unravelling the human factors of campus security
TRANSCRIPT

From crime hotspot to secure hotspot
Unravelling the human factors of campus
security
Thesis submitted for the degree of doctor in Safety Sciences at the
University of Antwerp by
Marlies SAS
Supervisors:
Prof. dr. Wim Hardyns
Prof. dr. Koen Ponnet
Prof. dr. Genserik Reniers Antwerpen, 2021
Faculteit Rechten
Master Veiligheidswetenschappen

Doctoral committee:
Prof. dr. Steven Van Passel
Prof. dr. Noel Klima
Doctoral jury:
Dr. Cindy Du Bois
Dr. Ellen Vandenbogaerde
The research project was financially supported by the University of Antwerp.

3
Table of contents
List of tables 4
List of figures 5
Dankwoord 6
Nederlandstalige samenvatting 7
Chapter 1 Introduction 9
Chapter 2 An integrative conceptual framework for physical security culture in organizations
36
Chapter 3 Measuring the security culture in organizations: A systematic overview of existing tools
45
Chapter 4 Measuring CPTED and disorder through different systematic social observation methods: In-situ observations, original photographs and Google Street View images
65
Chapter 5 The impact of training sessions on physical security awareness: measuring employee’s knowledge, attitude and self-reported behaviour
85
Chapter 6 Nudging as a crime prevention strategy: The use of nudges to improve cyclists’ locking behaviour and reduce the opportunities for bicycle theft
107
Chapter 7 Unravelling college students’ fear of crime: The role of perceived social disorder and physical disorder on campus
133
Chapter 8 The relationship between crime prevention through environmental design (CPTED) and fear of crime: A multi-method approach in four university campus neighbourhoods
158
Chapter 9 Discussion and conclusion 182
Author contributions 206
Overview of all publications 207
4
List of tables
Table 1.1 Overview of the different datasets used in this dissertation 23
Table 1.2 Overview of the structure of the dissertation 26
Table 3.1 General characteristics of the measuring tools for security culture 60
Table 3.2 Methodological characteristics of the measuring tools for security culture 61
Table 4.1 Standard deviations of average correlation for the three methods per
construct
85
Table 4.2. Descriptive statistics of CPTED and disorder items 93
Table 5.1 Demographic characteristics of respondents in the first study 103
Table 5.2 Descriptives of the variables in the study 103
Table 5.3 Demographic characteristics of respondents in the second study 109
Table 5.4 Changes in employees’ knowledge regarding security procedures and
policy
110
Table 5.5 Changes in employees’ attitude towards security 111
Table 5.6 Changes in employees’ self-reported security behaviour 111
Table 6.1 Partitioned Pearson chi-square comparisons of locking practices in the
baseline condition and after the first intervention at the treatment sites
136
Table 6.2 Pearson chi-square comparisons of locking practices in the baseline
condition and after the second intervention at the treatment sites
137
Table 6.3 Differences in locking practices at the control and treatment sites after the
second intervention
137
Table 6.4 Overview of demographic characteristics of respondents 138
Table 7.1 Descriptives of the variables included in the study 159
Table 7.2 Correlations between the components of the research model 163
Table 8.1 Socio-demographic characteristics of respondents of the student survey
and the staff survey
185
Table 8.2 Descriptive statistics of key variables of student survey and staff survey 187
Table 8.3 Descriptive statistics of key variables of SSO 189
Table 8.4 Overview of items that were included in the CPTED checklist and their
factor loadings
205
Table 9.1. Overview of the doctoral candidate’s contributions to each study 235

5
List of figures
Figure 1.1 Overview of the locations of the four campuses of the University of
Antwerp
22
Figure 2.1 An integrative conceptual framework for physical security culture in
organisations
47
Figure 2.2 Model for addressing physical security culture 48
Figure 3.1 Results of the search for security culture measuring tools 58
Figure 4.1 Example of original photograph and GSV image of the same observation
point
79
Figure 4.2 ICC coefficients (single measures) per modus per observation point 82
Figure 4.3 Correlation of observations between different methods per observation
point
83
Figure 4.4 Mean scores for constructs related to CPTED and disorder per method 84
Figure 4.5 Correlation of observations between different methods per construct 84
Figure 5.1 Structural model for the KAB model of security awareness 106
Figure 6.1 The first nudging intervention 130
Figure 6.2 The second nudging intervention 130
Figure 6.3 Example of the implementation of the sticker and poster at treatment
site
132
Figure 6.4 Chronological timeline of the experiment at treatment and control sites 132
Figure 6.5 Overview of the locking practices at control and treatment sites at
baseline condition, after the first intervention and after the second
intervention
135
Figure 7.1 Conceptual model of the determinants of avoidance behaviour 158
Figure 7.2 Full model of determinants of the three dimensions of fear of crime 165
Figure 8.1 Overview of the locations of the four university campuses 184
Figure 8.2 Overview of the results of student survey, staff survey and SSO 191

6
Dankwoord
Eind 2017, ondertussen bijna vier jaar geleden, kreeg ik de kans om te starten met dit
doctoraatsonderzoek naar de beveiliging van campussen. Omdat ik dit traject niet alleen
doorlopen heb, bedank ik graag enkele mensen die heel belangrijk zijn geweest tijdens dit hele
proces.
Allereerst gaat mijn grootste dank uit naar mijn drie promotoren: Wim Hardyns, Koen Ponnet
en Genserik Reniers. Elk met jullie eigen achtergrond, persoonlijke kenmerken en visie hebben
jullie me fantastisch goed bijgestaan. Wim, enorm bedankt voor jouw grote betrokkenheid,
het altijd meedenken naar oplossingen, het creëren van opportuniteiten buiten het
doctoraatstraject en vooral het altijd kunnen rekenen op jou. Koen, een grote dankjewel voor
jouw methodologische ondersteuning, jouw aandacht voor het mentale welzijn en jouw
motiverende complimenten op de juiste momenten. Genserik, hartelijk bedankt voor jouw
altijd positief geformuleerde feedback, jouw continue vertrouwen en jouw inspirerende visie
op beveiliging in een groter plaatje. Ik zou jullie zonder twijfel alle drie zowel afzonderlijk als
samen aan elke onderzoeker aanraden als promotoren. Daarnaast ook een woord van dank
aan Steven Van Passel en Noel Klima om me steeds constructieve feedback te bezorgen en
mee richting te geven aan dit onderzoek.
Daarnaast verdient de Universiteit Antwerpen een belangrijke plaats in dit dankwoord. Niet
alleen zorgde de universiteit voor een financiële ondersteuning, daarnaast zorgde zij ook voor
een onmiskenbare inhoudelijke ondersteuning. Specifieke dank gaat hierbij uit naar de
voorzitter en alle leden van de stuurgroep security, die tijdens de regelmatige bijeenkomsten
ervoor zorgden dat ik het vertrouwen kreeg, dat ik structuur kon vinden in het onderzoek en
dat mijn inspanningen niet enkel op theoretisch vlak maar ook in de praktijk van belang waren.
Verder verdienen alle collega’s met wie ik de afgelopen jaren heb mogen samenwerken een
grote dankjewel. Ik heb het geluk gehad om me te mogen mengen in drie verschillende
onderzoeksgroepen. Allereerst bedankt aan de collega’s aan Universiteit Antwerpen, en dan
voornamelijk de mede-bureaugenoten, om te zorgen voor een heel fijne werkomgeving. Ook
een dikke dankjewel aan de collega’s in de Krook om een zeer warme groep te zijn en te zorgen
voor een werkplek die ik iedereen kan aanbevelen. Ten slotte hartelijk bedankt aan de

7
collega’s van de vakgroep Criminologie voor de interessante en vooral heel fijne
samenwerkingen.
Een allerlaatste bedanking gaat uiteraard uit naar alle mensen rondom mij buiten de
universiteit. Mijn lief, familie, schoonfamilie en vrienden, aan allen een heel grote dankjewel
om in de afgelopen jaren voor de nodige afleiding te zorgen, om me te blijven steunen en om
er simpelweg altijd te zijn.

8
Nederlandstalige samenvatting
Terwijl hogeschool- en universiteitscampussen vaak worden beschouwd als omgevingen die
immuun zijn voor criminaliteit, wijst eerder onderzoek uit dat delicten zoals verbaal en fysiek
geweld, diefstal, vandalisme en seksueel ongewenst gedrag regelmatig voorkomen op de
campus. Daarnaast geeft ongeveer een vierde van de studenten aan dat ze zich soms onveilig
voelen op en in de buurt van de campus en speelt beveiligingsperceptie een belangrijke rol in
de werktevredenheid van personeelsleden. In voorgaande studies is men het er over eens dat
een sterke beveiligingscultuur een organisatie weerbaarder maakt tegen criminaliteit. Deze
beveiligingscultuur bestaat uit drie domeinen die nauw verbonden zijn met elkaar: het
technologische (bv. alarmsystemen, bewakingscamera’s), het organisatorische (bv.
procedures) en het menselijke domein (bv. het gedrag van mensen).
Terwijl hoger onderwijsinstellingen vaak investeren in technologische en organisatorische
maatregelen, wordt het menselijke domein vaak over het hoofd gezien. De bijzondere
eigenschappen van campussen, zoals het publiek toegankelijk karakter en de grote
aanwezigheid van studenten, zorgen ervoor dat gesofisticeerde technologische maatregelen
niet altijd haalbaar of wenselijk zijn. Veel potentieel kan daarom toegeschreven worden aan
de menselijke factor in het kader van de beveiliging van de campus. Deze cruciale rol wordt in
het bijzonder onderstreept binnen het concept van security awareness of
beveiligingsbewustzijn. Het verhogen van de bewustwording van de mogelijke
beveiligingsrisico’s en handelingen om deze risico’s te beperken kan een belangrijke troef zijn
in het beveiligingsbeleid. Anderzijds is het belangrijk dat personeelsleden en studenten zich
veilig voelen en vrij kunnen deelnemen aan alle activiteiten op de campus. Het beperken van
fear of crime, of de angst voor criminaliteit, maakt integraal deel uit van het menselijke
beveiligingsdomein. Naast de campus zelf, wordt ook de buurt waarin deze gelegen is vaak
gekenmerkt door enkele specifieke factoren die de kans op criminaliteit en angst kunnen
vergroten. Terwijl eerder onderzoek voornamelijk focust op de relatie tussen socio-
demografische factoren, werd tot nu toe weinig aandacht besteed aan de invloed van deze
campusomgeving op angst voor criminaliteit onder studenten en personeelsleden.

9
Deze dissertatie heeft als doel om de menselijke factoren in de beveiliging van de campus te
ontleden. Enerzijds wordt onderzocht welke factoren bijdragen aan het
beveiligingsbewustzijn van studenten en personeelsleden en op welke manier zij nog
bewuster kunnen gemaakt worden. Anderzijds wordt gefocust op angst voor criminaliteit
onder studenten en personeelsleden en de invloed van omgevingsfactoren, zoals de inrichting
van de omgeving en de aanwezigheid van overlast. Omdat het onderzoek naar beveiliging in
het algemeen en beveiliging op de campus meer specifiek nog zeer beperkt is, werd eerst een
conceptueel model voor beveiligingscultuur ontwikkeld en een overzicht geboden van de
verschillende methoden om deze beveiligingscultuur te meten. Bovenstaande werd op een
multi-methodische manier onderzocht, daarbij gebruik makend van (i) een
literatuuronderzoek naar fysieke beveiliging, (ii) een systematische review van de bestaande
meetinstrumenten voor beveiligingscultuur, (iii) een survey onder studenten en een survey
onder personeelsleden, (iv) quasi-experimenten met awareness trainingen en nudges en (v)
systematische observaties in de directe omgeving van de campus.
De resultaten tonen aan dat het inzetten op kennis, attitudes en gedrag in het kader van
beveiliging noodzakelijk is bij het vergroten van beveiligingsbewustzijn onder studenten en
personeelsleden. Terwijl awareness traingingen voornamelijk effectief zijn in het bijbrengen
van noodzakelijke kennis en verbeteren van attitudes, toont het experiment met nudges
verandering in het gedrag op het vlak van beveiliging teweeg te kunnen brengen. Daarnaast
wordt een duidelijk verband aangetoond tussen angst voor criminaliteit onder
personeelsleden en studenten en de omgevingsfactoren van de campus. Gebaseerd op onze
bevindingen raden we aan hoger onderwijsinstellingen meer in te zetten op de menselijke
factor in beveiliging. Op een kostenefficiënte manier kunnen er initiatieven ontwikkeld
worden die het beveiligingsbewustzijn onder personeelsleden en studenten vergroten. Het
aanpakken van overlast en inzetten op architecturale aanpassingen in de omgeving via de
principes van Crime Prevention Through Environmental Design (CPTED), zorgt daarnaast voor
minder angst voor criminaliteit en een campusomgeving waar iedereen vrij kan deelnemen
aan activiteiten.

CHAPTER 1
Introduction
1.1. Campus security
Although there is general consensus in empirical literature that university and college
campuses are more secure than the communities in which they are located (Barton et al.,
2010; Gregory & Janosik, 2002), previous studies show that crimes such as theft, verbal and
physical violence, vandalism and sexually undesirable behaviour are quite prevalent at higher
educational institutions (HEI’s) (Doss et al., 2017; Jacobsen, 2017; Jennings et al., 2007;
Schokkenbroek et al., 2020). The high student population, the prevailing freedom, lack of
guardians and homogenous nature of the campus setting create an environment with
opportunities for crime to occur (Petherick, 2000). McPheters (1978) and Fox and Hellman
(1985) were among the first researchers to empirically examine campus crime and explore
factors associated with its occurrence. While their publications can be considered as the
starting point of a long research tradition in the United States, it is only recently that attention
has been given to these issues in Europe (Maran & Begotti, 2019; Maran & Zedda, 2014; Sani
et al., 2020). Due to the large differences in educational system and campus design of HEI’s in
the two continents, it is risky to extrapolate findings from the United States to Europe. This
implies that to date, little is known about crime victimization at non-American campuses.
Over the years, several theories have been developed to explain which factors contribute to
the occurrence of criminal incidents. Concerning crime on campus, the lifestyle routine activity
theory (LRAT) (Cohen et al., 1981) is often put forward as a valuable explanation for
victimization. According to this theory, crime is associated with the daily routines of people. A
combination of a greater proximity to crime, the presence of motivated offenders and suitable
targets, and a lack of capable guardians increases the likelihood of criminal events. In a campus
environment, the gathering of many students in auditoria or the presence of a high number
of staff members during events may increase exposure to crime. Moreover, engaging in
activities that are inherently part of student life, such as going to bars at night, may be
accompanied by an increased presence of motivated offenders (Hayes et al., 2020). Besides

Introduction
11
students and staff members, also personal property, such as laptops, smartphones or bikes,
or business equipment such as projectors, printers or lab equipment, can be considered as
suitable targets. The presence of capable guardians lowers the probability of crimes to occur
and serve as ‘the ears and eyes’ of the campus. In addition to police patrol or security guards,
also students, staff members, visitors or neighbouring residents may fulfil this role of capable
guardian (Tewksbury & Mustaine, 2003). Moreover, physical measures, such as closed-circuit
television (CCTV), detection systems and various other forms of technology used to monitor
the campus, could serve as capable guardians (Barnes, 2009).
In order to prevent or reduce campus crime, HEI’s have to identify and protect suitable targets,
strengthen guardianship and minimize offences across the campus environment. In
comparison with other organizations, HEI’s often consist of specific characteristics which
creates many challenges to secure them (Jennings et al., 2007). Most campuses in Europe are
characterized by a very open infrastructure with many (semi-) publicly accessible buildings.
This implies that not only students and staff members can enter the campus, but that also
external people can freely walk through the campus buildings (Rasmussen & Johnson, 2008).
Additionally, next to the normal teaching and working activities, numerous events take place
on campus. Occasions such as study days, workshops, student parties or staff activities are
accompanied by a highly increased presence of people. Contrary to this open campus
character, extra protection is required for some areas, such as server rooms or labs.
Moreover, not only the campus itself, but also the direct neighbourhood of the campus is
characterized by some specific features which may be linked to an increased presence of
crime. The limited research that has been done on this topic has found some associations
between a neighbourhood’s proximity to a college or university campus and its level of crime.
Previous studies show that a large majority of crimes occur approximately within 150 meters
beyond the campus boundaries, in the student-dense neighbourhoods (Nobles et al., 2013;
Weiss, 2013). A combination of the individual characteristics of those spending time in these
areas along with the structural characteristics of the campus environment should theoretically
create conditions conducive to opportunities for crime. On one hand, these neighbourhoods
can be considered as crime attractors, as they may attract offenders seeking to capitalize on
the opportunities present in these areas, such as intoxicated students or insecure housing
largely vacant during the day. On the other hand, the campus neighbourhood can be seen as

Introduction
12
a crime generator due to the presence of numerous venues designed for student leisure, such
as bars, restaurants and shopping venues that attract people to an area and may become
potential targets. This finding is supported by numerous studies on crime hot spots which have
consistently found associations between the presence of these types of businesses and higher
rates of crime (Weisburd et al., 2012).
Since the beginning of this century, it has become clear to scientists and practitioners that the
development of a strong security culture is indispensable to make organizations prepared for
and resilient against criminal incidents (Breidenbach, 2000; Solms, 2000). Although there is
some unanimity about the need of a security culture, there does not exist a concise definition
of what is meant by ‘a security culture’, nor are there clear views on how to create this
organizational culture to support security (Chia et al., 2002). This could be explained by the
fact that security culture research is still a relatively young discipline, in which theories and
models are still emerging (Malcolmson, 2009). In order to conceptualize security culture,
previous studies draw inspiration from the more developed and related field of safety sciences
(Máté, 2017; Reniers et al., 2011). Also in this dissertation, we rely on de definition of
Vierendeels et al. (2018), who refer to safety culture as an entanglement of technological,
organizational and human domains. Therefore, in order to create a strong security culture, an
integral focus on technological (e.g., CCTV, fences, locks), organizational (e.g., procedures,
responsibilities) and human (e.g., behaviour, attitudes) domains is needed1.
While HEI’s (and other organizations) often focus on the technological and organizational
domains to prevent and mitigate criminal offenses, less attention is paid to the human factors,
such as the behaviour or attitudes of organizational members (Ghafir et al., 2018; Metalidou
et al., 2014). As HEI’s are by their very nature open-access environments where people move
between and among buildings and outdoor spaces, sophisticated technological techniques
(e.g., badge checks, fences) are often not desirable or feasible (Rasmussen & Johnson, 2008).
Therefore, a crucial role is reserved for students and staff members to act as capable guardians
in order to reduce the opportunities for crime on campus. In previous studies, authors refer
to ‘security awareness’ or people’s understanding of the importance of security and their own
1 In this dissertation we will refer to a ‘physical’ security culture, in order to make a distinction between security in the physical world and security in a digital world, which is often called information security or cyber security.

Introduction
13
responsibility in it (Rezgui & Marks, 2008; Siponen, 2000). It is assumed that by making
students and staff members more aware of the potential risks and the (preventive) actions
they can take, security culture can be strengthened. On the other hand, it is also important
that they are not deterred from knowing the risks, but that they feel secure to engage in
activities on campus. Previous research has shown that fear of crime among students and staff
members may negatively affect their participation in educational or work-related activities
(May et al., 2010). Moreover, feelings of fear of crime may well have more of an impact on
people than the reality of crime (Gover et al., 2011).
Considering the above, besides investing in the technological and organizational security
domains, it should be the aim of HEI’s to strengthen students’ and staff members’ security
awareness and reduce their fear of crime in order to strengthen the security culture.
Understanding which factors contribute to this human domain of campus security is
undoubtedly indispensable to improve it. An introduction to the two main human concepts of
this dissertation, security awareness and fear of crime, is presented below.
1.1.1. Security awareness
Previous studies indicate that security awareness can be distinguished in three dimensions:
what people know (security knowledge), what people think (security attitude) and what
people do (security behaviour) (Kaur & Mustafa, 2013; McCormac et al., 2017). The three
components originate from the Knowledge, Attitude and Behaviour (KAB) model of
Baranowski et al. (2003), which assumes that the accumulation of knowledge may result into
changes in attitudes, which can in turn lead to changes in behaviour. For instance, when
individuals have knowledge about the potential security threats and understand the
importance of security procedures, their attitude might change which may result in more
security compliant behaviour. Vice versa, a lack of knowledge of the potential security
breaches and its implications may lead to a lack of security motivation and the
incomprehensibility of the seriousness of potential risks and the associated needs for security
procedures. This can in turn lead to an impediment of logical decision-making associated with
security.
Over time, various methods have been developed in order to affect people’s behaviour by
increasing their knowledge. Initiatives such as promotional methods (e.g., posters, stickers),
Introduction
14
enforcing methods (e.g., awareness tests, confidentiality agreements), educational methods
(e.g., trainings, workshops) or informational methods (e.g., leaflets, e-mail warnings) all have
the aim to share information which ideally leads to more compliant behaviour (Johnson,
2006). While some studies confirmed the relationship between individuals’ knowledge,
attitude and behaviour in the field of security (e.g., Parsons et al., 2014), research carried out
in other fields, such as healthcare (Baranowski et al., 2003) and environmental awareness
(Newbould & Furnell, 2009), has shown that increased knowledge is not the ultimate factor of
change in behaviour. In these domains, researchers have started to search for alternative
approaches to achieve changes in people’s behaviour.
An approach that has been frequently used in other domains is the use of nudging, or ‘the
ways of influencing choice without limiting the choice set or making alternatives appreciably
more costly in terms of time, trouble, social sanctions, and so forth’ (Hausman & Welch, 2010,
p. 126). Nudges have gained widespread recognition through the work of Thaler and Sunstein
(2009), who assume that individuals can be directed towards certain behaviour by gentle
pushes or nudges. Examples are the displaying of caloric information on a menu with the goal
of less calorie intake (Thunström, 2019) or the placement of footsteps leading towards a bin
to facilitate dropping garbage in the bin (Hansen & Jespersen, 2013). To date, the use of
nudges in the field of security is still limited to a few examples such as posters with watching
eyes in bicycle parking facilities to deter offenders of stealing bikes (Nettle et al., 2012) or the
introduction of a travel pass with biometric data for passengers that want to cross the border
without the interrogation of security guards at the airport (Schuilenburg & Peeters, 2015).
The findings above show that further research is needed about the relationship between
people’s security knowledge and their behaviour in order to examine how students’ and staff
members’ security awareness can be improved. Additionally, further exploration of the
effectiveness of nudges in the field of security is necessary to examine whether this approach
may be useful for directing students and staff members towards more secure behaviour.

Introduction
15
1.1.2. Fear of crime
Fear of crime is considered as one of the main effects of crime and victimization and can be
distinguished in three dimensions: a cognitive dimension, or the perceived risk of
victimization; an affective or emotional dimension, or feelings of anxiety; and an expressive
dimension, or the behavioural attitudes or measures taken in response to feelings of fear, such
as avoidance behaviour (Hardyns & Pauwels, 2010). Fear of crime can have detrimental
effects, not only on people’s health (Jackson & Stafford, 2009), but also on social networks,
neighbourhoods and society as a whole (Hale, 1996). On campus, higher levels of fear of crime
have been related to psychological strain and avoidance behaviour, which may negatively
affect students’ participation in educational activities (Schuck, 2017). Additionally, fear of
crime has been found to play an important role in the level of job satisfaction among
employees (Ayim Gyekye, 2005; Nielsen et al., 2011). Over time, the impact of demographic
factors on levels of fear of crime on campus has been largely emphasized (Fisher, 1995;
Jennings et al., 2007; Warr, 2000). For instance, findings reveal that fear of crime increases
with age and that women express more feelings of anxiety in comparison to their male
counterparts (Schreck & Miller, 2003).
In addition to individual determinants, environmental cues may also matter. Previous research
has demonstrated the relationship of physical features of the built environment and people’s
fear of crime (Cozens & Sun, 2018; Marzbali et al., 2012). In this light, the concept of Crime
Prevention Through Environmental Design (CPTED), has become one of the most popular
prevention strategies to reduce crime and fear of crime. Introduced by Jeffery (1971), the
CPTED approach involves the implementation of physical environmental designs that may
reduce the opportunities for criminal behaviour and thus reduce fear of crime through
architectural means. Various studies have found that CPTED consists of five key principles:
surveillance (e.g., security guards, police patrol), access control (e.g., detection mechanisms),
territoriality (e.g., fences, property signs), maintenance (e.g., cleanliness, condition of the
buildings) and activity support (e.g., parks, shops) (Armitage & Monchuk, 2019; Cozens, 2016).
Additionally, underlying the principle of maintenance, the broken windows theory proposes
that the presence of social (e.g., drunk people, people fighting) and physical disorder (e.g.,
litter, graffiti) has an important impact on people’s fear of crime (Wilson & Kelling, 1982).
Public disorder may reflect the neglect of the community and a breakdown in behavioural

Introduction
16
norms and formal and informal social controls (Perkins & Taylor, 2002; Skogan, 1990). The
presence of physical or social disorder could inform the belief that victimization is likely to
happen (Robinson et al., 2003).
A subset of studies that investigated the relationship of CPTED and disorder and fear of crime
in a campus setting, focused on three correlates of fear of crime: prospect, refuge and escape
(Fisher & May, 2009; Petherick, 2000). Their findings show that higher levels of fear of crime
on campus are related to a poor visibility of the location, a lower chance for victims to escape
and a higher presence of areas that contain hiding places for offenders. Each of these
correlates are design features which are minimized or eliminated in high CPTED facilities. For
instance, Tseng et al. (2004) evaluated security perceptions at two different parking garages
of Ohio State University in the United States following a 2-year implementation of a CPTED
program. Their findings confirmed the positive relationship between CPTED modifications and
people’s perception of security, with lighting being the most significant factor affecting
perceptions. Fernandez (2005) surveyed students’ perceptions of secure and unsecure
exterior sites on Louisiana State University campus finding that visibility, clean and well-kept
areas, and proper landscaping increased students’ perception of security. More recently,
Cozens and Sun (2018) examined students’ fear of crime in relation to the level of CPTED
finding that lower levels of CPTED were associated with more frequent feelings of insecurity.
As most European campuses are open-access environments where traditional security
measures are often not desirable, a more feasible approach could be the implementation of
CPTED principles and the reduction of social and physical disorder (Maier & DePrince, 2020;
Robinson, 1999). Further examination of the impact of physical cues in the environment on
students’ and staff members’ fear of crime is needed to obtain more insight in potential
strategies that may reduce these feelings of insecurity.
While it is the main focus of this dissertation to explore and improve the human factors of
security, reference is made to the technological and organizational security domains. For
instance, attention will be paid to CPTED, which can be categorized under the technological
domain, and nudging, which can be categorized under the technological and organizational
domains. The integral focus on human, organizational and technological aspects of security
culture shows that all these domains are strongly intertwined.

Introduction
17
1.2. Relevance of the dissertation
1.2.1. Scientific relevance
This dissertation contributes to the literature on physical security in general and campus
security in particular. It is only since the terrorist attacks of September 11, 2001 that physical
security gained widespread attention which moved the topic to a higher place on the business
agendas of many companies (Sas et al., 2019). Although from then on organizations mostly
focused on small crimes such as vandalism and theft, a more recent expansion in other
security incidents such as espionage, organized crime and cyberattacks, led to increased
attention for all intentional and malicious security threats. Also in scientific research, an
acceleration in the development of security concepts and models can be observed in the past
two decennia (Reniers et al., 2020; Sas et al., 2020). Nevertheless, security culture can be
considered as a research domain that is still in its infancy. This finding is supported by the fact
that there does not exists a widely accepted definition of security culture and that there is
also no standard agreement on how an organization’s security culture can be measured or
evaluated. While some researchers have made some attempts in specific security domains,
such as nuclear security (e.g., World Institute for Nuclear Security, 2011) and cyber security
(e.g., Schlienger & Teufel, 2003), studies in other domains are missing (Malcolmson, 2009). It
is the aim of this dissertation to fill this knowledge gap in literature by focusing on security
culture in general and campus security in particular. More specifically, the conceptual part
(Chapter 2) and methodological parts (Chapters 3 and 4) will provide more insight in the
conceptualization and measurement of an organization’s security culture.
Subsequently, a second knowledge gap in scientific literature can be identified in the field of
campus security. While hundreds of studies have been conducted in an attempt to explain
victimization on campus, the large majority is carried out at American colleges and universities
(e.g., Jennings et al., 2007; Kaminski et al., 2010; Steinmetz & Austin, 2014). Although there
exists a large body of scientific research on topics such as the prevalence of sexual assault
(e.g., Klein & Martin, 2019), the impact of school shootings (e.g., Kaminski et al., 2010) and
the effect of security legislation (e.g., Janosik & Gehring, 2003) on American campuses, it is
difficult to apply the conclusions about these studies to European HEI’s (Sani et al., 2020).
Contrary to European HEI’s, campuses in American countries are characterized by large

Introduction
18
populations of students living on campus (in dormitories) and spending their free time on
campus (e.g., in fraternities and sororities, campus gyms, campus restaurants) (Huesman et
al., 2009). Moreover, the widespread phenomenon of school shootings in the past decades
led to the development of specific campus security legislation and an implementation of more
severe security measures, such as campus police officers and metal detectors. The campus
design and security policies are contrary to those of European HEI’s where focus lies on
preserving open campuses where students, staff and visitors can enter buildings freely. The
lack of scientific interest in campus security studies at European HEI’s could be rooted in the
assumption that campuses are secure and safe places (Fisher, 1995; Fox et al., 2009; Jacobsen,
2017) or in the absence of tragic incidents (e.g., shootings) compared to American universities.
It is the aim of this dissertation to fill this knowledge gap and focus on campus security in a
non-American context. More specifically, the empirical part (Chapters 5-8) will focus on
students’ and staff members’ perceptions of security at the University of Antwerp, in Belgium.
Finally, the large majority of studies on campus security focus on the security perceptions of
students, while little is known about the feelings and perceptions of other campus’ residents,
such as staff members (Gover et al., 2011). Previous research on security awareness in other
environments than the campus showed that older people are often more security aware and
behave in a more secure way in comparison with younger individuals (Pattinson et al., 2015).
Additionally, previous studies on fear of crime found that feelings of anxiety are associated
with age, indicating that older people have higher levels of fear of crime compared to younger
individuals (Gibson et al., 2002). These findings suggest that students and staff members
should not be presumed to share the same perceptions as they are generally at different life
phases an may have different relationships with HEI’s (i.e., for staff members the campus is a
workplace, but for students it could be a home, especially for those residing in student
housing) (Kyle et al., 2017). It is therefore the aim of this dissertation to fill this research gap
by including staff members in the research samples of the empirical studies that were carried
out. More specifically, in Chapters 5, 6 and 8 the factors that contribute to staff members’
security awareness and fear of crime on campus will be explored.

Introduction
19
1.2.2. Practical relevance
In addition to the scientific relevance, this dissertation also contains an important practical
relevance. All HEI’s have a common goal: attracting and retaining prospective students to
sustain sufficient enrolments and recruiting qualified staff members to achieve and maintain
a high quality of education (De Jager & Bezuidenhout, 2014). Previous research has shown
that the perception of a secure and crime-free campus environment plays an important role
in the school choice process of prospective students and their parents (Ammigan & Jones,
2018; The British Council, 2012). Additionally, studies carried out in other types of
organizations found that employees’ security perceptions are related with their job
satisfaction, indicating that the perception of a secure environment is associated with a higher
level of satisfaction (Ayim Gyekye, 2005; Nielsen et al., 2011). A major step towards
understanding what security programs and policies HEI’s can implement to address crime, is
to study what affects the perception of a secure campus. When it comes to Belgium, very little
- if any - research has been carried out on campus security in general and security perceptions
of students and staff members in particular. As such, this dissertation has the aim to provide
an important practical relevance by offering policy recommendations for HEI’s based on the
different studies that were carried out in Chapters 5 to 8.
Secondly, the findings of this dissertation mainly contribute to the practical security approach
of the University of Antwerp. The university served as the research area of all empirical studies
that were carried out during this research project. Moreover, at the start of this research, the
steering group ‘Security’ was composed which fulfilled an advisory role during the different
research phases. Its contribution was reflected in regularly meetings in which interim results
and future research ideas were discussed. The close cooperation with the University of
Antwerp implies that the conclusions and recommendations of this dissertation are most
applicable to support further developments in this university’s security policy. However, this
certainly does not mean that this dissertation is only of practical relevance for the University
of Antwerp. In the first couple of months of the research project, 10 qualitative in-depth
interviews were carried out with security managers from other HEI’s in Belgium and The
Netherlands. During those meetings, topics such as the best practices, main concerns and
future priorities regarding campus security were discussed. Due to the confidential nature of
these conversations, the results are not be published in this dissertation. However, the
Introduction
20
security managers’ shared insights were born in mind during the whole research project. This
implies that this dissertation consists of a practical relevance for (European) HEI’s in general
and the University of Antwerp in particular.
Finally, the practical relevance of this dissertation extends beyond HEI’s. Previous research
has shown that also in other organizations the human domain of security is often ignored or
overlooked compared to the large investments that are made in technological and
organizational measures (Ghafir et al., 2018; Luo et al., 2011). Moreover, most organizations
focus on tackling criminal incidents that already took place and approach their security policy
mainly in a reactive way, while focus is very rarely on a proactive way of thinking (Ruighaver
et al., 2007). In other words, an integrated and proactive approach to security challenges is
often lacking (Chia et al., 2002). This dissertation has the aim to focus on the human factors
of security and explore how this human domain can be strengthened by taking into account
the interconnected technological and organizational domains. As such, the findings and
insights of this dissertation may also be useful for other organizations than HEI’s who have the
aim to further develop their security approach in a more proactive way with a key focus on
the human security domain.
1.3. Aims of the dissertation
It is the key aim of this dissertation to unravel the human factors of campus security. As
illustrated in the introduction of this dissertation, the human domain forms an integral part of
an organization’s security culture but is often not prioritized or even ignored. To examine
which factors affect this human domain and how it can be strengthened, this dissertation
comprises three main parts: (1) a conceptual part, (2) a methodological part and (3) an
empirical part.
To unravel the human factors of campus security, it is indispensable to start this dissertation
with an understanding of what is security. We will refer to (physical) security culture to take
into account all relevant security aspects of the organization. As the current literature lacks a
uniform definition of security culture, it is the aim of the conceptual part of this dissertation
to develop a comprehensive conceptual model of security culture that integrates all relevant
security domains of the organization.

Introduction
21
The methodological part of this dissertation builds on this conceptualization and examines
how security culture can be measured and evaluated. Due to the lack of a standardized
measuring tool, an overview of existing instruments is provided. Subsequently, systematic
social observations (SSO) are applied in practice in order to investigate the potential value of
this methodological approach for analysing the environmental cues in the campus
environment. As such, the methodological part aims to investigate how security culture can
be measured, thereby taking into account the conceptualization and integrality of the
different domains of security culture.
The insights obtained in the conceptual and methodological parts are put in practice in the
empirical part. As HEI’s are by their nature open-access environments, sophisticated
technological measures are often not feasible. A crucial role is therefore reserved for the
human factors of security. On one hand, students and staff members that are security aware
may prevent and reduce criminal events and strengthen HEI’s security culture. Therefore, it is
the first aim of the empirical part of the dissertation to explore which factors constitute
security awareness on campus, how these factors are related to each other and how they
can be strengthened. On the other hand, it is important that students and staff members feel
secure on campus and that they can engage in their activities without fear of crime. Therefore,
it is the second aim of the empirical part to explore the extent to what environmental cues
of the campus are related to students’ and staff members’ fear of crime and how these
feelings of fear can be reduced.
1.4. Research design
1.4.1. Research setting
All empirical studies included in this dissertation were carried out at the University of Antwerp.
The University of Antwerp is one of eleven Belgian universities and is located in the largest
city of Belgium (based on its population). The university consists of nine faculties spread
among four main campuses (see Figure 1.1). While one campus is located in the centre of the
city of Antwerp, the other three campuses are situated in a more rural environment on the
outskirts of the city. All campuses are open to the public and are directly accessible by public
roads. This implies that campuses are not only visited by students and staff members, but also
by visitors such as inhabitants of the city or tourists. At the start of this research project (2017)

Introduction
22
the university enrolled 20,492 students, while at the end of the project (2021) 21,133 students
were studying at the university. In 2017, 5,618 staff members were employed at the university
which increased to 6,205 employees at the end of the research project.
Figure 1.1. Overview of the locations of the four campuses of the University of Antwerp.
1.4.2. Research methods
This dissertation adopted a multimethod approach. The emergence of multimethod research,
or also called a mixed methodology, multi-strategy research, hybrid or combined research, is
often associated to the famous article of Campbell and Fiske (1959) on measurement
validation. The multimethod approach became a widely used strategy for improvement and
led to a systematic practice to employ different types of methods interacting with each other
(Hunter & Brewer, 2015). With regard to crime and security, this multimethod approach
became widely recognized and institutionalized in the public policy arena in 1973 with the
establishment of the U.S. Department of Justice’s Victimization Surveys to supplement the

Introduction
23
FBI’s Uniform Crime Reports (Brewer & Hunter, 2006). In this dissertation, a combination of
six research methods was used: (1) qualitative in-depth interviews, (2) a literature review, (3)
a systematic review, (4) systematic social observations (SSO), (5) quantitative surveys and (6)
quasi-experiments. Table 1.1 provides an overview of the datasets.
Table 1.1. Overview of the different datasets used in this dissertation.
Dataset Method Year Sample size (N) Chapter
1 Qualitative in-depth interviews 2017 18 n/a
2 Literature review 2018 n/a 2
3 Systematic review 2018 6 3
4 Systematic social observations 2020 406 4, 8
5 Quasi-experiment 2018 74 5
6 Survey 2018 1,443 5, 8
7 Survey 2019 1,463 7, 8
8 Quasi-experiment/survey 2019 3,963/197 6
At the beginning of the research project, 10 qualitative in-depth interviews were carried out
with security managers from different HEI’s located in Belgium (n=8) and The Netherlands
(n=2). Additionally, eight interviews were conducted among staff members of the University
of Antwerp, who all have a certain responsibility in campus security (e.g., Head of
Infrastructure Department, Head of Communications Department). Because of the
confidential character of the content of these interviews, the results are not written down in
this dissertation. The obtained insights did provide inspiration for the general approach of the
research project and led to input for the development of the research designs of the empirical
studies.
To respond to the aim of the conceptual part of this dissertation, or the development of a
conceptual model for security culture, an extensive literature review was carried out. Because
of the limited availability of research on physical security, inspiration was drawn from studies
in the related field of safety sciences. Based on the literature study, a conceptual model for
safety culture was examined and translated to the security domain.
In order to fulfil the aim of the methodological part of this dissertation, namely the
investigation of how security culture can be measured, a systematic review was carried out.
Based on the predefining of eligibility criteria, six already existing measuring tools were

Introduction
24
selected, examined and compared to each other. Both academic studies and grey literature
were consulted in order to include all relevant scientific and practical-oriented measuring
tools. The results of this systematic review led to recommendations for the development of a
standardized measurement instrument.
Subsequently, in a second methodological study, SSO (N=406) were carried out in four campus
neighbourhoods of the University of Antwerp. SSO are considered a key measurement
strategy for a wide variety of social science phenomena (Raudenbush & Sampson, 1999). The
most important advantage of this observation technique is that it relies on the independent
observation of a location by the researcher and not on conversations with respondents.
Therefore, it does not have to deal with socially desirable answers or non-response (Hoeben
et al., 2018). In this dissertation, three different observation methods were applied: in-situ
observations, observations via original photographs and observations by means of Google
Street View images. A combination of methods was carried out in order to examine to what
extent the measurement of the physical properties of the environment could be improved.
To fulfil the first aim of the empirical part of this dissertation, or the exploration of which
factors constitute security awareness and how they are related to each other, a large-scale
survey among all staff members (N=5,924) of the University of Antwerp was carried out. Self-
selection processes were used as staff members could voluntarily choose to fill in the
questionnaire. This led to a response rate of 24%, or 1,443 staff members that participated in
the study. In order to explore how staff members’ security awareness could be strengthened,
a quasi-experiment was carried out, making use of a one group pre-test post-test design. As
we were not able to include a control or comparison group in the study, this experimental
design was considered most appropriate. By measuring the same dependent variable in one
group of participants before (pre-test survey) and after (post-test survey) the organization of
a security training, a comparison was made between the pre-test and post-test scores in order
to obtain insight in the impact of the security trainings on staff members’ security awareness.
Subsequently, to explore further how security awareness could be strengthened, a second
empirical study was carried out. In this study, nudges were used in order to examine whether
this approach would be effective in directing students and staff members to more secure
behaviour. A non-equivalent control group pre-test post-test design was applied to examine

Introduction
25
the effectiveness of nudges in a natural setting. Although randomization and true
experimentation are ideal goals to test the effectiveness of an intervention (Kenny, 1975), this
was not possible. The non-equivalent control group pre-test post-test design has the
advantage that it is possible to compare scores before and after a treatment in a group that
receives the intervention and in a non-equivalent control group that does not receive the
intervention (Ledford & Gast, 2014). This way, the impact of the implementation of nudges on
the behaviour of students and staff members could be observed. Additionally, an oral survey
was carried out among 197 respondents at the end of the experiment to obtain more insight
in other factors that could have contributed to a potential change in behaviour.
To fulfil the second aim of the empirical part of this dissertation, or the exploration of the
relationship of environmental cues and students’ and staff members’ fear of crime, two
empirical studies were carried out. In a first study, the impact of the presence of disorder on
students’ fear of crime was examined, by carrying out a large-scale survey among all students
(N=21,095) of the University of Antwerp. Students could voluntarily choose to fill in the
questionnaire, which led to a response rate of 7%, or 1,463 students who participated in the
study.
Finally, a second empirical study was carried out in order to further explore the relationship
of environmental cues and fear of crime. More specifically, the influence of the presence of
CPTED measures in the neighbourhood of the campus on students’ and staff members’ fear
of crime was examined. The results originating from the SSO provided more insight in the
presence of CPTED in the neighbourhood of the campuses. These findings were merged with
the data from the two large-scale surveys, distributed among students and staff members of
the university of Antwerp, in order to explore the impact of the environmental cues on their
fear of crime.

Introduction
26
1.5. Structure of the dissertation
Importantly, this PhD research is a dissertation on articles which means that part of this
dissertation has already been published (or accepted for publication) in the form of journal
articles2. The dissertation will start with a conceptual part (Chapter 2), followed by a
methodological part (Chapters 3 and 4). The findings from the first two parts are applied in
practice in the third empirical part of this dissertation (Chapters 5-8). An overview of the
structure of the dissertation is provided in Table 1.2.
Table 1.2. Overview of the structure of the dissertation.
Conceptual part Chapter 2 An integrative conceptual framework for physical security culture in organizations
Methodological part Chapter 3 Chapter 4
Measuring the security culture in organizations: A systematic overview of existing tools Measuring CPTED and disorder through different systematic social observation methods: In-situ observations, original photographs and Google Street View images
Empirical part Chapter 5 Chapter 6 Chapter 7 Chapter 8
The impact of training sessions on physical security awareness: Measuring employee’s knowledge, attitude and self-reported behaviour Nudging as a crime prevention strategy: The use of nudges to improve cyclists’ locking behaviour and reduce the opportunities for bicycle theft Unravelling college students’ fear of crime: The role of perceived social disorder and physical disorder on campus The relationship between crime prevention through environmental design (CPTED) and fear of crime: A multi-method approach in four university campus neighbourhoods
2 All articles in this dissertation are co-authored. In all studies the doctoral candidate took the lead, while the promoters of this research, Prof. dr. Hardyns, Prof. dr. Ponnet and Prof. dr. Reniers, revised the articles. Prof. dr. Hardyns and Prof. dr. Ponnet also assisted the doctoral candidate with the analysis of the collected data. For a detailed overview of the doctoral candidate’s contribution to each chapter, we refer to the ‘Author contributions’ at the end of this dissertation.

Introduction
27
The first part of this dissertation offers a theoretical framework for physical security culture in
organizations. Although the dissertation will mainly focus on the human aspects of security, it
was indispensable to first obtain a clear insight in all aspects that contribute to an
organization’s security culture. Due to the relatively young status of research on physical
security culture, theoretical frameworks and models are still developing (Aven, 2007). In
comparison to security culture, the related field of safety sciences is characterized by a longer
academic history and because of the main similarities between safety and security, much can
be learned from adopting knowledge from the former discipline to the latter (Kriaa et al.,
2015). Taking this into account, the first study (Chapter 2) presents an integrative framework
for physical security culture based on The Egg Aggregated Model (TEAM) model for safety
culture, as proposed by Vierendeels et al. (2018). The TEAM-model for security culture
provides an integral and comprehensive overview of all related security aspects within an
organization, by making a distinction between the technological, organizational and human
security domains. This conceptual framework forms the starting point of this dissertation on
which the following chapters are build.
In order to investigate how an organization’s security culture can be measured, the second
article (Chapter 3) provides an overview of already existing measurement instruments. In
order for organizations to improve their security culture, is it indispensable to obtain insight
in the current strength of the different security domains (Chia et al., 2002). To date, very little
research has been carried out into how organizational security culture should be evaluated
and only a few measuring tools have been created worldwide (Schlienger & Teufel, 2005). The
limited number of existing tools mainly focus on the measurement of security culture in
specific domains, such as nuclear or information security. This implies that a common view or
widely accepted approach to measure security culture is lacking (Alnatheer et al., 2012) .
Based on a systematic review of literature, six tools that met the eligibility criteria of the
search process are explored and compared to each other. An identification of the strengths
and weaknesses of each measurement approach provides further insight in the characteristics
that a standardized tool should consist of. Based on the findings, recommendations for the
development of such a tool are presented. In the empirical part of this dissertation (Chapters
5-8), these methods are used in practice in order to unravel the human factors of campus
security.

Introduction
28
Since it is one of the aims of this dissertation to examine the impact of contextual
determinants on fear of crime, the third article of this dissertation (Chapter 4) will explore
how these physical cues in the environment can be assessed most accurately. Over time,
systematic social observations (SSO) have become a popular method for measuring
environmental characteristics (Hinkle & Yang, 2014). Although this methodological approach
consists of many advantages compared to more traditional methods, some concerns arise
when conducting observations within a specific neighbourhood (e.g., security of observers,
travel costs) (Gracia & Herrero, 2007). In order to find effective and alternative ways to
examine the physical environment, this study applies a multi-method approach combining
three types of SSO (i.e., observations in situ, observations based on original photographs and
observations by means of Google Street View images). The observations were carried out in
four campus neighbourhoods in order to examine the presence of CPTED and disorder. Given
the potential strengths and weaknesses associated with physical and virtual SSO, different
measurement approaches were carried out to evaluate their reliability and validity. By doing
so, the quality of the three observation approaches is assessed in order to improve ecometric
measures of the physical properties of the environment. While this article mainly focuses on
the methodological approach of the examination of the environmental design, the
relationship between the results of these observations and fear of crime are presented in
Chapter 8 of this dissertation.
The third part of this dissertation has an empirical aim and will focus on the application of the
findings of the previous chapters in order to unravel the human factors of campus security.
The fourth article (Chapter 5) aims to examine the factors that contribute to security
awareness and explore how this level of awareness can be improved. As previous research
indicated that security awareness consists of people’s knowledge, attitudes and behaviour
(Baranowski et al., 2003), the relationship between these three dimensions is be measured
based on a large-scale survey among all staff members of the university. Additionally, the
impact of security trainings on staff members’ security awareness is examined, by carrying out
a quasi-experiment on campus. Based on the results of a pre-test and post-test among the
participants of the security trainings, the impact of the training on their security knowledge,
attitude and self-reported behaviour is measured. The findings of this study provide further

Introduction
29
insight in the relationship between people’s knowledge, attitude and behaviour and offers
potential strategies to increase people’s level of security awareness.
The fifth article of the dissertation (Chapter 6) examines further how people’s security
awareness can be improved. By carrying out a quasi-experiment with nudges, it is the aim to
increase cyclists’ awareness and reduce the opportunities for bicycle theft in the direct
neighbourhood of the campus. While this technique showed promising results in domains
such as healthcare (Shaffer, 2017) and sustainable energy consumption (Kasperbauer, 2017),
little is known about its effectiveness in the field of security. Although the campus is subject
to various types of crime, statistics show that bicycle theft has been one of the most common
forms of crime for a long time, especially in neighbourhoods of HEI’s (Van Dijk et al., 2007). A
potential prevention strategy to reduce the opportunities for bicycle theft for offenders is the
stimulation of cyclists to lock their bike in a decent way. Taking this into account, two types of
nudges were implemented at different bicycle parking sites in the neighbourhood of one
university campus. On site observations and a survey among cyclists were carried out in order
to examine the effectiveness of the nudges for reducing bicycle theft. The findings offer more
insight in the potential of the nudging approach to direct people towards more secure
behaviour to prevent crime.
Besides strengthening the human factor in order to reduce crime, it is also the aim of HEI’s to
create an environment in which campus’ residents feel secure to engage in their daily
activities. A minimalization of students’ and staff members’ fear of crime on and in the direct
neighbourhood of the campus is therefore indispensable (Fisher, 1995; Maier & DePrince,
2020). The sixth article of this dissertation (Chapter 7) aims to examine the determinants of
people’s fear of crime in order to decrease these feelings. Focus lies on the influence of
contextual determinants on students’ fear of crime. More specifically, the relationship
between the presence of social and physical disorder and the three dimensions of fear of
crime (i.e., feelings of anxiety, perceived risk of victimization and avoidance behaviour) is
examined based on a large-scale survey among all university students. The findings of this
study provide more insight in the potential strategies to reduce students’ fear of crime on and
in the neighbourhood of the campus by making adjustments in the physical environment.
Introduction
30
The seventh article of this dissertation (Chapter 8) builds on the findings from the previous
chapter and examines further the influence of physical cues in the environment of fear of
crime. In addition to the presence of social and physical disorder, previous research has shown
that also characteristics of the built environment may be related with campus’ residents fear
of crime (Cozens & Sun, 2018; Fisher & May, 2009). In order to examine this relationship, SSO
were carried out to provide insight in the presence of CPTED measures in the neighbourhood
of the four university campuses. Additionally, data collected via the two-large scale surveys
among students (see also Chapter 7) and staff members (see also Chapter 5) were consulted
in order to get a view on their feelings of anxiety, their risk perception and their avoidance
behaviour on campus and in its neighbourhood. By applying this multi-method approach, a
unique insight is provided in the relationship between the environmental design of the four
campuses and students’ and staff members’ fear of crime. Based on these findings,
recommendations to reduce feelings of insecurity among campus’ residents are formulated.
In Chapter 9, the dissertation’s main concluding remarks are highlighted, followed by an
overview of recommendations for HEI’s. Based on our findings derived from the conceptual,
methodological and empirical parts, some guidelines are provided for HEI’s who have the aim
to maintain an open campus culture while ensuring that staff members and students feel
secure. Finally, the limitations of this dissertation are presented, linked to opportunities for
future research.

Introduction
31
1.6. References
Alnatheer, M., Chan, T., & Nelson, K. (2012). Understanding And Measuring Information
Security Culture. In S. L. Pan & T. H. Cao, Proceedings of the 16th Pacific Asia Conference
on Information Systems (PACIS). PACIS 2012, University of Science (Vietnam).
Ammigan, R., & Jones, E. (2018). Improving the student experience: Learning from a
comparative study of international student satisfaction. Journal of Studies in
International Education, 22(4), 283-301.
Armitage, R., & Monchuk, L. (2019). What is CPTED? Reconnecting theory with application in
the words of users and abusers. Policing: A Journal of Policy and Practice, 13(3), 312-
330.
Aven, T. (2007). A unified framework for risk and vulnerability analysis covering both safety
and security. Reliability engineering & system safety, 92(6), 745-754.
Ayim Gyekye, S. (2005). Workers’ perceptions of workplace safety and job satisfaction.
International Journal of occupational safety and ergonomics, 11(3), 291-302.
Baranowski, T., Cullen, K. W., Nicklas, T., Thompson, D., & Baranowski, J. (2003). Are current
health behavioral change models helpful in guiding prevention of weight gain efforts?
Obesity research, 11(S10), 23S-43S.
Barnes, C. M. (2009). Examining campus crime at Virginia's colleges and universities [PhD
Dissertation Virginia Commonwealth University]. VCU Scholars Compass.
Barton, M. S., Jensen, B. L., & Kaufman, J. M. (2010). Social disorganization theory and the
college campus. Journal of Criminal Justice, 38(3), 245-254.
Breidenbach, S. (2000). How secure are you? InformationWeek(800), 71-71.
Brewer, J., & Hunter, A. (2006). Foundations of multimethod research: Synthesizing styles.
Sage.
Campbell, D. T., & Fiske, D. W. (1959). Convergent and discriminant validation by the
multitrait-multimethod matrix. Psychological Bulletin, 56(2), 81.

Introduction
32
Chia, P. A., Maynard, S. B., & Ruighaver, A. B. (2002). Understanding organizational security
culture. Proceedings of PACIS2002. Japan, 158.
Cohen, L. E., Kluegel, J. R., & Land, K. C. (1981). Social inequality and predatory criminal
victimization: An exposition and test of a formal theory. American sociological review,
505-524.
Cozens, P. (2016). Think crime! Using evidence, theory and crime prevention through
environmental design (CPTED) for planning safer cities. Praxis education.
Cozens, P., & Sun, M. Y. (2018). Exploring crime prevention through environmental design
(CPTED) and students’ fear of crime at an Australian university campus using prospect
and refuge theory. Property Management, 37(2), 287-306.
De Jager, J., & Bezuidenhout, G. (2014). Customer satisfaction at private higher education
institutions in South Africa: an importance-performance analysis. Journal of
Contemporary Management, 11(1), 206-229.
Doss, D., Lackey, H., McElreath, D., Gokaraju, B., Tesiero, R., Jones, D., & Lusk, G. (2017).
Quantitatively Assessing Reported Crime versus Enrollment among Selected Higher
Education Institutions. Universal Journal of Educational Research, 5(10), 1678-1683.
Fernandez, M. (2005). Crime prevention and the perception of safety in campus design [M.A.
thesis, Louisiana State University]. LSU Digital Commons.
Fisher, B. S. (1995). Crime and fear on campus. The Annals of the American Academy of
Political and Social Science, 539(1), 85-101.
Fisher, B. S., & May, D. (2009). College students' crime-related fears on campus: Are fear-
provoking cues gendered? Journal of Contemporary Criminal Justice, 25(3), 300-321.
Fox, J. A., & Hellman, D. A. (1985). Location and other correlates of campus crime. Journal of
Criminal Justice, 13(5), 429-444.
Fox, K. A., Nobles, M. R., & Piquero, A. R. (2009). Gender, crime victimization and fear of crime.
Security Journal, 22(1), 24-39.

Introduction
33
Ghafir, I., Saleem, J., Hammoudeh, M., Faour, H., Prenosil, V., Jaf, S., Jabbar, S., & Baker, T.
(2018). Security threats to critical infrastructure: the human factor. The Journal of
Supercomputing, 74(10), 4986-5002.
Gibson, C. L., Zhao, J., Lovrich, N. P., & Gaffney, M. J. (2002). Social integration, individual
perceptions of collective efficacy, and fear of crime in three cities. Justice quarterly,
19(3), 537-564.
Gover, A. R., Tomsich, E. A., Jennings, W. G., & Higgins, G. E. (2011). An exploratory study on
perceptions of safety, fear of crime, and victimization experiences among faculty and
staff at an urban university: A focus on gender. Criminal Justice Studies, 24(1), 37-55.
Gracia, E., & Herrero, J. (2007). Perceived neighborhood social disorder and attitudes toward
reporting domestic violence against women. Journal of Interpersonal Violence, 22(6),
737-752.
Gregory, D. E., & Janosik, S. M. (2002). The Clery Act: How effective is it-perceptions from the
field-the current state of the research and recommendations for improvement. Stetson
Law Review, 32, 7.
Hale, C. (1996). Fear of crime: A review of the literature. International review of Victimology,
4(2), 79-150.
Hansen, P. G., & Jespersen, A. M. (2013). Nudge and the manipulation of choice: A framework
for the responsible use of the nudge approach to behaviour change in public policy.
European Journal of Risk Regulation, 4(1), 3-28.
Hardyns, W., & Pauwels, L. (2010). Different measures of fear of crime and survey
measurement error. Governance of Security Research Papers Series III, New Empirical
Data, Theories and Analyses on Safety, Societal Problems and Citizens’ Perceptions, 19-
39.
Hausman, D. M., & Welch, B. (2010). Debate: To nudge or not to nudge. Journal of Political
Philosophy, 18(1), 123-136.
Hayes, B. E., O’Neal, E. N., & Hernandez, C. N. (2020). The Sexual Victimization of College
Students: A Test of Routine Activity Theory. Crime & Delinquency, 1-26.

Introduction
34
Hinkle, J. C., & Yang, S.-M. (2014). A new look into broken windows: What shapes individuals’
perceptions of social disorder? Journal of Criminal Justice, 42(1), 26-35.
Hu, L., & Bentler, P. (1999). Cutof criteria for fit indexes in covariance structure analysis:
Conventional criteria versus new alternatives. Structural Equation Modeling, 6, 1-55.
Huesman, R., Brown, A. K., Lee, G., Kellogg, J. P., & Radcliffe, P. M. (2009). Gym bags and
mortarboards: Is use of campus recreation facilities related to student success? NASPA
journal, 46(1), 50-71.
Hunter, A., & Brewer, J. D. (2015). Designing multimethod research. In S. N. Hesse-Biber & B.
R. Johnson (Eds.), The Oxford handbook of multimethod and mixed methods research
inquiry (pp. 185-205). Oxford University Press.
Jackson, J., & Stafford, M. (2009). Public health and fear of crime: A prospective cohort study.
The British Journal of Criminology, 49(6), 832-847.
Jacobsen, S. K. (2017). Examining crime on campus: The influence of institutional factors on
reports of crime at colleges and universities. Journal of Criminal Justice Education,
28(4), 559-579.
Janosik, S. M., & Gehring, D. D. (2003). The impact of the Clery Campus Crime Disclosure Act
on student behavior. Journal of College Student Development, 44(1), 81-91.
Jeffery, C. R. (1971). Crime prevention through environmental design. American Behavioral
Scientist, 14(4), 598-598.
Jennings, W. G., Gover, A. R., & Pudrzynska, D. (2007). Are institutions of higher learning safe?
A descriptive study of campus safety issues and self‐reported campus victimization
among male and female college students. Journal of Criminal Justice Education, 18(2),
191-208.
Johnson, E. C. (2006). Security awareness: switch to a better programme. Network security, 2,
15-18.
Kaminski, R. J., Koons-Witt, B. A., Thompson, N. S., & Weiss, D. (2010). The impacts of the
Virginia Tech and Northern Illinois University shootings on fear of crime on campus.
Journal of Criminal Justice, 38(1), 88-98.

Introduction
35
Kasperbauer, T. J. (2017). The permissibility of nudging for sustainable energy consumption.
Energy Policy, 111, 52-57.
Kaur, J., & Mustafa, N. (2013). Examining the effects of knowledge, attitude and behaviour on
information security awareness: A case on SME. In Proceedings of 2013 International
Conference on Research and Innovation in Information Systems (ICRIIS), 3rd
International Conference on Research and Innovation in Information Systems, Kuala
Lumpur.
Kenny, D. A. (1975). A quasi-experimental approach to assessing treatment effects in the
nonequivalent control group design. Psychological Bulletin, 82(3), 345.
Klein, L., & Martin, S. L. (2019). Sexual harassment of college and university students: a
systematic review. Trauma, Violence, & Abuse, 1-16.
Kline, R. (2011). Principles and practices of structural equation modeling (2nd ed.). The Guilford
Press.
Kriaa, S., Pietre-Cambacedes, L., Bouissou, M., & Halgand, Y. (2015). A survey of approaches
combining safety and security for industrial control systems. Reliability engineering &
system safety, 139, 156-178.
Kyle, M. J., Schafer, J. A., Burruss, G. W., & Giblin, M. J. (2017). Perceptions of campus safety
policies: Contrasting the views of students with faculty and staff. American journal of
criminal justice, 42(3), 644-667.
Ledford, J. R., & Gast, D. L. (2014). Single case research methodology: Applications in special
education and behavioral sciences. Routledge.
Luo, X., Brody, R., Seazzu, A., & Burd, S. (2011). Social engineering: The neglected human factor
for information security management. Information Resources Management Journal
(IRMJ), 24(3), 1-8.
Maier, S. L., & DePrince, B. T. (2020). College students’ fear of crime and perception of safety:
The influence of personal and university prevention measures. Journal of criminal
justice education, 31(1), 63-81.

Introduction
36
Malcolmson, J. (2009). What is security culture? Does it differ in content from general
organisational culture? 43rd Annual 2009 international Carnahan conference on
security technology, Zurich, Switzerland.
Maran, D. A., & Begotti, T. (2019). Prevalence of cyberstalking and previous offline
victimization in a sample of Italian university students. Social Sciences, 8(30), 1-10.
Maran, D. A., & Zedda, M. (2014). Stalking victimization among Italian university students.
Gender and Behaviour, 12(1), 6070-6079.
Marzbali, M. H., Abdullah, A., Razak, N. A., & Tilaki, M. J. M. (2012). The influence of crime
prevention through environmental design on victimisation and fear of crime. Journal
of environmental psychology, 32(2), 79-88.
Máté, S. (2017). Assessing and Enhancing Nuclear Safety and Security Culture for Small
Facilities that Handle Radioactive Material. International Journal of Nuclear Security,
3(1), 12.
May, D. C., Rader, N. E., & Goodrum, S. (2010). A gendered assessment of the ‘‘threat of
victimization’’: Examining gender differences in fear of crime, perceived risk,
avoidance, and defensive behaviors. Criminal justice review, 35(2), 159-182.
McCormac, A., Zwaans, T., Parsons, K., Calic, D., Butavicius, M., & Pattinson, M. (2017).
Individual differences and information security awareness. Computers in Human
Behavior, 69, 151-156.
McPheters, L. R. (1978). Econometric analysis of factors influencing crime on the campus.
Journal of Criminal Justice, 6(1), 47-52.
Metalidou, E., Marinagi, C., Trivellas, P., Eberhagen, N., Giannakopoulos, G., & Skourlas, C.
(2014). Human factor and information security in higher education. Journal of Systems
and Information Technology, 16(3), 210-221.
Nettle, D., Nott, K., & Bateson, M. (2012). ‘Cycle thieves, we are watching you’: Impact of a
simple signage intervention against bicycle theft. PloS one, 7(12), e51738.

Introduction
37
Newbould, M., & Furnell, S. (2009). Playing Safe: A prototype game for raising awareness of
social engineering [Paper presentation]. 7th Australian Information Security
Management Conference, Perth, Western Australia.
Nielsen, M. B., Mearns, K., Matthiesen, S. B., & Eid, J. (2011). Using the Job Demands–
Resources model to investigate risk perception, safety climate and job satisfaction in
safety critical organizations. Scandinavian Journal of Psychology, 52(5), 465-475.
Nobles, M. R., Fox, K. A., Khey, D. N., & Lizotte, A. J. (2013). Community and campus crime: A
geospatial examination of the Clery Act. Crime & Delinquency, 59(8), 1131-1156.
Parsons, K., McCormac, A., Pattinson, M., Butavicius, M., & Jerram, C. (2014). A study of
information security awareness in Australian government organisations. Information
Management & Computer Security, 22(4), 334-345.
Pattinson, M., Butavicius, M., Parsons, K., McCormac, A., & Calic, D. (2015). Factors that
influence information security behavior: An Australian web-based study. International
Conference on Human Aspects of Information Security, Privacy, and Trust, Los Angeles,
CA, USA.
Perkins, D. D., & Taylor, R. B. (2002). Ecological assessments of community disorder: Their
relationship to fear of crime and theoretical implications. In Ecological research to
promote social change (pp. 127-170). Springer.
Petherick, N. (2000). Environmental design and fear: the prospect-refuge model and the
university college of the Cariboo campus. Western Geography, 10(11), 89-112.
Rasmussen, C., & Johnson, G. (2008). The Ripple Effect of Virginia Tech: Assessing the
Nationwide Impact on Campus Safety and Security Policy and Practice. Midwestern
Higher Education Compact.
Reniers, G., Landucci, G., & Khakzad, N. (2020). What safety models and principles can be
adapted and used in security science? Journal of Loss Prevention in the Process
Industries, 64, 104068.
Reniers, G. L., Cremer, K., & Buytaert, J. (2011). Continuously and simultaneously optimizing
an organization’s safety and security culture and climate: the Improvement Diamond

Introduction
38
for Excellence Achievement and Leadership in Safety & Security (IDEAL S&S) model.
Journal of Cleaner Production, 19(11), 1239-1249.
Rezgui, Y., & Marks, A. (2008). Information security awareness in higher education: An
exploratory study. Computers & security, 27(7-8), 241-253.
Robinson, J. B., Lawton, B. A., Taylor, R. B., & Perkins, D. D. (2003). Multilevel longitudinal
impacts of incivilities: Fear of crime, expected safety, and block satisfaction. Journal of
quantitative criminology, 19(3), 237-274.
Robinson, M. (1999). The theoretical development of crime prevention through
environmental design (CPTED). Advances in Criminological Theory, 8, 427-462.
Ruighaver, A. B., Maynard, S. B., & Chang, S. (2007). Organisational security culture: Extending
the end-user perspective. Computers & security, 26(1), 56-62.
Sani, A., Nunes, L. M., Azevedo, V., & Sousa, H. F. (2020). Campus Criminal Victimization among
Higher Education Students: A Diagnosis of Local Security in Porto. Journal of criminal
justice education, 31(2), 250-266.
Sas, M., Reniers, G., van Nunen, K., Hardyns, W., & Ponnet, K. (2020). Adequaat
risicomanagement voor fysieke beveiliging: het gebruik van modellen en metaforen
gebaseerd op kennis uit het veiligheidsdomein. Tijdschrift voor toegepaste
Arbowetenschap, 33(3), 93-103.
Sas, M., Van Nunen, K., Reniers, G., Ponnet, K., & Hardyns, W. (2019). When safety meets
security. Veiligheidsnieuws Prebes, 204, 6-10.
Schlienger, T., & Teufel, S. (2003). Analyzing information security culture: increased trust by
an appropriate information security culture [Paper presentation]. 14th International
Workshop on Database and Expert Systems Applications, Prague, Czech Republic.
Schlienger, T., & Teufel, S. (2005). Tool supported management of information security culture.
20th IFIP international information security conference, Makuhari-Messe, Chiba, Japan.
Schokkenbroek, J., Sas, M., Ponnet, K., & Hardyns, W. (2020). Seksuele intimidatie in (dating-)
relaties en de publieke ruimte: een vergelijking tussen twee survey-onderzoeken bij
Vlaamse universiteitsstudenten. Panopticon, 41(1), 99.

Introduction
39
Schreck, C. J., & Miller, J. M. (2003). Sources of fear of crime at school: What is the relative
contribution of disorder, individual characteristics, and school security? Journal of
School Violence, 2(4), 57-79.
Schuck, A. M. (2017). Evaluating the impact of crime and discipline on student success in
postsecondary education. Research in Higher Education, 58(1), 77-97.
Schuilenburg, M., & Peeters, R. (2015). From biopolitics to mindpolitics: Nudging in safety and
security management. Open! Platform for Art, Culture & the Public Domain, 1-7.
Shaffer, V. A. (2017). Nudges for health policy: Effectiveness and limitations. Missouri Law
Review, 82, 727.
Siponen, M. T. (2000). A conceptual foundation for organizational information security
awareness. Information Management & Computer Security, 8(1), 31-41.
Skogan, W. G. (1990). Disorder and decline: crime and the spiral of decay in American
neighborhoods. The Free Press.
Solms, B. V. (2000). Information security-The third wave? Computers & security, 19(7), 615-
615.
Steinmetz, N. M., & Austin, D. M. (2014). Fear of criminal victimization on a college campus: A
visual and survey analysis of location and demographic factors. American journal of
criminal justice, 39(3), 511-537.
Tewksbury, R., & Mustaine, E. E. (2003). College students' lifestyles and self-protective
behaviors: Further considerations of the guardianship concept in routine activity
theory. Criminal Justice and Behavior, 30(3), 302-327.
Thaler, R. H., & Sunstein, C. R. (2009). Nudge: Improving decisions about health, wealth, and
happiness. Penguin.
The British Council. (2012). Student insight hot topics: The rise in global student safety
concerns. https://www.britishcouncil.org/voices-magazine/uk-number-one-
studyabroad-destination-us-students
Thunström, L. (2019). Welfare effects of nudges: The emotional tax of calorie menu labeling.
Judgment and Decision making, 14(1), 11.

Introduction
40
Tseng, C.-H., Duane, J., & Hadipriono, F. (2004). Performance of campus parking garages in
preventing crime. Journal of Performance of Constructed Facilities, 18(1), 21-28.
Van Dijk, J. J., Van Kesteren, J., & Smit, P. (2007). Criminal victimisation in international
perspective: Key findings from the 2004-2005 ICVS and EU ICS. Boom Juridische
Uitgevers Den Haag.
Vierendeels, G., Reniers, G., van Nunen, K., & Ponnet, K. (2018). An integrative conceptual
framework for safety culture: The Egg Aggregated Model (TEAM) of safety culture.
Safety science, 103, 323-339.
Warr, M. (2000). Fear of crime in the United States: Avenues for research and policy. Criminal
justice, 4(4), 451-489.
Weisburd, D., Groff, E. R., & Yang, S.-M. (2012). The criminology of place: Street segments and
our understanding of the crime problem. Oxford University Press.
Weiss, K. G. (2013). Party school: Crime, campus, and community. UPNE.
Wilson, J. Q., & Kelling, G. L. (1982). Broken windows. Atlantic monthly, 249(3), 29-38.
World Institute for Nuclear Security (WINS) (2011). A WINS international best practice guide
for your organization: Nuclear security culture. WINS.

41
A conceptual framework for physical security culture
42
CHAPTER 2
An integrative conceptual framework for physical security culture in
organizations
A conceptual framework for physical security culture in organizations is proposed, based on
the integrative model of safety culture, as developed by Vierendeels et al. (2018). The proposed
conceptual framework for physical security culture has the advantage that it brings security
threats, technique, organization and human aspects together in a coherent, integrative and
related way. The framework includes five main domains of security culture, being (1) an
observable technological domain, (2) an observable organizational domain, (3) an observable
human domain, (4) a non-observable organizational domain or perceptual domain, and (5) a
non-observable human domain or psychological domain. These five main domains can be
further divided into several more specific sub-domains of security culture. At their turn, these
sub-domains can be translated into measurable security results, being (1) observable security
outcomes, (2) the security climate of an organization or the shared perceptions on security,
and (3) the individual intention to behave secure or insecure. The aim of the framework is to
take all security-related aspects into account – based on the specific security threats to which
an organization is exposed – leading to a pro-active approach of the physical security of
organizations. The framework provides specific points of departure to make the security
culture measurable, and by extension controllable.
This chapter is based on:
van Nunen, K., Sas, M., Reniers, G., Vierendeels, G., Ponnet, K., & Hardyns, W. (2018). An
integrative conceptual framework for physical security culture in organizations. Journal of
Integrated Security Science, 2(1), 25-32.

A conceptual framework for physical security culture
43
2.1. Introduction
The field of academic research in the domain of security culture is relatively new. Only since
the beginning of this century, attention for security has been translated into scientific
research, with a huge boost in studies since 9/11. From then on, more and more security
initiatives have been emerged in both science and practice. Due to the relatively young status
of security culture research, conceptual frameworks, theories, and models are still fully
developing. An advantage in this ongoing development process, is the resemblance of security
with safety, causing that inspiration for security research can be found in the field of safety
research, of which the latter has a longer academic history.
In this paper, a conceptual framework for physical security culture in organisations is
proposed, based on the integrative model of safety culture, as developed by Vierendeels et
al. (2018). The safety culture model of Vierendeels et al. (2018) is called The Egg Aggregated
Model (TEAM) of safety culture and is developed based on an extensive review of literature
regarding existing studies and models with respect to safety.
2.2. Main resemblances and differences between safety and security
For a long time, security and safety were seen as independent from each other. Though, more
recent research illustrates that there arises synergy when safety and security measures are
considered jointly. Much can be learned from adopting the knowledge of the one discipline to
the other and vice versa (Kria et al., 2015).
The main resemblance between safety and security is the focus on preventing undesirable
events such as injury to people, material damage and environmental damage. The main
difference is the origin of these undesirable events, being unintentional in the field of safety,
and intentional in the field of security. This difference in origin leads to an important
distinction in the desired degree of transparency. In the field of safety, a high level of
transparency – both within and outside organisations – is required in order to optimally
prevent undesirable safety events and in order to optimally come to insights and learn from
each other. However, in the field of security, this transparency is also needed, but only within
trusted communities, for instance within a single plant or between multiple plants of the same
organisation. Outside these trusted communities, the level of transparency should be

A conceptual framework for physical security culture
44
curtailed in order to optimally prevent undesirable security events and to protect (sensitive)
information. This can be clarified by, for example, storage tanks of chemical products. Safety-
wise, the characteristics of the stored chemicals should be easily retrievable in case of for
instance a leak or a fire. However, security-wise, the retrievability of the chemical
characteristics makes it easier to choose a target in case of for instance theft or a terrorist
attack. Therefore, this information should only be shared within the trusted community, for
instance with the nearest fire department.
Another distinction relates to the difference between risks in the domain of safety, and threats
in the field of security. Safety risks are predominantly rooted inside the organisation, whereas
security threats are mostly rooted outside of the organisation. Safety risks are often well-
known by the organisation, as the accident scenarios are inherently linked to the specific
characteristics of the organisation. However, looking at security, it is more difficult to fully
cover the specific threats to which an organisation is exposed, as this could cover a wide
spectrum of possible scenarios that are influenced by aspects out of the control or knowledge
of an organisation (Jore, 2017).
A noteworthy resemblance is that both safety and security can be viewed as a part of the
overall organisational culture (Hopkins, 2006; Connolly, 2000). This implies that both safety
and security should be integrated in other corporate processes. Doing so, in order to be as
efficient and effective as possible, both safety and security should be assessed in an
integrative, holistic way. In other words, continuous attention is needed for both the safety
culture and the security culture of an organisation.
2.3. The need for a proactive and integrative approach of security
culture
Organisations – and even governances – are approaching their security in a predominantly
reactive manner which is incident-driven, instead of using a more proactive approach
(Ruighaver et al., 2007). Also, based on the literature, it can be concluded that security
research often lacks an integrative approach. After all, it are mainly the technological security
aspects that receive attention. It is only in the last decade that the concept of security culture
gains interest from researchers and business leaders, with a dominant position of
information/cyber security. There is nearly no reference to other types of security issues.

A conceptual framework for physical security culture
45
However, in analogy with safety culture, a proactive and holistic approach is needed when
addressing the security culture of an organisation.
As elaborated in the safety culture model of Vierendeels et al. (2018), safety culture consists
of three main domains, being a technological, an organisational and a human domain. This
approach can be extended to the field of security culture, where security culture consists of
three main domains:
(1) A technological domain, which comprises aspects regarding the present security
technology, material and equipment present in the company.
(2) An organisational domain, which comprises aspects such as the security
management, the company security policy, and the resources available for security.
(3) A human domain, which comprises aspects such as knowledge, attitudes,
assumptions, decisions, and actions of individuals regarding security.
Both the organisational and the human domain are manifested at two levels:
(1) Firstly, there are the tangible, observable aspects regarding security. These are the
aspects that are observable when walking around in the company. This concerns, for
instance, the security behaviour of employees, or the security rules, procedures,
instructions, etc. that can be consulted in documents of the company.
(2) Secondly, there are the less tangible, non-observable aspects. These are the aspects
that cannot be observed by walking around in a company. This concerns, for instance,
what employees think of the level of security in the company, or the attitude they have
towards security.
The technological domain consists only of observable aspects. This structure leads to five
domains, as can be seen in Figure 2.1, which together form the physical security culture of an
organisation. The five domains can be further divided into several sub-domains, which are
represented as the white boxes in Figure 2.1. Important are the arrows in the model, which
symbolise that all the different domains of the physical security culture are related in a cyclic
way.

A conceptual framework for physical security culture
46
The grey boxes in the conceptual model represent the security results. In case of the three
observable domains, the several sub-domains result in observable security outcomes. In case
of the non-observable organisational domain or the perceptual domain, the several sub-
domains result in the security climate of an organisation, being the shared perceptions on
security. In case of the non-observable human domain or the psychological domain, the
several sub-domains result in the individual intention to behave secure or insecure.
The security culture of a specific organisation is influenced by external factors such as the level
of technological development of a country or a region, the socio-economic status of a country
or a region, the policies, regulations and legislations of a country or a region, the national
culture, etcetera. In addition, the security culture of an organisation is inextricably linked to
the security threats to which a specific organisation is exposed to. In other words, the entire
security culture of an organisation – security results included – is influenced by the specific
security threats of the organisation. For instance, in the financial sector, the security threats
of espionage, fraud and theft are more prominent than for instance in the chemical sector
where the security threats of terrorism and activism are more prominent. The presence of
these possible security threats influence the entire development and rollout of the security
culture of the organisation.

A conceptual framework for physical security culture
47
Figure 2.1. An integrative conceptual framework for physical security culture in organisations.

A conceptual framework for physical security culture
48
2.4. Addressing the security culture of an organisation
To address the physical security culture of an organisation, several steps should be taken as
illustrated in Figure 2.2. Firstly, the security culture should be diagnosed. In order to obtain a
clear image of the current physical security culture in the organisation, all sub-domains
constituting physical security culture should be measured.
Subsequently, based on this measurement, recommendations should be formulated and
implemented in order to improve the current physical security culture (van Nunen et al.,
2016). It is important that continuous attention is being paid to the security of a company.
Follow-up is needed in order to meet with possible changes within the company as well as
external developments and trends in the field of security. It is an everlasting process, a cycle
of evaluation and maintenance or change.
During this continuous process of addressing security culture, some aspects should be taken
into account, in analogy with addressing safety culture (van Nunen et al., 2016). It is for
instance important to use a multi-method approach in order to adequately explore and
understand the security culture of an organisation. Also, the involvement of the entire
organisation is important. Employees, supervisors, managers, contractors, clients, suppliers,
etcetera; all should be taken into account when diagnosing the security culture. This
comprehensive involvement is not only crucial during the diagnose of the security culture, but
also during the phase of formulating improvement strategies and setting priorities. Not only
leads this comprehensive involvement to a more accurate diagnose of the security culture, it
also leads to the creation of a foundation to successfully implement and maintain the
improvement strategies.
Figure 2.2. Addressing physical security culture (adapted from van Nunen et al., 2016).

A conceptual framework for physical security culture
49
2.5. Conclusion
The proposed conceptual framework for physical security culture in organisations has the
advantage that it brings technique, organisation and human together in a coherent,
integrative and related way. The aim of the framework is to take all security-related aspects
into account, leading to a pro-active approach of the physical security, instead of working on
an incident-driven base. The framework provides specific points of departure to make the
security culture measurable, and by extension controllable. The importance of continuous
attention for security is being stressed, as well as the importance of the involvement of the
entire organisation in order to obtain sustainable improvements in the field of security.

A conceptual framework for physical security culture
50
2.6. References
Connolly, P.J. (2000). Security starts from within. InfoWorld, 22(28), 39-40.
Hopkins, A. (2006). Studying organisational cultures and their effects on safety. Safety Science,
44(10), 875-889.
Jore, S.H. (2017). The conceptual and scientific demarcation of security in contrast to safety.
European Journal for Security Research, 4(1), 157-174.
Kria, S., Pietre-Cambacedes, L., Bouissou, M., & Halgand, Y. (2015). A survey of approaches
combining safety and security for industrial control systems. Reliability engineering &
system safety, 139, 156-178.
Ruighaver, A.B., Maynard, S.B., & Chang, S. (2007). Organisational security culture: Extending
the end-user perspective. Computers and Security, 26(1), 56-62.
van Nunen, K., Reniers, G., Ponnet, K. (2016). Measuring and improving safety culture in
organisations: an exploration of tools developed and used in Belgium. Journal of Risk
Research, 22(5), 622-644.
Vierendeels, G., Reniers, G., van Nunen, K., & Ponnet, K. (2018). An Integrative Conceptual
Framework for Safety Culture: The Egg Aggregated Model (TEAM) of Safety Culture.
Safety Science, 103, 323-339.


Measuring security culture
52
CHAPTER 3
Measuring the security culture in organizations: A systematic overview of
existing tools
There has been an increase in research into the security culture in organizations in recent years.
This growing interest has been accompanied by the development of tools to measure the level
of security culture in order to identify potential threats and formulate solutions. This article
provides a systematic overview of the existing tools. A total of 16 are identified, of which six
are studied in detail. This exploration reveals that there is no validated and widely accepted
tool that can be used in different sectors and organizations. The majority of the tools reviewed
use only a quantitative method; however, security culture includes very different domains and
therefore a mixed-method approach should be used. In contrast to security culture,
instruments for measuring safety culture are widely available, and with many similarities
between these two domains it is possible that well-established tools for measuring safety
culture could be adapted to a security environment.
This chapter is based on:
Sas, M., Hardyns, W., van Nunen, K., Reniers, G., & Ponnet, K. (2020). Measuring the security
culture in organizations: a systematic overview of existing tools. Security Journal, 34(2), 340-
357.

Measuring security culture
53
3.1. Introduction
Prior to 2001 organizations generally paid little or no attention to security threats. However,
the terrorist attacks on 9/11 instigated a shift, and the issue of security was suddenly much
more important (Baybut & Ready, 2003). Many business leaders focused on implementing
new security technology, and paid less attention to the broader ‘security culture’ of their
organization (Chia et al., 2003). However, the increased interest in security within
organizations encouraged researchers to study this topic more in depth. They realized that an
organization’s security culture might play an important role in maintaining an adequate level
of security in an organization (Andress & Fonseca, 2000; Beynon, 2001; Breidenbach, 2000;
Schwarzwalder, 1999; von Solms, 2000). For instance, Connolly (2000) argues that a strong
security culture is needed to convince employees that security is an important issue, as it
impacts the likelihood of a malicious attack. Vierendeels et al. (2018) believe that the success
of security measures is related to the security culture of organizations. According to Da Veiga
and Martins (2015), a strong security culture enables members of an organization to behave
in a more secure way in order to reduce security incidents.
Despite substantial interest in the subject, researchers struggle to agree on what factors or
constructs constitute security culture, and how it can be established (Alnatheer et al., 2012;
Schlienger & Teufel, 2003). A number of authors suggest that security culture must be
regularly modified to ensure that it constantly corresponds with the goals of an organization
(Kruger and Kearney, 2006; Martins & Eloff, 2002; Schlienger & Teufel, 2003). They emphasize
the importance of repeated measurement in order to propose recommendations that
establish, improve, and maintain a strong security culture (Chia et al., 2003). Unfortunately,
very little research has been carried out into how organizational security culture should be
evaluated (Chia et al., 2003), and only a few measuring tools have been created worldwide
(Schlienger & Teufel, 2005).
Effective tools for measuring organizational security culture enable businesses to uncover
critical issues and risk areas, formulate recommendations, and implement improvements over
time. Therefore, an overview of the tools that are currently available could provide useful
insights for practitioners and highlight areas for further research (Chia et al., 2003). While van
Nunen et al. (2018a) have explored the tools used and developed in Belgian organizations to

Measuring security culture
54
measure safety culture, an overview of the existing instruments that measure security culture
is lacking. Therefore, the aim of this paper is to provide a systematic overview of the science-
based instruments that are used to assess security culture within organizations worldwide.
Below, we first give an overview of the state-of-the-art insights into security culture. We then
provide information about the methodological approach of our systematic review, followed
by a comparison of the characteristics of the measuring tools that have been reviewed. Finally,
we discuss the findings and provide recommendations for organizations and future research.
3.2. Security culture
Lundy and Cowling (1996) argue that security culture can be seen as a subculture of the
organizational culture. The latter can, in simplest terms, be described as “the way things are
done in an organization”. According to Schein (2009, p. 27), organizational culture is ‘a pattern
of shared tacit assumptions that is learned by a group’. When developed well, this can solve
internal and external organizational problems. Nosworthy (2000) argues that organizational
culture has a strong impact on security culture. A first definition of security culture was
formulated within the domain of information security by Schlienger and Teufel (2003, p. 405),
who stated that security culture is ‘all socio-cultural measures that support technical security
measures’. Malcolmson (2009, p. 361) presented a more extensive definition, arguing that
‘security culture is indicated in the assumptions, values, attitudes and beliefs, held by members
of an organization, and behaviours they perform’. Importantly, security culture should not be
confused with the security climate, which refers to employees’ shared perceptions about the
organization’s security policy. The security climate should therefore be seen as a part of the
whole security culture of a company (Vierendeels et al., 2018).
A distinction can be made between information security, such as the protection of computer
networks and the data therein, and physical security, such as the protection of infrastructure
and employees. According to van Niekerk and von Solms (2005), who based their ideas on
Schein’s (2004) model of organizational culture, information security culture consists of four
levels: (1) artifacts, (2) espoused values, (3) shared tacit assumptions, and (4) information
security knowledge. The artifacts reflect the visible and measurable security aspects in an
organization, such as the behaviour of employees, security handbooks, or technology.
Espoused values are a partially visible layer of security culture, such as the goals, strategies,

Measuring security culture
55
or documents that describe the principles and values of the company. The shared tacit
assumptions form the core of the organization’s culture when the values and beliefs of the
organization become shared. The fourth level, information security knowledge, supports the
other three levels. According to the authors, in order to create a strong security culture,
employees need to have enough security knowledge, they need to know the security needs
of the organization, and they need to be aware of why security measures have been taken
(van Niekerk & von Solms, 2005). Other researchers (Schlienger & Teufel, 2005; Vroom & von
Solms, 2004; Zakaria, 2004) also link their model of security culture to Schein’s (2004)
organizational model and identify similar aspects of information security culture.
Focusing on physical security culture in chemical plants, Reniers and Dullaert (2007) identify
three crucial domains: people, procedures, and technology. They argue that the people
domain comprises individuals’ ideas about the organization’s security and the way they handle
security. The procedures domain refers to the measures that are implemented to safeguard
the security of the organization. Finally, the technology domain comprises the technical
devices used to protect company from criminal acts. Starting from the same theoretical
foundation as Reniers and Dullaert (2007), a more elaborate description of physical security
culture is proposed by van Nunen et al. (2018b), who focus on the similarity between aspects
of a safety culture presented in The Egg Aggregated Model (TEAM) (Vierendeels et al., 2018).
According to the authors, both safety and security culture can be separated into three
domains: technological, organizational, and human. Focusing on security culture, the
technological domain consists of aspects such as the security technology, equipment, and
material of the organization. The organizational domain comprises the security policy, the
resources available for security, and the security management. Finally, the human domain
contains aspects such as security knowledge, attitudes, priorities, decisions, and the behaviour
of employees. Van Nunen et al. (2018b) argue that the organizational and human domains are
manifested at two levels. At the first level are the observable security aspects that are
noticeable when walking around the company. The second level consists of the non-
observable, or not immediately apparent, aspects of security that can still be measured. In
contrast to the organizational and human domain, the technological domain comprises only
observable aspects of security.

Measuring security culture
56
In addition to the aspects related to the characteristics of the organization, the influence of
external factors is emphasized. Factors such as the socio-economic status, level of
technological development, or regulations and legislation of the country or region where the
organization is based affect its security culture. Security culture is also determined by the
security threats, such as theft, terrorism, or espionage, that an organization is exposed to.
Organizations’ vulnerability to these threats differs depending on the company’s
characteristics. For instance, nuclear companies are more vulnerable to terrorism or activism,
whereas in the financial sector security threats such as fraud or theft are more prominent.
When measuring security culture, van Nunen et al. (2018a) recommend a multi-method
approach in order to take into account the technological, organizational, and human aspects.
The authors argue that quantitative methods such as questionnaires are needed to measure
the non-observable domains of security culture, for instance the security knowledge of
employees. Qualitative tools such as observations, interviews, or focus groups are required to
measure the observable security domains, for instance the written security procedures.
Qualitative methods can also provide a broader view of the non-observable aspects, such as
the management’s security priorities. Alvesson and Berg (1992) point out that qualitative and
quantitative methods have both weaknesses and strengths, and therefore a mixed method
approach should be used to measure the security culture in depth. The International Atomic
Energy Agency (IAEA) (2017) agrees, and states that a triangulated approach is needed to
gather data from multiple points of reference. For instance, surveys could be followed by
interviews to clarify ambiguities and fill in possible gaps.
Despite researchers’ increased interest in security culture, there is no widely accepted or
validated tool available for measuring security culture within different kinds of organization.
However, a few researchers have developed tools that measure culture within a specific
security domain. As part of this study, in order to get a clear view of the different approaches,
a systematic overview was conducted. It was hoped that identifying the characteristics of
current measuring tools would enable researchers and organizations to gain more insight in
order to develop a standardized and validated instrument. The methodological approach used
for the systematic overview is presented below.

Measuring security culture
57
3.3. Methodology
3.3.1. Search strategy
Two online databases, Google Scholar and Web of Science, were searched for measuring tools.
The following keywords were used: [instrument OR survey OR measuring tool OR assessment
OR questionnaire] AND [security OR security culture OR security behaviour OR security
climate]. In addition, other relevant studies were retrieved by manually screening the
references of all the full-text articles that were included in the study. When necessary details
about a measuring tool were missing in the article or related studies, the developer of the tool
was contacted via email in order to gather more information. No limits were put on where or
when studies were conducted. However, as research on security culture is still at an early
stage, only studies between 2000 and 2019 were found and selected.
3.3.2. Inclusion criteria
Studies were selected for inclusion by reviewing each article for its relevance and content. The
inclusion process was based on five criteria:
(1) A focus on security culture: Because numerous researchers argue that security
awareness should be seen as only a part of the security culture (Alnatheer et al., 2012;
van Niekerk & von Solms, 2005), studies from authors who indicate that they only focus
on security awareness among employees of an organization were excluded from the
review.
(2) Original tool: Only articles that contain a description of a tool by its original
developers are included in the review. Studies containing information about a tool
developed by someone other than the article authors were excluded. In such cases,
the original tools were checked for their relevance to this study.
(3) Sufficient information about the content of the instrument: The article must
contain sufficient, and detailed, information about the content and application of the
measuring tool, to enable this study to provide a comprehensive overview of the
different options. Articles that contain only limited details, even after contacting the
author, were excluded.

Measuring security culture
58
(4) Possible applications of the tool: Because this article aims to give an overview of
the existing tools within very different security domains, it is important that a specific
comparison is possible. For instance, Maidabino and Zainab (2011) developed a tool
that can only be used to measure the security culture in libraries, so its application
possibilities are limited to one specific sector. Only studies that provide a tool with
more or less generalizable content were included.
(5) Practical approach: In order to understand how the tool can be used in practice,
only articles that contain a clear description of the application process are included.
Solely theoretical approaches were excluded.
3.3.3. Results of the search
In total, 12 tools were retrieved during the search using the keywords, while four other
relevant studies were retrieved by manually screening the references of all the full-text
articles included in the overview (see Figure 3.1). Application of the inclusion criteria resulted
in a number of exclusions. Four tools were excluded because of their narrow focus on security
awareness instead of security culture (criterion 1). One tool was excluded because the tool
had been created by someone other than the article authors (criterion 2). Two tools were
excluded because of a lack of sufficient information about the content of the instrument
(criterion 3). One tool was excluded because the tool could not be generalized to other
situations (criterion 4). Two tools were excluded because they were solely theoretical
(criterion 5). In the end, six tools were eligible for inclusion in the systematic overview.
Figure 3.1. Results of the search for security culture measuring tools.

Measuring security culture
59
3.3.4. Information collected per tool
Table 3.1 provides an overview of the general characteristics of the reviewed tools. Firstly, the
domain the instrument was developed for is specified. Next, the key indicators of each tool
are listed; this shows which aspects of a security culture the developers of the tool have
prioritized. Details about the theoretical foundation of the tool are included, followed by the
main objectives of the instrument.
In order to understand the practical application of the tool, the methodological strengths and
limitations of its reliability and validity are presented. The table specifies whether a multi-
method approach was applied and, when a questionnaire was used, the type of survey,
number of items, type of answers and target population. For tools that required a qualitative
approach, the target population of the interviews or observations is included. These
methodological characteristics are presented in Table 3.2.

Measuring security culture
60
Table 3.1. General characteristics of the measuring tools.
Analysing Information
Security Culture
(Schlienger & Teufel, 2003)
Self-assessment of nuclear
security culture in facilities
and activities
(International Atomic
Energy Agency, 2017)
A WINS international best
practice guide for nuclear
security culture
(World Institute for Nuclear
Security, 2011)
Information Security
Culture
(Martins & Eloff, 2002)
Understanding and
measuring information
security culture
(Alnatheer et al., 2012)
Organizational Information
Security Culture Assessment
(AlHogail & Mirza, 2015)
Domain Information security Physical security Physical security Information security Information security Information security
Key
indicators
- Artefacts (e.g. behaviour,
technology, security
handbooks)
- Official values (i.e. the
perception of the
company on security)
- True values (i.e. the
individual attitude
towards security)
- Beliefs and attitudes
- Principles for guiding
decisions and behaviour
- Leadership behaviour
- Management systems
(e.g. processes,
procedures, programs)
- Personnel behaviour
- Beliefs, principles and
values
- Characteristics (e.g.
leadership, accountability,
competency)
- Documented expectations
(e.g. security policy,
responsibilities) and
behaviours
- Organizational level:
policy, benchmarking, risk
analysis and budget
- Group level: management
and trust
- Individual level:
awareness and ethical
- Change
- Top management
involvement in information
security
- Information security policy
enforcements
- Information security
training
- Information security
awareness
- Information security
ownerships
- Strategy (S) (e.g. policies,
guidelines, best practices)
- Technology (T) (e.g. hardware,
software, services)
- Organization (O) (e.g. beliefs,
values, norms)
- People (P) (e.g. behaviour of
employees)
- Environment (E) (e.g. national
culture, ethical conduct, legal
systems)
Theoretical
foundation
Schein’s model of
organizational culture
(2004)
Schein’s model of
organizational culture
(2004) (questionnaire)
No details are given Information Security
Culture Framework from
Da Veiga and Eloff (2007)
Model developed by
Alnatheer et al. (2012)
Framework developed by
AlHogail (2015) and based on
STOPE development profile
(Bakry, 2003), Human Factor
Diamond Framework (AlHogail
and Mirza, 2015) and
Information security culture
change framework (AlHogail and
Mirza, 2014)
Main
objectives
Measurement and
improvement of security
culture
Measurement of security
culture
Measurement and
improvement of security
culture
Measurement and
improvement of security
culture
Measurement of security
culture
Measurement and improvement
of security culture

Measuring security culture
61
Table 3.2. Methodological characteristics of the measuring tools.
Analysing Information
Security Culture
(Schlienger & Teufel, 2003)
Self-assessment of nuclear
security culture in facilities
and activities
(International Atomic Energy
Agency, 2017)
A WINS international best
practice guide for nuclear
security culture
(World Institute for Nuclear
Security, 2011)
Information Security
Culture
(Martins & Eloff, 2002)
Understanding and
measuring information
security culture
(Alnatheer et al., 2012)
Organizational Information
Security Culture
Assessment
(AlHogail & Mirza, 2015)
Reliability and
validity
- Tool consists of a multi-
method approach
- No formal guidelines or
established framework was
used when conducting the
interviews, document
analysis and observations
(difficult to repeat the
exact same assessment in
other organizations or by
other researchers)
- Tool consists of a multi-
method approach
- No scientific results available
about the validation of the
instrument
- Tool can be used by different
nuclear companies. The WINS
practice guide contains
supporting guidelines for
organizations
- No use of multi-method
approach
- Not clear on what theoretical
or practical basis the tool has
been developed
- No scientific results available
about the validation of the
instrument
Good scores on
reliability and validity
(verified by authors)
- The development of the
tool is well substantiated
by using a mixed method
research design
- Process for deriving the
questionnaire items was
relatively subjective
- Tool is developed for
Saudi Arabia. It is not
known whether the tool
can be used in other
settings
- Tool shows good scores
on reliability and validity
(verified by authors)
- Tool is developed for a
developing country. It is
not sure if this tool can be
used in other settings
Measurement
approach
Questionnaire + interviews +
document analyses +
observations
Questionnaire + interviews +
document analyses +
observations
Questionnaire Questionnaire Questionnaire Questionnaire
Type of
questionnaire
Self-assessment Self-assessment Self-assessment Self-assessment Self-assessment Self-assessment
No. of items 42 25-35 52 45 19 79
Type of
answers
Three answer options (true-
false-I don’t know)
Seven-point and eleven-point
Likert scale (strongly disagree
– strongly agree)
Five-point Likert scale (strongly
disagree - strongly agree)
Five-point Likert scale
(strongly disagree –
strongly agree)
Five-point Likert scale
(strongly disagree –
strongly agree)
Two-point and five-point
Likert scale (strongly
disagree – strongly agree)
Target
population
- Questionnaire: Employees
from different job levels
- Interviews: Chief Security
Officer
- Observations: Employees
from different job levels
- Questionnaire: Employees
from different job levels
- Interviews: employees from
different job levels
- Observations: employees
from different job levels
Questionnaire: Employees from
different job levels
Questionnaire:
executive/senior
managers, department
managers/supervisors,
operational job staff
and technology staff
Questionnaire: Employees
of private, public, non-
profit and semi-public Saudi
Arabian organizations from
different job levels
Questionnaire: Employees
from different job levels of
Saudi Arabian
organizations

Measuring security culture
62
3.4. Results
3.4.1. General characteristics of the tools
Based on the systematic overview, it is clear that the tools only focus on two security domains.
Four of the six included instruments were specifically developed to measure information
security culture within organizations, while the other two measure physical security culture.
The information security domain has a predominant position within research on security
culture; as organizations rely ever more heavily on technology to run their businesses, so
interest in information security has rapidly increased (Kruger and Kearney, 2006).
A more detailed analysis of the measuring tools shows that the authors emphasize similar
aspects of the security culture within organizations. Based on the TEAM model of Vierendeels
et al. (2018), security culture consists of both observable and non-observable security
domains. A comparison of the tools’ key indicators shows that they all aim to measure the
non-observable security domain, which includes the security climate or shared security
perceptions and individuals’ views on security. For instance, Alnatheer et al. (2012) focus on
the security climate by measuring top management involvement in information security and
who is responsible for security. Schlienger and Teufel (2003) include the company’s
perceptions of security as a key indicator in order to assess shared security perceptions. To
measure individuals’ mindsets on security issues, IAEA (2017) focuses on employees’ beliefs
and attitudes, while WINS (2011) included employees’ beliefs, principles, and values as a key
indicator.
The security culture also consists of an observable domain, which includes organizational,
human, and technological security aspects (Vierendeels et al., 2018). The overview revealed
that all instruments aim to measure organizational security aspects. Martins and Eloff (2002)
include the organizational security policy and budget as key indicators, while AlHogail and
Mirza (2015) focus on the security policies, guidelines, and best practices with their key
indicator strategy. Subsequently, each tool focuses on human aspects or the security
behaviour of employees. For instance, IAEA (2017) measures personnel behaviour and
Schlienger and Teufel (2003) include the indicator artifacts which also includes the behaviour
of employees. In contrast to the organizational and human domains, only half of the tools
included key indicators to measure technological security measures. While Martins and Eloff
Measuring security culture
63
(2002), AlHogail and Mirza (2015), and Schlienger and Teufel (2003) explicitly mention that
they measure the technological security aspects of the organization, Alnatheer et al. (2012),
IAEA (2017) and WINS (2011) do not focus on any technological aspects. Although IAEA (2017)
indicates that the human and organization aspects are inextricably linked to the technological
measures, the tool does not assess the technological aspects. Finally, only AlHogail and Mirza
(2015) focus on the impact of external security aspects, such as national culture, laws, and
regulations on the security culture of the organization, while other tools only focus on internal
security aspects.
The majority of the instruments are based on a theoretical concept. For instance, both
Schlienger and Teufel (2003) and the IAEA (2017) created their tool based on the model of
organizational culture developed by Schein (2004). Martins and Eloff (2002) use the
framework of Da Veiga and Eloff (2007) as a foundation for their instrument. Only Alnatheer
et al. (2012) and WINS (2011) combine theoretical insights with experiences and expertise
from practitioners in the development of their tool.
Finally, when analysing the main objectives of the measuring instruments, it becomes clear
that only half focus explicitly on improving the security culture by formulating specific
recommendations. For instance, WINS (2011) and Martins and Eloff (2002) state that goal of
their measuring process is the formulation of well-founded recommendations. In contrast,
IAEA (2017) and Alnatheer et al. (2012) emphasize the measuring process without making
specific recommendations based on the results.
3.4.2. Methodological characteristics of the tools
Only Schlienger and Teufel (2003) and IAEA (2017) make use of a multi-method approach to
assess security culture, with the other tools only including a questionnaire. When analysing
the methodological strengths and limitations of the reliability and validity of the tools, the use
of a multi-method approach can be seen as a strength. Although questionnaires can be used
to measure the security climate of an organization, qualitative methods are vital to obtain a
clear picture of the whole security culture. For instance, our comparison of the tools’ key
indicators showed that they all emphasize employee behaviour. However, depending on the
methodological approach used, different forms of behaviour will be measured. When the
instrument only includes a quantitative approach, such as a survey, the focus is on self-

Measuring security culture
64
reported behaviour. When qualitative methods such as observations are used, the actual
behaviour of individuals can be observed and measured. While it can be very time-consuming
and difficult to observe behaviour in various situations, a combination of two methods would
provide a more global view of individuals’ security behaviour. For instance, Schlienger and
Teufel (2003) conduct unstructured interviews with the chief security officer of an
organization, and IAEA (2017) proposes a semi-structured approach that includes staff
members from the entire organization. Both use document analysis to obtain an overview of
the organization’s security policy and carry out audits to verify the answers provided by
respondents, and to get a deeper insight into their actual behaviour. Although IAEA (2017)
emphasizes the importance of formal guidelines when carrying out the interviews, document
analysis, and observations, Schlienger and Teufel (2003) did not use any formal guidelines
when conducting these qualitative methods. Unfortunately, this makes it very difficult to
repeat the exact same approach in other settings or by other researchers.
According to the articles’ authors, most of the tools show good results on reliability and
validity. Although the tools already contain numerous strengths, the developers themselves
indicate that some adjustments still have to be made in order to fully develop them. For
instance, Alnatheer et al. (2012) developed a tool for measuring the information security
culture in Saudi Arabian companies, and it is not clear whether the tool could be used in other
countries. The authors indicate that the business environment of Saudi Arabia is different from
that of Western countries. While Saudi Arabian information technology companies are still
developing, most international information security standards are written from the
perspective of more technologically advanced Western countries. The different technological
levels combined with the cultural differences between Western countries and Saudi Arabia
cause challenges when implementing the same measuring tool in both contexts.
When a questionnaire is included in these measuring tools, it is always as a self-assessment.
The number of items varies between 19 and 79. Alnatheer et al. (2012) have developed the
shortest questionnaire (19 items), while AlHogail and Mirza (2015) have expanded their survey
to 79 items. Five of the six questionnaires utilize a Likert scale. Only Schlienger and Teufel
(2003) use a categorical answering scale with the options ‘True,’ ‘False,’ or ‘I don’t know.’
Employees from different job levels are included in the research samples. For instance, WINS
(2011) gathers data from staff at all levels, including the board of directors.

Measuring security culture
65
3.5. Conclusion and discussion
This article identified and analysed tools that measure organizational security culture. Six tools
were eligible for inclusion in the systematic overview. It was found that the tools focus on two
security domains, namely information security and physical security. The tools were compared
based on their general characteristics and methodological approach. While they all included
similar key indicators, notable differences were found in their methodology.
As has already been mentioned, a common view on or widely accepted theoretical approach
to security is lacking. While some researchers and practitioners do get involved in the debate
about security culture, their attention is focused on certain security domains (e.g. information
security) and sectors (e.g. nuclear companies). Indisputably, in scientific research, information
security culture holds a dominant position. Despite the actual threats related to information
security, the vulnerability of organizations to other threats, such as terrorism, cannot be
underestimated. For companies to prevent and be prepared for threats related to security,
more research about physical security culture is needed.
Additionally, there is no widely accepted and consolidated approach or unique toolset
available that can be used in different sectors or by different organizations (Schlienger &
Teufel, 2003). Therefore, a standardized measuring tool needs to be developed. Collaboration
between researchers and practitioners is required in order to create a strong, practical-based
instrument that can be validated in scientific research. By adjusting the tool to the
characteristics of the company in the preparation phase of the measuring process, a
standardized instrument could be used by different organizations and sectors. As the overview
showed that tools that only measure information security or physical security contain similar
key indicators, an instrument that combines these two security domains could readily be
developed. Most importantly, a tool must be adaptable to an organization’s specific
characteristics. For instance, different organizations are more or less exposed to security
threats, so this should be taken into account in the developing process. This means that a one-
size-fits-all approach must be avoided. Additionally, there are some benefits for benchmarking
when different organizations use the same instrument and the results can be compared. The
insights obtained by a company comparing its results to those of a similar one can enable it to
improve its security culture.

Measuring security culture
66
In creating a standardized instrument, much can be learned from adapting the knowledge
about safety culture to the measurement of security culture. In contrast to the limited number
of tools that are currently available to measure security culture, several tools already exist to
measure safety culture. While safety and security were long seen as independent of each
other, more recent research shows that there are a lot of similarities between these domains
(Kria et al., 2015; van Nunen et al., 2018b). Both domains focus on the prevention of
undesirable events, such as injuries to people, and material or environmental damage. The
main difference is in the origin of these events – damage is unintentional in the field of safety
and intentional in the case of a security incident. Additionally, there is a difference between
risks related to the domain of safety and threats in the field of security. As safety risks are
mostly rooted inside the organization and therefore are well known, security threats are
predominantly rooted outside of the organization and are more difficult to uncover. The
greatest similarity is that both safety and security are part of the overall culture of the
organization. This implies that a focus on the technological, organizational, and human aspects
in both fields is needed to ensure an integrated and strong organizational culture (van Nunen
et al., 2018b). Therefore, it can be useful to consider to what extent the existing tools for
measuring safety culture can be applied to the security context. Adjustments or additions
could be made to pre-existing tools by altering the aspects included in the tool to the different
aspects of a security culture. This process would result in the creation of a measuring tool for
security culture based on an already existing framework developed for measuring safety
culture.
3.6. Recommendations
Based on the systematic review, some recommendations can be made about creating an
effective tool for assessing the security culture within an organization.
Firstly, a multi-method approach should be used, as it provides a more detailed picture of the
security culture of an organization. All tools in the systematic review used a quantitative
approach, while only two add qualitative methods. Due to their statistical robustness,
questionnaires can be included without major costs (Da Veiga, 2008). Additionally, completing
the survey could create more security awareness among employees. On the other hand, as
there is no certainty as to how respondents interpret the specific questions, the reliability of

Measuring security culture
67
this method remains uncertain. In contrast, qualitative methods have the benefit of revealing
more detailed insights in the results (Kaplan & Duchon, 1988), but also have their limits,
especially in terms of generalizability and time (Alvesson & Berg, 1992). Considering both the
weaknesses and strengths of qualitative and quantitative methods, it is believed that a multi-
method approach is needed to measure security culture (Alvesson & Berg, 1992). As the
results of one method can be verified with those of other approaches, there are greater
opportunities for data analysis (Schlienger & Teufel, 2005). Additionally, the researcher is able
to explore different points of view when interpreting the results (Fleeger, 1993). Considering
the very different domains of a security culture, it is recommended that both quantitative and
qualitative methods be used. For instance, while data about the observable security aspects
can be gathered through qualitative methods such as interviews, focus groups, document
analyses, or observations, a quantitative approach is needed to explore employees’
perceptions of security issues (van Nunen et al., 2018b). The multi-method approach makes
the measuring process more time-intensive but ensures a more detailed and realistic result
that can be translated into substantiated recommendations for the organization. As culture
has a very comprehensive structure, it is impossible to measure it well in a short period of
time.
Secondly, it is recommended that the entire organization should be involved in the measuring
process. Numerous authors argue that the involvement of both staff and top management is
necessary to measure and improve a security culture (Chia et al., 2003; Da Veiga & Eloff, 2007;
Kraemer et al. 2009; Schlienger & Teufel, 2003). As cultural change in an organization should
always start with the support of top management, a strong security culture can only be
created and maintained with the consistent involvement and support of those at the top of
the organization (Alnatheer et al., 2012; O’Donovan, 2006). Ownership of and commitment to
security by both management and employees is necessary for them to understand their role
in the security policy and to be convinced that security is important (Connolly, 2000).
Thirdly, external security threats should be included in the measuring process, in addition to
internal security aspects. Organizations are always more or less exposed to certain external
security threats, such as theft or fraud, depending on the company’s characteristics. It is
important that these ‘standard’ threats are considered when developing a measuring
instrument. In addition, the external aspects or the general characteristics of the country or

Measuring security culture
68
region where the company is based also have an influence on the security culture of an
organization. For instance, national culture, socio-economic or technological development,
and legislation could all have a substantial impact (van Nunen et al., 2018b). Therefore, as
organizations are always exposed to these security threats and external factors, it is important
to take them into account when measuring security culture.
Finally, the formulation and implementation of well-founded recommendations and
systematic follow-ups are required to achieve a strong security culture. This review found that
only two tools explicitly mention possible improvements to the security culture of the
organization. Other tools were still being developed and therefore only their methodology
could be reviewed. However, all authors focus on identifying weaknesses and strengths in the
field of security, so it is highly recommended that those results are used when formulating
recommendations. Assessing the security culture helps an organization to discover its
strengths and weaknesses in order to make the right strategic choices (Ross, 2011; Schein,
2009). Also, the results of regular assessments can show whether recommendations from
previous measurements were actually implemented, and the extent to which these measures
effectively improved the security culture of an organization (Martins & Eloff, 2002). If newly
implemented measures are found to be inefficient, there may be some shortcomings with the
measuring tool. Therefore, it is important that tools contain easily applicable criteria to
translate measurement results into well-founded recommendations for an organization. Only
in this way can security culture be improved and maintained.

Measuring security culture
69
3.7. References
AlHogail, A. (2015). Design and validation of information security culture framework.
Computers in Human Behavior, 49, 567-575.
AlHogail, A. and Mirza, A. (2014). A framework of information security culture change. Journal
of Theoretical and Applied Information Technology, 64(2), 540-549.
AlHogail, A. and Mirza, A. (2015). Organizational information security culture assessment. In:
The 2015 World Congress in Computer Science, Computer Engineering and Applied
Computing (SAM ’15) Proceedings, pp. 287-292.
Alnatheer, M., Chan, T., & Nelson, K. (2012). Understanding And Measuring Information
Security Culture. In S. L. Pan & T. H. Cao, Proceedings of the 16th Pacific Asia Conference
on Information Systems (PACIS). PACIS 2012, University of Science (Vietnam).
Alvesson, M., & Berg, P.O. (1992). Corporate Culture and Organizational Symbolism. Walter
de Gruyter.
Andress, M., & Fonseca, B. (2000). Manage people to protect data. InfoWorld, 22(46), 48.
Bakry, S. (2003). Development of security policies for private networks. International Journal
of Network Management, 13(3), 203–210.
Baybutt, P., & Ready, V. (2003). Strategies for protecting process plants against terrorism,
sabotage and other criminal acts. Homeland Defense Journal, 2, 1-4.
Beynon, D. (2001). Talking heads. Computerworld, 24(33), 19-21.
Breidenbach, S. (2000). How security are you? Information Week, 800, 71-78.
Chia, P., Maynard, S., & Ruighaver, A.B. (Eds.) (2003). Understanding organisational security
culture. In: Information Systems: The challenges of theory and practice. Information
Institute.
Connolly, P. (2000). Security starts from within. InfoWorld, 22(28), 39-40.
Da Veiga, A. (2008). Cultivating and assessing information security culture [unpublished PhD
thesis], University of Pretoria.

Measuring security culture
70
Da Veiga, A., & Eloff, J.H.P. (2007). Information security culture – validation of an assessment
instrument. Information Systems Management, 24, 361-372.
Da Veiga, A., & Eloff, J.H.P. (2010). A framework and assessment instrument for information
security culture. Computers & Security, 29, 196-207.
Da Veiga, A., & Martins, N. (2015). Improving information security culture through monitoring
and implementation actions illustrated through a case study. Computers & Security,
49, 162-176.
Fleeger, M.E. (1993). Assessing organizational culture: A planning strategy. Nursing
Management, 24 (2), 39–42.
International Atomic Energy Agency (IAEA) (2017). Self-assessment of nuclear security culture
in facilities and activities. IAEA Nuclear Security Series, 28, 1-124.
Kaplan, B., & Duchon, D. (1988). Combining qualitative and quantitative methods in
information systems research: A case study. MIS Quarterly, 12(4), 571-587.
Kraemer, S., Carayon, P., and Clem, J. (2009). Human and organizational factors in computer
and information security: Pathways to vulnerabilities, Computers & Security, 28: 509-
520.
Kria, S., Pietre-Cambacedes, L., Bouissou, M., & Halgan, Y.A. (2015). A survey of approaches
combining safety and security for industrial control systems. Reliability Engineering &
System Safety, 139, 156-178.
Kruger, H.A., & Kearney, W.D. (2006). A prototype for assessing information security
awareness, Computers & Security, 25(4), 289-296.
Lundy, O. , & Cowling, A. (1996). Strategic Human Resource Management. Routledge.
Maidabino, A.A., & Zainab, A.N. (2011). Collection security management at university libraries:
Assessment of its implementation status. Malaysian Journal of Library & Information
Science, 16(1), 15-33.
Malcolmson, J. (2009). What is security culture? Does it differ in content from general
organisational culture? 43rd Annual 2009 international Carnahan conference on
security technology, Zurich, Switzerland.

Measuring security culture
71
Martins, A., & Eloff, J. (2002). Information security culture. In: Ghonaimy, M.A., El-Hadidi, M.T.,
and Aslan, H.K. (eds.), Security in the Information Society, IFIP Advances in Information
and Communication Technology, 86. Springer.
Nosworthy, J. (2000). Implementing information security in the 21st century – do you have
the balancing factors? Computers & Security, 19(4): 337-347.
OʼDonovan, G. (2006). The Corporate Culture Handbook: How to plan, implement and measure
a successful culture change. Lifey Press.
Reniers, G., & Dullaert, W. (2007). Gaining and Sustaining Site-Integrated Safety and Security
in Chemical Clusters. Nautilus Academic Books.
Ross, S.J. (2011). Creating a Culture of Security. Information Systems Audit & Control
Association.
Schein, E.H. (2004). Organizational Culture and Leadership. Jossey-Bass.
Schein, E.H. (2009). The Corporate Culture Survival Guide. Jossey-Bass.
Schlienger, T., & Teufel, S. (2003). Analyzing information security culture: increased trust by
an appropriate information security culture. 14th International Workshop on Database
and Expert Systems Applications, 2003, Proceedings. Prague, Czech Republic.
Schlienger, T., & Teufel, S. (2005). Tool supported management of information security
culture: Application in a private bank. In: Sasaki, R., Qing, S., Okamoto, E., and Yoshiura,
H. (eds.), IFIP International Information Security Conference Proceedings (pp. 65-77).
Springer.
Schwarzwalder, R. (1999). Intranet security. Database and Network Journal, 22(2), 58-62.
van Niekerk., J., & von Solms, R. (2005). A holistic framework for the fostering of an information
security sub-culture in organizations [Paper presentation]. 4th Annual ISSA
Conference, South Africa.
van Nunen, K., Reniers, G., & Ponnet, K. (2018a). Measuring and improving safety culture in
organizations: An exploration of tools developed and used in Belgium. Journal of Risk
Research, 21(5), 622-644.

Measuring security culture
72
van Nunen, K., Sas, M., Reniers, G., Ponnet, K., & Hardyns, W. (2018b). An integrative
conceptual framework for physical security culture in organizations. Journal of
Integrated Security Science, 2(1), 25-32.
Vierendeels, G., Reniers, G., van Nunen, K., & Ponnet, K. (2018). An integrative conceptual
framework for safety culture: The Egg Aggregated Model (TEAM) of safety culture.
Safety Science, 103, 323-339.
Von Solms, B. (2000). Information security – the third wave? Computers & Security, 19(7), 615-
620.
Vroom, C., & von Solms, R. (2004). Towards information security behavioural compliance.
Computers & Security, 23(3), 191-198.
World Institute for Nuclear Security (WINS) (2011). A WINS international best practice guide
for your organization: Nuclear security culture. Vienna: WINS, pp. 1-22.
Zakaria, O. (2004). Understanding challenges in information security culture: A
methodological approach issue. In: Proceedings of the 2nd Australian Information
Security Management Conference, Perth, Australia.


Measuring CPTED and disorder
74
CHAPTER 4
Measuring CPTED and disorder through different systematic social
observation methods: In-situ observations, original photographs and
Google Street View images
This study focuses on the measurement of Crime Prevention Through Environmental Design
(CPTED) and disorder by means of Systematic Social Observations (SSO). To improve ecometric
measures of the physical properties of neighbourhoods, a three different SSO are carried out:
in-situ observations, original photographs and Google Street View (GSV) images. Based on an
evaluation of the methodological quality of the observation methods, the results of our study
suggest that virtual SSO approaches have considerable promise for the reliable and valid
assessment of neighbourhood-level physical properties. Challenges are discussed and avenues
for future research provided to keep evolving towards a more valid and reliable measurement
approach for the physical environment.
This chapter is based on:
Sas, M., Snaphaan, T., Pauwels, L., Ponnet, K., & Hardyns, W. (in review). Measuring CPTED
and disorder through different systematic social observation methods: in-situ observations,
original photographs and Google Street View images.

Measuring CPTED and disorder
75
4.1. Introduction
This study addresses the challenge of measuring the physical properties of neighbourhoods.
Neighbourhood disorder is one of the processes that is studied extensively, because it affects
several aspects of daily life, such as mental and physical health (Hill and Angel, 2015; Feng et
al., 2010), fear of crime (Kelling & Coles, 1996; Perkings & Taylor, 1996) and violent
victimization (Morenoff, 2001; Sampson & Raudenbush, 2001). Neighbourhood theories, such
as The Broken Windows theory, which focuses on the relationship between disorder and
crime, has inspired a variety of policy programs (Skogan, 1990; Wilson & Kelling, 1982). The
Crime Prevention Through Environmental Design (CPTED) approach assumes that also other
characteristics of the urban environment, such as the extent of surveillance (e.g., security
guards, shop keepers), access control (e.g., detection mechanisms), territoriality (e.g., fences,
property signs), maintenance (e.g., building conditions) and activity support (e.g., parks,
shops, bars) are related to crime (Crowe, 2000). Moreover, the CPTED approach proposes that
crime can be reduced by implementing a proper architecture design and by modifying physical
features of the environment (Jeffery, 1971; Mihinjac & Saville, 2019; Saville & Cleveland,
2008).
In order to measure neighbourhood characteristics, scholars have traditionally used
administrative data (Raudenbush & Sampson, 1999) or (nationally) representative victim
surveys or self-reported delinquency surveys (Gracia et al., 2012; Ross & Mirowsky, 2009).
While administrative census data proved to be valuable for describing the socio-demographic
composition of (small) geographic entities like municipalities and neighbourhoods, surveys are
useful to measure more subjective data that is otherwise difficult to obtain, such as resident’s
fear of crime, feelings of security or perceived disorder (Marco et al., 2017). While both
methods have their strengths, they are less useful for assessing visible neighbourhood
phenomena such as the presence of social disorder like public drinking or loitering and
physical disorder such as vacant buildings or dilapidation. As a consequence, systematic social
observation (SSO) by trained observers has become fundamental in neighbourhood-level
studies (e.g., Mastrofski, 1998; Raudenbush & Sampson, 1999), particularly for measuring
disorder (Hinkle & Yang, 2014; Hoeben et al., 2018; Johnson et al., 2016). By carrying out SSO,
well-known validity threats of surveys, such as social desirability, unit non-response and

Measuring CPTED and disorder
76
sampling error are eliminated (see for an overview of validity problems in survey research:
Rossi et al., 2013; Wolf et al., 2016).
While in-situ SSO could provide rich details of the presence of disorder and CPTED measures,
some concerns arise when conducting observations within a specific neighbourhood (Gracia
& Herrero, 2007). Travel costs and human resources of researchers who need to travel to the
observation area could be very high (Rundle et al., 2011) and carrying out in-situ observations
in less secure neighbourhoods could create danger and fear of crime among observers, thus
creating additional bias (Griew et al., 2013). These important theoretical, epistemological and
methodological concerns have let to more innovative techniques to conduct research in
neighbourhood settings, such as the utilization of virtual instead of in-situ SSO, often carried
out by using Google Street View (GSV) images (Ben-Joseph et al., 2012; Clarke et al., 2010;
Rundle et al., 2011) or original photographs (e.g., Cannuscio et al., 2009; Yang & Pao, 2015).
In order to move beyond the traditional assessment of psychometric properties of ecological
measures, Raudenbush and Sampson (1999) propose ecometric assessments, which allow to
measure item inconsistency within face blocks, or micro places in our case, and micro places
variation within neighbourhoods (Raudenbush & Sampson, 1999). To improve ecometric
(ecologically reliable) measures of the physical properties of neighbourhoods and other small-
scale areas, it is the aim of the present study to evaluate the methodological quality of in-situ
observations, original photographs and GSV images. More specifically, observations by trained
observers were carried out to assess the presence of CPTED and disorder in four
neighbourhoods. It is an important disadvantage that in-situ observations, original
photographs and GSV images are always a snapshot in time. Not only for measuring social
disorder, but also for linking in-situ observations to virtual observations, this temporal
invariance is an obvious challenge. Temporal invariance should therefore be addressed as a
potential measurement error when evaluating SSO (Raudenbush & Sampson, 1999).
Additionally, a multi method approach is accompanied by potential mode-effects, or
measurement and selection effects. Measurement effects occur when the results of the same
items differ across modes (De Leeuw, 2005; Dillman et al., 2009). Selection errors occur when
the observation points of different modes differ on the variables of interest
(Vannieuwenhuyze et al., 2012). This study departs thus from a total error perspective
(Lavrakas, 2013).

Measuring CPTED and disorder
77
Given the potential strengths and limitations associated with in-situ and virtual SSO, different
measurement approaches are carried out to evaluate their inter-rater reliability, inter-modus
reliability and convergent validity. With ‘inter-rater reliability’, we refer to the extent to which
the same ratings are obtained by different observers. Inter-modus reliability refers to the
extent to which the same results are obtained by different methods. Wit convergent validity,
we refer to the extent to which theoretically linked measures ought to correlate.
In order to guide our analyses and explicate our expected results, we put forward the following
five predefined hypotheses:
H1: Due to the extensive training of observers, we hypothesize that we will not find
significant differences in inter-rater reliability over the different methods.
H2: Due to temporal incongruences, and in particular due to the prevailing measures
against COVID-193 at the time of the in-situ observations and the photographs taken
at that moment, we hypothesize that we will find significant differences between
observations from GSV imagery compared to the other two methods.
H3: Due to temporal congruences, we hypothesize that we will not find significant
differences between observations from photographs and in-situ observations.
H4: We hypothesize that there will be more agreement across the different modes on
the CPTED measures than on the measures regarding physical and social disorder,
expecting that the CPTED measures are more stable over time.
H5: We hypothesize that there will be more agreement across the different modes on
the measures of physical disorder than on the measures of social disorder, expecting
that physical disorder is more stable over time.
3 At the time of the observations, the following measures against COVID-19, that are relevant for this study, applied: (1) at the University of Antwerp, only 20% of students were allowed to be physically present in the auditoriums, all other students had to follow classes online from home, (2) telework was highly recommended for staff members, several days a week, (3) all bars had to be closed at 11 p.m., (4) non-organized gatherings outside were limited to a maximum of four people, except for family members who lived under the same roof, (5) there was a limitation of a maximum of three close contacts per month for everyone, (6) extra efforts in the field of enforcement had to ensure that the above measures were applied everywhere.

Measuring CPTED and disorder
78
4.2. Data and methods
4.2.1. Data collection
4.2.1.1. Research area
In the current study, SSO was applied within the neighbourhood of the campuses of the
University of Antwerp. The city of Antwerp consists of approximately 526,000 inhabitants and
is, based on its population, the largest city of Belgium. The university has four main campuses
which are spread over the territory of the city and located in four different neighbourhoods.
The university neighbourhood serves as an interesting research setting as it can be considered
as an attractive environment for motivated offenders to engage in crime. The combination of
crime attractors, such as the presence of intoxicated students or insecure housing largely
vacant during the day, and crime generators, such as the presence of bars and shopping
venues, creates conditions conducive to opportunities for crime (Cundiff, 2020). In total, 36
observation points within the four university neighbourhoods were selected to be included in
the study, indicated by x,y-coordinates. The selection was based on three criteria, taking into
account both physical and virtual characteristics of the observation point:
• only observation points with a direct access to the university campus were
selected to ensure that all observation points were located in the university
neighbourhood;
• only observations points that are at least 100 meters apart from each other
were selected to avoid overlapping observations;
• only observation points of which the GSV images were recently captured (after
May 2017) were selected to address the limitation of temporal invariance.
Observers who carried out in-situ observations (see below for more information) were
instructed to observe in 360° from the exact x,y-coordinates they received. From the
observation point, they had to capture four photographs which offered a clear overview of
the observation point (see Figure 4.1). The observers were free to choose a date and time to
carry out the observations, within the period of the 1st of October and the 23rd of October
2020. In the end, in-situ observations were carried out between 10 a.m. and 20.15 p.m. from
October 3 to October 20.

Measuring CPTED and disorder
79
Figure 4.1. Example of an original photograph (left) and a GSV image (right) of the same observation
point.
4.2.1.2. Observers
Trained observers4 (N=203) were divided in groups of four to six persons. Before they carried
out the observations, all observers followed an extensive training in which they were
instructed about the checklist and the practical performance of the observations. Additionally,
they received theoretical information about crime prevention, disorder and CPTED.
Each group received an observation point with address and specific x,y-coordinates. While
two persons of every group travelled to the observation point to carry out in-situ observations,
the other group members observed the same observation point based on photographs they
received from their group members on location. Additionally, every group member was
instructed to observe the observation point by means of GSV images. In the end, 174 female,
28 male and one non-binary observer carried out two observations which led to 406 individual
observations in total. 71 observations were performed in-situ, 132 observations were
executed based on original photographs and 203 observations were virtually carried out by
means of GSV images.
4 All observers were trained Master students in Criminological Sciences at Ghent University. They received course credit for their observation efforts.
Measuring CPTED and disorder
80
4.2.2. Materials and measures
All observations were carried out by using a standardized checklist. The observation checklist
consisted of 40 items to assess the presence of CPTED measures and social and physical
disorder (see Appendix Table 4.2). To examine CPTED, the five key principles (i.e., surveillance,
access control, territoriality, maintenance and activity support) were included in the checklist.
Surveillance was measured by using seven items (e.g., presence of formal surveillance (police
patrol, security guards)). For access control, three items were included (e.g., there are visible
campus entrances and exits). Also territoriality was measured by three items (e.g., there are
physical barriers (e.g., fences, shrubs) that separate campus from public space). All
aforementioned key principles were scored on a scale from 0 (=none (=0)) to 3 (=many (>4)).
In order to measure maintenance, nine items were used (e.g., in general, the observation
point appears to be well maintained in terms of infrastructure; the condition of the buildings
on the observation point is…). Items were scored on a scale from 1 (=totally not agree) tot 4
(=totally agree) or on a scale from 1 (=very bad) to 4 (=very good). Finally, activity support was
assessed by six items (e.g., there is a cultural activity going on (e.g., performance, festival) at
the observation point), which were scored on a scale from 0 (=none (=0)) to 3 (=many (>4)).
In order to measure the presence of physical and social disorder, respectively eight and four
items were included in the checklist. For physical disorder, a distinction was made between
the cleanliness of the observation point (e.g., there are waste bins on the observation point)
and the presence of broken infrastructure (e.g., there are broken windows/doors at the
observation point). Answers were scored based on a scale ranging from 0 (= none (=0)) to 3
(=many (>4)). For social disorder, the presence of people who disturb public order (e.g., there
are people who are drunk on the observation point) was examined, based on a scale ranging
from 0 (=none (=0)) to 3 (=many (>4)).
4.2.3. Analytical strategy
For all analyses SPSS Statistics (version 26) was used. To assess inter-rater reliability, the Intra
Class Correlation (ICC) coefficient is used. The ICC is represented in equation 1, where σ2
represents the variance and B and W respectively stand for between and within groups (Heck
et al., 2010).

Measuring CPTED and disorder
81
𝜌 = 𝜎𝐵2/(𝜎𝐵
2 + 𝜎𝑊2 ) (1)
In assessing both inter-modus reliability and convergent validity, correlational analyses are
used. To examine inter-modus reliability the correlation per modus and per observation point
is assessed for all items together. In these analyses the dataset is transposed to the extent
that the concepts related to CPTED and disorder are represented as cases. To examine
convergent validity the mean per observation point is compared over the different modes and
for the different concepts related to CPTED and disorder.
4.3. Results
4.3.1. Inter-rater reliability
ICC coefficients (one-way random, single measures) were computed for the three observation
methods. Figure 4.2 shows that the variation in ICCs per observation point was higher, and
highly similar for the observations by means of photographs (Mphoto) and GSV imagery (MGSV),
compared with the in-situ observations (Min-situ). The average ICCs are 0.974 (SD=0.034) for
Min-situ, 0.829 (SD=0.117) for Mphoto and 0.844 (SD=0.078) for MGSV. These averages indicate
strong levels of agreement between the raters. The highest ICCs were found for Min-situ, which
are also characterized by small variations. The lowest ICCs, but still high, were obtained for
Mphoto and MGSV and show larger variations.
These results suggest that the first hypothesis can be confirmed. Although the ICCs differ by
observation method, in particular regarding Min-situ that yield higher inter-rater reliability, the
average ICC of each method is high. Considering these ICCs, very similar results were obtained
by different observers carrying out the same observation method.
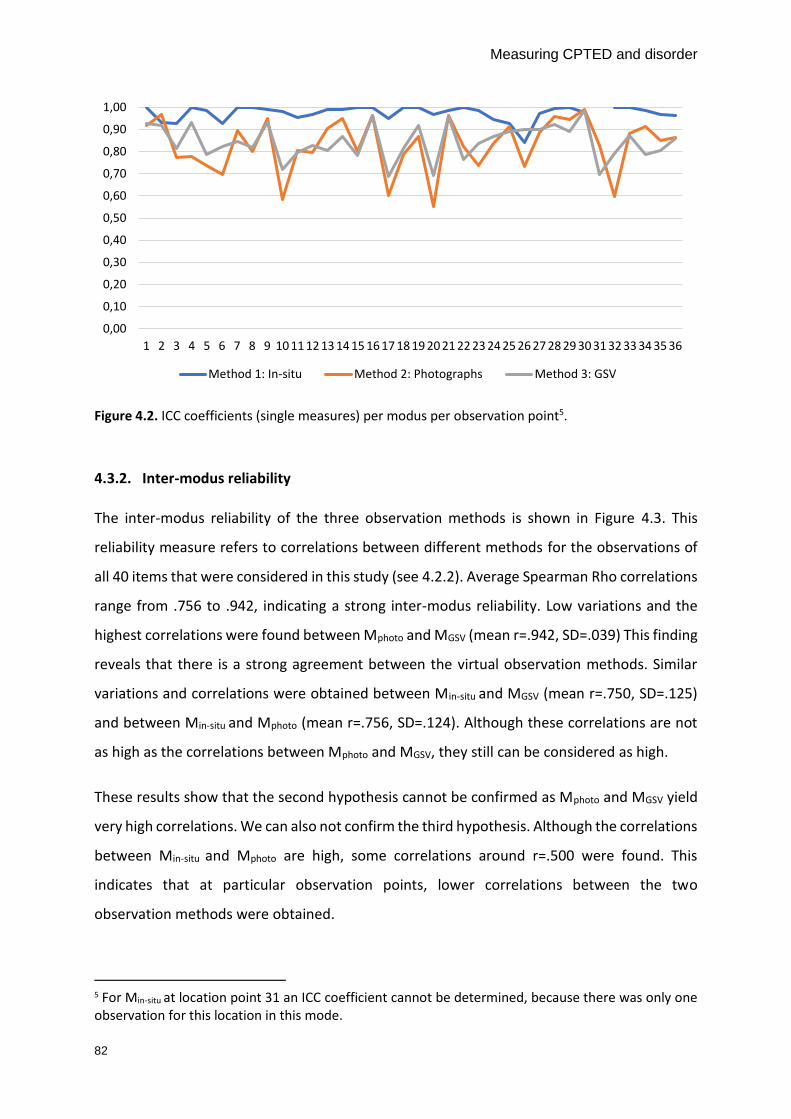
Measuring CPTED and disorder
82
Figure 4.2. ICC coefficients (single measures) per modus per observation point5.
4.3.2. Inter-modus reliability
The inter-modus reliability of the three observation methods is shown in Figure 4.3. This
reliability measure refers to correlations between different methods for the observations of
all 40 items that were considered in this study (see 4.2.2). Average Spearman Rho correlations
range from .756 to .942, indicating a strong inter-modus reliability. Low variations and the
highest correlations were found between Mphoto and MGSV (mean r=.942, SD=.039) This finding
reveals that there is a strong agreement between the virtual observation methods. Similar
variations and correlations were obtained between Min-situ and MGSV (mean r=.750, SD=.125)
and between Min-situ and Mphoto (mean r=.756, SD=.124). Although these correlations are not
as high as the correlations between Mphoto and MGSV, they still can be considered as high.
These results show that the second hypothesis cannot be confirmed as Mphoto and MGSV yield
very high correlations. We can also not confirm the third hypothesis. Although the correlations
between Min-situ and Mphoto are high, some correlations around r=.500 were found. This
indicates that at particular observation points, lower correlations between the two
observation methods were obtained.
5 For Min-situ at location point 31 an ICC coefficient cannot be determined, because there was only one observation for this location in this mode.
0,00
0,10
0,20
0,30
0,40
0,50
0,60
0,70
0,80
0,90
1,00
1 2 3 4 5 6 7 8 9 10 11 12 13 14 15 16 17 18 19 20 21 22 23 24 25 26 27 28 29 30 31 32 33 34 35 36
Method 1: In-situ Method 2: Photographs Method 3: GSV

Measuring CPTED and disorder
83
Figure 4.3. Correlation of observations between different methods per observation point.
4.3.3. Convergent validity
The convergent validity was first investigated by comparing the average scores per observed
measure over the three observation methods (see Figure 4.4). These results indicate that the
average scores for Min-situ are the highest. Except for the constructs maintenance and social
disorder, higher average scores were found compared to Mphoto or MGSV. It should, however,
be noticed that social disorder items were included in the observation checklist, but they were
not observed during the in-situ observations. Subsequently, although MGSV yield higher scores
for all constructs on average, the results show that the mean scores on the constructs
observed via MGSV and Mphoto are comparable.
0,00
0,10
0,20
0,30
0,40
0,50
0,60
0,70
0,80
0,90
1,00
1 2 3 4 5 6 7 8 9 10 11 12 13 14 15 16 17 18 19 20 21 22 23 24 25 26 27 28 29 30 31 32 33 34 35 36
In situ - Photographs In-situ - GSV Photographs - GSV

Measuring CPTED and disorder
84
Figure 4.4. Mean scores for constructs related to CPTED and disorder per method.
Figure 4.5 reveals the average correlations between the different observation methods per
group of items (i.e., constructs). The results show the highest correlations between Mphoto and
MGSV (mean r=0.708, SD=0.194). Lower correlations were found between Min-situ and Mphoto
(mean r=0.460, SD=0.237) and Min-situ and MGSV (mean r=.538, SD=0.261). These findings
indicate that average correlations between the two virtual methods, Mphoto and MGSV, are
higher compared to correlations between Min-situ and the two virtual observations, even while
this comparison is not subject to temporal incongruences.
Figure 4.5. Correlation of observations between different methods per construct.
0,00
0,50
1,00
1,50
2,00
2,50
3,00
3,50
4,00
Surveillance Accesscontrol
Territoriality Maintenance Activitysupport
Physicaldisorder
Socialdisorder
Method 1: In-situ Method 2: Photographs Method 3: GSV
-0,20
0,00
0,20
0,40
0,60
0,80
1,00
Surveillance Accesscontrol
Territoriality Maintenance Activitysupport
Physicaldisorder
Socialdisorder
Average correlation M1-M2 Average correlation M1-M3 Average correlation M2-M3

Measuring CPTED and disorder
85
To evaluate the agreement across the different modes, we computed the standard deviations
(SD) of the average correlations for the three methods per construct (see Table 4.1). The
results show that the SD range from .107 to .533. The highest agreement was found for the
construct territoriality, while the lowest agreement was obtained for social disorder.
Importantly, regarding social disorder it should be remarked that three of four items were not
included, because the scores of Min-situ are nihil.
Table 4.1. Standard deviations of average correlation for the three methods per construct.
Our findings are in line with hypothesis 4, because stronger agreement was found across the
different modes regarding the CPTED measures compared to physical and social disorder. But,
caution is warranted because only one of four items were included for social disorder. Our
findings also align with hypothesis 5 as there is more agreement across the different modes
on the measures of physical disorder compared to the measures of social disorder. Again, it
should however be mentioned that we were not able to compare the observations across
modes, as there was no social disorder observed during the in-situ observations.
4.4. Discussion and conclusion
It was the aim of this article to evaluate the methodological quality of three different
observation methods to improve the ecometric measures of physical properties of an
environment. To assess the presence of CPTED and disorder at street segment level, in-situ
observations, observations via original photographs and observations by means of GSV images
were carried out. Considering the potential strengths and weaknesses of physical and virtual
SSO, we evaluated their inter-rater reliability, inter-modus reliability and convergent validity.
Item Standard deviation
CPTED
Surveillance .152
Access control .169
Territoriality .107
Maintenance .119
Activity support .130
Disorder
Physical disorder .218
Social disorder .533

Measuring CPTED and disorder
86
In general, our findings support the use of observations by original photographs and by means
of GSV images as reliable and cost-effective tools for gathering information about the
presence of physical cues in the neighbourhood.
High levels of inter-rater agreement are found, indicating that similar results were obtained
by different observers for each of the three observation methods. An evaluation of the inter-
modus reliability shows that the agreement between in-situ observations and photographs,
and in-situ observations and GSV imagery is strong. A higher correlation is obtained between
the virtual observation methods, indicating that there is a stronger agreement between the
observations based on secondary material. Overall, the items measured by means of in-situ
observations are characterized by the highest mean scores. Additionally, more agreement is
found between CPTED items compared to disorder, while physical disorder items show a
stronger agreement in comparison to social disorder. Based on these findings, despite high
correlations and agreement, we can conclude that by means of in-situ observations, that is
considered the best measurement of the actual scores, on average more disorder and CPTED
measures are observed, and the virtual methods seem to miss an equal amount of aspects (as
well as the same aspects) of reality due to the specific characteristics of these methods (e.g.,
objects obstructing the view, limited view due to the specific position of observation).
Although our study provides valuable insights, the results must be interpreted in light of a
number of limitations and challenges which may be useful to take into account in future
research. The first challenges refer to the way the study design affects the inter-rated
reliability. Although the inter-rater reliability for all three methods proved to be high, a
variation in the number of observers may have contributed to these results. 71 observers
carried out in-situ observations, while respectively 132 and 203 observers performed
observations by means of photographs and GSV images. The high ICCs for in-situ observations
may have been influenced by the lower number of unique observations that were included in
the analysis. Ensuring an equal number of observers performing each observation method, is
recommended for future research. Subsequently, the inter-rater reliability is a parameter that
is difficult to control. In our study, it is possible that the coherence between the raters was
artificially increased due to the varying number of observers per observation point. A potential
limitation arises because the in-situ observations were almost all times carried out per two
observers. This implies that, even though they were instructed to perform the observation

Measuring CPTED and disorder
87
independently, the observers were able to discuss the measures they observed. For future
studies, ensuring that observers are not influenced by other raters is recommended.
A second challenge refers to the evaluation of the inter-modus reliability. Although strong
correlations were found, these results may be influenced by the task setting of the observers.
Every student was asked to perform two different observations and they all performed the
observations by means of GSV imagery. This implies that every rater observed one observation
point twice. The first observations they carried out, could have biased the observations that
were performed second. Ensuring that observers are not biased with previous observations
of the same observation point is recommended for future research. Additionally, future
research could assess these limitations quantitatively by performing cross-classified multilevel
models, because, unfortunately, the number of observations in this study was too low to
conduct this analysis.
A third challenge is that social disorder was not observed during the in-situ observations. The
prevailing measures against COVID-19 at the time of the observations could have limited the
presence of social incivilities at the observation points. These external factors, that we could
not control, may have influenced our results. Additionally, social disorder can be considered
as a snapshot in time, especially compared to the other concepts, which implies that this is
more difficult to determine via observations at one moment in time.
A fourth challenge concerns the convergent validity and arose because of the temporal
incongruence of combining physical and virtual observations. This challenge emerges in
various studies (Clarke et al., 2010; Rundle et al., 2011; Taylor et al., 2011). Both physical and
social disorder are considered temporally variable items, which may lower the correlation
among the measured items over the different methods. The CPTED measures may be seen as
items that are more stable over time. Remarkably, our study showed high correlations
between photographs and GSV images indicating that there is a stronger effect of the modus,
than an actual shift in levels of CPTED and disorder. In other words, the concepts studied
seemed to be relatively stable over time. It is therefore recommended for future research to
further examine this spatial stability. Additionally, consistent with previous studies,
convergent validity tended to be lower for disorder compared to CPTED measures. Clarke et
al. (2010) explain this finding by stating that characteristics that require a qualitative

Measuring CPTED and disorder
88
judgement (e.g., condition of the buildings) and items requiring highly detailed observations
at street level (e.g., presence of litter), may be less obviously observed, especially using virtual
methods.
The fifth and final challenge refers to the characteristics of GSV imagery. The quality of the
images is not always optimal, due to different reasons, such as the quality of the initial
recording, compression of the data or resolute blurring of the data because of privacy
considerations (Google, n.d.). Furthermore, GSV images are recorded by a car from the
roadway, that does mean that all facets of the streets are mapped due to objects blocking the
view at the time of the recording. These aspects in sum make that it is generally not easy to
capture, detect and/or recognize smaller objects with the use of GSV imagery (Aghaabbasi et
al., 2018; Rzotkiewicz et al., 2018). Additionally, not applicable for this study, but it may be
relevant when this study is extended: GSV imagery are not available for all geographical
regions and/or all the micro places within these geographical regions (Bloch, 2020).
Despite the number of limitations and challenges, the results of our study still suggest that
virtual SSO approaches have considerable promise for the reliable and valid assessment of
neighbourhood-level physical properties. Our study contributes, moreover, to the few existing
studies that investigate the extent to which virtual observations are complementary to other
methods. By doing so, we did not only evaluate the quality of observations by means of GSV
images, but also investigated a second virtual observation method, or original photographs.
In future research, the challenges that our study identified should be taken into account in
order to keep evolving towards a more valid and reliable measurement approach for the
physical environment. Finally, future research could explore the replacement of human
observers by computers, because, although the results are eminently satisfactory, it remains
a labour-intensive process. Therefore, it is necessary to conduct similar research, but test the
reliability and validity of both type of observers instead of the reliability and validity over
observation methods. Exploratory studies provide promising results regarding the
classification of various types of urban disorder (and by extension more aspects in public
space, such as presence of CCTV) on a micro-level scale (Sukel et al., 2020).

Measuring CPTED and disorder
89
4.5. References
Aghaabbasi, M., Moeinaddini, M., Shah, M. Z., & Asadi-Shekari, Z. (2018). Addressing issues in
the use of Google tools for assessing pedestrian-built environments. Journal of
Transport Geography, 73, 185-198.
Ben-Joseph, E., Lee, J.S., Cromley, E.K., Laden, F., & Troped, P.J. (2009). Virtual and actual:
Relative accuracy of on-site and web-based instruments in auditing the environment
for physical activity. Health & Place, 19, 138-150.
Bloch, S. (2020). An on-the-ground challenge to uses of spatial big data in assessing
neighbourhood character. Geographical Review, 110(1-2), 210-223.
Cannuscio, C.C., Weiss, E.E., Fruchtman, H., Schroeder, J., Weiner, J., & Asch, D. A. (2009).
Visual epidemiology: Photographs as tools for probing street-level etiologies. Social
Science & Medicine, 69(4), 553-564.
Clarke, P., Ailshire, J., Melendez, R., Bader, M., & Morenoff, J. (2010). Using Google Earth to
conduct a neighbourhood audit: reliability of a virtual audit instrument. Health Place,
16(5), 1224-1229.
Crowe, T.D. (2000). Crime prevention through environmental design: Applications of
architectural design and space management concepts. Butterworth-Heinemann.
Cundiff, K. (2020). Colleges and Community Crime: An Analysis of Campus Proximity and
Neighbourhood Crime Rates. Crime & Delinquency, 0011128720974312.
De Leeuw, E. D. (2005). To mix or not to mix data collection modes in surveys. Journal of official
statistics, 21(5), 233-255.
Dillman, D. A., Phelps, G., Tortora, R., Swift, K., Kohrell, J., Berck, J., & Messer, B. L. (2009).
Response rate and measurement differences in mixed-mode surveys using mail,
telephone, interactive voice response (IVR) and the Internet. Social science research,
38(1), 1-18.
Feng, J., Glass, T.A., Curriero, F.C., Stewart, W.F., Schwartz, B.S. (2010). The built environment
and obesity: a systematic review of the epidemiologic evidence, Health Place, 16, 175–
90

Measuring CPTED and disorder
90
Google. (n.d.). Google-contributed Street View imagery policy.
https://www.google.com/streetview/policy/
Gracia, E., & Herrero, J. (2007). Perceived neighbourhood social disorder and attitudes toward
reporting domestic violence against women. Journal of Interpersonal Violence, 22(6),
737–52.
Gracia, E., Fuentes, M.C., García, F., & Lila, M. (2012). Perceived neighbourhood violence,
parenting styles, and developmental outcomes among Spanish adolescents. Journal of
Community Psychology, 40(8), 1004–1021.
Griew, P., Hillsdon, M., Foster, C., Coombes, E., Jones, A., Wilkinson, P (2013). Developing and
testing a street audit tool using Google Street View to measure environmental
supportiveness for physical activity. International Journal of Behavioural Nutrition and
Physical Activity, 10(1), 103–9.
Heck, R.H., Thomas, S.L., & Tabata, L. (2010). Multilevel and longitudinal modeling with IBM
SPSS. New York: Routledge. Hill, T. D., & Angel, R. J. (2005). Neighbourhood disorder,
psychological distress, and heavy drinking. Social science & medicine, 61(5), 965-975.
Hinkle, J., & Yang, S. M. (2014). A new look into broken windows: What shapes individuals’
perceptions of social disorder? Journal of Criminal Justice, 42(1), 26–35.
Hoeben, E. M., Steenbeek, W., & Pauwels, L. J. (2018). Measuring disorder: observer bias in
systematic social observations at streets and neighbourhoods. Journal of Quantitative
Criminology, 34(1), 221-249.
Jeffery, C. (1971). Crime Prevention through Environmental Design. Sage.
Johnson, D., Maguire, E. R., Maass, S. A., & Hibdon, J. (2016). Systematic observation of
disorder and other neighbourhood conditions in a distressed Caribbean community.
Journal of community psychology, 44(6), 729-746.
Kelling, G. L. & Coles, C. M. (1996). Fixing Broken Windows. Restoring Order and Reducing
Crime in Our Communities. The Free Press.
Lavrakas, P. J. (2013). Applying a total error perspective for improving research quality in the
social, behavioral, and marketing sciences. Public Opinion Quarterly, 77(3), 831-850.

Measuring CPTED and disorder
91
Marco, M., Gracia, E., Martín-Fernández, M., & López-Quílez, A. (2017). Validation of a Google
Street View-based neighbourhood disorder observational scale. Journal of Urban
Health, 94(2), 190-198.
Mastrofski, S. D. (1998). Systematic observation of public police: Applying field research
methods to policy issues. US Department of Justice, Office of Justice Programs, National
Institute of Justice.
Mihinjac, M., & Saville, G. (2019). Third-generation crime prevention through environmental
design (CPTED). Social Sciences, 8(6), 182.
Morenoff, J., Sampson, R. J., & Raudenbush, S. W. (2001). Neighbourhood inequality,
collective efficacy, and the spatial dynamics of urban violence. Criminology, 39, 517–
558.
Raudenbush, S. W., & Sampson, R. J. (1999). Ecometrics: toward a science of assessing
ecological settings, with application to the systematic social observation of
neighbourhoods. Sociological methodology, 29(1), 1-41.
Ross, C.E.,& Mirowsky, J. (2009). Neighbourhood disorder, subjective alienation, and distress.
Journal of Health & Social Behaviour, 50(1), 49–64.
Rossi, P. H., Wright, J. D., & Anderson, A. B. (Eds.). (2013). Handbook of survey research.
Academic Press.
Rundle, A.G., Bader, M.D.M., Richards, C.A., Neckerman, K.M., & Teitler, J.O. (2011). Using
Google Street View to audit neighbourhood environments. American Journal of
Preventive Medicine, 40(1), 94–100.
Rzotkiewicz, A., Pearson, A. L., Dougherty, B. V., Shortridge, A., & Wilson, N. (2018). Systematic
review of the use of Google Street View in health research: Major themes, strengths,
weaknesses and possibilities for future research. Health & Place, 52, 240-246.
Sampson, R. J., & Raudenbush, S. W. (1999). Systematic social observation of public spaces: A
new look at disorder in urban neighbourhoods. American journal of sociology, 105(3),
603-651.

Measuring CPTED and disorder
92
Sampson, R. J., & Raudenbush, S. W. (2001). Disorder in urban neighbourhoods: Does it lead
to crime. US Department of Justice, Office of Justice Programs, National Institute of
Justice.
Saville, G., & Cleveland, G. (2008). Second-generation CPTED. 21st century security and CPTED:
Designing for critical infrastructure protection and crime prevention, 79.
Skogan, W.G. (1990). Disorder and decline: crime and the spiral of decay in American
neighbourhoods. The Free Press.
Sukel, M., Rudinac, S., & Worring, M. (2020). Urban Object Detection Kit: A system for
collection and analysis of street-level imagery. In Proceedings of the 2020 International
Conference on Multimedia Retrieval (pp. 509-516).
Taylor, B.T., Fernando, P., Bauman, A.E., Williamson, A., Craig, J.C., & Redman, S. (2011).
Measuring the quality of public open space using Google Earth. American Journal of
Preventive Medicine, 40(2), 105-112.
Vannieuwenhuyze, J. T., Loosveldt, G., & Molenberghs, G. (2012). A Method to Evaluate Mode
Effects on the Mean and Variance of a Continuous Variable in Mixed‐Mode Surveys.
International Statistical Review, 80(2), 306-322.
Wilson, J. Q., & Kelling, G. L. (1982). Broken windows. Atlantic monthly, 249(3), 29-38.
Wolf, C., Joye, D., Smith, T. W., & Fu, Y. C. (Eds.). (2016). The SAGE handbook of survey
methodology. Sage.
Yang, S. M., & Pao, C. C. (2015). Do we “see” the same thing? An experimental look into the
black box of disorder perception. Journal of Research in Crime and delinquency, 52(4),
534-566.

Measuring CPTED and disorder
93
Appendix
Table 4.2. Descriptive statistics of CPTED and disorder items.
Variable Mode 1: In-situ
Mode 2: Photographs
Mode 3: Google Street View
Mean SD Mean SD Mean SD
Number of observers 1.97 0.17 3.67 0.53 5.64 0.59 Surveillance Formal surveillance 0.21 0.44 0.02 0.07 0.03 0.10 Natural surveillance 2.19 0.56 1.48 0.77 1.93 0.55 CCTV 0.54 0.69 0.28 0.46 0.25 0.36 Icons indicating presence of CCTV 0.39 0.68 0.21 0.38 0.13 0.24 Lighting 2.25 0.73 1.87 0.81 2.05 0.64 Windows 2.32 0.93 2.40 0.76 2.37 0.81 Open spaces 1.14 0.97 1.11 0.82 1.11 0.84 Access control Entrances and exits 1.15 0.82 0.92 0.67 1.05 0.60 Icons indicating presence of entrances
0.82 0.83 0.55 0.56 0.61 0.57
Alarm systems 0.49 0.73 0.15 0.29 0.24 0.47 Territoriality Physical barriers 1.60 1.22 1.32 1.03 1.43 1.04 Icons indicating presence of university
1.46 0.97 0.85 0.78 0.96 0.68
Icons indicating presence of private properties
0.61 0.66 0.33 0.47 0.45 0.49
Maintenance Cleanliness 2.06 0.76 2.21 0.55 2.37 0.42 Infrastructure 1.94 0.67 2.26 0.58 2.21 0.45 Garbage 0.89 0.81 0.50 0.62 0.40 0.38 Garbage bins 0.65 0.76 0.55 0.60 0.72 0.74 Graffiti 0.49 0.67 0.34 0.59 0.30 0.57 Icons indicating importance of cleanliness
0.14 0.33 0.05 0.15 0.04 0.14
Car wrecks 0.01 0.08 0.01 0.04 0.00 0.03 Bicycle wrecks 0.01 0.08 0.01 0.06 0.02 0.06 Broken windows/doors 0.13 0.40 0.03 0.10 0.04 0.17 Vacant buildings 0.26 0.49 0.10 0.20 0.15 0.24 Maintenance of buildings 3.21 0.58 3.31 0.55 3.34 0.54 Maintenance of pavements 3.42 0.68 3.46 0.42 3.37 0.40 Maintenance of sidewalks 3.32 0.69 3.34 0.55 3.39 0.47 Maintenance of lighting 3.29 0.68 3.24 0.58 3.24 0.44 Maintenance of CCTV 4.25 0.97 4.60 0.66 4.52 0.68 Maintenance of alarm systems 4.31 0.92 4.67 0.55 4.63 0.60 Maintenance of vegetation 3.63 0.86 3.54 0.60 3.68 0.57

Measuring CPTED and disorder
94
Homeless people 0.00 0.00 1.54 1.45 1.76 1.57 Drunk people 0.00 0.00 2.12 1.52 2.44 1.45 People using drugs 0.03 0.17 2.18 1.54 2.47 1.47 People fighting 0.00 0.00 1.63 1.45 1.82 1.57 Activity support Bars and restaurants 0.64 0.59 0.33 0.45 0.45 0.53 Shops 0.18 0.38 0.13 0.29 0.21 0.34 Picnic tables 0.43 0.78 0.19 0.47 0.24 0.47 Cultural activities 0.11 0.40 0.03 0.17 0.04 0.17 Playgrounds 0.04 0.18 0.07 0.24 0.06 0.16 Park 0.64 0.98 0.55 0.86 0.62 0.90

Impact of training on security awareness
96
CHAPTER 5
The impact of training sessions on physical security awareness: Measuring
employees’ knowledge, attitude and self-reported behaviour
Today, the need to deal with workplace security threats has become an important matter for
many organisations. While companies have invested in technological and organization
measures, the human processes behind these techniques are often ignored. However,
employees’ awareness of security procedures and policy of the organisation may strengthen
or weaken the implemented security measures. This article assessed in an empirical way
employees’ security awareness and has a twofold aim. First, a study was conducted to examine
the associations between three dimensions of employees’ security awareness. By the use of a
survey (n=1,443; mean age=42.5; 60.4% female, 30.4% male), the relationship between
employees’ knowledge about security procedures and policy, the attitudes towards security
and the self-reported security behaviour is measured. Second, a case study was carried out to
examine the impact of training sessions on employee’s level of security awareness. By
organizing an awareness training, its effect on employees’ knowledge, attitude and behaviour
was measured (n=74; mean age=51.7; 70.3% female, 29.7% male). While the first study found
a significant relationship between employees’ knowledge and attitude and their self-reported
behaviour, the second study showed that the training session had a positive effect on
employees’ level of security awareness. Based on the findings from both studies,
recommendations for practice and future research are presented.
This chapter is based on:
Sas, M., Reniers, G., Ponnet, K., & Hardyns, W. (in review). The impact of training sessions on
physical security awareness: Measuring employees’ knowledge, attitude and self-reported
behaviour.

Impact of training on security awareness
97
5.1. Introduction
Workplace security threats, and how to handle them, are important issues worldwide (Villa et
al., 2016). An increase in the use of digital information and communication techniques,
complex modern infrastructures and a closer connection between different systems and
organisations have all created greater vulnerability to security breaches. Companies have
invested in numerous technological and organisational security measures in an attempt to
address this issue, but both researchers and professionals suggest that even the most
sophisticated security techniques cannot work effectively unless every member of an
organisation acts in a secure way (Wiley et al., 2020). In recent years, there has been a
noticeable shift of focus on to the importance of ‘human processes’ in dealing with security
threats (Ghafir et al., 2018; Hassija et al., 2020). These human processes refer to employees’
security awareness – the extent to which a member of an organisation understands the
importance of security and the level of security required (ISF, 2002). An individual’s security
awareness can be categorised using three levels: perception, comprehension and protection,
depending on the employee’s degree of understanding of security issue (Shaw et al., 2009).
An employee with the lowest level of awareness may be aware of the potential security risks
but does not know how to mitigate them. At the comprehension level of awareness, the
employee knows what the potential risks are, and knows how to act in a preventive way. At
the protection level, the employee might have already experienced a similar security scenario
and decides to act in a preventive way based on this earlier experience.
Researchers have experimented with various learning mechanisms to strengthen the role of
employees in security, including online training, poster campaigns, email messages and face-
to-face training sessions (ENISA, 2008; Johnson, 2006; Khan et al., 2011a). All these
programmes are designed to affect employees’ behaviour by increasing their knowledge
about the threats and security policy and procedures of the organisation, in order to achieve
more secure and compliant behaviour. However, the implementation of a security awareness
programme does not guarantee that every employee has understood the information they
are given. It is therefore important to measure how effective the specific method is in fulfilling
its purpose (Khan et al., 2011b). In previous studies, the effectiveness of security awareness
programmes has often been evaluated by measuring three equivalent dimensions (cf. the
Impact of training on security awareness
98
Knowledge, Attitude and Behaviour (KAB) model of Baranowski et al., 2003): what people
know (knowledge), how people feel (attitude) and what people do (behaviour) (Kaur &
Mustafa, 2013; Khan et al., 2011a; Kruger & Kearney, 2006; McCormac et al., 2017).
Baranowski et al. (2003) propose that human functioning in relation to these dimensions can
be fragmented in these dimensions. Acquiring knowledge may result in changes in attitudes,
which in turn can lead to changes in behaviour. For instance, when employees have more
knowledge about the potential security threats and understand the importance of security
procedures, their attitude might change, which may result in more security-compliant
behaviour. However, the authors underline that although a person’s knowledge, attitude and
behaviour are definitely interrelated, they are not necessarily linear or dependent on each
other.
Previous studies show ambiguous results about the validity of the KAB model in practice. On
the one hand, Chang and Liao (2009) found that an aviation safety education programme
positively affected participants’ knowledge, attitude and behaviour; Rosenbloom et al. (2008)
concluded that an active learning programme in Israeli elementary schools resulted in an
increase in children’s knowledge and an improvement in behaviour regarding road safety; Van
der Linden (2012) reviewed past studies dedicated to climate change and found significant
associations between knowledge, attitude and behaviour; and Miller et al. (1990) stated that
the KAB approach supported an AIDS prevention programme, as an increase in knowledge led
to a change in behaviour among the participants. On the other hand, Shaftel and Shaftel
(2005) indicated that, while universities observe the influence of teaching on students’
knowledge and skill development, less is known about the impact on their attitudes and
behaviour; and in a study relating to oral health Singh (2009) found no correlations between
high school students’ knowledge, attitude and behaviour.
Within the field of security, very little research has been carried out on how employees’
security awareness can be improved. The few studies that have explored this have mainly
focused on the impact of security training and education on employees’ awareness regarding
information security. Wahyudiwan et al. (2017), for instance, showed that knowledge-based
programmes improved the knowledge, attitude and behaviour of employees regarding topics
such as password management and email usage. Also, Parsons et al. (2014) found significant
associations between a person’s knowledge, attitude and behaviour when using a work

Impact of training on security awareness
99
computer. Kaur and Mustafa (2013) found significant relationships between end users’
attitudes and behaviour, and their information security awareness. However, no significant
association was found between knowledge and information security awareness.
While the aforementioned studies examined employees’ awareness of security threats in an
online environment, very few – if any – studies exist about employees’ awareness of physical
security, or security in the offline world. In order to fill this research gap, the aim of the current
research was twofold. In a first study (Study 1) we examined whether employees’ knowledge
of physical security procedures and policy was associated with their attitudes towards security
and their self-reported security behaviour. Using a questionnaire distributed among staff at a
university, we measured the relationship between physical security knowledge, attitude and
behaviour. In a second study (Study 2) security training sessions were organised, and their
impact on staff members’ knowledge, attitude and behaviour concerning physical security was
measured.
Both studies were conducted among staff members of a university in Antwerp, Belgium.
Universities function as interesting research objects for this type of study for several reasons.
Higher educational institutions are increasingly confronted with various types of crime (Doss
et al., 2017; Jacobsen, 2017; Jennings et al., 2007; Schokkenbroek et al., 2020). While minor
crimes such as theft and vandalism occur regularly, universities’ characteristics, such as the
presence of a large number of young people, server rooms that store valuable information
and laboratories with potentially harmful substances make them an attractive target for more
serious crimes such as terrorism or espionage (Boynton, 2003; Grubbs, 2019). Moreover, most
European universities consist of various (semi-) publicly accessible spaces, which implies that
it is not always possible or desirable to implement significant physical security measures, and
that security is strongly dependent on the strength of the human factor. A university security
model must therefore include initiatives that increase and maintain the level of security
awareness among staff members.
Based on the results of both studies, concluding remarks and recommendations are made that
are applicable to both higher educational institutions and other types of organisations.

Impact of training on security awareness
100
5.2. Study 1: The association between knowledge, attitude and
behaviour
5.2.1. Hypotheses
Study 1 examined the interconnectedness between the three dimensions of security
awareness. To measure the relationships between employees’ security knowledge, attitudes
and behaviour, three hypotheses were proposed:
H1: More knowledge about security procedures and policy leads to a better attitude
towards security.
H2: A better attitude towards security leads to more secure self-reported behaviour.
H3: More knowledge about security procedures and policy leads to more secure self-
reported behaviour.
5.2.2. Data and methods
5.2.2.1. Data collection
A questionnaire was distributed among staff members of a Belgian university between June 3
and August 7, 2019. All employees (N=5,924) working at the university during this period were
eligible to participate in the study. Staff members could therefore voluntarily choose to
complete the questionnaire, utilising self-selection processes. With the cooperation of the
central administration of the university, every employee received an email with a link to the
questionnaire, which was developed in Qualtrics. After ten days, a polite reminder was sent
via email and an announcement was placed on the university’s intranet.
To fulfil the first aim of the study, the survey included questions regarding the three
dimensions of the KAB model. A first draft of the questionnaire was developed after a review
of existing questionnaires and an analysis of the security information presented on the
university’s intranet. All questions were self-developed and presented to a panel of ten
security experts at the university. Each security expert represented a department related to
security (e.g., Department of Infrastructure). They were asked about their understanding of

Impact of training on security awareness
101
the questions and whether they wanted to include other security topics of importance to them
in the survey. Based on their comments and suggestions, the proposed questions were kept,
but were adjusted and finalised. In order to measure knowledge, five items were included
(e.g., ‘At the university, I know where I can report crimes of which I am the victim’). For each
item, respondents had to indicate a number on a five-point Likert scale ranging from not at all
(=1) to totally (=5). To measure employees’ attitudes, three items were included in the
questionnaire (e.g., ‘The university provides its staff members with sufficient information
about security’). Each item was scored on a five-point Likert scale ranging from totally disagree
(=1) to totally agree (=5). Employees’ self-reported behaviour was measured using three items
(e.g., ‘If I noticed something or someone suspicious at the university, I would report it’).
Respondents had to indicate their answer on a five-point Likert scale ranging from (almost)
never (=1) to (almost) always (=5).
5.2.2.2. Data analysis
Structural equation modelling (SEM) was applied to the collected data using Mplus 8 (Muthén
& Muthén, 2017) to examine the relationships between the KAB constructs. First, a
measurement model was built to test whether the observed variables reliably reflected the
hypothesised latent variables. Second, we estimated a structural model. The SEM results were
obtained with the maximum likelihood mean adjusted, because preliminary tests suggested
that all three constructs were not normally distributed. Given the large sample size, p-values
<0.01 are considered significant.
The model fits of the measurement and path models were evaluated according to several fit
indices. Given that the χ2 is almost always significant and not an adequate test of the model
fit (Kline, 2011), we also reported the comparative fit index (CFI), root mean square error of
approximation (RMSEA), and the standardised root mean square residual (SRMR). The CFI
ranges from 0 to 1.00, with .95 or higher indicating that the model provides a good fit (Hu &
Bentler, 1999). RMSEA and SRMR values below .05 indicate a good model fit, and values from
.06 to .08 indicate an adequate fit (Ponnet, 2014).

Impact of training on security awareness
102
5.2.3. Results
5.2.3.1. Demographic data
In total, 1,443 employees participated in the study, which yields a response rate of 24.4%.
Table 5.1 provides an overview of the demographic characteristics of the participants. 35.5%
of respondents had been working at the university for 10 years or more. The gender split was
60.4% females (n=871) and 39.6% males (n=572). A small majority of the study’s participants
were administrative and technical staff (51.6%). More than 80% of participants had a full-time
equivalent between 76% and 100% at the time they filled in the questionnaire.
Table 5.1. Demographic characteristics of respondents in Study 1 (N=1,443).
n %
Gender Male Female
572 871
39.6 60.4
Age 20-29 30-39 40-49 50-59 ≥ 60 Missing
249 412 340 275 163
4
17.3 28.6 23.6 19.1 11.3 0.3
Staff category
Professors 169 11.7
Assistants 125 8.7
Researchers 358 24.8
Administrative and technical staff 745 51.6
Educational staff 45 3.2
Length of career at university Less than 1 year Between 1 and 5 years Between 6 and 10 years More than 10 years
169 483 282 509
11.7 33.5 19.5 35.3
% full time effort ≤ 25% Between 26% and 50% Between 51% and 75% Between 76% and 100%
50
122 76
1,195
3.5 8.5 5.3
82.8

Impact of training on security awareness
103
5.2.3.2. Overview of the variables
The questionnaire included 11 items, related to the three dimensions of the KAB model:
knowledge (5 items), attitude (3 items) and behaviour (3 items). The reliability, or internal
consistency, of a set of scale items was checked using Cronbach’s alpha. Items that would
increase Cronbach’s alpha in their absence were deleted (Attitude: 1 item6; Behaviour: 1
item7). Table 5.2 provides an overview of all study variables with their descriptives (mean and
SD) and internal reliability of each scale. The composite mean score per scale refers to the
mean of all scores on the individual items for that scale.
Table 5.2. Descriptives of the variables in Study 1 (N=1,443).
M SD
Knowledge (α=0.90) 3.25 1.10
Item 1 – At the university, I know where I can find information about preventive security tips (e.g., tips for the prevention of theft)
3.20
1.31
Item 2 – At the university, I know where to report crimes of which I am the victim (e.g., theft, violence)
3.40 1.34
Item 3 – At the university, I know how to report suspicious behaviour 3.25 1.29
Item 4 – At the university, I know what to do if there is an emergency situation (e.g., bomb alert, active shooter)
3.14 1.30
Item 5 – At the university, I know where to go when I am confronted with unacceptable behaviour (e.g., stalking, inappropriate sexual behaviour)
3.26 1.27
Attitude (α=0.77) 3.25 0.74
Item 1 – The university has sufficient security measures 3.13 0.93
Item 2 – The university takes sufficient action in case of an emergency situation
3.51 0.79
Item 3 – The university provides its staff members with sufficient information about security
3.10 0.96
Behaviour (α=0.60) 3.73 0.79
Item 1 – If I noticed someone in the hallway who does not seem to belong to the university, I would approach him/her
3.13 1.26
Item 2 – If I noticed someone or something suspicious at the university, I would report it
3.55 1.10
Item 3 – If I witnessed an incident at the university (e.g., violence, theft), I would report it
4.50 0.78
6 The item that was deleted is ‘minor incidents (vandalism, verbally aggressive behaviour) must always be reported to the university’. 7 The item that was deleted is ‘Every time I leave my workplace, I lock my door’.
Impact of training on security awareness
104
All constructs were significantly related to each other at the p<.001 level. The associations
between knowledge and attitude, and knowledge and behaviour were .36 and .37
respectively. The association between attitude and behaviour was .16.
5.2.3.3. Measurement model
The measurement model provided a good fit for the data: χ2(41)=230.65, p < .001; CFI=.968,
RMSEA=.057, CI [.050, .065], and SRMR=.047. All factor loadings were significant and above
.48. We subsequently included gender, age, % full-time effort, length of career and staff
category (professor, assistant, researcher, administrative and technical staff, educational
staff) as covariates in the analyses and examined the relationships between these covariates
and the study variables.
Age was significantly associated with behaviour (β=.265, p < .001) and knowledge (β=.11, p <
.001), which implies that older staff members had more security knowledge and behaved in a
more secure way. Percentage full-time effort was significantly related with knowledge
(β=.148, p<.001), suggesting that staff members with a higher % full-time effort at the
university knew more about the university’s security procedures and policy. Length of career
was significantly related to knowledge (β=.204 p<.001), suggesting that staff members who
had worked for a longer time at the university had more knowledge about the security
procedures and policy. The staff category ‘administrative and technical staff’ was significantly
related to knowledge (β=.366, p<.01). The structural model was adjusted for these covariates.
5.2.3.4. Structural model
The results of the structural model are presented in Figure 5.1. The results of the fit statistics
indicated an adequate model fit: χ2(80)=350.95, p<.001; CFI=.959, RMSEA=.049, CI [.044,
.054], and SRMR=.047.
Our analyses revealed that knowledge explained 18.6% of the variance in attitude, and that
knowledge and attitude explained 28.0% of the variance in behaviour. Knowledge was
significantly associated with attitude (β=.431, p < .001) and behaviour (β=.365, p < .001), thus
confirming that staff members who knew more about security procedures and policy had
better attitudes towards security and behaved in a more secure way. Unexpectedly, attitude

Impact of training on security awareness
105
was not significantly associated with behaviour (β=.065, p=.087). As a result, the indirect effect
from knowledge to behaviour was not significant (β=.028, p=.091).

Impact of training on security awareness
106
Figure 5.1. Structural model for the KAB model of security awareness. Note. Know1-5, Att1-3 and Beh1-3 represent the items presented in Table 5.2. All reported coefficients are standardised values, adjusted for the influence of covariates. The dashed lines indicate non-significant paths. *p < .01; **p < .001.

Impact of training on security awareness
107
5.3. Study 2: The impact of training sessions on security awareness
5.3.1. Hypotheses
In Study 2, three hypotheses were formulated in order to check whether participation in the
training session had an impact on employees’ level of security awareness: (i) participating in
the training sessions significantly improved employees’ knowledge of security procedures and
policy, (ii) participating in the training sessions significantly improved employees’ attitude
regarding security, (iii) participating in the training sessions significantly improved employees’
self-reported security behaviour.
5.3.2. Data and methods
The aim of the second study was to examine to what extent training sessions have an impact
on participants’ level of security awareness. In order to do this, training was organised for the
employees of a Belgian university (the same sample as in Study 1) between March 21 and April
19, 2018. Various security procedures and topics of importance to the university were
included in the training. Before the content of the training session was devised, ten security
experts from the university (the same experts as in Study 1) were interviewed to explore which
topics were relevant. The experts suggested that the focus should be on four topics: terrorism,
radicalisation, incident reporting and employees’ own security responsibilities at the
university. Based on their insights, a training session with a focus on all of these security topics
was developed.
The training sessions were held during the working day between 12:00 and 14:00 hours. Three
sessions were held on three different dates and at different locations, each with a maximum
capacity of 55 participants. All university employees were informed about the training
sessions via an announcement on the intranet and a personal email, both of which included a
registration link. Registration was entirely voluntary. To analyse the impact of the training
sessions on employees’ levels of security awareness, two questionnaires were developed and
distributed among the participants before and after the sessions. The pre-test questionnaire
was sent immediately after employees registered for the training. The post-test questionnaire
was distributed among the participants about two weeks after the training session. The aim
Impact of training on security awareness
108
was to examine whether the training sessions had improved participants’ security-related
knowledge, attitude and behaviour.
Based on the KAB model, questions regarding knowledge, attitude and behaviour were
included in both the pre-test and post-test questionnaire. All questions focused on the specific
topics that were discusses during the training sessions. After the questions were formulated,
they were presented to the university security expert panel and then adjusted. The final pre-
test questionnaire consisted of 24 questions. Five statements were developed to assess
employees’ knowledge about the university’s security procedures and policy (e.g., ‘I know how
to report suspicious behaviour‘). Answers were scored on a five-point Likert scale ranging from
totally disagree (=1) to totally agree (=5). To measure employees’ attitude towards security,
three statements were included (e.g., ‘Every suspicious behaviour or situation must be
reported, even if it turns out to be nothing’). Each item was scored on a five-point Likert scale
ranging from totally disagree (=1) to totally agree (=5). Additionally, three items referring to
employees’ self-reported behaviour were included in the questionnaire (e.g., ‘If I noticed
someone or something suspicious at the university, I would report it’). Staff members
indicated their answer on a five-point Likert scale ranging from (almost) never (=1) to (almost)
always (=5). The post-test questionnaire consisted of exactly the same questions as those in
the pre-test questionnaire, together with a couple of additional statements asking participants
to evaluate the training session.
Changes in employees’ scores on knowledge, attitude and behaviour between the pre-test
and post-test were analysed by using Wilcoxon signed-rank tests, as normality assumptions
were unsatisfied. The criterion for significance was set at 0.05.
5.3.3. Results
5.3.3.1. Demographic data
In total, 157 employees registered for one of the three sessions, 116 of whom attended a
session. As shown in Table 5.3, the sample comprised 74 employees who both attended the
training sessions and completed the pre- and post-questionnaire. A majority of women
(70.3%) participated, while every respondent indicated they were over 25 years of age. The
defined age groups were approximately equally represented. When asked about the length of

Impact of training on security awareness
109
their career at the university, most respondents had either worked at the university for
between one and five years (39.2%), or for more than 10 years (47.3%). Only three participants
indicated that they had worked at the university for less than a year.
Table 5.3. Demographic characteristics of respondents of Study 2 (N=74).
5.3.3.2. Results of the pre-test and post-test
The results showed that the training session had a positive effect on employees’ knowledge
of the university’s security procedures and policy (see Table 5.4). For all statements, significant
differences (p<0.05) between the two tests were found. The biggest improvement is noticed
when comparing the pre- and post-test results for the statements ‘I know the difference
between the procedures for a fire alarm and a bomb alert’ (z=6.816, p>0.001) and ‘I know how
to report signs of radicalisation among students or staff members’ (z=6.832, p<0.001). Sixty-
one of 73 respondents (83.6%) indicated they were more aware of the difference in
procedures for a fire alarm and a bomb alert. Additionally, 63 of 74 respondents (85%) were
convinced that after the training session they were more knowledgeable about the internal
reporting tools for radicalisation. Based on the results of all knowledge statements, it can be
concluded that respondents scored significantly higher on self-reported knowledge about
security after their participation in the training session. Therefore, the first hypothesis is
confirmed.
n %
Gender
Female 52 70.3
Male 22 29.7
Age
<25 0 0
25-35 15 20.3
36-45 21 28.4
46-55 19 25.7
>56 19 25.7
Length of career at university
<1 year 3 4.1
1-5 years 29 39.2
6-10 years 7 9.5
>10 years 35 47.3

Impact of training on security awareness
110
Table 5.4. Changes in employees’ knowledge regarding security procedures and policy (n=74).
Statements Pre-test M (SD)
Post-test M (SD)
z-score p-value Sample Scoring higher
Scoring lower
Scoring even
I know the difference between the procedures for a fire alarm and a bomb alert
2.32 (1.218)
4.04 (0.841)
6.816 p<0.001 73 n=61 n=3 n=9
I know how to report suspicious behaviour
3.14 (1.162)
4.51 (0.503)
6.215 p<0.001 74 n=51 n=2 n=21
I know where to report crimes of which I’m the victim
3.51 (1.317)
4.57 (0.526)
6.461 p<0.001 74 n=54 n=2 n=18
I know how to report signs of radicalisation among students or staff members
2.61 (1.259)
4.30 (0.677)
6.832 p<0.001 74 n =63 n=4 n=7
I know where to go with questions about security
4.07 (0.912)
4.45 (0.708)
3.220 p=0.001 73 n=33 n=9 n=31
Note. A composite mean score of 3.13 (SD = .92) was found. Reliability analysis indicated the scale has a Cronbach’s alpha of .84. ‘Scoring higher’, ‘scoring lower’ and ‘scoring even’ refer to a comparison between the post-test and pre-test scores.
For employees’ attitudes towards security, the Wilcoxon signed-rank tests showed a
significant improvement on two of three statements (see Table 5.5). After the training session,
more employees were convinced about their personal responsibility with respect to security
and the need to report suspicious situations. However, when asked to what extent security is
an important topic, a majority of 48 respondents indicated the same score. Remarkably, only
11 employees indicated a higher score after the training session, while 14 of them indicated
lower scores. Although a limited number of participants scored higher on the post-test, it
should be noted that the pre-test mean (4.46) was already very high. Based on the majority
of the statements, there was a significant improvement in the attitude of employees towards
security. This implies that the second hypothesis is confirmed.

Impact of training on security awareness
111
Table 5.5. Changes in employees’ attitude towards security (N=73).
Statements Pre-test M (SD)
Post-test M (SD)
z-score p-value Sample Scoring higher
Scoring lower
Scoring even
The security of the university is an important topic
4.46 (0.894)
4.48 (0.669)
0.044 p=0.965 73 n=11 n=14 n=48
Every suspicious behaviour or situation must be reported, even though it turns out to be nothing
4.01 (0.884)
4.30 (0.639)
2.868 p=0.004 73 n=28 n=10 n=35
I feel responsible for the security of the university
4.01 (0.630)
4.26 (0.578)
2.999 p=0.003 73 n=21 n=6 n=46
Note. A composite mean score of 4.16 (SD = .61) was found. Reliability analysis indicated the scale has a Cronbach’s alpha of .60. ‘Scoring higher’, ‘scoring lower’ and ‘scoring even’ refer to a comparison between the post-test and pre-test scores.
Regarding employees’ self-reported security behaviour, no significant differences were found
between the pre-test and post-test questionnaires (see Table 5.6). The large majority of
employees indicated an even score on both pre-test and post-test. For all three statements,
only a very limited number of respondents indicated higher scores in the post-test. Based on
these results, it can be concluded that the training sessions had less of an impact on the self-
reported behaviour of employees than on their knowledge and attitude. Hence, when looking
at all statements, the third hypothesis cannot be confirmed.
Table 5.6. Changes in employees’ self-reported security behaviour (N=71).
Statements Pre-test M (SD)
Post-test M (SD)
z-score p-value Sample Scoring higher
Scoring lower
Scoring even
If I noticed someone suspicious, I would report it
4.51 (1.024)
4.28 (0.759)
1.775 p=0.076 71 n=13 n=22 n=36
If I were the victim of a crime, I would report it
4.95 (0.571)
4.87 (0.335)
0.727 p=0.467 71 n=5 n=14 n=52
If I were confronted with an emergency situation, I would report it via the internal reporting tools
4.73 (0.926)
4.83 (0.377)
1.050 p=0.294 71 n=13 n=13 n=45
Note. A composite mean score of 4.73 (SD = .70) was found. Reliability analysis indicated the scale has a Cronbach’s alpha of .74. ‘Scoring higher’, ‘scoring lower’ and ‘scoring even’ refer to a comparison between the post-test and pre-test scores.

Impact of training on security awareness
112
5.4. Discussion
Most companies want their employees to exhibit security-compliant behaviour, therefore a
clear understanding of the effectiveness and impact of security awareness initiatives is
indispensable. To provide more insight into this topic, the aim of the current article was
twofold: examining the relationship between employees’ security knowledge, attitudes and
self-reported behaviour (Study 1) and measuring the impact of security training on their level
of security awareness (Study 2). The first study found that employees who have more security
knowledge also displayed a better attitude towards security issues. Additionally, employees
who reported having more security knowledge and better attitude towards security indicated
they would behave in a more secure way. No significant relationship was found between
employees’ attitudes towards security and their self-reported security behaviour. Taking into
account employees’ socio-demographic characteristics, positive associations were found
between their age, length of career and % full time effort, and their security knowledge. Older
employees also indicated that they behaved in a more secure way. The results of the second
study showed that the training session had a positive effect on employees’ security knowledge
and attitudes towards security. The impact of the training on staff members’ self-reported
behaviour was also found to be positive, but less strong compared to knowledge and attitude.
A comprehensive overview of the findings from both studies indicates that more security
knowledge and better attitudes towards security are related to more self-reported security-
compliant behaviour. Moreover, training sessions were found to be effective in increasing
employees’ security knowledge and attitudes. Extra attention should, however, be given to
the impact of training on participants’ behaviour.
Regarding the validity of the KAB model, our results showed that employees’ attitudes
towards security were not significantly related to their self-reported behaviour. In this light, it
should be acknowledged that other factors could have played a mediating role in the KAB
model. Parsons et al. (2014), for instance, state that employees may well know the security
procedures and behave in a secure way, even when their attitudes towards security issues are
negative. The desire to keep their job may be a mediating factor in employees choosing to act
in a security-compliant way. Previous studies in healthcare (Baranowski et al., 2003) and
environmental awareness (Newbould & Furnell, 2009) support this statement, and indicate
that individuals’ knowledge and attitude are not sufficient to explain changes in behaviour. A
Impact of training on security awareness
113
potential explanation for this complex relationship between attitude and behaviour can be
found in the Theory of Planned Behaviour of Azjen (1991), which assumes that a person’s
behavioural change is dependent on three beliefs: behavioural beliefs, or beliefs about the
consequences or other attributes of behaviour; normative beliefs, or beliefs about the
normative expectations of other people; and control beliefs, or beliefs about the presence of
factors that may support or hinder performance of the behaviour. The intention towards
particular behaviour will be higher if the person has a positive attitude about it, more of a
subjective norm towards the behaviour and a high perception of behavioural control.
In addition to the impact of mediators, moderators could also influence this attitude–
behaviour inconsistency. A potential explanation is provided by the Attitude, Behaviour and
Structural Conditions (ABC) model of Guagnano et al. (1995). According to this model, a
person’s behaviour depends not only on their attitudes, but also on contextual conditions. The
relationship between an individual’s attitude and behaviour is strongest when contextual
factors are neither too strong nor too weak, providing the right level of support. This implies
that employees who work in highly supportive structural conditions but have a negative
attitude towards security may still act in a secure way. In reality, and adapted to the field of
physical security, this means that the organisation must possess the tools and structures that
are needed to simulate employees to act in a security-compliant way. Insufficient support or
a weak organisational culture could create the opposite result. Another moderating factor
may be found in the processes that contribute to people’s attitude formation. Regan and Fazio
(1977) indicate that individuals who form their attitudes based on direct behavioural
interaction with the attitude’s object will show significantly greater attitude–behaviour
consistency than people whose attitudes were formed by other means. The authors start from
the assumption that direct behavioural experiences form an attitude that is more stable than
an attitude produced through indirect means. Related to the field of physical security, this
would, for instance, imply that people who have themselves been a victim of crime will
demonstrate higher attitude–behaviour consistency compared to individuals who have not.
Bulgurcu et al. (2010) found that prior negative experiences, both direct and indirect, with
information security increased employees’ level of information security awareness. In this
light, the organisation of more interactive training sessions where people gain experience with
the topic may increase the relationship between their attitudes and behaviour. More practical

Impact of training on security awareness
114
awareness initiatives, such as penetration tests, red teaming, simulation attacks or interactive
demos may therefore be recommended.
Furthermore, when implementing security awareness programmes, one should keep in mind
the exact level of security awareness that is expected by the organisation. The level of security
awareness that is expected of an employee at a university may differ from that required of an
employee of a chemical or nuclear company. Therefore, it is important for an organisation to
identify the level of security awareness it expects of its employees and adapt its security
awareness programmes to these predefined goals. Moreover, any security awareness
programme needs to be continually measured and monitored to respond to all relevant
threats at that time. Physical security processes are dynamic because they are dependent on
continuously changing threat profiles. This implies that employees have to be updated about
these changes, and in order to do that security awareness training should be an integral part
of the security culture of the organisation. In each and every organisation, regardless of its
type of business, location or size, people are always a key factor for successful physical security
management. Furthermore, as Study 1 showed that employees’ age, % full-time effort, length
of career and staff category are significantly related to their knowledge about security, it is
vital to involve everyone in awareness initiatives. Specific attention should be paid to new
employees and staff members who only occasionally work at the organisation. In this light,
employees who are not formally part of the organisation, such as contractors or consultants,
should also be encouraged to participate in security awareness programmes.
Although this article has provided valuable insights into the knowledge–attitude–behaviour
relationship regarding physical security, some limitations have to born in mind when
interpreting the results of the two studies. First, employees participated in both studies on a
voluntarily basis, which implies that the participants represent a self-selected sample of the
targeted population or a non-random selection. Unfortunately, the researchers could not
control for the self-selection process of voluntary, online surveys. While the high response
rate of Study 1 increases the validity of the study, the much smaller number of participants in
Study 2 contributes to a lower generalisability of the research findings. Therefore, it is not
known how the participants compare to other employees who did not fill in the questionnaire.
Even though previous research showed that self-selection does not necessarily bias the results
of surveys used in studies conducted at higher educational institutions (Brown et al., 2014;

Impact of training on security awareness
115
Rosenthal & Freyd, 2018), this limitation should be kept in mind. Additionally, the results of
both studies may be influenced by socially desirable behaviour. To overcome this limitation,
questionnaires were filled in anonymously and the confidentiality of the answers was
emphasised at the beginning of the surveys. However, as with most self-reported data, the
results may not be a true reflection of the actual security knowledge, attitude and behaviour
of employees. Moreover, we can expect that employees who decided to participate in the first
study or who engaged in the training session may already have been more interested in
security issues at the university than those who did not choose to take part. This implies that
caution is needed when generalising these conclusions to the whole staff member population
of the university. Furthermore, in both questionnaires, only a limited number of items were
included to measure employees’ knowledge, attitude and behaviour. To the authors’
knowledge, no measurement tools for physical security awareness were available at the start
of the current study. Therefore, all items had to be created based on the security aspects that
were relevant for the university where the study was conducted. For future studies, we
suggest the question items for each awareness dimension should be redefined. The items
should ideally be adapted to the security policy and procedures of the organisation where the
study is conducted.
The current research also has the limitation that the results may only be valid for short-term
conclusions. Both studies were conducted on a cross-sectional basis, which implies that it was
not possible to explore the long-term effect of employees’ security level of awareness and the
impact of the training sessions. In the first study, the questionnaire was distributed over a
period of two months. Factors such as criminal incidents at the university or communication
about security from the university could have influenced employees’ security knowledge,
attitude or self-reported behaviour at the time they filled in the survey. In the second study,
the post-test questionnaire was distributed approximately two weeks after the training
session. It is possible that participants scored higher on some questions because they
remembered what had been discussed during the training. This implies that, for both studies,
only short-term conclusions can be made. Further research is needed to examine whether
employees’ level of security awareness varies across time, and to what extent training causes
a long-term improvement in employees’ awareness. Finally, both the studies discussed in this
article were conducted among staff members of a university. While this type of organisation

Impact of training on security awareness
116
functioned as an interesting research environment, one should keep in mind the specific
contextual features of higher educational institutions. Caution should be exercised when
generalising the conclusions of these studies to populations outside of the specific university
where they took place. Similar studies conducted in other types of organisations are needed
in order to examine whether the organisational culture and context have a substantial impact
on the outcomes.
Despite these limitations, the results provide valuable information for security officers of
universities, but also other types of organisation. Empirical results on the association between
employees’ security knowledge, attitude and behaviour and the efficiency of training
programmes in enhancing security awareness were provided. While this study offered a first
insight into physical security awareness in a university context, future research is needed in
other types of organisations.

Impact of training on security awareness
117
5.5. References
Ajzen, I. (1991). Theory of planned behaviour. Organizational Behaviour And Human Decision
Processes, 50, 179–211.
Baranowski, T., Cullen, K.W., Nicklas, T., Thompson, D., & Baranowski, J. (2003). Are current
health behavioural change models helpful in guiding prevention of weight gain efforts?
Obesity research, 11, 23-43.
Boynton, A. (2003). Securing college campuses in the face of terrorism. Campus Law
Enforcement Journal, 33(5), 15-17.
Bulgurcu, B., Cavusoglu, H., & Benbasat, I. (2010). Information security policy compliance: An
empirical study of rationality-based beliefs and information security awareness. MIS
Quarterly, 34(3), 523-527.
Chang, Y. H., & Liao, M. Y. (2009). The effect of aviation safety education on passenger cabin
safety awareness. Safety science, 47(10), 1337-1345.
Doss, D. A., Lackey, H., McElreath, D., Goza, R., Gokaraju, B., Tesiero, R., & Sheffield, J. (2017).
A Quantitative Examination of Crime: Reported Incidents at Land-Grant Higher
Education Institutions versus Reported Societal Incidents. Journal of Interdisciplinary
Studies in Education, 6(1), 81.
ENISA (2008). The new users' guide: How to raise information security awareness. European
Network and Information Security Agency.
Ghafir, I., Saleem, J., Hammoudeh, M., Faour, H., Prenosil, V., Jaf, S., ... & Baker, T. (2018).
Security threats to critical infrastructure: the human factor. The Journal of
Supercomputing, 74(10), 4986-5002.
Grubbs, E. N. (2019). Academic Espionage: Striking the Balance Between Open and
Collaborative Universities and Protecting National Security. North Carolina Journal of
Law & Technology, 20(5), 235.
Guagnano, G. A., Stern, P. C., & Dietz, T. (1995). Influences on attitude–behavior relationships:
A natural experiment with curbside recycling. Environment and Behavior, 27, 699–718.
Hassija, V., Chamola, V., Gupta, V., Jain, S., & Guizani, N. (2020). A survey on supply chain
security: Application areas, security threats, and solution architectures. IEEE Internet of
Things Journal, 99, 1-25.

Impact of training on security awareness
118
Hu, L., & Bentler, P. (1999). Cutof Criteria for Fit Indexes in Covariance Structure Analysis:
Conventional Criteria versus new Alternatives. Structural Equation Modeling, 6, 1–55.
ISF (2002). Effective security awareness (workshop report). Information Security Forum.
Jacobsen, S. K. (2017). Examining crime on campus: The influence of institutional factors on
reports of crime at colleges and universities. Journal of Criminal Justice Education, 28(4),
559-579.
Jennings, W. G., Gover, A. R., & Pudrzynska, D. (2007). Are institutions of higher learning safe?
A descriptive study of campus safety issues and self‐reported campus victimization
among male and female college students. Journal of criminal justice education, 18(2),
191-208.
Johnson, E. C. (2006). Security awareness: switch to a better programme. Network security,
2006(2), 15-18.
Kaur, J., & Mustafa, N. (2013). Examining the effects of knowledge, attitude and behaviour on
information security awareness: A case on SME. In 2013 International Conference on
Research and Innovation in Information Systems (ICRIIS) (pp. 286-290). IEEE.
Khan, B., Alghathbar, K. S., & Khan, M. K. (2011a). Information security awareness campaign:
An alternate approach. In Kim, T., Adeli, H., Robles, R.J., & Balitanas, M., (Eds.),
Information Security and Assurance—ISA (pp. 1-10). Springer.
Khan, B., Alghathbar, K. S., Nabi, S. I., & Khan, M. K. (2011b). Effectiveness of information
security awareness methods based on psychological theories. African Journal of
Business Management, 5(26), 10862-10868.
Kline, R. B. (2011). Convergence of structural equation modeling and multilevel modelling. In
Williams, M., & Vogt, W.P. The SAGE Handbook of Innovation in Social Research
Methods (pp. 562-589). Sage Publications.
Kruger, H.A., & Kearney, W.D. (2006). A prototype for assessing information security
awareness, Computers & Security, 25, 289-296.
McCormac, A., Zwaans, T., Parsons, K., Calic, D., Butavicius, M., & Pattinson, M. (2017).
Individual differences and information security awareness. Computers in Human
Behavior, 69, 151-156.
Miller, T.E., Booraem, C., Flowers, J.V., & Iversen, A.E. (1990). Changes in knowledge, attitude,
and behavior as a result of a community-based AIDS prevention program, AIDS
Education and Prevention, 2(1), 12-23.

Impact of training on security awareness
119
Muthén, L., & Muthén, B. (2017). Mplus user’s guide (Version 8.0). Muthén & Muthén.
Newbould, M., & Furnell, S. (2009). Playing Safe: A prototype game for raising awareness of
social engineering [Paper presentation]. 7th Australian Information Security
Management Conference, Perth, Western Australia.
Parsons,, K., McCormac A., Butavicius, M., Pattinson, M., & Jerram, C. (2014). Determining
employee awareness using the Human Aspects of Information Security Questionnaire
(HAIS-Q), Computers & Security, 42, 165-176.
Ponnet, K. (2014). Financial Stress, Parent Functioning and Adolescent Problem Behavior: An
actor–Partner Interdependence Approach to Family Stress Processes in Low-, Middle-,
and High-Income Families. Journal of youth and adolescence, 43(10), 1752-1769.
Regan, D. T., & Fazio, R. (1977). On the consistency between attitudes and behavior: Look to
the method of attitude formation. Journal of experimental social psychology, 13(1), 28-
45.
Rosenbloom, T., Haviv, M., Peleg, A., & Nemrodov, D. (2008). The effectiveness of road-safety
crossing guards: Knowledge and behavioral intentions. Safety Science, 46(10), 1450-
1458.
Sas, M., Reniers, G., Hardyns, W., & Ponnet, K. (2019). The impact of training sessions on
security awareness: Measuring the security knowledge, attitude and behaviour of
employees. Chemical Engineering Transactions, 77, 895-900.
Schokkenbroek, J., Sas, M., Ponnet, K., & Hardyns, W. (2020). Seksuele intimidatie in (dating-)
relaties en de publieke ruimte: een vergelijking tussen twee survey-onderzoeken bij
Vlaamse universiteitsstudenten. Panopticon, 41(1), 99.
Shaftel, J., & Shaftel, T.L. (2005). The influence of effective teaching in accounting on student
attitudes, behavior, and performance, Accounting Education, 20(3), 231-246.
Shaw, R.S., Charlie, C.C., Harris, A.L., & Huang, H.J. (2009). The impact of information richness
on information security awareness training effectiveness, Computers & Education, 52,
92-100.
Singh, A. (2009). Oral health knowledge, attitude and practice among NCC Navy Cadets and
their correlation with oral hygiene in south India. Oral health & preventive dentistry,
7(4), 363.
van der Linden, S. (2012, July 3-6). Understanding and achieving behavioural change: towards
a new model for communicating information about climate change [Paper

Impact of training on security awareness
120
presentation]. International workshop on psychological and behavioural approaches to
understanding and governing sustainable Tourism Mobility, Freiburg, Germany.
Villa, V., Reniers G.L.L., & Cozzani V. (2016). Application of cost-benefit analysis for the
selection of process-industry related security measures, Chemical engineering
transactions, 53, 103-108.
Wahyudiwan, D. D. H., Sucahyo, Y. G., & Gandhi, A. (2017). Information security awareness
level measurement for employee: Case study at ministry of research, technology, and
higher education. In Proceedings of the 3rd International Conference on Science in
Information Technology (pp. 654-658). IEEE.
Wiley, A., McCormac, A., & Calic, D. (2020). More than the individual: Examining the
relationship between culture and Information Security Awareness. Computers &
Security, 88, 101640.


Nudging as a crime prevention strategy
122
CHAPTER 6
Nudging as a crime prevention strategy: The use of nudges to improve
cyclists’ locking behaviour and reduce the opportunities for bicycle theft
As policy makers are developing new alternative strategies to prevent bicycle theft, a nudging
approach could provide useful insights in this field. In the current study, two different nudges
were implemented at a selection of bicycle parking facilities in the neighbourhood of a Belgian
university campus. To measure the effectiveness of the nudges, a multi-method approach was
used with a combination of observations (N=3,963) and questionnaires (N=197). The results
showed that both nudges had a positive impact on cyclists’ locking behaviour. Based on these
findings it can be concluded that nudging can be a rather cheap and easy way to improve
secure behaviour. However, concerns such as the limitations of increased awareness on
behaviour and the excessive focus on the victim need to be taken into account when
implementing nudges in the field of security.
This chapter is based on:
Sas, M., Ponnet, K., Reniers, G., & Hardyns, W. (2021). Nudging as a crime prevention strategy:
the use of nudges to improve cyclists’ locking behaviour and reduce the opportunities for
bicycle theft, Security Journal, 1-23 (published online first).

Nudging as a crime prevention strategy
123
6.1. Introduction
While for a long time safety and security policies have been controlled within the framework
of penal law, more recent evolutions show that governments are developing new alternative
ways to ensure a safe and secure environment (Schuilenburg & Peeters, 2015). As crime
prevention and social control strategies have become more popular, the concept of nudging
could provide useful insights in this field. The nudging approach, which stems from the
emerging behavioural research domain, suggests that it should be the aim of policy makers to
guide people into making the most positive decisions. In this view, policy makers are
considered as ‘choice architects’ who regulate the environment in which individuals make
decisions (Alemanno, 2012). Nudges have gained widespread recognition through the book
‘Nudge’ (2008) by Richard Thaler and Cass Sunstein, who describe nudging as ‘any aspect of
choice architecture that alters behaviour in a predictable way without forbidding alternatives
or significantly changing economic incentives’ (Thaler & Sunstein, 2008, p.6).
To be qualified as a nudge, it is indispensable that the intervention fully preserves freedom of
choice without using any material incentives or disincentives such as taxes, subsidies or a fine
(Sunstein, 2015). This implies that there always has to be an easily available escape clause for
the nudged individual. However, the suggested freedom of choice has been criticized
extensively. Wertheimer (2014, p.10) indicated that there is never a complete freedom of
choice as we ‘always choose from among a limited set of options’. In this light, Hausmann and
Welch (2010) suggest broadening the definition of nudges because according to them, rational
agents are not only responsive to economic incentives. The authors define nudges as ‘the ways
of influencing choice without limiting the choice set or making alternatives appreciably more
costly in terms of time, trouble, social sanctions, and so forth’ (Hausmann & Welch, 2010,
p.126).
Since the first experiment with nudging, the etching of the image of a black housefly in urinals
in the men’s rooms at Schiphol Airport in Amsterdam, proved to be a major success (Thaler &
Sunstein, 2008), nudges are frequently used in various domains. Examples can be found in the
health sector, where healthy food is placed at eye level in order to nudge people to choose
meals low in calories (Thorndike et al., 2012), or in the traffic sector, where the narrowing of

Nudging as a crime prevention strategy
124
the distance between white stripes on the road nudges drivers to limit their speed (Lindhout
& Reniers, 2017).
Two groups of nudges can be identified, reflecting different underlying brain processes:
automatic thinking (system 1), which is associated by fast and instinctive processes, and
reflective thinking (system 2), which is characterized by deliberate and conscious processes
(Hansen & Jespersen, 2013). System 1 nudges have an impact on the automatic thinking or
the non-conscious part. Putting food on eye level or narrowing the distance between the
stripes on the road are examples of this kind of nudge. System 2 nudges focus on the slow and
reflective way of thinking or the conscious processes, such as the alarm that goes off when
one is not wearing a seatbelt in the car (Kahneman, 2011; Lindhout & Reniers, 2017; Thaler &
Sunstein, 2008). Additionally, seen from the point of view of the person who is nudged, nudges
can be transparent or non-transparent. Nudges such as stickers of footprints placed on the
ground leading to a sink or garbage bin are transparent as both the nudge itself and the
intention behind it are noticeable by the individual. The inclusion of defaults in a registration
form for organ donation is a non-transparent nudge as the intention of the means by which
the behavioural change is persecuted is not directly noticeable by the person who is nudged
(Lindhout & Reniers, 2017).
It can be stated that this nudging approach overlaps with techniques of crime prevention.
Reference can be made to Crime Prevention Through Environmental Design (CPTED) approach
which has the aim to prevent crime and fear of crime by manipulating the social and physical
environment (Cozens et al., 2005). Additionally, nudges can be considered as a form of
Situational Crime Prevention (SCP), which has the aim to reduce the opportunities of crime by
increasing the risks and difficulties associated with it (Clarke, 1995, 1997). Based on the
assumption that criminals weigh their costs and benefits before they act, SCP aims to
hardening the target and reducing the rewards of crime by changing the physical environment
(Clarke, 1997). Whereas CPTED and SCP are both grounded in the rational choice theory and
target a criminal’s ability to make rational choices, nudges are based on the principle that
some of the choices that people make are irrational (i.e. not consciously calculated). By
manipulating the choice architecture, (system 1) nudges seek to influence the unconscious
choices of people. However, (system 2) nudges can also be used to provoke criminals into
thinking about the consequences of their decisions before they act. Sharma and Kilgallon Scott

Nudging as a crime prevention strategy
125
(2015), for instance, suggest that theft from shops might be reduced if retailers displayed signs
showing how savings made from reductions in losses due to shop-theft, would be donated
directly to charity. Additionally, while it is one of the key principles of the nudging approach
to preserve full freedom of choice, some of the most effective situational interventions within
the CPTED and SCP frameworks involve the removal of choice (Sidebottom & Tilley, 2017). For
instance, the removal of accessible cash boxes on buses in the United States have led to the
near disappearance of bus robberies in the 1960s (Chaiken et al., 1974).
In the current study, system 2 nudges are used to provoke cyclists into thinking about the
consequences of their decisions. By implementing contextual cues, it is the aim to reduce the
number of opportunities for bicycle theft and increase the efforts for criminals. Due to the
unavailability of official police statistics, the number of bicycle thefts before and after the
nudging experiment is unknown. While these data cannot be included in the evaluation of the
nudging approach, changes in cyclists’ preventive locking behaviours will be assessed by
carrying out observations. First, an overview of earlier experiments with nudges in the field of
security will be provided. Additionally, the methodological approach of the current study will
be presented. After the presentation of the results, the most remarkable conclusions are
discussed. At the end of the paper, some limitations of the current research and
recommendations for future studies will be presented.
6.2. Nudges in the field of security
Although some nudging techniques are already sporadically used in cyber security
environments (see Almuhimedi et al., 2015; Balebako et al., 2011; Turland et al., 2015),
examples in the field of physical security are scarce. Only a limited number of researchers have
carried out experiments to examine whether nudging can be effective in the reduction of
criminal offenses or individuals’ fear of crime. A first example can be found in the prevention
of crimes occurring around cashpoints. Drawings of coloured boxes on the pavement right
before the cashpoint operate to deliver greater distance between the users of the cash points
and the pedestrians on the street behind them. This ‘safety spot’ has the aim to increase the
privacy of the cash point user and to ensure greater social control. As previous experiments
proved to be effective, this type of nudge has already been implemented in some cities in the
United Kingdom and the Netherlands (Gamman & Willcocks, 2010; Kuiper et al., 2016).

Nudging as a crime prevention strategy
126
In May 2008, the airports of Schiphol and New York started a nudging experiment with
biometric data from American and Dutch travellers with a low security risk. Travelers who
agreed to participate in this project were screened for extra security risks. In case they were
considered safe, they received a chip card with their identity data, fingerprints and iris scan.
With this pass travellers could cross the border without any delay due to the interrogation by
security guards at the airport. This way, travellers were ‘rewarded’ with speed and ease if they
are willing to share some personal data (Romein & Schuilenburg, 2008).
In 2015 the municipality of Hilversum, a town in the Netherlands, rolled out a red carpet with
mirrors next to it to reduce crime in the main entertainment street of the city. While the red
carpet referred to a high status, the mirrors ensured that passers-by saw a reflection of
themselves. The two interventions had the aim to suppress the tendency towards aggressive
behaviour. A survey indicated that passers-by felt much more secure after the implementation
of the red carpet and the mirrors (Kuiper et al., 2016). In Roermond, another town in the
Netherlands, portrait photos were placed behind the benches of the train station and quiet
music sounds were provided in the waiting area of regional transport. While the placement of
several eyes on the walls had the aim to create the feeling that people are watched, the music
offered people a warm and welcome feeling. As a result, individuals unconsciously showed
socially desirable behaviour and the train station was perceived as more atmospheric,
colourful and secure (Kuiper et al., 2016). In the study of Nettle et al. (2012) posters with
watching eyes were placed in bicycle parking facilities to reduce bicycle theft which caused a
reduction of 62% of bicycle thefts. Unfortunately, a displacement effect took place as the
amount of theft increased at other parking facilities in the neighbourhood by 65%.
In order to prevent vehicle theft in Durham in the United Kingdom, Roach et al. (2017)
developed a leaflet campaign to nudge vehicle owners into locking their vehicle when leaving
it unattended. Results showed that the number of thefts committed against insecure vehicles
in the treatment areas was reduced significantly in comparison with the control areas where
no nudges were implemented. In a more recent study, Roach et al. (2020) developed a
questionnaire to raise awareness among the residents of the twelve most victimized streets
of Durham. It was the second aim of the survey to nudge the residents into reflecting on their
preventing behaviour. The experiment led to a decrease in recorded burglaries during and
soon after the distribution of the survey. Moreover, the authors indicated that the

Nudging as a crime prevention strategy
127
questionnaire had a positive nudging effect on residents’ preventive behaviour regarding
burglary.
In the current study, nudges were implemented to improve cyclists’ locking behaviour to
reduce the opportunities for bicycle theft. While worldwide bicycles are promoted as an
alternative and sustainable way of transport, the widespread use of bikes creates a large
number of challenges, not only for traffic safety but also seen from a criminological
perspective. An increase in bicycle use raises the opportunities for potential perpetrators of
bicycle theft. While over the past years international crime rates show a decrease of criminal
offenses, this is not the case for registered bicycle thefts (Swanepoel, 2017). Previous research
has shown that the most attractive locations for bicycle thieves are in or around the home, at
railway stations and in the neighbourhood of educational institutions (Mercat & Heran, 2003;
Nicholas et al., 2005; Zhang et al., 2007). Additionally, it is shown that bicycle theft and the
fear of theft could discourage cycle use (Sidebottom et al., 2009). Moreover, the abundance
of not properly locked bikes not only facilitates bicycle theft, it also encourages it (Felson &
Clarke, 1998).
In this light, Sidebottom et al. (2009) examined the use of targeted publicity to limit the
opportunities for offenders of bicycle theft in public bicycle parking facilities. Although not
badged so, the targeted publicity approach can be considered as an example of nudging.
Stickers with a short advisory tag line and an illustration were placed on cycle parking
furniture. At the end of the experiment, the authors concluded that the stickers did have a
positive impact on the locking practices of cyclists. Similar to this study, the current research
has the aim to examine whether the use of nudges can have an impact on cyclists’ locking
behaviours. Different from the study of Sidebottom et al. (2009), the impact of two different
nudging interventions will be measured in the neighbourhood of a university campus in
Antwerp (Belgium). Additionally, a multi-method approach will be used with a combination of
observations and a survey. Focus lies on a measurement of the change in cyclists’ locking
behaviours instead of the reduction in the amount of bicycle thefts.

Nudging as a crime prevention strategy
128
6.3. Methodology
6.3.1. Research design
In the current study, focus lies on the improvement of cyclists’ locking behaviours to reduce
the opportunities for crime. A multi-method design was used in which observations and
questionnaires are combined. In a first research stage, observations were carried out to
examine the impact of the nudges on the locking behaviour of cyclists. In a second stage, a
quantitative survey was conducted to verify to what extent a change in locking practices could
be attributed to the implementation of the nudges. In order to set up the nudging experiment
for this study, the guidance of Lindhout and Reniers (2017) for the development,
implementation and evaluation of a safety nudge was used. Based on their literature review,
six steps were identified for the design and development of a nudge in practice: (1) assessment
of the situation, (2) focus on the individual behaviour, (3) selection of a nudge type, (4) design,
construction and pre-test of the nudge, (5) implementation of the nudge and (6) evaluation
of the nudge.
6.3.1.1. Assessment of the situation
The most recent Belgian crime statistics show that for several years, the number of bicycle
thefts has been around 35,000 offences per year (Federale Politie, 2019). In 2018, 3,672
bicycle thefts were registered in Antwerp, the second largest city of Belgium. The Safety
Monitor, a national population survey on various safety and security topics, showed that
17,23% (n=265) of respondents (n=1538) indicated that they had become a victim of bicycle
theft in the city of Antwerp in 2018. Additionally, in the same year 40,44% (n=74) of
respondents (n=183) indicated that they reported bicycle theft to the Police Department
(Federale Politie, 2018). National crime statistics show that the total amount of bike thefts is
much higher in the vicinity of universities. In the whole city of Antwerp, 6.27 bikes per 1000
inhabitants were stolen in 2018 in comparison to 25.11 bikes per 1000 inhabitants in the
vicinity of the university campuses (Lokale Politie Antwerpen, 2019). These findings are similar
to conclusions based on international crime statistics where the environment of educational
institutions is considered as an attractive location for perpetrators of bicycle theft (Van Dijk et
al., 2007). In this light, the bicycle parking facilities in the neighbourhood of a university
campus in the city of Antwerp were selected for carrying out the nudging experiment.

Nudging as a crime prevention strategy
129
6.3.1.2. Focus on the individual behaviour
Nudges affect the psychological processes that determine the individual’s automatic or choice
behaviour. As this study has the aim to urge cyclists to lock their bike in a secure way, the
choice behaviour of individuals has to be influenced. At the moment they park their bicycle,
cyclist choose whether they lock it decently or leave the bike behind in an unsecure way. Based
on the instructions of the Belgian police department, opportunities for bicycle theft can be
reduced by ensuring that bicycles are secured with attaching the frame and (one of) the
wheels to the parking furniture. Therefore, it is the aim of this study to stimulate cyclists to
make the effort to secure their bike with two locks.
It should be mentioned that while it is the goal of the interventions of the current study to
influence cyclists’ decision process, the nudges cannot have any impact on situational factors.
For instance, it is possible that a student, who has noticed the nudge, needs to be on time in
class to follow a course and decides to leave their bike unsecured in a rush. In another
situation, it is possible that there are no available parking spots left which hinders cyclists to
lock their bike to the bicycle stand. In order to obtain a more clear view on the impact of
situational factors in this study, the nudges will be evaluated by making use of a multi-method
approach (see 6.3.1.6.).
6.3.1.3. Selection of a nudge type
In the current study, the nudges have to stimulate the ‘system 2’ or reflective behaviour of
individuals as it is the aim to make cyclists aware of the potential risks of leaving their bike in
an unsecure way in order to stimulate them to improve their locking behaviour. One strategy
to guide behaviour in a certain direction can be found in theories and research about
normative social norms (Cialdini, 2003). Although there exists little research involving the use
of social norms to promote more secure behaviour, their ability to stimulate human behaviour
has been demonstrated in other contexts (Aldrovandi et al., 2015; Lehner et al., 2016). Recent
literature has distinguished two different types of social norms: injunctive norms, which
involves the individuals’ perceptions of which behaviours are approved or disapproved, and
descriptive norms, involving the individuals’ perceptions of which behaviours are typically
performed (Loschelder, 2019). Previous research showed that both kinds of norms motivate
human behaviour as people tend to do what is socially approved as well as what is popular

Nudging as a crime prevention strategy
130
(Dolan et al., 2012; Lindhout & Reniers, 2017; Ponnet et al., 2015). As a consequence, a
combination of injunctive (intervention 1) and descriptive (intervention 2) norms may be the
most effective way to induce normative behaviour (Cialdini, 2003).
6.3.1.4. Design, construction and pre-test of the nudge
For the first intervention, a nudge including an injunctive social norm was developed (see
Figure 6.1). With a very clear and transparent visual sign of both a poorly secured and a good
secured bicycle, cyclists were informed about the expected norm of their locking behaviour.
A green satisfied smiley emoticon was placed next to the secured bike to show that this
behaviour is approved. A red unsatisfied smiley emoticon was added next to the poorly
secured bicycle to disapprove this behaviour. In order to make the nudge more transparent,
the slogan (in Dutch and English) ‘Lock your bike twice… and don’t suffer from theft’ was
added next to the images of the bicycles.
Figure 6.1. The first nudging intervention (110x45mm).
A descriptive social norm was included in the second nudge (see Figure 6.2). The same visual
sign of a good secured bicycle, which was used in the first nudge, was developed in a larger
format. Additionally, the message (in Dutch and English) that ‘80% of students of University
[name blinded for review purposes] fix wheel and frame… to prevent theft’ was placed above
and beneath the image in order to influence their perception of which behaviour is typically
performed by other cyclists.
Figure 6.2. The second nudging intervention (297x210mm).
Nudging as a crime prevention strategy
131
While the first intervention involved a sticker, the second nudge was presented in the form of
a poster. Both were developed in a format that could easily be attached to the bicycle parking
furniture. For the sticker and the poster, three possible designs were developed and
presented to a panel of researchers, students and staff members of the university. In total, 21
respondents were asked to draw up a ranking of the six designs, based on three criteria: (1)
the design of the sticker and poster, (2) the clarity of the message and (3) the perceived effect
of the included social norm. Based on their ranking, two designs were selected and printed on
stickers and posters.
6.3.1.5. Implementation of the nudge
After the development of the two nudges, the stickers and posters were attached in the
bicycle parking facilities (see Figure 6.3). In order to select the bicycle parking locations, a
couple of choices had to be made. First, based on the crime statistics, it became clear that the
environment of educational institutions is a very attractive location for perpetrators of bicycle
theft. This means that only bicycle parking facilities in the close neighbourhood of the campus
were selected. Secondly, based on the differences in infrastructure of these parking facilities,
a selection was made of parking spots that only contained bicycle stands between each
bicycle. This criterion was necessary to attach the stickers. In total, six bicycle parking facilities
were selected. The maximum capacity of the parking facilities varied between 86 and 164
bikes. All parking locations are public, which implies that they are accessible to students and
staff members of the university, but also for external people such as inhabitants of Antwerp
or tourists. Thirdly, the selected bicycle parking locations were randomly split up in three
control sites and three treatment sites. The maximum number of parking options per site was
taken into account when randomizing the parking facilities. It was the aim to create two
groups that consisted of, to the extent possible, an equal number of available parking spots.

Nudging as a crime prevention strategy
132
Figure 6.3. Example of the implementation of the sticker and poster at treatment site.
As the timeline of the experiment indicates (see Figure 6.4), no stickers or posters were
attached in the parking facilities belonging to the control group. At the treatment sites, no
nudges were implemented in the first four weeks. In the fifth week, the stickers were attached
to every bicycle stand between two bikes, which made it very easy for cyclists to read the
message when they parked their bike. In the ninth week, the stickers remained and posters
were attached to the walls or railing of the parking infrastructure. Depending on the surface
of each bicycle parking, minimum three and maximum eight posters were attached.
Figure 6.4. Chronological timeline of the experiment at treatment (n=3) and control (n=3) sites.
6.3.1.6. Evaluation of the nudge
Similar to the research of Sidebottom et al. (2009), weekly observations were carried out in
order to observe the locking practices of cyclists (N=3,963) at both treatment (n=2,271) and
control (n=1,692) sites. In total, an average number of 329 bicycles were observed each week.
This made it possible to examine whether cyclists improved their locking practices before and
after each intervention at the treatment sites. Importantly, the observations were carried out
in a way that the observers attempted to remain unnoticed in order to minimize the impact
Nudging as a crime prevention strategy
133
of their presence on the behaviour of cyclists. During the experiment, three researchers
operated as observers and registered cyclists’ locking practices. By making use of a rotation
system, at each observation moment two of three observers were responsible for the
registration of bicycles. During 12 weeks, observations were carried out one day a week and
two times a day, starting between 9.00 am and 10.00 am in the morning and between 3.00
pm and 4.00 pm in the afternoon. Before the experiment started, different observations days
were picked randomly, which means that, for instance, observations took place on Monday in
the first week and on Wednesday in the second week. All observations were carried out before
the outbreak of the COVID-19 pandemic. Moreover, during the 12 weeks of observations there
were no holiday periods or other interruptions in students’ class schedules. Each researcher
was assigned the same three parking facilities in the morning and the afternoon. At the first
observation moment, the three observers registered all the bicycles at the six parking spots
together in order to adjust the observation criteria and to minimize observer bias.
In order to register the observations as uniform as possible, the researchers used a
standardized observation sheet to categorize the locking practices according to three criteria:
• Good: The use of two locks; or the frame and one (or both) wheels are attached
to the bicycle stand.
• Acceptable: The use of a single lock; or the frame or one wheel are attached to
the bicycle stand.
• Poor: The use of no lock or a single lock; neither the frame, nor one wheel are
attached to the bicycle stand.
In order to decide whether or not an improvement in cyclists’ locking practices took place, the
researchers decided that at least one out of three criteria had to be fulfilled: (1) an increase in
good locking practices, (2) an increase in acceptable locking practices and/or (3) a decrease in
poor locking practices.
Besides the locking practices, seven other characteristics of the bicycles were registered on
the observation sheet: (1) whether it is a male or female bike, (2) the brand of the bike, (3)
the colour of the bike, (4) the colour of the lock, (5) whether the bike has bicycle bags, (6)

Nudging as a crime prevention strategy
134
whether the bike is marked and (7) other remarkable characteristics, such as the presence of
a child’s seat or a remarkable colour of the saddle. The inclusion of these extra categories
made it possible to identify duplicate observations as counting the same bike would distort
the results and would lead to the wrong conclusions. Therefore, registered bicycles with
exactly the same characteristics were removed out of the data collection. For instance, if a
particular bike was poorly locked in the morning and the bike is still there in the afternoon,
only the first registration was retained. Additionally, observers were instructed to leave clearly
abandoned bicycles out of the data collection.
In order to find out whether a possible change in behaviour was caused by the interventions
or whether or not other factors had an impact on the behaviour of cyclists a survey was carried
out. Two days after the last observations took place in the 12th week of the experiment, five
researchers orally questioned arriving and departing cyclists at the six bicycle parking facilities.
Two very similar surveys were developed, one directed to cyclists who used the bicycle parking
facilities on the control site, and one directed to cyclists who used one of the treatment sites
to park their bike. In order to not disturb the cyclists before or after they went to class or work,
the surveys were very short.
6.4. Results
6.4.1. Observations
Figure 6.5 presents an overview of the locking practices at both the control and treatment
sites before and after the two interventions took place. Based on the results, it can be noticed
that in the baseline condition, locking practices at both control and treatment site are quite
similar: around 30% of cyclists locked their bicycle in a poor way, around 30% in an acceptable
way and around 40% in a good way. After the first intervention, a small increase in good
locking practices of 4.1% and a small decrease of acceptable locking practices of 3.8% at the
control sites can be noticed. For the poor locking practices, the results remain almost the
same. At the treatment sites, a decrease in poor and acceptable locking practices of
respectively 6.4% and 3.8% can be noticed. This decrease is accompanied with a large increase
of 10.2% in good locking practices. After the second intervention, the locking practices at the
control sites are quite similar with the baseline condition. At the treatment sites, a further

Nudging as a crime prevention strategy
135
increase of 2.8% in acceptable locking behaviour can be noticed after the second intervention,
compared with the first intervention.
Figure 6.5. Overview of the locking practices at control and treatment sites at baseline condition, after
the first intervention and after the second intervention (N=3,963).
In order to measure the impact of the nudges on the locking behaviour of cyclists, a Pearson
chi-square test was used. In order to know which specific categories differ significantly from
each other, partitioned Pearson chi-square tests were carried out.
When comparing cyclists’ behaviour at control and treatment sites in the baseline condition,
the Pearson chi-square test showed that there were no significant differences in locking
practices (χ2(2)=0.274, p=0.872). After the first intervention, no significant differences were
found in poor, acceptable or good locking practices at the control sites (χ2(2)=2.396, p=0.302).
At the treatment sites, significant differences were observed in locking practices after the
attachment of the stickers (χ2(2)=15.928, p<0.001). A partitioned Pearson chi-square test (see
Table 6.1) showed a significant increase in good locking practices compared to poor locking
practices (p<0.001). Additionally, a significant decrease was observed in acceptable locking
behaviour compared to good locking behaviour (p=0.004). Poor locking practices were found
to be less frequent compared to acceptable locking behaviour, but non-significant before and
after the implementation of the first nudge (p=0.484).

Nudging as a crime prevention strategy
136
Table 6.1. Partitioned Pearson chi-square comparisons of locking practices in the baseline condition
and after the first intervention at the treatment sites.
Baseline condition
%
First intervention
%
Total n
X² p
Poor 49.8 47.3
Acceptable 50.2 52.7 841 .490 .484
Acceptable 43.0 34.4
Good 57.0 65.6 1089 8.432 .004*
Good 57.2 68.0
Poor 42.8 32.0 1079 13.124 <.001**
*p < 0.01, **p < 0.001
After the second intervention, a Pearson chi-square test showed non-significant increases in
poor and acceptable locking behaviour and a non-significant decrease in good locking
behaviour at the control sites (χ2(2)=1.394, p=0.498). At the treatment sites, also only non-
significant changes were observed as poor and good locking conditions decreased and
acceptable locking behaviours were more frequent (χ2(2)=2.083, p=0.353).
When comparing the locking behaviours of the baseline condition with these of the period
after the second intervention, no significant changes were found at the control sites in poor,
acceptable and good practices (χ2(2)=0.186, p=0.911). At the treatment sites, significant
changes in cyclists’ locking behaviour were observed (χ2(2)=21.578, p<0.001). A partitioned
chi-square test (see Table 6.2) showed a significant decrease in poor locking practices in
comparison to acceptable locking practices (p=0.018), while a significant increase was found
in good locking behaviour compared to poor locking behaviour (p<0.001). Additionally, a
significant decrease in acceptable locking practices was observed in comparison with good
locking practices (p=0.030).

Nudging as a crime prevention strategy
137
Table 6.2. Pearson chi-square comparisons of locking practices in the baseline condition and after the
second intervention at the treatment sites.
Baseline condition %
Second intervention
%
Total n
X² p
Poor 49.8 41.9
Acceptable 50.2 58.1 906 5.577 .018*
Acceptable 43.0 36.9
Good 57.0 63.1 1214 4.702 .030*
Good 57.2 70.4
Poor 42.8 29.6 1150 21.367 <.001**
*p < 0.05, **p < 0.001
At the end of the experiment, significant differences were found between cyclists’ locking
behaviour at the control and treatment sites (χ2(2)=16.018, p<0.001). A partitioned chi-square
test (see Table 6.3) showed that significantly less poor locking practices in comparison to
acceptable locking behaviour was observed at the treatment sites (p=0.043). Additionally,
more good locking practices in comparison to poor locking practices were found at the
treatment sites (p<0.001). Finally, at the control sites, more acceptable locked bikes in
comparison to good locked bikes were observed. The differences between the control sites
and treatment sites were, however, non-significant (p=0.061).
Table 6.3. Differences in locking practices at the control and treatment sites after the second
intervention.
Control sites
Treatment sites
Total X² p
% % n
Poor 49.3 41.9
Acceptable 50.7 58.1 739 4.092 0.043*
Acceptable 42.7 36.9
Good 57.3 63.1 1026 3.523 .061
Good 58.0 70.4
Poor 42.0 29.6 959 15.874 <.001**
*p < 0.05, **p < 0.001

Nudging as a crime prevention strategy
138
6.4.2. Survey
6.4.2.1. Demographic characteristics of respondents
In total, 197 cyclists were surveyed at the bicycle parking facilities at the control and treatment
sites. Table 6.4 shows the demographic characteristics of the respondents at both sites.
Table 6.4. Overview of demographic characteristics of respondents at treatment (n=139) and control
sites (n=58).
Treatment sites Number (%)
Control sites Number (%)
Gender Man Women Missing
66 (47.5) 70 (50.4)
3 (2.2)
30 (51.7) 28 (48.3)
0 (0.0)
Age <20 20-29 30-39 40-49 >49
20 (14.4) 84 (60.4) 16 (11.5) 10 (7.2) 9 (6.5)
10 (17.2) 30 (51.7) 6 (10.3) 6 (10.3) 6 (10.3)
Position Student Staff member External
112 (80.6) 18 (12.9)
9 (6.5)
34 (58.6) 18 (31.0) 6 (10.3)
6.4.2.2. Awareness and effectiveness of nudges at treatment sites
At the treatment sites, 77.7% of cyclists (n=108) indicated that they had noticed the sticker,
while 59% of cyclists (n=82) indicated to be aware of the poster, and 84.9% (n=118) had
noticed the sticker and/or the poster. Remarkably, while many people at the treatment sites
were aware of the interventions, only 11.5% (n=14) of them indicated that the sticker had an
impact on their locking practices in the last couple of months, and only 7.2% of cyclists (n=9)
confirmed that their improvement in locking practices is due to the second intervention or
poster. 8.6% (n=12) gave other explanations for an improvement in their locking practices. An
earlier experience with theft (n=4) and the risk of the public character of the bicycle parking
(n=3) were the most common reasons.
Nudging as a crime prevention strategy
139
6.4.2.3. Awareness and effectiveness of nudges at control sites
At the control sites, cyclists were asked if they ever park their bike at other parking locations
in the neighbourhood of the university. If they confirmed, they were asked whether they had
noticed stickers or posters at one of the locations of the treatment group. In total, 60.4 %
cyclists (n=35) indicated that they sometimes park their bike at another location. 22.4% of
them (n=13) did park their bike in the last couple of months at one of the treatment sites.
Eight of them had noticed the sticker and two of them had noticed the poster. Additionally,
four individuals indicated that they had noticed the sticker without parking their bike at one
of the parking facilities of the treatment group. We could observe a significant difference
between cyclists’ awareness of stickers or posters and their locking practices (p=0.031), which
implies that cyclists who indicated to be aware of the nudges locked their bike in a more secure
way. Of the 14 individuals that noticed the sticker and/or poster, only one individual
confirmed that the sticker had an effect on his/her locking practices. The other 13 cyclists gave
other explanations, such as an earlier experience with theft (n=9) or theft warnings by their
parents (n =2).
6.5. Discussion
6.5.1. The relationship between awareness and conscious behaviour
The nudging interventions of the current study had the aim to improve cyclists’ locking
practices and therefore to reduce the opportunities for bicycle theft. By developing a sticker
and poster, cyclists were stimulated to think consciously about their locking practices and the
potential risk of bicycle theft. After the first intervention, the observations showed an
improvement in locking practices as significantly more cyclists locked their bike in a good way
after implementing the stickers. Based on the results of the survey it became clear that almost
80 per cent of cyclists indicated that they had noticed the stickers at the treatment sites.
Remarkably, only 12% of them confirmed that the sticker had an impact on their behaviour,
while almost 9% indicated that other factors influenced their locking practices.
Although it was the aim of the nudges to influence the conscious and reflective thinking of
cyclists, these findings suggest that almost 80% of cyclists who noticed the sticker, changed
their locking behaviour apart from the intervention or other factors. An explanation could be
that the cyclists improved their locking practices in an unconscious way. This would imply that
Nudging as a crime prevention strategy
140
the stickers served more as a system 1 nudge, which influences the automatic thinking of
people, instead of a system 2 nudge, which aims to impact the reflective decision process.
Following this explanation, cyclists unconsciously could have paid more attention their locking
practices after they noticed the first intervention. As the results of the current study cannot
confirm whether these assumptions are correct, further research is needed.
6.5.2. More awareness does not directly lead to better behaviour for everyone
At the beginning of the experiment, it was expected that an increase in awareness would
cause a change in behaviour. Based on the results of the survey, almost 85% of cyclists
indicated that they were aware of one or both interventions. While the results show that the
nudges led to a significant improvement in good locking practices, almost 20% of cyclists still
locked their bike in a poor way at the end of the experiment. This finding may support the
findings of other studies that an increase in the awareness of individuals does not always lead
to a change in behaviour for everyone. For instance, Reniers et al. (2014) concluded in their
study that lab safety interventions within higher educational chemical labs did change the
safety knowledge of students but did not change student’s safety behaviour. Kempton et al.
(1995) examined the relationship between the awareness of environmental issues and pro-
environmental behaviour and concluded that environmental knowledge is not a prerequisite
for behaving in a good environmental way. Yet, the majority of the existing policy tools for
changing rational behaviour are often guided by the assumption that availability of
information is needed to make rational choices.
According to Sidebottom et al. (2009) the distinction between an improvement in awareness
and behaviour is caused by an ‘incubation period’, or a sort of acclimatization time for people
to adapt to the changes in the environment. For instance, if cyclists decide at a certain moment
to change their behaviour, it is possible that they still have to buy an extra lock or take other
precautions. In the current study, it was not possible to examine the effect of the incubation
period as the experiment was only limited to 12 weeks. Previous research on the long-term
effects of nudging provides mixed evidence (see Dupas, 2012; Gneezy et al., 2011). Therefore,
more research is needed to examine whether it is suggested that policy makers make use of
nudges as a long-term intervention tool (Marchiori et al., 2016).

Nudging as a crime prevention strategy
141
6.5.3. Careful with blaming the victim
In contrast to the study of Nettle et al. (2012), the interventions in this study did not focus on
perpetrators but on the responsibility of potential victims of bicycle theft. The nudges had the
aim to empower cyclists by providing them with information about the risk on bicycle theft
and a possible way to avoid this risk. In previous research, these victim-oriented strategies
have received some criticism. In the most extreme example women are considered
responsible for rape for wearing short skirts or other ‘sexually provocative’ clothing. However,
in other situations people are happy to receive some advice about possible ways to minimalize
their risk on crime. For example, informing car owners that it is best to park their vehicle in
their garage at night could reduce the risk of vehicle crime by twenty-fold. Based on this
information, they can decide for themselves whether the risk is worth the effort of parking
the car in the garage (Clarke & Mayhew, 1998).
Additionally, providing information to potential victims could unintentionally cause some side-
effects, such as increased fear of crime. Depending on the used strategy, preventive
communication can result in inflated estimates of victimization risk or a strengthening of the
perceived negative impact of victimization (Winkel, 1991). However, in the study of Davis and
Smith (1994), the authors found that encouraging people to take responsibility for their own
security did not lead to higher levels of fear of crime (Davis & Smith, 1994). Winkel (1991)
concluded that an adaptation of the communication strategy to the target population can
control these negative side-effects. According to Barthe (2006), information given to potential
victims should always be complemented by initiatives by the police or government. Publicity
campaigns proved only to be successful in the context of a broader response to the problem.
In this light, it can be useful for this experiment to combine the nudging techniques that focus
on the responsibility of the potential victims with security measures that improve the bicycle
parking facilities or discourage perpetrators. In this way, the responsibility is shared between
the potential victim and the law enforcement institutions.
6.5.4. Limitations and further research
As this study was not carried out in a laboratory but in a natural setting, there are some
limitations to the research design, which can create opportunities for future research. First,
the presence of observers at the busiest hours of the day may have caused an impact on the
Nudging as a crime prevention strategy
142
locking behaviour of cyclists. Although the observers received the instructions that they had
to stay on the background, it is still possible that cyclists were aware that their behaviour was
observed and that they locked their bicycle in a better way. Especially at the treatment sites,
where stickers and posters were attached, the combination of these interventions with the
presence of the observers could have led to a change in behaviour.
Secondly, the locations of the bicycle parking facilities may have caused a contamination on
the effect of the interventions. As all parking facilities were located in the same
neighbourhood, they are within walking distance of each other. This means that it could be
possible that cyclists who normally park their bike at one of the control sites, for once choose
to store it at a treatment site and noticed the interventions. These cyclists could have
experienced an effect of the nudges and therefore decided to lock their bicycle in a better
way. In order to examine the impact of this limitation on the results, a survey was carried out
at the end of the experiment. Based on the answers of the respondents, it became clear that
only a very small number of cyclists at the control locations had noticed the interventions on
the treatment sites. It should be interesting for further research to select parking facilities
spread over a whole city or region in order to eliminate the contamination. In case of the
university context, it could be interesting to include parking facilities of different campuses or
universities in the experiment.
Thirdly, a major limitation of this research is the limited time frame. As the experiment only
lasted for 12 weeks, it was not possible to examine the long-term effect of both interventions.
For future research, it should be interesting to test the nudges over a longer period. This way,
some interesting hypotheses could be framed which could explore what nudges may and may
not be able to do. For example, one conjecture could be that nudges are good for altering
behaviour of the moment (although not changing longer-term habits or reasoning). Another
could be that nudging is educative and leads those nudged to change their longer-term
intentional behaviour in the preferred direction. A third could be that novelty nudges are
noticed at first and then lose their saliency over time. Each would lead to rather different
outcome patterns, but an experiment on long term would need to be designed to allow those
outcome patterns to emerge (or not to do so).

Nudging as a crime prevention strategy
143
Fourthly, based on this study it was not possible to ascertain the impact size of the second
intervention on itself. As the attachment of posters took place four weeks after the stickers
were applied, only the impact of the first intervention and the effect of both interventions
together could be measured. Based on the results, it can be concluded that the impact of the
posters was smaller than the influence of the stickers. However, in this study it was not
possible to find out whether the poster on itself did have little impact on the cyclists’
behaviour or whether it can be assumed that one intervention is more effective than a
combination of two nudges. Therefore, it should be interesting for further research to focus
on the effectiveness of this second intervention on itself.
Finally, it was not possible to examine whether the interventions caused a reduction in bicycle
theft at the parking facilities that were included in the experiment. Due to the unavailability
of official crime statistics for this specific neighbourhood of the university, the number of
bicycle thefts before and after the experiment is unknown. This also means that it was not
possible to examine whether the interventions caused a displacement effect. Previous
research on place-based crime prevention strategies has raised concerns that the
interventions displace the offences to other places (Gabor, 1990). In about 25 per cent of
evaluation studies on place-based security measures, a displacement effect was found
(Guerette & Bowers, 2009). Also Nettle et al. (2012) concluded in their study that a reduction
of bicycle thefts in the parking facilities that were included in the experiment caused an
increase of crime in bicycle facilities on other locations.
Furthermore, earlier experiments with crime prevention techniques have shown that besides
displacement also diffusion can be an effect of the intervention. Diffusion can be seen as the
reverse of displacement and occurs ‘when reductions of crime (or other improvements) are
achieved in areas that are close to crime-prevention interventions, even though those areas
were not actually targeted by the intervention itself’ (Guerette & Bowers, 2009, p. 1334).
Diffusion effects have been found in several crime prevention studies in the past (Bowers &
Johnson, 2003; Weisburd & Green, 1995; Weisburd et al., 2006). Therefore, when interpreting
the results of this study, it is important to keep these limitations in mind.

Nudging as a crime prevention strategy
144
6.6. Conclusion
This study had the aim to examine whether nudging could be useful as a crime prevention
strategy. To figure out whether the nudging approach could have an impact, an experiment
was carried out where nudges were used to reduce bicycle theft at public parking facilities in
a university neighbourhood. Based on the results, it can be concluded that the nudges led to
a significant improvement in cyclists’ locking behaviour. The first intervention caused a large
and significant improvement at the treatment sites. The second intervention led to a further,
but smaller and non-significant, improvement. Meanwhile, the locking practices at the control
sites remained the same during the whole experiment. This means that a combination of both
nudges had an effect on the behaviour of cyclists. These conclusions confirm the results of the
study of Sidebottom et al. (2009) where the attachment of stickers with a similar message
caused a significant improvement of cyclists’ locking practices. Based on these findings, it can
be concluded that nudging can be a rather cheap and easy way to improve secure behaviour.
However, as pointed out in the discussion, it is important to keep in mind the limitations of
increased awareness on behaviour and an excessive focus on victims of crime.

Nudging as a crime prevention strategy
145
6.7. References
Aldrovandi, S., Brown, G.D., & Wood, A.M. (2015). Social norms and rank-based nudging:
Changing willingness to pay for healthy food. Journal of Experimental Psychology:
Applied, 21(3), 242.
Alemanno, A. (2012). Nudging Smokers The Behavioural Turn of Tobacco Risk Regulation.
European Journal of Risk Regulation, 3(1), 32-42.
Almuhimedi, H., Chaub, F., Sadeh, N., Adjerid, I., Acquisti, A., Gluck, J., … ,& Agarwal. Y. (2015).
Your location has been shared 5,398 times!, A field study on mobile app privacy
nudging. In: Proceedings of the 33rd annual ACM conference on human factors in
computing systems (pp. 787-796). ACM.
Balebako, R., Leon, P.G., Almuhimedi, H., Kelley. P.G., Mugan, J., Acquisti, A., ..., & Sadeh, N.
(2011). Nudging users towards privacy on mobile devices. In: Proceedings of CHI 2011
Workshop on Persuasion, Nudge, Influence and Coercion (pp. 193-201).
Barthe, E. (2006). Crime prevention publicity campaigns (Vol. 5). US Department of Justice,
Office of Community Oriented Policing Services.
Bowers, K., & Johnson, S. (2003). Measuring the geographical displacement and diffusion of
benefit effects of crime prevention activity. Journal of Quantitative Criminology, 193,
275–301.
Chaiken, J.J., Lawless, M.W. & Stevenson, K. (1974). Impact of Police Activity on Crime:
Robberies on the New York City Subway System, Report No. R-1424-NYC, Rand
Corporation, Santa Monica, CA.
Cialdini, R.B. (2003). Crafting normative messages to protect the environment. Current
Directions in Psychological Science, 12, 105–109.
Clarke, R. V. (1995). Situational crime prevention. Crime and justice, 19, 91-150.
Clarke, R.V. (ed.) (1997). Situational Crime Prevention: Successful case studies. Harrow and
Heston.

Nudging as a crime prevention strategy
146
Clarke, R.V., & Mayhew, P. (1998). Preventing crime in parking lots: what we know and what
we need to know, In: Felson, M. & Peiser, R. (eds.). Reducing crime through real estate
development and management (pp. 205-210). Urban Land Institute.
Cozens, P. M., Saville, G. & Hillier, D. (2005). Crime prevention through environmental design
(CPTED): a review and modern bibliography. Property management, 23, 328-356.
Davis, R.C., & Smith, B. (1994). Teaching victims crime prevention skills: Can individuals lower
their risk of crime. Criminal Justice Review, 19(1), 56-68.
Departement Openbare Werken (2016). Een tandje bij voor de fiets: Een doelgericht Vlaams
fietsbeleidsplan. https://www.mobielvlaanderen.be/docs/beleidsplannen/2016-04-
28-fietsbeleidplan.pdf
Federale Politie (2018). Veiligheidsmonitor 2018.
http://www.moniteurdesecurite.policefederale.be/veiligheidsmonitor/
Federale Politie (2019). Criminaliteitsstatistieken.
http://www.stat.policefederale.be/criminaliteitsstatistieken/interactief/tabel-per-
politiezone/
Felson, M., & Clarke, R.V. (1998). Opportunity makes the thief: Practical theory for crime
prevention. Police Research Series Paper 98. Home Office.
Gabor, T. (1990). Crime displacement and situational prevention - toward the development of
some principles. Canadian Journal of Criminology, 32, 41–73.
Gamman, L., & Willcocks, M. (2010). ATM and cashpoint art: what’s at stake in designing
against crime. ATM and Cashpoint Art.
Guerette, R.T., & Bowers, K.J. (2009). Assessing the extent of crime displacement and diffusion
of benefits: a review of situational crime prevention evaluations. Criminology, 47,
1331–1368.
Hansen, P.G., & Jespersen, A.M. (2013). Nudge and the manipulation of choice: A framework
for the responsible use of the nudge approach to behavior change in public policy.
European Journal of Risk Regulation, 4(1), 3-28.

Nudging as a crime prevention strategy
147
Hausmann, D., &Welch, B. (2010). Debate: to nudge or not to nudge. Journal of Political
Philosophy, 18, 123-136.
Jeffery, C.R. (1971). Crime prevention through environmental design. Sage Publications.
Kahneman, D. (2011). Thinking fast and slow. Farrar, Straus and Giroux: Pengiun Books 2012.
Kempton, W., Boster, J.S., & Hartley, J.A. (1995). Environmental Values in American Culture.
MIT Press.
Kuiper, J., Meijer, S., van der Wiele, D., & Meijer, K. (2016). Veiligheidsverleiding.
https://hetccv.nl/fileadmin/Bestanden/Onderwerpen/Zintuigbenvloeding/Veiligheids
verleiding_14-12.pdf
Lehner, M., Mont, O., & Heiskanen, E. (2016). Nudging–A promising tool for sustainable
consumption behavior? Journal of Cleaner Production, 134, 166-177.
Lindhout, P., & Reniers, G. (2017). What about nudges in the process industry? Exploring a
new safety management tool. Journal of Loss Prevention in the Process Industries, 50,
243-156.
Lokale Politie Antwerpen (2019). Stad in cijfers: databank.
https://stadincijfers.antwerpen.be/databank/
Loschelder, D.D., Siepelmeyer, H., Fischer, D., & Rubel, J.A. (2019). Dynamic norms drive
sustainable consumption: Norm-based nudging helps café customers to avoid
disposable to-go-cups. Journal of Economic Psychology, 75, 102146.
Marchiori, D.R., Adriaanse, M.A., & De Ridder, D.T.D. (2016). Unresolved questions in nudging
research: Putting the psychology back in nudging. Social and Personality Psychology
Compass, 11(1), e12297.
Mercat, N., & Heran, F. (2003). Bicycle theft in France. In: Tolley, R. (ed.) Sustainable transport:
Planning for walking and cycling in urban environments. CRC Press, Woodhead
Publishing.
Nettle, D., Nott, K., & Bateson, M. (2012). ‘Cycle thieves, we are watching you’: Impact of a
simple signage intervention against bicycle theft. PloS one, 7(12), e51738.

Nudging as a crime prevention strategy
148
Nicholas, S., Povey, D., Walker, A.A., & Kershaw, C. (2005). Crime in England and Wales
2004/2005. Home Office.
Ponnet, K., Reniers, G., & Kempeneers, A. (2015). The association between students’
characteristics and their reading and following safety instructions. Safety Science, 71,
Part A, 56-60.
Reniers, G., Ponnet, K., & Kempeneers, A. (2014). Higher educational chemical lab safety
interventions: efficacious or ineffective? Journal of Chemical Health and Safety, 21(1),
4-8.
Roach, J., Weir, K., Phillips, P., Gaskell, K., & Walton, M. (2017). Nudging down theft from
insecure vehicles. A pilot study. International Journal of Police Science & Management,
19(1), 31-38.
Roach, J., Cartwright, A., Weir, K., Richards, S., & Weir, M. (2020). Reducing student burglary
victimisation using the Nudge approach. Crime Prevention and Community Safety,
22(4), 364-380.
Romein, E., & Schuilenburg, M. (2008). Are you on the fast track? The rise of surveillant
assemblages in a post industrial age. Architectural Theory Review, 13(3), 337-348.
Sharma, D., & Kilgatton, S.M. (2015, April). Nudge; Don’t judge: Using nudge theory to deter
shoplifters [Paper presentation]. 11th European Academy of Design Conference, Paris,
France.
Schuilenburg, M., & Peeters, R. (2015). From Biopolitics to Mindpolitics. Nudging in safety and
security management. http://www.onlineopen.org/article.php?id=491
Sidebottom, A., & Tilley, N. (2017). Situational prevention and offender decision making. In:
W. Bernasco, H. Elffers and J-L Van Gelder (eds.). Oxford Handbook of Offender
Decision Making. Oxford University Press.
Sidebottom, A., Thorpe, A., & Johnson, S.D. (2009). Using targeted publicity to reduce
opportunities for bicycle theft: A demonstration and replication. European Journal of
Criminology, 6(3), 267-286.
Sunstein, C.R. (2015). The ethics of nudging. Yale Journal on Regulation, 32, 413-452.

Nudging as a crime prevention strategy
149
Swanepoel, M.C. (2017). Smart dock for bicycle protection in theft-prone urban areas [Doctoral
dissertation]. Stellenbosch: Stellenbosch University.
Thaler, R.H., & Sunstein, C.R. (2008). Nudge: Improving decisions about health, wealth, and
happiness. Yale University Press.
Thorndike, A.N., Sonnenberg, L., Riis, J., Barraclough, S., & Levy, D.E. (2012). A 2-phase labeling
and choice architecture intervention to improve healthy food and beverage choices.
American journal of public health, 102(3), 527-533.
Turland, J., Coventry, L., Jeske, D., Briggs, P., & van Moorsel, A. (2015). Nudging towards
security: Developing an application for wireless network selection for android phones
[Paper presentation]. 2015 British HCI conference, Lincolnshire, United Kingdom.
Weisburd, D.L., & Green, L. (1995). Policing drug hot spots: The Jersey City drug market
analysis experiment. Justice Quarterly, 124, 711–35.
Weisburd, D.L., Wyckoff, L., Ready, J., Eck, J.E., Hinkle, J.C., & Gajewski, F. (2006). Does crime
just move around the corner? A controlled study of spatial displacement and diffusion
of crime control benefits. Criminology, 443, 549–91.
Wertheimer, A. (2014). Coercion. Princeton University Press.
Winkel, F. (1991). Police, victims, and crime prevention some research-based
recommendations on victim-orientated interventions. British Journal of Criminology,
31(3), 250-265.
Zhang, L., Messner, S., & Liu, J. (2007). Bicycle-theft victimization in contemporary urban
China: A multilevel assessment of risk and protective factors. Journal of Research in
Crime and Delinquency, 44, 406–426.


Unravelling college students’ fear of crime
151
CHAPTER 7
Unravelling college students’ fear of crime: The role of perceived social
disorder and physical disorder on campus
The current study explores the role of individual and environmental determinants on students’
fear of crime. Based on a large-scale survey among students of a Belgian university (N=1,463),
the relationship between perceived social and physical disorder and the three dimensions of
fear of crime (perceived risk of victimization, feelings of anxiety, avoidance behaviour) is
examined. Support was found for a relationship between perceived social and physical disorder
and perceived risk of victimization. Moreover, a relationship was found between students’
perception of social disorder and anxiety and students’ perception of physical disorder and
avoidance behaviour. Based on the results, this study suggests that preventing or reducing
visible signs of disorder on campus should inevitably be included in the university’s security
policy. This research offers universities more insight in the determinants of students’ fear of
crime and potential measures to increase their (perception of) security.
This chapter is based on:
Sas, M., Hardyns, W., Reniers, G., & Ponnet, K. (2021). Unravelling college students’ fear
of crime: the role of perceived social disorder and physical disorder on campus. British
Journal of Educational Studies, 1-21

Unravelling college students’ fear of crime
152
7.1. Introduction
While campuses are often seen as environments that are immune for crime, previous studies
(Jennings et al., 2007; Paulson & Sherer 2007; Woolnough, 2009) evoke questions about this
status of a safe haven. Research has shown that crimes such as vandalism, physical violence
or sexually undesirable behaviour are prevalent in higher educational institutions. The high
student population, the prevailing freedom, lack of guardians and homogenous nature of the
campus setting create an environment with opportunities for crime to occur (Petherick, 2000).
Moreover, the open structure of university campuses and the easy access through public
roads may contribute to the perception of risk (Gomme & Micucci 1997; Rasmussen & Johnson
2008). Although empirical data suggest that college campuses are more secure than the
communities in which they are located (Baum & Klaus 2005; Hart, 2003; Shariati & Guerette
2019), students may feel vulnerable and at risk for being victimized.
In the past decades, authors focused on students’ perceptions on their risk of victimization by
referring to the concept ‘fear of crime’ (Bohmer & Parrot, 1993; Brown & Andy, 2007). Recent
findings show that approximately one-quarter of students reported to experience fear of
crime on campus (Maier & DePrince, 2019; Robinson & Roh, 2013; Sani et al., 2020). Fear of
crime can be considered as a complex phenomenon that can be influenced by different
variables. In a campus environment, numerous studies have shown that students’ individual
characteristics, such as gender, age or nationality, may strengthen or reduce fear of crime
(May & Dunaway 2000; Tomsich et al,. 2011; Williams & Konrad, 2004). Moreover, earlier
experiences with victimization could make students more fearful (Lee & Hilinski-Rosick, 2012;
Maier & DePrince, 2019). To date, limited efforts have been applied to understanding the
influence of environmental features of campuses on students’ fear (Hibdon et al., 2016).
Research conducted in other contexts, for instance in communities and neighbourhoods,
suggest that environmental cues, such as the presence of disorder, can have a significant
impact on individuals’ fear of crime (Franklin et al,. 2008; Hardyns et al., 2019). Studies
indicate that certain areas can send signals that can cause people to develop feelings of
anxiety (Scarborough et al., 2010; Steinmetz & Austin, 2013). Many environmental dynamics
that generate fear of crime in community contexts, may also occur on campus. Scholars state
that college campuses can be considered similar to communities as they have three
components in common: a fixed geographic location, common ties among students, faculty

Unravelling college students’ fear of crime
153
and other people and many social interactions (Mansour & Sloan, 1992; Poplin, 1972; Sloan
et al., 1996). Still, a campus may also have characteristics that are not typically found in a
community, which could reduce students’ fear of crime. However, because of the limited
research on the influence of perceived disorder on fear of crime in a campus setting, the
specifics of fear generating processes on campus are uncertain (Sloan et al., 1996).
An overview of the literature shows that most studies on fear of crime on campus were
conducted among American college students. While there exists a large body of scientific
research on topics such as the prevalence of sexual assault (Klein & Martin, 2019), the impact
of school shootings (Kaminski et al., 2010) and the effect of security legislation (Janosik &
Gering, 2003) on American campuses, caution is needed to extrapolated the conclusions of
these studies to European universities (Sani et al., 2020). Contrary to European universities,
campuses in American countries are characterized by large populations of students living on
campus and spending their free time on campus (e.g. in fraternities and sororities, campus
gyms, campus restaurants) (Huesman et al., 2009). Moreover, empirical evidence shows that
there are differences in victimization rates between American and European countries. For
instance, a comparative study of Fisher and Wilkes (2003) showed that English college
students reported slightly higher rates of victimization (37.5%) compared to American
students (36.1%).
Therefore, the current research has the aim to fill a gap in the literature by examining the role
of perceived social and physical disorder on students’ fear of crime on campus in a non-
American context. By conducting a large-scale survey among students of a Belgian university,
a better understanding of the influence of environmental cues on students’ risk perception,
feelings of anxiety and avoidance behaviour will be provided. Based on the results of this
study, suggestions for universities to reduce students’ fear of crime will be provided.
7.2. Fear of crime on campus: a literature review
Campuses are public spaces where students and staff members are studying, working and
living close to each other. The daily campus activities create an environment where many
people function in a close proximity to criminal offenders (Robinson & Mullen, 2001). While
security can decrease the risks of becoming a victim, it is almost impossible to monitor all

Unravelling college students’ fear of crime
154
individuals working or visiting the campus. This implies that it is realistic that students become
victimized or report higher levels of fear of crime (Paulson & Scherer, 2007).
In previous research, authors often measured fear of crime by referring to the emotional
aspects of individuals’ feelings of anxiety. In this light, the question ‘How safe do you feel or
would you feel being alone in your neighbourhood at night?’ and a parallel question for ‘during
the day?’ have long served as the standard measurement method. Criminologists Ferraro and
LaGrange (1987) were one of the first researchers who criticized this narrow view and
emphasized on a multidimensional approach. Since the remarkable publication of the authors,
three main dimensions of fear of crime are distinguished: a cognitive dimension, or the risk
perception of crime victimization; an affective or emotional dimension, or the experienced
fear of more general feelings of, or concerns about security; and an expressive dimension, or
the behavioural attitudes or measures taken in response to feelings of fear (Hardyns &
Pauwels, 2010).
With perceived risk, authors refer to the individual's perception of the likelihood that they will
become a victim of a crime (Rader et al. 2007). Numerous studies found a one-way
relationship between risk perception and feelings of anxiety (Ferraro & LaGrange 1987; Warr
& Stafford, 1983). Ferraro (1995) even argued that perceived risk can be considered as the
strongest predictor of anxiety. Regarding the campus environment, a majority of studies,
which were conducted among students of American universities and colleges, suggest that a
difference can be made between perceived risk during the day and at night. For instance,
Tomsich et al. (2011) concluded that students’ perceived risk of victimization at night was
almost double of their perceived risk during the day. Moreover, gender differences have been
found. Jennings et al. (2007) concluded that females perceived higher levels of risk compared
to males. Fisher and Sloan (2003) also found higher levels of perceived risk for female
students, both during the day and at night. Other studies provide evidence that gender
differences in perceived risk are dependent on the type of crime. For instance, Reid and
Konrad (2004) found that women had lower levels of perceived risk for robbery than men but
showed higher levels of perceived risks for sexual assault and burglary.
As a continuation of the growing research on perceived risk and feelings of anxiety on
campuses, authors began to examine the behavioural changes originating from these feelings

Unravelling college students’ fear of crime
155
(Hibdon 2016). With constrained behaviour researchers refer to behavioural adaptations that
individuals make when they have the perception that there is a possibility of crime and they
want to reduce the victimization risk. These constrained behaviours include avoidance
behaviours (e.g., avoiding certain areas or classes in the evening) and defensive (or protective)
behaviours (e.g., carrying keys in case of self-defence or asking someone to walk with you)
(Ferraro & LaGrange, 1987). Studies have shown that students who express high levels of fear
report more avoidance and defensive behaviours (Wilcox et al., 2007; Woolnough, 2009). For
instance, Tewksbury and Mustaine (2003) found that 22% of American students indicated that
they carry a mace for self-protection while 17% reported to carry a gun to the university.
McCreedy and Dennis (1996) concluded that 27% of students of East Carolina University
(United States) avoid following classes after dark because of their feelings of anxiety. Prior
studies have indicated that women tend to report engaging in higher levels of avoidance
behaviour, while men are more likely to engage in defensive behaviours (Jennings et al., 2007;
May et al., 2010; McCormick et al., 1996).
7.2.1. Individual factors
As previous research indicated, individual characteristics can contribute to the experienced
level of fear (Schreck and Miller 2003). Numerous authors emphasize on age and gender
differences in fear of crime, both in the general population and among university students
(Fisher, 1995; Jennings et al., 2007; Woolnough, 2009). Studies have shown that people who
are less able to protect themselves from crime, such as female or younger students,
experience higher levels of fear since they consider themselves as more vulnerable to become
a victim (Alvarez & Bachman, 1997; McDevitt & Panniello, 2005; Schreck & Miller, 2003). Fox
et al. (2009) found that female students at a south-eastern American university experienced
more fear of crime at the campus in comparison to male students. Fisher and Sloan (2003)
considered gender as the strongest predictor of fear of crime and found that women reported
higher levels of fear on another American campus.
Additionally, previous studies showed that younger college students express more fear of
crime than older peers (Fisher & Sloan, 2003; Kaminski et al,. 2010). Patton and Gregory (2014)
found that younger students, those from 18–24 years of age, generally felt more secure while
on campus than did their older counterparts. Kaminski et al. (2010) concluded that after the

Unravelling college students’ fear of crime
156
Virginia Tech and Northern Illinois University shootings, younger students indicated to be
more fearful of crime on campus (Kaminski et al., 2010). May and Dunaway (2000) focused on
the grade level of students instead of their age and also found that grade level is inversely
related to fear. Hibdon et al. (2016) explain these differences due to the fact that younger
students may be more afraid of crime because they have been on campus for a shorter
duration of time and are less familiar with the campus environment.
Furthermore, studies have shown that experiences with previous victimization can increase
the level of students’ fear of crime. Researchers have distinguished between the impacts of
direct and indirect victimization. The direct victimization model establishes a link between fear
of crime and the experience of being victimized in the past (Dull & Wint, 1997; Skogan &
Maxfield, 1981). Overwhelmingly, studies show that crime victims are significantly more likely
to fear crime than non-victims. For instance, Fox et al. (2009) concluded that victims of theft
and stalking reported to be more fearful of crime on campus than students who did not
become a victim. Bedenbaugh (2003) also found that prior experiences with victimization had
a significant impact on students’ fear of crime on campus. Other authors have found a very
weak or even no relationship between victimization and fear of crime. For instance, Jennings
et al. (2007) found no impact of previous victimization on fear of crime at the university
campus.
The indirect victimization model, or vicarious victimization model, assumes that people who
have not been victimized personally but have been exposed to others who have, can
experience higher levels of fear (Fox et al., 2009). del Carmen et al. (2000) found that after an
incident of sexual assault on campus, the percentage of students that reported to be fearful
of crime increased from 32 per cent to 41 per cent. Schreck and Miller (2003) also found that
vicarious victimization heightens feelings of fear on school. Although many studies have found
support for the impact of indirect victimization on fear of crime, some studies indicate that
those who experience victimization vicariously are not more likely to be fearful of crime than
those who do not (Fisher et al., 1995; Fox et al., 2009). Despite the mixed relationship between
victimization and fear of crime, researchers have pointed out that it is part of a more complex
issue which involves many other factors which take into account the larger social and physical
aspects of campus life (Austin et al., 2002; Skogan & Maxfield, 1981).

Unravelling college students’ fear of crime
157
7.2.2. Environmental factors
Besides individual risk factors for fear, environmental cues may also matter in the perception
of security. The presence of physical or social disorder which alert people to possible criminal
victimization would inform the belief that victimization is likely to happen (Barberet &
Fisher, 2009; Warr, 2000). Disorder can be considered as violations of community standards,
which can be expressed by social disorder, such as the presence of people who are drunk or
fighting, or physical disorder, such as the presence of vandalism or dirty spaces. Individuals
may consider disorder as visible signs of crime indicating that dangerous elements are present,
and their personal security might be compromised and threatened (Fisher & May, 2009).
The link between perceived disorder and fear of crime originates from the Chicago School and
has been expressed more clearly in the Broken Window Theory. This theoretical framework
indicates that visible symbols of disorder make neighbourhoods vulnerable to criminal
offences (Wilson & Kelling, 2003). Visual cues of disorder, such as graffiti, public intoxication
or garbage, can signify to criminal offenders that residents are indifferent of what goes on in
the neighbourhood and lack the social cohesion that is needed to hinder crime (Sampson &
Raudenbush, 2004). More complex is the relationship between fear of crime and community
crime rates. Some scholars argue that fear of crime does not necessarily correspond to the
actual risk of victimization but is instead an individuals’ subjective estimate of the certainty of
being at risk of victimization based on an interpretation of the situation (Cook & Fox, 2011).
Most of the research on disorder and fear of crime has focused on the community setting
rather than university campuses (e.g., Hardyns et al., 2019; Scarborough et al., 2010). Wilson
and Kelling (1982) were the first researchers to argue that the presence of physical of social
disorder in neighbourhoods is directly linked to greater fear of crime. More recent studies
support this finding and indicate that individual perceptions of neighbourhood disorder
appear to be the most powerful determinants of both the cognitive and emotional dimensions
of fear of crime (Franklin et al. 2008; Hardyns et al. 2019). Other researchers have argued that
disorder indirectly affect feelings of anxiety through elevated perceived risk of victimization
(Ferraro, 1995; LaGrange et al., 1992; Rountree & Land, 1996). Regarding the campus
environment, some research has found that community disorder extends to fear of school-
related crime (May & Dunaway, 2000). Alvarez and Bachman (1997) found that the presence

Unravelling college students’ fear of crime
158
of gangs and the perceived availability of drugs and alcohol had an impact on fear of crime of
students. Sloan et al. (1995) and Fisher (1995) reported that a relationship exists among fear
of crime and perceived social disorder on campus. Based on these findings, the conceptual
model as shown in Figure 7.1 was developed.
Figure 7.1. Conceptual model of the determinants of avoidance behaviour. Note: gender and study
years were added as covariates for all variables.
7.3. Method
7.3.1. Research setting
The survey was conducted among students of the university of Antwerp, which consists of
nine faculties spread among four main campuses. While one campus is located in the centre
of the city, the other three campuses are situated in a more rural environment on the outskirts
of the city. All campuses are open to the public and are directly accessible by public roads.
This implies that campuses are not only visited by students and staff members, but also by
inhabitants of the city or tourists. At the time of the study the university enrolled 21,095
students with a majority of 11,918 (56,5 %) female students and 9,177 (43,5 %) male students.
The city of Antwerp consists of approximately 526,000 inhabitants and is, based on its
population, the largest city of Belgium. In 2019, the Local Police Department registered 63,495
crimes on the territory of the University of Antwerp. Theft, disorder, assault and battery and
drug related offenses were the most frequently reported crimes (Federale Politie, 2019). In
the vicinity of the four university campuses, the same types of crime were registered most

Unravelling college students’ fear of crime
159
often. Crime rates differed in 20188 from 284 to 1,099 with the highest crime rate measured
in the environment of the campus located in the city centre (Lokale Politie Antwerpen, 2019).
Unfortunately, no crime rates are available for the university campuses itself.
In the past years, the university of Antwerp increased its security efforts and invested, among
other things, in new buildings with CCTV and access control, strengthened the collaboration
with external security services and improved the support system for students who became
victim of inappropriate behaviour. In order to implement more evidence-based security
measures, this study has the aim to provide more empirical foundations about students’ fear
of crime on campus.
7.3.2. Procedure and participants
The current study was conducted among students of the University of Antwerp. All students
who were enrolled at the university during the spring semester of 2019 were eligible to
participate in this study. An online survey was spread among all students of the university
(N=21,095) from March 25 until May 25, 2019. With the cooperation of the central
administration of the university, every student received an email with a link to the
questionnaire, which was developed in Qualtrics. After ten days, a kindly reminder was sent
via email and an announcement was placed on the faculty’s internal website. Students
voluntarily and anonymously completed the online survey, utilizing self-selection processes.
A total of 1,463 students participated in the study, which yielded a response rate of 7%. The
average amount of years that respondents were a student at the university was 2.88 years
(SD=1.93, range=1 – 8), with 65.1% females (n=953) and 34.9% males (n=510). When
comparing these results to the total student population, it should be remarked that the two
groups differed in terms of gender. Women were overrepresented among the survey
participants.
8 While we found crime rates for the year 2019 on city level, unfortunately no crime rates of 2019 were available for the level of the neighbourhood. Therefore, the most recent police statistics of 2018 were consulted.
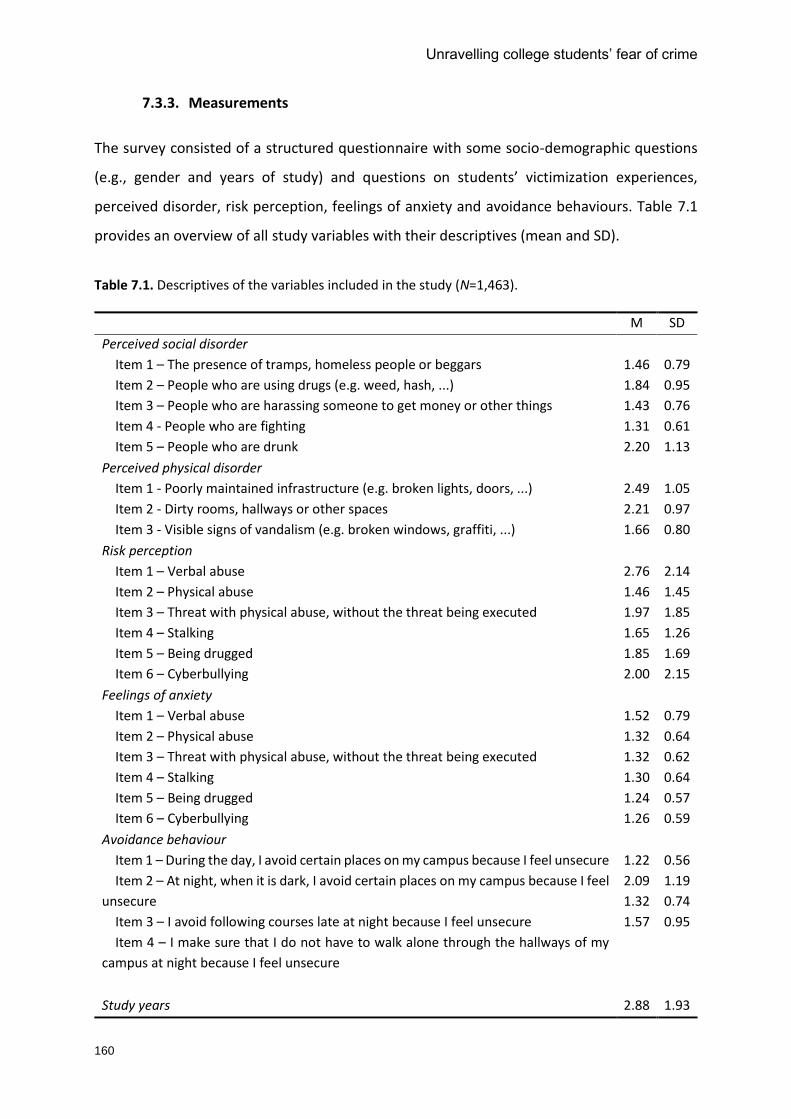
Unravelling college students’ fear of crime
160
7.3.3. Measurements
The survey consisted of a structured questionnaire with some socio-demographic questions
(e.g., gender and years of study) and questions on students’ victimization experiences,
perceived disorder, risk perception, feelings of anxiety and avoidance behaviours. Table 7.1
provides an overview of all study variables with their descriptives (mean and SD).
Table 7.1. Descriptives of the variables included in the study (N=1,463).
M SD
Perceived social disorder
Item 1 – The presence of tramps, homeless people or beggars
Item 2 – People who are using drugs (e.g. weed, hash, ...)
Item 3 – People who are harassing someone to get money or other things
Item 4 - People who are fighting
Item 5 – People who are drunk
1.46
1.84
1.43
1.31
2.20
0.79
0.95
0.76
0.61
1.13
Perceived physical disorder
Item 1 - Poorly maintained infrastructure (e.g. broken lights, doors, ...)
Item 2 - Dirty rooms, hallways or other spaces
Item 3 - Visible signs of vandalism (e.g. broken windows, graffiti, ...)
2.49
2.21
1.66
1.05
0.97
0.80
Risk perception
Item 1 – Verbal abuse
Item 2 – Physical abuse
Item 3 – Threat with physical abuse, without the threat being executed
Item 4 – Stalking
Item 5 – Being drugged
Item 6 – Cyberbullying
2.76
1.46
1.97
1.65
1.85
2.00
2.14
1.45
1.85
1.26
1.69
2.15
Feelings of anxiety
Item 1 – Verbal abuse
Item 2 – Physical abuse
Item 3 – Threat with physical abuse, without the threat being executed
Item 4 – Stalking
Item 5 – Being drugged
Item 6 – Cyberbullying
1.52
1.32
1.32
1.30
1.24
1.26
0.79
0.64
0.62
0.64
0.57
0.59
Avoidance behaviour
Item 1 – During the day, I avoid certain places on my campus because I feel unsecure
Item 2 – At night, when it is dark, I avoid certain places on my campus because I feel
unsecure
Item 3 – I avoid following courses late at night because I feel unsecure
Item 4 – I make sure that I do not have to walk alone through the hallways of my
campus at night because I feel unsecure
1.22
2.09
1.32
1.57
0.56
1.19
0.74
0.95
Study years 2.88 1.93
Unravelling college students’ fear of crime
161
7.3.3.1. Perceived social disorder
Similar to the study of Pauwels and Hardyns (2009) which focuses on communities,
respondents were asked how often they noticed some problematic social situations on the
campus where they were most present on and in the streets that give direct access to this
campus. Five items were measured (e.g., “people who are using drugs”) and responses were
made using a five-point Likert scale, ranging from (almost) never (=1) to (almost) often (=5).
The internal reliability proved to be good (α=0.78).
7.3.3.2. Perceived physical disorder
Again, similar to the study of Pauwels and Hardyns (2009), perceived physical disorder was
measured by asking the students were how often they have noticed physical disorder on the
campus where they are most present on and in the streets that give access to this campus.
The scale consists of three items (e.g., “visible signs of vandalism (broken windows, doors,
…)”). Each item was scored on a five-point Likert scale, ranging from (almost) never (=1) to
(almost) often (=5). Reliability analysis indicated that the scale has a Cronbach’s alpha of 0.71.
7.3.3.3. Risk perception
Based on the study of Ferraro (1996), respondents were asked to give an estimation of the
chance that they could become a victim on campus they were most present on or in the direct
neighbourhood of this campus within the next 12 months. The risk perception scale consists
of six items (e.g., “stalking”). For each item, respondents had to indicate a number on a scale
from no probability (=0) to very high probability (=10). The internal reliability proved to be
good (α=0.89).
7.3.3.4. Feelings of anxiety
Based on the research of Farall and Gadd (2004), feelings of anxiety was measured by asking
respondents about the frequency of their feelings of anxiety for criminal victimization on
campus they were most present on or in the direct neighbourhood of this campus in the past
12 months. Six items were used (e.g., “verbal abuse”). Each item was scored on a five-point
Likert-scale, ranging from (almost) never (=1) to (almost) often (=5). Reliability analysis
indicated the scale has a Cronbach’s alpha of 0.86.

Unravelling college students’ fear of crime
162
7.3.3.5. Avoidance behaviour
To measure avoidance behaviour, students were asked to what extent they adapt their
behaviour on campus. The scale consists of five self-constructed items (e.g., “I avoid following
courses late at night because I feel unsecure”). Each item was scored on a five-point Likert
scale ranging from (almost) never (=1) to (almost) often (=5). Reliability analysis showed that
the avoidance behaviour scale was reliable (α=0.79).
7.3.3.6. Direct victimization
Similar to the studies of Ferraro (1996) and Fisher and Sloan (2003) students were asked about
their previous experiences with personal victimization on campus in the past 12 months.
Responses were given by indicating ‘yes’ or ‘no’ on a selection of six types of crime (e.g., verbal
abuse). Furthermore, students had the possibility to indicate ‘other’ and fill in a criminal
offense that was not included in the list above.
7.3.3.7. Indirect victimization
To measure the impact of indirect victimization, students were asked if they knew any fellow
students who had been a victim of crime on campus in the past 12 months (Ferraro, 1996;
Fisher & Sloan, 2003). Similar to the previous question on direct victimization, respondents
had to indicate ‘yes’ or ‘no’ on a selection of six crimes (e.g., physical abuse) or had the option
to fill in another criminal offense.
7.3.4. Data analysis
To test the hypotheses, SEM was applied to the collected data using Mplus 8.4 to examine the
relationships between perceived disorder and the three dimensions of fear of crime (Muthén
& Muthén, 2017). The analyses were performed using the following approach. First, a
measurement model was built to test whether the observed variables reliably reflected the
hypothesized latent variables (i.e., perceived social disorder, perceived physical disorder, risk
perception, feelings of anxiety and avoidance behaviour). Thereafter, we estimated a
structural model with gender and years of study as covariates. The SEM results were obtained
with the maximum likelihood mean adjusted because preliminary tests suggested that
avoidance behaviour was a not normally distributed dependent variable.

Unravelling college students’ fear of crime
163
The model fits of the measurement and path models were evaluated according to several fit
indices. Given that the χ2 is almost always significant and not an adequate test of the model
fit (Brown, 2012; Kline 2016), we have also reported the comparative fit index (CFI), root mean
square error of approximation (RMSEA) , and the standardized root mean square residual
(SRMR) (Kline 2016). The CFI ranged from 0 to 1.00, with a cut-off of .95 or higher indicating
that the model provided a good fit and .90 indicating that the model provided an adequate fit
(Byrne, 2001; Hu & Bentler, 1999). RMSEA values below .05 indicated a good model fit, and
values from .06 to .08 indicated an adequate fit (Ponnet, 2014). The SRMR consisted of a
standardized summary of the average covariance residuals (Kline, 2011). A relatively good
model fit was indicated when the SRMR value was less than .08 ( Hu & Bentler, 1999).
7.4. Results
Table 7.2 displays the correlations between the research constructs used in the model. All
constructs were significantly positive related to each other.
Table 7.2. Correlations between the components of the research model.
1 2 3 4 5 6 7
1 Perceived social disorder -
2 Perceived physical disorder
0.331** -
3 Risk perception 0.374** 0.272** -
4 Feelings of anxiety 0.346** 0.204** 0.529** -
5 Avoidance behaviour 0.189** 0.197** 0.412** 0.455** -
6 Direct victimization 0.208** 0.079* 0.193** 0.213** 0.138** -
7 Indirect victimization 0.273** 0.128** 0.180** 0.224** 0.099* 0.311** -
Note. *p < .01; **p < .001 (N=1,463).
The measurement model provided an adequate fit for the data χ2(236)=1097.55, p<.001;
CFI=.918, RMSEA=.051, CI [.048,.054], SRMR=.056.). All factor loadings were significant and
above .56. The results of the structural model are presented in Figure 7.2. The results of the
fit statistics indicated an adequate model fit: χ2(318)=1390.81, p<.001; CFI=.91, RMSEA=.050,
CI [.047, .052] and SRMR=.052.
Our analyses revealed that feelings of anxiety, risk perception, perceived social and physical
disorder together with the covariates, explained 35.5% of the variance in avoidance

Unravelling college students’ fear of crime
164
behaviour. In addition, risk perception, perceived social and physical disorder together with
the covariates, accounted for 29.6% of the variance in feelings of anxiety. Perceived social and
physical disorder and the covariates accounted for 19.3% of the variance in students’ risk
perception.
The strongest predictors of students’ avoidance behaviour were feelings of anxiety (β=.24,
p<.001) and risk perception (β=.19, p<.001), followed by perceived physical disorder (β=.09,
p<.01). Unexpectedly, perceived social disorder (β=.05, p=.20) was not significantly related to
avoidance behaviour. These results indicate that students who perceive more physical
disorder, have a higher estimate of the risk of victimization, experience more feelings of
anxiety and show more avoidance behaviour. Students who perceive more social disorder at
their campus or in the direct neighbourhood of the campus do not adapt their behaviour.

Unravelling college students’ fear of crime
165
Figure 7.2. Full model of determinants of the three dimensions of fear of crime. Note: All reported coefficients are standardized values, adjusted for the
influence of covariates. Only significant associations are presented. *p < .01; **p < .001.
Unravelling college students’ fear of crime
166
Furthermore, the strongest determinants of students’ feelings of anxiety were risk perception
(β=.37, p <.001) and perceived social disorder (β=.25, p<.001). This indicates that students
who perceive more social disorder, have a higher risk perception and experience more feelings
of anxiety. Unexpectedly, no significant direct relationship was found between perceived
physical disorder (β=0.003, p=0.93) and feelings of anxiety, which indicates that students who
perceive more physical disorder do not experience higher levels of anxiety.
With regard to the gender and years of study, we found a significant relationship between
gender and avoidance behaviour (β=.37, p<.001), indicating that female students show
significantly more avoidance behaviour on campus in comparison to their male counterparts.
Unexpectedly, no significant associations were found between gender and risk perception or
feelings of anxiety. Furthermore, years of study was significantly related to perceived physical
disorder (β=.15, p<.001), indicating that students who have been studying at the university for
a longer time perceive more physical disorder on campus and in the direct neighbourhood of
the campus in comparison to students who have been a student at the university for a shorter
time. Years of study was not significantly associated with any other study variables.
7.5. Discussion
Crime and victimization on campuses is currently widely recognized not only as an educational
concern but also as a social issue. One of the effects of crime and victimization is fear, which
can have a considerable impact on the recruitment and the overall quality of the learning
environment (Fisher et al., 2010; Fisher & Sloan, 2013). To date, research on the determinants
of fear of crime mostly focused on demographic gender differences and other personal
characteristics, while limited efforts have been applied to understanding the influence of
environmental cues on students’ fear of crime. The present study has attempted to fill this
void by examining the influence of perceived social and physical disorder on the three
dimensions of fear of crime.
First of all, our findings suggest that a higher perception of physical disorder in combination
with a higher estimate of the risk of victimization and higher levels of anxiety lead to more
avoidance behaviour on campus. While we expected that both perceived physical and social
disorder would have an impact on students’ behaviour, no significant association was found
between the perception of social disorder and students’ avoidance behaviour. This indicates

Unravelling college students’ fear of crime
167
that students adapt their behaviour when they notice physical disorder on campus, such as
poorly maintained infrastructure or visible signs of vandalism. Secondly, the study suggests
that a higher perception of social disorder in combination with a higher estimate of the risk of
victimization increases students’ feelings of anxiety. This indicates that students’ feelings of
anxiety strengthen when they notice signs of social disorder in their environment, such as
drunk people or people fighting. No significant relationship was found between perceived
physical disorder and feelings of anxiety.
Secondly, two conclusions can be made regarding the role of the control variables which can
also be important for policy strategies. First, our study suggest that female students show
more avoidance behaviour in comparison to their male counterparts. Also, previous studies
have indicated that more female students adapt their behaviour, but that this is caused by the
fact that they experience higher levels of anxiety and estimated a higher risk of victimization.
Unexpectedly, no relation between gender and risk perception and feelings of anxiety was
found in our study. This indicates that both female and male students estimate similar levels
of risk perception and experience similar levels of anxiety, while mostly female students adapt
their behaviour to these cognitive and emotional experiences. Secondly, our study suggests
that the amount of years that a student studies at the university has an impact on his or her
perceived physical disorder. While previous research showed that older students or students
in a higher grade experienced more feelings of anxiety, this finding cannot be confirmed based
on our results.
7.6. Conclusions and recommendations
The above findings offer several implications for the different stakeholders who are involved
in campus security. First of all, it is indicated that fixing ‘the broken window’ is important to
reduce students’ feelings of anxiety and their responding behaviours. In order to reduce social
and physical disorder, many scholars have sought solutions in the neighbourhood setting and
have suggested collective efficacy (Scarborough et al., 2010). Collective efficacy consists of
individuals who have a strong tie to the community or neighbourhood. Research conducted
in communities has shown that residents of neighbourhoods with strong social cohesion and
collective efficacy are more likely to report lower levels of fear (Hardyns et al., 2018;
Scarborough et al., 2010). On college campuses every year incoming students start their

Unravelling college students’ fear of crime
168
academic career while a large group of older students leave the university and its campus
environment. Due to these transitions, forming strong social ties in neighbourhoods is not
totally comparable with creating collective efficacy on campus. However, many colleges and
universities have student associations, sport teams or other initiatives that unite students
which also gives them a platform where they can report concerns about their security on
campus.
On the other hand, social bonds do not necessarily have to be formed in order for problems
to be identified and addressed. Visible improvements in the campus area, such as planting
vegetation, implementing garbage cans or installing extra lighting could reduce social and
physical disorder (Woordward et al., 2016). Previous studies have showed that proper
landscaping, visibility and clean and well-kept areas increased students’ perceptions of
security on campus (Fernandez, 2005). Additionally, lower levels of crime prevention through
environmental design (CPTED) have found to be associated with higher levels of fear among
college students (Cozens & Sun 2018). Therefore, security stakeholders must be aware of the
opportunities of CPTED measures to decrease students’ fear of crime. Furthermore,
awareness campaigns can be used to encourage students and staff to keep the buildings of
the university clean or to report broken infrastructure or dirty classrooms. Making students
more aware of crime victimization on campus and its determinants has already been
suggested by many scholars (Jennings et al., 2007; Robinson & Roh, 2013; Sani et al., 2020).
Moreover, awareness campaigns have the advantage that they can often be easily
implemented, and they are rather inexpensive.
Finally, close cooperation with the police department and local authorities is recommended
in order to reduce the visible signs of disorder in the neighbourhood of the campus. In our
study, we asked students about their perception of disorder both on campus and in the direct
neighbourhood of the campus. This implies that not only the campus buildings but also the
areas around the campus may generate fear of crime. Despite the fact that areas bordering a
campus may actually considered no property of the university, students may have to travel
through these areas on their way to and from campus. Therefore, it should be the
responsibility of the university to initiate and maintain partnerships with local authorities.

Unravelling college students’ fear of crime
169
7.7. Limitations
Although we have uncovered a number of interesting findings, this study is not without
limitations. First, the data were obtained cross-sectional, which implies that it is not possible
to explore the long-term effect of the determinants on students’ fear of crime. For instance,
Hardyns et al. (2018) observed that disorder might influence feelings of fear over a period of
time. Other studies are needed in order to examine whether the determinants of students’
fear of crime varies across time. Furthermore, students were asked about their risk
perception, feelings of anxiety and avoidance behaviour in the next (risk perception) or past
12 months (feelings of anxiety and avoidance behaviour). While we limited this time frame on
purpose, memory bias may have influenced our findings. Moreover, as all data were collected
through self-reports, socially desirable answers could be given.
Secondly, the participants of the current study represent a self-selected sample of the
targeted population, which is a non-random selection. Unfortunately, the researchers could
not control for the self-selection process that comes with this voluntary, online survey. This
implies that the results cannot be extrapolated in any statistically of mathematically
meaningful way to the entire student population. Therefore, it is unknown how the
participants compare to other students who did not fill in the questionnaire. Although
previous research showed that self-selection does not necessarily bias the results of surveys
used in campus studies (Brown et al., 2014; Rosenthal & Freyd, 2018), this limitation should
be considered. Additionally, while a 10% response rate for online surveys is generally
considered acceptable, the current study is characterized by a relatively low response rate.
Reasons for this low response date could be factors such as the over-surveying of students at
the end of the academic year, students’ perception that the topic is irrelevant or students’
lack of time. Although the current study consists of an adequate sample, this limitation should
be kept in mind when interpreting the results.
Thirdly, as our data was obtained from students from one university, caution is needed to
generalize the results to other universities. The university’s structure and security policy can
have a substantial impact on the results. In the current study, a survey was conducted at a
university which consists of four main campuses that are characterized by an open structure
and have direct access to the public space. However, not all university campuses have these

Unravelling college students’ fear of crime
170
open-access character. Consider for instance college campuses where all buildings and
student accommodation are located on one central location, well demarcated from public
space. The university’s characteristics often depend on the country where it is located.
Scholars already stated that the conclusions from the large body of scientific research on
students’ fear of crime on American campuses cannot be extrapolated to European
universities (Sani et al. 2020). This indicates that caution is needed when adapting the
conclusions from the current study to universities within another country or continent. To
date, studies on fear of crime among students of European universities are rather scare.
Finally, one should be careful to generalize the conclusions to the entire university population,
which also include other groups such as faculty or professors. Previous research has stated
that college students have unique characteristics which may not necessarily coincide with
those of the larger community (Lee & Hilinski-Rosick, 2012). Therefore, it is important that
further research gathers data from other college campuses and different groups of the
university community. The findings and recommendations of the current study should be
interpreted with caution given the generalizability concerns.
Despite these limitations, this study adds a valuable contribution to the research on fear of
crime among college students. To date, there is a lack of current research on the impact of
environmental cues on fear of crime on campus in general and more specific in a non-
American context. Further research needs to be completed to examine whether the physical
environment of the campus and the surrounding areas play any role in students’ risk
perceptions, feelings of anxiety and avoidance behaviour on campus.

Unravelling college students’ fear of crime
171
7.8. References
Alvarez, A., & Bachman, R. (1997). Predicting Fear of Assault at School and while going to and
from School in an Adolescent Population. Violence and victims, 12(1), 69-86.
Austin, D. M., Furr, L. A., &Spine, M. (2002). The Effects of Neighbourhood Conditions on
Perceptions of Safety. Journal of Criminal Justice, 30, 417–427.
Barberet, R., &Fisher, B. S. (2009). Can security beget insecurity? Security and Crime
Prevention Awareness and Fear of Burglary among University Students in the East
Midlands. Security Journal, 22(1), 3-23.
Baum, B. K., & Klaus, P. (2005). National Crime Victimization Survey: Violent victimization of
College Students, 1995–2002. Washington, DC: Bureau of Justice Statistics.
Bedenbaugh, C. P. (2003). Measuring Fear of Crime on Campus: a Study of an Urban University.
Bohmer, C. & Parrot, A. (1993). Sexual Assault on Campus: The Problem and the
Solution. Lexington Books.
Brown, T. (2006). Confirmatory Factor analysis for Applied Research. New York: The Guilford
Press.
Brown, S.L. & Andy, M. M. (2007). Risk Perception, Fuzzy Representations and Comparative
Optimism. British Journal of Psychology, 98, 575-578.
Brown, C. F., Demaray, M. K., & Secord, S. M. (2014). Cyber victimization in middle school and
relations to social emotional outcomes. Computers in human behavior, 35, 12-21.
Byrne, B. (2001). Structural Equation Modeling with Amos: Basic concepts, applications and
programming. Erlbaum.
Cook, C. L., & Fox, K. A. (2011). Fear of Property Crime: Examining the Effects of Victimization,
Vicarious Victimization, and Perceived Risk. Violence and Victims, 26(5), 684-700.
Cozens, P., & Sun, M. Y. (2018). Exploring Crime Prevention Through Environmental Design
(CPTED) and Students’ Fear of Crime at an Australian University Campus using Prospect
and Refuge Theory. Property Management 37(2), 287–306.

Unravelling college students’ fear of crime
172
del Carmen, A., Polk, O. E., Segal, C., & Bing, R. L. (2000). Fear of Crime on Campus: Examining
Fear Variables of CRCJ Majors and Nonmajors in Pre- and Post-serious Crime
Environments, Journal of Security Administration, 23, 21-36.
Dull, R. T., & Wint, A. V. (1997). Criminal Victimization and its Effect on Fear of Crime and
Justice Attitudes. Journal of Interpersonal Violence, 12(5), 748-758.
Federale Politie (2019). Criminaliteitsstatistieken.
http://www.stat.policefederale.be/criminaliteitsstatistieken/interactief/tabel-per-
politiezone/
Fernandez, M. F. (2005). Crime Prevention and the Perception of Safety in Campus
Design [Doctoral dissertation].
https://digitalcommons.lsu.edu/gradschool_theses/1483
Ferraro, K. F. (1995). Fear of crime: Interpreting Victimization Risk. New York State University
of New York Press.
Ferraro (1996). Women’s Fear of Victimization: Shadow of Sexual Assault? Social
Forces, 75(2), 667-690.
Ferraro, K. F., & LaGrange, R. L. (1987). The Measurement of Fear of Crime. Sociological
Inquiry, 57, 70-101.
Fisher, B. S. (1995). Crime and Fear on Campus. The Annals of the American Academy of
Political and Social Science, 539(1), 85-101.
Fisher, B. S., & May, D. (2009). College Students' Crime-Related Fears on Campus: Are Fear-
Provoking Cues Gendered?. Journal of Contemporary Criminal Justice, 25(3), 300-321.
Fisher, B. S., Daigle, L. E., & Cullen, F. T. (2010). Unsafe in the Ivory Tower: The Sexual
Victimization of College Women. Sage.
Fisher, B. S., & Sloan, J. J. (2003). Unravelling the Fear of Victimization among College Women:
Is the “Shadow of Sexual Assault Hypothesis” supported? Justice Quarterly, 20(3), 633-
659.
Fisher, B. S., & Sloan, J. J., III (2013). Campus Crime: Legal, Social, & Policy Perspectives (3d
ed.). Charles C. Thomas Publisher, LTD.

Unravelling college students’ fear of crime
173
Fisher, B. S., & Wilkes, A. R. P. (2003). A tale of two ivory towers. A comparative analysis of
victimization rates and risks between university students in the United States and
England. British Journal of Criminology, 43(3), 526–545
Franklin, T. W., Franklin, C. A., & Fearn, N. E. (2008). A Multilevel Analysis of the Vulnerability,
Disorder, and Social Integration Models of Fear of Crime. Social Justice Research, 21,
204-227.
Fox, K. A., Nobles, M. R., & Piquero, A. R. (2009). Gender, Crime Victimization and Fear of
Crime. Security Journal, 22(1), 24-39.
Gomme, I., & Micucci, A. (1997). Loose connections: Crime and policing on the university
campus. The Canadian Journal of Higher Education, 27(1), 41-68.
Hardyns, W. & Pauwels, L. (2010). Different Measures of Fear of Crime and Survey
Measurement Error. In: M. Cools, B. De Ruyver, M. Easton, L. Pauwels, P. Ponsaers, G.
Vande Walle, T. Vander Beken, F. Vander Laenen, G. Vermeulen & G. Vynckier (Eds.),
Governance of Security Research Papers Series III, New Empirical Data, Theories and
Analyses on Safety, Societal Problems and Citizens’ Perceptions (pp. 19–39). Maklu.
Hardyns, W., Pauwels, L.J.R., & Heylen, B. (2018). Within-individual Change in Social Support,
Perceived Collective Efficacy, Perceived Disorder and Fear of Crime: Results from a
Two-wave Panel Study. British Journal of Criminology, 58(5), 1254-1270.
Hardyns, W., Snaphaan, T., Pauwels, L. J., Vyncke, V., & Willems, S. (2019). A Multilevel
Analysis of Collective Efficacy, Neighbourhood Disorder, and Individual Social Capital
on Avoidance Behavior. Crime & Delinquency, 65(7), 994-1021
Hart, T. C. (2003). National Crime Victimization Survey, 1995–2000: Violent Victimization of
College Students. Washington, DC: Bureau of Justice Statistics.
Hibdon, J., Schafer, J., Lee, C., & Summers, M. (2016). Avoidance Behaviours in Campus
Residential Environment. Criminology, Criminal Justice, Law & Society, 17(3), 74-89.
Hu, L., & Bentler, P. (1999). Cutof Criteria for Fit Indexes in Covariance Structure Analysis:
Conventional Criteria versus new Alternatives. Structural Equation Modeling, 6, 1–55.
Huesman Jr, R., Brown, A. K., Lee, G., Kellogg, J. P., & Radcliffe, P. M. (2009). Gym bags and

Unravelling college students’ fear of crime
174
mortarboards: Is use of campus recreation facilities related to student success? NASPA
Journal, 46(1), 50-71.
Janosik, S. M., & Gehring, D. D. (2003). The impact of the Clery Campus Crime Disclosure Act
on
student behavior. Journal of College Student Development, 44(1), 81-91.
Jennings, W. G., Gover, A. R., & Pudrzynska, D. (2007). Are Institutions of Higher Learning Safe?
A Descriptive Study of Campus Safety Issues and Self‐Reported Campus Victimization
among Male and Female College Students. Journal of Criminal Justice Education, 18(2),
191-208.
Kaminski, R. J., Koons-Witt, B. A., Thompson, N. S., & Weiss, D. (2010). The Impacts of the
Virginia Tech and Northern Illinois University Shootings on Fear of Crime on
Campus. Journal of Criminal Justice, 38(1), 88-98.
Klein, L., & Martin, S. L. (2019). Sexual harassment of college and university students: a
systematic review. Trauma, Violence, & Abuse, 1-16.
Kline, R. B. (2016). Principles and Practice of Structural Equation Modeling. Guilford
publications.
Lee, D. R., and Hilinski-Rosick, C. M. (2012). The Role of Lifestyle and Personal Characteristics
on Fear of Victimization among University Students. American Journal of Criminal
Justice, 37(4), 647-668.
Lokale Politie Antwerpen (2019). Stad in cijfers: databank.
https://stadincijfers.antwerpen.be/databank/
Maier, S. L., and DePrince, B. T. (2020). College students’ Fear of Crime and Perception of
Safety: The Influence of Personal and University Prevention Measures. Journal of
Criminal Justice Education, 31(1), 63-81.
Mansour, N., & Sloan, J. J. (1992). Campus Crime and Campus Communities: Theoretical and
Empirical Linkages [Paper presentation]. Annual Meetings of the Academy of Criminal
Justice Sciences. Birmingham AL, United States.

Unravelling college students’ fear of crime
175
May D.C., &Dunaway, R.G. (2000). Predictors of Fear of Criminal Victimization at School
Among Adolescents, Sociological Spectrum, 20, 149 – 168 .
May, D. C., Rader, N. E., & Goodrum, S. (2010). A Gendered Assessment of the ‘‘Threat of
Victimization’’: Examining Gender Differences in Fear of Crime, Perceived Risk,
Avoidance, and Defensive Behaviours. Criminal justice review, 35(2), 159-182.
McCormick, N., Nadeau, R., Provost, J., Gaeddert, W., & Sabo, A. (1996). Feelings of Safety,
Fears, and Knowledge and the Use of Public Safety Resources, Campus Law
Enforcement Journal, 26(3),15–18.
McCreedy, K. R., & Dennis, B. G. (1996). Sex-Related Offenses and Fear of Crime on Campus.
Journal of Contemporary Criminal Justice, 12, 69-80.
McDevitt, J., & Panniello, J. (2005). National Assessment of the School Resource Officer
Programs: Survey of Students in Three Large New SRO Programs. National Institute of
Justice final report. http://www.ncjrs.gov/pdffiles1/nij/grants/209270.pdf
Muthén, L., & Muthén, B. (2017). Mplus User’s Guide. Version 8.0. Muthén & Muthén.
Paulson, A., & Scherer, R. (2007). How Safe are College Campuses. Christian Science Monitor,
18(1).
Pauwels, L., & Hardyns, W. (2009). Measuring Community (dis)Organizational Processes
through Key Informant Analysis. European Journal of Criminology, 6(5), 401-417.
Patton, R. C., & Gregory, D. E. (2014). Perceptions of Safety by On-campus Location, Rurality,
and Type of Security/Police Force: The Case of the Community College. Journal of
college student development, 55(5), 451-460.
Petherick, N. (2000). Environmental Design and Fear: the Prospect-Refuge Model and the
University College of the Cariboo Campus. Western Geography, 10(11), 89-112.
Ponnet, K. (2014). Financial Stress, Parent Functioning and Adolescent Problem Behavior: An
actor–Partner Interdependence Approach to Family Stress Processes in Low-, Middle,
and High-Income Families. Journal of youth and adolescence, 43(10), 1752-1769.
Poplin, D.E. (1979). Communities: A Survey of Theories and Methods of Research. Macmillan.

Unravelling college students’ fear of crime
176
Rader, N.E., May, D.C., & Goodrum, S. (2007). An Empirical Assessment of the “Threat of
Victimization:” Considering Fear of Crime, Perceived Risk, Avoidance, and Defensive
Behaviours. Sociological Spectrum, 27(5), 475-505.
Rasmussen, C., & Johnson, G. (2008). The Ripple Effect of Virginia Tech: Assessing the
Nationwide Impact on Campus Safety and Security Policy and Practice. Midwestern
Higher Education Compact.
Reid, L.W. & Konrad, M. (2004). The Gender Gap in Fear: Assessing the Interactive Effects of
Gender and Perceived Risk on Fear of Crime, Sociological Spectrum, 24, 399 – 425.
Robinson, M. B., & Mullen, K. L. (2001). Crime on Campus: A Survey of Space Users. Crime
Prevention and Community Safety, 3(4), 33-46.
Robinson, M., & Roh, S. (2013). Crime on Campus: Spatial Aspects of Crime at a Regional
Comprehensive University. In B. Fisher & J. Sloan (Eds.), Campus crime: Legal, social,
and policy perspectives (3rd ed., pp. 261–286). C.C. Thomas.
Rosenthal, M. N., & Freyd, J. J. (2018). Sexual violence on campus: No evidence that studies
are biased due to self-selection. Dignity: A Journal on Sexual Exploitation and
Violence, 3(1), 7.
Rountree, P.W., & Land, K.C. (1996). Perceived Risk Versus Fear of Crime: Empirical Evidence
of Conceptually Distinct Reactions in Survey Data. Social Forces 74(4), 1353–76.
Sampson, R.J. & Raudenbush, S.W. (2004). Seeing Disorder: Neighborhood Stigma and the
Social Construction of “Broken Windows”. Social Psychology Quarterly, 67, 319-342.
Sani, A., Nunes, L. M., Azevedo, V., & Sousa, H. F. (2020). Campus Criminal Victimization among
Higher Education Students: A Diagnosis of Local Security in Porto. Journal of Criminal
Justice Education, 31(2), 250-266.
Scarborough, B.K., Like-Haislip, T.Z., Novak, K.J., Lucas, W.L., & Alarid, L.F. (2010). Assessing
the Relationship between Individual Characteristics, Neighbourhood Context, and Fear
of Crime. Journal of Criminal Justice, 38(4), 819-826.

Unravelling college students’ fear of crime
177
Shariati, A., & Guerette, R. T. (2019). Resident Students’ Perception of Safety in On-Campus
Residential Facilities: Does Crime Prevention through Environmental Design (CPTED)
Make a Difference?, Journal of school violence, 18(4), 570-584.
Schreck, C. J., & Miller, J. M. (2003). Sources of Fear of Crime at School: What is the Relative
Contribution of Disorder, Individual Characteristics, and School Security? Journal of
School Violence, 2(4), 57–79.
Skogan, W. G., & Maxfield, M. G. (1981). Coping with Crime: Individual and Neighborhood
Differences. Beverly Hills, CA: Sage.
Sloan, J., Fisher, B., & Wilkins, D.L. (1995). Fear of Crime and Perceived Risk of Victimization
on Campus: A Test of Theoretical Models. In Fisher, B., & Sloan, J. (Eds.). Campus crime:
Legal, social, and policy perspectives (pp. 189-256). Springfield, IL: Charles C. Thomas.
Sloan, J. J., Fisher, B. S., & Wilkins, D. L. (1996). Reducing Perceived Risk and Fear of
Victimization on Campus: A Panel Study of Faculty Members, Staff, and Students.
Journal of Contemporary Criminal Justice, 12(1), 81-102.
Steinmetz, N. M., & Austin, D. M. (2013). Fear of Criminal Victimization on a College Campus:
A Visual and Survey Analysis of Location and Demographic Factors. American Journal
of Criminal Justice, 39(3), 511-537.
Tewksbury, R., & Mustaine, E. E. (2003). College Students' Lifestyles and Self-Protective
Behaviours: Further Considerations of the Guardianship Concept in Routine Activity
Theory. Criminal Justice and Behavior, 30(3), 302-327.
Tomsich, E. A., Gover, A. R., & Jennings, W. G. (2011). Examining the Role of Gender in the
Prevalence of Campus Victimization, Perceptions of Fear and Risk of Crime, and the
Use of Constrained Behaviours among College Students attending a Large Urban
University. Journal of Criminal Justice Education, 22(2), 181–202.
Warr, M. (2000). Fear of Crime in the United States: Avenues for Research and
Policy. (pp. 451 – 490) in: Measurement and Analysis of Crime and Justice: Crime
Justice, vol. 4, edited by David Duffee. Washington, DC: Department of Justice.

Unravelling college students’ fear of crime
178
Warr, M., & Stafford, M. (1983). Fear of Victimization: A Look at the Proximate Causes, Social
Forces, 61 (4),1033 – 1043.
Wilcox, P., Jordan, C. E., & Pritchard, A. J. (2007). A Multidimensional Examination of Campus
Safety Victimization, Perceptions of Danger, Worry about Crime, and Precautionary
Behavior among College Women in the Post-Cleary Era, Crime Delinquency, 53(2), 219-
254.
Wilson, J.Q., & Kelling, G.L. (1982). Police and Neighbourhood Safety: Broken windows,
Atlantic Monthly, 29-38.
Wilson, J. Q., and Kelling, G. L. (2003). Broken Windows: The Police and Neighbourhood Safety.
Criminological perspectives: essential readings, 400.
Woodward, V. H., Pelletier, D., Griffin, O. H., & Harrington, J. R. (2016). University Policies and
Programs for Crime Prevention and Awareness: An Examination of Online Reports and
Resources. Criminal Justice Review, 41, 140–158.
Woolnough, A. D. (2009). Fear of Crime on Campus: Gender Differences in Use of Self-
Protective Behaviours at an Urban University. Security Journal, 22, 40-55.


Relationship between CPTED and fear of crime
180
CHAPTER 8
The relationship between crime prevention through environmental design
(CPTED) and fear of crime: A multi-method approach in four university
campus neighbourhoods
The present study focuses on the relationship between prevention through environmental
design (CPTED) and fear of crime on higher educational institutions. A multi-method approach
was carried out, combining a survey among students (N=1,463), a survey among staff
members (N=1,443) and systematic social observations (N=406) in four campus
neighbourhoods. Based on an evaluation of the presence of five CPTED principles (surveillance,
access control, territoriality, maintenance and Activity support), the relationship of the built
environment on students’ and staff members’ fear of crime on campus was examined. The
results show that CPTED principles territoriality, access control and maintenance were most
related to students’ and staff members’ fear of crime on campus. Although the presence of
physical and social disorder was also associated with students’ fear of crime, these phenomena
were less related to staff members’ fear of crime. Taking this into account, this study offers
valuable insights for higher educational institutions that have the aim to create a secure
environment. Both the implementation of CPTED measures and disorder limiting measures can
be recommended to reduce fear of crime among students and staff members.
This chapter is based on:
Sas, M., Ponnet, K., & Hardyns, W. (in review). The relationship between crime prevention
through environmental design (CPTED) and fear of crime: A multi-method approach in four
university campus neighbourhoods.

Relationship between CPTED and fear of crime
181
8.1. Introduction
Over the years, several approaches have been put forward to reduce crime in
neighbourhoods. Since the 1970s, Crime Prevention Through Environmental Design (CPTED)
has become one of the most popular urban planning strategies for improving neighbourhood’s
security. Based on the assumption that human behaviour can be influenced by the
surrounding environment, CPTED aims to prevent and reduce crime by the implementation of
proper architecture design and a modification of the physical features of the environment
(Cozens et al., 2005). The CPTED approach proposes the implementation of five key principles
for the reduction of crime: surveillance, access control, territoriality, maintenance and activity
support (Jeffery, 2971).
The concept surveillance starts from the assumption that crime is less likely to occur as deviant
behaviour can be noticed and reported more easily. It involves the implementation of
mechanical surveillance, such as CCTV, or formal and natural surveillance, such as the
presence of police patrols or residents, to maximize visibility (Reynald, 2011). Access control
focuses on the reduction of opportunities for crime by limiting the access to potential targets
and creating a high perception of risk to offenders. Both the implementation of symbolic and
real barriers should deter criminal behaviour (Newman, 1972; Shariati & Guerette, 2020).
Territoriality involves the creation of visual cues in the built environment to develop clear and
discrete spaces. Examples are the use of plants, low walls or other landscaping conventions.
The personalization of environmental spaces creates a sense of belonging and ownership
among residents which could serve as an effective deterrent to potential crimes (Brower et
al., 1983; Cozens & Sun, 2019). Maintenance refers to the absence of physical and social
incivilities and arose from the broken windows theory of Wilson and Kelling (1982), which
assumed that that norm‐setting and signalling can impact social behaviour. Visible incivilities,
such as physical disorder (e.g., litter, graffiti) or social disorder (e.g., the presence of drunk
people or people fighting) are considered as important predictors of crime. To prevent crime,
streets and properties should be maintained to create a perceived image of civility (Gau &
Pratt, 2010). The concept activity support starts from the assumption that crime can be
reduced in environments where a variety of activities continuously take place and attract
people. Places such as bars, parks or shops increase social activity and improve both natural
surveillance and territoriality (Jacobs, 2016).

Relationship between CPTED and fear of crime
182
While the impact of CPTED on inducing or hindering crime has been studied multiple times in
recent years (Armitage, 2000; Casteel & Peek-Asa, 2000; Teedon et al., 2010), research has
only begun to empirically examine the extent to which the built environment is associated
with people’s fear of crime (Cozens & Sun, 2019; Lee et al., 2016). Generally, fear of crime can
be seen as a complex phenomenon that involves three dimensions: a cognitive dimension, or
the perceived risk of victimization, an emotional dimension, or the feelings of anxiety and an
expressive dimension, or the behavioural outcomes of feelings of fear (Hardyns & Pauwels,
2010; LaGrange & Ferraro, 1987). Over time, the impact of individual factors, such as age or
gender, have often been related to people’s fear of crime in previous research (Fox et al.,
2009; Pain, 2001).
Although a few studies have assessed the impact of contextual factors, such as socio-structural
characteristics (e.g., Brunton‐Smith & Sturgis, 2011; Vauclair & Bratanova, 2017), social
processes (e.g., Hardyns et al., 2018; Scarborough et al., 2010) or disorder (e.g., Doran & Lees,
2005; Kohm, 2009) on fear of crime, the impact of the architectural design on the three
dimensions of fear of crime can still be considered as insufficiently researched. Moreover, the
limited amount of studies that examined the impact of the CPTED approach on fear of crime
has shown mixed results. While some studies found a positive impact of CPTED modifications
on people’s fear of crime (Armitage & Monchuk, 2011; Cozens & Tarca, 2016; Tseng et al.,
2004), other studies showed no statistical relationships between the two concepts (Caughy et
al., 2001; Minnery & Lim, 2005).
To provide further insights on this topic, this study uses a multi-method approach, combining
surveys and systematic social observations (SSO). Data collected from two large-scale surveys
unravel people’s fear of crime. SSO are applied in this study to examine the presence of CPTED.
Over time, SSO by trained observers has become a cornerstone of neighbourhood-level
research, particularly for measuring physical characteristics of the built environment, given
the disparities in perceptual and observed measures of these phenomena (Hinkle & Yang,
2014; Hoeben et al., 2018). While SSO eliminates some of the restrictions of conducting
surveys, such as socially desirable answers or interviewer effects, some concerns arise when
conducting observations within a specific neighbourhood (Gracia & Herrero, 2007). For
instance, travel costs and human resources of researchers who have to move to the study area
could be very high (Rundle et al., 2011) and carrying out research in less secure

Relationship between CPTED and fear of crime
183
neighbourhoods could create danger and fear of crime among raters (Griew et al., 2013).
These concerns have let to more innovative techniques to conduct research in neighbourhood
settings. One of these new approaches is the utilization of virtual instead of physical SSO, often
carried out by using Google Street View (GSV).
In this study a combination of three SSO methods is applied: in-situ observations, observations
via original photographs and observations by means of GSV images. All observations were
carried out in the neighbourhood of the four campuses of the University of Antwerp in
Belgium. Additionally, one survey was conducted among students and one survey was
conducted among staff members of this university. By making use of this multi-method
approach, it is the aim of this study to provide more insight in the relationship between CPTED
and fear of crime. In the following paragraphs, details about the used methodological
approach will be presented, followed by a discussion of the results. The article will end with
some concluding remarks and recommendations for both practitioners and future research.
8.2. Methodology
8.2.1. Study area
The study was conducted in four neighbourhoods of the University of Antwerp in Belgium (see
Figure 8.1). The university consists of nine faculties, which are spread among four main
campuses. While one campus is located in the centre of the city (Campus 1), the other three
campuses are situated in a more rural environment at the outskirts of the city centre. Campus
1 consists of five main buildings, which are all located within the same neighbourhood. The
buildings house offices where staff members work, auditoriums where students can follow
classes and some student facilities, such as a restaurant. The headquarters of the university
are located on Campus 2. The campus is adjacent to one of the five main hospitals of Antwerp
and is also surrounded by a large city park. In addition to offices and auditoriums, the campus
also consists of a fitness centre. Campus 3 is located furthest from the city centre and is
surrounded by greenery. The university hospital is located right next to this campus. Campus
4 is located close to Campus 2 and is adjacent to a large city park. In 2016, a completely new
building was constructed to house the Faculty of Applied Engineering Sciences. All campuses
are open to the public and are directly accessible by public roads. At the time the study was
carried out, the university enrolled 21,095 students and 5,924 staff members.
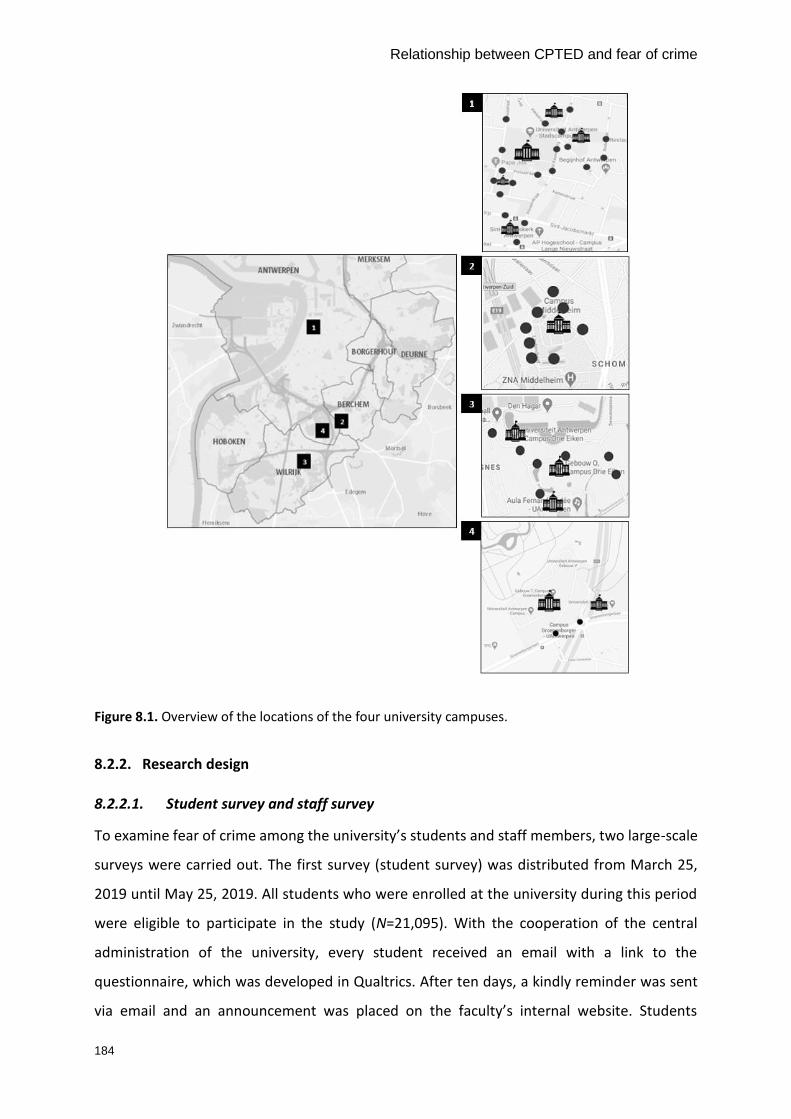
Relationship between CPTED and fear of crime
184
Figure 8.1. Overview of the locations of the four university campuses.
8.2.2. Research design
8.2.2.1. Student survey and staff survey
To examine fear of crime among the university’s students and staff members, two large-scale
surveys were carried out. The first survey (student survey) was distributed from March 25,
2019 until May 25, 2019. All students who were enrolled at the university during this period
were eligible to participate in the study (N=21,095). With the cooperation of the central
administration of the university, every student received an email with a link to the
questionnaire, which was developed in Qualtrics. After ten days, a kindly reminder was sent
via email and an announcement was placed on the faculty’s internal website. Students
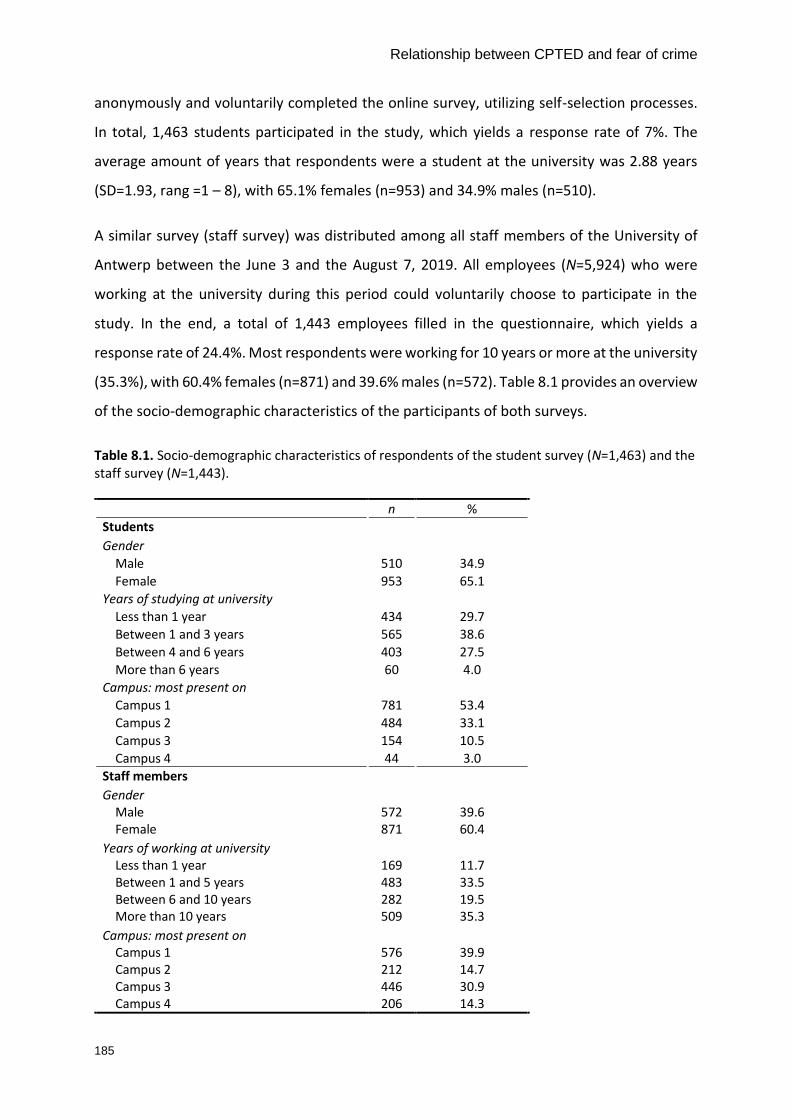
Relationship between CPTED and fear of crime
185
anonymously and voluntarily completed the online survey, utilizing self-selection processes.
In total, 1,463 students participated in the study, which yields a response rate of 7%. The
average amount of years that respondents were a student at the university was 2.88 years
(SD=1.93, rang =1 – 8), with 65.1% females (n=953) and 34.9% males (n=510).
A similar survey (staff survey) was distributed among all staff members of the University of
Antwerp between the June 3 and the August 7, 2019. All employees (N=5,924) who were
working at the university during this period could voluntarily choose to participate in the
study. In the end, a total of 1,443 employees filled in the questionnaire, which yields a
response rate of 24.4%. Most respondents were working for 10 years or more at the university
(35.3%), with 60.4% females (n=871) and 39.6% males (n=572). Table 8.1 provides an overview
of the socio-demographic characteristics of the participants of both surveys.
Table 8.1. Socio-demographic characteristics of respondents of the student survey (N=1,463) and the staff survey (N=1,443).
n %
Students
Gender
Male 510 34.9
Female 953 65.1
Years of studying at university
Less than 1 year 434 29.7
Between 1 and 3 years 565 38.6
Between 4 and 6 years 403 27.5
More than 6 years 60 4.0
Campus: most present on
Campus 1 781 53.4
Campus 2 484 33.1
Campus 3 154 10.5
Campus 4 44 3.0
Staff members
Gender Male Female
572 871
39.6 60.4
Years of working at university Less than 1 year Between 1 and 5 years Between 6 and 10 years More than 10 years
169 483 282 509
11.7 33.5 19.5 35.3
Campus: most present on Campus 1 Campus 2 Campus 3 Campus 4
576 212 446 206
39.9 14.7 30.9 14.3

Relationship between CPTED and fear of crime
186
In addition to the socio-demographic questions, students and staff members were asked to
fill in the campus where they were most present on. They received the instruction that they
had to fill in the whole survey keeping in mind this campus. Most students and staff members
indicated that they were most present on Campus 1 (53.4%; n=781 and 39.9%; n=576
respectively). Additionally, related to the research of Ferraro (1996), the survey contained
questions about the three dimensions of fear of crime (i.e., cognitive, emotional and
behavioural dimension). The cognitive dimension, or the perceived risk of victimization, was
measured by asking the respondents to provide an estimation of the chance that they could
become a victim of crime on or in the neighbourhood of the campus within the next 12
months. A selection of six crimes (verbal aggressive behaviour, physical aggressive behaviour,
threat with physical abuse without the threat being executed, verbally getting bothered for
sexual reasons, physically undesirable sexual behaviour, stalking) was presented to the
students and staff members. For each of the crimes, respondents had to indicate a number
on a scale from 0 (no probability) to 10 (very high probability).
Related to the research of Farrall and Gadd (2004), the emotional dimension of fear of crime,
or respondent’s feelings of anxiety, was measured by asking them about the frequency of their
anxious feelings regarding criminal offenses on and in the neighbourhood of the campus.
Respondents were asked if they had fearful experiences in the past 12 months with regard to
the same six types of crime as asked in the previous question. Responses were scored using a
Likert-scale, with answers ranging from 1 (=(almost) never) to 5 (=(almost) often).
Respondent’s behavioural dimension of fear of crime, or their avoidance behaviour on or in
the neighbourhood of the campus, was measured by asking them if they sometimes avoided
places or activities in reaction to their feelings of anxiety (e.g., ‘I avoid following courses late
at night because I feel unsecure’). Four items were scored using a 5-point Likert scale ranging
from 1 (=(almost) never to 5 (=(almost) often). The descriptive statistics of both surveys are
presented in Table 8.2.

Relationship between CPTED and fear of crime
187
Table 8.2. Descriptive statistics of key variables of student survey and staff survey.
Total
Variables α N Overall mean (SD)
Min. Max. Campus 1 Mean (SD)
Campus 2 Mean (SD)
Campus 3 Mean (SD)
Campus 4 Mean (SD)
Student survey
Risk perception
.89 1408 2.07 (1.61)
0 10 2.27 (1.62)
1.90 (1.58)
1.72 (1.54)
1.67 (1.52)
Feelings of anxiety
.86 1395 1.44 (.59)
1 5 1.50 (.60)
1.39 (.58)
1.35 (.58)
1.27 (.42)
Avoidance behaviour
.79 1391 1.55 (.70)
1 5 1.53 (.68)
1.65 (.75)
1.39 (.68)
1.36 (.49)
Staff survey
Risk perception
.92 1372 1.75 (1.49)
0 10 1.81 (1.58)
1.64 (1.46)
1.74 (1.48)
1.73 (1.40)
Feelings of anxiety
.89 1219 1.34 (.53)
1 5 1.31 (.51)
1.33 (.53)
1.34 (.53)
1.36 (.56)
Avoidance behaviour
.86 1337 1.89 (.96)
1 5 1.69 (.88)
1.87 (.90)
2.14 (1.01)
1.91 (1.00)
8.2.2.2. Systematic social observations (SSO)
SSO was applied within the neighbourhoods of the four campuses of the university. In total,
36 observation points were selected to be included in the study. Depending on the size of the
campus, between two9 and 19 observation points were chosen per campus neighbourhood.
Additionally, the selection of the 36 observation points was based on three criteria, taking into
account both physical and virtual characteristics of the location:
• Only observation points with a direct access to the university campus were
selected to ensure that all observation points were located in the direct
neighbourhood of the campus;
• Only observation points that are at least 100 meters apart from each other
were selected to avoid overlapping observations;
• Only observation points of which the GSV images were recently captured (after
May 2017) were selected to exclude old images that no longer corresponded to the
real physical environment.
9 On Campus 4, only two observation points were selected as the campus is adjacent to a zone with lots of greenery, which is not accessible via GSV.

Relationship between CPTED and fear of crime
188
All observation points were subject to three different observation methods: in-situ
observations, observations via original photographs and observations by means of GSV.
Observers were divided in groups of four to six persons10. Before they carried out the
observations, all observers followed an extensive training in which they were instructed about
the checklist and the practical performance of the observations. Additionally, they received
theoretical information about crime prevention, disorder and CPTED. Each group received an
observation location with address and specific coordinates. While two persons of every group
travelled to the location to carry out in-situ observations, the other group members observed
the same location based on photos they received from their group members on location.
Additionally, every group member was instructed to observe the location by means of GSV
images.
Observers who carried out in-situ observations were instructed to observe in 360° from the
exact location they received. From the observation point, they had to capture four
photographs which offered a clear overview of the location. The observers were free to
choose a date and time to carry out the observations, within the period of October 1 and
October 23, 2020. In the end, in-situ observations were performed between 10 a.m. and 20.15
p.m. from October 3 to October 20. In total, 174 female, 28 male and one non-binary student
carried out two observations which led to 406 individual observations in total: 71 observations
were performed in-situ, 203 observations were virtually carried out by means of GSV images
and 132 observations were executed based on photographs. High correlations were found
between the three observation methods. Inter-modus reliability proved to be very good, with
the following average correlations: M1-M2: 0.756 (SD=0.124); M1-M3: 0.750 (SD=0.125); M2-
M3: 0.942 (SD=0.039).
All observations were carried out by using a standardized checklist, which consisted of 40
items. Based on a Principle Components Analysis (PCA), items with less than .40 loading were
excluded (Nunnally & Bernstein, 1978), resulting in a final scale of 29 items nested within the
five CPTED dimensions (i.e., surveillance, access control, territoriality, maintenance and target
hardening, and activity support) and two disorder constructs (physical and social disorder)
10 Master students in Criminological Sciences (N=203) were selected to act as observers. We would like to thank professor Lieven Pauwels and all these students of Ghent University who participated in this study.

Relationship between CPTED and fear of crime
189
(see Appendix, Table 8.4). Surveillance was measured by using five items (e.g., presence of
formal surveillance (police patrol, security guards)). For access control, two items were
included (e.g., there are visible campus entrances and exits). Territoriality was measured by
three items (e.g., there are physical barriers (e.g., fences, shrubs) that separate campus from
public space). All aforementioned key principles were scored on a scale from 1 (=0) to 4 (=>4).
In order to measure maintenance, four items were used (e.g., the condition of the buildings
on the location is…). Items were scored on a scale from 1 (=very bad) to 4 (=very good). To
assess the presenceof maintenance more in detail, items regarding the presence of physical
and social disorder were included in the checklist. For physical disorder, four items were
included (e.g., there are broken windows/doors at the location). Social disorder was measured
by including four items regarding the presence of people who disturb the public order (e.g.,
there are people who are drunk on the location). For both physical and social disorder,
answers were scored based on a scale ranging from 1 (=0) to 4 (=>4). Finally, activity support
was assessed by three items (e.g., there is a cultural activity going on (e.g., performance,
festival) at the location), which were scored on a scale from 1 (=0) to 4 (=>4).
The data collected by use of the surveys and SSO were merged into one data file and analysed
with SPSS26. The descriptive statistics of all key variables included in this study are presented
in Table 8.3.
Table 8.3. Descriptive statistics of key variables of SSO.
Total
Variables N Overall mean (SD)
Min. Max. Campus 1 Mean (SD)
Campus 2 Mean (SD)
Campus 3 Mean (SD)
Campus 4 Mean (SD)
Surveillance 406 1.87 (.37) 1 4 1.86 (.36) 2.06 (.39) 1.79 (.32) 1.65 (.28)
Access control 406 1.82 (.68) 1 4 1.62 (.53) 2.00 (.79) 2.00 (.73) 2.57 (.56)
Territoriality 405 1.94 (.70) 1 4 1.58 (.52) 1.96 (.79) 2.17 (.52) 2.79 (.48)
Maintenance 406 3.10 (.59) 1 4 3.27 (.22) 2.94 (.60) 3.33 (.63) 3.24 (.48)
Activity support 402 1.22 (.41) 1 4 1.01 (.06) 1.64 (.59) 1.41 (.37) 1.21 (.22)
Physical disorder 406 1.05 (.16) 1 4 1.08 (.18) 1.07 (.20) 1.00 (.00) 1.02 (.07)
Social disorder 406 .59 (.47) 1 4 .57 (.45) .69 (.51) .53 (.47) .55 (.51)

Relationship between CPTED and fear of crime
190
8.3. Results
Taking into account the mean scores for each variable per campus, associations can be made
between students’ and staff members’ fear of crime on and in the neighbourhood of the
campus and the presence of CPTED measures in the neighbourhood of these campuses. The
integrated results are visualized in four radar charts, shown in Figure 8.2. The grey lines
represent the overall mean per variable per campus. The black lines show the mean scores
per variable per campus. Below, the results are first presented per campus, and thereafter we
compare the four campuses.

Relationship between CPTED and fear of crime
191
Figure 8.2. Overview of the results of student survey (N=1,463), staff survey (N=1,443) and SSO (N=406).

Relationship between CPTED and fear of crime
192
8.3.1. Campus 1
Starting with Campus 1, the results show that this neighbourhood is characterized by the
highest presence of maintenance. Measures referring to territoriality and access control were
least observed on this campus and also lower scores were found for activity support. The
mean score for surveillance is comparable to the overall mean score for this variable.
Additionally, compared to the overall mean, more signs of physical disorder were observed.
The presence of social disorder was relatively low, scoring beneath the overall mean. Survey
data show that students’ risk perception and feelings of anxiety on this campus are higher
compared to the other three campuses. Also staff members’ risk perception is the highest on
this campus in comparison to the other campuses. Both students and staff members indicated
to show less avoidance behaviour compared to the mean scores. Finally, lower scores for staff
members’ feelings of anxiety were found on this campus compared to the overall mean for
this variable.
Interpreting these results, it can be assumed that students’ and staff members’ high risk
perception and students’ more frequent feelings of anxiety are related to a higher presence
of physical disorder in the neighbourhood of this campus. Moreover, a greater absence of
territoriality and access control could also play a role. The lower scores on avoidance
behaviour among both respondent groups and staff members’ less frequent feelings of
anxiety may be associated with a higher presence of maintenance and surveillance in the
neighbourhood of Campus 1.
8.3.2. Campus 2
The results concerning Campus 2 indicate that this campus is characterized by the highest
presence of activity support compared to the other campuses. Also CPTED principles
surveillance and access were more present compared to the overall mean for this variable.
The presence of territoriality is similar to the mean score for this variable. The observers
noticed the lowest presence of maintenance in comparison to the other three campuses.
Subsequently, the presence of physical disorder is comparable to Campus 1, showing a higher
score than the overall mean. Also social disorder was frequently observed, showing the
highest mean scores for this campus compared to the other three campuses. Data collected
via the two surveys show that students’ risk perception and feelings of anxiety are lower and

Relationship between CPTED and fear of crime
193
less frequent on Campus 2, compared to the overall mean score. In comparison to the other
campuses, they indicated to show more avoidance behaviour on and in the neighbourhood of
this campus. Staff members indicated a similar score on feelings of anxiety and avoidance
behaviour in comparison to the overall mean scores for these variables. Additionally, they
perceive the risk of becoming a victim of crime on campus two as the lowest, compared to the
other three campuses.
Based on a comprehensive view on these findings, it may be assumed that more frequent
avoidance behaviour among students on this campus could be associated with a lower
presence of maintenance in this neighbourhood. Furthermore, a higher presence of social
disorder in the neighbourhood of Campus 2 could also have been associated with these
findings. Staff members’ average levels of feelings of anxiety and avoidance behaviour may
also be related with these findings. Subsequently, a lower perceived risk among students and
staff members could be influenced by a higher presence of surveillance, access control and
activity support in the neighbourhood of the campus. Also students’ less frequent feelings of
anxiety could be explained by the higher presence of these CPTED principles.
8.3.3. Campus 3
The results from the observations show that the neighbourhood of Campus 3 is characterized
by a higher presence of territoriality and maintenance. The observers noticed also a higher
presence of access control and activity support, compared to the overall mean scores for these
variables. For surveillance, slightly lower scores were found compared to the overall mean.
Additionally, no physical disorder was observed on this campus and also the lowest presence
of social disorder was observed compared to the other three campuses. Survey data show
that students indicated lower scores on the three dimensions of fear of crime, compared to
the overall mean scores. For staff members, their risk perception and feelings of anxiety are
comparable to the overall means for these variables. They indicated, however, that they
experienced most frequently avoidance behaviour on this campus in comparison to the other
three campuses.
Taking the above findings into account, lower levels of fear of crime among students may be
related to a higher presence of territoriality and maintenance in the neighbourhood of
Campus 3. The higher presence of access control and activity support could have been

Relationship between CPTED and fear of crime
194
associated with these findings. Moreover, as the observers noticed the least signs of visible
disorder in this neighbourhood, this could also be related with students’ lower levels of fear
of crime. Staff members’ average scores on risk perception and feelings of anxiety may be
related to the aforementioned findings. Additionally, more frequent avoidance behaviour
among staff members may be related to the slightly lower scores on surveillance.
8.3.4. Campus 4
The results for Campus 4 indicate a higher presence of access control, territoriality and
maintenance in this neighbourhood. More specifically, the highest presence of access control
and territoriality was found, compared to the other three campuses. Additionally, the lowest
presence of surveillance was observed in the neighbourhood of Campus 4 in comparison to
the other three campuses. The scores on activity support are comparable to the overall mean.
The observers noticed less physical and social disorder compared to the overall mean scores
on these variables. The results of the surveys show that students experienced less fear of
crime on this campus compared to the other three campuses. For all three dimensions, the
lowest scores were found. Staff members’ experiences with fear of crime on Campus 4 are
comparable with the overall mean scores for the three dimensions.
In light of these findings, it may be assumed that students’ lower levels of fear of crime on
campus are associated with a higher presence of access control, territoriality and maintenance
in the campus neighbourhood. A higher presence of the aforementioned CPTED principles
could also be related to staff members’ average scores on risk perception, feelings of anxiety
and avoidance behaviour. Subsequently, also low levels of disorder may have contributed to
lower levels of fear of crime among students.
8.3.5. All campuses
Firstly, the results show that the campuses where students indicated a lower risk perception,
less frequent feelings of anxiety and less frequent avoidance behaviour (Campus 3 and 4) have
in common that they are characterized by a higher presence of territoriality, maintenance and
access control. Surveillance was less observed in the neighbourhood of these two campuses.
When these results are compared to the campuses on which students had higher levels of fear
of crime, we found a lower presence of maintenance on Campus 2, while Campus 1 is

Relationship between CPTED and fear of crime
195
characterized by the lowest scores on territoriality and access control. Both campuses are also
characterized by a higher presence of surveillance.
Secondly, the results indicate that Campuses 3 and 4 students are characterized by a lower
presence of both physical and social disorder. On Campuses 1 and 2, higher levels of physical
disorder were observed while a higher presence of social disorder was noticed in the
neighbourhood of Campus 2. On this campus, students indicated to frequently avoid certain
places. On Campus 1, they experienced most feelings of anxiety and perceived the risk of
becoming a victim as highest.
Thirdly, staff members’ scores on the three dimensions of fear of crime are mainly similar to
the overall mean scores for these variables. This implies that, concerning staff members’ fear
of crime, only preliminary findings can be reported. On Campus 1, staff members indicated to
experience least frequent feelings of anxiety and avoidance behaviour, while they estimated
the risk of becoming a victim on this campus as the highest. These lower levels of anxiety and
avoidance behaviour may be related to a higher presence of maintenance and surveillance in
the neighbourhood of the campus. Staff members indicated to have the lowest risk perception
on Campus 2, which is characterized by lower levels of maintenance. Additionally, staff
members indicated to show most frequent avoidance behaviour on Campus 3, a campus that
is mainly characterized by a high presence of territoriality and access control. On Campus 1,
where they experienced less frequent avoidance behaviour, the lowest levels of territoriality
and access control were observed.
Concerning the relationship between disorder and staff members’ fear of crime, again only
preliminary findings can be reported. The highest presence of physical disorder was observed
in the neighbourhood of Campus 1, the campus where staff members estimated the risk of
becoming a victim as the highest. However, the lowest scores on risk perception were found
for Campus 2, which is characterized by the same levels of physical disorder. On this campus,
the highest presence of social disorder was found, while staff members’ level of feelings of
anxiety and avoidance behaviour are similar to the overall mean scores for these variables. In
the neighbourhoods of Campus 3 and 4 lower levels of physical and social disorder were
found. On these campuses, staff members indicated average levels of fear of crime, except for
avoidance behaviour, which was more frequently experienced on Campus 3.

Relationship between CPTED and fear of crime
196
8.4. Conclusion and discussion
This study had the aim to provide more insight in the relationship between CPTED and fear of
crime. By using a multi-method approach, combining surveys and SSO, associations between
the environmental characteristics of four campus neighbourhoods and fear of crime among
university’s students and staff members were examined. Based on the findings, it can be
concluded that lower levels of students’ fear of crime may be related to a higher presence of
CPTED principles territoriality, access control and maintenance. Additionally, a greater
presence of surveillance could be associated with higher levels of fear of crime among
students on and in the neighbourhood of the campus. Students indicated to experience more
fear of crime on campuses with higher levels of social and physical disorder. The presence of
physical disorder may have been more related to students’ risk perception, while visible signs
of social disorder may influence students’ avoidance behaviour to a greater extent. Regarding
staff members’ fear of crime, it can be concluded that their feelings of anxiety and avoidance
behaviour may be associated with the presence of CPTED principle maintenance. Additionally,
a higher presence of territoriality and access control may have been related to lower levels of
staff members’ avoidance behaviour. Contrary to students’ fear of crime, staff members’
experiences with fear of crime are less related with the presence of physical and social
disorder in the neighbourhood of the campus.
In light of the above, we can conclude that similar CPTED principles are related to students’
and staff members’ fear of crime on campus. Lower levels of fear of crime among students
were observed on campuses that are characterized by a higher presence of territoriality,
access control and maintenance. Also staff members experienced less feelings of anxiety and
avoidance behaviour on campuses with a higher presence of maintenance measures.
Additionally, they indicated the risk of becoming a victim lower on campuses with a higher
presence of territoriality and access control. Concerning the influence of disorder, different
conclusions can be drawn for students and staff members. While students experienced less
fear of crime on campuses characterized by a lower presence of physical and social disorder,
it was difficult to relate staff members’ fear of crime to these variables. In summary, our study
showed that CPTED principles territoriality, access control and maintenance were mostly
associated with students’ and staff members’ fear of crime on campus. Subsequently, it was

Relationship between CPTED and fear of crime
197
found that the presence of physical and social disorder was more related with students’ fear
of crime in comparison to staff members’ fear of crime on campus.
Interventions in the physical environment have shown promising results in reducing crime and
fear of crime in different settings such as residential neighbourhoods and commercial areas
(Casteel et al., 2004; Cozens et al., 2005). Only few studies have assessed the relation between
built environment and fear of crime in an educational context (Fisher & May, 2009; Petherick,
2000; Sas et al., 2021). This study sought to fill this gap by examining the relationship between
CPTED and fear of crime in a campus setting. Our findings provide further evidence for the
effectiveness of the CPTED approach in promoting security through reducing fear of crime.
Additionally, this study offered more insights in which CPTED measures are most effective in
a campus neighbourhood. While most European universities are open-access environments
where people move between and among buildings and outdoor spaces (Rasmussen &
Johnson, 2008), traditional security measures (such as badge checks or fences) are often not
desirable or feasible. A more feasible approach to improve campus security could be the
implementation of various physical security measures, aligning with the principles of CPTED
(Maier & DePrince, 2020; Robinson, 1999). The proactive nature of the CPTED approach could
be better suited to college environments compared to more reactive and coercive
approaches.
Regarding the assessment of the presence of CPTED, we included five CPTED principles in our
checklists of which the items do not consistently refer to the same latent concept as they
mainly indicate the presence or absence of physical characteristics that are not always related
to each other (e.g., the presence of lighting and the presence of CCTV). This may be different
for the phenomena that are based on perceptions, such as social disorder. One social
phenomenon (e.g., drunk people) is often accompanied by the presence of other social
phenomena (e.g., people fighting). Future research in different crime and demographic
settings is needed to examine how the presence of CPTED can be measured in a more reliable
way to evolve towards the development of a more solid measurement instrument.
Although this study offered a valuable contribution to the existing literature on CPTED and
fear of crime in general and the relationship between these concepts in a campus setting more
specifically, there are some limitations to bear in mind when interpreting these findings. The

Relationship between CPTED and fear of crime
198
first potential constraint is that the data were collected at three different points of time. While
the surveys were distributed in the spring and summer of 2019, the observations were carried
out at the end of 2020. This implies that it is possible that changes could have been made to
the built environment or that the presence of disorder has increased or decreased in the
period between the three data collections. To overcome this limitation, in-situ observations
were combined with observations via GSV. All GSV images were captured after May 2017 and
a large majority of images was captured in 2019. Moreover, we asked respondents about their
experiences with fear of crime in the past 12 months. However, collecting the data
simultaneously is recommended for future research in order to limit this potential bias.
Subsequently, in this study we did not include other factors that could have influenced
respondents’ fear of crime, such as previous victimization (e.g., Karakus et al., 2010; Marzbali
et al., 2012) or demographic factors (e.g., Fox et al., 2009; Tulloch, 2000). Moreover, as all
data were collected through self-reports, socially desirable answers could be given by the
respondents. We aimed to overcome this limitation by informing the respondents that we
guaranteed the anonymity of their responses, but this is definitely a limitation that has to be
taken into account. Additionally, we did also not include factors that could have influenced
the presence of CPTED measures at the time the observations were carried out. In this light,
it is important to mention that the observations took place during the COVID-19 pandemic,
which was accompanied by restrictions implemented by the government11. We assume that
these restrictions had obviously an impact on the results of the observations, especially
regarding the presence of disorder and activity support.
Finally, it remains unclear whether our findings are generalizable to other university campuses
or other neighbourhood settings. Future research in different contexts would increase the
validity and generalizability of our findings and provide more insights in the relationship
between CPTED and fear of crime in various settings. Despite these limitations, the study
11 At the time of the observations, the following measures against COVID-19, that are relevant for this study, applied: (1) at the University of Antwerp, only 20% of students were allowed to be physically present in the auditoriums, all other students had to follow classes online from home, (2) telework was highly recommended for staff members, several days a week, (3) all bars had to be closed at 11 p.m., (4) non-organized gatherings outside were limited to a maximum of four people, except for family members who lived under the same roof, (5) there was a limitation of a maximum of three close contacts per month for everyone, (6) extra efforts in the field of enforcement had to ensure that the above measures were applied everywhere.

Relationship between CPTED and fear of crime
199
provides support for the CPTED theory and its relationship with people’s fear of crime. A first
insight was obtained in the type of CPTED measures that are most effective in campus
environments. Our findings offer useful insights for higher educational institutions that have
the aim to create a secure environment for their students and staff members. Based on this
study, a focus on evidence-based implementations of CPTED measures and disorder limiting
measures is recommended.

Relationship between CPTED and fear of crime
200
8.5. References
Armitage, R. (2000). An evaluation of secured by design housing within West Yorkshire. Home
Office Briefing Note, 7, 1-4.
Armitage, R., & Monchuk, L. (2011). Sustaining the crime reduction impact of designing out
crime: Re-evaluating the Secured by Design scheme 10 years on. Security Journal,
24(4), 320-343.
Brower, S., Dockett, K., & Taylor, R. B. (1983). Residents' perceptions of territorial features and
perceived local threat. Environment and behavior, 15(4), 419-437.
Brunton‐Smith, I., & Sturgis, P. (2011). Do neighborhoods generate fear of crime? An empirical
test using the British Crime Survey. Criminology, 49(2), 331-369.
Casteel, C., & Peek-Asa, C. (2000). Effectiveness of crime prevention through environmental
design (CPTED) in reducing robberies. American journal of preventive medicine, 18(4),
99-115.
Casteel, C., Peek-Asa, C., Howard, J., & Kraus, J. F. (2004). Effectiveness of crime prevention
through environmental design in reducing criminal activity in liquor stores: a pilot
study. Journal of occupational and environmental medicine, 46(5), 450-458.
Caughy, M. O., O’Campo, P. J., & Patterson, J. (2001). A brief observational measure for urban
neighborhoods. Health & place, 7(3), 225-236.
Cozens, P., Saville, G., & Hillier, D. (2005). Crime prevention through environmental design
(CPTED): a review and modern bibliography. Property management.
Cozens, P., & Sun, M. Y. (2019). Exploring crime prevention through environmental design
(CPTED) and students’ fear of crime at an Australian university campus using prospect
and refuge theory. Property management.
Cozens, P., & Tarca, M. (2016). Exploring housing maintenance and vacancy in Western
Australia. Property management.
Doran, B. J., & Lees, B. G. (2005). Investigating the spatiotemporal links between disorder,
crime, and the fear of crime. The Professional Geographer, 57(1), 1-12.
Relationship between CPTED and fear of crime
201
Farrall, S., & Gadd, D. (2004). Evaluating crime fears: a research note on a pilot study to
improve the measurement of the ‘fear of crime’as a performance indicator. Evaluation,
10(4), 493-502.
Ferraro, K. F. (1996). Women's fear of victimization: Shadow of sexual assault? Social forces,
75(2), 667-690.
Fisher, B. S., & May, D. (2009). College students' crime-related fears on campus: Are fear-
provoking cues gendered? Journal of Contemporary Criminal Justice, 25(3), 300-321.
Fox, K. A., Nobles, M. R., & Piquero, A. R. (2009). Gender, crime victimization and fear of crime.
Security Journal, 22(1), 24-39.
Gau, J. M., & Pratt, T. C. (2010). Revisiting broken windows theory: Examining the sources of
the discriminant validity of perceived disorder and crime. Journal of criminal justice,
38(4), 758-766.
Gracia, E., & Herrero, J. (2007). Perceived neighborhood social disorder and attitudes toward
reporting domestic violence against women. Journal of Interpersonal Violence, 22(6),
737-752.
Griew, P., Hillsdon, M., Foster, C., Coombes, E., Jones, A., & Wilkinson, P. (2013). Developing
and testing a street audit tool using Google Street View to measure environmental
supportiveness for physical activity. International Journal of Behavioral Nutrition and
Physical Activity, 10(1), 1-7.
Hardyns, W., & Pauwels, L. (2010). Different measures of fear of crime and survey
measurement error. Governance of Security Research Papers Series III, New Empirical
Data, Theories and Analyses on Safety, Societal Problems and Citizens’ Perceptions,
19-39.
Hardyns, W., Pauwels, L. J., & Heylen, B. (2018). Within-individual change in social support,
perceived collective efficacy, perceived disorder and fear of crime: Results from a two-
wave panel study. The British Journal of Criminology, 58(5), 1254-1270.
Hinkle, J. C., & Yang, S.-M. (2014). A new look into broken windows: What shapes individuals’
perceptions of social disorder? Journal of Criminal Justice, 42(1), 26-35.

Relationship between CPTED and fear of crime
202
Hoeben, E. M., Steenbeek, W., & Pauwels, L. J. (2018). Measuring disorder: observer bias in
systematic social observations at streets and neighborhoods. Journal of Quantitative
Criminology, 34(1), 221-249.
Jacobs, J. (2016). The death and life of great American cities: Vintage.
Jeffery, C. R. (1971). Crime prevention through environmental design. American Behavioral
Scientist, 14(4), 598-598.
Karakus, O., McGarrell, E. F., & Basibuyuk, O. (2010). Fear of crime among citizens of Turkey.
Journal of criminal justice, 38(2), 174-184.
Kohm, S. A. (2009). Spatial dimensions of fear in a high-crime community: Fear of crime or fear
of disorder? Canadian Journal of Criminology and Criminal Justice, 51(1), 1-30.
LaGrange, R. L., & Ferraro, K. F. (1987). The elderly's fear of crime: A critical examination of
the research. Research on aging, 9(3), 372-391.
Lee, J. S., Park, S., & Jung, S. (2016). Effect of crime prevention through environmental design
(CPTED) measures on active living and fear of crime. Sustainability, 8(9), 872.
Maier, S. L., & DePrince, B. T. (2020). College students’ fear of crime and perception of safety:
The influence of personal and university prevention measures. Journal of criminal
justice education, 31(1), 63-81.
Marzbali, M. H., Abdullah, A., Razak, N. A., & Tilaki, M. J. M. (2012). The influence of crime
prevention through environmental design on victimisation and fear of crime. Journal
of environmental psychology, 32(2), 79-88.
Minnery, J. R., & Lim, B. (2005). Measuring crime prevention through environmental design.
Journal of architectural and planning research, 330-341.
Newman, O. (1972). Defensible space: Macmillan New York.
Nunnally, J. C., & Bernstein, I. (1978). Psychometric theory. New York: MacGraw-Hill. _ d.
Intentar embellecer nuestras ciudades y también las.
Pain, R. (2001). Gender, race, age and fear in the city. Urban studies, 38(5-6), 899-913.

Relationship between CPTED and fear of crime
203
Petherick, N. (2000). Environmental design and fear: the prospect-refuge model and the
university college of the Cariboo campus. Western Geography, 10(11), 89-112.
Rasmussen, C., & Johnson, G. (2008). The Ripple Effect of Virginia Tech: Assessing the
Nationwide Impact on Campus Safety and Security Policy and Practice. Midwestern
Higher Education Compact.
Reynald, D. M. (2011). Translating CPTED into crime preventive action: A critical examination
of CPTED as a tool for active guardianship. European Journal on Criminal Policy and
Research, 17(1), 69-81.
Robinson, M. (1999). The theoretical development of crime prevention through
environmental design (CPTED). Advances in Criminological Theory, 8, 427-462.
Rundle, A. G., Bader, M. D., Richards, C. A., Neckerman, K. M., & Teitler, J. O. (2011). Using
Google Street View to audit neighborhood environments. American journal of
preventive medicine, 40(1), 94-100.
Sas, M., Hardyns, W., Reniers, G., & Ponnet, K. (2021). Unravelling college students' fear of
crime: the role of perceived social disorder and physical disorder on campus British
Journal of Educational Studies, 1-21.
Scarborough, B. K., Like-Haislip, T. Z., Novak, K. J., Lucas, W. L., & Alarid, L. F. (2010). Assessing
the relationship between individual characteristics, neighborhood context, and fear of
crime. Journal of criminal justice, 38(4), 819-826.
Shariati, A. (2017). An assessment of the role of crime prevention through environmental
design (CPTED) in campus safety.
Shariati, A., & Guerette, R. T. (2020). The Forgotten (Practical) Side of School Safety: What Do
Clery Reports Say about CPTED and Crime on College Campuses? Planning Practice &
Research, 35(4), 396-417.
Teedon, P., Reid, T., Griffiths, P., & McFadyen, A. (2010). Evaluating Secured by Design door
and window installations: Effects on residential crime. Crime Prevention and
Community Safety, 12(4), 246-262.

Relationship between CPTED and fear of crime
204
Tseng, C.-H., Duane, J., & Hadipriono, F. (2004). Performance of campus parking garages in
preventing crime. Journal of Performance of Constructed Facilities, 18(1), 21-28.
Tulloch, M. (2000). The meaning of age differences in the fear of crime. British journal of
criminology, 40(3), 451-467.
Vauclair, C.-M., & Bratanova, B. (2017). Income inequality and fear of crime across the
European region. European Journal of Criminology, 14(2), 221-241.
Wilson, J. Q., & Kelling, G. L. (1982). Broken windows. Atlantic monthly, 249(3), 29-38.

Relationship between CPTED and fear of crime
205
8.6. Appendix
Table 8.4. Overview of items that were included in the CPTED checklist and their factor loadings (N=25).
Scale construct (type of scale)
Items Factor loading
Surveillance (4-point scale (0 to >4))*
There is formal surveillance at the observation point (e.g., police patrol, security guards, community guards, …)
.41
There is natural control at the observation point (e.g., pedestrians, shop owners, car drivers, …)
.52
There is lighting at the observation point .42
There are CCTV cameras at the observation point .79
There are signs that indicate the presence of CCTV cameras at the observation point
.79
Access control (4-point scale (0 to >4))*
There are clearly visible entrances and exits at the observation point
.88
There are signs that indicate the presence of entrances and exits at the observation point
.88
Territoriality (4-point scale (0 to >4))*
There are physical barriers (e.g., fences, shrubs, …) at the observation point that distinguish between the campus and public space
.78
There are signs that indicate the presence of the university at the observation point
.84
There are signs that indicate the presence of private properties at the observation point
.59
Maintenance (4-point scale (very bad to very good))
The condition of the buildings at the observation point is… .52
The condition of the road surface at the observation point is…
.67
The condition of the sidewalks at the observation point is… .65
The maintenance of the greenery (e.g., plants, grass, …) at the observation point is…
.57
Activity support (4-point scale (0 to >4))*
There is a cultural activity going on (e.g., performance, festival, …) at the observation point
.67
There is a playground at the observation point .73
There is a park/lake at the observation point .76
Physical disorder (4-point scale (0 to >4))*
There are car wrecks at the observation point .84
There are bicycle wrecks at the observation point .79
There are broken windows/doors at the observation point .58
There are visibly vacant buildings at the observation point .49
Social disorder (4-point scale (0 to >4))*
There are vagrants, homeless people or beggars at the observation point
.99
There are drunk people at the observation point .99
There are people that are using drugs (e.g., weed, hash, …) at the observation point
.81
There are people fighting at the observation point .99
*Note. 4-point scale with 1 (= 0), 2 (= 1-2), 3 (= 3-4) or 4 (>4).


Discussion and conclusion
207
CHAPTER 9
Discussion and conclusion
Previous studies found that the campus is prone to various types of crime (Jennings et al.,
2007; Schokkenbroek et al., 2020), that approximately one-quarter of students report feeling
insecure on campus (Maier & DePrince, 2020; Sani et al., 2020) and that security perceptions
play an important role in the school choice process of students (British Council, 2012; De Jager
& Bezuidenhout, 2014) and in the level of job satisfaction among employees (Ayim Gyekye,
2005; Nielsen et al., 2011). Although authors agree that an integral focus on the technological,
organizational and human security domains is needed in order to create a secure
environment, HEI’s often overlook the human factor in campus security. In order to obtain
more insight in the human domain of security culture, this dissertation consisted of three main
parts: (1) a conceptual part, (2) a methodological part and (3) an empirical part. All three parts
contributed to the key aim of the dissertation: unravelling the human factors of campus
security. In order to do so, four sub-aims were formulated: (i) the development of a
comprehensive conceptual model of security culture, (ii) the investigation of how security
culture can be measured, (iii) exploring which factors constitute security awareness on
campus and how they can be strengthened and (iv) exploring the extent to what
environmental cues of the campus are related to fear of crime and how these feelings of fear
can be reduced. Throughout seven separate studies, answers were formulated on each of the
above research aims.
In this concluding part, the findings of the dissertation will be discussed pertaining these four
sub-aims. Subsequently, some practical recommendations are formulated for HEI’s who have
the aim to invest in the human factor of campus security and create a secure environment for
their students and staff members. Finally, an overview is provided of the limitations of the
studies that were carried out, linked to some theoretical implications and suggestions for
future research.

Discussion and conclusion
208
9.1. Responding to the four research aims
9.1.1. Development of a comprehensive conceptual model of security culture
To examine the human factors of campus security, it was indispensable to first obtain a clear
insight in physical security in general. Although some authors already proposed a definition of
security culture (Reniers et al., 2011; Winter, 2007), they mainly focused on one type of
organization or security domain. A more holistic model for physical security culture was
presented in Chapter 2, based on acquired knowledge in the related domain of safety. Due to
the main similarities between safety and security, much can be learned from safety sciences
which is characterized by a longer research tradition compared to security. Based on an
extensive literature review, the TEAM-model of Vierendeels et al. (2018), which presents a
conceptual model for safety culture, was further examined and adapted to the security
domain. The presented TEAM-model for security culture offers an integral overview of all
security related aspects within an organization and brings together the technological,
organizational and human domains in a coherent way.
Our findings showed that the three security domains are strongly intertwined, which implies
that organizations should focus on all three domains to strengthen their security culture. This
also means that attention should not only be paid to observable security domains (e.g.,
technology, procedures, behaviour), but also to security aspects that are not visible but offer
an important contribution to the security culture, such as people’s attitudes or management’s
commitment to security. Additionally, different from safety culture, the impact of security
threats (e.g., vandalism, theft) and external factors (e.g., technological development, national
culture) should also be considered when analysing or improving an organization’s security
culture. Finally, we provided a first insight in how an organization’s security culture can be
measured. It is suggested that a diagnosis of all sub-domains is needed in order to provide
recommendations for improvement. Furthermore, the organization will benefit from involving
all organizational members. This whole process should be seen as a continuous and
everlasting cycle of evaluation and improvement. The methodological part of this dissertation
(Chapters 3 and 4) focused further on this measurement process.

Discussion and conclusion
209
9.1.2. The investigation of how security culture can be measured
An extensive review of literature showed that only a few authors made an attempt to develop
a measurement tool and tested its reliability and validity in practice (e.g., Martins et al., 2007;
Schlienger & Teufel, 2003). Chapter 3 aimed to identify and analyse these tools in order to
provide recommendations for the development of a standardized measurement instrument.
In order to do so, a systematic review of already existing tools that measure security culture
was carried out. Six tools were found eligible and were compared to each other regarding their
general characteristics and methodological approach. Based on the results of the systematic
review, we had to reaffirm that information security has a predominant position in security
research. Taking into account the specific focus of these instruments, the results showed that
all tools emphasized on the organizational and human aspects of an organization’s security
culture. Half of tools also focused on the assessment of the technological domain. More
differences were found regarding the methodological approach. The majority of tools used a
single method approach, mainly focused on the distribution of surveys. Although this
quantitative approach could provide useful insights in the strengths of the organizational and
technological domain, it limits the measurement of the human domain, for instance because
there is often a dissimilarity between people’s self-reported behaviour in a survey and their
actual behaviour. To overcome this potential limitation, two tools included a combination of
quantitative and qualitative methods such as the use of document analysis, observations and
surveys. Additionally, it was found that the involvement of the entire organization in this
measurement process is indispensable (Chia et al., 2002; Martins et al., 2007). On one hand,
it is argued that a cultural change should always be supported by the top of the organization
(Alnatheer et al., 2012). On the other hand, it is assumed that a stronger support for cultural
change is more likely to be achieved when all organizational members are involved (Kraemer
et al., 2009).
In Chapter 4, we investigated one methodological approach more thoroughly, namely
systematic social observations (SSO). Although numerous studies have been carried out to
examine the relationship between individuals’ demographic characteristics (e.g., Fox et al.,
2009; May et al., 2010), socio-structural features (e.g., Brunton‐Smith & Sturgis, 2011; Vauclair
& Bratanova, 2017) or social processes (e.g., Hardyns et al., 2018; Scarborough et al., 2010)
and fear of crime, it was one of the sub-aims of this dissertation to examine the relationship

Discussion and conclusion
210
between physical cues in the environment and students’ and staff members’ feelings of
security. Over the years, SSO have become a commonly used and effective methodological
approach in ethnographic research to examine neighbourhood characteristics (Hinkle & Yang,
2014). Although this observation technique provides many advantages compared to more
traditional methods, such as census data or surveys, some disadvantages are linked to
observations on site (e.g., transportation costs, extensive time investment, potential dangers
in specific areas). In order to overcome these drawbacks, the reliability and validity of in-situ
observations, observations via original photographs and observations by means of GSV images
were evaluated. Our results showed that observations via photographs and GSV imagery
served as reliable and cost-effective tools for gathering information about the presence of
physical cues in the environment. It was, however, found that by means of in-situ
observations, more disorder and CPTED measures were observed compared to the virtual
methods. Observations via original photographs and GSV images seemed to miss an equal
amount of aspects or reality due to the specific characteristics of these methods. Based on
our findings, challenges and avenues for future research were provided to keep evolving
towards a more valid and reliable measurement approach for the physical environment.
9.1.3. Exploring which factors constitute security awareness on campus and how
they can be strengthened
The first two chapters of the empirical part of this dissertation aimed to unravel the factors
that constitute students’ and staff members’ security awareness and examine how this level
of security awareness could be improved. The first empirical study (Chapter 5) focused on staff
members’ security awareness and the effectiveness of training sessions on their awareness
level. Based on the Knowledge Attitude Behaviour (KAB) model of Baranowski et al. (2003),
the relationship between staff members’ security knowledge, attitudes towards security and
self-reported behaviour regarding security was examined. A significant relationship was found
between security knowledge and attitudes towards security. The results showed no significant
relationship between staff members’ attitude and self-reported security behaviour. This
complex attitude-behaviour relationship is not new as it has been studied multiple times in
previous research (Baranowski et al., 2003; Conner et al., 2002; Newbould & Furnell, 2009).
Explanations were found in potential mediators such as the combination of a positive attitude
about the expected behaviour, subjective norm towards the behaviour and the perception of

Discussion and conclusion
211
behavioural control, as proposed by the theory of planned behaviour of Ajzen (1991). Also
potential moderators, such as the contextual condition in which employees work (Guagnano
et al., 1995) or the direct experiences with security (Regan & Fazio, 1977) may impact this
attitude-behaviour consistency. Although no direct relationship was observed between staff
members’ attitudes and behaviour, we found that more security knowledge and a better
attitude towards security related to better self-reported security behaviour. In other words,
staff members with greater knowledge about the security procedures of the university and a
more positive attitude towards security indicated to behave in a more secure way on campus.
Taking into account socio-demographic characteristics, employees who are older, who are
working at the university for a longer time and who spend more time on campus reported to
know more about the university’s security procedures. Older employees also indicated to
behave in a more secure way.
In order to examine the effectiveness of training sessions on staff members’ knowledge,
attitudes and behaviour, awareness trainings were organized on campus. A comparison
between the results of a pre-test and post-test survey among the participants showed a
significant increase in staff members’ security knowledge and attitudes towards security. A
smaller and non-significant improvement in people’s self-reported security behaviour was
observed. Although we found an overall positive impact of the training on staff members’
security awareness, the results also showed that increased attention is needed for the
behavioural awareness dimension. A combination of awareness trainings, which mainly affect
participants’ knowledge and attitudes, and more practical initiatives aimed at influencing
participants’ behaviour, such as interactive demos or workshops, are therefore
recommended.
An alternative approach for improving people’s behaviour was found in the use of nudges
(Chapter 6), which already proved to be successful in other research domains. A quasi-
experiment was carried out at the university to reduce the opportunities for bicycle theft by
carrying out two nudging interventions. Stickers and posters that contained a clear social norm
were implemented in a selection of bicycle parking facilities in the neighbourhood of one
university campus in order to improve cyclists’ locking practices by making them more aware
of the potential risks and informing them about the expected preventive behaviour. Our
findings showed that the nudges served as an effective crime prevention measure. At the end
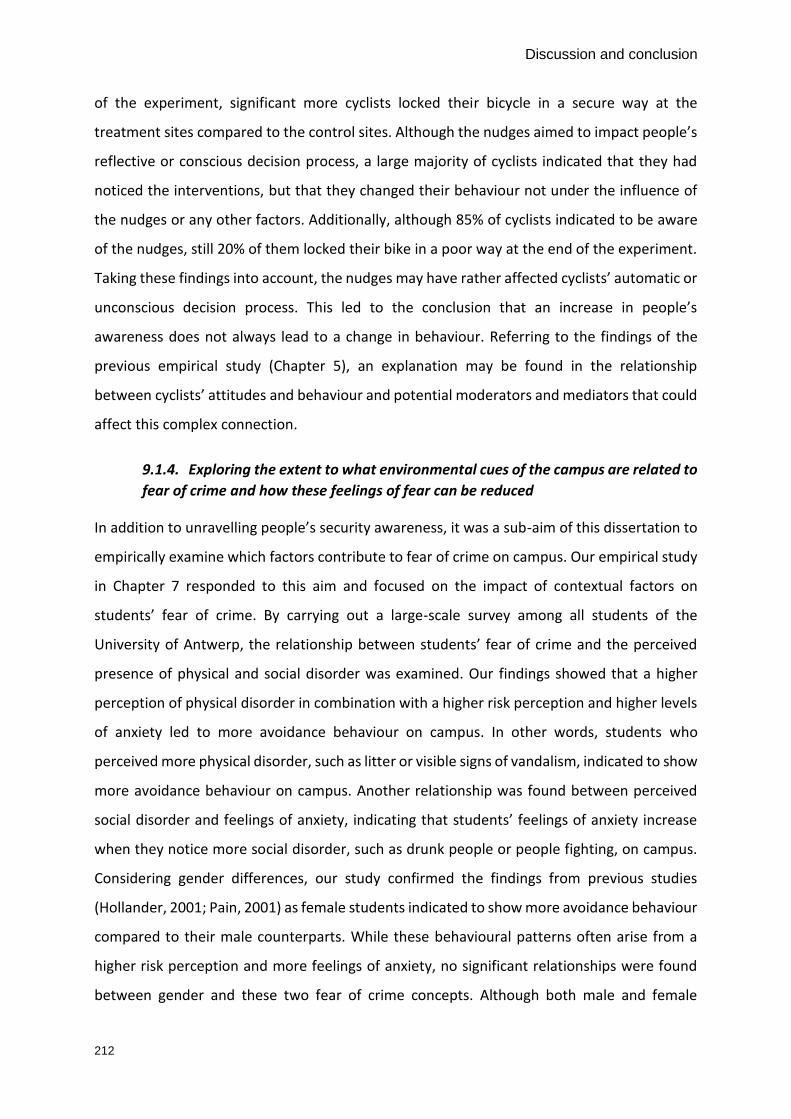
Discussion and conclusion
212
of the experiment, significant more cyclists locked their bicycle in a secure way at the
treatment sites compared to the control sites. Although the nudges aimed to impact people’s
reflective or conscious decision process, a large majority of cyclists indicated that they had
noticed the interventions, but that they changed their behaviour not under the influence of
the nudges or any other factors. Additionally, although 85% of cyclists indicated to be aware
of the nudges, still 20% of them locked their bike in a poor way at the end of the experiment.
Taking these findings into account, the nudges may have rather affected cyclists’ automatic or
unconscious decision process. This led to the conclusion that an increase in people’s
awareness does not always lead to a change in behaviour. Referring to the findings of the
previous empirical study (Chapter 5), an explanation may be found in the relationship
between cyclists’ attitudes and behaviour and potential moderators and mediators that could
affect this complex connection.
9.1.4. Exploring the extent to what environmental cues of the campus are related to
fear of crime and how these feelings of fear can be reduced
In addition to unravelling people’s security awareness, it was a sub-aim of this dissertation to
empirically examine which factors contribute to fear of crime on campus. Our empirical study
in Chapter 7 responded to this aim and focused on the impact of contextual factors on
students’ fear of crime. By carrying out a large-scale survey among all students of the
University of Antwerp, the relationship between students’ fear of crime and the perceived
presence of physical and social disorder was examined. Our findings showed that a higher
perception of physical disorder in combination with a higher risk perception and higher levels
of anxiety led to more avoidance behaviour on campus. In other words, students who
perceived more physical disorder, such as litter or visible signs of vandalism, indicated to show
more avoidance behaviour on campus. Another relationship was found between perceived
social disorder and feelings of anxiety, indicating that students’ feelings of anxiety increase
when they notice more social disorder, such as drunk people or people fighting, on campus.
Considering gender differences, our study confirmed the findings from previous studies
(Hollander, 2001; Pain, 2001) as female students indicated to show more avoidance behaviour
compared to their male counterparts. While these behavioural patterns often arise from a
higher risk perception and more feelings of anxiety, no significant relationships were found
between gender and these two fear of crime concepts. Although both male and female

Discussion and conclusion
213
students indicated similar scores on risk perception and feelings of anxiety, this resulted more
frequently in a change in behaviour among female students compared to male students.
Based on these findings, we concluded that ‘fixing the broken window’, or preventing and
reducing both social and physical disorder, should be an integral part of HEI’s security policies
in order to reduce fear of crime among students.
The empirical study in Chapter 8 further examined the relationship between contextual
factors and fear of crime. By applying a multi-method approach, the relationship between
Crime Prevention Through Environmental Design (CPTED) and disorder and campus residents’
fear of crime was explored. Data collected via SSO (as described in Chapter 4) was merged
with data originating from the two large-scale surveys carried out among students and staff
members (see also Chapters 5 and 7). This way, our study aimed to assess the presence of
CPTED measures and disorder within four campus neighbourhoods and examine the
relationship with students’ and staff members’ fear of crime on and in the neighbourhood of
these campuses. Our findings showed that similar factors contribute to students’ and staff
members’ fear of crime. Both students and staff members indicated to show lower levels of
fear of crime on campuses characterized with a higher presence of access control (e.g.,
detection systems), maintenance (e.g., condition of the buildings) and territoriality (e.g.,
hedges, fences). Concerning the relationship between fear of crime and the presence of
disorder, we could draw different conclusions. While students experienced less fear of crime
on campuses characterized by a lower presence of physical and social disorder, a less
straightforward relationship was found between staff members’ fear of crime and disorder.
Nevertheless, our results provided further evidence for the effectiveness of the CPTED
approach in creating a secure environment through the reduction of fear of crime. The
implementation of physical features in the built environment of the campus may serve as a
more feasible security approach compared to more sophisticated technological measures.
Finally, similar to the conclusions and recommendations that were drawn based on the
findings of Chapter 7, preventing and tackling disorder is recommended in order to decrease
students’ fear of crime.

Discussion and conclusion
214
9.2. Recommendations
The specific characteristics of the campus and the campus neighbourhood make it a major
challenge for HEI’s to create an environment where students and staff members feel secure
to participate in various activities. The conceptual, methodological and empirical studies in
this dissertation offered valuable insights in how HEI’s can approach campus security. For
most HEI’s, it is one of the biggest challenges to find the right balance. In the following
paragraphs, we will provide some recommendations that may help HEI’s to find the right
balance. More specifically, we will focus on three topics:
(1) Finding a balance between the technological, organizational and human security
domains;
(2) Finding a balance between students’ and staff members’ security knowledge,
attitudes and behaviour;
(3) Finding a balance between the open campus design and students’ and staff
members’ feelings of security.
9.2.1. Finding a balance between the technological, organizational and human
security domains
With the technological, organizational and human security domains, we refer to the
organization’s security culture as proposed by the TEAM-model in Chapter 2. Throughout this
dissertation, the importance of a strong security culture was emphasized, indicating that HEI’s
should focus simultaneously and proportionally on all three domains. In order to develop an
efficient security culture in practice, we argued that this process always starts with a diagnosis
of security culture, followed by the formulation of recommendations and the implementation
of improvement strategies. Based on our findings, some recommendations regarding those
three essential phases in the development of security culture can be formulated.
9.2.1.1. Diagnosis of security culture
The diagnosis of security culture starts with an identification of the HEI’s goals in the field of
security. Decisions have to be made about which security aspects will be measured, how this

Discussion and conclusion
215
will be measured and what has to be done whether adjustments are needed (Reniers et al.,
2011). To figure out what has to be measured, HEI’s have to determine the dimensions and
sub-dimensions of their security culture. More specifically, the technological, organizational
and human security domains have to be filled in with concrete aspects that are relevant for
the HEI. Subsequently, these dimensions and sub-dimensions need to be translated into
measurable performance indicators to be able to objectively assess them. In order to
determine how these security aspects can be measured, our findings from Chapters 2 and 3
of this dissertation showed that a multi-method approach is recommended. More qualitative
methods are suitable for the measurement of the observable technological (e.g., CCTV,
detection systems), organizational (e.g., written security procedures) and human (e.g.,
students’ and staff members’ behaviour) security domains. Measurement techniques such as
interviews, focus groups, document analyses or observations may provide more insight in the
effectiveness of these security aspects. To evaluate the non-observable organizational (e.g.,
trust in the organization, perceptions on management commitment towards security) and
human (e.g., students’ and staff members’ attitudes towards security) domains, a more
quantitative approach is needed, such as the use of questionnaires.
Applying a multi-method approach makes the measurement process more time-intensive, but
ensures a more detailed and realistic outcome that can be translated into substantiated
recommendations. Moreover, the combination of multiple measuring tools does not have to
imply that HEI’s have to invent new tools as they can often rely on instruments that are already
in use in other domains. For instance, think of surveys that are carried out in order to obtain
more insight in the well-being of staff members and students, or questionnaires that assess
students’ opinion regarding the content of course units. The same software programs and
distribution methods may be used to carry out a survey about students’ attitudes towards
security or staff members’ trust in the organization. Additionally, valuable information can be
obtained from incident reports. As HEI’s already follow up the reports of occupational
incidents, similar reporting methods and evaluation techniques may be used for security
incidents. Furthermore, most HEI’s have a yearly tradition of carrying out an evacuation drill
in case of a fire alarm. While the observation of how this exercise is performed provides
valuable information on students’ and staff members’ safety knowledge and behaviour,

Discussion and conclusion
216
similar exercises may be organized regarding security incidents, such as a bomb alert or active
shooter threat.
9.2.1.2. Formulation of recommendations
Based on the diagnosis of the security culture, recommendations for improvement can be
formulated. In Chapter 3 of this dissertation, we found that only two of six existing measuring
tools for security culture focused on the formulation of recommendations in their approach.
Carrying out a diagnosis of HEI’s security culture without putting the outcomes in practice,
should be considered as a missed opportunity. It is recommended that the measurement
process leads to well-formulated security strategies that aim to strengthen HEI’s
technological, organizational and human domains. Based on the diagnosis, some weaknesses
and strengths of the organization’s security approach are discovered, which can be translated
to short-term and long-term goals.
Additionally, the importance of benchmarking was emphasized by some measuring tools we
discussed in Chapter 3 (AlHogail & Mirza, 2015; Martins et al., 2007). By comparing one’s own
security strategy with other HEI’s, the own level of campus security can be determined more
accurately. Additionally, HEI’s can learn from the knowledge and experiences of peers and
share best practices which may result in more informed decisions about campus security. For
instance, the Association of University Chief Security Officers (AUCSO, 2016) provides a forum
to exchange knowledge and best practices relating to campus security within the sector. This
association for security professionals working at HEI’s in the United Kingdom, Europe and
across the globe organizes annual meetings and provides an online forum on which
information can be shared.
9.2.1.3. Implementation of improvement strategies
Building on the previous phase, the implementation of improvement strategies is needed in
order to develop a strong security culture. When introducing new security measures, it is
recommended that the entire organization is involved. This implies that not only staff
members and students need to be prepared and informed about changes in security
approaches, but that also other people, such as contractors, visitors or neighbouring residents
should be involved in this process. Additionally, our findings showed that a pioneering role

Discussion and conclusion
217
should be attributed to the organization’s management (Alnatheer, 2012; International
Atomic Energy Agency, 2017). Showing commitment and involvement regarding security
issues may lead to more support and more positive attitudes towards security among other
organizational members. Moreover, expected security behaviours will be more accepted as
the way things are done within the organization when the example is set by the management.
Closely related to this, it is indispensable that organizational members have trust in the
management concerning security and vice versa. It will be easier to implement new security
strategies when the management of HEI’s trust all staff members and students.
Furthermore, when implementing improvement strategies in the field of security, it is
important to find a balance between safety and security. While security culture research can
be considered as a relatively new field and a topic that is still climbing higher on the business
agendas of organizations, the safety domain is characterized by a longer research tradition
and a strongly anchored position within organizations’ daily operations. HEI’s have often
implemented numerous safety measures, while they are still gradually considering the need
to protect themselves against security incidents as important. Although safety and security
differ on many areas, they also contain a lot of similarities. This implies that, when
implementing security measures, a strong overlap with safety measures is expected. On one
hand, measures taken in the field of security may also have a positive effect in the safety
domain and vice versa. For instance, awareness trainings aimed to improve participants’
security awareness may also result in more awareness of safety aspects among participants.
On the other hand, a contradiction may emerge when applying safety and security measures
in practice. For instance, from a security perspective it is indispensable that some buildings
(e.g., laboratories) are locked with a badge system. In case of a safety incident, however, it is
important that everyone can exit the building as quickly as possible, preferably without losing
time by using a badge. In other words, finding the right balance between safety and security
requires an adequate alignment between both types of measures in the two domains.
Finally, a regular follow-up of the implemented improvement strategies is needed in order to
maintain a strong security culture. Regular evaluations are indispensable in order to obtain
knowledge about whether recommendations from previous measurements were actually
implemented and the extent to which these security measures effectively improved HEI’s
security culture. Previous studies agree that the creation of a strong security culture should

Discussion and conclusion
218
be considered as a long-term and continuous process, which will take many years (Gaunt,
2000; Reniers et al., 2011).
9.2.2. Finding a balance between students’ and staff members’ security knowledge,
attitude and behaviour
Throughout this dissertation, we argued that HEI’s often overlook the importance of human
factors when investing in physical security. The TEAM-model in Chapter 2 showed that the
human aspects are an indispensable part of HEI’s security culture. In order to strengthen this
human domain, HEI’s should focus on students’ and staff members’ security awareness, or
their security knowledge, attitudes towards security and security behaviour. In Chapters 5 and
6, we empirically examined the effectiveness of security trainings and nudges for increasing
security awareness. Based on our findings and best practices from previous research, some
recommendations for the improvement of students’ and staff members’ security knowledge,
attitudes and behaviour are formulated. Additionally, some considerations when
implementing a security awareness program are highlighted.
9.2.2.1. Sufficient knowledge as the necessary foundation
In Chapter 5 of this dissertation, we found that staff members who have more security
knowledge also indicated to behave in a more secure way. In order to improve security
awareness, it is therefore indispensable that students and staff members acquire knowledge
about the potential risks on campus and the behaviour they can adopt to prevent criminal
incidents. As campus security is often not their main concern when performing activities on
campus, it is important that the most efficient, desirable and feasible awareness programs are
developed.
Our evaluation of the effectiveness of awareness trainings showed a positive impact on
participants’ knowledge about the security procedures and policies. Also in previous research,
education is considered as one of the most effective methods to transfer the necessary
information (Eminağaoğlu et al., 2009; Furnell & Clarke, 2005; Kim, 2014). In order to develop
efficient awareness trainings, the content plays a significant role (King et al., 2001; McCoy &
Fowler, 2004). In our trainings, we mainly focused on terrorism and radicalization at the
request of the university as they noticed some concerns about these topics among staff

Discussion and conclusion
219
members. In general, the information that is provided should be based on what participants
need to know about security, instead of what is nice to know. Subsequently, the information
communicated should always be adjusted to the participants of the training (McCoy & Fowler,
2004). Finding a balance between theoretical explanations and more practical security
guidelines is therefore indispensable.
Additionally, it is important that awareness programs do not take up too much time (King et
al., 2001). In our study, we organized the security trainings during lunchtime, so that staff
members had to invest as little working time possible. This approach led to the desired
outcome as the maximum number of registrations per training session was achieved. An
alternative format may be the organization of online trainings, which can be followed
whenever students or staff members have sufficient time. In addition to training sessions, also
other methods such as newsletter articles, email messages, posters, flyers or banners on the
intranet may be used to transfer security information to the target group. Regardless of which
method is used, it is recommended that the program is time efficient, focuses on what
participants must know and provides information that is adjusted to the audience.
9.2.2.2. Positive attitudes as the indispensable link in the awareness chain
Our findings showed that people’s attitudes towards security are an indispensable link
between their knowledge and behaviour. Increased attention for students’ and staff
members’ attitudes is therefore needed when organizing awareness programs. We argued
that some mediating or moderating factors could have an important role in the development
of attitudes towards security. For instance, according to Regan and Fazio (1977), individuals
who form their attitudes on direct behavioural interaction with the attitude’s object will show
significantly greater attitude-behaviour consistency than people whose attitudes are formed
by other means. When adapting this assumption on security awareness improvement
strategies, more interactive formats may have a greater impact on people’s attitudes.
Our awareness training only included a short moment of interaction at the end of the
presentation. Previous research has found that, in order to make trainings sessions more
effective, it is useful to include some discussion moments during the training (Albrechtsen &
Hovden, 2010). By discussing different security issues, knowledge can be shared among
participants which may influence their understanding of the security strategies of the

Discussion and conclusion
220
organization. By learning more about the attitudes of their colleagues, they may change their
own motivation in a positive way. Additionally, alternative and more interactive approaches,
such as penetration tests, red teaming, simulation attacks or interactive demos could increase
participants’ direct interaction with certain security topics, which may also lead to more
positive attitudes towards security.
Finally, in order to change people’s attitudes, it is indispensable that security is a natural part
of the organizational culture from day one students start to study or staff members start to
work at the HEI. On this moment, necessary security procedures need to be communicated to
indicate the expected level of security on campus and show the importance given to campus
security. Subsequently, regularly and various programs should be organized to maintain
attention for security among students and staff members. This way, attitudes towards security
can gradually be shaped which ideally leads to more secure behaviour.
9.2.2.3. Secure behaviour as the desired outcome
The security awareness programs and guidelines that were discussed in the previous
paragraphs all aim to achieve more secure behaviour among people. Our findings concerning
the impact of awareness trainings showed that they did not result in a significant change in
participants’ (self-reported) security behaviour. As an alternative approach, we examined the
effectiveness of nudging in Chapter 6, which did show a significant behavioural change among
cyclists. Also the limited amount of previous experiments with nudges in the field of physical
security proved to be successful (Gamman & Willcocks, 2010; Kuiper et al., 2016).
In our study, we implemented system 2 nudges in the format of a sticker and a post to target
people’s reflecting and conscious thinking. Both interventions contained a clear social norm
which referred to the approved behaviour and the behaviour that is set by other people.
Starting from the assumption that people tend to do what is socially approved and what is
popular, the inclusion of these social norms resulted in the desired outcome. Including social
norms in security awareness programs is therefore a recommended strategy to achieve the
desired behavioural outcome. Additionally, as the use of an image showing the behaviour that
was expected from the cyclists proved to be successful in our experiment, it is suggested that
the expected behaviour should be presented as simple and easy as possible. While we found
that the first nudge increased cyclists’ locking behaviour significantly, the combination of both

Discussion and conclusion
221
nudges showed less impact. Taking this into account, it is recommended to focus on one type
of nudge or message to direct people’s behaviour. Also in previous research it is argued that
a change in people’s behaviour is more difficult when the person is bombarded with a large
number of messages (Bada et al., 2019). Moreover, it is important that some ethical concerns
are born in mind when implementing nudges (Sunstein, 2015). Awareness is needed for the
thin line that separates nudging from the manipulation of choice and a lack of transparency
regarding underlying intentions. Finding a balance between individuals’ autonomy and
steering people’s behaviour into the ‘right’ direction is therefore indispensable, especially in
a higher educational environment where much importance is attached to freedom of choice.
Finally, Guagnano et al. (1995) argued that contextual conditions are important when
achieving the desired behaviour among the target population of an awareness program. Not
having two bicycle locks may be one of the reasons why some cyclists did not change their
behaviour during the nudging experiment. To refer to another example; when encouraging
students and staff members to report incidents, it is indispensable that an easy to use and
quickly available incident reporting system is implemented. In this light, it is recommended
that HEI’s provide sufficient security tools when stimulating people to behave in a more secure
way.
9.2.2.4. Considerations when organizing security awareness programs
In addition to the specific recommendations that were provided to increase people’s security
knowledge, attitudes and behaviour, some general considerations can be formulated when
organizing security awareness programs.
First, it is indispensable that all organizational members are involved in the awareness
program. As already mentioned before, a strong security culture can only be achieved when
everyone is included in the change process. Consequently, all organizational members should
be encouraged to participate in security awareness programs. Especially for HEI’s, this may
cause a big challenge as the student population changes every four or five years and also
within the staff member population there is often a quick turnover in the employment of
(foreign) researchers or teaching staff. Reaching specific groups, such as first-year students or
foreign doctoral students may be a challenge but is considered as indispensable.

Discussion and conclusion
222
Secondly, it is suggested that security awareness programs focus on topics that still could need
some improvement. Obtaining a baseline view or indication of how security aware students
and staff members are about certain topics is therefore necessary. Additionally, not only the
overall level of security awareness before and after the awareness program should be
measured, also the program itself needs evaluation. Based on an overview of the strengths
and weaknesses of the program, improvement strategies for more efficient initiatives may be
formulated. Similar to the measurement of HEI’s security culture, it is recommended to adopt
a multi-method approach when evaluating participants’ awareness and the program’s
effectiveness.
Thirdly, it is recommended to repeat awareness programs regularly in order to achieve long-
term changes in students’ and staff members’ knowledge, attitudes and behaviours. Although
educational methods are considered as one of the most effective and powerful mechanisms
to increase people’s awareness, the addition of other initiatives such as posters, flyers, videos,
demos or quizzes may be useful to highlight certain security topics that may be forgotten some
weeks after a training session. A combination of educational methods with ongoing awareness
campaigns is therefore recommended. For instance, the Center for the Protection of National
Infrastructure (CPNI), located in the United Kingdom, provides various examples of security
awareness campaigns on its website on which inspiration can be drawn (CPNI, 2020).
Finally, HEI’s should find the right balance between providing sufficient information and
causing increased fear of crime when implementing awareness programs. Previous research
has shown that fear invocations provide an insufficient change in behaviour (Bada et al., 2019).
Offering an adequate amount of information in the most appropriate format is therefore
needed in order to prevent an increase in fear of crime among students and staff members.
Closely related to this, encouraging people to undertake preventive actions should always be
accompanied with the implementation of security measures aimed at discouraging
perpetrators from commit crimes. A one-sided focus on the responsibilities of potential
victims needs to be avoided.

Discussion and conclusion
223
9.2.3. Finding a balance between the open campus design and students’ and staff
members’ feelings of security
As HEI’s are by their very nature open-access environments where people move between and
among buildings and outdoor spaces, it is one of HEI’s major challenges to create a secure
environment for students and staff members while maintaining an open campus. Our
empirical studies on the impact of disorder on students’ fear of crime (Chapter 7) and the
relationship between CPTED and fear of crime among students and staff members (Chapter
8), showed that the campus design plays an important role in feelings of security among
campus’ residents. In this light, we propose the following recommendations.
9.2.3.1. Tackling disorder as a key strategy
Our findings showed that students indicated to experience more fear of crime on campuses
where they noticed a higher presence of social and physical disorder. Both the campus and its
neighbourhood can be considered as hotspots for crime and disorder. The presence of leisure
venues, such as bars, restaurants or shopping venues contribute to the attractiveness of these
areas. As higher levels of disorder are expected, tackling social and physical disorder can be
considered as an important strategy to create an environment where students and staff
members feel more secure.
In order to reduce disorder on campus, HEI’s may focus on tasks such as regularly cleaning the
classrooms, providing a quick follow up on reported infrastructural defects or ensuring that
there are enough garbage bins on campus. These are, however, activities that are often
inherently linked to the normal duties of HEI’s. In addition, an alternative approach may be
found in the use of nudges. While we experimented with nudges to create more awareness
about bicycle theft, previous studies and field experiments showed that nudges may also be
effective in reducing physical and social disorder. For instance, to prevent and reduce loitering,
various designs of garbage bins have been developed (Kolodko et al., 2016; Mazar et al., 2013),
mirrors were installed in more vandalised neighbourhoods to influence people’s self-
awareness (De Kort et al., 2008) and footsteps were placed on the ground to direct people to
garbage bins (Keep Britain Tidy, 2013; Webster, 2012; Zero Waste Scotland, 2015). To prevent
social disorder, experiments have been carried out to prevent fighting by installing mirrors
and red carpets in entertainment areas (CCV, 2015), to reduce public urinating by placing

Discussion and conclusion
224
footsteps on the ground to direct people to public toilets (Celis, 2020), or to limit the presence
of drunk people by sending students text messages to encourage them to think about their
drinking behaviour (Lesner et al., 2020). Both our experiences with nudges and the
aforementioned examples show that this approach may be a successful and cost-effective
strategy to reduce physical and social disorder on campus and in its neighbourhood.
Additionally, awareness programs could be efficient in encouraging students and staff
members to keep the campus clean and to avoid showing socially undesirable behaviour. This
recommendation is supported by previous researchers who emphasize that campaigns can be
implemented very easy without being too expensive, especially compared with other
technological measures (Jennings et al., 2007; Sani et al., 2020). Similar methods as described
in section 9.2.2. may be used to make people more aware of the importance of the absence
of disorder. Finally, when preventing and tackling disorder in the neighbourhood of the
campus, close cooperation between HEI’s and local authorities is needed. Actors such as the
police department, community guards and local entrepreneurs are considered valuable
stakeholders when implementing nudges or awareness programs. It is therefore a
responsibility of HEI’s to initiate and maintain partnership with local authorities.
9.2.3.2. Hedges and shrubs as crime prevention measures
In addition to the relationship between disorder and fear of crime, our findings showed that
also other contextual factors, such as the presence of CPTED measures, play an important role
in the feelings of insecurity among students and staff members. More specifically, we found
that lower levels of fear among students and staff members were related to a higher presence
of CPTED principles maintenance, access control and territoriality. Higher levels of fear were
found at campuses characterized by less surveillance measures.
The CPTED principle maintenance starts from the assumption that visible well-maintained and
attractive spaces reduce crime and fear of crime. In this light, we refer to the previous section
where some guidelines to tackle disorder were provided. To ensure more territoriality on
campus, various landscaping elements, such as fencing, hedges or shrubs may be
implemented. By making a distinction between the campus and the public environment, a
sense of ownership is created which may deter crime and disorder. Clearly indicating the
presence of HEI buildings (e.g., by arrows or signs) may also contribute to more territoriality.

Discussion and conclusion
225
The principle access control assumes that crime is more likely in highly accessible areas. To
find the right balance between the open campus design and a limited access for people who
do not necessarily need to be on campus, some access restrictions may be applied. Off-limit
areas of campus property, such as server rooms, laboratories or computer labs, could be
equipped with locks or badge control systems to keep intruders out. Implementing reception
areas at buildings that should not be accessible for everyone also increases the presence of
access control.
The surveillance principle assumes that crime is less likely to occur as deviant behaviour can
be noticed and reported more easily. It involves the implementation of mechanical
surveillance, such as CCTV, or formal surveillance, such as the presence of security guards,
police patrols or community guards. Additionally, the importance of natural surveillance is
emphasized. Concerning HEI’s, this form of surveillance may be performed by students and
staff members, but also by other people such as residents of the campus neighbourhood,
shopkeepers in these areas or even pedestrians walking along the campus. In order to increase
natural surveillance, HEI’s should create highly visible areas with little opportunities for
potential perpetrators to hide, for instance by keeping shrubs low and avoiding the
implementation of high fences. Additionally, previous studies showed that the presence of
lighting positively influenced people’s feelings of anxiety (Tseng et al., 2004; Vos et al., 2015)
and found a significant decrease in areas that were well lit (van Noije & Wittebrood, 2008).
Based on these findings, spaces that are poorly lit should be reduced on campus.
In light of our results, it is suggested that CPTED may be an efficient security measure for HEI’s
who aim to maintain an open campus design. CPTED measures are often easily accessible and
may be implemented in any area on campus and in its neighbourhood. Moreover, as this type
of measures can be applied in the design phase of new buildings or areas in a very natural
way, they can be considered as cost-effective.
9.3. Limitations and future research
Although this dissertation offers several valuable contributions to the existing research on
campus security and the human factors of security culture, these should be interpreted while
keeping some limitations in mind. Although the shortcomings of this research to the field(s)

Discussion and conclusion
226
of study and to policy have been articulated throughout this dissertation, some points warrant
further reflection. A distinction is made between general limitations that apply to the
dissertation as a whole and limitations that are inherently linked to the methodological
approaches of the empirical studies. In the following paragraphs we will highlight some
limitations by linking them to opportunities for future research.
9.3.1. General limitations
As was already discussed in Chapters 2 and 3 of this dissertation, there does not exist a widely
accepted definition of physical security culture nor is there a standardized instrument for
measuring an organization’s security culture available. We aimed to present a conceptual
model of physical security and provided recommendations for the development of a
standardized measurement instrument, based on a literature review and systematic review.
Among other insights, this extensive search of literature showed that there is clearly a lack of
research on physical security culture. Throughout this dissertation, we had to draw inspiration
from other research fields, such as safety sciences or information security. Moreover, the
limited amount of studies that examined physical security mainly focused on one type of
organization, such as nuclear of chemical companies. Although studies originating from these
related domains and sectors offered valuable information, it is certainly a limitation that we
could not rely on previous research that examined physical security in a more comprehensive
way. We aimed to fill this research gap by carrying out four empirical studies on physical
security, but we also focused on one specific type of organization. It is therefore
recommended for future research to further explore the security domain and carry out
empirical research within different types of organizations as not only HEI’s, but also other
organizations are increasingly confronted with various types of security threats. Additionally,
it would be useful to focus on all three domains of security culture (i.e., technological,
organizational and human domains). Considering the specific campus environment and as a
way of determining the scope of this dissertation, we focused predominantly on the human
domain of physical security. Although we aimed to not separate this from the other domains
by regularly referring to technological and organizational aspects, more research is needed on
all three domains.

Discussion and conclusion
227
Additionally, we did not only focus on one type of organization, but we also carried out all
empirical studies at one HEI (i.e., the University of Antwerp). As this research project was
initiated by the university itself, it was clear from the beginning that the four campuses would
serve as the main research area. With the support of the University of Antwerp, we were able
to distribute two large-scale surveys among the entire student and staff member population,
we had the possibility to organize awareness trainings on campus and we could experiment
with nudges in the neighbourhood of the campus. Although these research opportunities led
to valuable insights in campus security, the specific characteristics of the University of
Antwerp should be considered when interpreting the results and applying them to other HEI’s.
As we acknowledged this limitation from the start of this research project, we aimed to
provide sufficient information about the university itself, its design and the student and staff
member population in the empirical studies. Additionally, insights that were obtained from
the qualitative in-depth interviews with security managers from other HEI’s in Belgium and
The Netherlands were taken into account during the research project. Subsequently,
throughout this dissertation we aimed to compare findings from the limited amount of studies
on campus security that were carried out in Europe with our empirical results. However,
future research on campus security on other HEI’s is needed in order to examine whether our
findings can be generalized to other universities in Belgium and abroad.
Another limitation can be attributed to the absence of crime statistics in this dissertation.
Although we have repeatedly requested these statistics from the police authorities, we were
not able to obtain them. Official statistics would have been useful, for instance, to measure
the effectiveness of the nudges based on a comparison of the number of bicycle thefts before
and after the interventions. Although reported crimes reflect only a part of all crimes that are
committed, it is recommended for future research to take these statistics into account as they
could provide valuable information about the effectiveness of security measures or serve as
potential mediators in people’s fear of crime on campus.
9.3.2. Methodological limitations
Besides general limitations attributed to the dissertation as a whole, some methodological
shortcomings that are linked to the empirical studies have to be mentioned.

Discussion and conclusion
228
First, it should be pointed out that all empirical studies included in this dissertation used cross-
sectional designs. For instance, in Chapter 7 we examined the relationship between the
presence of disorder and students’ fear of crime based on data obtained from a survey. As this
methodological approach can be considered a snapshot in time, this limits the possibility to
find a causal link between the included concepts. In other words, it is impossible to declare
with certainty whether it is fear of crime that determines the significance of disorder within
the neighbourhood or whether it is the perceptions of disorder that shape subsequent levels
of fear. A more longitudinal approach would be required in order to examine whether
students’ fear of crime changes over time. Especially for HEI’s, which are characterized by a
student population that changes every four or five years, obtaining an overview of changes in
students’ fear of crime over the years would be useful. Additionally, these fears may also be
related to the occurrence of major crime events, such as a terrorist attack, which makes a
regularly follow-up very interesting. Closely related to this, it is another limitation that we did
not include a number of variables noted to mediate people’s fear of crime. Amongst others,
factors such as ethnic diversity (Hooghe & De Vroome, 2016), socio-economic status (McCrea
et al., 2005), social networks (Scarborough et al., 2010) or news exposure (Romer et al., 2003)
could have played a role in students’ and staff members’ fear of crime. As such, it is
recommended to include more of these variables in future research, when examining fear of
crime.
Secondly, some other limitations can be attributed to the design of the two large-scale surveys
that were carried out among students and staff members. As the respondents could
voluntarily choose to fill in the questionnaires, this self-utilizing character can be considered
as a potential limitation. Using a non-random selected research sample may have the
implication that people who already had a greater interest in campus security were more like
to participate in the study. Additionally, by using this research design, we were not able to
control the equal distribution of the demographic characteristics of the participants.
Replications with more representative samples are needed to exclude specific effects on the
results. Another limitation of the surveys is linked to the included measures, which were not
controlled in terms of possible response biases, such as social desirability. This can mainly be
considered as a limitation with regard to staff members’ reported level of security awareness.
As they had to indicate to what extent they knew the security procedures and policies of the

Discussion and conclusion
229
university, and to what extent they (would) perform a certain behaviour, their answers are
highly susceptible to socially desirable behaviour. As such, it is recommended for future
research to control for social desirability or other response biases. Also alternative
methodological approaches may be used to measure the actual level of security knowledge or
behaviour, for instance by awareness quizzes (Khan et al., 2020), interviews (Parsons et al.,
2014), group conversations (Albrechtsen & Hovden, 2010) or observations (Rantos et al.,
2012).
Thirdly, the two quasi-experiments that were carried out have the limitation in common that
the results are only valid for short-term conclusions. In the first experiment with security
trainings, the post-test was carried out approximately two weeks after the training was
organized. Although the nudging experiment was carried out for 12 weeks, we were not able
to observe long-term changes in cyclists’ locking behaviour. Because little research has been
carried out on the long-term effect of trainings or nudges, it is recommended for future
research to fill in this research gap and repeat evaluations after some time.
Regardless of the limitations that are inevitably linked to every study, this dissertation
provided unique and valuable insights in campus security. We are convinced that the
conclusions and recommendations of this dissertation could be very helpful for both HEI’s and
researchers. We hope that this dissertation is the starting point of an increasing trend in
research on physical security in general and campus security in particular. Additionally, we
hope that our recommendations may help security managers of HEI’s to strengthen the
human security domain by making students and staff members more aware of security and
most of all, create a secure campus environment where everyone feels free to study, work
and perform other activities.

Discussion and conclusion
230
9.4. References
Ajzen, I. (1991). The theory of planned behaviour. Organizational Behaviour and Human
Decision Process, 50(2), 179-211.
Albrechtsen, E., & Hovden, J. (2010). Improving information security awareness and behaviour
through dialogue, participation and collective reflection. An intervention study.
Computers & security, 29(4), 432-445.
AlHogail, A., & Mirza, A. (2015). Organizational information security culture assessment.
Proceedings of the International Conference on Security and Management (SAM),
Alnatheer, M., Chan, T., & Nelson, K. (2012). Understanding And Measuring Information
Security Culture. In S. L. Pan & T. H. Cao, Proceedings of the 16th Pacific Asia
Conference on Information Systems (PACIS). PACIS 2012, University of Science
(Vietnam).
Alnatheer, M. A. (2012). Understanding and measuring information security culture in
developing countries: case of Saudi Arabia [Paper presentation]. Queensland
University of Technology.
AUCSO. (2016). AUCSO. Securing your campus. https://www.aucso.org/
Ayim Gyekye, S. (2005). Workers’ perceptions of workplace safety and job satisfaction.
international Journal of occupational safety and ergonomics, 11(3), 291-302.
Bada, M., Sasse, A. M., & Nurse, J. R. (2019). Cyber security awareness campaigns: Why do
they fail to change behaviour? arXiv preprint arXiv:1901.02672.
Baranowski, T., Cullen, K. W., Nicklas, T., Thompson, D., & Baranowski, J. (2003). Are current
health behavioral change models helpful in guiding prevention of weight gain efforts?
Obesity research, 11(S10), 23S-43S.
British Council. (2012). Student insight hot topics: The rise in global student safety concerns.
https://www.britishcouncil.org/voices-magazine/uk-number-one-studyabroad-
destination-us-students
CCV. (2015). Trends Uitgaansgeweld: Centrum voor Criminaliteitspreventie en Veiligheid.
Celis, M. (2020). Thou shalt not pee in public: Een case study over nudging tegen wildplassen
in een Gentse uitgaansbuurt Ghent University [M.A. Thesis]. Ghent.
Chia, P. A., Maynard, S. B., & Ruighaver, A. B. (2002). Understanding organizational security
culture. Proceedings of PACIS2002. Japan, 158.

Discussion and conclusion
231
Conner, M., Sparks, P., Povey, R., James, R., Shepherd, R., & Armitage, C. J. (2002). Moderator
effects of attitudinal ambivalence on attitude–behaviour relationships. European
Journal of Social Psychology, 32(5), 705-718.
CPNI. (2020). Security campaigns. https://www.cpni.gov.uk/security-campaigns
De Jager, J., & Bezuidenhout, G. (2014). Customer satisfaction at private higher education
institutions in South Africa: an importance-performance analysis. Journal of
Contemporary Management, 11(1), 206-229.
De Kort, Y. A., McCalley, L. T., & Midden, C. J. (2008). Persuasive trash cans: Activation of
littering norms by design. Environment and Behavior, 40(6), 870-891.
Eminağaoğlu, M., Uçar, E., & Eren, Ş. (2009). The positive outcomes of information security
awareness training in companies–A case study. information security technical report,
14(4), 223-229.
Furnell, S., & Clarke, N. (2005). Organizational security culture: Embedding security awareness,
education, and training. Proceedings of the IFIP TC11 WG, 11, 67-74.
Gamman, L., & Willcocks, M. (2010). ATM and cashpoint art: what’s at stake in designing
against crime (ATM and Cashpoint Art, Issue.
Gaunt, N. (2000). Practical approaches to creating a security culture. International journal of
medical informatics, 60(2), 151-157.
Guagnano, G. A., Stern, P. C., & Dietz, T. (1995). Influences on attitude-behavior relationships:
A natural experiment with curbside recycling. Environment and Behavior, 27(5), 699-
718.
Hinkle, J. C., & Yang, S.-M. (2014). A new look into broken windows: What shapes individuals’
perceptions of social disorder? Journal of Criminal Justice, 42(1), 26-35.
Hollander, J. A. (2001). Vulnerability and dangerousness: The construction of gender through
conversation about violence. Gender & society, 15(1), 83-109.
Hooghe, M., & De Vroome, T. (2016). The relation between ethnic diversity and fear of crime:
An analysis of police records and survey data in Belgian communities. International
Journal of Intercultural Relations, 50, 66-75.
International Atomic Energy Agency. (2017). Self-Assessment of Nuclear Security Culture in
Facilities and Activities. In: International Atomic Energy Agency Vienna, Austria.
Jennings, W. G., Gover, A. R., & Pudrzynska, D. (2007). Are institutions of higher learning safe?
A descriptive study of campus safety issues and self‐reported campus victimization

Discussion and conclusion
232
among male and female college students. Journal of Criminal Justice Education, 18(2),
191-208.
Keep Britain Tidy. (2013). Green footprints Report. Retrieved 17 February 2021 from
https://www.keepbritaintidy.org/sites/default/files/resources/KBT_CFSI_Green_Foot
prints_Report_2015.pdf
Khan, A. H., Sawhney, P. B., Das, S., & Pandey, D. (2020). SartCyber Security Awareness
Measurement Model (APAT) [Paper presentation]. 2020 International Conference on
Power Electronics & IoT Applications in Renewable Energy and its Control (PARC), GLA
University, Mathura, India.
Kim, E. B. (2014). Recommendations for information security awareness training for college
students. Information Management & Computer Security.
King, S. B., King, M., & Rothwell, W. J. (2001). The Complete Guide to Training Delivery: A
Competency-Based Approach. ERIC.
Kolodko, J., Read, D., & Taj, U. (2016). Using behavioural insights to reduce littering in the UK.
WBS, Gret Britain.
Kraemer, S., Carayon, P., & Clem, J. (2009). Human and organizational factors in computer and
information security: Pathways to vulnerabilities. Computers & security, 28, 509-520.
Kuiper, J., Meijer, S., van der Wiele, D., & Meijer, K. (2016). Veiligheidsverleiding.
https://hetccv.nl/fileadmin/Bestanden/Onderwerpen/Zintuigbenvloeding/Veiligheids
verleiding_14-12.pdf
Lesner, R. V., Greve, J., & Andrade, S. B. (2020). A Randomized Controlled Trial to Investigate
the Impact of Nudging University Students to Reduce Risky Alcohol Consumption.
Maier, S. L., & DePrince, B. T. (2020). College students’ fear of crime and perception of safety:
The influence of personal and university prevention measures. Journal of criminal
justice education, 31(1), 63-81.
Martins, N., Da Veiga, A., & Eloff, J. H. (2007). Information security culture-validation of an
assessment instrument. Southern African Business Review, 11(1), 147-166.
Mazar, N., Ly, K., Zhao, M., & Soman, D. (2013). A practitioner's guide to nudging.
McCoy, C., & Fowler, R. T. (2004). " You are the key to security" establishing a successful
security awareness program. Proceedings of the 32nd annual ACM SIGUCCS
conference on User services,
Discussion and conclusion
233
McCrea, R., Shyy, T.-K., Western, J., & Stimson, R. J. (2005). Fear of crime in Brisbane:
Individual, social and neighbourhood factors in perspective. Journal of Sociology, 41(1),
7-27.
Newbould, M., & Furnell, S. (2009). Playing safe: A prototype game for raising awareness of
social engineering [Paper presentation]. 7th Australian information security
management conference, Perth, Western Australia.
Nielsen, M. B., Mearns, K., Matthiesen, S. B., & Eid, J. (2011). Using the Job Demands–
Resources model to investigate risk perception, safety climate and job satisfaction in
safety critical organizations. Scandinavian Journal of Psychology, 52(5), 465-475.
Pain, R. (2001). Gender, race, age and fear in the city. Urban studies, 38(5-6), 899-913.
Parsons, K., McCormac, A., Butavicius, M., & Ferguson, L. (2010). Human factors and
information security: individual, culture and security environment.
Parsons, K., McCormac, A., Pattinson, M., Butavicius, M., & Jerram, C. (2014). A study of
information security awareness in Australian government organisations. Information
Management & Computer Security, 22(4), 334-345.
Rantos, K., Fysarakis, K., & Manifavas, C. (2012). How effective is your security awareness
program? An evaluation methodology. Information Security Journal: A Global
Perspective, 21(6), 328-345.
Regan, D. T., & Fazio, R. (1977). On the consistency between attitudes and behavior: Look to
the method of attitude formation. Journal of experimental social psychology, 13(1), 28-
45.
Reniers, G. L., Cremer, K., & Buytaert, J. (2011). Continuously and simultaneously optimizing
an organization’s safety and security culture and climate: the Improvement Diamond
for Excellence Achievement and Leadership in Safety & Security (IDEAL S&S) model.
Journal of Cleaner Production, 19(11), 1239-1249.
Romer, D., Jamieson, K. H., & Aday, S. (2003). Television news and the cultivation of fear of
crime. Journal of communication, 53(1), 88-104.
Sani, A., Nunes, L. M., Azevedo, V., & Sousa, H. F. (2020). Campus criminal victimization among
higher education students: a diagnosis of local security in Porto. Journal of Criminal
Justice Education, 31(2), 250-266.

Discussion and conclusion
234
Scarborough, B. K., Like-Haislip, T. Z., Novak, K. J., Lucas, W. L., & Alarid, L. F. (2010). Assessing
the relationship between individual characteristics, neighborhood context, and fear of
crime. Journal of criminal justice, 38(4), 819-826.
Schlienger, T., & Teufel, S. (2003). Analyzing information security culture: increased trust by an
appropriate information security culture [Paper presentation]. 14th International
Workshop on Database and Expert Systems Applications, 2003, Prague, Czech
Republic.
Schokkenbroek, J., Sas, M., Ponnet, K., & Hardyns, W. (2020). Seksuele intimidatie in (dating-)
relaties en de publieke ruimte: een vergelijking tussen twee survey-onderzoeken bij
Vlaamse universiteitsstudenten. Panopticon, 41(1), 99.
Sunstein, C.R. (2015). The ethics of nudging. Yale Journal on Regulation, 32, 413-452.
Tseng, C.-H., Duane, J., & Hadipriono, F. (2004). Performance of campus parking garages in
preventing crime. Journal of Performance of Constructed Facilities, 18(1), 21-28.
van Noije, L., & Wittebrood, K. (2008). Sociale veiligheid ontsleuteld.
Vierendeels, G., Reniers, G., van Nunen, K., & Ponnet, K. (2018). An integrative conceptual
framework for safety culture: The Egg Aggregated Model (TEAM) of safety culture.
Safety science, 103, 323-339.
Vos, M., Van Hagen, M., & Spoorwegen, N. (2015). Licht op treinstations. Contribution to
Colloquium Vervoersplanologisch Speurwerk (CVS), 19 en 20 november 2015,
Antwerpen: CVS,
Webster, G. (2012). Is a 'nudge' in the right direction all we need to be greener? Retrieved 17
February 2021 from https://edition.cnn.com/2012/02/08/tech/innovation/green-
nudge-environment-persuasion/index.html
Winter, D. (2007). Security culture in the nuclear field. In I. Khipunov, N. Ischenko, & J. P.
Holmes (Eds.), Nuclear security culture: From national best practices to international
standards (Vol. 28, pp. 63). IOS Press.
Zero Waste Scotland. (2015). Nudge study, implementation kit: promoting the use of street
litter bins.
https://www.zerowastescotland.org.uk/sites/default/files/ZWS%20Litter%20Nudge%20Stud
y.pdf

Author contributions
Table 9.1. Overview of the doctoral candidate’s contributions to each study.
Chapter Title Authors Drs.’ contribution
1 Introduction Marlies Sas
Writing
2 An integrative conceptual framework for physical security culture in organizations
Karolien van Nunen, Marlies Sas, Genserik Reniers, Geert Vierendeels, Koen Ponnet, & Wim Hardyns
Data collection, & writing
3 Measuring the security culture in organizations: a systematic overview of existing tools
Marlies Sas, Wim Hardyns, Karolien van Nunen, Genserik Reniers, & Koen Ponnet
Research design, data collection, data analysis, chapter conceptualization, & writing
4 Measuring CPTED and disorder through different systematic social observation methods: in-situ observations, original photographs and Google Street View images
Marlies Sas, Thom Snaphaan, Lieven Pauwels, Koen Ponnet, & Wim Hardyns
Research design, chapter conceptualization, & writing
5 The impact of training sessions on physical security awareness: Measuring employees’ knowledge, attitudes and self-reported behaviour
Marlies Sas, Genserik Reniers, Koen Ponnet, & Wim Hardyns
Research design, data collection, data analysis, chapter conceptualization, & writing
6 Nudging as a crime prevention strategy: the use of nudges to improve cyclists’ locking behaviour and reduce the opportunities for bicycle theft
Marlies Sas, Koen Ponnet, Genserik Reniers, & Wim Hardyns
Research design, data collection, data analysis, chapter conceptualization, & writing
7 Unravelling college students’ fear of crime: the role of perceived social disorder and physical disorder on campus
Marlies Sas, Wim Hardyns, Genserik Reniers, & Koen Ponnet
Research design, data collection, chapter conceptualization, & writing
8 The relationship between crime prevention through environmental design (CPTED) and fear of crime: A multi-method approach in four university campus neighbourhoods
Marlies Sas, Koen Ponnet, & Wim Hardyns
Research design, data collection, data analysis, chapter conceptualization, & writing
9 Discussion, conclusion and recommendations
Marlies Sas Writing

236
Overview of all publications emerging from this research project
• van Nunen, K., Sas, M., Reniers, G., Vierendeels, G., Ponnet, K., & Hardyns, W. (2018). An
integrative conceptual framework for physical security culture in organisations. Journal of
Integrated Security Science, 2(1), 25-32.
• Sas, M., van Nunen, K., Reniers, G., Ponnet, K., & Hardyns, W. (2019). Omgaan met
beveiligingsdreigingen: when safety meets security. Veiligheidsnieuws, 204, 6-10.
• Sas, M., Reniers, G., Hardyns, W., & Ponnet, K. (2019). The impact of training sessions on
security awareness : measuring the security knowledge, attitude and behaviour of
employees. Chemical Engineering Transactions, 77, 895-900.
• Sas, M., Hardyns, W., Ponnet, K., & Reniers, G. (2019). Radicalisering op de campus: welke
rol kunnen hogeronderwijsinstellingen opnemen bij het voorkomen en aanpakken van
radicalisering bij jongeren?. Tijdschrift voor onderwijsrecht en onderwijsbeleid, 3, 221-230.
• Sas, M., Reniers, G., Ponnet, K., & Hardyns, W. (2020). De introductie van risicoanalyse in
de aanpak van criminaliteit. In Hardyns, W., & Snaphaan, T. (eds.) Big data en innovatieve
methoden voor criminologisch onderzoek. Boom.
• Sas, M., Hardyns, W., Ponnet, K., & Reniers, G. (2020). Emergency management: Crisis
communication. In Shapiro, L.R., & Maras, M. (eds.) Encyclopedia of security and
emergency management (pp.1-8). Springer.
• Sas, M., Ponnet, K., Reniers, G., & Hardyns, W. (2020). The role of education in the
prevention of radicalization and violent extremism in developing countries. Sustainability,
12(6), 2320.
• Schokkenbroek, J., Sas, M., Ponnet, K., & Hardyns, W. (2020). Seksuele intimidatie in
(dating-) relaties en de publieke ruimte: een vergelijking tussen twee survey-onderzoeken
bij Vlaamse universiteitsstudenten. Panopticon: tijdschrift voor strafrecht, criminologie en
forensisch welzijnswerk, 41(1), 99-106.
• Sas, M., Hardyns, W., van Nunen, K., Reniers, G., & Ponnet, K. (2020). Measuring the
security culture in organizations: a systematic overview of existing tools. Security Journal,
34(2), 340-357.
• Sas, M., Reniers, G., van Nunen, K., Hardyns, W., & Ponnet, K. (2020). Adequaat
risicomanagement voor fysieke beveiliging: het gebruik van modellen en metaforen

237
gebaseerd op kennis uit het veiligheidsdomein. Tijdschrift voor toegepaste
arbowetenschap, 33(3), 93-103.
• Sas, M., Hardyns, W., Reniers, G., & Ponnet, K. (2021). Unravelling college students’ fear
of crime: the role of perceived social disorder and physical disorder on campus. British
Journal of Educational Studies, 1-21.
• Sas, M., Ponnet, K., Reniers, G., & Hardyns, W. (2021). Nudging as a crime prevention
strategy: the use of nudges to improve cyclists’ locking behavior and reduce the
opportunities for bicycle theft. Security Journal, 1-23 (published online first).
• Sas, M., Reniers, G., Ponnet, K., & Hardyns, W. (in review). The impact of training sessions
on physical security awareness: Measuring employees’ knowledge, attitude and self-
reported behaviour.
• Sas, M., Hardyns, W., Anrijs, S., Benschop, V., Reniers, G., & Ponnet, K. (2021). Kiezen voor
een hogeschool of universiteit: een kwestie van ‘the safest choice’?. Tijdschrift voor
onderwijsrecht en onderwijsbeleid, 3, 241-253.
• Sas, M., Snaphaan, T., Pauwels, L., Ponnet, K., & Hardyns, W. (in review). Measuring CPTED
and disorder through different systematic social observation methods: in-situ
observations, original photographs and Google Street View images.
• Sas, M., Ponnet, K., & Hardyns, W. (in review). The relationship between crime prevention
through environmental design (CPTED) and fear of crime: A multi-method approach in four
university campus neighborhoods.
• Reveraert, M., Sas, M., Reniers, G., Hardyns, W., & Sauer, T. (in review). A typology of
insider threats applied to higher education.

238