unrelated business income - internal revenue service · income is investments, the annual amounts...
TRANSCRIPT

57
by Margaret Riley
Margaret Riley is a statistician with the Special StudiesSpecial Projects Section. This article was preparedunder the direction of Barry W. Johnson, Chief.
T he number of tax-exempt organizations filingForms 990-T, Exempt Organization BusinessIncome Tax Returns, decreased only slightly
between Tax Years 2001 and 2002, from 35,540 to35,103. However, 2002 marked the fourth consecu-tive year of declining filings of Forms 990-T to report“unrelated business income” (UBI) and taxes. FromTax Year 1998 to Tax Year 2002, the number oforganizations filing Forms 990-T dropped nearly 25percent. The 13,395 returns filed with gross UBI of$10,000 or less represented a 6 percent increase over2001, but a 40 percent decrease since 1998. Thenumber of returns with gross UBI over $10,000 fellby 10 percent over the 4-year period. Figure Acontains these and other statistics for selected majorfinancial data items reported on Forms 990-T for TaxYears 1998, 2001, and 2002.
Gross UBI reported on Forms 990-T, which wasan aggregate $7.8 billion for 2002, grew by 11 per-cent between 1998 and 2000, but then declined by 8percent from 2000 to 2002, resulting in an overall2.5 percent growth from 1998 to 2002. After offset-ting total gross UBI with $7.9 billion of total deduc-tions, the resulting unrelated business taxable income(less deficit) was -$0.1 billion for 2002. Unrelatedbusiness (positive) taxable income (UBTI) of $647.2million and the associated unrelated business incometax (UBIT) of $194.1 million reported on Tax Year2002 Forms 990-T were a respective 18 percent and1 percent less than that reported for 2001 [1]. From1998 to 2002, taxable income and the associatedUBIT liability declined sharply, by 61 percent and 62percent, respectively.
Figure B shows the computation of total taxliability for Tax Year 2002. After adjusting UBITwith certain credits and other taxes, the resulting totaltax reported on Form 990-T for 2002 was $192.7million, a 13 percent decrease from 2001. Total taxfor 2002 takes into account $194.1 million of UBIT,plus $1.1 million of alternative minimum tax, $1.1million of “proxy tax” on certain nondeductible lobby-ing and political expenditures, and $0.07 million of“other” taxes, minus $3.6 million of tax credits [2, 3].
Tax credits included the foreign tax credit ($1.6million), general business credit ($1.4 million), creditfor prior-year minimum tax ($0.3 million), and “other”credits ($0.2 million). (Detail does not equal totalsbecause of rounding.)
Declines in Unrelated Business Taxable Incomeand TaxThe decline between 1998 and 2002 in the UBTI oftax-exempt trusts was much greater than the declinein the UBTI of tax-exempt corporations [4]. As aresult of the more rapid decline in the UBTI reportedby tax-exempt trusts, the share of UBTI reported bytax-exempt corporations increased from 51 percentto 70 percent, respectively, of the total amount ofUBTI reported for 1998 and 2002 [5]. The $192.6million of UBTI reported by tax-exempt trusts for2002 reflected a 76 percent drop from the $811.1million reported for 1998, while the UBTI reported bytax-exempt corporations declined by 47 percent, from$858.7 million to $454.6 million between 1998 and2002. The UBIT liability of trusts decreased by 72percent during this 4-year period, while that of tax-exempt corporations declined by 52 percent.
In large part, the decline in the amount of UBTIreported by trusts filing Forms 990-T can be attrib-uted to IRC section 501(c)(9) voluntary employees’beneficiary associations (VEBAs) and section 401(a)pension, profit-sharing, and stock bonus plans [6].(The various types of tax-exempt organizationssubject to the unrelated business income tax provi-sions are described, by Code section, in the Appendixto this article.) These organizations together ac-counted for a respective 92 percent and 78 percentof the UBTI of trusts for 1998 and 2002. The UBITof VEBAs fell by 83 percent between the 4 years,and that of section 401(a) trusts fell by 68 percent.
Among the many factors that can influence theamount of an organization’s unrelated business tax-able income and tax, the types of unrelated businessactivities in which they engage, and which generatetheir various types of unrelated business income, arekey. Volatility of financial markets during the 1999 to2002 period appears to be responsible for some of theannual decreases in unrelated business taxable in-come and tax reported, especially by tax-exempttrusts. Since these types of entities’ main source ofincome is investments, the annual amounts of total
Unrelated Business Income Tax Returns, 2002:Financial Highlights and Special Analyses of Exempt-Organization Reporting Quality

58
Unrelated Business Income Tax Returns, 2002: Financial Highlights and SpecialAnalyses of Exempt-Organization Reporting Quality
58
UBI that they report are linked more closely to finan-cial market fluctuations than UBI amounts reportedby other types of organizations.
The two main sources of UBI for section501(c)(9) VEBAs consistently have been investmentincome (less loss) and capital gain net income. Forthe section 401(a) trusts, combined partnership and Scorporation income and capital gain net income arethe two main UBI producers. For tax-exempt corpo-rations, the two largest sources of unrelated businessincome traditionally have been gross profit (less loss)from sales and services, and advertising income.Generally, investment income of section 501(c)corporations, except for those exempt under sections501(c)(7), (9), and (17), is not taxed as unrelatedbusiness income. (See the definition of InvestmentIncome (Less Loss) in the Explanation of Termssection of this article.)
Between 1998 and 2002, investment income (lessloss) and capital gain net income reported by section501(c)(9) VEBA trusts with taxable income were 77percent and 93 percent less than respective amountsreported for 1998. These two income items ac-
counted for 95 percent of taxable VEBA trusts’gross UBI for 2002. Capital gain net income andcombined partnership and S corporation income ofsection 401(a) trusts fell by a respective 74 percentand 64 percent between the 2 years, and 88 percentof gross UBI was attributable to these items for2002. Incorporated organizations with taxable unre-lated business income reported a 9 percent increasein gross profit (less loss) from sales and services anda 16 percent increase in advertising income between1998 and 2002. Together, these income sourcesaccounted for 67 percent of their 2002 gross UBI.
The number of trusts with positive UBTI de-creased by 71 percent from 1998 to 2002, from11,044 to 3,156, compared to a decline of 15 percentfor corporations, from 13,395 to 11,339. Most of thedecline in the number of trusts was accounted for bythe 77 percent decline in the number of IRC section408(e) traditional IRA trusts reporting UBTI, from9,741 to 2,253. However, these organizations ac-counted for only 4 percent to 5 percent of all trusts’UBTI for each of the 2 years. A substantial portionof the gross UBI of smaller traditional IRA trusts
Figure A
[Money amounts are in thousands of dollars]
2001 to 2002 1998 to 2002(1) (2) (3) (4) (5)
Number of returns, total.......................................................................... 46,208 35,540 35,103 -1.2 -24.0 With gross unrelated business income of $10,000 or less¹..................... 22,124 12,653 13,395 5.9 -39.5 With gross unrelated business income over $10,000¹............................. 24,084 22,888 21,708 -5.2 -9.9 With unrelated business taxable income.................................................. 24,332 15,277 14,495 -5.1 -40.4 Without unrelated business taxable income² ......................................... 21,876 20,264 20,608 1.7 -5.8 Gross unrelated business income.......................................................... 7,584,915 7,900,464 7,776,017 -1.6 2.5 Total deductions³ ................................................................................ 6,484,443 7,882,907 7,922,208 0.5 22.2 Unrelated business taxable income (less deficit)................................. 1,100,470 17,557 -146,191 -932.7 -113.3 Unrelated business taxable income ....................................................... 1,669,753 791,963 647,246 -18.3 -61.2 Deficit ..................................................................................................... 569,283 774,406 793,438 2.5 39.4 Unrelated business income tax.............................................................. 505,896 226,032 194,074 -14.1 -61.6 Total tax..................................................................................................... 464,288 221,532 192,747 -13.0 -58.5
³ Excludes cost of sales and services, which was subtracted from gross receipts from sales and services in computing gross profit from sales and services (GPSS). GPSS is a component of gross unrelated business income (upon which the filing requirement is based). Total cost of sales and services was $2.1 billion for 1998, $2.3 billion for 2001, and $2.4 billion for 2002. NOTES: Detail may not add to totals because of rounding. See the Explanation of Selected Terms section of this article for definitions of gross unrelated business income, total deductions, unrelated business taxable income (less deficit), unrelated business income tax, and total tax.
Percentage change
¹ Organizations with gross unrelated business income (UBI) between $1,000 (the filing threshold) and $10,000 were not required to report itemized expenses and deductions, or to complete return schedules. Those with gross UBI over $10,000 were required to fill out a more detailed "complete" return. ² Includes returns with deficits and returns with equal amounts of gross unrelated business income and total deductions.
Selected Items from Forms 990-T, Exempt Organization Business Income Tax Returns, Tax Years 1998, 2001, and 2002
Item 2001 20021998

59
Unrelated Business Income Tax Returns, 2002: Financial Highlights and SpecialAnalyses of Exempt-Organization Reporting Quality
(those with gross income of $10,000 or less) consistsof combined partnership and S corporation income.Changes in the gains or losses from partnerships andS corporations can affect whether small IRA trusts’total gross UBI is above or below the $1,000 thresh-old for filing Form 990-T. For example, the numberof returns filed by traditional IRA trusts fell by 32percent between 1998 and 1999, and the amount ofnet partnership and S corporation income decreasedby 52 percent.
Background
Definition of Unrelated Business IncomeNonprofit organizations that are granted Federal taxexemption based on their mission-related purposesare allowed, within certain limits, to generate incomefrom unrelated business activities; however, theincome from these activities is subject to taxation.
Unrelated business income is produced from anactivity that is both conducted on a regular basis andnot directly related to an organization’s tax-exemptmission. The fact that the income may be used forfurthering an organization’s exempt purposes doesnot alter the definition [7]. Any profits from anorganization’s unrelated business activities are taxedat regular corporate or trust income tax rates [8].There are certain exclusions to this income taxation;some examples are engaging in business activities inwhich substantially all of the work is performed byvolunteer labor; selling merchandise that the organi-zation received as a gift or contribution; and operatingcertain games of chance, as specified in the InternalRevenue Code (IRC).
Form 990-T Filing RequirementsOrganizations that are described in IRC sections220(e), 401(a), 408(e), 408A, 501(c)(2)-(27), 529(a),and 530(a) must file a Form 990-T if they received$1,000 or more of gross income from businessactivities that were considered unrelated to thepurposes for which they received tax-exempt status.IRC section 501(d) religious and apostolic organiza-tions, farmers’ cooperatives, and section 4941(a)(1)“nonexempt charitable trusts” report taxes on formsother than Form 990-T.
Most tax-exempt organizations are required tofile an annual Form 990, Return of OrganizationExempt From Income Tax, or Form 990-EZ, ShortForm Return of Organization Exempt From In-come Tax (used by organizations with annual grossreceipts of less than $100,000 and total end-of-yearassets of less than $250,000). IRC section 501(c)(3)private foundations and certain charitable trusts filean information return on Form 990-PF, Return ofPrivate Foundation or Section 4947(a)(1) Nonex-empt Charitable Trust Treated as a Private Foun-dation [9]. The Form 990-T is required only for atax year in which an organization has unrelatedbusiness income. While specific taxpayer informa-tion reported on an exempt organization’s Form 990/990-EZ “information return” can be disclosed to thepublic, specific taxpayer information reported on itsForm 990-T “tax return” cannot. Under disclosurerules governing the release of taxpayer information,only aggregate totals from Form 990-T can be pre-sented in this article.
Figure B
Computation of Total Tax Reported on ExemptOrganization Business Income Tax Returns,Tax Year 2002[Money amounts are in thousands of dollars]
Item Amount
Total unrelated business income tax (UBIT)....................... 194,074 Corporate UBIT...................................................................... 126,652
Trust UBIT............................................................................. 67,422
PLUS: Total additional taxes............................................................ 2,234 Alternative minimum tax...................................................... 1,061
Proxy tax¹ ............................................................................ 1,104 Other taxes.......................................................................... 69
MINUS: Total tax credits..................................................................... 3,562 Foreign tax credit................................................................. 1,617 General business credit....................................................... 1,434
Credit for prior-year minimum tax........................................ 262 Other credits........................................................................ 248
EQUALS: Total tax.................................................................................. 192,747
1Represents the tax for only those organizations that reported gross UBIabove the $1,000 filing threshold. According to IRS Business Returns Transaction File records, the total proxy tax reported on all Forms 990-T was $12.1 million. Some organizations filed Form 990-T only to reportthe proxy tax and had no unrelated business income. NOTE: Detail may not add to totals because of rounding.
60
Unrelated Business Income Tax Returns, 2002: Financial Highlights and SpecialAnalyses of Exempt-Organization Reporting Quality
60
To report unrelated business income of $1,000(the filing threshold) or more for Tax Year 2002, IRCsection 220(e), 401(a), 408(e), 408A, and 530(a)trusts’ required reporting period was Calendar Year2002, and the Form 990-T filing date was April 15,2003. For all other organizations, the required report-ing period was any accounting period beginning inCalendar Year 2002 (and, therefore, ending betweenDecember 2002 and November 2003, for full-yearreturn filers). The associated required due dates forfiling their Tax Year 2002 Forms 990-T generallyspanned May 2003 to April 2004, but extensions oftime to file beyond this period were routinely grantedto many organizations. Corresponding to the requiredfiling dates, the Tax Year 2002 study sample wasdrawn from Forms 990-T processed by IRS through-out Calendar Years 2003 and 2004. (See the “DataSources and Limitations” section of this article fordetailed information on the study sample.) Becauseof the various accounting periods of the organizationsfiling a 2002 return, the financial activities covered inthis article span the period January 2002 throughNovember 2003, although 54 percent of Form 990-Tfilers had Calendar Year 2002 accounting periods.
Any returns filed by organizations with grossunrelated business income (UBI) below the $1,000filing requirement threshold were excluded from thestatistics presented in this article. Some of thesereturns were filed inadvertently; others were filed fora specific reason, such as to claim a refund of taxwithheld erroneously on interest or dividend payments(reported on Form 1099) because the payer did notrealize that the payee was a tax-exempt organization.Organizations with gross UBI between $1,000 and$10,000 were required to report only totals for ex-penses and deductions (except for the “specificdeduction” and “net operating loss deduction,” whichall organizations reported separately). Organizationswith gross UBI over $10,000 were required to reportmore detailed expense and deduction information.
Statistical TablesAt the end of this article, Tax Year 2002 statisticscovering selected financial data (including gross UBI,total deductions, unrelated business taxable income(UBTI), and total income tax) are shown in Tables 1-5. Tables 6 and 7 provide data on detailed sources ofUBI and deductions, respectively. Statistics shown inTable 1 are distributed by type of organization based
on Internal Revenue Code sections. Tables 2, 4, 6,and 7 are distributed by size of gross UBI; Table 4 isalso distributed by type of entity. Table 3 is distrib-uted by size of UBTI, while Table 5 is distributed byunrelated business activity or industrial grouping.
Special Analyses of Exempt OrganizationReporting Quality
Reporting QualityWith the advent of electronic filing and imaging ofIRS exempt-organization information returns andtheir widespread availability to the public, the quantityof data available for regulation and research hasincreased dramatically. Technological improvementsthat make more data more accessible are certainlydesirable, but ensuring that preparers fill out theforms completely and accurately is equally important.Is “more” really better without quality reporting ofreturn information? Ensuring reporting quality is ashared responsibility of both IRS and returnpreparers. IRS information and tax forms mustrequire information that is essential for effectiveregulation, oversight, and public transparency; and theform instructions must be complete, explicit, and clearenough for preparers to follow. Preparers need to bediligent in providing complete responses to therequested information on the forms, especiallyitemized financial components.
Form 990-T Deductions Allocation StudyThe deductions allocation study measures the extentto which high-income organizations (those with grossUBI of $500,000 or more) misreported specificallydefined, itemized deduction components as “Otherdeductions” on Tax Year 2002 Forms 990-T. Duringthe data entry process, SOI staff check the requiredOther deductions statement for inaccurately reporteditems and move (allocate) amounts, when appropri-ate, to one or more of the specifically defineddeduction components, such as Salaries and wages.The study examined the difference between deduc-tion amounts as initially reported by filers, and ascorrected, through allocation, by SOI staff [10].
During normal IRS processing of paper and e-filereturns, data are captured as reported by the returnfiler. Misreported amounts included in the residual“other” categories are not allocated to the proper,specifically defined return line items. Researchers

61
Unrelated Business Income Tax Returns, 2002: Financial Highlights and SpecialAnalyses of Exempt-Organization Reporting Quality
and IRS staff who use Returns Transaction File(RTF) data for examination or administrative pur-poses may find this study useful for gauging theextent to which deductions data may be understated,and extrapolating its results to draw conclusionsabout the possible understatement of itemized in-come, deductions, assets, and liabilities reported onother types of IRS exempt-organization returns.
Of the 2,381 high-income returns filed, 20 per-cent required at least one allocation from Otherdeductions during SOI data entry. Paid preparerscompleted 79 percent of these 485 returns withmisreported amounts [11]. After allocation, theincrease in the total amount of each specificallydefined deduction category reported by high-incomefilers ranged from 3 percent to 45 percent, as shownin Figure C. Salaries and wages, the largest aggre-gate itemized deduction reported on Form 990-T, rose
by only 3 percent, although it contained the largestaggregate amount allocated from Other deductions.Contributions to deferred compensation plans rose by14 percent, and Repairs and maintenance rose by 45percent. Allocations made to other types of itemizeddeductions resulted in increases ranging from 4 percentto 9 percent. The residual Other deductions categoryfell by 3.1 percent.
It is worth noting that no allocations were madeto Compensation of officers, directors, and trustees,Excess exempt expenses, or Excess readershipcosts. Form 990-T filers must provide detailedinformation on related schedules for these items andthen enter schedule totals in the itemized deductionsstatement. The schedule preparation requirementapparently deters preparers from including theseitems in Other deductions.
Figure C
All High-Income Forms 990-T: Deduction Detail, As Edited by SOI, As Reported by Taxpayer,and Aggregate Amount Allocated, Tax Year 2002[Money amounts are in thousands of dollars]
Compensation ofofficers, directors, Salaries and Repairs and Bad debts Interest
and trustees wages maintenance(1) (2) (3) (4) (5)
Number of returns............................................... 2,381 1,393 943 287 413 Total, as edited by SOI........................................ 16,563 1,059,609 70,135 41,349 39,180 Total, as reported by taxpayer............................. 16,563 1,027,583 48,469 39,741 37,090 Amount allocated from Other deductions............ -- 32,027 21,667 1,608 2,090 Percentage increase after allocation................... -- 3.1 44.7 4.0 5.6
ContributionsTaxes and Charitable to deferredlicenses contributions compensation
plans(6) (7) (8) (9) (10)
Number of returns............................................... 1,117 234 1,041 7 175 Total, as edited by SOI........................................ 73,644 23,274 140,164 1,790 9,679 Total, as reported by taxpayer............................. 67,727 21,787 135,169 1,790 8,471 Amount allocated from Other deductions............ 5,917 1,487 4,995 -- 1,207 Percentage increase after allocation................... 8.7 6.8 7.3 -- 14.3
Employee Excess Excess Otherbenefit programs exempt readership deductions
expenses costs(11) (12) (13) (14)
Number of returns................................................................................. 1,018 40 399 1,751 Total, as edited by SOI......................................................................... 175,184 6,397 217,549 2,465,018 Total, as reported by taxpayer.............................................................. 167,406 6,397 217,549 2,543,794 Amount allocated from Other deductions............................................. 7,778 -- -- -78,776 Percentage increase after allocation..................................................... 4.6 -- -- -3.1 NOTES: "High-income" Forms 990-T are those returns with gross unrelated business income of $500,000 or more. "SOI" is the abbreviation for the Statistics of Income program of the Internal Revenue Service. Other deductions did not include any amounts of Compensation of officers, directors, and trustees, Excess exempt expenses, Excess readership costs, or Depletion. Therefore, no allocations to these categories were necessary. For the first three of these items, Form 990-T filers must provide detailed information on related schedules and then enter schedule totals in the itemized deductions statement. The schedule preparation requirement apparently discourages filers from including these items in Other deductions.
Item
Item
Item
Depreciation Depletion
62
Unrelated Business Income Tax Returns, 2002: Financial Highlights and SpecialAnalyses of Exempt-Organization Reporting Quality
62
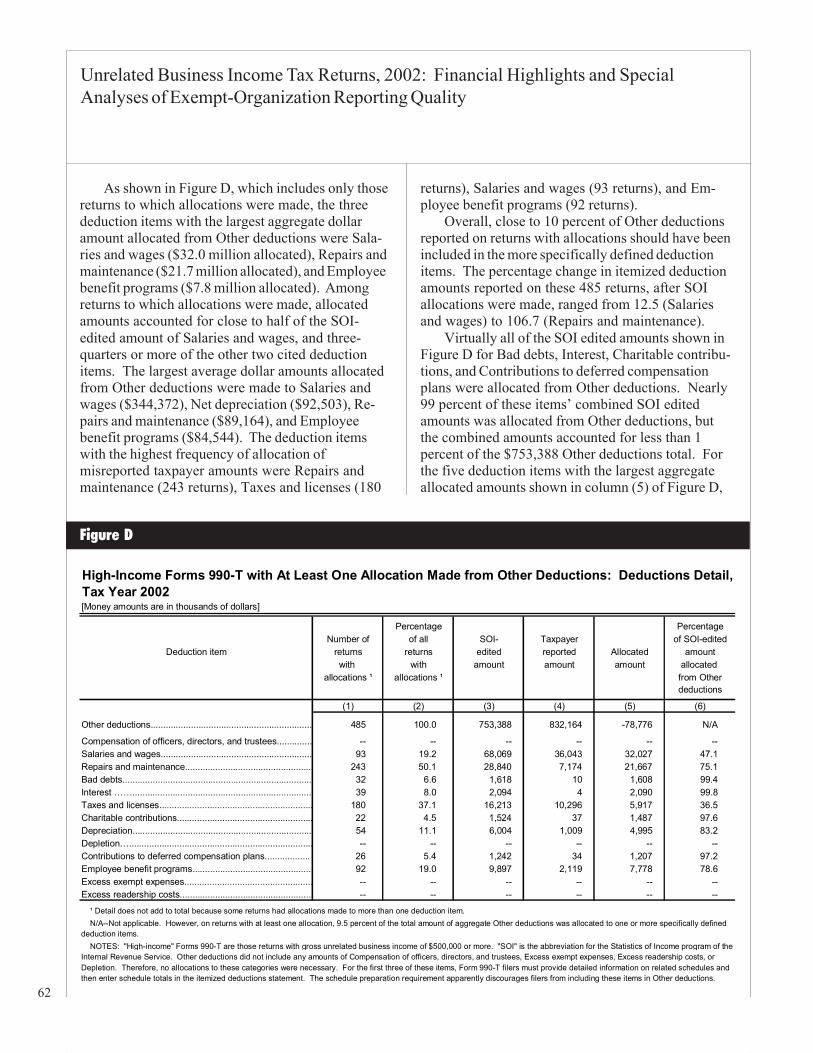
As shown in Figure D, which includes only thosereturns to which allocations were made, the threededuction items with the largest aggregate dollaramount allocated from Other deductions were Sala-ries and wages ($32.0 million allocated), Repairs andmaintenance ($21.7 million allocated), and Employeebenefit programs ($7.8 million allocated). Amongreturns to which allocations were made, allocatedamounts accounted for close to half of the SOI-edited amount of Salaries and wages, and three-quarters or more of the other two cited deductionitems. The largest average dollar amounts allocatedfrom Other deductions were made to Salaries andwages ($344,372), Net depreciation ($92,503), Re-pairs and maintenance ($89,164), and Employeebenefit programs ($84,544). The deduction itemswith the highest frequency of allocation ofmisreported taxpayer amounts were Repairs andmaintenance (243 returns), Taxes and licenses (180
returns), Salaries and wages (93 returns), and Em-ployee benefit programs (92 returns).
Overall, close to 10 percent of Other deductionsreported on returns with allocations should have beenincluded in the more specifically defined deductionitems. The percentage change in itemized deductionamounts reported on these 485 returns, after SOIallocations were made, ranged from 12.5 (Salariesand wages) to 106.7 (Repairs and maintenance).
Virtually all of the SOI edited amounts shown inFigure D for Bad debts, Interest, Charitable contribu-tions, and Contributions to deferred compensationplans were allocated from Other deductions. Nearly99 percent of these items’ combined SOI editedamounts was allocated from Other deductions, butthe combined amounts accounted for less than 1percent of the $753,388 Other deductions total. Forthe five deduction items with the largest aggregateallocated amounts shown in column (5) of Figure D,
Figure D
High-Income Forms 990-T with At Least One Allocation Made from Other Deductions: Deductions Detail,Tax Year 2002[Money amounts are in thousands of dollars]
Percentage PercentageNumber of of all SOI- Taxpayer of SOI-edited
Deduction item returns returns edited reported Allocated amountwith with amount amount amount allocated
allocations ¹ allocations ¹ from Otherdeductions
(1) (2) (3) (4) (5) (6)
Other deductions................................................................ 485 100.0 753,388 832,164 -78,776 N/A
Compensation of officers, directors, and trustees.............. -- -- -- -- -- -- Salaries and wages............................................................ 93 19.2 68,069 36,043 32,027 47.1 Repairs and maintenance................................................... 243 50.1 28,840 7,174 21,667 75.1 Bad debts........................................................................... 32 6.6 1,618 10 1,608 99.4 Interest ……....................................................................... 39 8.0 2,094 4 2,090 99.8 Taxes and licenses............................................................. 180 37.1 16,213 10,296 5,917 36.5 Charitable contributions...................................................... 22 4.5 1,524 37 1,487 97.6 Depreciation....................................................................... 54 11.1 6,004 1,009 4,995 83.2 Depletion…......................................................................... -- -- -- -- -- -- Contributions to deferred compensation plans.................. 26 5.4 1,242 34 1,207 97.2 Employee benefit programs............................................... 92 19.0 9,897 2,119 7,778 78.6 Excess exempt expenses................................................... -- -- -- -- -- -- Excess readership costs..................................................... -- -- -- -- -- --
¹ Detail does not add to total because some returns had allocations made to more than one deduction item. N/A--Not applicable. However, on returns with at least one allocation, 9.5 percent of the total amount of aggregate Other deductions was allocated to one or more specifically defined deduction items. NOTES: "High-income" Forms 990-T are those returns with gross unrelated business income of $500,000 or more. "SOI" is the abbreviation for the Statistics of Income program of the Internal Revenue Service. Other deductions did not include any amounts of Compensation of officers, directors, and trustees, Excess exempt expenses, Excess readership costs, or Depletion. Therefore, no allocations to these categories were necessary. For the first three of these items, Form 990-T filers must provide detailed information on related schedules and then enter schedule totals in the itemized deductions statement. The schedule preparation requirement apparently discourages filers from including these items in Other deductions.

63
Unrelated Business Income Tax Returns, 2002: Financial Highlights and SpecialAnalyses of Exempt-Organization Reporting Quality
their respective allocated amounts were between 37percent to 83 percent of their associated SOI-editedamounts. The proportions of the SOI-edited (cor-rected) amount attributed to taxpayer reporting andSOI allocation for these deduction items are illus-trated in Figure E.
Sixty-eight percent of the high-income returnsthat required SOI allocations of misreported amountswere filed by section 501(c)(3) nonprofit organiza-tions; the remainder were filed by organizationsexempt under other sections of the tax code. Section501(c)(6) business leagues, chambers of commerce,and real estate boards; section 501(c)(7) social andrecreational clubs; section 501(c)(4) civic leaguesand social welfare organizations; and section501(c)(5) labor, agricultural, and horticultural organi-zations accounted for another 30 percent of all high-income returns that required allocations from Otherdeductions to specifically defined components. Fig-
ure F presents selected allocation study data forthese organizations. While section 501(c)(3) chari-ties had the highest frequency of returns with alloca-tions, the percentage of their Other deductions allo-cated to more specifically defined deduction catego-ries was smaller than that for section 501(c)(6), (7),and (5) organizations.
The three primary unrelated business activitiesreported most often by organizations with allocationsfrom Other deductions, based on self-reported NorthAmerican Industry Classification System (NAICS)codes and percentage of returns with allocations,were medical and diagnostic laboratories (14 per-cent), gambling industries (9 percent), and advertisingand related services (6 percent). A list of acceptableNAICS codes used to describe organizations’ unre-lated business activities was provided with the 2002Form 990-T instructions. These activities are in-cluded within the major NAICS industrial classifica-
Figure E
0.0
10.0
20.0
30.0
40.0
50.0
60.0
70.0
Salaries and wages Repairs andmaintenance
Employee benefitprograms
Taxes and licenses Depreciation
NOTES: "High-income" Forms 990-T are those returns with gross unrelated business income of $500,000 or more. "SOI" is the abbreviation for the Statistics of Income program of the Internal Revenue Service.
Deduction Item
Reported amountAllocated amount
High-Income Forms 990-T with At Least One Allocation Made from Other Deductions: Top Five Deduction Items with Largest Amounts Allocated, Tax Year 2002
SOI-Edited Amount(Millions of dollars)

64
Unrelated Business Income Tax Returns, 2002: Financial Highlights and SpecialAnalyses of Exempt-Organization Reporting Quality
64
tions of healthcare and social assistance; arts, enter-tainment, and recreation; and professional, scientific,and technical services, respectively. (See Table 5 fordata distributed by major unrelated business activities/industrial groupings for all Form 990-T filers.)
The deductions allocation study makes it clearthat Form 990-T preparers, as well as preparers ofother types of exempt-organization returns, could doa much better job of accurately reporting all-inclusiveamounts within the specifically defined deductioncomponents. In order for IRS to make intelligentdecisions regarding regulation, compliance, or poten-tial abuses of tax-exempt status, it is imperative that ahigh priority be placed on educating nonprofit organi-zations and their tax practitioners to report detaileditems completely and accurately. Also, becauseexempt organizations are not allowed to file supple-mentary electronic financial statements with e-filedreturns (they must provide financial data in the IRSformat), there is concern that if the data provided are
incorrect or incomplete, there will be no additionalinformation available with the e-filed returns, as thereis with paper returns, that can be used to correctthese reporting errors.
Comparing and Reconciling Unrelated BusinessIncome Data Reported on Forms 990 and 990-TAn analysis of Tax Year 2002 data from 2,894 linkedrecords in the Forms 990 and 990-T “integratedsample” of section 501(c)(3) public charities con-cludes that unrelated business income (UBI) reportedon Form 990-T oftentimes cannot be reconciled withthat reported on Form 990. (See the Data Sourcesand Limitations section of this article for a descriptionof the Forms 990 and 990-T integrated sampledesign.) Anecdotal information from reviewed casesindicates that the data entered on Form 990-T aremuch more accurate, perhaps because the purpose ofForm 990-T is to calculate tax liability, which carriesa greater potential for the assessment of monetary
Figure F
High-Income Forms 990-T with At Least One Allocation Made from Other Deductions: Top Five Organization Types1, by Number of Returns With Allocations, Tax Year 2002[Money amounts are in thousands of dollars]
Total Allocated Averageamount amount as a Deduction amount
allocated percentage item with allocatedType of organization Number Percentage from of largest to
by Internal Revenue Code of of all organization organization aggregate deductionsection returns returns type's type's allocated item
other other amount in deductions deductions col. (5)
(1) (2) (3) (4) (5) (6) All organizations........................................ 485 100.0 78,776 9.5 Salaries and wages 344
501(c)(3) charities²............................................ 330 68.0 56,444 9.6 Salaries and wages 435
501(c)(6) business leagues, chambers of commerce, and Employee real estate boards............................................ 51 10.5 5,630 23.8 benefit programs 146
501(c)(7) social and recreational clubs................................................................ 35 7.2 5,116 29.0 Salaries and wages 202
501(c)(4) civic leagues and social welfare organizations............................ 24 4.9 2,453 2.2 Salaries and wages 444
501(c)(5) labor, agricultural, and horticultural organizations............................... 14 2.9 2,811 13.8 Taxes and licenses 172
2The term "charities" refers to tax-exempt organizations with purposes that are charitable, educational, scientific, literary, or religious in nature, or organizations that test for public safety or prevent cruelty to children or animals. NOTE: "High-income" Forms 990-T are those returns with gross unrelated business income of $500,000 or more.
1Tax-exempt organization types are based on the Internal Revenue Code section describing them. See the Appendix to this article for descriptions of the types of tax-exempt organizations.

65
Unrelated Business Income Tax Returns, 2002: Financial Highlights and SpecialAnalyses of Exempt-Organization Reporting Quality
penalties for misreporting than Form 990, whosepurpose is to supply information only. Applying Form990 weights to the sample records produced anestimated population of 8,992 public charities thatwere required to file both a Form 990 and a Form990-T. The main sources of data for this analysiswere Form 990, Part VII, Analysis of Income-Producing Activities, and Form 990-T, Part I,Unrelated Trade or Business Income.
Form 990, Part VII, provides a three-tieredbreakout of an organization’s total revenue (excludingany contributions, gifts, and grants received fromGovernment or public sources): potentially taxableUBI reportable on Form 990-T, UBI excluded fromtaxation under the Internal Revenue Code, and mis-sion-related (exempt function) income. Form 990-T,Part I, contains a statement of gross UBI, directexpenses, and net UBI.
As illustrated in Figure G, the Form 990 returns inthe integrated sample were separated into threegroups based on potentially taxable UBI reported inPart VII: those with positive total UBI (80 percentof all returns), those with zero UBI (13 percent of allreturns), and those with negative total UBI (7 percentof all returns). Within these groups, Form 990 total
UBI was compared to both total gross UBI and totalnet UBI reported in Part I of Form 990-T, and alsocompared to a computed amount of total “adjustedUBI.” Adjusted UBI is derived from a combinationof Form 990-T gross and net itemized UBI amounts,based on their correlation to the combination of grossand net UBI amounts required to be reported in PartVII, Form 990. If organizations had reported incomeconsistently on both forms, it was expected that theForm 990 total UBI amount would be the same asthe Form 990-T adjusted UBI amount, a value thatwas no more than gross UBI and no less than netUBI, depending on what types of income were re-ported in each individual case.
For this analysis, Form 990 UBI in most caseswas deemed reconcilable with Form 990-T UBI if itmatched any of gross UBI, adjusted UBI, or netUBI, within a $100 tolerance. (Cases in which noForm 990 total UBI was reported are discussedbelow.) Any case where Form 990 UBI equaledForm 990-T adjusted UBI, the expected outcome ifUBI was correctly reported on both forms, wasconsidered a “perfect match.” Of particular note, asshown in Figure H, is that, out of the 5,567 linkedreturns with reconciled total UBI, 80 percent were
Figure G
Reconciliation of Unrelated Business Income (UBI) Data Reported by Public Charities on Form 990and Form 990-T, Tax Year 2002[Money amounts are in thousands of dollars]
Form 990-TNumber Form 990
of returns UBI Gross Net AdjustedUBI¹ UBI UBI ²
(1) (2) (3) (4) (5) (6)
Linked returns, total............................................................ 8,992 100.0 3,807,095 4,089,889 3,343,626 3,771,948
Number with Form 990 UBI greater than zero.................. 7,194 80.0 3,869,524 3,574,474 3,009,050 3,411,944 Number with UBI that could not be reconciled ³................ 2,447 27.2 1,870,317 1,521,271 1,253,569 1,433,963
Number with Form 990 UBI equal to zero.......................... 1,183 13.2 -- 270,348 225,634 236,913 Number with UBI that could not be reconciled ³................ 853 9.5 -- 251,173 229,754 234,908
Number with Form 990 UBI less than zero........................ 614 6.8 -62,429 245,067 108,942 123,091 Number with UBI that could not be reconciled ³................ 124 1.4 -29,903 181,211 131,100 132,128 ¹ All returns in the Form 990-T sample had gross unrelated business income of $1,000 (the filing threshold) or more. ² Adjusted UBI is derived from a combination of Form 990-T gross and net itemized UBI amounts, based on their correlation to the combination of gross and net UBI amounts required to be reported on Form 990. ³ The amount of total UBI reported on Form 990, Part VII, does not equal gross UBI, net UBI, or adjusted UBI (within $100 tolerance) reported on Form 990-T, Part I.
ItemPercentage
of all returns

66
Unrelated Business Income Tax Returns, 2002: Financial Highlights and SpecialAnalyses of Exempt-Organization Reporting Quality
66
perfect matches of Form 990 UBI and Form 990-Tadjusted UBI.
UBI reported on nearly 4 out of every 10 Forms990 could not be reconciled with UBI reported onForm 990-T, meaning that total UBI on Form 990 didnot match gross UBI, net UBI, or adjusted UBI onForm 990-T, within the $100 tolerance. The reasonsfor the inconsistency are twofold: some filers re-ported a combination of gross and net taxable incomethat differed from that specified in the Form 990instructions; other filers did not report taxable UBI onForm 990 at all. Of the 7,194 returns where theForm 990 UBI amount was positive, 34 percent couldnot be reconciled. In some observed cases, the Form990 amounts simply did not correspond to any Form990-T amounts. In many other cases, filers of Form990 erroneously reported Gross receipts from sales
and services in Part VII, rather than Gross profitfrom sales and services, which is the net of grossreceipts minus cost of goods sold. Gross profit, notgross receipts, should be included in total UBI onboth Forms 990 and 990-T.
Twenty-eight percent of the 1,183 organizationsthat reported no potentially taxable UBI amounts onForm 990 filed Form 990-T with net UBI that wasnegative. Organizations may have presumed thatnegative net UBI amounts need not be reported onForm 990. These cases were not deemed irreconcil-able for this analysis. However, 72 percent of theorganizations reporting no taxable UBI on Form 990filed Form 990-T with positive amounts of gross, net,and adjusted UBI. There is no known reason forthis, with the exception of some degree ofnonreporting on Form 990.
Figure H
0 2,000 4,000 6,000 8,000 10,000
UBI not reconciled
UBI "perfect match" ²
UBI reconciled ¹
Linked forms, total
Number of returns
¹ For this analysis, Form 990 UBI was deemed reconcilable with Form 990-T UBI if it matched any of gross UBI, adjusted UBI, or net UBI on Form 990-T, within a $100 tolerance. Linked cases in which Form 990-T net UBI was negative and Form 990 UBI was zero were also deemed reconcilable. ² Any case where Form 990 UBI corresponded to Form 990-T adjusted UBI, the expected outcome if total UBI was reported correctly on both forms, was considered a "perfect match."
62% of linked returns
49% of linked returns80% of reconciled returns
38% of linked returns
Linked Forms 990 and 990-T of Public Charities: Unrelated Business Income (UBI) Reconciliation Outcome, Tax Year 2002
100%

67
Unrelated Business Income Tax Returns, 2002: Financial Highlights and SpecialAnalyses of Exempt-Organization Reporting Quality
About one-fifth of the 614 organizations reportingnegative UBI on Form 990 filed a Form 990-T withpositive amounts of gross, net, and adjusted UBI. Insome cases, negative amounts entered on Form 990for Gain or loss from sales of investment assets werenot reported on Form 990-T. As mentioned earlier,income from investments is generally not consideredunrelated business income for public charities that fileForms 990 and 990-T. Therefore, net investmentincome or losses should be reported on Form 990 inPart I, but not in Part VII as UBI.
An exception to the UBIT rules regarding invest-ment income applies to public charities that produceincome from debt-financed property, in which casethe income is subject to the unrelated business in-come tax. Public charities are required to providedetailed information about income from debt-financedproperty on Form 990-T, Schedule E, UnrelatedDebt-Financed Income. This schedule containsseveral financial items used to compute the amountof debt-financed income that is subject to UBIT. Inthe above described cases, where organizations
reported losses from sales of investment assets onForm 990, Part VII, there was no debt-financedincome reported on Form 990-T, within Part I or onSchedule E. In other irreconcilable cases involvingthe reporting of debt-financed income, organizationsreported debt-financed income on both forms, but 1)the Form 990 amount was negative, and the Form990-T amount was either positive or a smaller nega-tive; or 2) the amounts on both forms were negativeand equal, but positive amounts of other UBI compo-nents that were reported on Form 990-T were notreported on Form 990. In many other irreconcilablecases, negative entries on Form 990 could not becorrelated with any amount reported on Form 990-T.
Figure I presents distributions, by organizationsize, of the 3,424 linked Form 990 and Form 990-Tcases with total UBI that could not be reconciled[12]. The linked returns are grouped by the threecategories of total UBI reported on Form 990 thatwere discussed above: greater than zero, equal tozero, and less than zero. Of the 8,992 Form 990filers in the linked return study, 34 percent were small
Figure I
0
1,000
2,000
3,000
4,000
5,000
All linked returns Returns with UBI thatcould not bereconciled²
UBI greater than zero UBI equal to zero UBI less than zero
Small charitiesMedium charitiesLarge charities
Value of Total UBI on Form 990
Number of returns
¹For purposes of analysis, "small" charities hold less than $1 million in book value of total assets; “medium"charities hold from $1 million to less than $50 million in book value of total assets; and “large" charities hold $50 million or more in book value of total assets. ²For this analysis, Form 990 UBI in most cases was deemed not reconcilable with Form 990-T UBI if it did not match any gross UBI, adjusted UBI, or net UBI Form 990-T amount within a $100 tolerance.
Linked Forms 990 and 990-T of Public Charities with Total Unrelated Business Income (UBI) That Could Not Be Reconciled, by Organization Size¹, Tax Year 2002

68
Unrelated Business Income Tax Returns, 2002: Financial Highlights and SpecialAnalyses of Exempt-Organization Reporting Quality
68
charities, 46 percent were medium charities, and 20percent were large charities. The proportions ofsmall, medium, and large charities shown in Figure Ifor all irreconcilable returns and for those irreconcil-able returns with positive Form 990 total UBI arevery similar to the size proportions found within theoverall population of linked returns. That was not thecase for irreconcilable returns where no Form 990UBI was reported or Form 990 UBI was negative.Small charities had a greater tendency than mediumand large charities to report total UBI on Form 990-T,but not on Form 990. They accounted for half of the853 Forms 990 on which Form 990-T UBI wasomitted. The relatively small number of cases withirreconcilable negative total UBI on Form 990 wasattributable mainly to medium-size charities, whichfiled about three-quarters of these 124 returns.
For each taxable UBI item entered on Form 990,the filer is instructed to provide an associated busi-ness activity code from a list of NAICS codes. In 36percent of the linked Forms 990 and 990-T cases, theprimary unrelated business activity indicated on theorganization’s Form 990-T did not match any activitycode reported in Part VII of Form 990 for eachitemized taxable UBI amount. This, along with UBIreporting inconsistencies, seems indicative ofpreparers who fill out Form 990 and 990-T exclusiveof any attempted reconciliation of reporting of infor-mation on the two forms.
Researchers, both in and outside of IRS, useForm 990 to make assessments of nonprofits’ finan-cial activities, operations, and programs. Form 990,Part VII, for example, provides data that should beuseful for gauging how much of an organization’sincome is from taxable unrelated business activitiesand what types of activities are producing the income.Currently, an IRS team is designing a revised Form990 that will be geared toward obtaining data that willbe useful for better regulation and oversight of non-profit and other tax-exempt organizations. Taxpayereducation, comprehensive IRS form instructions, andcomplete and accurate reporting by return preparersare vital for making the Form 990 a consistent andreliable tool for research and public accountability.
SummaryDuring 2003 and 2004, tax-exempt organizations filedan estimated 35,103 Forms 990-T, Exempt Organi-
zation Business Income Tax Returns, for Tax Year2002. Compared to Tax Year 2001, organizationsreporting “unrelated business income” (UBI) filedonly slightly fewer returns for 2002, but it was thefourth consecutive year for which filings of Form990-T declined. From Tax Year 1998 to Tax Year2002, the number of filings dropped nearly 25 per-cent. After offsetting $7.8 billion of total gross UBIwith $7.9 billion of expenses and deductions, theresulting unrelated business taxable income (lessdeficit) for 2002 was $-0.1 billion. Unrelated busi-ness taxable income (UBTI) and the associatedunrelated business income tax (UBIT) decreased by18 percent and 14 percent, respectively, overamounts reported for 2001. For the 4 years between1998 and 2002, UBTI and UBIT each declined byapproximately 61 percent.
This article contains analyses from two specialstudies of exempt-organization reporting quality onForm 990, Return of Organization Exempt fromIncome Tax, and Form 990-T. The Form 990-Tdeductions allocation study measures the extent towhich high-income organizations (those with grossUBI of $500,000 or more) misreported specificallydefined, itemized deduction components as “Otherdeductions” on Tax Year 2002 Forms 990-T. Afterallocation, the increase in the total amount of eachspecifically defined deduction category reported byhigh-income filers ranged from 3 percent to 45 per-cent. A second special study, comparing total unre-lated business income (UBI) amounts reported onForms 990 and 990-T, revealed that total UBI re-ported on nearly 4 out of every 10 Forms 990 couldnot be reconciled with total UBI reported on Form990-T. The main reasons for this were twofold:some Form 990 filers reported a combination of grossand net taxable income that differed from the combi-nation specified in the return form instructions; otherfilers did not report total UBI on Form 990 at all.
Data Sources and LimitationsThe Tax Year 2002 Form 990-T study incorporated atwo-stage sample design consisting of a stratifiedrandom sample and a special “integrated” sample.The integrated sample was designed to gatherinformation on “related” (tax-exempt) and “unre-lated” (taxable) income and expenses for section501(c)(3) organizations that filed both Form 990,Return of Organization Exempt from Income Tax

69
Unrelated Business Income Tax Returns, 2002: Financial Highlights and SpecialAnalyses of Exempt-Organization Reporting Quality
(or Form 990-EZ, the short-form version of thisinformation return), and Form 990-T. This integratedsampling program ensured that the Statistics ofIncome sample of Forms 990-T included any unre-lated business income tax returns (with gross UBI of$1,000 or more) filed by organizations whose Form990 or Form 990-EZ information returns wereselected for the separate sample of section 501(c)(3)nonprofit charitable organizations. Organizationsexempt under other Code sections were not sub-jected to the integrated sampling program.
The Form 990-T returns were initially divided intostrata, based on gross UBI, and selected usingBernouli sampling. Section 501(c)(3) returns notselected randomly were then linked, by EmployerIdentification Number (EIN), to returns in the Forms990/990-EZ sample. These linked returns, along withany randomly selected Forms 990-T that also hadcounterparts in the Forms 990/990-EZ sample,
formed the “integrated” IRC section 501(c)(3) por-tion of the Form 990-T sample [13].
As shown in Figure J, the designed samplingrates ranged from a minimum of 2 percent (Form990-T gross UBI less than $20,000, with either noForm 990/990-EZ EIN match or an EIN match to aCode section 501(c)(3) Form 990/990-EZ with totalassets under $1,000,000) to a maximum of 100 per-cent (either Form 990-T gross UBI of $300,000 ormore, or Form 990-T with any amount of gross UBIand an EIN match to a section 501(c)(3) Form 990with total assets of $30,000,000 or more). OtherForms 990-T were selected at rates ranging from 2percent to 30 percent. In addition to designed samplerates, Figure J contains population counts, samplecounts, and achieved sample rates, by size of grossunrelated business income reported on Form 990-Tand size of total assets reported on Form 990 or Form990-EZ.
Figure J
Population and Sample Counts, and Designed and Achieved Sample Rates, by Sample Group,Tax Year 2002
Designed AchievedSize of gross unrelated business income (UBI) on Form 990-T Population Sample sample sample
and size of total assets on matching IRC section 501(c)(3) Form 990 or Form 990-EZ ¹ counts counts rate rate
(1) (2) (3) (4)1 Gross UBI $1,000 under $20,000 and total assets under $1,000,000, or
Gross UBI $1,000 under $20,000 and no matching Form 990 or Form 990-EZ....................... 15,021 317 2.00 2.11
2 Gross UBI $1,000 under $20,000 and total assets $1,000,000 under $2,500,000, orGross UBI $20,000 under $60,000 and total assets under $2,500,000, orGross UBI $20,000 under $60,000 and no matching Form 990 or Form 990-EZ..................... 6,853 301 4.00 4.39
3 Gross UBI $1,000 under $60,000 and total assets $2,500,000 under $10,000,000, orGross UBI $60,000 under $150,000 and total assets under $10,000,000, orGross UBI $60,000 under $150,000 and no matching Form 990 or Form 990-EZ................... 5,580 532 10.00 9.53
4 Gross UBI $1,000 under $150,000 and total assets $10,000,000 under $30,000,000, orGross UBI $150,000 under $300,000 and total assets under $30,000,000, orGross UBI $150,000 under $300,000 and no matching Form 990 or Form 990-EZ................. 2,950 942 30.00 31.93
5 Gross UBI $300,000 or more, or total assets $30,000,000 or more......................................... 4,832 4,832 100.00 100.00
All sample groups ²................................................................................................................ 35,236 6,924 N/A N/A
N/A--Not applicable. ¹ The Form 990-T sample included returns that were initially selected based on independent Form 990-T sampling criteria, and additional returns that were not initially selected but were subsequently matched to returns in the Forms 990 and 990-EZ sample of IRC section 501(c)(3) filers. Form 990-EZ may be completed by smaller organizations, those with gross receipts of less than $100,000 and end-of-year assets of less than $250,000. ² After excluding returns that were originally selected for the sample but later rejected, the sample size was 6,893, and the estimated population sizewas 35,103.
Percentages
Sample group
number

70
Unrelated Business Income Tax Returns, 2002: Financial Highlights and SpecialAnalyses of Exempt-Organization Reporting Quality
70
The population from which the 2002 Form 990-Tsample was drawn consisted of Form 990-T recordsposted to the IRS Business Master File system during2003 and 2004. Returns filed after Calendar Year2004 were not included in the sample, unless a returnwas considered a large income-size case (over$300,000 or more of gross UBI). The returns in thesample were stratified based on the size of grossunrelated business income (UBI). A sample of 6,924returns was selected from a population of 35,236.After excluding returns that were selected for thesample but later rejected, the resulting sample sizewas 6,893 returns, and the estimated population sizewas 35,103. Rejected returns included those that hadgross UBI below the $1,000 filing threshold; werefiled for a part-year accounting period for 2002, and afull-year return was also filed for that year; or werefiled for a part-year accounting period that began in ayear other than 2002. For example, a final returnfiled for the short period of January 2003-June 2003may have been initially selected for the 2002 samplebased on the criterion of an accounting period thatended between December 2002 and November 2003,but it was later rejected because, in actuality, it was aTax Year 2003 return.
The information presented in this article wasobtained from returns as originally filed with theInternal Revenue Service. The data were subjectedto comprehensive testing and correction proceduresin order to improve statistical reliability and validity.In most cases, due to time constraints, changes madeto the original return as a result of administrativeprocessing, audit procedures, or a taxpayer amend-ment were not incorporated into the database.
Because the data are based on a sample, theyare subject to sampling error. In order to use thesestatistics properly, the magnitude of the samplingerror, measured by the coefficient of variation (CV),should be taken into account. Figure K shows CVsfor selected financial data. CVs are not shown forreturns with gross UBI of $300,000 or more becausethey were sampled at a 100-percent rate and, there-fore, are not subject to sampling variability. A dis-cussion of the reliability of estimates based onsamples and methods for evaluating both the magni-tude of sampling and nonsampling error and theprecision of sample estimates can be found in thegeneral Appendix, located near the back of this issueof the SOI Bulletin.
Explanation of Selected TermsIn some of the following explanations, tax-exemptorganizations are cited by the Internal Revenue Codesection under which they are described. The varioustypes of tax-exempt organizations subject to theunrelated business income tax provisions are de-scribed by Code section in the Appendix to thisarticle. This section provides definitions to help thereader understand the terms contained in the articleand in Tables 1 through 7 at the end of the article.
Advertising Income.--Gross income realized bya tax-exempt organization from the sale of advertis-ing in a periodical was gross income from an unre-lated trade or business activity involving the “exploita-tion of an exempt activity,” namely, the circulationand readership of the periodical developed by produc-ing and distributing the readership content of thatperiodical. Advertising income was reported sepa-rately from other types of “exploited exempt activityincome.” (See the explanation of Exploited ExemptActivity Income.) Internal Revenue Code section501(c)(7), (9), and (17) organizations reported grossadvertising income, as well as other types of “ex-ploited exempt activity income,” as part of grossreceipts from sales and services. All other organiza-tions reported this income separately.
Figure K
Coefficients of Variation for Selected Items,by Size of Gross Unrelated Business Income,Tax Year 2002
Gross Unrelated
unrelated Total business Total
Size of gross unrelated business deductions taxable tax
business income income income
(1) (2) (3) (4) (5)
Total................................. 0.15 0.57 0.59 1.19 1.05
$1,000 under $10,001 ¹....... 2.69 4.40 10.87 9.87 11.94
$10,001 under $100,000 ¹... 2.77 2.28 2.93 7.52 9.47
$100,000 under $300,000... 2.43 1.94 2.35 6.44 7.38
$300,000 or more................ N/A N/A N/A N/A N/A
Number of
returns
¹ Organizations with gross unrelated business income (UBI) between $1,000 (the filing threshold) and $10,000 were not required to report itemized expenses and deductions, or to complete return schedules. Those with gross UBI over $10,000 were required to fill out a more detailed "complete" return.
N/A--Not applicable because the achieved sample rate was 100 percent.
Coefficient of variation (percentages)

71
Unrelated Business Income Tax Returns, 2002: Financial Highlights and SpecialAnalyses of Exempt-Organization Reporting Quality
Capital Gain Net Income.--Generally, organiza-tions required to file Form 990-T (except organiza-tions tax-exempt under Internal Revenue Code sec-tions 501(c)(7), (9), and (17)) were not taxed on netgains from the sale, exchange, or other disposition ofproperty. However, capital gain net income on salesof debt-financed property, certain gains on the cuttingof timber (section 1231), and gains on sales of certaindepreciable property (described in sections 1245,1250, 1252, 1254, and 1255) were taken into accountin computing capital gain net income. Also, any gainor loss passed through from a partnership or S corpo-ration, or any gain or loss on the disposition of Scorporation stock by a “qualified tax-exempt” (de-fined in the explanation of Income (Less Loss) fromPartnerships and S Corporations), was taxed as acapital gain or loss. (See the explanation of Invest-ment Income (Less Loss) for information regardinginvestment income of section 501(c)(7), (9), and (17)organizations.)
Contributions.--To the extent permissible underthe Internal Revenue Code, a deduction was allowedfor contributions or gifts actually paid within the taxyear to, or for the use of, another entity that was acharitable or Governmental organization described inCode section 170(c). A tax-exempt corporation wasallowed a deduction for charitable contributions up to10 percent of its unrelated business taxable income(UBTI) computed without regard to the deduction forcontributions. A tax-exempt trust was generallyallowed a deduction for charitable contributions underthe rules applicable to individual taxpayers, except thelimit on the deduction was determined in relation toUBTI computed without regard to the contributionsdeduction, rather than in relation to adjusted grossincome. Contributions in excess of the respectivecorporate or trust limitations may be carried over tothe next 5 taxable years, subject to certain rules. Thecontributions deduction was allowed whether or notdirectly connected with the carrying on of a trade orbusiness.
Cost of Sales and Services.--Cost of sales andservices was reported as a lump-sum total, but mayhave included depreciation, salaries and wages, andcertain other types of deductible items. For thisreason, the total amount shown for some of theseparately reported components of total deductions,such as “salaries and wages,” may be understated.Cost of sales and services was subtracted from gross
receipts from sales and services in computing grossprofit (less loss) from sales and services, which is acomponent of gross unrelated business income(UBI). Because Form 990-T filing requirements arebased on gross UBI, and cost of sales and services isfactored into the computation of gross income, thededuction for cost of sales and services is reported inthe gross income section of Form 990-T, not thedeductions section.
Deductions Directly Connected With Unre-lated Business Income.--These were deductionsallowed in computing net income, if they otherwisequalified as income tax deductions under the InternalRevenue Code and if they had a “proximate andprimary” relationship to carrying on an unrelatedtrade or business. Allowable deductions includedthose allocable to rental of personal property; thoseallocable to unrelated debt-financed income; thoseallocable to investment income of Internal RevenueCode section 501(c)(7), (9), and (17) organizations;those allocable to interest, annuities, royalties, andrents received from “controlled organizations” (seedefinition of Income from Controlled Organizations);those allocable to “exploited exempt activity income”other than advertising; direct advertising costs; com-pensation of officers, directors, and trustees; salariesand wages; repairs and maintenance; bad debts;interest; taxes and licenses; depreciation (unlessdeducted elsewhere); depletion; contributions todeferred compensation plans; contributions to em-ployee benefit plans; the “net operating loss deduc-tion”; and “other deductions.” Tax-exempt organiza-tions with gross unrelated business income (UBI)above $10,000 were required to report each deduc-tion component separately. Organizations with grossUBI between $1,000 (the filing threshold) and$10,000 reported a single total of the first five typesof directly-connected expenses listed above (thosedescribed as “allocable to”) and a single total for allother types of deductions (both deductions directlyconnected with UBI and those not directly con-nected, each defined elsewhere in this section),except for two items that were required to be re-ported separately: the “net operating loss deduction”(directly connected) and the “specific deduction” (notdirectly connected), both also defined below.
Deductions Not Directly Connected WithUnrelated Business Income.--The componentdeductions were “set-asides,” “excess exempt ex-

72
Unrelated Business Income Tax Returns, 2002: Financial Highlights and SpecialAnalyses of Exempt-Organization Reporting Quality
72
penses,” charitable contributions, and the “specificdeduction.” The specific deduction was reported,when applicable, by all organizations with positivetaxable income; the other types of deductions notdirectly connected with UBI were reported sepa-rately, when applicable, only by tax-exempt organiza-tions with gross UBI above $10,000. (See, also, theexplanations of Set-Asides, Excess Exempt Ex-penses, Contributions, and the Specific Deduction.)
Excess Exempt Expenses.--The two types of“excess” expenses allowed as deductions fromunrelated business income were (1) excess exemptexpenses attributable to commercial exploitation ofexempt activities, and (2) excess exempt expensesattributable to advertising income. In the case of“exploited” exempt activity income (see the explana-tion of Exploited Exempt Activity Income, ExceptAdvertising, below), if the expenses of theorganization’s exempt activity exceeded the incomefrom the exempt activity, then the excess expensescould be used to offset any positive net unrelatedbusiness income produced from exploiting the exemptactivity, to the extent that it did not result in a loss.Excess expenses of a commercially exploited exemptactivity could not be used to offset income fromanother type of unrelated business activity if theunrelated activity did not exploit that particular ex-empt activity. In the case of excess exempt ex-penses attributable to advertising income, if the ex-penses attributable to producing and distributing thereadership content of a periodical exceeded thecirculation income, then the excess of readershipcosts over circulation income could be used to offsetany net gain from advertising (gross advertisingincome less direct advertising costs), to the extentthat it did not result in a loss.
Exploited Exempt Activity Income, ExceptAdvertising.--In some cases, exempt activities cre-ate goodwill or other intangibles that are capable ofbeing exploited in a commercial manner. When anorganization exploited such an intangible in commer-cial activities that did not contribute importantly to theaccomplishment of an exempt purpose, the income itproduced was gross income from an unrelated tradeor business. An example of this type of activitywould be an exempt scientific organization with anexcellent reputation in the field of biological researchthat exploits its reputation regularly by selling en-dorsements of laboratory equipment to manufactur-
ers. Endorsing laboratory equipment would not havecontributed importantly to the accomplishment of anypurpose for which tax exemption was granted to theorganization. Accordingly, the income from sellingsuch endorsements is gross unrelated business in-come. Exploited exempt activity income from adver-tising was reported separately from other types ofexploited exempt activity income (see the explanationof Advertising Income). Internal Revenue Codesection 501(c)(7), (9), and (17) organizations reportedincome from exploited exempt activities as part ofgross receipts from sales and services. All otherorganizations reported this income separately.
Gross Profit (Less Loss) from Sales and Ser-vices.--This was the gross profit (less loss) from anyunrelated trade or business regularly carried on thatinvolved the sale of goods or performance of ser-vices. It did not include income from unrelatedbusiness activities that were required to be reportedseparately on any of the tax form’s supporting sched-ules. For example, an Internal Revenue Code section501(c)(7) social club would include gross restaurantand bar receipts from nonmembers in the calculationof gross profit (less loss) from sales and services, butwould report its investment income from sales ofsecurities on the required supporting schedule. Grossprofit (less loss) from sales and services is computedas gross receipts from sales or services, less returnsand allowances, minus cost of sales and services.
Gross Unrelated Business Income (UBI).--Thiswas the total gross unrelated business income prior toreduction by allowable deductions used in computingunrelated business taxable income. All organizationswere required to report detailed sources of grossUBI. The components of gross UBI were grossprofit (less loss) from sales and services; capital gainnet income; net gain (less loss) from sales ofnoncapital assets; net capital loss deduction (trustsonly); income (less loss) from partnerships and Scorporations; rental income; unrelated debt-financedincome; investment income (less loss) of InternalRevenue Code section 501(c)(7), (9), and (17) orga-nizations; income (annuities, interest, rents, and royal-ties) from controlled organizations; “exploited exemptactivity” income, except advertising; advertisingincome; and “other” income (less loss). (For anexplanation of these sources of income, see theseparate explanations of each component.)

73
Unrelated Business Income Tax Returns, 2002: Financial Highlights and SpecialAnalyses of Exempt-Organization Reporting Quality
A tax-exempt organization’s income was treatedas unrelated business income if it was from a trade orbusiness that was regularly carried on by the organi-zation and that was not substantially related to theperformance of the organization’s exempt purpose orfunction (other than that the organization needed theprofits derived from the unrelated activity). The term“trade or business” generally comprised any activitiescarried on for the production of income from sellinggoods or performing services. These activities didnot lose their identity as trades or businesses merelybecause they were carried on within a larger aggre-gate of similar activities or within a larger complex ofother endeavors that may, or may not, have beenrelated to the exempt purposes of the organization.For example, soliciting, selling, or publishing commer-cial advertising is identified as a trade or businesseven though the advertising is published in an exemptorganization’s periodical that contains editorial matterrelated to the organization’s exempt purpose.
Income from Controlled Organizations.--When an exempt organization controls another orga-nization, the entire amount of gross annuities, interest,rents, and royalties (termed “specified payments”)received from the controlled organization are includedin the gross UBI of the controlling organization, to theextent that the specified payments were claimed as adeduction from the controlled organization’s ownUBI (in the case of an exempt controlled organiza-tion) or the “equivalent” of UBI (in the case of anonexempt controlled organization). The equivalentof UBI was computed as if the nonexempt controlledorganization were exempt and had the same exemptpurpose as the controlling organization. “Control”meant: (a) for a stock corporation, the ownership (byvote or value) of more than 50 percent of the stock;(b) for a partnership, ownership of more than 50percent of the profits or capital interests; or (c) forany other organization, ownership of more than 50percent of the beneficial interests. All deductions“directly connected” with a Form 990-T filer’s grosscontrolled-organization income were allowed. Therules for debt-financed property did not apply topassive income (generally, investment income) fromcontrolled organizations. (See the definition of Unre-lated Debt-Financed Income.)
Income (Less Loss) from Partnerships and SCorporations.--If an organization was a partner in
any partnership that carried on an unrelated trade orbusiness, this income item included the organization’sshare of partnership gross unrelated business incomeless its share of partnership deductions that weredirectly connected with the unrelated income. If anorganization was a “qualified tax-exempt” that heldstock in an S corporation, this income item includedthe income or loss from the stock interest. The stockinterest was treated as an unrelated trade or busi-ness, and all items of income, loss, or deduction weretaken into account in computing unrelated businesstaxable income. A “qualified tax-exempt” was anorganization described in Internal Revenue Codesection 401(a) (qualified stock bonus, pension, orprofit-sharing plan) or section 501(c)(3), and exemptfrom tax under section 501(a).
Investment Income (Less Loss).--This incomewas reported only by organizations exempt underInternal Revenue Code sections 501(c)(7), (9), and(17) and included such income as gross unrelateddebt-financed income, gross income from the owner-ship or sale of securities, and set-asides deductedfrom investment income in previous years that weresubsequently used for a purpose other than that forwhich a deduction was allowed. (See, also, theexplanation of Set-Asides.) All gross rents (exceptthose that were exempt-function income) of section501(c)(7), (9), and (17) organizations were treated asunrelated business income and were reported as“rental income.” Organizations exempt under sec-tions other than 501(c)(7), (9), and (17) did not report“investment income (less loss).” Generally, theseorganizations’ investment income (dividends, interest,rents, and annuities) and royalty income were nottaxed as unrelated business income, unless it wasincome, other than dividends, from a controlled orga-nization or debt-financed income, or the rents were ofthe type described in the explanation of rental in-come. (See explanations of Income from ControlledOrganizations, Rental Income, and Unrelated Debt-Financed Income.)
Net Capital Loss (Trusts Only).--If a trust had anet loss from sales or exchanges of capital assets, itwas allowed a deduction for the amount of the netloss or $3,000, whichever was lower. (Tax-exemptcorporations were not allowed to deduct any ex-cesses of capital losses over capital gains.) Tax-exempt trusts reported the net capital loss deduction
74
Unrelated Business Income Tax Returns, 2002: Financial Highlights and SpecialAnalyses of Exempt-Organization Reporting Quality
74
on Form 990-T as a component of gross unrelatedbusiness income, and it was subtracted when com-puting total gross UBI.
Net Gain (Less Loss), Sales of NoncapitalAssets.--This was the gain or loss from the sale orexchange of business property, as reported on Form4797, Sales of Business Property. Property otherthan capital assets generally included property of abusiness nature, in contrast to personal and invest-ment properties, which were capital assets.
Net Operating Loss Deduction (NOLD).--Thenet operating loss carryover or carryback (as de-scribed in Internal Revenue Code section 172) wasallowed as a deduction (limited to the current-yearexcess of receipts over deductions, prior to applyingthe NOLD) in computing unrelated business taxableincome. However, the net operating loss carryoveror carryback (allowed only to or from a tax year forwhich the organization was subject to tax on unre-lated business income) was determined withouttaking into account any amount of exempt-functionincome or deductions that had been excluded fromthe computation of unrelated business taxable in-come. A “net operating loss” represented the excessof deductions over receipts for a specified year forwhich an organization reported an overall deficit fromits unrelated trade or business activities. The netoperating loss deduction statistics in this article repre-sent only net operating loss carryovers from prioryears because carrybacks from future years wouldbe reported in a later year on an amended return, noton the return as initially filed (which served as thebasis for the statistics).
Other Deductions.--This included all types ofunrelated business deductions that were not specifi-cally required to be reported elsewhere on the taxreturn. Examples are fees for accounting, legal,consulting, or financial management services; insurancecosts (if not for employee-related benefits); equip-ment costs; mailing costs; office expenses, such asjanitorial services, supplies, or security services; rent;travel expenses; educational expenses; and utilities.
Other Income (Less Loss).--This included alltypes of unrelated business income that were notspecifically required to be reported elsewhere on thetax return. Examples are insurance benefit fees;member support fees; commissions; returned contri-butions that were deducted in prior years; incomefrom insurance activities that was not properly set
aside in prior years; recoveries of bad debts; andrefunds of State or local government tax payments, ifthe payments were previously reported as a deduction.
Proxy Tax.--This was a tax on certain nonde-ductible lobbying and political expenditures. A mem-bership organization that was tax-exempt underInternal Revenue Code sections 501(c)(4), 501(c)(5),or 501(c)(6) was liable for the proxy tax if the organi-zation did not notify its members of the shares oftheir dues that were allocated to the nondeductiblelobbying and political expenditures, or if the noticedid not include the entire amount of dues that wasallocated. The proxy tax was computed as 35 per-cent of the aggregate amount of nondeductible lobby-ing expenditures that was not included in the noticessent to the organization’s members. The proxy taxwas required to be reported on Form 990-T and wasincluded in total tax; however, there was no connec-tion between the proxy tax and the taxation of in-come from an organization’s unrelated businessactivities.
Rental Income.--For organizations tax-exemptunder Internal Revenue Code sections other than501(c)(7), (9), and (17), this was the amount of (1)gross rents from personal property (e.g., computerequipment or furniture) leased with real property, ifthe rental income from the personal property wasmore than 10 percent, but not more than 50 percent,of the total rents from all leased property; or (2)gross rents from both real property and personalproperty leased with real property if the personalproperty was more than 50 percent of the total rentsfrom all leased property. Except for the secondsituation covered above, gross rents from real prop-erty were generally excluded in computing unrelatedbusiness taxable income. In addition, gross rentsfrom personal property that did not exceed 10 per-cent of the total rents from all leased property wereexcluded (and not included in gross UBI). Any rentsnot covered by the explanation of “rental income”had to be considered in terms of their taxability asunrelated business income from controlled organiza-tions or unrelated debt-financed income, in that order.For organizations tax-exempt under sections501(c)(7), (9), and (17), rental income included allgross rents (except those that were exempt-functionincome), with no exclusions. (See explanations ofIncome from Controlled Organizations and UnrelatedDebt-Financed Income.)

75
Unrelated Business Income Tax Returns, 2002: Financial Highlights and SpecialAnalyses of Exempt-Organization Reporting Quality
Set-Asides.--This deduction from investmentincome was allowed to social and recreational clubs(Internal Revenue Code section 501(c)(7)), voluntaryemployees’ beneficiary associations (section501(c)(9)), and supplemental unemployment benefittrusts (section 501(c)(17)). The deduction was equalto the amount of passive income (generally, invest-ment income) that these organizations set aside (1) tobe used for charitable purposes or (2) to providepayment of life, health, accident, or other insurancebenefits (section 501(c)(9) and (17) organizationsonly). However, any amounts set aside that ex-ceeded the “qualified asset account” limit, as figuredunder section 419A, were not allowed as a deductionfrom unrelated business investment income; theywere treated as taxable investment income. A sec-tion 419A qualified asset account is any accountconsisting of assets set aside to provide for the pay-ment of disability benefits, medical benefits, sever-ance pay benefits, or life insurance benefits.
Specific Deduction.--The specific deductionwas $1,000 or the amount of positive taxable income,whichever was less. The amount deducted wasconsidered “not directly connected” with gross unre-lated business income and was allowed to all organi-zations that had positive taxable income after all othertypes of deductions were taken. This deductionprovided the equivalent benefit of the $1,000 grossunrelated business income filing threshold under whichsome organizations were exempted from filing areturn and paying the unrelated business income tax.
Total Deductions.--Total deductions includedboth deductions reported on the main part of Form990-T and expense items reported on any of sixsupporting schedules, which were also part of the taxform. It excluded cost of sales and services ($2.4billion for 2002), which was subtracted from grossreceipts from sales and services in computing grossprofit (less loss) from sales and services, which is acomponent of gross unrelated business income(UBI). (See the explanation of Cost of Sales andServices.)
Total Tax.--Total tax was unrelated businessincome tax less the foreign tax credit, general busi-ness credit, credit for prior-year minimum tax, andother allowable credits, plus the “proxy tax” on cer-tain lobbying and political expenditures, the “alterna-tive minimum tax,” and “other” taxes.
Unrelated Business Income (UBI).--See defini-tion of Gross Unrelated Business Income (UBI).
Unrelated Business Income Tax.--This was thetax imposed on unrelated business taxable income. Itwas determined based on the regular corporate ortrust income tax rates that were in effect for the2002 Tax Year, as shown in the following schedules.
Tax Rates for Corporations
Amount of unrelated business taxable income is:Of the
But not amountOver— over— Tax is: over—
$ 0 $50,000 15% $050,000 75,000 $7,500 + 25% 50,00075,000 100,000 13,750 + 34% 75,000
100,000 335,000 22,250 + 39% 100,000335,000 10,000,000 113,900 + 34% 335,000
10,000,000 15,000,000 3,400,000 + 35% 10,000,00015,000,000 18,333,333 5,150,000 + 38% 15,000,00018,333,333 -- 35% 0
Tax Rates for Trusts
Amount of unrelated business taxable income is:Of the
But not amountOver— over— Tax is: over—
$ 0 $1,850 15.0% $01,850 4,400 $277.50 + 27.0% 1,8504,400 6,750 966.00 + 30.0% 4,4006,750 9,200 1,671.00 + 35.0% 6,7509,200 -- 2,528.50 + 38.6% 9,200
Unrelated Business Taxable Income (LessDeficit).--This was gross income derived from anyunrelated trade or business regularly carried on by anexempt organization, less deductions directly con-nected with carrying on the trade or business and lessother allowable deductions not directly connected.On a return-by-return basis, the result of this compu-tation was either positive (unrelated business taxableincome), negative (deficit), or zero. Taxable incomewas subject to the unrelated business income tax.(See, also, explanations of Deductions Directly Con-nected With Unrelated Business Income and Deduc-tions Not Directly Connected With Unrelated Busi-ness Income.)

76
Unrelated Business Income Tax Returns, 2002: Financial Highlights and SpecialAnalyses of Exempt-Organization Reporting Quality
76
Unrelated Debt-Financed Income.--Grossincome from investment property for which acquisi-tion indebtedness was outstanding at any time duringthe tax year was subject to the unrelated businessincome (UBI) tax. The percentage of investmentincome to be included as gross UBI was proportionalto the ratio of average acquisition indebtedness to theaverage adjusted basis of the property. Varioustypes of passive income (generally, investment in-come) were considered to be unrelated debt-financedincome, but only if the income arose from propertyacquired or improved with borrowed funds and if theproduction of income was unrelated to theorganization’s tax-exempt purpose. When any prop-erty held for the production of income by an organi-zation was disposed of at a gain during the tax year,and there was acquisition indebtedness outstanding atany time during the 12-month period prior to the dateof disposition, the property was considered debt-financed property, and the gain was treated as unre-lated debt-financed income. Income from debt-financed property did not include rents from personalproperty (e.g., computers or furniture) leased withreal property, certain passive income (generally,investment income) from controlled organizations,and other amounts that were otherwise included incomputing unrelated business taxable income. Inter-nal Revenue Code section 501(c)(7), (9), and (17)organizations reported all debt-financed income as“Investment Income (Less Loss).” All other organi-zations reported debt-financed income separately.
Notes and References[1] The unrelated business income tax (UBIT) was
imposed on the portion of a tax-exempt organi-zation’s income produced from a trade orbusiness that was conducted on a regular basisand was not substantially related to the organi-zation’s tax-exempt mission. After reducinggross income by allowable deductions, anyresulting positive net income was subject to UBIT.
[2] The proxy tax is required to be reported onForm 990-T and is included in total tax, but it hasno connection to the imposition of the unrelatedbusiness income tax or an organization’s in-volvement in unrelated business activities. Atax-exempt membership organization was liable
for the proxy tax on certain nondeductiblelobbying and political expenditures if the organi-zation did not notify its members of the shares oftheir dues that were allocated to the nondeduct-ible expenditures, or if the notice did not includethe entire amount of dues that was allocated.(See “Proxy Tax” in the Explanation of SelectedTerms section of this article for more informa-tion.) The proxy tax of $1.4 million shown inthe total tax computation is only that reported byForm 990-T filers with gross unrelated businessincome above the $1,000 filing threshold, acriterion for selection for the Statistics ofIncome (SOI) sample. Proxy tax reported byorganizations that had no UBI or those that hadUBI below the filing threshold is not included.According to IRS Business Returns Transac-tions File records, total proxy tax of $12.1 millionwas reported on Forms 990-T for Tax Year 2002.
[3] The amount of total tax liability originally re-ported on Forms 990-T, as stated in thesestatistics, may not necessarily be the amountultimately paid to the Internal Revenue Service(IRS). Changes in tax liability assessments canbe made after the original return is filed, eitherby the taxpayer on an amended return, by theIRS after examination, or by litigation.
[4] All Form 990-T filers described under InternalRevenue Code sections 220(e) (Archer MedicalSavings Accounts), 401(a) (pension, profit-sharing and stock bonus plans), 408(e) (tradi-tional Individual Retirement Arrangement),408A (Roth Individual Retirement Arrange-ment), 529(a) (Qualified State Tuition Plans),and 530(a) (Coverdall Education SavingsAccounts) are trusts. The group of filersdescribed under section 501(c) contains a mixof trusts and corporations, depending on anentity’s choice of organizational structure whenit was created (defined in the organization’sarticles of incorporation or association). Seethe Appendix to this article for a description ofthe various types of tax-exempt organizationssubject to the unrelated business income taxprovisions.
[5] Most of the statistics on tax-exempt trusts andtax-exempt corporations presented in this
77
Unrelated Business Income Tax Returns, 2002: Financial Highlights and SpecialAnalyses of Exempt-Organization Reporting Quality
section are from unpublished data from Form990-T SOI studies conducted for Tax Years1998, 1999, and 2002.
[6] Eighty-one percent of section 501(c)(9) volun-tary employees’ beneficiary associations(VEBAs) that had taxable unrelated businessincome for 2002 were structured as trusts, andthese trusts accounted for 98 percent of theunrelated business income tax liability of allVEBA’s filing Form 990-T for 2002.
[7] A business activity is considered unrelated if itdoes not contribute importantly (other than theproduction of funds) to accomplishing anorganization’s charitable, educational, or otherpurpose that is the basis for the organization’stax exemption. In determining whether activitiescontribute importantly to the accomplishment ofan exempt purpose, the size, extent, and natureof the activities involved must be considered inrelation to the size, extent, and nature of theexempt function that they intend to serve. Tothe extent an activity is conducted on a scalelarger than is reasonably necessary to performan exempt purpose, it does not contributeimportantly to the accomplishment of the exemptpurpose. The part of the activity that is morethan needed to accomplish the exempt purposeis an unrelated trade or business. Whether anactivity contributes importantly depends in eachcase on the facts involved. See IRS Publication598, Tax on Unrelated Business Income ofExempt Organizations, for additional informa-tion on unrelated business income and tax.
The following is a case example from Publica-tion 598. An American folk art museum oper-ates a shop in the museum that sells reproduc-tions of works in the museum’s own collectionand also works from the collections of other artmuseums. In addition, the museum sells souve-nir items of the city where the museum islocated. The sale of the reproductions, regard-less of which museum houses the original works,is considered to be “related” because it contrib-utes importantly to the achievement of themuseum’s exempt educational purpose bymaking works of art familiar to a broader
segment of the public, thereby enhancing thepublic’s understanding and appreciation of art.However, the sale of souvenir items depictingthe city in which the museum is located isconsidered to be “unrelated” because it has nocausal relationship to art or to artistic endeavor,and, therefore, does not contribute importantly tothe accomplishment of the museum’s exempteducational purposes.
[8] The unrelated business income tax (UBIT) forexempt corporations and trusts was determinedbased on the regular corporate and trust incometax rates in effect for the tax year of the Form990-T filing. Trusts that were eligible for themaximum 28-percent tax rate on capital gain netincome figured their tax based on Schedule D ofForm 1041, U.S. Income Tax Return forEstates and Trusts. The corporate and trusttax-rate schedules for Tax Year 2002 areincluded in the definition of Unrelated BusinessIncome Tax, found in the Explanation of Se-lected Terms section of this article.
[9] Churches, which are tax-exempt under InternalRevenue Code section 501(c)(3), are notrequired to apply for exemption unless theydesire to obtain an Internal Revenue Serviceruling, and they do not have to file a Form 990information return. However, these churchesare required to file Form 990-T if they received$1,000 or more of gross income from businessactivities that were considered unrelated to theirreligious purposes. For the most recent Form990 annual data on organizations tax-exemptunder Internal Revenue Code sections 501(c)(3)(excluding private foundations and most reli-gious organizations) through 501(c)(9), seeArnsberger, Paul D., “Charities and Other Tax-Exempt Organizations, 2002,” Statistics ofIncome Bulletin, Fall 2005, Volume 25, Num-ber 2. For the most recent data on privatefoundations, see Ludlum, Melissa, “DomesticPrivate Foundations, 1993-2002,” Statistics ofIncome Bulletin, Fall 2005, Volume 25, Number2. Internal Revenue Code section 4947(a)(1)“nonexempt charitable trusts” and section4947(a)(2) “split-interest trusts” are required to

78
Unrelated Business Income Tax Returns, 2002: Financial Highlights and SpecialAnalyses of Exempt-Organization Reporting Quality
78
report unrelated business income on Form 1041,Estate and Trust Income Tax Return, ratherthan Form 990-T. For information on split-interest trusts, which file Form 5227, Split-Interest Trust Information Return, seeSchreiber, Lisa, “Split-Interest Trusts, 2003,”Statistics of Income Bulletin, Spring 2006,Volume 25, Number 4. These reports, andstatistical tables of nonexempt charitable trustdata for 2002, are available from the IRS TaxStats Web site at http://www.irs.gov/taxstats.
[10] Data collected for the deductions allocationstudy were controlled to provide statistics solelyon amounts of itemized deductions allocatedfrom Other deductions. Any SOI adjustmentsmade for reasons other than allocating, such ascorrecting math errors, are included in both theSOI adjusted amounts and the taxpayer re-ported amounts.
[11] The actual number of Tax Year 2002 large-income Forms 990-T with allocations was 492.Seven returns could not be located for the study,and data on taxpayer entries of itemized deduc-tions were not available from any other source.
[12] For purposes of analysis, “small” public charitieshold less than $1 million in book value of totalassets; “medium” public charities hold from $1million to less than $50 million in book value oftotal assets; and “large” public charities hold $50million or more in book value of total assets.
[13] For additional information on the Forms 990 and990-T integrated sample design, see Harte,James M. and Hilgert, Cecelia H., “EnrichingOne Sample While Improving Another: LinkingDifferently Stratified Samples of DocumentsFiled by Exempt Organizations,” Statistics ofIncome: Turning Administrative Systems IntoInformation Systems, 1993.

79
Unrelated Business Income Tax Returns, 2002: Financial Highlights and SpecialAnalyses of Exempt-Organization Reporting Quality
AppendixTypes of Tax-Exempt Organizations Subject to the Unrelated Business Income Tax Provisions,by Internal Revenue Code Section
Code section Description of organization General nature of activities
220(e) Archer Medical Savings Accounts (MSA's) Fiduciary agent for accounts used in conjunction with high-deductible health insurance plans to save funds for future medical expenses
401(a) Qualified pension, profit-sharing, or stock bonus plans Fiduciary agent for pension, profit-sharing, or stock bonus plans
408(e) Traditional Individual Retirement Accounts (IRA's) Fiduciary agent for retirement funds
408A Roth Individual Retirement Accounts (IRA's) Fiduciary agent for retirement funds; subject to same rules as traditional IRA's, except contributions are not tax-deductible and qualified distributions are tax free
501(c)(2) Title-holding corporations for exempt organizations Holding title to property for exempt organizations
(3) Religious, educational, charitable, scientific, or literary organizations; testing for public safety organizations. Also, organizations preventing cruelty to children or animals, or fostering national or international amateur sports competition
Activities of a nature implied by the description of the class of organization
(4) Civic leagues, social welfare organizations, and local associations of employees
Promotion of community welfare and activities from which net earnings are devoted to charitable, educational, or recreational purposes
(5) Labor, agricultural, and horticultural organizations Educational or instructive groups whose purpose is to improve conditions of work, products, and efficiency
(6) Business leagues, chambers of commerce, real estate boards, and like organizations
Improving conditions in one or more lines of business
(7) Social and recreational clubs Pleasure, recreation, and social activities
(8) Fraternal beneficiary societies and associations Lodges providing for payment of life, health, accident, or other insurance benefits to members
(9) Voluntary employees' beneficiary associations (including Federal employees' voluntary beneficiary associations formerly covered by section 501(c)(10))
Providing for payment of life, health, accident, or other insurance benefits to members
(10) Domestic fraternal beneficiary societies and associations
Lodges, societies, or associations devoting their net earnings to charitable, fraternal, and other specified purposes, without life, health, or accident insurance benefits to members
(11) Teachers' retirement fund associations Fiduciary associations providing for payment of retirement benefits

80
Unrelated Business Income Tax Returns, 2002: Financial Highlights and SpecialAnalyses of Exempt-Organization Reporting Quality
80
AppendixTypes of Tax-Exempt Organizations Subject to the Unrelated Business Income Tax Provisions,by Internal Revenue Code Section--Continued
Code section Description of organization General nature of activities
501(c)(12) Benevolent life insurance associations, mutual ditch or irrigation companies, mutual or cooperative telephone companies, and like organizations
Activities of a mutually beneficial nature implied by the description of the class of organization
(13) Cemetery companies Arranging for burials and incidental related activities
(14) State-chartered credit unions and mutual insurance or reserve funds
Providing loans to members or providing insurance of, or reserve funds for, shares or deposits in certain banks or loan associations
(15) Mutual insurance companies or associations other than life, if written premiums for the year do not exceed $350,000
Providing insurance to members, substantially at cost
(16) Corporations organized to finance crop operations Financing crop operations in conjunction with activities of a marketing or purchasing association
(17) Supplemental unemployment benefit trusts Fiduciary agent for payment of supplemental unemployment compensation benefits
(18) Employee-funded pension trusts (created before June 25, 1959)
Providing for payments of benefits under a pension plan funded by employees
(19) Posts or organizations of past or present members of the armed forces
Providing services to veterans or their dependents; advocacy of veteran's issues; and promotion of patriotism and community service programs
(21) Black Lung Benefit Trusts Created by coal mine operators to satisfy their liability for disability or death due to black lung disease
(22) Withdrawal liability payment funds Providing funds to meet the liability of employers withdrawing from a multiple-employer pension fund
(23) Associations of past and present members of the armed forces founded before 1880
Providing insurance and other benefits to veterans or their dependents
(24) Trusts described in section 4049 of the Employee Retirement Income Security Act of 1974
Providing funds for employee retirement income
(25) Title-holding corporations or trusts with no more than 35 shareholders or beneficiaries and only one class of stock or beneficial interest
Acquiring real property and remitting all income earned from such property to one or more exempt organizations; pension, profit-sharing, or stock bonus plans; or governmental units

81
Unrelated Business Income Tax Returns, 2002: Financial Highlights and SpecialAnalyses of Exempt-Organization Reporting Quality
AppendixTypes of Tax-Exempt Organizations Subject to the Unrelated Business Income Tax Provisions,by Internal Revenue Code Section--Continued
Code section Description of organization General nature of activities
501(c)(26) State-sponsored high-risk health insurance plans Providing coverage for medical care on a not-for-profit basis to residents with pre-existing medical conditions that resulted in denied or exorbitantly priced traditional medical care coverage
(27) State-sponsored workers' compensation reinsurance plans
Pooled employers' funds providing reimbursements to employees for losses arising under workers' compensation acts; also, State-created, -operated, and -controlled organizations providing workers' compensation insurance to employers
529(a) Qualified State Tuition Plans State- and agency-maintained plans that allow individuals to purchase credits or certificates, or make contributions to an account, to pay for future educational expenses
530(a) Coverdell Education Savings Accounts Fiduciary agent for accounts created for the purpose of paying qualified higher education expenses of a designated beneficiary
NOTE: Corporations that are organized under an Act of Congress, and are instrumentalities of the United States, described insection 501(c)(1) of the Internal Revenue Code, are not subject to unrelated business income taxation. Prepaid legal service funds, previously described in section 501(c)(20) of the Internal Revenue Code, were no longer tax-exempt effective with tax years beginning after June 30, 1992.

82
Unrelated Business Income Tax Returns, 2002: Financial Highlights and SpecialAnalyses of Exempt-Organization Reporting Quality
82
Table 1.--Number of Returns, Gross Unrelated Business Income (UBI), Total Deductions, Unrelated Business Taxable Income (Less Deficit), Unrelated Business Taxable Income, and Total Tax, by Internal Revenue Code Section Describing Type of Tax-Exempt Organization, Tax Year 2002[All figures are estimates based on samples--money amounts are in thousands of dollars]
Gross Total TotalNumber unrelated deductions
Internal Revenue of business (less deficit)Code section returns income Number Number Number
(UBI) of Amount of Amount of Amountreturns returns returns
(1) (2) (3) (4) (5) (6) (7) (8) (9)
All sections................................. 35,103 7,776,017 34,977 7,922,208 27,230 -146,191 647,246 14,511 192,747
220(e)............................................... -- -- -- -- -- -- -- -- -- 401(a)............................................... 381 79,958 334 31,491 325 48,467 49,652 249 16,591 408(e)............................................... 2,300 13,124 2,300 3,288 2,253 9,837 9,837 2,206 3,373 408A................................................. ** ** ** ** ** ** ** ** **
501(c)(2)........................................... 286 87,717 286 91,473 229 -3,756 11,099 84 3,487 501(c)(3)........................................... 12,803 4,720,890 12,795 5,005,814 9,852 -284,924 288,853 4,183 86,001 501(c)(4)........................................... 1,484 437,329 1,462 448,785 878 -11,456 14,598 214 3,855 501(c)(5)........................................... 2,079 241,256 2,078 242,656 1,545 -1,400 19,360 651 5,126 501(c)(6)........................................... 5,483 924,341 5,483 911,889 3,889 12,452 73,346 1,762 20,775
501(c)(7)........................................... 6,372 494,524 6,325 486,541 5,400 7,983 50,067 3,662 10,680 501(c)(8)........................................... 595 130,038 595 128,594 338 1,444 3,931 221 709 501(c)(9)........................................... 733 347,553 733 252,661 426 94,892 102,233 395 35,744 501(c)(10)......................................... 245 23,962 245 25,193 206 -1,231 1,922 41 351 501(c)(11)......................................... -- -- -- -- -- -- -- -- --
501(c)(12)......................................... 231 77,910 231 77,279 182 631 7,357 102 2,499 501(c)(13)......................................... *114 *3,470 *114 *3,034 *114 *436 *997 *102 *211 501(c)(14)......................................... 123 45,949 123 56,372 121 -10,423 4,026 84 1,224 501(c)(15)......................................... ** ** ** ** ** ** ** ** ** 501(c)(16)......................................... -- -- -- -- -- -- -- -- --
501(c)(17)......................................... -- -- -- -- -- -- -- -- -- 501(c)(18)......................................... -- -- -- -- -- -- -- -- -- 501(c)(19)......................................... 1,799 135,489 1,799 139,487 1,397 -3,998 6,795 483 1,094 501(c)(21) ....................................... -- -- -- -- -- -- -- -- -- 501(c)(22)......................................... -- -- -- -- -- -- -- -- --
501(c)(23)......................................... -- -- -- -- -- -- -- -- -- 501(c)(24)......................................... ** ** ** ** ** ** ** ** ** 501(c)(25)......................................... *25 *1,732 *25 *1,245 *25 *488 *641 *23 *96 501(c)(26)......................................... -- -- -- -- -- -- -- -- -- 501(c)(27)......................................... ** ** ** ** ** ** ** ** **
529(a)............................................... -- -- -- -- -- -- -- -- -- 530(a)............................................... -- -- -- -- -- -- -- -- -- *Estimate should be used with caution because of the small number of sample returns on which it is based. **Data deleted to avoid disclosure of information for specific taxpayers. However, data are included in the appropriate totals. ¹ Excludes cost of sales and services, which was subtracted from gross receipts from sales and services in computing gross profit from sales and services. Gross profit from sales and services was a component of gross unrelated business income (UBI). Cost of sales and services can include amounts attributable to depreciation, salaries and wages, and certain other deductible items. For all exempt organizations reporting gross UBI, cost of sales and services was $2.4 billion. ² Includes both expenses and deductions reported on Form 990-T, lines 13(B) and 34, respectively. ³ Includes only positive amounts of unrelated business taxable income. Total tax is the regular unrelated business income tax after reduction by any tax credits (foreign tax credit, general business credit, prior-year minimum tax credit, and other allowable credits), plus the "alternative minimum tax," the "proxy" tax on nondeductible lobbying and political expenditures, and "other" taxes. The proxy tax was reported on Form 990-T and was included in total tax; however, it had no connection to the tax on unrelated business income or an organization's involvement in unrelated business activities. For exempt organizations reporting gross UBI above the $1,000 filing threshold, total proxy tax was $1.1 million. Corporations that are organized under an Act of Congress and are instrumentalities of the United States, described in section 501(c)(1) of the Internal Revenue Code, are not subject to unrelated business income taxation. Prepaid legal service funds, previously described in section 501(c)(20) of the Internal Revenue Code, were no longer tax-exempt, beginning with tax years after June 30, 1992. Therefore, these organizations are not listed in this table. NOTES: Detail may not add to totals because of rounding. See the Appendix to this article for descriptions of the types of tax-exempt organizations filing Form 990-T, by the Internal Revenue Code section describing them.
Unrelated business taxable income Unrelated
business taxable
income 3
tax 4
5
1,2
5
4
6
6

83
Unrelated Business Income Tax Returns, 2002: Financial Highlights and SpecialAnalyses of Exempt-Organization Reporting Quality
Table 2.--Number of Returns, Gross Unrelated Business Income (UBI), Total Deductions, Unrelated Business Taxable Income (Less Deficit), Unrelated Business Taxable Income, and Total Tax, by Size of Gross UBI, Tax Year 2002[All figures are estimates based on samples--money amounts are in thousands of dollars]
Gross Total TotalNumber unrelated deductions
Size of gross unrelated of business (less deficit)business income (UBI) returns income Number Number Number
(UBI) of Amount of Amount of Amountreturns returns returns
(1) (2) (3) (4) (5) (6) (7) (8) (9)
Total................................................ 35,103 7,776,017 34,977 7,922,208 27,230 -146,191 647,246 14,511 192,747
$1,000 under $10,001 ....................... 13,395 53,742 13,348 62,733 10,310 -8,991 13,624 6,868 2,444 $10,001 under $100,000 .................... 13,341 508,157 13,266 541,776 10,389 -33,619 71,541 4,584 13,280 $100,000 under $500,000................... 5,987 1,306,509 5,986 1,339,646 4,722 -33,138 136,918 2,237 36,772 $500,000 under $1,000,000................ 1,139 794,839 1,138 798,162 853 -3,324 69,732 410 21,231 $1,000,000 under $5,000,000............. 999 2,022,671 997 2,041,214 769 -18,543 194,002 329 64,471 $5,000,000 or more............................. 242 3,090,100 242 3,138,677 187 -48,577 161,429 82 54,549
¹ Excludes cost of sales and services, which was subtracted from gross receipts from sales and services in computing gross profit from sales and services. Gross profit from sales andservices was a component of gross unrelated business income (UBI). Cost of sales and services can include amounts attributable to depreciation, salaries and wages, and certain other deductible items. For all exempt organizations reporting gross UBI, cost of sales and services was $2.4 billion. ² Includes both expenses and deductions reported on Form 990-T, lines 13(B) and 34, respectively. ³ Includes only positive amounts of unrelated business taxable income. Total tax is the regular unrelated business income tax after reduction by any tax credits (foreign tax credit, general business credit, prior-year minimum tax credit, and other allowable credits), plus the "alternative minimum tax," the "proxy" tax on nondeductible lobbying and political expenditures, and "other" taxes. The proxy tax was reported on Form 990-T and was included in total tax; however, it had no connection to the tax on unrelated business income or an organization's involvement in unrelated business activities. For exempt organizations reporting gross UBI above the $1,000 filing threshold, total proxy tax was $1.1 million. The gross unrelated business income (UBI) brackets of "$1,000 under $10,001" and "$10,001 under $100,000" reflect the different filing requirements for organizations with gross UBI of $10,000 or less (not required to report itemized expenses and deductions, or to complete return schedules) and all other Form 990-T filers (required to file a more detailed "complete" return). Organizations with gross UBI below $1,000 were not required to file Form 990-T. NOTE: Detail may not add to totals because of rounding.
Unrelated business taxable income Unrelated
business taxable
income 3
tax 4
5
5
1,2
5
4
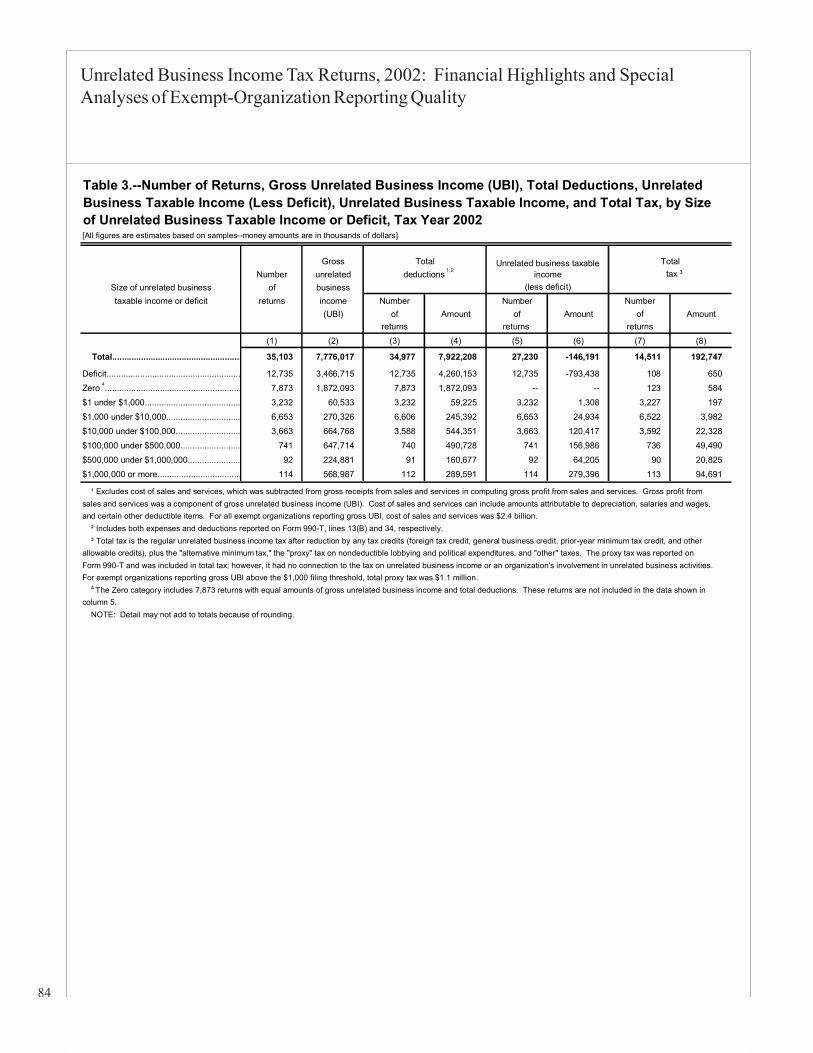
84
Unrelated Business Income Tax Returns, 2002: Financial Highlights and SpecialAnalyses of Exempt-Organization Reporting Quality
84
Table 3.--Number of Returns, Gross Unrelated Business Income (UBI), Total Deductions, Unrelated Business Taxable Income (Less Deficit), Unrelated Business Taxable Income, and Total Tax, by Size of Unrelated Business Taxable Income or Deficit, Tax Year 2002[All figures are estimates based on samples--money amounts are in thousands of dollars]
Gross Total TotalNumber unrelated deductions
Size of unrelated business of businesstaxable income or deficit returns income Number Number Number
(UBI) of Amount of Amount of Amountreturns returns returns
(1) (2) (3) (4) (5) (6) (7) (8)
Total...................................................... 35,103 7,776,017 34,977 7,922,208 27,230 -146,191 14,511 192,747
Deficit........................................................ 12,735 3,466,715 12,735 4,260,153 12,735 -793,438 108 650 Zero ......................................................... 7,873 1,872,093 7,873 1,872,093 -- -- 123 584 $1 under $1,000........................................ 3,232 60,533 3,232 59,225 3,232 1,308 3,227 197 $1,000 under $10,000............................... 6,653 270,326 6,606 245,392 6,653 24,934 6,522 3,982 $10,000 under $100,000........................... 3,663 664,768 3,588 544,351 3,663 120,417 3,592 22,328 $100,000 under $500,000......................... 741 647,714 740 490,728 741 156,986 736 49,490 $500,000 under $1,000,000...................... 92 224,881 91 160,677 92 64,205 90 20,825 $1,000,000 or more................................... 114 568,987 112 289,591 114 279,396 113 94,691
¹ Excludes cost of sales and services, which was subtracted from gross receipts from sales and services in computing gross profit from sales and services. Gross profit from sales and services was a component of gross unrelated business income (UBI). Cost of sales and services can include amounts attributable to depreciation, salaries and wages, and certain other deductible items. For all exempt organizations reporting gross UBI, cost of sales and services was $2.4 billion. ² Includes both expenses and deductions reported on Form 990-T, lines 13(B) and 34, respectively. ³ Total tax is the regular unrelated business income tax after reduction by any tax credits (foreign tax credit, general business credit, prior-year minimum tax credit, and other allowable credits), plus the "alternative minimum tax," the "proxy" tax on nondeductible lobbying and political expenditures, and "other" taxes. The proxy tax was reported on Form 990-T and was included in total tax; however, it had no connection to the tax on unrelated business income or an organization's involvement in unrelated business activities. For exempt organizations reporting gross UBI above the $1,000 filing threshold, total proxy tax was $1.1 million. The Zero category includes 7,873 returns with equal amounts of gross unrelated business income and total deductions. These returns are not included in the data shown in column 5. NOTE: Detail may not add to totals because of rounding.
Unrelated business taxable income
(less deficit) tax1,2
4
4
3

85
Unrelated Business Income Tax Returns, 2002: Financial Highlights and SpecialAnalyses of Exempt-Organization Reporting Quality
Table 4.--Returns with Positive Unrelated Business Taxable Income: Number of Returns, Gross Unrelated Business Income (UBI), Total Deductions, Unrelated Business Taxable Income, and Total Tax, by Type of Entity and Size of Gross UBI, Tax Year 2002[All figures are estimates based on samples--money amounts are in thousands of dollars]
Gross TotalType of entity and size of Number unrelated deductions tax 3
gross unrelated business of businessincome (UBI) returns income Number Number
(UBI) of Amount of Amountreturns returns
(1) (2) (3) (4) (5) (6) (7)
ALL ENTITIES
Total......................................................................... 14,495 2,437,209 14,369 1,789,963 647,246 14,281 191,513 $1,000 under $10,001................................................... 6,820 24,294 6,773 10,669 13,624 6,773 2,152 $10,001 under $100,000 .............................................. 4,621 171,812 4,546 100,270 71,541 4,514 12,954 $100,000 under $500,000............................................. 2,239 505,147 2,238 368,228 136,918 2,195 36,607 $500,000 under $1,000,000.......................................... 410 279,005 409 209,273 69,732 402 21,150 $1,000,000 under $5,000,000....................................... 329 637,535 327 443,534 194,002 322 64,225 $5,000,000 or more...................................................... 75 819,417 75 657,987 161,429 74 54,425
TAX-EXEMPT CORPORATIONS
Total......................................................................... 11,339 2,164,609 11,260 1,709,995 454,613 11,223 124,840 $1,000 under $10,001 ................................................ 4,277 18,068 4,230 7,749 10,319 4,277 1,556 $10,001 under $100,000 ............................................ 4,277 160,462 4,249 98,376 62,086 4,217 9,593 $100,000 under $500,000............................................. 2,058 463,021 2,057 360,823 102,197 2,014 24,108 $500,000 under $1,000,000.......................................... 377 255,598 376 203,964 51,634 370 15,235 $1,000,000 under $5,000,000....................................... 285 547,739 283 419,960 127,779 280 40,881 $5,000,000 or more...................................................... 64 719,721 64 619,123 100,598 64 33,466
TAX-EXEMPT TRUSTS
Total......................................................................... 3,156 272,600 3,109 79,967 192,633 3,058 66,673 $1,000 under $10,001 ................................................ 2,543 6,225 2,543 2,920 3,305 2,496 595 $10,001 under $100,000 ............................................ 345 11,350 297 1,894 9,456 297 3,361 $100,000 under $500,000............................................. 181 42,126 181 7,405 34,721 181 12,499 $500,000 under $1,000,000.......................................... 33 23,407 33 5,309 18,098 32 5,915 $1,000,000 under $5,000,000....................................... 44 89,797 44 23,574 66,222 42 23,344 $5,000,000 or more...................................................... 11 99,696 11 38,865 60,831 10 20,959
¹ Excludes cost of sales and services, which was subtracted from gross receipts from sales and services in computing gross profit from sales and services. Gross profit from sales and services was a component of gross unrelated business income (UBI). Cost of sales and services can include amounts attributable to depreciation, salaries and wages, and certain other deductible items. For exempt organizations reporting positive unrelated business taxable income, cost of sales and services was $710.6 million, 99 percent of which was attributable to tax-exempt corporations. ² Includes both expenses and deductions reported on Form 990-T, lines 13(B) and 34, respectively. ³ Total tax is the regular unrelated business income tax after reduction by any tax credits (foreign tax credit, general business credit, prior-year minimum tax credit, and other allowable credits), plus the "alternative minimum tax," the "proxy" tax on nondeductible lobbying and political expenditures, and "other" taxes. The proxy tax was reported on Form 990-T and was included in total tax; however, it had no connection to the tax on unrelated business income or an organization's involvement in unrelated business activities. For exempt organizations reporting positive unrelated business taxable income, total proxy tax was $0.4 million. The gross unrelated business income (UBI) brackets of "$1,000 under $10,001" and "$10,001 under $100,000" reflect the different filing requirements for organizations with gross UBI of $10,000 or less (not required to report itemized expenses and deductions, or to complete return schedules) and all other Form 990-T filers (required to file a more detailed "complete" return). Organizations with gross UBI below $1,000 were not required to file Form 990-T. NOTE: Detail may not add to totals because of rounding.
TotalUnrelated business taxable income
4
1,2
4
4
4
4
4
4
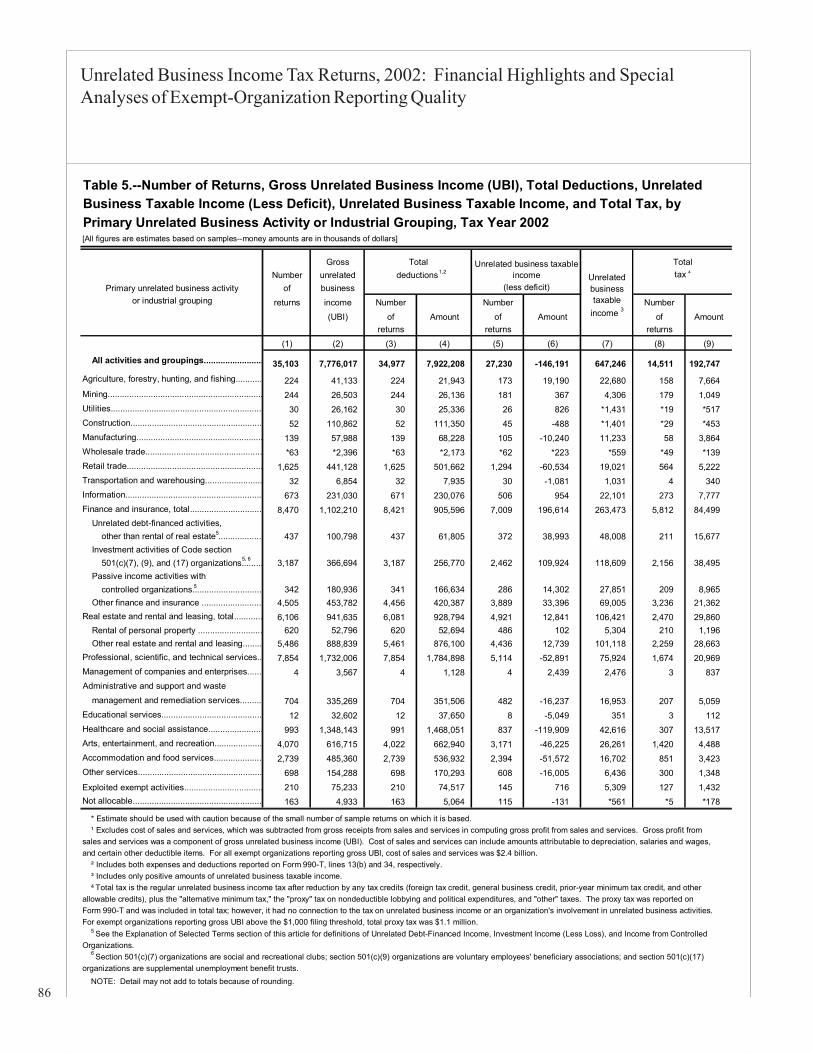
86
Unrelated Business Income Tax Returns, 2002: Financial Highlights and SpecialAnalyses of Exempt-Organization Reporting Quality
86
Table 5.--Number of Returns, Gross Unrelated Business Income (UBI), Total Deductions, Unrelated Business Taxable Income (Less Deficit), Unrelated Business Taxable Income, and Total Tax, by Primary Unrelated Business Activity or Industrial Grouping, Tax Year 2002[All figures are estimates based on samples--money amounts are in thousands of dollars]
Gross Total TotalNumber unrelated deductions
Primary unrelated business activity of business (less deficit)or industrial grouping returns income Number Number Number
(UBI) of Amount of Amount of Amountreturns returns returns
(1) (2) (3) (4) (5) (6) (7) (8) (9)
All activities and groupings......................... 35,103 7,776,017 34,977 7,922,208 27,230 -146,191 647,246 14,511 192,747 Agriculture, forestry, hunting, and fishing........... 224 41,133 224 21,943 173 19,190 22,680 158 7,664 Mining................................................................. 244 26,503 244 26,136 181 367 4,306 179 1,049 Utilities................................................................ 30 26,162 30 25,336 26 826 *1,431 *19 *517 Construction....................................................... 52 110,862 52 111,350 45 -488 *1,401 *29 *453 Manufacturing..................................................... 139 57,988 139 68,228 105 -10,240 11,233 58 3,864 Wholesale trade................................................. *63 *2,396 *63 *2,173 *62 *223 *559 *49 *139 Retail trade......................................................... 1,625 441,128 1,625 501,662 1,294 -60,534 19,021 564 5,222 Transportation and warehousing........................ 32 6,854 32 7,935 30 -1,081 1,031 4 340 Information......................................................... 673 231,030 671 230,076 506 954 22,101 273 7,777 Finance and insurance, total.............................. 8,470 1,102,210 8,421 905,596 7,009 196,614 263,473 5,812 84,499 Unrelated debt-financed activities, other than rental of real estate ................... 437 100,798 437 61,805 372 38,993 48,008 211 15,677 Investment activities of Code section 501(c)(7), (9), and (17) organizations......... 3,187 366,694 3,187 256,770 2,462 109,924 118,609 2,156 38,495 Passive income activities with controlled organizations............................. 342 180,936 341 166,634 286 14,302 27,851 209 8,965 Other finance and insurance .......................... 4,505 453,782 4,456 420,387 3,889 33,396 69,005 3,236 21,362 Real estate and rental and leasing, total............ 6,106 941,635 6,081 928,794 4,921 12,841 106,421 2,470 29,860 Rental of personal property ........................... 620 52,796 620 52,694 486 102 5,304 210 1,196 Other real estate and rental and leasing........ 5,486 888,839 5,461 876,100 4,436 12,739 101,118 2,259 28,663 Professional, scientific, and technical services.. 7,854 1,732,006 7,854 1,784,898 5,114 -52,891 75,924 1,674 20,969 Management of companies and enterprises...... 4 3,567 4 1,128 4 2,439 2,476 3 837 Administrative and support and waste management and remediation services......... 704 335,269 704 351,506 482 -16,237 16,953 207 5,059 Educational services.......................................... 12 32,602 12 37,650 8 -5,049 351 3 112 Healthcare and social assistance....................... 993 1,348,143 991 1,468,051 837 -119,909 42,616 307 13,517 Arts, entertainment, and recreation.................... 4,070 616,715 4,022 662,940 3,171 -46,225 26,261 1,420 4,488 Accommodation and food services.................... 2,739 485,360 2,739 536,932 2,394 -51,572 16,702 851 3,423 Other services.................................................... 698 154,288 698 170,293 608 -16,005 6,436 300 1,348 Exploited exempt activities................................. 210 75,233 210 74,517 145 716 5,309 127 1,432 Not allocable...................................................... 163 4,933 163 5,064 115 -131 *561 *5 *178
* Estimate should be used with caution because of the small number of sample returns on which it is based. ¹ Excludes cost of sales and services, which was subtracted from gross receipts from sales and services in computing gross profit from sales and services. Gross profit from sales and services was a component of gross unrelated business income (UBI). Cost of sales and services can include amounts attributable to depreciation, salaries and wages, and certain other deductible items. For all exempt organizations reporting gross UBI, cost of sales and services was $2.4 billion. ² Includes both expenses and deductions reported on Form 990-T, lines 13(b) and 34, respectively. ³ Includes only positive amounts of unrelated business taxable income. Total tax is the regular unrelated business income tax after reduction by any tax credits (foreign tax credit, general business credit, prior-year minimum tax credit, and other allowable credits), plus the "alternative minimum tax," the "proxy" tax on nondeductible lobbying and political expenditures, and "other" taxes. The proxy tax was reported on Form 990-T and was included in total tax; however, it had no connection to the tax on unrelated business income or an organization's involvement in unrelated business activities. For exempt organizations reporting gross UBI above the $1,000 filing threshold, total proxy tax was $1.1 million. See the Explanation of Selected Terms section of this article for definitions of Unrelated Debt-Financed Income, Investment Income (Less Loss), and Income from Controlled Organizations. Section 501(c)(7) organizations are social and recreational clubs; section 501(c)(9) organizations are voluntary employees' beneficiary associations; and section 501(c)(17) organizations are supplemental unemployment benefit trusts. NOTE: Detail may not add to totals because of rounding.
Unrelated business taxable income Unrelated
business taxable
income 3
tax 41,2
6
4
5
5
5
5, 6

87
Unrelated Business Income Tax Returns, 2002: Financial Highlights and SpecialAnalyses of Exempt-Organization Reporting Quality
Table 6.--Sources of Gross Unrelated Business Income (UBI), by Size of Gross UBI, Tax Year 2002[All figures are estimates based on samples--money amounts are in thousands of dollars]
Sources of gross unrelated business income (UBI) ¹
Gross profit (less loss) Capital gainSize of gross unrelated from sales and services net incomebusiness income (UBI) Number Number Number
of Amount of Amount of Amountreturns returns returns
(1) (2) (3) (4) (5) (6) Total............................................................... 35,103 7,776,017 14,895 4,322,643 614 106,267
$1,000 under $10,001 ..................................... 13,395 53,742 2,864 10,010 *151 *184
$10,001 or more, total .................................... 21,708 7,722,275 12,031 4,312,632 463 106,083
$10,001 under $100,000................................ 13,341 508,157 6,731 230,100 214 7,641 $100,000 under $500,000.............................. 5,987 1,306,509 3,734 707,744 159 17,842 $500,000 under $1,000,000........................... 1,139 794,839 735 412,856 30 11,109 $1,000,000 under $5,000,000........................ 999 2,022,671 659 1,094,952 42 38,761 $5,000,000 or more........................................ 242 3,090,100 172 1,866,979 18 30,730
Sources of gross unrelated business income (UBI) ¹--Continued
Net capital loss Net gain (less loss),Size of gross unrelated (trusts only) sales of noncapital assets business income (UBI)
Number Number Numberof Amount of Amount of Amount
returns returns returns
(7) (8) (9) (10) (11) (12) Total............................................................... 147 930 250 4,445 3,977 180,890
$1,000 under $10,001 ..................................... *47 *142 *10 *-220 2,793 7,353
$10,001 or more, total .................................... 99 788 240 4,664 1,184 173,537 $10,001 under $100,000................................ -- -- 121 -160 548 10,652 $100,000 under $500,000.............................. 62 548 65 697 317 35,560 $500,000 under $1,000,000........................... 10 30 15 242 107 20,078 $1,000,000 under $5,000,000........................ 24 200 23 -820 150 59,219 $5,000,000 or more........................................ 3 9 16 4,706 62 48,028
Sources of gross unrelated business income (UBI) ¹-- Continued
Rental Unrelated debt- Investment income
Size of gross unrelated income financed income (less loss)
business income (UBI)Number Number Number
of Amount of Amount of Amountreturns returns returns
(13) (14) (15) (16) (17) (18) Total............................................................... 4,550 240,445 3,079 436,949 5,454 350,619 $1,000 under $10,001 ..................................... 1,163 5,415 866 3,539 2,606 7,702 $10,001 or more, total .................................... 3,387 235,031 2,213 433,410 2,848 342,917 $10,001 under $100,000................................ 2,423 55,547 1,380 43,575 1,630 22,184 $100,000 under $500,000.............................. 722 63,133 590 81,312 951 43,446 $500,000 under $1,000,000........................... 125 31,728 95 40,519 169 30,141 $1,000,000 under $5,000,000........................ 92 47,944 120 120,796 84 94,406 $5,000,000 or more........................................ 25 36,678 28 147,208 14 152,738
Footnotes at end of table.
Income (less loss) from partnerships and S corporations
Gross unrelated business income (UBI)
6
4
5
2,3
2,3
2,3
2
2
2
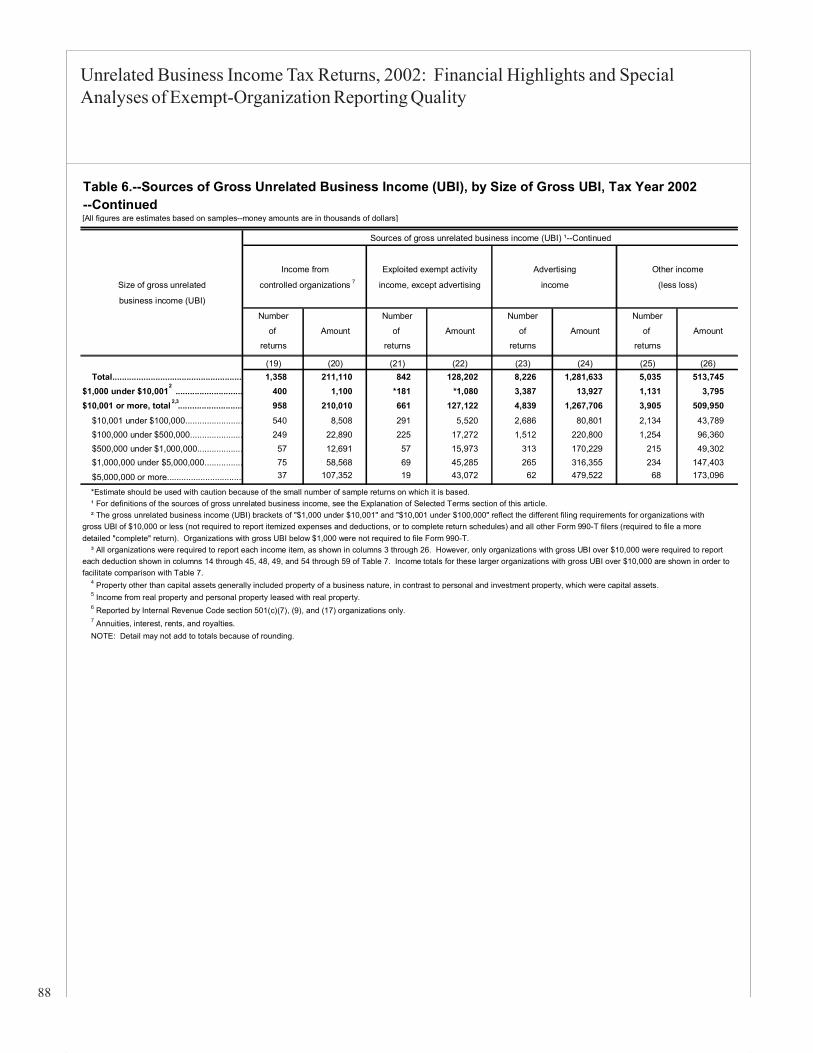
88
Unrelated Business Income Tax Returns, 2002: Financial Highlights and SpecialAnalyses of Exempt-Organization Reporting Quality
88
Table 6.--Sources of Gross Unrelated Business Income (UBI), by Size of Gross UBI, Tax Year 2002--Continued[All figures are estimates based on samples--money amounts are in thousands of dollars]
Sources of gross unrelated business income (UBI) ¹--Continued
Income from Exploited exempt activity Advertising Other income
Size of gross unrelated controlled organizations income, except advertising income (less loss)
business income (UBI)
Number Number Number Number
of Amount of Amount of Amount of Amount
returns returns returns returns
(19) (20) (21) (22) (23) (24) (25) (26) Total....................................................... 1,358 211,110 842 128,202 8,226 1,281,633 5,035 513,745 $1,000 under $10,001 ............................ 400 1,100 *181 *1,080 3,387 13,927 1,131 3,795 $10,001 or more, total ........................... 958 210,010 661 127,122 4,839 1,267,706 3,905 509,950 $10,001 under $100,000........................ 540 8,508 291 5,520 2,686 80,801 2,134 43,789 $100,000 under $500,000...................... 249 22,890 225 17,272 1,512 220,800 1,254 96,360 $500,000 under $1,000,000................... 57 12,691 57 15,973 313 170,229 215 49,302 $1,000,000 under $5,000,000................ 75 58,568 69 45,285 265 316,355 234 147,403
$5,000,000 or more................................ 37 107,352 19 43,072 62 479,522 68 173,096
*Estimate should be used with caution because of the small number of sample returns on which it is based. ¹ For definitions of the sources of gross unrelated business income, see the Explanation of Selected Terms section of this article. ² The gross unrelated business income (UBI) brackets of "$1,000 under $10,001" and "$10,001 under $100,000" reflect the different filing requirements for organizations with gross UBI of $10,000 or less (not required to report itemized expenses and deductions, or to complete return schedules) and all other Form 990-T filers (required to file a more detailed "complete" return). Organizations with gross UBI below $1,000 were not required to file Form 990-T. ³ All organizations were required to report each income item, as shown in columns 3 through 26. However, only organizations with gross UBI over $10,000 were required to report each deduction shown in columns 14 through 45, 48, 49, and 54 through 59 of Table 7. Income totals for these larger organizations with gross UBI over $10,000 are shown in order to facilitate comparison with Table 7. 4 Property other than capital assets generally included property of a business nature, in contrast to personal and investment property, which were capital assets. 5 Income from real property and personal property leased with real property. 6 Reported by Internal Revenue Code section 501(c)(7), (9), and (17) organizations only. 7 Annuities, interest, rents, and royalties. NOTE: Detail may not add to totals because of rounding.
7
2,3
2

89
Unrelated Business Income Tax Returns, 2002: Financial Highlights and SpecialAnalyses of Exempt-Organization Reporting Quality
Table 7.--Types of Deductions, by Size of Gross Unrelated Business Income (UBI), Tax Year 2002[All figures are estimates based on samples--money amounts are in thousands of dollars]
Organizations with grossunrelated business income
Total Total (UBI) of $1,000 under $10,001 ³Size of gross unrelated number deductions Total Net operating Specificbusiness income (UBI) of deductions loss deduction deduction
returns Number Number Number Numberof Amount of Amount of Amount of Amount
returns returns returns returns
(1) (2) (3) (4) (5) (6) (7) (8) (9) Total.......................................... 35,103 34,977 7,922,208 13,348 62,733 921 1,263 8,117 7,614 $1,000 under $10,001 ³................. 13,395 13,348 62,733 13,348 62,733 921 1,263 8,117 7,614 $10,001 under $100,000 ³............. 13,341 13,266 541,776 -- -- -- -- -- -- $100,000 under $500,000............. 5,987 5,986 1,339,646 -- -- -- -- -- -- $500,000 under $1,000,000.......... 1,139 1,138 798,162 -- -- -- -- -- -- $1,000,000 under $5,000,000....... 999 997 2,041,214 -- -- -- -- -- -- $5,000,000 or more....................... 242 242 3,138,677 -- -- -- -- -- --
Deductions directly connected with UBITotal Allocable to Allocable to unrelated Allocable to
Size of gross unrelated deductions Total rental debt-financed investmentbusiness income (UBI) income income income
Number Number Number Number Numberof Amount of Amount of Amount of Amount of
returns returns returns returns returns
(10) (11) (12) (13) (14) (15) (16) (17) (18) Total.......................................... 20,704 7,305,072 20,704 7,305,072 1,623 156,010 2,115 426,611 908 $1,000 under $10,001 ³................. -- -- -- -- -- -- -- -- -- $10,001 under $100,000 ³............. 12,591 511,619 12,591 511,619 1,162 29,933 1,334 48,458 351 $100,000 under $500,000............. 5,800 1,265,199 5,800 1,265,199 328 40,222 550 85,515 413 $500,000 under $1,000,000.......... 1,112 728,510 1,112 728,510 57 17,292 92 36,443 92 $1,000,000 under $5,000,000....... 967 1,908,607 967 1,908,607 59 33,067 113 116,738 49 $5,000,000 or more....................... 232 2,891,138 232 2,891,138 18 35,496 26 139,457 3
Organizations with gross unrelated business income (UBI) of $10,001 or more ³--Continued
Deductions directly connected with UBI--ContinuedAllocable to Allocable to income Allocable to exploited Direct Compensation of
Size of gross unrelated investment from controlled exempt activity income, advertising officers, directors,
business income (UBI) income organizations except advertising costs and trustees--Continued
Number Number Number NumberAmount of Amount of Amount of Amount of Amount
returns returns returns returns
(19) (20) (21) (22) (23) (24) (25) (26) (27) Total.......................................... 15,018 467 147,724 605 120,403 4,450 923,970 1,766 38,242 $1,000 under $10,001 ³................. -- -- -- -- -- -- -- -- -- $10,001 under $100,000 ³............. 1,300 225 6,477 281 4,533 2,463 65,959 929 8,660 $100,000 under $500,000............. 4,100 128 15,747 192 18,192 1,383 153,724 604 13,018 $500,000 under $1,000,000.......... 1,580 39 9,074 54 12,983 301 125,396 101 3,516 $1,000,000 under $5,000,000....... 5,833 48 33,622 62 44,591 245 223,681 107 8,323 $5,000,000 or more....................... 2,206 27 82,805 16 40,104 57 355,210 26 4,723
Organizations with gross unrelated business income (UBI) of $10,001 or more ³--Continued
Deductions directly connected with UBI--Continued
Size of gross unrelated Salaries and wages Repairs and maintenance Bad debts Interestbusiness income (UBI)
Number Number Number Numberof Amount of Amount of Amount of Amount
returns returns returns returns(28) (29) (30) (31) (32) (33) (34) (35)
Total................................................................... 10,063 1,517,666 6,935 117,790 918 43,132 2,912 61,518 $1,000 under $10,001 ³........................................... -- -- -- -- -- -- -- -- $10,001 under $100,000 ³....................................... 5,260 112,517 3,546 16,065 304 276 1,387 6,263 $100,000 under $500,000....................................... 3,410 345,539 2,445 31,590 326 1,507 1,112 16,075 $500,000 under $1,000,000.................................... 652 174,121 456 13,591 104 1,710 211 9,340 $1,000,000 under $5,000,000................................. 585 403,065 383 23,701 129 10,151 148 18,929 $5,000,000 or more................................................. 156 482,423 104 32,843 54 29,488 54 10,912 Footnotes at end of table.
All organizations
Organizations with gross unrelated business income (UBI) of $10,001 or more ³
2,4
2,5
6 6 6,7
6 6 66,7
1,2

90
Unrelated Business Income Tax Returns, 2002: Financial Highlights and SpecialAnalyses of Exempt-Organization Reporting Quality
90
Table 7.--Types of Deductions, by Size of Gross Unrelated Business Income (UBI), Tax Year 2002--Continued[All figures are estimates based on samples--money amounts are in thousands of dollars]
Organizations with gross unrelated business income (UBI) of $10,001 or more ³--ContinuedDeductions directly connected with UBI--Continued
Taxes and ContributionsSize of gross unrelated Depreciation Depletion to deferredbusiness income (UBI) deduction compensation plans
Number Number Number Numberof Amount of Amount of Amount of Amount
returns returns returns returns
(36) (37) (38) (39) (40) (41) (42) (43)
Total...................................................... 10,169 161,329 7,689 221,587 94 3,457 981 12,204 $1,000 under $10,001 ³............................. -- -- -- -- -- -- -- -- $10,001 under $100,000 ³......................... 5,828 22,032 4,152 24,370 *74 *730 446 478 $100,000 under $500,000.......................... 3,224 65,653 2,496 57,052 *12 *937 360 2,047 $500,000 under $1,000,000....................... 557 26,370 469 26,991 ** ** ** ** $1,000,000 under $5,000,000.................... 444 29,139 438 54,935 **7 **1,790 **175 **9,679 $5,000,000 or more................................... 116 18,135 134 58,238 ** ** ** **
Organizations with gross unrelated business income (UBI) of $10,001 or more ³--Continued
Deductions directly connected with UBI--ContinuedDeductions not
Contributions Net operating directly connectedSize of gross unrelated to employee loss Other deductions with UBIbusiness income (UBI) benefit programs deduction
TotalNumber Number Number Number
of Amount of Amount of Amount of Amountreturns returns returns returns
(44) (45) (46) (47) (48) (49) (50) (51) Total...................................................... 4,960 212,057 3,296 164,487 13,598 2,961,868 10,430 554,402 $1,000 under $10,001 ³............................. -- -- -- -- -- -- -- -- $10,001 under $100,000 ³......................... 2,127 7,366 1,893 15,087 7,629 141,114 6,192 30,156 $100,000 under $500,000.......................... 1,815 29,508 963 29,038 4,217 355,737 3,045 74,447 $500,000 under $1,000,000....................... 442 21,733 181 20,667 804 226,235 601 69,652 $1,000,000 under $5,000,000.................... 447 62,739 203 44,810 753 791,001 474 132,607 $5,000,000 or more................................... 129 90,712 55 54,885 195 1,447,781 117 247,539
Organizations with gross unrelated business income (UBI) of $10,001 or more ³--Continued
Deductions not directly connected with UBI--Continued
Size of gross unrelated Specific deduction Charitable contributions Set-asides Excess exemptbusiness income (UBI) expenses 8
Number Number Number Numberof Amount of Amount of Amount of Amount
returns returns returns returns
(52) (53) (54) (55) (56) (57) (58) (59) Total...................................................... 8,031 7,635 1,456 32,740 351 223,387 2,314 290,640 $1,000 under $10,001 ³............................. -- -- -- -- -- -- -- -- $10,001 under $100,000 ³......................... 4,917 4,611 735 2,577 *195 *6,490 1,130 16,479 $100,000 under $500,000.......................... 2,288 2,208 487 6,890 90 15,135 769 50,215 $500,000 under $1,000,000....................... 427 418 100 10,704 28 15,004 199 43,527 $1,000,000 under $5,000,000.................... 324 323 100 8,237 30 48,297 171 75,749 $5,000,000 or more................................... 75 75 34 4,333 9 138,462 45 104,670
* Estimate should be used with caution because of the small number of sample returns on which it is based. **Data in adjacent size classes are combined to avoid disclosure of information about specific taxpayers. ¹ Excludes cost of sales and services, which was subtracted from gross receipts from sales and services in computing gross profit from sales and services. Gross profit from sales and services was a component of gross unrelated business income (UBI). Cost of sales and services can include amounts attributable to depreciation, salaries and wages, and certain other deductible items. For all exempt organizations reporting gross UBI, cost of sales and services was $2.4 billion. ² Includes both expenses and deductions reported on Form 990-T, lines 13(B) and 34, respectively. ³ Organizations with gross UBI between $1,000 (the filing threshold) and $10,000 were required to report only totals for expenses and deductions (except for the specific deduction and net operating loss deduction, which all organizations reported separately). Organizations with gross UBI over $10,000 were required to report each expense and deduction item separately, as shown in columns 14 through 45, 48, 49, and 54 through 59. Excludes $48.5 million of cost of sales and services reported by organizations with gross UBI of $10,000 or less. See footnote 1 for explanation. Excludes $2.3 billion of cost of sales and services reported by organizations with gross UBI over $10,000. See footnote 1 for explanation. This deduction was required to be reported as a lump-sum total only and may have included component deductions that were of the same type shown elsewhere in this table. For example, if deductions "allocable to rental income" included depreciation, then that amount of depreciation would not be included in the separately reported item, "depreciation." Therefore, the total amount shown for some of the separately reported deductions may be understated. Reported by Internal Revenue Code section 501(c)(7), (9), and (17) organizations only. Includes excess exempt-activity expenses from Form 990-T, Schedule I, and excess readership costs from Form 990-T, Schedule J. NOTE: Detail may not add to totals because of rounding.
licenses paid
4
7
5
6
7
8