unsafe return of human excreta to the environment: a ... · project titled “estimates for the...
TRANSCRIPT
Estimates for the Unsafe Return of Human Excreta to the Environment
Unsafe return of human excreta to the environment: a literature review
June 2015


This document was prepared by The Water Institute at UNC as part of the project “Estimates for the Unsafe Return of Human Excreta to the Environment,” funded by Bill & Melinda Gates Foundation.
The Water Institute at UNC Gillings School of Global Public Health The University of North Carolina at Chapel Hill Rosenau Hall, CB #7431 135 Dauer Drive, Chapel Hill, NC 27599-7431 Phone +1-919-966-7302 http://www.waterinstitute.unc.edu
Authors: Ashley R. Williams and Alycia Overbo
Reviewers and Editors: Pete Kolsky and Jamie Bartram
Please use the following reference when quoting this document:
Williams, AR & Overbo, A. Unsafe return of human excreta to the environment: A literature review. 2015. The Water Institute at UNC, Chapel Hill, NC, USA.
© University of North Carolina at Chapel Hill.
Disclaimer: The findings, suggestions and conclusions presented in this publication are entirely those of the authors and should not be attributed in any manner to The University of North Carolina at Chapel Hill or Bill & Melinda Gates Foundation.
iii
Estimates for the Unsafe Return of Human Excreta to the Environment
Unsafe return of human excreta to the environment: a literature review
June 2015
Prepared by Ashley Rhoderick Williams and Alycia Overbo

iv
About The Water Institute at UNC The Water Institute at UNC provides international academic leadership at the nexus of water, health
and development.
Through research, we tackle knowledge gaps that impede effective action on important WaSH and
health issues. We respond to the information needs of our partners, act early on emerging issues,
and proactively identify knowledge gaps. By developing local initiatives and international teaching
and learning partnerships, we deliver innovative, relevant and highly-accessible training programs
that will strengthen the next generation’s capacity with the knowledge and experience to solve
water and sanitation challenges. By identifying or developing, synthesizing and distributing relevant
and up-to-date information on WaSH, we support effective policy making and decision-taking that
protects health and improves human development worldwide, as well as predicting and helping to
prevent emerging risks. Through networking and developing partnerships, we bring together
individuals and institutions from diverse disciplines and sectors, enabling them to work together to
solve the most critical global issues in water and health.
We support WaSH sector organizations to significantly enhance the impact, sustainability and
scalability of their programs.
The vision of The Water Institute at UNC is to bring together individuals and institutions from diverse
disciplines and sectors and empower them to work together to solve the most critical global issues in
water, sanitation, hygiene and health.
v
Table of Contents
1. Abbreviations, Acronyms and Names vii
2. Executive Summary 1
3. Introduction 4
4. Methods 6
5. Results 6
5.1 Microbial hazard of fecal waste streams 6
5.2 Latrines 9
5.2.1 Containment 10
5.2.2 Emptying 12
5.2.3 Transport 17
5.3 Septic systems 20
5.3.1 Containment 21
5.3.2 Emptying 26
5.3.3 Transport and disposal 29
5.3.4 Treatment 30
5.4 Fecal Sludge Treatment 34
5.4.1 Capacity of fecal sludge treatment plants 34
5.4.2 Sludge Treatment Efficiencies 35
5.5 Sewers 38
5.5.1 Containment/Transport 38
5.5.2Treatment 43
5.5.3 Disposal 54
6. Discussion 34
7. Conclusions 62
8. References 63
9. Appendix A. Additional Tables 91
vi
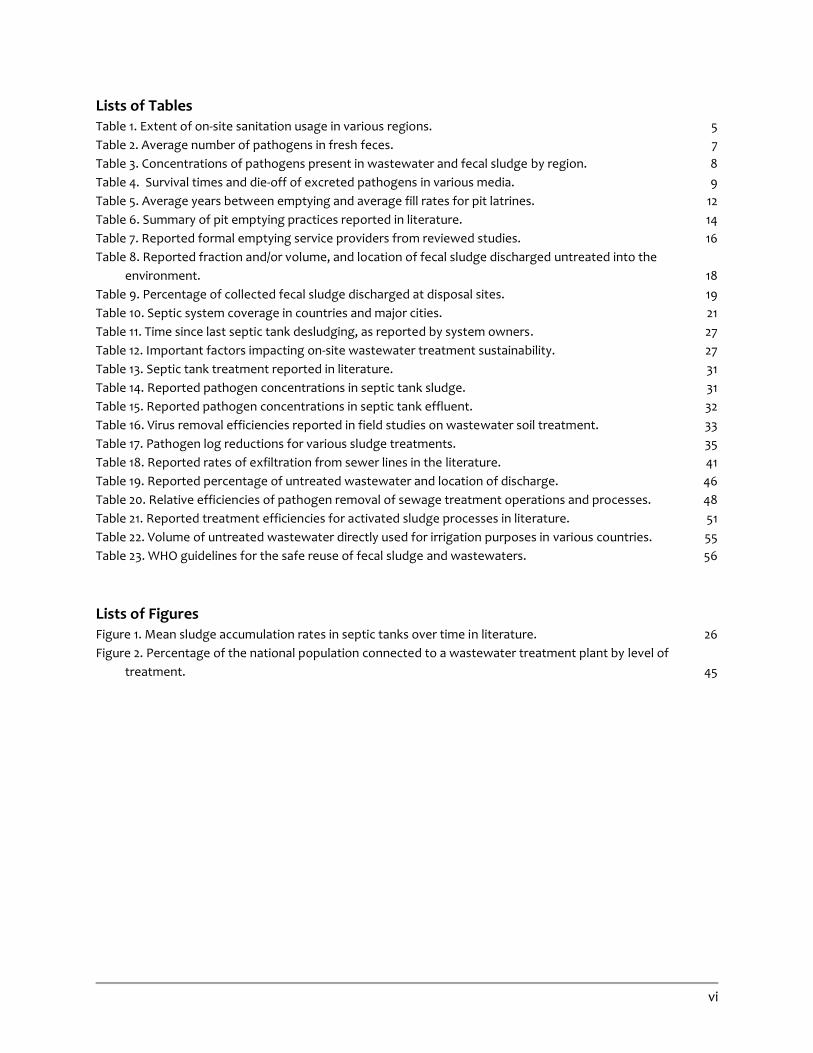
Lists of Tables
Table 1. Extent of on-site sanitation usage in various regions. 5 Table 2. Average number of pathogens in fresh feces. 7 Table 3. Concentrations of pathogens present in wastewater and fecal sludge by region. 8 Table 4. Survival times and die-off of excreted pathogens in various media. 9 Table 5. Average years between emptying and average fill rates for pit latrines. 12 Table 6. Summary of pit emptying practices reported in literature. 14 Table 7. Reported formal emptying service providers from reviewed studies. 16 Table 8. Reported fraction and/or volume, and location of fecal sludge discharged untreated into the
environment. 18 Table 9. Percentage of collected fecal sludge discharged at disposal sites. 19 Table 10. Septic system coverage in countries and major cities. 21 Table 11. Time since last septic tank desludging, as reported by system owners. 27 Table 12. Important factors impacting on-site wastewater treatment sustainability. 27 Table 13. Septic tank treatment reported in literature. 31 Table 14. Reported pathogen concentrations in septic tank sludge. 31 Table 15. Reported pathogen concentrations in septic tank effluent. 32 Table 16. Virus removal efficiencies reported in field studies on wastewater soil treatment. 33 Table 17. Pathogen log reductions for various sludge treatments. 35 Table 18. Reported rates of exfiltration from sewer lines in the literature. 41 Table 19. Reported percentage of untreated wastewater and location of discharge. 46 Table 20. Relative efficiencies of pathogen removal of sewage treatment operations and processes. 48 Table 21. Reported treatment efficiencies for activated sludge processes in literature. 51 Table 22. Volume of untreated wastewater directly used for irrigation purposes in various countries. 55 Table 23. WHO guidelines for the safe reuse of fecal sludge and wastewaters. 56
Lists of Figures Figure 1. Mean sludge accumulation rates in septic tanks over time in literature. 26 Figure 2. Percentage of the national population connected to a wastewater treatment plant by level of
treatment. 45
vii
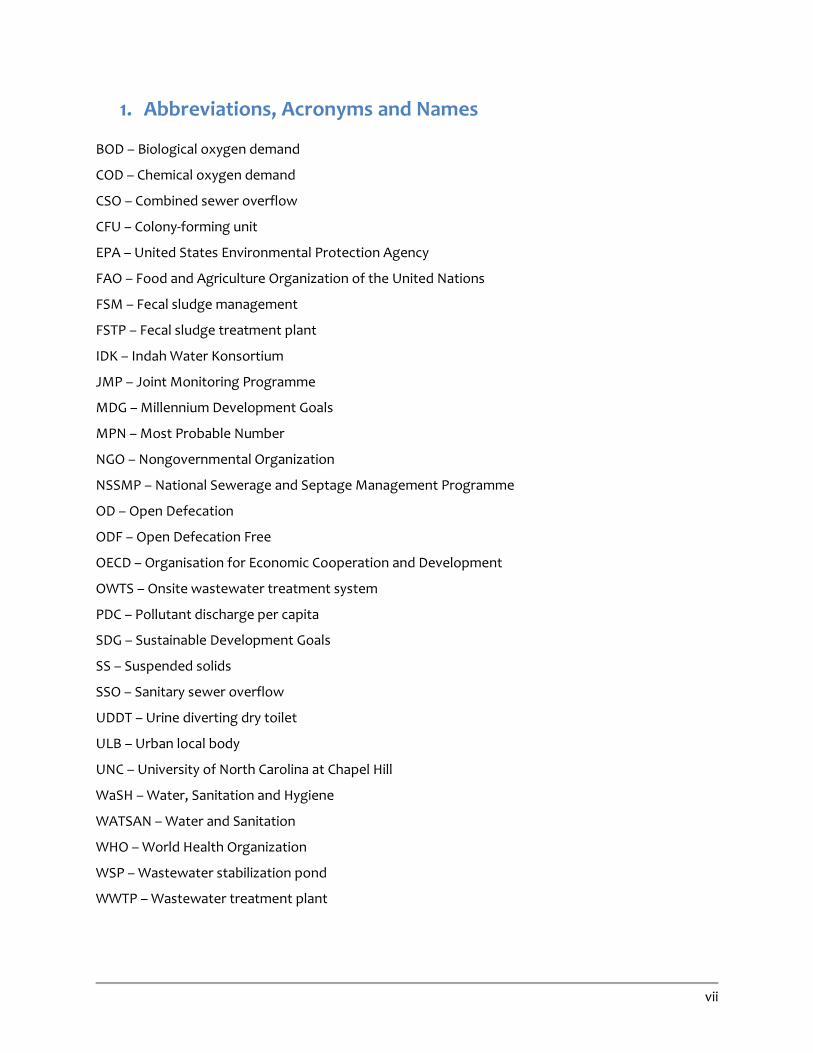
1. Abbreviations, Acronyms and Names
BOD – Biological oxygen demand
COD – Chemical oxygen demand
CSO – Combined sewer overflow
CFU – Colony-forming unit
EPA – United States Environmental Protection Agency
FAO – Food and Agriculture Organization of the United Nations
FSM – Fecal sludge management
FSTP – Fecal sludge treatment plant
IDK – Indah Water Konsortium
JMP – Joint Monitoring Programme
MDG – Millennium Development Goals
MPN – Most Probable Number
NGO – Nongovernmental Organization
NSSMP – National Sewerage and Septage Management Programme
OD – Open Defecation
ODF – Open Defecation Free
OECD – Organisation for Economic Cooperation and Development
OWTS – Onsite wastewater treatment system
PDC – Pollutant discharge per capita
SDG – Sustainable Development Goals
SS – Suspended solids
SSO – Sanitary sewer overflow
UDDT – Urine diverting dry toilet
ULB – Urban local body
UNC – University of North Carolina at Chapel Hill
WaSH – Water, Sanitation and Hygiene
WATSAN – Water and Sanitation
WHO – World Health Organization
WSP – Wastewater stabilization pond
WWTP – Wastewater treatment plant

1
2. Executive Summary
This literature review was funded by Bill & Melinda Gates Foundation as part of a proof of concept
project titled “Estimates for the Unsafe Return of Human Excreta to the Environment”. The aim was
to compile evidence on the pathways and extent of unsafe return of human excreta to the
environment throughout the sanitation delivery chain. This document was submitted to Bill &
Melinda Gates Foundation on June 4, 2015. The authors invite readers to provide feedback,
suggestions, and questions that may be addressed and incorporated in a future version of the
review.
Within monitoring and evaluation, sanitation facilities are often assumed to be safe if, by design, they
create a barrier between humans and human excreta. However, human excreta may be released
into the environment if the waste is not sufficiently contained on-site, if the waste is “leaked” into
the environment through improper disposal or transport, or if the waste is insufficiently treated.
Human waste contains pathogens that are harmful to health; thus leakage of human excreta into the
household, community, and greater environment is a public health concern.
This review investigated leakage of excreta in the containment, disposal, transport, treatment, and
disposal stages of the sanitation delivery chain for the following technologies: pit latrines, septic
systems, and sewerage. The review focused on “leakage” of fecal sludge, liquid waste stream,
wastewater, and pathogens contained in excreta.
The review findings indicate that while there are few studies on “leakage” of latrines and septic
systems, studies report that many latrines and septic tank are not emptied and are sources of
groundwater contamination. Unlined latrines, damaged facilities, and pits serving as septic tanks do
not provide effective containment and can cause microbial contamination of the household
premises. Findings from a few studies indicate that latrines are widely affected by storms, heavy
rainfall, and floods; while no studies reported on effects of weather events on septic systems,
vulnerability to floods and extreme weather events may also be expected. In addition, findings
indicated the additional hazard of households resorting to open defecation when their latrines
became damaged or unusable.
While several studies and reviews cited latrines and septic systems as potential or likely causes of
groundwater contamination events, this was not universal across included studies; some studies
reported no contamination effects from nearby facilities. The range of findings emphasize that the
impact of latrines and septic systems on groundwater quality is dependent on soil type, distance
between groundwater and pit or drain field, and hydrological conditions. Additionally, seasonal
effects on well contamination in areas with a high density of latrines or septic systems were reported
in several studies.
Household latrine and septic tank emptying behavior is not well understood or characterized in the
literature. Included studies on household emptying behavior for latrines and septic tanks commonly
2
reported a large proportion of respondents had never emptied their on-site sanitation facility or did
not know the last time they had emptied it. This appeared to vary across study settings; some
studies cited a high percentage of respondents routinely emptied their on-site sanitation
facility. However, emptying was self-reported in all studies and subject to recall bias.
Methods for pit latrine emptying also varied by study setting; mechanical emptying was more
prevalent in some regions, whereas manual emptying, burying pits, pit diversion, and mechanical
emptying were more commonly used in other study settings. “Flooding” latrines appears to be a
common practice in certain areas, yet was cited in few papers. Literature findings indicate that
availability of diverse emptying options was associated with routine emptying. Several studies cited
that while private and public companies may provide emptying services, they were often not
sufficient to meet regional demand. Only two studies in peri-urban and rural areas were found,
therefore the behaviors practiced in these settings when pits fill up are relatively undocumented.
Very little literature was found on certain topics related to on-site sanitation facilities. Septic systems
are used in many urban and rural settings of developing countries, yet few studies on septic system
performance and maintenance were retrieved from developing countries. Within a small number of
studies, septic system maintenance was found to be infrequent. Older septic systems are prone to
failure and common in the US, but little data was found on system age and performance.
Critical gaps identified in the literature included the fate of collected fecal sludge, and the extent of
primary, secondary, and tertiary treatment. While some studies reported volumes of fecal sludge
collected, treated, and properly disposed in certain cities, there were no estimates or studies found
for many regions. Having more reliable estimates from collection through disposal would better
illustrate regional gaps and opportunities within the sanitation delivery chain. Similarly, there are
global estimates for wastewater that is treated, but the effectiveness and level of treatment is
unknown. The results from the reviewed studies show, even with advanced treatment processes,
some wastewater effluent still contains high levels of pathogens.
In order to understand the increased hazard to public health through the unsafe return of human
excreta, it is necessary to determine where excreta is “leaking” back into the environment. From the
literature, it is unclear what fraction of sludge is being disposed of, untreated, into surface water
through practices such as flooding or discharging sludge into drains which may lead to wastewater
treatment plants or directly into surface water through storm water drains. Since the rate of
pathogen die-off varies in soil and water, future research on fecal sludge management behavior
should report more specifically the location of disposal in order to better characterize the associated
public health risks.

3
4
3. Introduction
As part of the United Nations Millennium Development Goals (MDGs), Target 7c focuses on reducing
by half, “the “proportion of the population without sustainable access to ...basic sanitation”
between 1990 and 2015. In order to monitor the progress towards this target, the Joint Monitoring
Programme (JMP) has defined categories of improved and unimproved sanitation facilities.
Improved sanitation facilities are ventilated improved pit latrines (VIP), pit latrines with a slab,
composting toilets, and flush or pour-flush to either piped sewer systems a septic tank or a pit
latrine. Unimproved sanitation facilities are flush or pour-flush to an endpoint other than a piped
system, septic tank or pit latrine, pit latrine without a slab, an open pit, bucket, hanging toilet or
hanging latrine, any type of shared facility, or open defecation (1).
One of the motivations behind this target is to reduce the risk of human exposure to hazardous
pathogens present in human excreta by creating a barrier between humans and excreta. Previous
systematic reviews have shown sanitation technologies to reduce the prevalence of diarrheal disease
and helminth infections (2–4). While global monitoring currently focuses solely on the type of
sanitation technology used by the household, there is a need to understand what happens with
human excreta beyond the point of containment. The entire sanitation delivery chain (containment,
emptying, transport, treatment, and disposal/reuse) must be examined in order to ensure a
separation of human contact from human excreta within and beyond the household premises (5).
For each sanitation technology, there exist potential pathways for unsafe leakage of human excreta
back into the environment. Pit latrines and septic tanks are considered “on-site sanitation”
technologies and have some similar characteristics with regards to the sanitation delivery chain. Both
technologies are designed to contain fecal waste at the household. Pit latrines generally contain
fecal sludge along with some inorganic materials that are occasionally discharged into the pit by
users. Septic tanks generate both a liquid and solid (sludge) waste stream, however the liquid waste
is designed to discharge into the surrounding soil through a drain field. On-site sanitation
technologies are used by roughly a quarter of Americans (6), and are the predominant sanitation
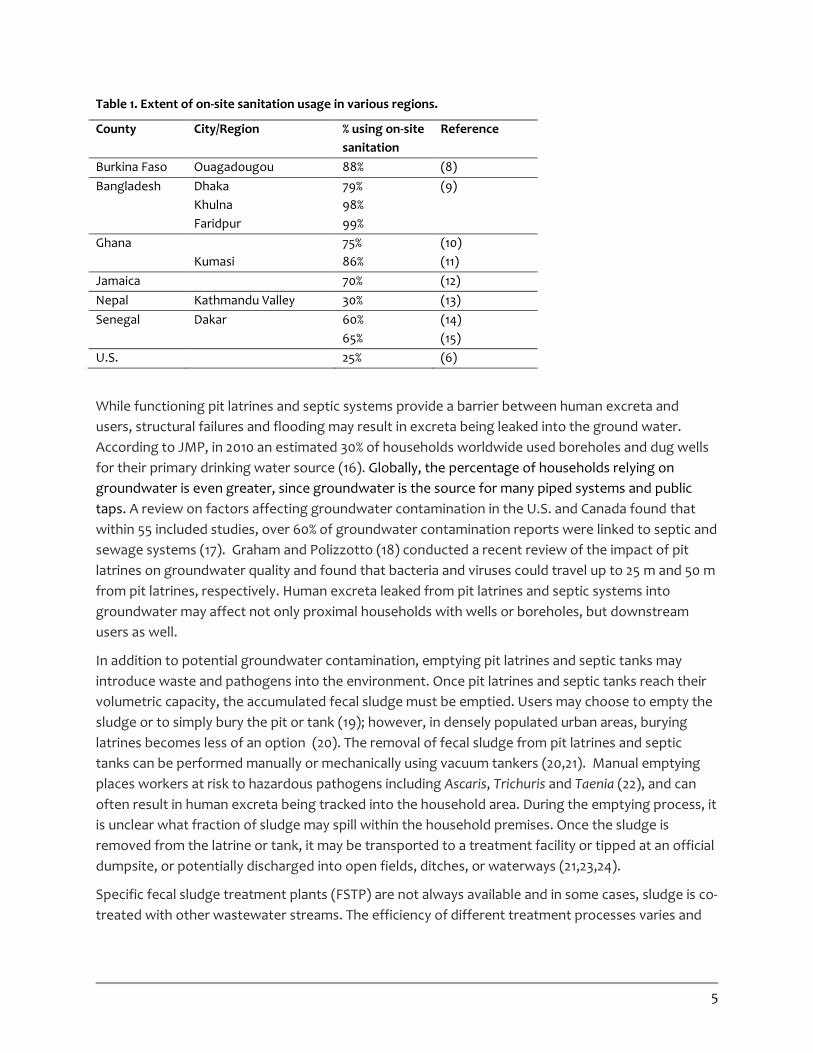
technology in certain parts of Asia and Africa (7) (Table 1).
5
Table 1. Extent of on-site sanitation usage in various regions.
County City/Region % using on-site
sanitation
Reference
Burkina Faso Ouagadougou 88% (8)
Bangladesh Dhaka
Khulna
Faridpur
79%
98%
99%
(9)
Ghana
Kumasi
75%
86%
(10)
(11)
Jamaica 70% (12)
Nepal Kathmandu Valley 30% (13)
Senegal Dakar 60%
65%
(14)
(15)
U.S. 25% (6)
While functioning pit latrines and septic systems provide a barrier between human excreta and
users, structural failures and flooding may result in excreta being leaked into the ground water.
According to JMP, in 2010 an estimated 30% of households worldwide used boreholes and dug wells
for their primary drinking water source (16). Globally, the percentage of households relying on
groundwater is even greater, since groundwater is the source for many piped systems and public
taps. A review on factors affecting groundwater contamination in the U.S. and Canada found that
within 55 included studies, over 60% of groundwater contamination reports were linked to septic and
sewage systems (17). Graham and Polizzotto (18) conducted a recent review of the impact of pit
latrines on groundwater quality and found that bacteria and viruses could travel up to 25 m and 50 m
from pit latrines, respectively. Human excreta leaked from pit latrines and septic systems into
groundwater may affect not only proximal households with wells or boreholes, but downstream
users as well.
In addition to potential groundwater contamination, emptying pit latrines and septic tanks may
introduce waste and pathogens into the environment. Once pit latrines and septic tanks reach their
volumetric capacity, the accumulated fecal sludge must be emptied. Users may choose to empty the
sludge or to simply bury the pit or tank (19); however, in densely populated urban areas, burying
latrines becomes less of an option (20). The removal of fecal sludge from pit latrines and septic
tanks can be performed manually or mechanically using vacuum tankers (20,21). Manual emptying
places workers at risk to hazardous pathogens including Ascaris, Trichuris and Taenia (22), and can
often result in human excreta being tracked into the household area. During the emptying process, it
is unclear what fraction of sludge may spill within the household premises. Once the sludge is
removed from the latrine or tank, it may be transported to a treatment facility or tipped at an official
dumpsite, or potentially discharged into open fields, ditches, or waterways (21,23,24).
Specific fecal sludge treatment plants (FSTP) are not always available and in some cases, sludge is co-
treated with other wastewater streams. The efficiency of different treatment processes varies and

6
can result in potentially hazardous “treated” fecal sludge being discharged back into the
environment.
For households served by sewerage connections, transport, treatment and disposal are of particular
concern for potential leakage. During transport within sewers, hazardous return of unsafe excreta
can occur due to misconnections, structural deficiencies, and flooding events such as combined
sewer overflows (25–27). However, a previous study has highlighted that a significant pathway of
“unsafe return” for sewage is likely within the treatment step. Baum et al. (28) estimated 1.5 billion
people have sewer connections that do not lead to any type of treatment facility but discharge
sewage back into the environment.
There are multiple pathways in the sanitation chain that may introduce pathogenic waste into
households, communities and the environment, and a more thorough understanding of the leakage
of human excreta is needed to safeguard public health. This literature review was conducted in order
to further examine and identify “leakage” pathways along the sanitation delivery chain.
4. Methods
Targeted Boolean searches were conducted in Web of Science and Google Scholar between March
15 and April 24, 2015. Search strategies included terms for latrines, septic systems, sewerage, and
wastewater treatment. Additional search terms were used for the stages in the sanitation delivery
chain, such as emptying, transport, and treatment efficiencies.
Papers from peer-reviewed journals and grey literature were included in this review. Eligible grey
literature included papers from conference proceedings and reports. Accepted papers had
qualitative or quantitative findings on sanitation technology functionality, microbial contamination,
emptying, transport, treatment, or groundwater contamination. Bibliographies from accepted
papers were also searched for relevant papers.
Data on study findings were extracted from included papers. Findings from accepted papers were
grouped by sanitation technology and by phase in the sanitation delivery chain.
5. Results
5.1 Microbial hazard of fecal waste streams
One of the primary hazards associated with human fecal waste is the presence of pathogenic
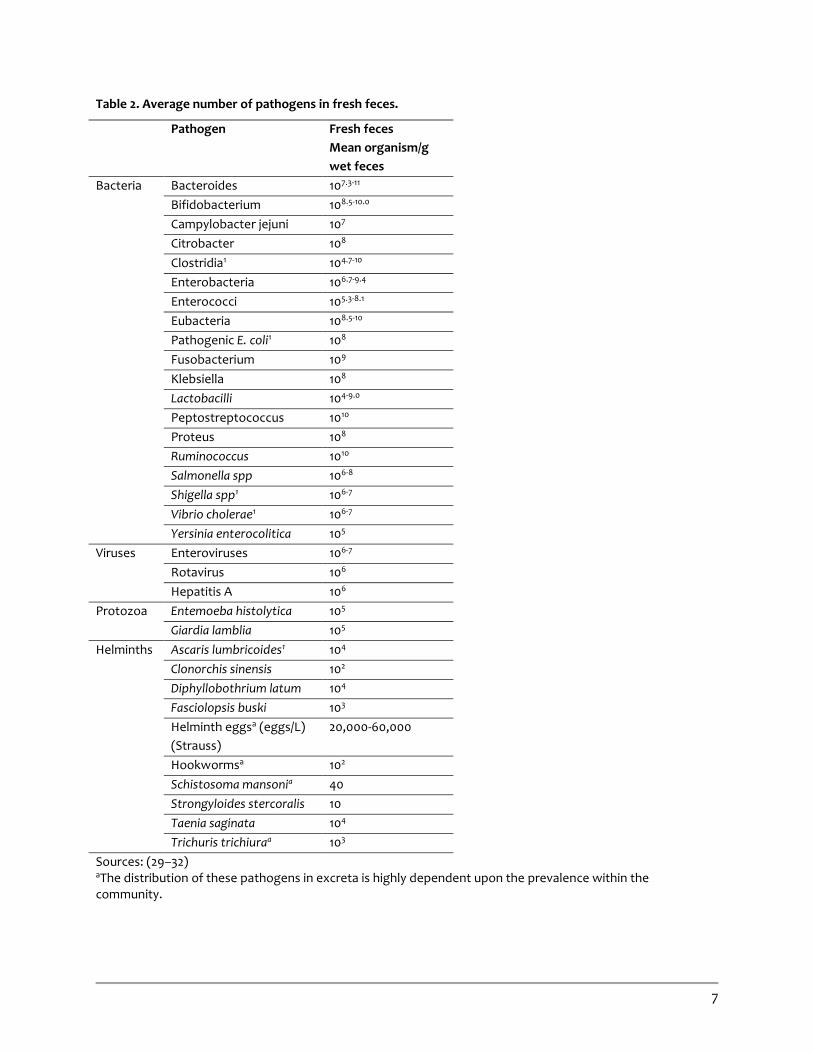
organisms in feces. Tables 2 and 3 show the average concentrations of various pathogens present in
human excreta, wastewater, and fecal sludge.
7
Table 2. Average number of pathogens in fresh feces.
Pathogen Fresh feces
Mean organism/g
wet feces
Bacteria Bacteroides 107.3-11
Bifidobacterium 108.5-10.0
Campylobacter jejuni 107
Citrobacter 108
Clostridia1 104.7-10
Enterobacteria 106.7-9.4
Enterococci 105.3-8.1
Eubacteria 108.5-10
Pathogenic E. coli1 108
Fusobacterium 109
Klebsiella 108
Lactobacilli 104-9.0
Peptostreptococcus 1010
Proteus 108
Ruminococcus 1010
Salmonella spp 106-8
Shigella spp1 106-7
Vibrio cholerae1 106-7
Yersinia enterocolitica 105
Viruses Enteroviruses 106-7
Rotavirus 106
Hepatitis A 106
Protozoa Entemoeba histolytica 105
Giardia lamblia 105
Helminths
Ascaris lumbricoides1 104
Clonorchis sinensis 102
Diphyllobothrium latum 104
Fasciolopsis buski 103
Helminth eggsa (eggs/L)
(Strauss)
20,000-60,000
Hookwormsa 102
Schistosoma mansonia 40
Strongyloides stercoralis 10
Taenia saginata 104
Trichuris trichiuraa 103
Sources: (29–32) aThe distribution of these pathogens in excreta is highly dependent upon the prevalence within the community.
8
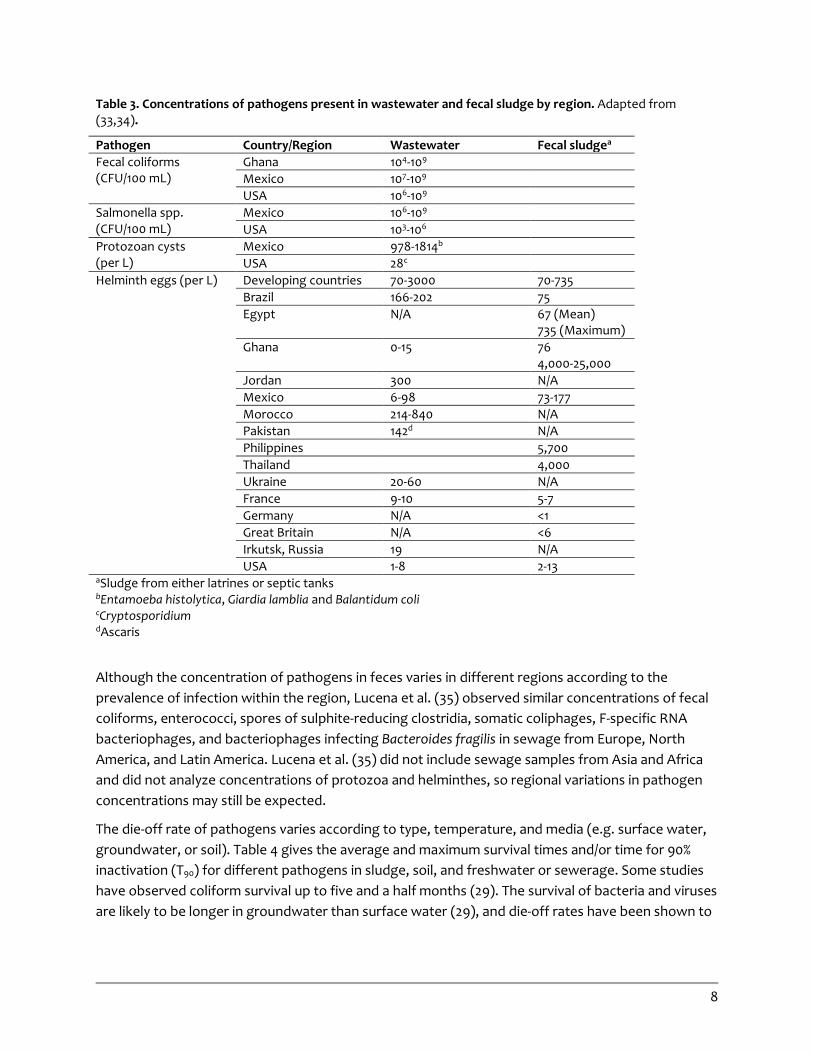
Table 3. Concentrations of pathogens present in wastewater and fecal sludge by region. Adapted from (33,34).
Pathogen Country/Region Wastewater Fecal sludgea
Fecal coliforms (CFU/100 mL)
Ghana 104-109
Mexico 107-109
USA 106-109
Salmonella spp. (CFU/100 mL)
Mexico 106-109
USA 103-106
Protozoan cysts (per L)
Mexico 978-1814b
USA 28c
Helminth eggs (per L) Developing countries 70-3000 70-735
Brazil 166-202 75
Egypt N/A 67 (Mean) 735 (Maximum)
Ghana 0-15 76 4,000-25,000
Jordan 300 N/A
Mexico 6-98 73-177
Morocco 214-840 N/A
Pakistan 142d N/A
Philippines 5,700
Thailand 4,000
Ukraine 20-60 N/A
France 9-10 5-7
Germany N/A <1
Great Britain N/A <6
Irkutsk, Russia 19 N/A
USA 1-8 2-13 aSludge from either latrines or septic tanks bEntamoeba histolytica, Giardia lamblia and Balantidum coli cCryptosporidium dAscaris
Although the concentration of pathogens in feces varies in different regions according to the
prevalence of infection within the region, Lucena et al. (35) observed similar concentrations of fecal
coliforms, enterococci, spores of sulphite-reducing clostridia, somatic coliphages, F-specific RNA
bacteriophages, and bacteriophages infecting Bacteroides fragilis in sewage from Europe, North
America, and Latin America. Lucena et al. (35) did not include sewage samples from Asia and Africa
and did not analyze concentrations of protozoa and helminthes, so regional variations in pathogen
concentrations may still be expected.
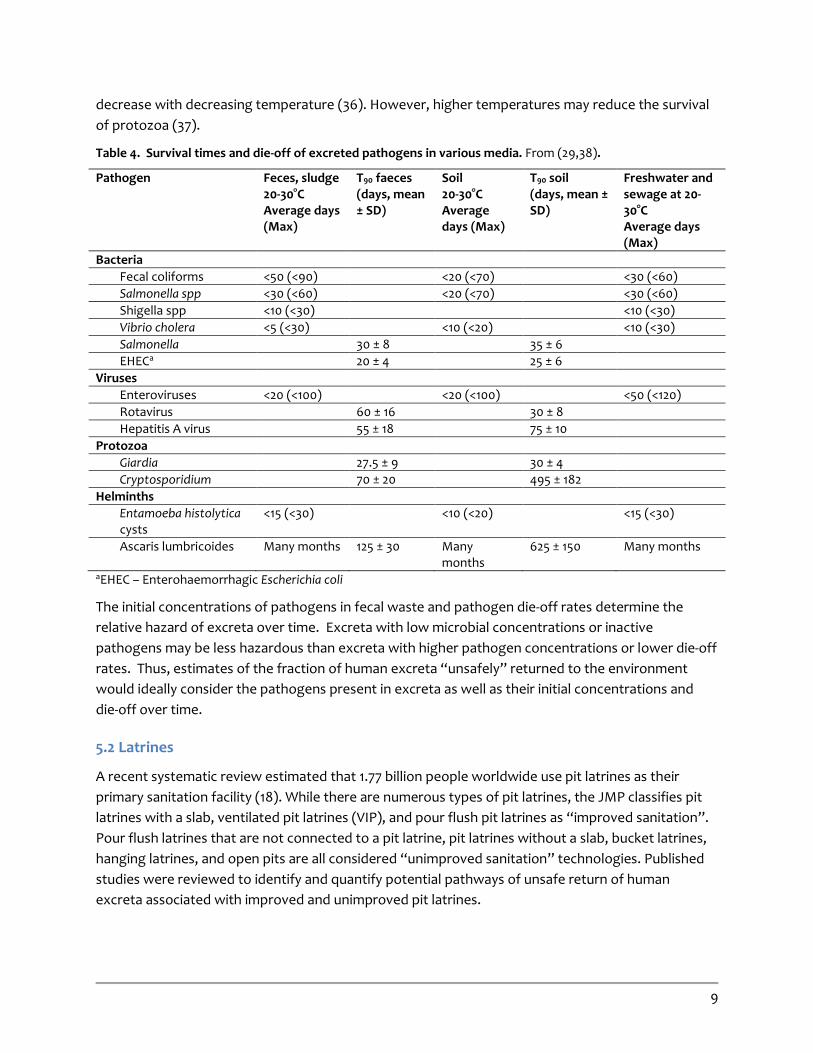
The die-off rate of pathogens varies according to type, temperature, and media (e.g. surface water,
groundwater, or soil). Table 4 gives the average and maximum survival times and/or time for 90%
inactivation (T90) for different pathogens in sludge, soil, and freshwater or sewerage. Some studies
have observed coliform survival up to five and a half months (29). The survival of bacteria and viruses
are likely to be longer in groundwater than surface water (29), and die-off rates have been shown to
9
decrease with decreasing temperature (36). However, higher temperatures may reduce the survival
of protozoa (37).
Table 4. Survival times and die-off of excreted pathogens in various media. From (29,38).
Pathogen Feces, sludge 20-30°C Average days (Max)
T90 faeces (days, mean ± SD)
Soil 20-30°C Average days (Max)
T90 soil (days, mean ± SD)
Freshwater and sewage at 20-30°C Average days (Max)
Bacteria
Fecal coliforms <50 (<90) <20 (<70) <30 (<60)
Salmonella spp <30 (<60) <20 (<70) <30 (<60)
Shigella spp <10 (<30) <10 (<30)
Vibrio cholera <5 (<30) <10 (<20) <10 (<30)
Salmonella 30 ± 8 35 ± 6
EHECa 20 ± 4 25 ± 6
Viruses
Enteroviruses <20 (<100) <20 (<100) <50 (<120)
Rotavirus 60 ± 16 30 ± 8
Hepatitis A virus 55 ± 18 75 ± 10
Protozoa
Giardia 27.5 ± 9 30 ± 4
Cryptosporidium 70 ± 20 495 ± 182
Helminths
Entamoeba histolytica cysts
<15 (<30) <10 (<20) <15 (<30)
Ascaris lumbricoides Many months 125 ± 30 Many months
625 ± 150 Many months
aEHEC – Enterohaemorrhagic Escherichia coli
The initial concentrations of pathogens in fecal waste and pathogen die-off rates determine the
relative hazard of excreta over time. Excreta with low microbial concentrations or inactive
pathogens may be less hazardous than excreta with higher pathogen concentrations or lower die-off
rates. Thus, estimates of the fraction of human excreta “unsafely” returned to the environment
would ideally consider the pathogens present in excreta as well as their initial concentrations and
die-off over time.
5.2 Latrines
A recent systematic review estimated that 1.77 billion people worldwide use pit latrines as their
primary sanitation facility (18). While there are numerous types of pit latrines, the JMP classifies pit
latrines with a slab, ventilated pit latrines (VIP), and pour flush pit latrines as “improved sanitation”.
Pour flush latrines that are not connected to a pit latrine, pit latrines without a slab, bucket latrines,
hanging latrines, and open pits are all considered “unimproved sanitation” technologies. Published
studies were reviewed to identify and quantify potential pathways of unsafe return of human
excreta associated with improved and unimproved pit latrines.

10
5.2.1 Containment
At the containment level, compromised structural integrity, flooding, and leakage of waste into
surface water and groundwater were identified as potential pathways of unsafe return.
Structural integrity Lined pit latrines can reduce the risk of microbial leakage from excreta into groundwater (39). In a
cross-sectional study of 662 households in Dar es Salaam, 88% of surveyed households had a
traditional pit latrine, and less than a quarter (21%) of them were fully lined. The majority (41%) of
traditional latrines were unlined. Including VIP, pour flush, and bucket latrines, 36% of latrines were
unlined, 36% were partially lined and 23% were fully lined. Additional structural compromises such as a
slightly cracked, badly cracked or collapsing slab were observed in 39.9%, 13.4% and 6.2% of latrine
facilities (40). A study of 100 households in Malawi found 95% of latrines were unlined (41).
Flooding Flooding poses another potential “leakage” of waste for pit latrines located in flood prone areas. In
areas of severe flooding, the majority of sanitation facilities can become inundated with water (42).
Flooding and severe weather can cause structural damage to latrines resulting in excreta being
washed into peoples’ homes and into the streets (43,44). No specific study was identified that
examined the impact of flooding on fecal contamination from sanitation facilities, however four
studies reported on latrine flooding events or vulnerability. A cross-sectional study of 189
households in Nicaragua found 41% were located in flood zones and 37% of sampled households had a
latrine overflow within the past year (45). In peri-urban Malawi, Grimason et al. (41) found 47% of
surveyed households experienced pit collapse, with 23% citing heavy rainfall as the main contributing
factor. A study of post-cyclone damage in affected areas of Bangladesh found 90% of latrines were
damaged or destroyed in the wake of the event (46). A rapid assessment study in Vientiane, Lao PDR
reported 31% of toilets (the majority were pour-flush latrines) were at risk of flooding, and 6% had
flooded at least once (47). The same study also observed pit latrines filling with water due to high
groundwater (47).
Surface water contamination from pit latrines Two studies were reviewed that demonstrated microbial contamination of surface water bodies due
to unsafe return of pit latrine waste. Latrines can be “flooded out” by creating a trapdoor or pipe in
the bottom of the latrine, allowing sludge to run off with rainwater (48,49). A study of protected
springs in Kampala, Uganda cited effluent from flooded out pit latrines as a potential source of fecal
coliform contamination (48). The study found statistically significant differences in fecal coliform
concentration in protected springs between high population density and low population density
villages. The springs served as a primary drinking water source for lower-income households in the
area, thus the households were at risk of exposure to waterborne pathogens (48).
A study in Bangladesh also examined the impacts of latrines on the microbial quality of nearby ponds
(50). In the study area, 43 ponds were sampled, of which 11 were used for fishing or bathing, 16 had
no specific purpose and 16 were identified as “latrine ponds” since they directly received latrine
effluent. Results from PCR analysis of human and bovine Bacteroidales revealed human fecal
contamination was more prevalent than bovine fecal contamination. Latrine ponds had the highest

11
concentrations of fecal indicator bacteria (FIB) (25th and 75th percentiles being 7.9 x 10³, 2.2 x 10⁵
MPN/100mL). While ponds used for bathing and fishing had significantly lower concentrations of FIB
(25th and 75th percentiles being 5.1 x 10², 4.4 x 10³ MPN/100mL), the concentrations were still higher
than the U.S. Environmental Protection Agency’s recreational water limit of 126 MPN/100mL (50).
Groundwater contamination from pit latrines A recent review of the impact of pit latrines on groundwater quality included 20 studies that
measured microbiological contamination of groundwater (18). Nineteen studies measured fecal
indicator bacteria concentration (total coliforms, fecal coliforms, fecal streptococci, E. coli, or B. coli),
while one measured rotaviruses and adenoviruses (51). None of the studies examined protozoa or
helminth contamination, although these have been shown to have relatively small movement in
groundwater (52).
Of the 20 studies included in the review, 17 reported microbial contamination associated with pit
latrines. Travel distance varied from 1-25 m for bacterial contamination, although the authors
remarked that most reported transport distances were closer to half the distance of the maximum
value (~10 m). In the one study examining viruses, viral contamination of water sources was
significantly associated with at least one latrine within 50 m (51). Soil type and hydrological
conditions influenced the extent of microbial contamination and travel distance of pathogens.
Lined pit latrines and increased vertical separation between pit latrines and ground water tables
were recommended to decrease groundwater contamination (39,53–55). In areas where the water
table is high, households may construct raised pit latrines to increase vertical separation (48,56,57).
Chaggu et al. (56) observed 50% of latrines were full due to high groundwater. However, one study
reported that elevated pit latrines can actually lead to a greater risk to groundwater water
contamination since it may increase the hydraulic gradient between groundwater (58).
In contrast, four studies found no significant correlation between pit latrine density and poor
groundwater microbial quality (59–62). Overall, attributing groundwater contamination to pit
latrines may be difficult since microbial pathogens from agriculture, livestock, and solid waste may
leach into groundwater from surface infiltration and runoff. A 1999 WELL Report on groundwater
and latrines concluded the key factor to be considered is the residence time between the point of
contamination and the point of water withdraw (63). Depending on hydrological conditions and soil
type, the residence time may be sufficient to allow microbial contaminants to die-off before
abstraction.
Non-functionality of sanitation facilities Another pathway for unsafe return of excreta occurs when sanitation facilities are compromised and
households must resort to open defecation. Several studies reported encountering sanitation
facilities that were unusable due to flooding, structural collapse, or being full (40,42,64). In one
study, latrines were non-operational for an average of 52 and 22 days due to a full pit or a collapsed
pit, respectively (40). During periods of non-functionality, households must find an alternative
sanitation option. Shimi et al. (42) found 48% of households resorted to open defecation during a
flood event. The alternative may be temporary or become a permanent behavior change if
12
households chose not to empty their pit or repair significant structural damage. Hoque et al. (44)
found 11% of households stopped using their latrines after a flood, while a study in Ghana found 63%
of households preferred to practice open defecation once their pit was full (64).
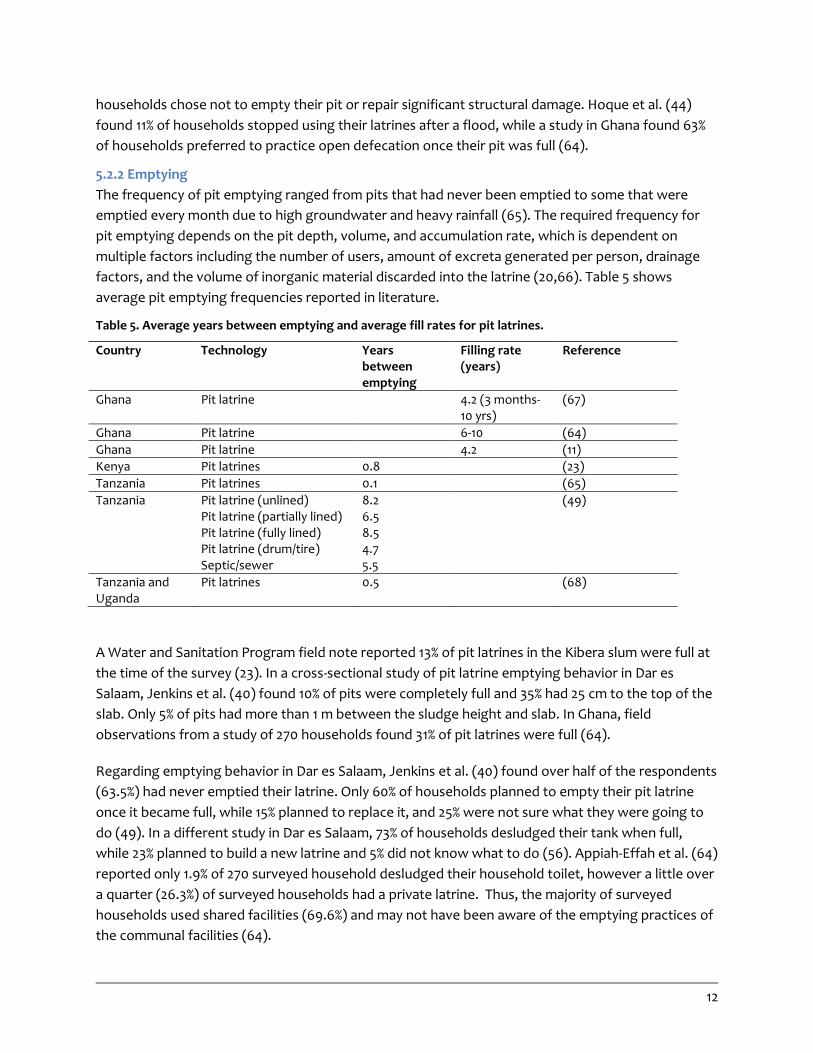
5.2.2 Emptying
The frequency of pit emptying ranged from pits that had never been emptied to some that were
emptied every month due to high groundwater and heavy rainfall (65). The required frequency for
pit emptying depends on the pit depth, volume, and accumulation rate, which is dependent on
multiple factors including the number of users, amount of excreta generated per person, drainage
factors, and the volume of inorganic material discarded into the latrine (20,66). Table 5 shows
average pit emptying frequencies reported in literature.
Table 5. Average years between emptying and average fill rates for pit latrines.
Country Technology Years between emptying
Filling rate (years)
Reference
Ghana Pit latrine 4.2 (3 months-10 yrs)
(67)
Ghana Pit latrine 6-10 (64)
Ghana Pit latrine 4.2 (11)
Kenya Pit latrines 0.8 (23)
Tanzania Pit latrines 0.1 (65)
Tanzania Pit latrine (unlined) Pit latrine (partially lined) Pit latrine (fully lined) Pit latrine (drum/tire) Septic/sewer
8.2 6.5 8.5 4.7 5.5
(49)
Tanzania and Uganda
Pit latrines 0.5 (68)
A Water and Sanitation Program field note reported 13% of pit latrines in the Kibera slum were full at
the time of the survey (23). In a cross-sectional study of pit latrine emptying behavior in Dar es
Salaam, Jenkins et al. (40) found 10% of pits were completely full and 35% had 25 cm to the top of the
slab. Only 5% of pits had more than 1 m between the sludge height and slab. In Ghana, field
observations from a study of 270 households found 31% of pit latrines were full (64).
Regarding emptying behavior in Dar es Salaam, Jenkins et al. (40) found over half of the respondents
(63.5%) had never emptied their latrine. Only 60% of households planned to empty their pit latrine
once it became full, while 15% planned to replace it, and 25% were not sure what they were going to
do (49). In a different study in Dar es Salaam, 73% of households desludged their tank when full,
while 23% planned to build a new latrine and 5% did not know what to do (56). Appiah-Effah et al. (64)
reported only 1.9% of 270 surveyed household desludged their household toilet, however a little over
a quarter (26.3%) of surveyed households had a private latrine. Thus, the majority of surveyed
households used shared facilities (69.6%) and may not have been aware of the emptying practices of
the communal facilities (64).

13
Five main methods of handling full pits were identified through the literature search: mechanical
emptying, manual emptying, pit diversion, ‘flooding’, or burial. Table 6 summarizes the distribution
of reported emptying methods employed by households. Mechanical emptying utilizes a vacuum
tanker that uses hoses to pump sludge out of the pits (20,21). Manual emptying can be done using
portable manual pumping technology (such as manual pit emptying technology (MAPET) or gulpers)
or it can be performed by hand using buckets and rakes. Mechanical and MAPET are considered
hygienic emptying methods, while hand emptying, pit diversion and flooding are considered
unhygienic (49). However, even when employing mechanical emptying methods, fecal sludge can
leak into the household due to the poor conditions of the hoses and equipment (69).
While some households with sufficient land area may choose to cover a full pit over and construct a
new latrine, others may choose not to construct a new latrine after burying a full pit. These
households may opt for alternative sanitation options such as using shared sanitation facilities or
reverting to open defecation (64). Observations from one study in Tanzania revealed 28% of latrines
practiced flooding out their latrine, although only 12% of households admitted to practicing this
method of disposal (40). This emptying method was observed but not quantified in two studies of
households in Kampala, Uganda (48,57).

14
Table 6. Summary of pit emptying practices reported in literature.
Country Region Setting Households total (N)
Households practicing emptying
Pit latrine emptying Reference
Burkina Faso Ouagadougou U 1.5 million 50% 75% vacuum tanker (70) as cited in (8)
Ghana Ashanti region P & R 270 1.9% (5) 1.9% mechanical emptying
(64)
Kenya Kibera U 80% flooded out 20% buried
(71)
Kenya Kiberia U 49 33% mechanical emptying 28% manual emptying 13% gravitational emptying 3% chemical emptying 5% burial 13% out of order latrines 5% unknown
(23)
Lao PDR Vientiane U 548 99% mechanically <1% manual emptying
(47)
Malawi Blantyre U 100 82% buried pits, construct new 13% mechanical emptying
(41)
Mali Bamako 306 70% (214) 80% Vacuum trucks 17% manual emptying 1% emptied by household 1% other (not specified)
(72)
Senegal Dakar U 74% discharged into streets 7% discharged onto compounds
(73) as cited in (74)
Senegal Dakar, Thiès, Touba
U 1,500 64% (960) 64% mechanical emptying 26% manual emptying 9% both mechanical and manual emptying
(15)
South Africa eThekwini Municipality
P & R 15,983 65.5% (10,414) 83.8% manual emptying (by household) 9.2% private company (unspecified)
(75)
Tanzania Dar es Salaam U 207 72% (149) 73% vacuum trucks 27% pit diversion
(56)
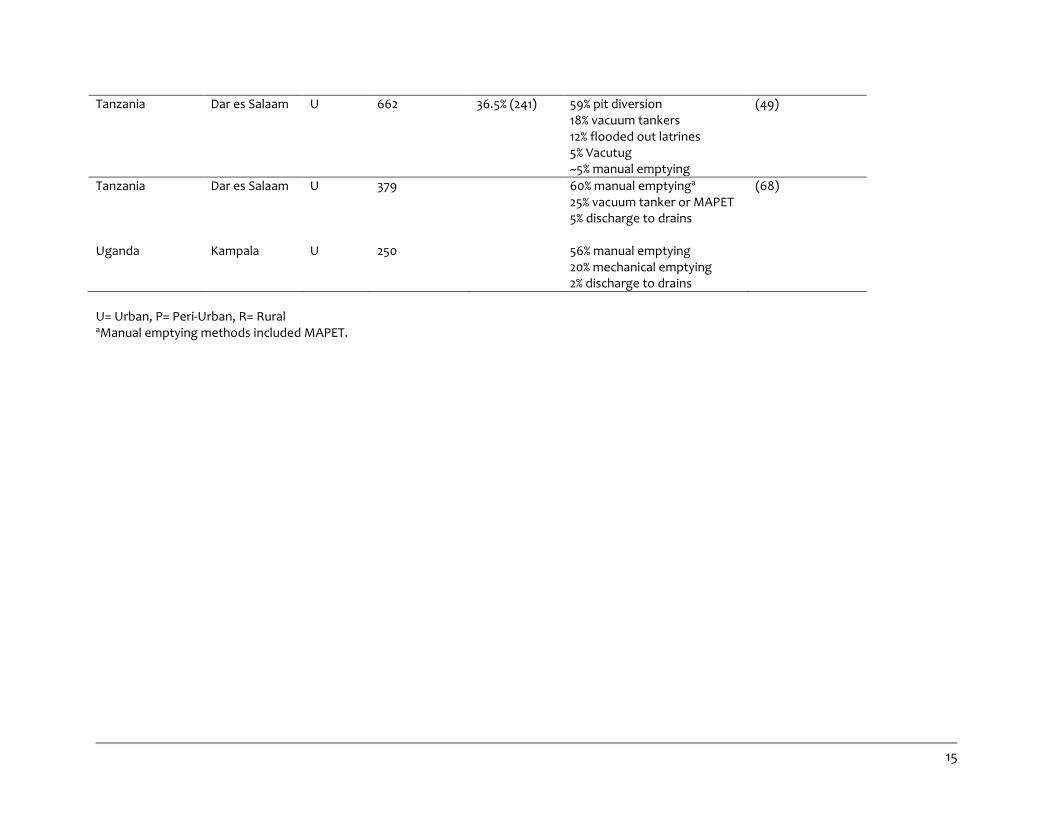
15
Tanzania Dar es Salaam U 662 36.5% (241) 59% pit diversion 18% vacuum tankers 12% flooded out latrines 5% Vacutug ~5% manual emptying
(49)
Tanzania Uganda
Dar es Salaam Kampala
U U
379 250
60% manual emptyinga
25% vacuum tanker or MAPET
5% discharge to drains 56% manual emptying 20% mechanical emptying 2% discharge to drains
(68)
U= Urban, P= Peri-Urban, R= Rural aManual emptying methods included MAPET.

16
Emptying services The type of emptying service providers were usually private companies, government owned
operators, or informal operators. Table 7 summarizes the number and types of formal service
providers reported in the reviewed studies.
Table 7. Reported formal emptying service providers from reviewed studies.
Country City/Region Type of service Number available
Reference
Bangladesh Dhaka Faridpur Khulna
NGO Public Public
2 1 1
(9)
Ghana Accra Private 26 (76)
Ghana Kumasi Private Public
17 5
(11)
Lao, PDR Vientiane Private 17 (47)
Senegal Dakar Thiès Touba
Private 50a
5a
12a
(15)
Tanzania Dar es Salaam Private City-council
28 14
(56)
aAverage number of private businesses
Key barriers to hygienic pit emptying arose within the reviewed literature. Lack of awareness of
services was mentioned in two studies. One found 74% of surveyed households in Blantyre, Malawai
were not aware of hygienic pit emptying services within their community (41), and the other study in
Dar es Salaam, Tanzania reported 95% of households knew about vacuum tanker services (49).
Availability and access of emptying services were cited as major barriers for households to empty
pits hygienically. In a study in Dar es Salaam only 43% and 24% of households had vacuum tanker or
Vacutug services available in their community (49). The same study found the odds of households
emptying their latrine using a hygienic form of pit emptying increased 23 times if services were
available in their area and their plot was accessible. Vacuum tankers are often unable to access
latrines located in densely populated urban areas with narrow roads (9,15,41). Vacuum tanker access
is site-specific; 96% of on-site sanitation facilities were accessible by vacuum truck in a study from
Vientiane, Lao PDR (47).
Technological limitations Manual emptying is sometimes preferred over vacuum tankers and mechanical pumping due to
limitations in technology or access (as well as cost, see below). Households that used hygienic
emptying methods such as vacuum tankers complained that they were not as efficient as manual
hand emptying and often times left sludge in the pit (49,69,74,77). In certain communities there are
not enough vacuum tankers to meet the demand, resulting in delays for household latrines to be
emptied (74). Aging equipment and breakdowns were also cited as limitations to providing hygienic
emptying services (21,69). Mechanical pumping can often hindered due to the presence of inorganic,
non-degradable items in the pit (23), resulting in communities manually desludging large, shared pit
latrine facilities (64).
17
Cost Another major barrier for households to access hygienic pit emptying services is the cost. Studies
reported households often knew more hygienic methods existed, yet they chose manual hand
emptying because it was cheaper (49,64,68). However, one study in Kibera, Kenya reported
mechanical emptying was the cheapest method, but accessibility and technology were its limiting
factors (23).
When households share latrines, the financial burden to empty the pit may be seen as the owner’s
sole responsibility rather than a shared expense by all users (57). However, the cost of emptying
services were found to be too great for one household to afford in a Dar es Salaam study (49). In
Tanzania and Uganda, Isunju et al. (68) and Katukiza et al. (57) observed household latrine
construction and emptying was financed by landlords or owners. Isunju et al. (68) observed some
landlords neglected to build or maintain latrines as they felt access to a public latrine was sufficient
(68). One study examined emptying practices of shared dormitory sanitation facilities in Vientiane,
Lao PDR (47). Eight dormitories had septic tanks and two had pour-flush pit latrines. Three of the
facilities had never been emptied but reportedly had yet to fill completely. All seven facilities that
were emptied used a vacuum truck service, and the frequency of emptying ranged from annually to
once every three years (47).
5.2.3 Transport
Dumping Numerous papers reported fecal sludge being discharged indiscriminately into streets, sewers,
drains, nearby surface water, and coastal areas (15,23,31,71,73,78–80). The specific location of sludge
disposal of was not reported in all studies.
Multiple factors influence the ultimate fate of emptied sludge, including the emptying method used
by the households. Mechanical emptiers are equipped to transport fecal sludge longer distances to
nearby disposal sites or treatment facilities (if they are available). However, manual emptiers must
transport sludge in hand carts or buckets, which often leads to sludge emptied being buried on-plot,
washed away in surface run-off, or discharged into nearby streams and rivers (15,23).
In Nairobi, there is no designated disposal site for fecal sludge; however it is legal for mechanical
emptiers to discharge fecal sludge into the sewer network (23). Sludge from pits emptied through
“flooding” (also referred to as “gravitational emptying”) is normally disposed into nearby rivers and
drains, while sludge from manual emptying is either buried, discharged into surface water or drains
(23). Surinkul and Koottatep (81) reported that private emptiers in Thailand disposed of sludge on
abandoned land. In Vientiane, only seven of the 17 service providers exclusively disposed of sludge at
official disposal sites, while six disposed of sludge at the disposal sites and open fields (47). Table 8
summarizes the reported percentages and/or volumes of untreated fecal sludge and the place of
discharge from reviewed studies.
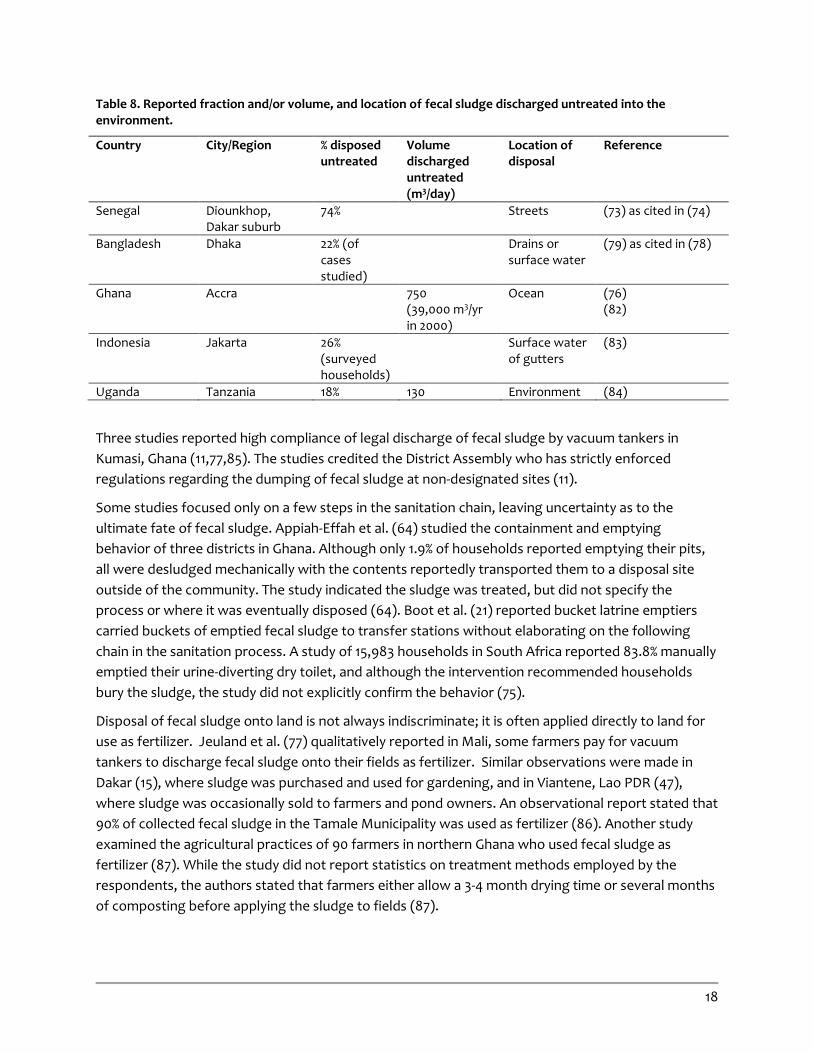
18
Table 8. Reported fraction and/or volume, and location of fecal sludge discharged untreated into the environment.
Country City/Region % disposed untreated
Volume discharged untreated (m3/day)
Location of disposal
Reference
Senegal Diounkhop, Dakar suburb
74% Streets (73) as cited in (74)
Bangladesh Dhaka 22% (of cases studied)
Drains or surface water
(79) as cited in (78)
Ghana Accra 750 (39,000 m3/yr in 2000)
Ocean (76) (82)
Indonesia Jakarta 26% (surveyed households)
Surface water of gutters
(83)
Uganda Tanzania 18% 130 Environment (84)
Three studies reported high compliance of legal discharge of fecal sludge by vacuum tankers in
Kumasi, Ghana (11,77,85). The studies credited the District Assembly who has strictly enforced
regulations regarding the dumping of fecal sludge at non-designated sites (11).
Some studies focused only on a few steps in the sanitation chain, leaving uncertainty as to the
ultimate fate of fecal sludge. Appiah-Effah et al. (64) studied the containment and emptying
behavior of three districts in Ghana. Although only 1.9% of households reported emptying their pits,
all were desludged mechanically with the contents reportedly transported them to a disposal site
outside of the community. The study indicated the sludge was treated, but did not specify the
process or where it was eventually disposed (64). Boot et al. (21) reported bucket latrine emptiers
carried buckets of emptied fecal sludge to transfer stations without elaborating on the following
chain in the sanitation process. A study of 15,983 households in South Africa reported 83.8% manually
emptied their urine-diverting dry toilet, and although the intervention recommended households
bury the sludge, the study did not explicitly confirm the behavior (75).
Disposal of fecal sludge onto land is not always indiscriminate; it is often applied directly to land for
use as fertilizer. Jeuland et al. (77) qualitatively reported in Mali, some farmers pay for vacuum
tankers to discharge fecal sludge onto their fields as fertilizer. Similar observations were made in
Dakar (15), where sludge was purchased and used for gardening, and in Viantene, Lao PDR (47),
where sludge was occasionally sold to farmers and pond owners. An observational report stated that
90% of collected fecal sludge in the Tamale Municipality was used as fertilizer (86). Another study
examined the agricultural practices of 90 farmers in northern Ghana who used fecal sludge as
fertilizer (87). While the study did not report statistics on treatment methods employed by the
respondents, the authors stated that farmers either allow a 3-4 month drying time or several months
of composting before applying the sludge to fields (87).
19
In Asia, fecal sludge reuse for agriculture and aquaculture is widely practiced. In cities within China,
an estimated 30 million tons of sludge are collected and reused, mostly without any form of
treatment (7). A study of 75 households engaged in farming activities in Vietnam found 70
households used latrines as their sanitation facility (88). Of those households, 85% utilized fecal
sludge from latrines as fertilizer with almost all (98%) households reporting that they composted it
before application (88). The length of reported composting time varied between households, with 9
composting excreta for less than one month, 23 composting for 1-3 months, 17 composting for 3-6
months, and 11 composting for six or more months (88). Another study in Nepal reported that fecal
sludge from urine diverting dry toilets (UDDTs) was used for fertilizer without further treatment,
however the length of time between emptying and reuse was not reported (80).
Disposal sites In areas where treatment facilities are not available, collected fecal sludge can be legally disposed of
at designated “disposal sites” (8,47,87,89). Use of disposal sites displaces fecal sludge from
households to the exterior fringes of cities and often results in 100% of collected waste being
returned to the environment (8,89,90). This practice may be considered safe or unsafe, depending
on the likelihood of human exposure at the disposal site or the probability of groundwater or surface
water contamination. At the Korle Gono disposal site outside of Accra, vacuum tankers may legally
discharge fecal sludge to the land and directly into the ocean (21).
Distance to disposal sites or treatment facilities can also be a major deterrent for vacuum tanker
operators (9,47,77). Congested urban areas with heavy traffic and short operating hours of
treatment facilities can lead vacuum tanker operators to discharge fecal sludge illegally (7,74). Data
from Collignon et al. (91) and Jeuland et al. (77) revealed the varying extent of collected fecal sludge
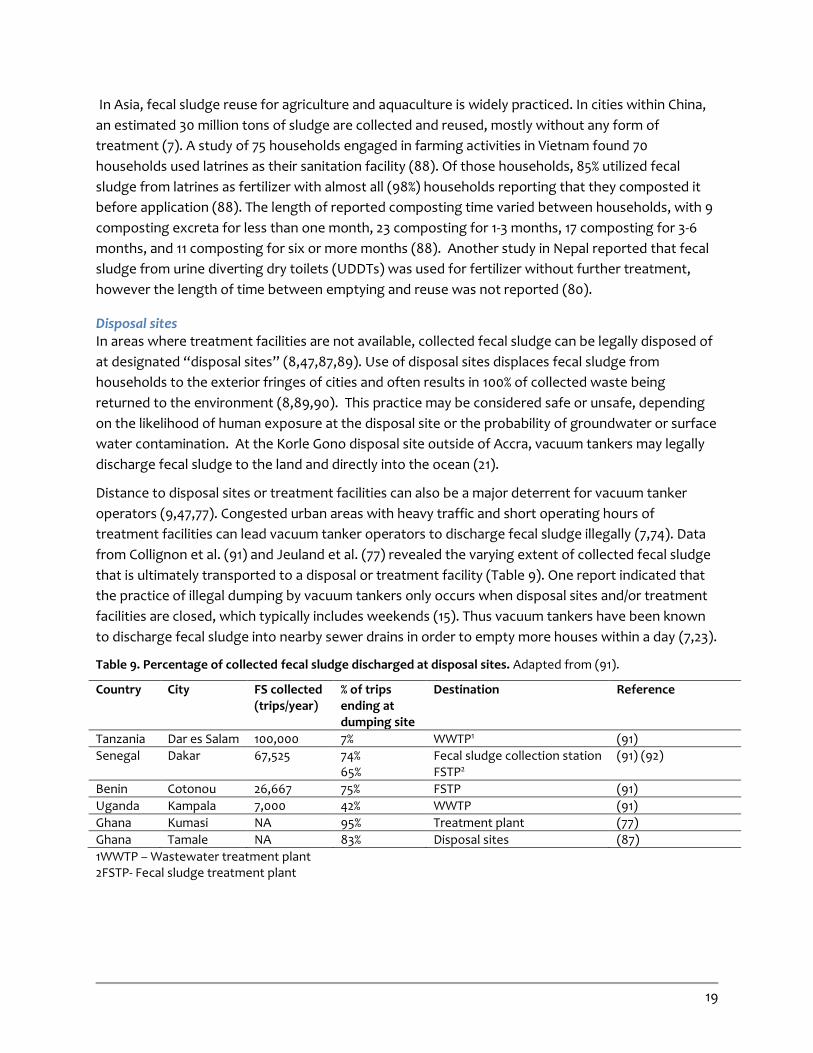
that is ultimately transported to a disposal or treatment facility (Table 9). One report indicated that
the practice of illegal dumping by vacuum tankers only occurs when disposal sites and/or treatment
facilities are closed, which typically includes weekends (15). Thus vacuum tankers have been known
to discharge fecal sludge into nearby sewer drains in order to empty more houses within a day (7,23).
Table 9. Percentage of collected fecal sludge discharged at disposal sites. Adapted from (91).
Country City FS collected (trips/year)
% of trips ending at dumping site
Destination Reference
Tanzania Dar es Salam 100,000 7% WWTP1 (91)
Senegal Dakar 67,525 74% 65%
Fecal sludge collection station FSTP2
(91) (92)
Benin Cotonou 26,667 75% FSTP (91)
Uganda Kampala 7,000 42% WWTP (91)
Ghana Kumasi NA 95% Treatment plant (77)
Ghana Tamale NA 83% Disposal sites (87)
1WWTP – Wastewater treatment plant 2FSTP- Fecal sludge treatment plant

20
Transfer stations In order to alleviate the problem of hauling distances, a few cities have developed a system of
“transfer stations” throughout the city where emptiers can dispose of fecal sludge (21,93). These
transfer stations serve to reduce the distance between operators and treatment facilities. Vacuum
tankers then collect the fecal sludge from the transfer stations and deliver it to a treatment facility;
however, one study reported fecal sludge is not consistently collected and can overflow at transfer
stations (21).
In areas where fecal sludge collection and treatment services are not available, communities have
begun piloting different social enterprise structures. Wall et al. (94) reported on a successful pilot
that used social franchising to launch pit latrine emptying businesses modeled after an earlier pilot in
rural schools. The pilot was located in the Govan Mbeki community within the Amatole District
Municipality in South Africa. The franchises developed multiple methods to empty the pits based on
the accessibility of the pit. The teams emptied the latrines by hand and transported the fecal sludge
in 220-litre, sealable drums. A disposal site next to a wastewater treatment plant (WWTP) was
identified since it was located less than a kilometer away from the community. Similar to the urban
school pilot, the disposal site was roped off and solid fecal sludge along with solid inorganic waste
was discharged following the “latest guidelines and research about the depth of pits and how waste
is handled and disposed of,” however the study did not report average disposal volumes of fecal
sludge or the size of the disposal site.
5.3 Septic systems
Septic systems treat wastewater close to the source and do not require the infrastructure of
centralized wastewater transport and treatment. For this reason, septic systems are common in
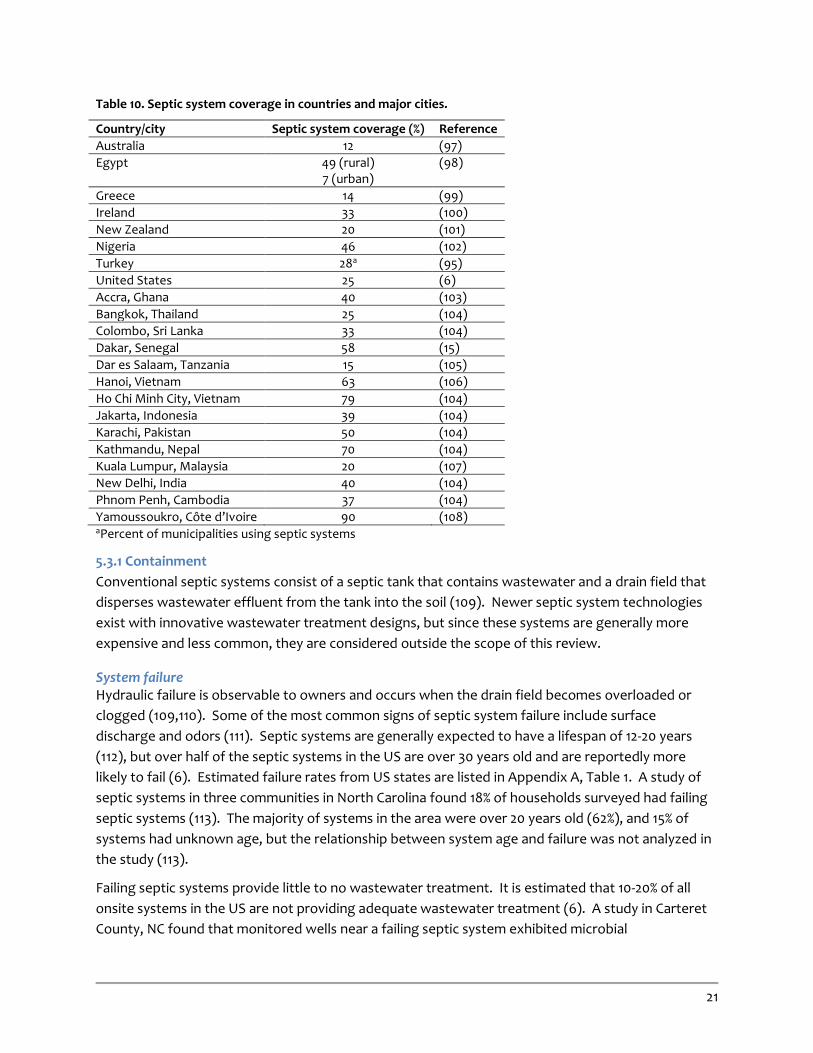
rural areas of many developed countries as well as urban and rural areas in developing countries (95)
(Table 10). Septic systems are estimated to serve 80% of urban populations in Asia-Pacific countries
(96).
21
Table 10. Septic system coverage in countries and major cities.
Country/city Septic system coverage (%) Reference
Australia 12 (97)
Egypt 49 (rural) 7 (urban)
(98)
Greece 14 (99)
Ireland 33 (100)
New Zealand 20 (101)
Nigeria 46 (102)
Turkey 28a (95)
United States 25 (6)
Accra, Ghana 40 (103)
Bangkok, Thailand 25 (104)
Colombo, Sri Lanka 33 (104)
Dakar, Senegal 58 (15)
Dar es Salaam, Tanzania 15 (105)
Hanoi, Vietnam 63 (106)
Ho Chi Minh City, Vietnam 79 (104)
Jakarta, Indonesia 39 (104)
Karachi, Pakistan 50 (104)
Kathmandu, Nepal 70 (104)
Kuala Lumpur, Malaysia 20 (107)
New Delhi, India 40 (104)
Phnom Penh, Cambodia 37 (104)
Yamoussoukro, Côte d’Ivoire 90 (108) aPercent of municipalities using septic systems
5.3.1 Containment
Conventional septic systems consist of a septic tank that contains wastewater and a drain field that
disperses wastewater effluent from the tank into the soil (109). Newer septic system technologies
exist with innovative wastewater treatment designs, but since these systems are generally more
expensive and less common, they are considered outside the scope of this review.
System failure Hydraulic failure is observable to owners and occurs when the drain field becomes overloaded or
clogged (109,110). Some of the most common signs of septic system failure include surface
discharge and odors (111). Septic systems are generally expected to have a lifespan of 12-20 years
(112), but over half of the septic systems in the US are over 30 years old and are reportedly more
likely to fail (6). Estimated failure rates from US states are listed in Appendix A, Table 1. A study of
septic systems in three communities in North Carolina found 18% of households surveyed had failing
septic systems (113). The majority of systems in the area were over 20 years old (62%), and 15% of
systems had unknown age, but the relationship between system age and failure was not analyzed in
the study (113).
Failing septic systems provide little to no wastewater treatment. It is estimated that 10-20% of all
onsite systems in the US are not providing adequate wastewater treatment (6). A study in Carteret
County, NC found that monitored wells near a failing septic system exhibited microbial
22
contamination; average total coliform concentrations ranged from 2 x 10³ – 1 x 10⁴ MPN/100 mL, and
enterococci were detected at least one time in each well with an average concentration of 100
MPN/100 mL (114). Following the system repair, total coliform levels were significantly lower,
although average enterococci concentrations remained elevated (50 MPN/100 mL) (114). A separate
study in the same area found that enterococci and E. coli concentrations were higher in wells near
failing systems than near functioning systems (115). Among the two functioning systems,
Rhodamine WT and MS2 virus tracers were infrequently found in low concentrations in wells near
the effluent distribution box; for the two failing systems, tracers were found in higher
concentrations and were detected in wells further from the distribution box (115).
Most septic system failures are caused by lack of maintenance or poor siting (111). Required
maintenance may include desludging or needed repairs, whereas poor siting may be due to
inappropriate soil type, inadequate sizing, or close proximity to groundwater (111). One study
reported that failure rates for septic systems near water bodies was much higher than failure rates
upland (116), which may be attributed to saturated subsoil.
System failure and sites Five studies examined suitability of residential properties for septic systems. One study used a GIS-
based soil rating system to assess soil suitability for septic systems in Alabama, where 44% of
households use septic systems that malfunction at a rate of 20% (117). Using criteria based on the
Alabama Onsite Sewage Disposal Rules that included percolation rate, depth to restrictive layer (e.g.
groundwater table or dense soil), depth to seasonal groundwater table, slope, and flooding, over
half the study area was unsuitable for conventional on-site wastewater treatment (118). Thirty-one
percent of the study area was marginally suitable, and only 15% was found suitable
(118). Additionally, many of the septic tanks in the area were assumed to be 20-30 years old, based
on house ages (118), making them potentially more likely to fail.
A study in Ohio classified soil types in plots with septic systems. “Severe” soils displayed one of the
following characteristics: they were wet, had slow permeability, had shallow bedrock, an
inappropriate slope, or were susceptible to flooding or ponding (119). The study authors found that
63% of the septic systems surveyed were installed in severe soils, which had a significantly higher
failure rate (23.3%) than the failure rate in all systems (16.2%) (119). Septic systems in soils that were
wet, less permeable, and had slow permeability had significantly higher likelihood of failure than
systems in soils with inappropriate slope or susceptibility to flooding or ponding (119). Systems in
soils that were rated as “slightly inadequate,” in contrast, had a significantly lower failure rate (2.8%)
(119). This study also found that systems installed in areas with high seasonal water tables were
slightly more likely to fail (119).
Soil type was classified in a study in Virginia to assess site suitability for septic systems. The authors
found that 41% and 42% of surveyed drain fields were in marginal and unsuitable soils, respectively,
while only 17% of the drain fields were located in suitable soils (120). Drain fields in unsuitable soils
repeatedly failed throughout the 16-month study period (120).
The remaining two studies found higher rates of site suitability for septic systems. A study in
Mississippi sampled six septic system sites and found that all of them complied with state standards

23
for installation of drip irrigation, sprinkler irrigation, or mounds, depending on soil type (121). An
analysis of septic system repair permits in Pennsylvania found that over half of the permits from a
given year were from mechanical failures and less than 20% of permits were issued for improper site
selection or installation (122). The researchers surveyed homeowners receiving permits and found
that over 60% of repairs were reportedly on systems installed prior to 1972, when Pennsylvania
enacted septic system regulations (122).
System failure and maintenance Data on system maintenance was collected and reported in four studies. A study in Eudlo Township,
Australia found of 48 septic systems surveyed, seven were found to be well-maintained and 32 tanks
needed to be emptied at the time of the survey (97). In Lough Melvin, Ireland, 23 of 50 systems
surveyed were over 20 years old and had undergone limited maintenance (123). Most of these
systems did not have an absorption field and drained to a cesspit (123). A survey of 236 systems
owners in Flanders, Belgium found that nearly 93% of respondents did not perform maintenance in
the first three years of system operation, and that by five years, half of the system pumps had been
replaced, but no other maintenance had been performed (124).
Maintenance contracts for septic system services were offered in Flanders, although they were
costly (124). Five of 23 on-site wastewater systems surveyed had maintenance contracts, six were
serviced with minimal maintenance (e.g. desludging or replacing a mechanical part), and 12 received
no maintenance (125). Systems with minimal or no maintenance had similar treatment performance,
but the five systems with maintenance contracts had nearly half the average effluent levels of
chemical oxygen demand (COD), biological oxygen demand (BOD), and suspended solids (SS) of the
18 systems without contracts (125).
One study reported observations of septic system structural issues. In a survey of 48 systems in
Australia, Ahmed et al. reported that 72% of systems had soggy absorption fields, 8% had structural
problems such as broken lids, and 6% had insufficient capacity for the household (97).
Non-conventional septic systems Conventional septic systems have tanks with two or three chambers. Several studies reported use of
septic systems with single chambers or alternative designs. Septic tanks are prevalent in Hanoi (106),
but reportedly the only conventional septic tanks in the city are those built by the French colonialists
in the mid-nineteenth century (126). Some households’ septic tanks may consist of a retaining
chamber, a pit, or even a repurposed bomb shelter (126). In Dagupan City, Philippines, a survey of
1,200 residents found that 43% of households have single vault septic tanks that provide limited
treatment and do not meet city standards (127). Tanks with multiple chambers have greater solids
retention and can provide better microbial treatment (58).
Reviewed studies revealed that septic tank designs and functionality vary across regions. Non-
conventional septic tanks commonly used in developing countries are listed in Appendix A, Table 2.
Septic tanks are prevalently used in the Kathmandu Valley of Nepal and serve about 21% of the
population, although most of the tanks are not truly “septic tanks;” they are larger pits lined with a
brick wall and covered with a concrete slab (13). Most of them are poorly constructed and thus do
24
not operate as a septic tank (13). About half the tanks examined had two or more chambers, while
47% had single chambers and 4% were concrete ring tanks (13).
Similar nonconventional tanks were reportedly used by households in several studies. Baetings et al.
found that among 520 households with septic systems, half of the households had a pit directly
under the toilet, 22% had septic tanks, and 18% had offset pits (14% with one pit and 4% two pits) (47).
In Muaeng Klong Luang, Thailand, 27% of households surveyed used conventional septic systems; the
remaining households used one (41%) or two (32%) bottomless concrete ring tanks, which allow
seepage of tank contents into the surrounding soil (128). Harder et al. reported that 15% of the septic
tanks surveyed in Dagupan City, Philippines were bottomless or lacked concrete flooring (127).
Bottomless, two-chambered septic tanks are also commonly used in Tuvalu (129).
Groundwater contamination Hydraulic failure can be readily observable to households, but treatment failure is more difficult to
detect. Removal of pathogens and organic compounds is decreased when the drain field and
subsoils become anaerobic and when effluent moves freely through cracks in the soils, escaping
treatment. Treatment failure can lead to groundwater contamination, particularly in areas with a
high groundwater table. Consequently, areas with high septic system density are more likely to have
poor groundwater quality (130). The combined effluent may raise pathogen and nutrient levels in
groundwater, and with more systems in a given area, there is a greater probability that one or more
systems are either failing and discharging untreated effluent or are too close to the groundwater
table (131).
Seven studies sampled groundwater near septic systems in developed countries. Five studies
reported groundwater contamination in areas with dense or nearby septic systems, and two studies
did not find clear evidence of groundwater contamination by septic systems. A study in residential
Mississippi found no significant differences in contaminant concentrations between wells upstream
and downstream of septic systems (121). Low levels of fecal contamination were found in well
samples in South Australia, and septic systems were not a confirmed source of contamination
(132). This study also did not find a statistical relationship between fecal coliform concentration and
distance between septic systems and wells (132).
Two studies reported high microbial concentrations in areas with dense septic systems and high
groundwater tables. In an septic-system-dense area of Queensland State, Australia where the water
table was generally less than 1 m from the surface, groundwater samples had average fecal coliform
concentrations of 25 cfu/100 mL and higher (133). Stewart et al. also found that fecal coliform
concentrations in shallow wells within 30 m of septic system drain fields were higher when the water
table was as high as or higher than the drain field level (~10 – 5 x 10⁴ MPN/100 mL) than when the
water table was low (~0 – 5 x 10² MPN/100 mL) (134).
Five studies reported contamination of wells in areas with dense septic systems. Two of these
studies were conducted in a semi-rural community near Christchurch, New Zealand with domestic
wells and septic systems on each plot (135,136). Fecal coliform concentrations were infrequently
detected in low concentrations in the first study, but over half of the samples had total coliform
concentrations above 10 CFU/100 mL (135). In the second study, indicator microorganisms were
25
found in a third of the 120 wells sampled (136). Coliforms were detected in 30-60% of shallow wells in
Frederick County, MD, and the highest concentrations were found on small plots under a half acre
with septic systems (137). Four of 50 wells across areas of Wisconsin with dense septic systems were
found positive for Hepatitis A, rotavirus, poliovirus, or NLV; however, virus occurrence was only
found in one of four samples for three of the wells (138). Results from a study of 60 wells near septic
systems in Florida showed a relationship between septic system distance to well and E. coli counts in
both the wet and dry seasons (139).
Rainfall effects were reported in six studies investigating septic systems as potential groundwater
contamination sources (114,115,133,139–141). During the wet season in Florida, approximately 70% of
the wells sampled had fecal coliform levels in the medium to high-contamination range (>500
CFU/100 mL), whereas only 40% of wells exhibited this level of contamination in the dry season
(139).
Two studies reported on groundwater and surface water contamination by septic systems in
developing countries. A study in Dar es Salaam sampled 25 dug wells in a neighborhood with septic
systems on each plot and found fecal coliform levels between 105-106 CFU/mL (142). The drain fields
in the study neighborhood were found to extend below the water table level (142). In Mar del Plata,
Argentina, 40 domestic and 10 deep wells were sampled in a residential area with a septic tank or
cesspool on each lot, often within 3-10 m of wells (143). Fecal coliforms were found in 60% of the
samples (143).
Findings from literature indicate that viruses and bacteria can travel great distances through
unsaturated and saturated soils. Bacteria from septic tank effluent reportedly traveled beyond 28 m
in one study (144). Hepatitis A and Salmonella were detected in wells 3 m and 64 m from septic
tanks, respectively (145,146). A study investigating septic tank contamination of marine waters in
Florida recorded virus migration rates between 0.57-24.2 m/h in subsurface limestone (147). Study
authors suggested that the high migration rates could reflect rapid virus transport through fissures
in limestone or rapid subsurface flow following recent a rainfall event (147). Two literature reviews
were found that contained data on bacterial travel distances in soil following contamination from pit
latrines, septic systems, infiltration beds, or subsoil injection (52,148); findings from these reviews
are listed in Appendix A, Table 3.
Effluent from septic tanks can also affect surface water quality. Surface water contamination has
been reported in areas with high septic system density (149), and like groundwater, contamination is
greater when the water table is high (150). A study in Tuvalu found that E. coli from bottomless
septic tanks travelled through groundwater during ebbing tides and contaminated coastal waters
(129).
Areas with septic systems exceeding minimum setback distances or in unsuitable soils may be more
vulnerable to surface water contamination (149). However, this was not observed in included
studies. A study in Virginia found that groundwater within 10-20 m of septic system drain fields had
fecal coliform bacteria densities near or below minimum detectable levels (MDLs) (151). In a study of
120 households with septic systems in North Carolina, 18% of wells in the study area were under 50
feet from septic tanks or drainage lines, well under the minimum county setback distance of 100 feet
26
(113). Little surface and groundwater contamination was found in the study area, although water
from private wells had a higher number of samples positive for fecal indicators than public drinking
water (113).
5.3.2 Emptying
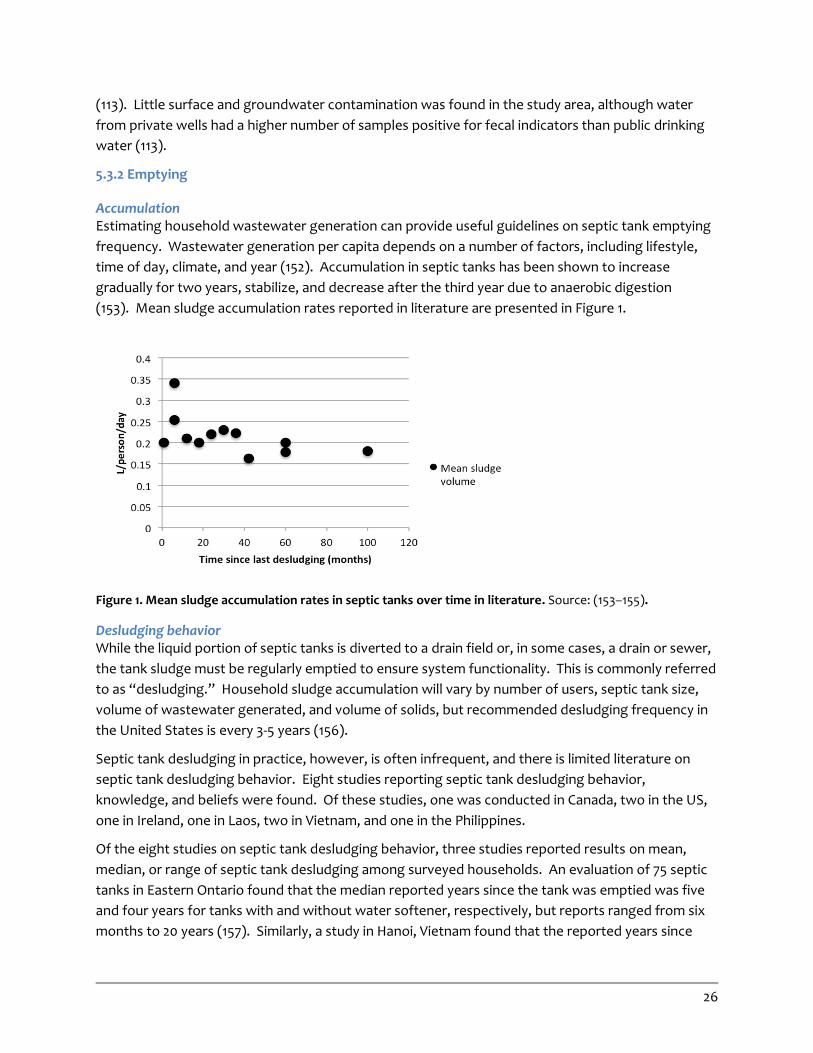
Accumulation Estimating household wastewater generation can provide useful guidelines on septic tank emptying
frequency. Wastewater generation per capita depends on a number of factors, including lifestyle,
time of day, climate, and year (152). Accumulation in septic tanks has been shown to increase
gradually for two years, stabilize, and decrease after the third year due to anaerobic digestion
(153). Mean sludge accumulation rates reported in literature are presented in Figure 1.
Figure 1. Mean sludge accumulation rates in septic tanks over time in literature. Source: (153–155).
Desludging behavior While the liquid portion of septic tanks is diverted to a drain field or, in some cases, a drain or sewer,
the tank sludge must be regularly emptied to ensure system functionality. This is commonly referred
to as “desludging.” Household sludge accumulation will vary by number of users, septic tank size,
volume of wastewater generated, and volume of solids, but recommended desludging frequency in
the United States is every 3-5 years (156).
Septic tank desludging in practice, however, is often infrequent, and there is limited literature on
septic tank desludging behavior. Eight studies reporting septic tank desludging behavior,
knowledge, and beliefs were found. Of these studies, one was conducted in Canada, two in the US,
one in Ireland, one in Laos, two in Vietnam, and one in the Philippines.
Of the eight studies on septic tank desludging behavior, three studies reported results on mean,
median, or range of septic tank desludging among surveyed households. An evaluation of 75 septic
tanks in Eastern Ontario found that the median reported years since the tank was emptied was five
and four years for tanks with and without water softener, respectively, but reports ranged from six
months to 20 years (157). Similarly, a study in Hanoi, Vietnam found that the reported years since
27
household septic tanks were emptied ranged from 1-20 across 20 households (32). Another, larger
study in Hanoi with 692 households found that the median and mean desludging period was
reportedly seven and eight years, respectively (158). While many households routinely empty their
septic tanks every several years, other households wait decades pass between desludging; however,
these desludging periods are self-reported.
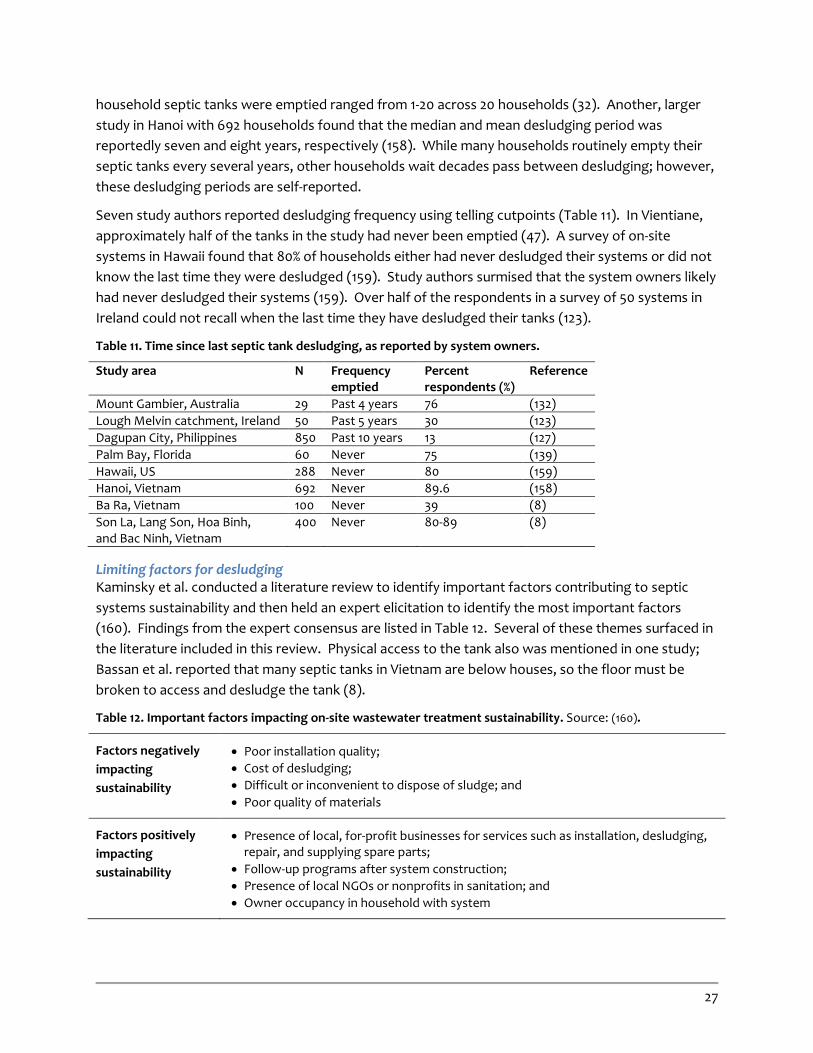
Seven study authors reported desludging frequency using telling cutpoints (Table 11). In Vientiane,
approximately half of the tanks in the study had never been emptied (47). A survey of on-site
systems in Hawaii found that 80% of households either had never desludged their systems or did not
know the last time they were desludged (159). Study authors surmised that the system owners likely
had never desludged their systems (159). Over half of the respondents in a survey of 50 systems in
Ireland could not recall when the last time they have desludged their tanks (123).
Table 11. Time since last septic tank desludging, as reported by system owners.
Study area N Frequency emptied
Percent respondents (%)
Reference
Mount Gambier, Australia 29 Past 4 years 76 (132)
Lough Melvin catchment, Ireland 50 Past 5 years 30 (123)
Dagupan City, Philippines 850 Past 10 years 13 (127)
Palm Bay, Florida 60 Never 75 (139)
Hawaii, US 288 Never 80 (159)
Hanoi, Vietnam 692 Never 89.6 (158)
Ba Ra, Vietnam 100 Never 39 (8)
Son La, Lang Son, Hoa Binh, and Bac Ninh, Vietnam
400 Never 80-89 (8)
Limiting factors for desludging Kaminsky et al. conducted a literature review to identify important factors contributing to septic
systems sustainability and then held an expert elicitation to identify the most important factors
(160). Findings from the expert consensus are listed in Table 12. Several of these themes surfaced in
the literature included in this review. Physical access to the tank also was mentioned in one study;
Bassan et al. reported that many septic tanks in Vietnam are below houses, so the floor must be
broken to access and desludge the tank (8).
Table 12. Important factors impacting on-site wastewater treatment sustainability. Source: (160).
Factors negatively
impacting
sustainability
Poor installation quality;
Cost of desludging;
Difficult or inconvenient to dispose of sludge; and
Poor quality of materials
Factors positively
impacting
sustainability
Presence of local, for-profit businesses for services such as installation, desludging, repair, and supplying spare parts;
Follow-up programs after system construction;
Presence of local NGOs or nonprofits in sanitation; and
Owner occupancy in household with system
28
Septic system desludging knowledge and beliefs Eight studies reported household beliefs, practices, or knowledge regarding septic tank
desludging. In three studies, many respondents reported that septic tanks were only emptied when
they were clogged, overflowing, or damaged (8,13,127,158). Only 6% of respondents in a baseline
study in Thimphu City, Bhutan thought septic tanks should be emptied regularly, and 60% did not
know how often they should be emptied ((161) as cited in (162)). Fink found less than half of the
respondents in Hanoi knew how to empty their septic tanks or knew if their tanks needed to be
emptied (126).
A qualitative study by Halcrow et al. in Thimphu City, Bhutan, used in-depth interviews with users and
non-users of septic tank desludging services to investigate their knowledge, beliefs, and attitudes
surrounding desludging (162). The authors found most users and non-users reported looking in the
inspection chamber for liquid depth, but did not know how to determine if their septic tanks were
full and did not know they needed to examine sludge levels. Users and non-users differed in that
non-users were less aware of available desludging services, but across both groups, most users felt
they did not need to desludge their tanks unless they were overflowing (162).
In Vientiane, the majority of respondents knew that their storage may be full if the toilet became
blocked, and only 5% of the respondents who had never emptied their tanks did not know how they
could tell if their septage storage was full. But only 6 of 520 households regularly checked their
septage storage or tanks to determine if they were full (47).
Lack of information or education can lead to improper system maintenance. Moelants et al. found
35% of system owners surveyed did not receive maintenance information from their system
manufacturers. For those who did receive information, the type of waste allowed in the system was
most frequently explained, however information on desludging and other maintenance were seldom
provided (124).
Septic system desludging and ownership The effect of owner occupancy on desludging raised by Kaminsky et al. (160) did not surface in the
literature, but three studies reported that households shared septic tanks (47,126,163).
Septic system desludging costs Cost of desludging services was discussed in six studies. Halcrow et al. found that most system
owners in Thiumphu City were willing to pay the city fee for desludging services (162). However,
residents outside of the city center who had to pay for additional desludging transportation costs
found the desludging and transportation fees expensive (162). Reportedly, desludging services in
Danang, Vietnam are not affordable for many households, even though six service providers operate
in a competitive market (164). In Flanders, Belgium, maintenance contracts were available for
196.82€ a year, and only 37% of 236 system owners surveyed in the area had these contracts (124).
Desludging costs in Kathmandu Valley were provided in a report by the High Powered Committee for
Integrated Development of the Bagmati Civilization (13). Desludging by private and public providers
costs households between 1500-2500 NRs (15-25 USD), depending on distance travelled, and manual
desludging fees begin at NRs. 2000 (20 USD) (13). The authors did not discuss whether these fees

29
are widely affordable to different user groups, but did report that fees for private providers and
manual emptying providers are negotiated based on travelling distance as well as client economic
status (13).
Average vacuum tanker emptying fees in Vientiane were estimated at LAK 210,000 (26 USD), but the
study authors did not report whether these fees are affordable in the region (47). Volumetric rates
are used in Malaysia, where private operators charge $77 to desludge tanks under 2 m3 and the Indah
Water Konsortium (IWK) charges $100 (165). Both providers charge $38 for each additional cubic
meter and $18/m3 for sludge treatment and disposal (165). In Muaeng Klong Luang, Thailand, the
costs of fecal sludge collection and disposal over the facility lifespan for one-pit, two-pit, and
commercial septic systems were estimated as 240, 300, and 200 Baht, respectively, (128). The
commercial septic system had greater storage capacity than the pits and therefore had lower
emptying costs, but study authors did not comment on affordability (128).
5.3.3 Transport and disposal
Another factor affecting household disposal of septic tank sludge is availability of desludging
services. In cities lacking sufficient or affordable desludging services, septic tank sludge is disposed
directly into the environment. Twelve articles reported on desludging service availability and
household behavior.
Dagupan City reportedly has no sludge treatment or disposal facilities, so of the 850 households
surveyed by Harder et al., 30% manually desludged and buried waste in a pit, 13% emptied waste into
water bodies, 5% emptied waste onto farmland, and 7% of households emptied sludge anywhere
(127). In Dhaka, Bangladesh, households served by septic systems often empty their tanks manually
or dispose of wastewater in low-lying lands, natural drains, water bodies, or through surface drains
(104). In Mira-Bhayandar and Wardha, India, only one vacuum suction tanker services each city, so
only a small fraction of septic tanks in the cities can be emptied each year (163).
Even when desludging services are available, system users may not utilize them. Six private
companies provide desludging services in Danang, Vietnam, where the majority of households use
septic tanks, yet their fees are high and households dispose of their effluent in the street and surface
drains (164). A cross-sectional study of 41 households in Hanoi found that less than 20% of
respondents used the public service, URENCO, or a private service provider to desludge their tank
(126), although the authors postulated that URENCO did not have the resources to meet consumer
demand. Instead of desludging the tank, over 20% of households surveyed used Bio-powder, a low-
cost mixture of organic compounds that digests the tank sludge (126).
Safe desludging was reportedly more prevalent in three studies. Ten private companies provide
desludging in Kathmandu Valley, and their services are used by 18% of septic tank owners. Sixteen
percent of respondents use public services, 34% hire local service providers to manually empty the
tanks, and 28% emptied their own tank (13). Households in farming communities often emptied their
own tanks to use the sludge as manure (13). In Muaeng Klong Long, Thailand, 20% and 33% of
respondents used desludging services from private and municipal providers, respectively; 47% did not
use desludging services, but the study authors did not specify if the tanks were emptied using other

30
methods (128). Septic tank desludging in Yamoussoukro, Côte d’Ivoire is typically done by private
service providers, but is sometimes done by manual emptying (108).
Seventeen private operators service Vientiane, Lao for desludging septic systems (47). Only 3 of the
emptied septage tanks or pits in the study had been desludged manually; 99% were emptied by
vacuum tankers (47). Desludging was reportedly more frequent in the rainy season than the dry
season (47).
Private companies provide desludging services to Son La, Ba Ria, Hoa Binh, Bac Ninh, and Lang Son,
Vietnam but discharge the waste directly into the environment because there are no designated
discharge sites (8). In Paramaribo, municipal sewage tankers desludge tanks and discharge the
sludge into the Surinam River, a government-designated disposal site, or directly into the
environment when the road conditions are poor (166). In Ireland, farmers commonly desludge septic
tanks and reuse the sludge as fertilizer (167).
Conventional septic systems feature an absorption field, but a common practice in some areas is to
dispose of effluent via drains or canals. A rapid assessment in Vientiane, Laos found that none of the
septic tanks surveyed had drain fields or soak pits (47). In Vientiane, the Vientiane Urban
Development and Administration Authority recommends for septic effluent to be discharged into
drains (47). In the following survey of 528 households, 17% of the septage systems discharged
effluent directly into the environment: 13% discharged into open drains, 3% discharged into open
water, and 1% discharged onto the ground (47). In Klong Luang, Thailand, most households
reportedly have pour-flush latrines connected to septic tanks, which discharged wastewater into
canals or open bodies of water (128,168). These practices can introduce contamination into water
sources and recreational bodies of water. In cities like Manila and Maynilad, septic tank effluent is
discharged into sewers and treated at the wastewater facilities (169).
5.3.4 Treatment
Contamination reduction in the septic tank When regularly maintained and desludged, septic tanks provide effective on-site wastewater
treatment. The extent of pathogen removal from sludge in the anaerobic tank is largely dependent
on retention time and emptying frequency, and typically can range from 0-2 log reduction for viruses,
bacteria, protozoa, and helminths (29). Six studies included in the review reported data on pathogen
removal rates from effluent in the septic tank (Table 13). Fifteen studies reported mean pathogen
concentrations in sludge or effluent; these findings are reported in Tables 14 and 15. Tsuzuki et al.
estimated per capita discharge of fecal and total coliforms for on-site wastewater treatment plants
in Bangkok (170); study results are listed in Appendix A, Table 4.
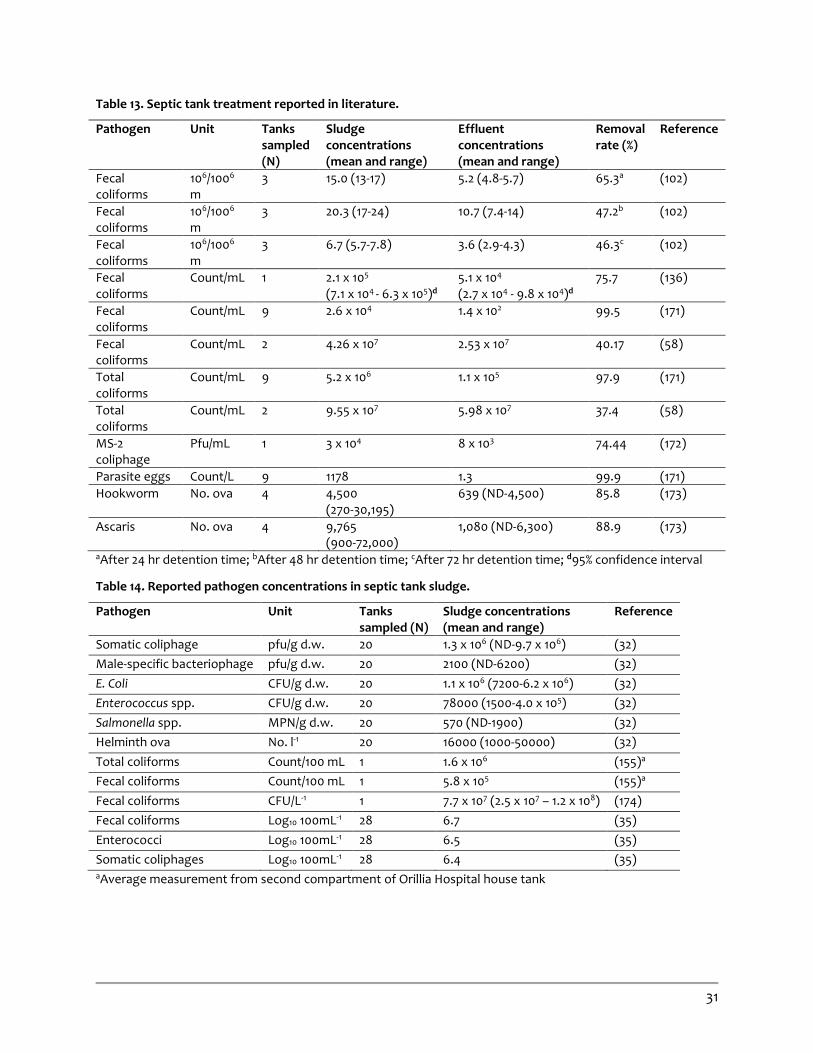
31
Table 13. Septic tank treatment reported in literature.
aAfter 24 hr detention time; bAfter 48 hr detention time; cAfter 72 hr detention time; d95% confidence interval
Table 14. Reported pathogen concentrations in septic tank sludge.
Pathogen Unit Tanks sampled (N)
Sludge concentrations (mean and range)
Reference
Somatic coliphage pfu/g d.w. 20 1.3 x 10⁶ (ND-9.7 x 10⁶) (32)
Male-specific bacteriophage pfu/g d.w. 20 2100 (ND-6200) (32)
E. Coli CFU/g d.w. 20 1.1 x 10⁶ (7200-6.2 x 10⁶) (32)
Enterococcus spp. CFU/g d.w. 20 78000 (1500-4.0 x 10⁵) (32)
Salmonella spp. MPN/g d.w. 20 570 (ND-1900) (32)
Helminth ova No. l-1 20 16000 (1000-50000) (32)
Total coliforms Count/100 mL 1 1.6 x 10⁶ (155)a
Fecal coliforms Count/100 mL 1 5.8 x 10⁵ (155)a
Fecal coliforms CFU/L-1 1 7.7 x 10⁷ (2.5 x 10⁷ – 1.2 x 10⁸) (174)
Fecal coliforms Log10 100mL-1 28 6.7 (35)
Enterococci Log10 100mL-1 28 6.5 (35)
Somatic coliphages Log10 100mL-1 28 6.4 (35) aAverage measurement from second compartment of Orillia Hospital house tank
Pathogen Unit Tanks sampled (N)
Sludge concentrations (mean and range)
Effluent concentrations (mean and range)
Removal rate (%)
Reference
Fecal coliforms
106/1006 m
3 15.0 (13-17) 5.2 (4.8-5.7) 65.3a (102)
Fecal coliforms
106/1006 m
3 20.3 (17-24) 10.7 (7.4-14) 47.2b (102)
Fecal coliforms
106/1006 m
3 6.7 (5.7-7.8) 3.6 (2.9-4.3) 46.3c (102)
Fecal coliforms
Count/mL 1 2.1 x 10⁵ (7.1 x 10⁴ - 6.3 x 10⁵)d
5.1 x 10⁴ (2.7 x 10⁴ - 9.8 x 10⁴)d
75.7 (136)
Fecal coliforms
Count/mL 9 2.6 x 10⁴ 1.4 x 10² 99.5 (171)
Fecal coliforms
Count/mL 2 4.26 x 10⁷ 2.53 x 10⁷ 40.17 (58)
Total coliforms
Count/mL 9 5.2 x 10⁶ 1.1 x 10⁵ 97.9 (171)
Total coliforms
Count/mL 2 9.55 x 10⁷ 5.98 x 10⁷ 37.4 (58)
MS-2 coliphage
Pfu/mL 1 3 x 10⁴ 8 x 10³ 74.44 (172)
Parasite eggs Count/L 9 1178 1.3 99.9 (171)
Hookworm No. ova 4 4,500 (270-30,195)
639 (ND-4,500) 85.8 (173)
Ascaris No. ova 4 9,765 (900-72,000)
1,080 (ND-6,300) 88.9 (173)
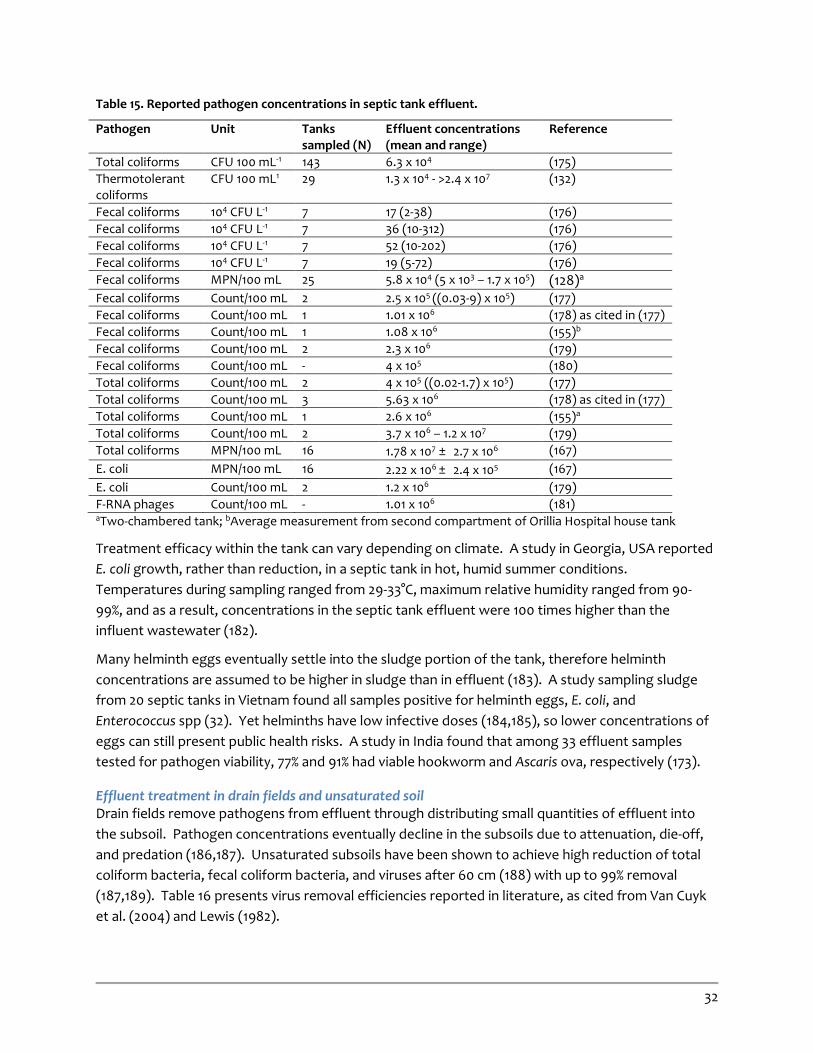
32
Table 15. Reported pathogen concentrations in septic tank effluent.
Pathogen Unit Tanks sampled (N)
Effluent concentrations (mean and range)
Reference
Total coliforms CFU 100 mL-1 143 6.3 x 10⁴ (175)
Thermotolerant coliforms
CFU 100 mL1 29 1.3 x 10⁴ - >2.4 x 10⁷ (132)
Fecal coliforms 104 CFU L-1 7 17 (2-38) (176)
Fecal coliforms 104 CFU L-1 7 36 (10-312) (176)
Fecal coliforms 104 CFU L-1 7 52 (10-202) (176)
Fecal coliforms 104 CFU L-1 7 19 (5-72) (176)
Fecal coliforms MPN/100 mL 25 5.8 x 10⁴ (5 x 10³ – 1.7 x 10⁵) (128)a
Fecal coliforms Count/100 mL 2 2.5 x 10⁵ ((0.03-9) x 105) (177)
Fecal coliforms Count/100 mL 1 1.01 x 10⁶ (178) as cited in (177)
Fecal coliforms Count/100 mL 1 1.08 x 10⁶ (155)b
Fecal coliforms Count/100 mL 2 2.3 x 10⁶ (179)
Fecal coliforms Count/100 mL - 4 x 10⁵ (180)
Total coliforms Count/100 mL 2 4 x 10⁵ ((0.02-1.7) x 105) (177)
Total coliforms Count/100 mL 3 5.63 x 10⁶ (178) as cited in (177)
Total coliforms Count/100 mL 1 2.6 x 10⁶ (155)a
Total coliforms Count/100 mL 2 3.7 x 10⁶ – 1.2 x 10⁷ (179)
Total coliforms MPN/100 mL 16 1.78 x 10⁷ ± 2.7 x 10⁶ (167)
E. coli MPN/100 mL 16 2.22 x 10⁶ ± 2.4 x 10⁵ (167)
E. coli Count/100 mL 2 1.2 x 10⁶ (179)
F-RNA phages Count/100 mL - 1.01 x 10⁶ (181) aTwo-chambered tank; bAverage measurement from second compartment of Orillia Hospital house tank
Treatment efficacy within the tank can vary depending on climate. A study in Georgia, USA reported
E. coli growth, rather than reduction, in a septic tank in hot, humid summer conditions.
Temperatures during sampling ranged from 29-33°C, maximum relative humidity ranged from 90-
99%, and as a result, concentrations in the septic tank effluent were 100 times higher than the
influent wastewater (182).
Many helminth eggs eventually settle into the sludge portion of the tank, therefore helminth
concentrations are assumed to be higher in sludge than in effluent (183). A study sampling sludge
from 20 septic tanks in Vietnam found all samples positive for helminth eggs, E. coli, and
Enterococcus spp (32). Yet helminths have low infective doses (184,185), so lower concentrations of
eggs can still present public health risks. A study in India found that among 33 effluent samples
tested for pathogen viability, 77% and 91% had viable hookworm and Ascaris ova, respectively (173).
Effluent treatment in drain fields and unsaturated soil Drain fields remove pathogens from effluent through distributing small quantities of effluent into
the subsoil. Pathogen concentrations eventually decline in the subsoils due to attenuation, die-off,
and predation (186,187). Unsaturated subsoils have been shown to achieve high reduction of total
coliform bacteria, fecal coliform bacteria, and viruses after 60 cm (188) with up to 99% removal
(187,189). Table 16 presents virus removal efficiencies reported in literature, as cited from Van Cuyk
et al. (2004) and Lewis (1982).
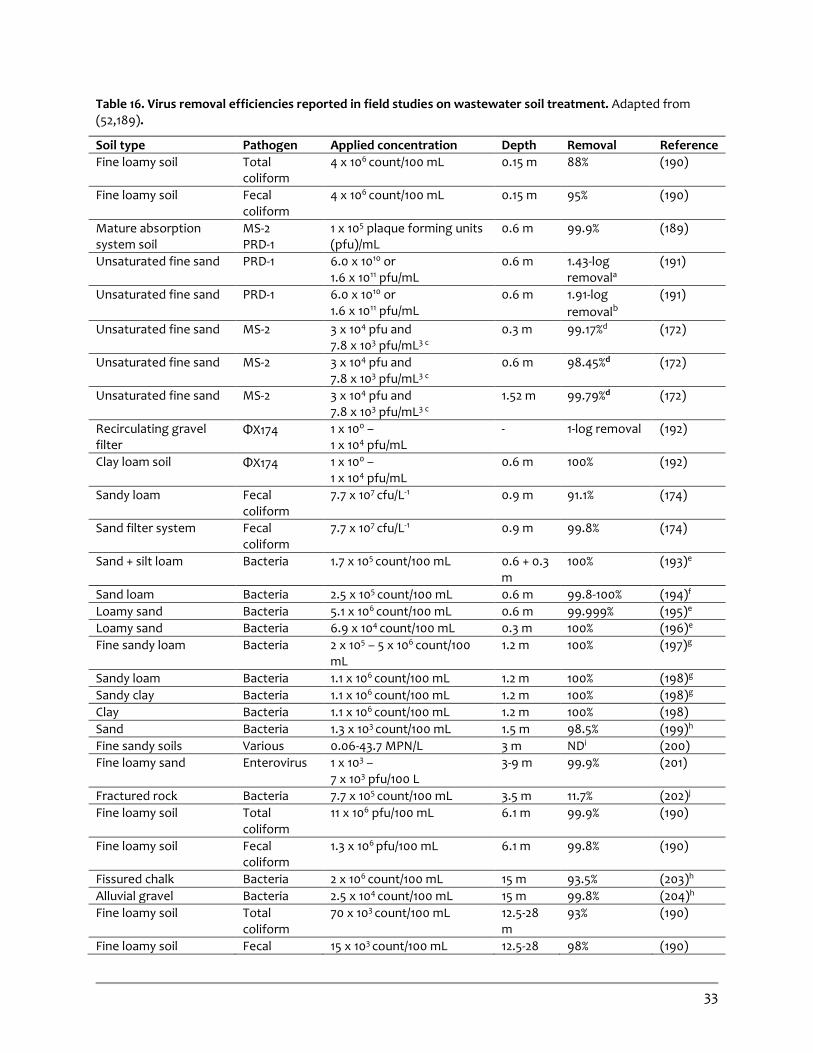
33
Table 16. Virus removal efficiencies reported in field studies on wastewater soil treatment. Adapted from (52,189).
Soil type Pathogen Applied concentration Depth Removal Reference
Fine loamy soil Total coliform
4 x 10⁶ count/100 mL 0.15 m 88% (190)
Fine loamy soil Fecal coliform
4 x 10⁶ count/100 mL 0.15 m 95% (190)
Mature absorption system soil
MS-2 PRD-1
1 x 10⁵ plaque forming units (pfu)/mL
0.6 m 99.9% (189)
Unsaturated fine sand PRD-1 6.0 x 10¹⁰ or 1.6 x 10¹¹ pfu/mL
0.6 m 1.43-log removala
(191)
Unsaturated fine sand PRD-1 6.0 x 10¹⁰ or 1.6 x 10¹¹ pfu/mL
0.6 m 1.91-log
removalb
(191)
Unsaturated fine sand MS-2 3 x 10⁴ pfu and 7.8 x 10³ pfu/mL3 c
0.3 m 99.17%d (172)
Unsaturated fine sand MS-2 3 x 10⁴ pfu and 7.8 x 10³ pfu/mL3 c
0.6 m 98.45%d (172)
Unsaturated fine sand MS-2 3 x 10⁴ pfu and 7.8 x 10³ pfu/mL3 c
1.52 m 99.79%d (172)
Recirculating gravel filter
ΦX174 1 x 100 – 1 x 10⁴ pfu/mL
- 1-log removal (192)
Clay loam soil ΦX174 1 x 100 – 1 x 10⁴ pfu/mL
0.6 m 100% (192)
Sandy loam Fecal coliform
7.7 x 10⁷ cfu/L-1 0.9 m 91.1% (174)
Sand filter system Fecal coliform
7.7 x 10⁷ cfu/L-1 0.9 m 99.8% (174)
Sand + silt loam Bacteria 1.7 x 10⁵ count/100 mL 0.6 + 0.3 m
100% (193)e
Sand loam Bacteria 2.5 x 10⁵ count/100 mL 0.6 m 99.8-100% (194)f
Loamy sand Bacteria 5.1 x 10⁶ count/100 mL 0.6 m 99.999% (195)e
Loamy sand Bacteria 6.9 x 10⁴ count/100 mL 0.3 m 100% (196)e
Fine sandy loam Bacteria 2 x 10⁵ – 5 x 10⁶ count/100 mL
1.2 m 100% (197)g
Sandy loam Bacteria 1.1 x 10⁶ count/100 mL 1.2 m 100% (198)g
Sandy clay Bacteria 1.1 x 10⁶ count/100 mL 1.2 m 100% (198)g
Clay Bacteria 1.1 x 10⁶ count/100 mL 1.2 m 100% (198)
Sand Bacteria 1.3 x 10³ count/100 mL 1.5 m 98.5% (199)h
Fine sandy soils Various 0.06-43.7 MPN/L 3 m NDi (200)
Fine loamy sand Enterovirus 1 x 10³ – 7 x 10³ pfu/100 L
3-9 m 99.9% (201)
Fractured rock Bacteria 7.7 x 10⁵ count/100 mL 3.5 m 11.7% (202)j
Fine loamy soil Total coliform
11 x 106 pfu/100 mL 6.1 m 99.9% (190)
Fine loamy soil Fecal coliform
1.3 x 10⁶ pfu/100 mL 6.1 m 99.8% (190)
Fissured chalk Bacteria 2 x 10⁶ count/100 mL 15 m 93.5% (203)h
Alluvial gravel Bacteria 2.5 x 10⁴ count/100 mL 15 m 99.8% (204)h
Fine loamy soil Total coliform
70 x 103 count/100 mL 12.5-28 m
93% (190)
Fine loamy soil Fecal 15 x 103 count/100 mL 12.5-28 98% (190)
34
coliform m aAt low hydraulic loading rate; bAt high hydraulic loading rate; cIn raw wastewater and applied STE, respectively; dPercent removals based on concentrations in septic tank effluent applied to soil; eLaboratory column experiments; fMound disposal system; gLysimeter studies; hLand disposal of sewage; iVirus was detected at one site between 0.6-0.9 m; jField studies
The efficacy of the drain field treatment is affected by the site’s topography, soil drainage and
aeration, climate, native vegetation, and biological activity in the soil (205). For example, treatment
efficacy of two experimental drain fields in North Carolina was affected by their topography. The
log10 reductions for coliphages, fecal coliforms, and fecal streptococci were found to be 144%, 167%,
and 190% higher (respectively) in the field with higher and drier conditions than the field with lower,
wetter conditions (206).
Characteristics of the drain field subsoils are also major determinants of treatment efficacy. The
depth, permeability, and composition of the drain field subsoils affect effluent dispersal and
pathogen reduction (186). Fine-textured soil with high clay content provide better treatment than
coarse-textured soils (207,208) due to better microbial adsorption (209). In contrast, areas with
sandy soil or thin soil over creviced bedrock have been found to be susceptible to groundwater
pollution by septic systems (52,210), although greater reduction of bacteria and viruses has been
demonstrated in sandy soils with 15% or higher clay content (210).
5.4 Fecal Sludge Treatment
5.4.1 Capacity of fecal sludge treatment plants
Where FSTPs are available, they often do not have sufficient capacity to treat all the collected sludge,
much less the total volume of sludge generated. In 1992, only 8.5% of registered households in
Bangkok, were served by night soil treatment plants. At the time of the study, only two night soil
treatment plants were in operation, with two additional plants to be constructed before 2000.
However, by the authors’ estimation, the total treatment capacity in 2000 would still only be able to
treat 50% of volume generated in 1992 (211). In Dakar, Senegal and Addis Ababa, Ethiopia the
estimated difference in treatment capacity and fecal sludge generation is 7,730 m3/day and 470
m3/day, respectively (15,165).
FSTPs may be overloaded due to the lack of adequate treatment capacity (78,92). In Dakar, Senegal,
there are only two FSTPs in operation, both of which are operating over their designed capacity
(15,92). While three FSTPs in Accra, Ghana were able to treat 90,000 m3 of fecal sludge in 2000, the
combined capacity was not sufficient to treat the remaining 70,000 m3 of sludge (82). In some cases,
such as in Palu, Indonesia, FSTPs operating under their designed capacity can lead to inefficient
treatment (78). Overloaded FSTPs can lead to inefficient sludge treatment as well as frequent
equipment problems (15).
In some cases, FSTPs and WWTPs may not be operated or maintained correctly, leading to inefficient
treatment. A 1992 study of WWTPs in the Caribbean reported 22% of facilities using an activated
sludge treatment process were operating incorrectly (212). They also found 23% of treatment
facilities allowed sludge to accumulate in the treatment process, which led to reduced retention

35
times and thus reduced efficiencies (212). Lack of financial resources and proper operation and
maintenance were cited as the causes for a failed FSTP in the Kathmandu Valley, Nepal (13).
5.4.2 Sludge Treatment Efficiencies
Fecal sludge treatment processes can be divided into two categories based on whether or not they
separate sludge into solids and liquids (213). While fecal sludge treatment literature often focuses
on reducing biological oxygen demand, chemical oxygen demand, our discussion will examine
treatment efficiencies with regards to pathogen reduction. During solid-liquid separation processes,
helminth eggs typically settle in the solid fraction and are thus more concentrated in the sludge
portion after separation (214). Other pathogens, such as bacteria and viruses, are distributed in both
the liquid and solid streams (214). Table 17 summarizes the range in log reductions reported in the
literature for the broad categories of bacteria, viruses, parasites, and helminths.
Table 17. Pathogen log reductions for various sludge treatments.
Treatment process Bacteria Viruses Parasites Helminths Duration required for helminth reduction (in months)
Helminth references
Thickening tanks <1 3 hours (31)
Settling ponds 3a 4 (215)
Planted dewatering drying beds (constructed wetlands)
1-2
1.5 2-3
12 6
(216) (217) (218)
Unplanted drying/dewatering beds (for pre-treatment)
6
6 1.2
8-59 days 11-30 days
(213) (219) (14)
Composting (window, thermophilic)
2-3 2-4 6
2-3
2-3 1.5-2.0 3 (220) (221) (222)
pH elevation >9 3 6 (223)
Anaerobic (mesophilic) digestion
1-2 0.3-3
1 2.0-6.2
0 <0.3
0.5 0
0.5-1.0
(29) (224) (225)
Aerobic digestion 1-2 1 0 (226) as cited in (227)
Air dryingb 2-3 1-3 1-3 (226) as cited in (227)
Lime stabilization 2-3 3 0 (226) as cited in (227)
aEffects depend on moisture levels
Thickening tanks Thickening tanks are used to separate fecal sludge into solid and liquid phases. In Accra, Ghana the
Achimota FSTP used a twin thickening tank process followed by four stabilization ponds (31). After
the thickening tanks, the amount of helminth eggs was reduced by 48% in the effluent (31). Fecal
sludge effluent from the thickening tanks were then discharged into four stabilization ponds where
fecal coliforms were reduced from 106 to 104/100 mL (31).

36
Unplanted drying beds Pilot studies of unplanted drying beds in Accra have fecal sludge dewatered to less than or equal to
40% total solids still containing helminth eggs in hazardous concentrations, however no recoverable
helminth eggs were found at greater than or equal to 70% total solids (213). Storage time and
temperature were important factors to ensure egg reduction. Similarly, the liquid effluent from the
dry beds were reported to be free from helminth eggs. A more recent pilot study of unplanted drying
beds in Kumasi, Ghana using a mixture of fecal sludge from public latrines and septage from septic
tanks reported 100% removal rate of helminth eggs in the effluent from the drying beds (219).
Helminth eggs concentrations were still high in the dewatered fecal sludge (exact number not
reported), therefore the sludge was subsequently co-composted along with biodegradable solid
waste (219).
A more recent study of drying beds used in Dakar, Senegal reported a 93.9% reduction of Ascaris
eggs (14). Fecal sludge was pre-treated using a settling-thickening tank and then applied to drying
beds at 92-117 kg TS/m2 yr and 150-175 kg TS/m2 yr. After 11-30 days of drying, the final sludge product
contained an average of 69 eggs/g TS (14), which is higher than the WHO guideline of <1 Ascaris
egg/g TS for agricultural use of fecal sludges (38).
Planted drying beds Kengne et al. (217) studied the treatment efficiency of vertical flow constructed wetland drying beds
loaded with fecal sludge from pit latrines, septic tanks, and public toilets. Fecal sludge was loaded
over the course of six months at 100, 200 and 300 kg TS/m2 yr. Helminth egg concentration of raw
fecal sludge feed ranged between 4,167 to 22,267 eggs/L. After one month of storage, overall
average helminth egg concentration was 79 eggs/g TS although viable egg concentration was 38.5
eggs/g TS. After six months of storage the average helminth egg concentration dropped to 7.5
eggs/g TS with only 4.03 eggs/g TS being viable.
Ghemandi et al. (218) conducted a literature review on studies examining the pathogen removal
efficiency of surface-flow constructed wetlands. The review compiled data from 70 studies, mostly
from North America (47), Europe (13), and Australia (6). Regardless of the type of pre-treatment,
constructed wetlands showed a one to two log reduction in fecal indicator bacteria (total coliforms,
fecal coliforms, fecal streptococci, and E. coli) for treated municipal sludge. The review concluded
that constructed wetlands receiving previously disinfected wastewater may actually be a source of
contamination rather than increase pathogen removal.
Anaerobic digestion Avery et al. (225) conducted a review of the pathogen reduction of anaerobic digestion processes.
The review found substantial differences in the removal rates for indicator organisms (total coliforms
and fecal coliforms) and pathogen occurrence. Table 5 in Appendix A contains characteristics from
studies using sewage waste included in the review. Gram-negative enteric bacteria may be able to
endure anaerobic digestion conditions better than other pathogens, thus it may not be a suitable
indicator for pathogen reduction for digestion processes. For total coliforms, reduction ranged from
0.3 to 3 logs for sewage feedstock (225). Fecal coliform reductions ranged from 1.3-3 logs and E. coli
37
reductions ranged from 1 to 2.0 logs (225). Studies of other gram positive species such as Clostridia
and Campylobacter, saw little reduction from anaerobic digestion (225).
A study with a feedstock of human night soil reported 3.6-6 log reduction of Vibrio cholerae (58).
Enterovirus reductions were less than 2.0 logs, although 6.2 log removal of poliovirus was observed
in one study (55). Protozoan removal was relatively ineffective with removal rates of no change to
0.3 log reduction observed in two studies (48, 61). The results of the reviewed studies showed an
increase in die-off rates of mixed feedstock (sewage combined with cattle dung) compared to
sewage only feedstocks. Interestingly, the results from the review indicate pathogen die-off was
greater under psychrophilic conditions (<20 C) than mesophilic conditions (20-45 C), however the
authors noticed the relationship of temperature on microbial reduction varied by pathogen (225).
Composting and co-composting Koné et al. (220) studied the pathogen removal efficiency for dewatering fecal sludge followed by
co-composting. Fecal sludge obtained from public toilets and septage with 2-3% total solid content
was loaded onto 25 m2 drying beds and dewatered to >20% TS. The dewatered sludge was then co-
composted with organic solid waste. Initial helminth concentration in the raw fecal sludge was 25-83
helminth eggs/g TS, which decreased to 22-38 eggs/g TS after dewatering. Inner composting
temperatures were ≥45°C for 40 days. After co-composting for 110 days, the concentration was
further reduced to 0.2-1.7 eggs/g TS. The viability of Ascaris eggs within the compost heap decreased
from 58% initially to <10% after 60 days. The study also found that turning frequency had no impact on
helminth egg reduction (220).
Cofie et al. (10) performed a pilot study for co-composting of solid waste and fecal sludge in Ghana.
The treatment system included pre-treatment of fecal sludge through dewatering followed by co-
composting of sludge with solid waste, and storage. Average fecal coliform and Clostridium
concentration in dewatered sludge was 4.07 x 10⁸ CFU/g and 4.93 x 10⁸CFU/g. Helminth egg
concentration ranged from 25-83 eggs/g TS in the dewatered sludge. According to Feachem et al.
(29), Ascaris eggs are inactivated after exposure to temperatures above 45°C for a minimum of five
days. Therefore, while pathogen concentration was not measured as part of the study, the authors
assumed the compost materials were sanitized since internal temperatures were above 45°C and
composting occurred over 90 days (10).
El Fels et al. (221) conducted a pilot study of co-composting sewage sludge with date palm tree
waste at 1:3 (Mixture A) and 1:1 ratios (Mixture B) for a period of six months. Initial concentrations of
fecal coliforms and total coliforms were 12 x 104 CFU/100 mL and 345 x 104 CFU/100 mL for Mixture A,
respectively, and 2 x 10⁴ CFU/100 mL and 456 x 104 CFU/100 mL for Mixture B. After 180 days of co-
composting, fecal coliforms and total coliforms concentrations decreased to ≤85 CFU/100 mL and
≤125 CFU/100 mL, respectively. Removal efficiencies were 99.9% and 99.5% for fecal coliforms in
Mixture A and B, respectively and 99.99% for total coliforms in both mixtures (221).
A co-composting study in El Jadida, Morocco mixed sewer sludge with a sugar beet leaves (C1) and
sewer sludge with a combination of sheep manure, sugar beet leaves, and straw (C2) (228). Co-
composting of C1 and C2 was carried out in a bioreactor chamber for 30 and 23 days, respectively
with temperatures >50°C for eight consecutive days. The process reduced total coliform
38
concentration from 3.4 x 10⁹ MPN/10g DS to 4.0 MPN/10g DS in C1 and from 6.9 x 10⁷ MPN/10g DS to
7.9 MPN/10g DS in C2. Fecal coliforms were reduced from 6.8 x 10⁸ MPN/10g DS to <1.3 MPN/10g DS in
C1 and from 4.9 x 10⁷ MPN/10g DS to 2.0 MPN/10g DS. For both mixtures, helminth eggs were
reduced to <1 egg/10g DS (228).
In a study from Egypt, composted sewage sludge was found to be free from Salmonella spp. and
coliforms at the end composting at temperatures >50°C for 12 weeks of fermentation and another
four weeks of maturation (222). The study the found coliform concentration to vary over the course
of composting and decrease overall at a slower rate than the Salmonella concentration. A study from
Porto Alegre, examined the pathogen reduction from co-composting of sewage sludge with solid
waste (229). Temperatures ranged from 37.0-67.6°C, with temperatures above 45°C for five
consecutive days. At the end of 15 days, the compost mixture was free from detectable enteric
viruses, Salmonella spp., helminth eggs, although the average E. coli concentration in the final
compost (4 x 10⁴ CFU/g) were above the WHO guidelines for agricultural reuse.
Co-treatment with wastewater In certain areas, fecal sludge is co-treated alongside wastewater. If the wastewater treatment
facilities were not designed to handle fecal sludge, this could negatively impact the plant’s ability to
adequately treat either waste stream (78) and lead to overloaded tanks (230).
5.5 Sewers
Sewers are often considered the preferred sanitation technology and are most frequently used in
developed countries (231). In sewerage systems, human excreta and urine are mixed with water and
flushed through individual household connections to a piped network. Sewerage (also referred to as
‘off-site sanitation’) is more expensive that on-site sanitation systems (231). In addition, sewerage
requires large volumes of readily available water, which is limiting for households without at-house
water supplies and can elevate stress in water scarce regions. While wastewater is conveyed away
from the household, there are numerous pathways whereby human excreta is unsafely leaked back
into the environment in sewer systems.
5.5.1 Containment/Transport
Wastewater flushed from a toilet connected to a sewer system may leak unsafely back into the
environment through misconnected sewer lines and/or breaks within the piping or sewer system. In
the case of combined sewers, where sanitary sewers are connected with stormwater sewers, there
is potential for wastewater to be discharged into the environment during periods of severe rainfall.
Each of these potential pathways will be examined in detail in the following sections.
Misconnections The term “misconnection” refers to a situation where a sanitary or greywater sewer pipe is
connected to a surface water pipe unintentionally (25). Thus, wastewater is conveyed to surface
water outfalls without any treatment. These may be accidental or intentional, illicit connections. Five
studies on misconnections were included in the review.
39
Dunk et al. (25) undertook case studies of communities along the Thames River in the United
Kingdom to determine the extent of misconnections. In total, the study examined almost 50,000
properties and found an average misconnection rate of 1.3% (range <1-9%). Toilet wastewater
accounted for only 3% of misconnections with the majority (almost 70%) resulting from greywater
appliances (e.g. sinks, hand basins, and washing machines) (25).
A study examining the microbial contamination of the Arkansas River found high concentrations of
fecal coliforms (40-11,384 CFU/100 mL) in sections running through the city of Tulsa, while upstream
and downstream concentrations were much lower (2-96 CFU/100 mL) (232). Raw sewage was
suspected to be the main pollutant, therefore city officials examined sections of sewer lines near
major storm drains. Upon inspection, a “T” connection in the sewage pipes was allowing sewage to
flow directly into a stormwater drain (232).
Three studies were reviewed that examined illegal connections of sewage discharge into storm
sewers. Johnson and Toumari (233) reported on a study of illegal connections to storm sewers in
Wayne County, Michigan. Of the 3,340 businesses and industries examined, 9% had illicit connections,
however only 11% (n=33) of those were from toilets. Li et al. (234) assessed the impact of illegal
connections on stormwater sewers in Shanghai and Hefei, China. Illicit connection rates ranged from
27.1-51.7% in Shanghai, with lower rates observed in more recently built systems. Rates in some areas
were as high as 90% in older systems of Hefei. Inceptors were built to try and reduce the volume of
dry weather discharge from illegal connections, however the capacity of inceptors were not always
sufficient to eliminate some wastewater being discharged into receiving waters (234). Another study
in Shanghai used a water flow balance to estimate the extent of misconnections. They calculated 51%
of collected sewage made its way into stormwater sewers (235).
Exfiltration Pipes may become compromised due to structural defects such as cracks, fractures, joint
displacement, deformation and collapse, or due to operational damage such as roots, siltation, and
blockage (26). Aging sewer pipes and infrastructure can allow sewage to leak out into surrounding
soil and groundwater (exfiltration) or, in some cases, allow water to leak into the sewage system
(infiltration). The position of sewer lines relative to the groundwater table determines whether
exfiltration or infiltration occurs more often (236). Leaking sewer lines situated above groundwater
will result in exfiltration, while sewer lines lower than groundwater will most likely experience
infiltration (236).
Sewer pipe exfiltration can result in contamination of drinking water if drinking water pipes are
nearby and have suffered similar structural or operational damage. However, exfiltration has a
greater impact on groundwater quality in areas where the water table is shallow. Previous studies
have indicated exfiltration of sewage pipes as the contamination source in groundwater supplies
(237).
The extent of exfiltration is often difficult to estimate, but numerous direct and indirect methods
have been developed. Rutsch et al. (238) conducted a review of different approaches to model and
estimate exfiltration in sewers. The results of the reviewed studies and some additional studies
found by this review are included in Table 18. The review concluded that there is large uncertainty in

40
the estimates of exfiltration rates, and the extent of exfiltration is still unclear in the body of
available research. In addition, as is demonstrated in Table 18, there is a wide range of measurements
used to report exfiltration estimates, which complicates comparability of results. Another review on
exfiltration rates estimated 3-5% as an average exfiltration rate for pre-1960s sewers (239). In a study
of urban recharge in Nablus, West Bank, Borst et al. (240) estimated 22% of wastewater is leached
into the ground, with 57% being from sewer exfiltration and 43% from cesspit leakage.
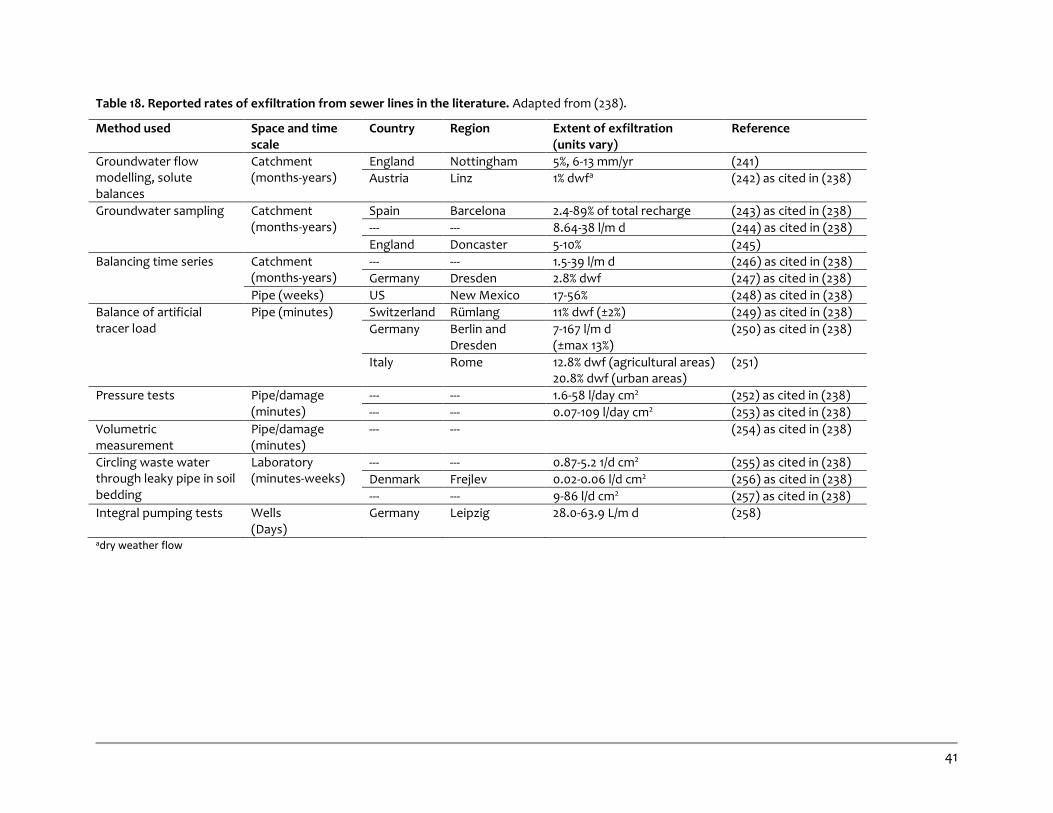
41
Table 18. Reported rates of exfiltration from sewer lines in the literature. Adapted from (238).
Method used Space and time scale
Country Region Extent of exfiltration (units vary)
Reference
Groundwater flow modelling, solute balances
Catchment (months-years)
England Nottingham 5%, 6-13 mm/yr (241)
Austria Linz 1% dwfa (242) as cited in (238)
Groundwater sampling Catchment (months-years)
Spain Barcelona 2.4-89% of total recharge (243) as cited in (238)
--- --- 8.64-38 l/m d (244) as cited in (238)
England Doncaster 5-10% (245)
Balancing time series Catchment (months-years)
--- --- 1.5-39 l/m d (246) as cited in (238)
Germany Dresden 2.8% dwf (247) as cited in (238)
Pipe (weeks) US New Mexico 17-56% (248) as cited in (238)
Balance of artificial tracer load
Pipe (minutes) Switzerland Rümlang 11% dwf (±2%) (249) as cited in (238)
Germany Berlin and Dresden
7-167 l/m d (±max 13%)
(250) as cited in (238)
Italy Rome 12.8% dwf (agricultural areas) 20.8% dwf (urban areas)
(251)
Pressure tests Pipe/damage (minutes)
--- --- 1.6-58 l/day cm2 (252) as cited in (238)
--- --- 0.07-109 l/day cm2 (253) as cited in (238)
Volumetric measurement
Pipe/damage (minutes)
--- --- (254) as cited in (238)
Circling waste water through leaky pipe in soil bedding
Laboratory (minutes-weeks)
--- --- 0.87-5.2 1/d cm2 (255) as cited in (238)
Denmark Frejlev 0.02-0.06 l/d cm2 (256) as cited in (238)
--- --- 9-86 l/d cm2 (257) as cited in (238)
Integral pumping tests Wells (Days)
Germany Leipzig 28.0-63.9 L/m d (258)
adry weather flow
42
Combined sewer overflows In certain areas, combined sewers connect sewerage systems to stormwater pipes. During periods of
intense rainfall, these systems allow wastewater and stormwater to bypass WWTPs, resulting in a
discharge of untreated wastewater. These events are referred to as “combined sewer overflows,” or
CSOs. According to the U.S. EPA, in 2004 there were 9,348 CSO outfalls in the United States, with
most of them concentrated in the Great Lakes region (259). In the same report, the authors
estimated the volume of untreated CSO discharge to be 850 billion gallons/year. Combined sewers
have been built in the U.S., Canada, Europe and parts of Asia.
Similarly, sanitary sewer overflows (SSOs) may also occur due to clogged or broken pipes,
infiltration, or power failures. While not all SSO events are reported, the U.S. EPA are an estimated
23,000-75,000 SSO events per year (259). Of the events reported during a three year period, over
80% consisted of less than 10,000 gallons. In the U.S., CSOs and SSOs are the main source of human
fecal contamination in surface water (260). One study reported an estimated 39 million m3 of
untreated sewage and stormwater is discharged into the River Thames in London during 60 overflow
events from 34 different CSO outfalls.
During a CSO or SSO event, large volumes of untreated wastewater may be discharged into surface
water bodies. The EPA reported a range of 105-107 fecal coliform colonies/100 mL in untreated
wastewater and a range of 3-406fecal coliform colonies/100 mL in CSOs (259). The bacterial load
fraction in surface water bodies due to CSO events were estimated to be 10-15% in the Michigan
Rouge River and up to 61% in the Anacostia River in Washington, D.C (259).
Data on frequency of CSO events in Shanghai, China and Japan were cited in Li et al. (261). In 2005,
80% of combined sewers in Shanghai overflows nine times or less, while 20% overflowed between 10-
19 times. However the frequency of overflows was higher in 2004, with 55% overflowing nine times
or less, 40% overflowed 10-19 times, and 5% overflowed 20-29 times during the year. In contrast, from
data of 192 combined sewers in Japan, 5% overflowed nine times or less, 10% between 10-19 times, 16%
between 20-29 times, and 69% over 30 times (up to 69 times as a maximum) (261). The frequency of
CSO events depends on multiple factors including precipitation and sewer characteristics.
Numerous studies reported high pathogen loads in receiving waters from CSO events. One study
estimated the discharge load from a CSO to contain 79 and 100 times more E. coli and intestinal
enterococci, respectively, than the combined total median outfalls from three WWTPs (27). Ham et
al. (262) estimated CSO outfall and stormwater accounted for 4-23% of the total indicator bacteria
concentration in the Tama River in Tokyo. Another study calculated distances of 3.5 km and 2.1 km
were needed for a 90% reduction in fecal coliform and fecal streptococci concentration from a CSO
outfall in north London (263). Fecal coliforms and fecal streptococci have been observed to multiple
and survive in sediments from receiving waters (263).
In contrast, McLellan and Salmore (264) monitored E. coli concentration in the South Shore Marina in
Milwaukee during two CSO events. They found no statistical significant difference in the geometric
means of E. coli concentration between the two events, even though one discharged over 100 times
more volume of wastewater (264). The study found the CSO events did not increase contamination
43
levels on the shoreline, but found high E. coli concentrations in the beach area regardless of CSO
events.
With regards to protozoan pathogens, three studies examined Giardia concentrations in CSO
discharges. In Germany, a study of CSOs found a two log increase in total coliform and Giardia
concentration in a river body during a CSO compared to dry weather conditions (265). Annual Giardia
loading from CSO events were substantially higher (1.2 x 10¹⁰ cysts/yr) than loading from sewage
treatment effluent (3.0 x 10⁹ cysts/yr) (265). Results of the study showed periods of heavy rainfall
led to higher levels of pathogens than longer periods of moderate precipitation (265).
In 1998, Gibson III et al. (266) studied protozoa concentrations in the Saw Mill Run stream, which
received 26 CSO outfalls. During dry weather conditions, concentrations of Cryptosporidium and
Giardia ranged from 5-105 oocysts/100 L and 13-6,579 cysts/100 L, respectively (266). However during
five CSO events, concentrations ranged from 250-40,000 oocysts/100 L and 9,000-283,000 cysts/100
L. A more recent study conducted microbial risk assessment of CSOs along the Lower Passaic River in
New York (267). During one CSO event, an estimated 125 million gallons of sanitary sewage and
stormwater are released into the river. Samples from the CSO outlet contained >30,000 CFU/100 mL
of total coliforms, fecal coliforms, fecal streptococcus and fecal enterococcus (combined). Giardia
concentration ranged from 1,860 cysts/L at the outfall to 798 cysts/L ten feet downstream, and
Cryptosporidium was not detected (267).
Two studies examining concentrations of viruses in CSO outfalls were reviews. Fong et al. (268)
found average adenovirus DNA concentrations from six CSO events to be 5.35 x 10⁵ viruses/L, which
was a little less than half the concentration found in raw sewage (1.15 x 10⁶ viruses/L). A study of a
CSO next to a WWTP in Tokyo found a one log decrease in total coliform concentration in receiving
waters the day after a CSO event (269). However, in the receiving waters of the CSO, the proportion
of samples positive for viruses remained relatively constant four days after the event. The study was
unable to confirm if this was due to viruses persisting in the environment or due to ineffective
treatment from the WWTP (269).
5.5.2Treatment
Available treatment facilities The 2000 Global Water and Sanitation Assessment from the World Health Organization and UNICEF
reported estimates for the population in large cities with access to sewers and the percentage of
wastewater treated using at least secondary treatment processes. North America had the highest
percentage of the population in large cities using sewers (96%) as well as the highest percentage of
wastewater undergoing at least secondary treatment (90%) (270). According to the report, only 18%
of the population in large cities in Africa were connected to sewers and 0% of wastewater was
treated using secondary treatment (270). While 92% of the population in large cities in Europe were
connected to sewers, only 66% of wastewater received secondary treatment (270). The WHO/UNICEF
report illustrates that globally, a small percentage of wastewater undergoes secondary treatment
processes.
44
A more recent study by Malik et al. (271) developed a global database of sewage connection rates
and wastewater treatment rates. The study drew on data from the Pinsent Masons Water Yearbook,
United Nations Statistics Division, Organisation for Economic Cooperation and Development, and the
Food and Agriculture Organization of the United Nations as well as additional publicly available data.
The study identified data for 183 countries and normalized wastewater treatment rates by
multiplying it by the national sewage connection rate to calculate a wastewater treatment indicator.
Connection rate and treatment level were positively correlated, however there were outlier
countries with low connection rates and high treatment levels (Thailand, Cape Verde, Palau, and
American Samoa) and countries with high connection rates and low treatment levels (Maldives,
Colombia, and Georgia). Regions where connection rates were greater than treatment rates by 10%
or more included Eastern Europe and Central Asia, Latin American and the Caribbean, the Middle
East and North Africa, North America, and South Africa. The available data reveals that even in
countries where households are connected to sewerage, there may be large percentages of
wastewater that is discharged untreated.
The study authors reported several challenges on locating and comparing data on wastewater
treatment. Since data sources rarely distinguished wastewater sources, wastewater data included
domestic, commercial, industrial, and stormwater runoff from urban areas. Similarly, the study
reported most data sources did not contain disaggregated data on the level of wastewater
treatment (primary, secondary, and tertiary), therefore treatment was considered primary and
above (271). Additionally, the study authors noted that recent data (post 2005) was unavailable for
96 countries.
Two datasets that contained national data on the extent of wastewater treatment coverage or type
of treatment processes were obtained, however the data was mostly limited to European or
developed countries. The Eurostat website provides publicly available data on the level of treatment
and the type of treatment from countries within the European Union. Data on the level on treatment
in 2013 for some countries was available on the OECD website (Figure 2). Figure 2 demonstrates that
even in developed countries, domestic wastewater from sewered households is discharged without
treatment (272). Few studies or reports were identified that detailed the level of wastewater
treatment in low, lower-middle, and upper-middle income countries.

45
Figure 2. Percentage of the national population connected to a wastewater treatment plant by level of treatment. From (272).
Several studies indicated that large volumes of wastewater were discharged without treatment in
major cities. Table 19 contains reported percentages of wastewater discharged untreated into the
environment in various areas. While only 15% of Accra is served by a central sewage system,
according to Murray et al. (76), all of the wastewater collected by the sewer system is discharged
directly into the ocean without treatment. Similarly, while Tema has a wastewater treatment facility,
it is no longer functioning and all wastewater is now discharged into the ocean (76).
Direct discharge of wastewater into surface water can result in high levels of microbial
contamination. Yapo et al. conducted a quantitative microbial risk assessment (QMRA) of a
wastewater canal and lagoon located in Abidjan, Côte d’Ivoire. Domestic and industrial wastewater
was discharged into drains that fed directly into the canal, and the study authors found
concentrations of E. coli ranging from 12.8- 2.97 x 10⁴ CFU/100 mL and Giardia lamblia ranging from 0-
18.5 cysts/L (273).
0
20
40
60
80
100
Net
herla
nds
Sw
itzer
land
Uni
ted
Kin
gdom
Ger
man
y
Aus
tria
Spa
in
Gre
ece
Luxe
mbo
urg
Isra
el
Kor
ea
Den
mar
k
Sw
eden
Fin
land
Est
onia
Cze
ch R
epub
lic
Japa
n
Bel
gium
Uni
ted
Sta
tes
Irel
and
Hun
gary
Can
ada
Chi
le
Pol
and
Por
tuga
l
Nor
way
Slo
veni
a
Tur
key
Icel
and
New
Zea
land
Italy
Slo
vak
Rep
ublic
Mex
ico
Not connected to a sewerage network/independent treatment Connected to a sewerage network without treatment
Primary treatment only Secondary and/or tertiary treatment
Public total treatment
partial data %
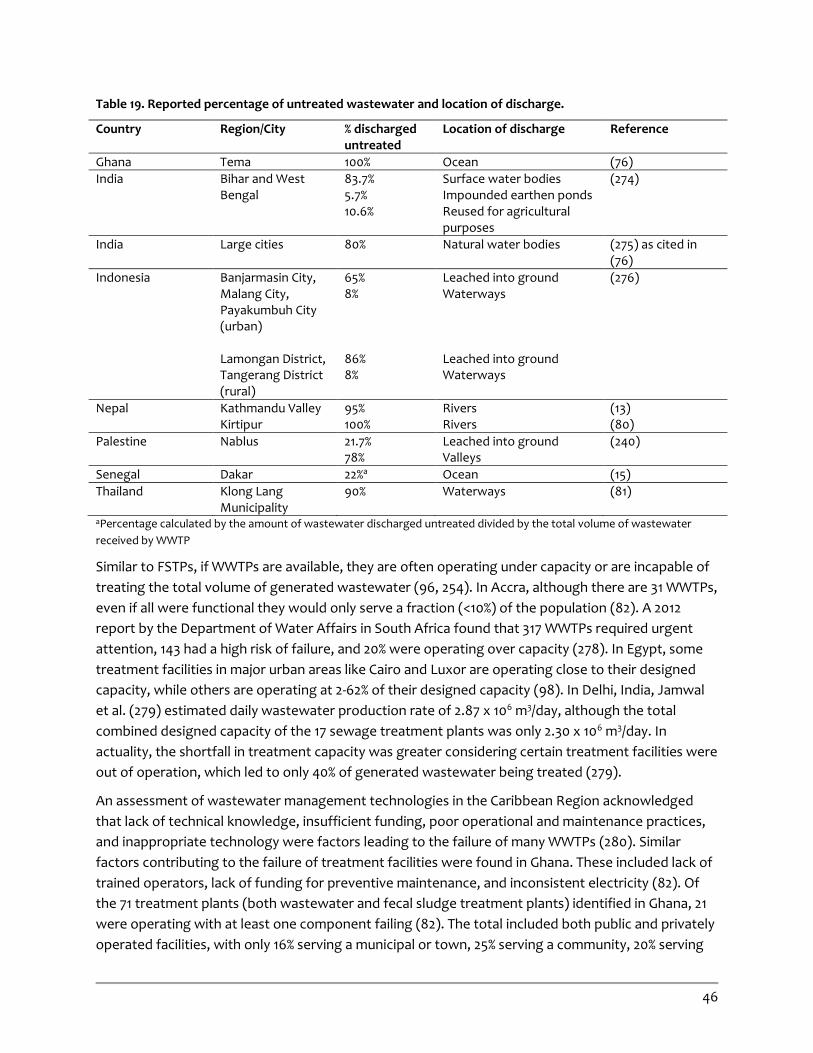
46
Table 19. Reported percentage of untreated wastewater and location of discharge.
Country Region/City % discharged untreated
Location of discharge Reference
Ghana Tema 100% Ocean (76)
India Bihar and West Bengal
83.7% 5.7% 10.6%
Surface water bodies Impounded earthen ponds Reused for agricultural purposes
(274)
India Large cities
80% Natural water bodies (275) as cited in (76)
Indonesia Banjarmasin City, Malang City, Payakumbuh City (urban) Lamongan District, Tangerang District (rural)
65% 8% 86% 8%
Leached into ground Waterways Leached into ground Waterways
(276)
Nepal Kathmandu Valley Kirtipur
95% 100%
Rivers Rivers
(13) (80)
Palestine Nablus 21.7% 78%
Leached into ground Valleys
(240)
Senegal Dakar 22%a Ocean (15)
Thailand Klong Lang Municipality
90% Waterways (81)
aPercentage calculated by the amount of wastewater discharged untreated divided by the total volume of wastewater
received by WWTP
Similar to FSTPs, if WWTPs are available, they are often operating under capacity or are incapable of
treating the total volume of generated wastewater (96, 254). In Accra, although there are 31 WWTPs,
even if all were functional they would only serve a fraction (<10%) of the population (82). A 2012
report by the Department of Water Affairs in South Africa found that 317 WWTPs required urgent
attention, 143 had a high risk of failure, and 20% were operating over capacity (278). In Egypt, some
treatment facilities in major urban areas like Cairo and Luxor are operating close to their designed
capacity, while others are operating at 2-62% of their designed capacity (98). In Delhi, India, Jamwal
et al. (279) estimated daily wastewater production rate of 2.87 x 10⁶ m3/day, although the total
combined designed capacity of the 17 sewage treatment plants was only 2.30 x 10⁶ m3/day. In
actuality, the shortfall in treatment capacity was greater considering certain treatment facilities were
out of operation, which led to only 40% of generated wastewater being treated (279).
An assessment of wastewater management technologies in the Caribbean Region acknowledged
that lack of technical knowledge, insufficient funding, poor operational and maintenance practices,
and inappropriate technology were factors leading to the failure of many WWTPs (280). Similar
factors contributing to the failure of treatment facilities were found in Ghana. These included lack of
trained operators, lack of funding for preventive maintenance, and inconsistent electricity (82). Of
the 71 treatment plants (both wastewater and fecal sludge treatment plants) identified in Ghana, 21
were operating with at least one component failing (82). The total included both public and privately
operated facilities, with only 16% serving a municipal or town, 25% serving a community, 20% serving
47
businesses, 13% serving schools, 13% serving military camps, and 13% serving hospitals (82). Thirty-five
of the plants were found to be non-functional and six were of unknown status (82). The ability of
wastewater treatment facilities to monitor effluent is also a concern. Some plants do not have the
proper equipment to test the quality of effluent before discharging (98).
Certain cities had more data available, however reported figures regarding the volume of
wastewater treated varied across the literature. According to Dodane et al. (281), the Cambèréne
WWTP in Dakar, Senegal uses two settling tanks (19,200 m3/day combined capacity) for primary
treatment and activated sludge as secondary treatment (9,600 m3/day). Sludge is then treated using
anaerobic digesters and then disposed of through land application. A fraction of secondary effluent
(5,700 m3/day) is further treated through sand filters and disinfection, then used for irrigation
purposes. The remaining secondary effluent is discharged to the ocean (281). However a different
paper claimed only 15% of wastewater generated in Dakar was treated using activated sludge
processing and the remainder was discharged untreated into the ocean (90). Yet another report
found 47% of surveyed households in Senegal discharged their wastewater directly into the streets
and 9% discharged into open canals (15).
Treatment efficiencies In areas where wastewater treatment facilities are available, there is still potential for unsafe return
of human excreta depending on the efficiency of the treatment process to remove harmful
pathogens. Table 20 summarizes relative efficiencies for bacteria, virus, protozoa, and helminth
removal of various treatment processes reported in the literature. If the concentration of pathogens
in influent wastewaters are high, then even multiple log reductions may not reflect the pathogen
concentration in the effluent.

48
Table 20. Relative efficiencies of pathogen removal of sewage treatment operations and processes.
Treatment level
Specific treatment process
Bacteria removal (%)
Virus removal (%)
Protozoa removal (%)
Helminth removal (%)
Reference
Primary Fine screening 10-20 (282)
Disinfection Chlorination of raw/settled sewage
90-95 (282)
Primary Plain sedimentation
25-75 50-90 0-90
0-50 0 0-90
0-50 0-90
50-70a
<30 0-90
(282) (29) (283) (33) (284)
Primary Chemical precipitation
40-80 90
90
50-80
90-99
(282) (283) (33)
Primary Trickling filtration
90-95b
80-99a
0-99
15-75 50 0-90
20-901
0-90
20-90a
94-100b 0-90
(282) (285) (283) (284)
Secondary Membrane bioreactors
Up to 99.9999 Up to 99.9999
Up to 99.9999 Up to 99.9999 (33)
Secondary Activated sludge treatment
90-98c
60-99 99-99.9
Up to 99 90 90-99
90-99
80-100 70-90 90-99
(282) (285) (283) (33) (284)
Secondary Stabilization ponds
95-98 Up to 99.9999 99.9-99.9999 99.99-99.9999
Up to 99.99 99-99.99 99-99.99
99-100 90-99 99.99-99.9999
100 99.9 99.99-99.9999
(282) (286) (33) (284)
Disinfection Chlorination of biologically treated sewage
98-99 99
90-99.9
0-96.8
0
(282) (33)
Disinfection Ozone 99d 99.9d ≥99d (283)
Secondary/ Constructed 90-98 60-100 (33)
49
Tertiary wetlands atypical removal rates reported bfollowed by plain sedimentation cpreceded and followed by plain sedimentation dat specific ozone residuals, contact times, and temperatures
50
Trickling filters Robertson et al. (287) conducted a three year study on the protozoan removal efficiency of six
WWTPs in the United Kingdom. Two of the plants used primary sedimentation followed by
secondary treatment using a trickling filter. One of the plants applied additional tertiary treatment
through filtration. Removal efficiencies for Giardia and ranged from 74% (SD 15) to 85% (SD 30). The
removal efficiencies for Cryptosporidium were much lower, ranging from 5% (SD 35) to 38% (SD 38%)
(287). These were within the ranges reported by Feachem et al. (29) and (284) for trickling filters
protozoa removal rates.
Activated sludge Six studies of wastewater treatment facilities using activated sludge processes were reviewed
(171,287–291). Two log removals of fecal coliforms were demonstrated in both studies measuring
bacterial concentration. Removal efficiency for protozoa ranged from 28% to 100%, while enterovirus
removal was 98%, however only one study measured virus concentrations (288). Helminth removal
also varied from 67% to <99.6%. Table 21 summarizes the removal efficiencies of pathogens from the
four studies.

51
Table 21. Reported treatment efficiencies for activated sludge processes in literature.
Country Treatment facilities (N)
Fecal coliforms
Coliphage Enteroviruses Giardia Crypto- sporidium
Ascaris lumbericoides
Entamoeba histolytica
Reference
US 1 99.1% 82.1% 98.0% 93.0% 92.8% <99.6% (288)
UK 3 66-94% 28-98% (287)
Canada 3 98.7%-99% 96.8-99.5% (171)
Jordan 1 100% 88% 67% (289)
Brazil 8 99% (290)
Iran 1 96.7% 97.4% (291)

52
Kerstens et al. (292) evaluated three different types of decentralized wastewater treatment facilities
operating in Java, Indonesia. System 1 consists of a settler, anaerobic baffled reactor, and an
anaerobic filter. System 2 treats blackwater through a digester, then combines treatment with grey
water in a settler, anaerobic baffled reactor, and an anaerobic filter. The final system uses a settler,
equalization activated sludge, clarifier and filtration. The effluent from nine sites (5 sites using
System 1, 3 sites using System 2, and one site using System 3) were tested for various water quality
parameters. The total coliform concentration from the different systems ranged from 1 x 10⁸ – 1 x 10¹⁸
CFU/100 mL, 1 x 10⁷- 1 x 10¹⁷ CFU/100 mL, and 1.5 x 10⁵- 1.5 x 10¹⁰ (estimated from graphs). The system
utilizing an activated sludge process had the lowest total coliform concentrations, however this was
based on only one sampling site (292).
Waste stabilization ponds Waste stabilization ponds (WSP) are classified into three different types: anaerobic, facultative, and
maturation (286). Anaerobic and facultative ponds are used to reduce the biological oxygen
demand, while subsequent maturation ponds are used to reduce the concentration of fecal bacteria
present in the wastewater (286). Table 6 in Appendix A contains various pathogen removal
efficiencies reported in literature for different WSP systems. Heinss et al. (213) states that there is a
one log reduction in fecal coliforms for each anaerobic pond in a series, and two maturation ponds in
series can results in one log reduction. Depending on the WSP configuration, one to six log
reductions in fecal coliforms have been demonstrated. Virus removal rates were between 90-99.9%,
with greater reductions occurring in systems with additional maturation ponds (213).
According to studies conducted by Ayres et al. (293) in Brazil, India, and Kenya, there is no
statistically significant difference in the efficiency of helminth egg removal between anaerobic,
facultative, and maturation ponds. Ayres et al. (293) developed the following equation [1] to
calculate percentage removal of helminth eggs based on retention time, where R is the percent
removal in anaerobic, facultative, or a maturation pond and θ is retention time in days:
𝑅 = 100[1 − 0.14𝑒−0.38𝜃] [1]
Mara (286) suggests if the effluent from a facultative pond contains >1 helminth egg/liter then one or
more maturation pond(s) should be included after the facultative pond to ensure proper helminth
removal. If facultative pond effluent contains <1000 CFU/100 mL E. coli, then helminth egg
concentrations are likely to be less than <<1 egg/L (286). Studies have shown that 100% removal rates
of helminth eggs can be achieved in various WSP schemes with a 10-14 day retention time (294). In
the four pond stabilization scheme, Heinss et al. (213) recorded helminth eggs in waste pond effluent
with retention times of 9, 4, 4, and 4, respectively in the four ponds. For anaerobic or facultative
ponds, complete helminth egg removal has been reported after two to three weeks (213). Once
helminth eggs settle in pond sludge, they may remain viable for long periods of time, as one study
found viable eggs in sludge stored for nine years (295).
Ingallinella et al. (296) piloted co-treatment of septage and sewage in a wastewater stabilization
pond system. Septage was discharged into a primary pond, then combined with sewage and treated
in two ponds in series. One primary pond was used from January to July of 1999 (Phase I), however
53
sludge accumulated to the point where a new primary pond (of the same dimension) had to be used
from July 1999 until February 2000 (Phase II). Fecal coliforms were reduced from 1.73 x 10⁷ MPN/100
mL in the septage effluent to 1.06 x 10⁵ MPN/100 mL in Phase I and from 6.0 x 10⁶ to 1.2 x 10⁵ MPN/100
mL in Phase II. The helminth concentration within the sludge increased from 5,500 eggs/100 g dry
weight in May 1999 to 6,000 eggs/100 g dry weight in April 2000. While the study demonstrated the
ability of WSP systems to reduce fecal coliforms, however the results emphasize the potential of
helminth contamination increasing in WSP sludge (296).
The siting of WSPs should take into account the depth of groundwater as large volumes of effluent
will be pooled in one location. Knappett et al. (297) examined the microbial contamination of a
shallow aquifer located beneath a wastewater ponds in Bangladesh. The results indicated latrine
effluent receiving ponds can be sources of significant bacterial contamination. Sediment grain size,
pond age, and seasonality affected the extent of bacterial contamination with newer ponds and
monsoon conditions resulting in the highest bacterial concentrations. The authors suggested a
minimum lateral distance of 13 meters between wells and ponds given the conditions within the
study setting, however the distance may need to be greater in areas with larger grain-sizes (297).
Disinfection processes Hendricks and Pool (298) studied three WWTP in South Africa that used the same primary and
secondary treatment processes (screens as a pre-treatment and activated sludge treatment) but
each used a different tertiary process. Of the three WWTP, one used ultraviolet (UV) light as a
disinfection step, while another used chlorination, and the last WWTP did not use a disinfection step
but rather a membrane bioreactor. In comparing the treatment efficiencies of the three plants, the
effluent from the WWTP using UV light contained >1000 CFU/100 mL of detectable E. coli, while the
effluent from the other two WWTP using chlorination and a membrane bioreactor contained <1
CFU/100 mL (298).
Specific case studies of treatment efficiencies A recent study examining water quality of the Upper Santa Cruz Watershed in Arizona measured the
microbial concentration of effluent discharged from three WWTPs (299). The type of treatment
processes used at the plants were not specified in the study. Arizona state regulations require for
any given sample not to exceed 235 E. coli CFU/100 mL or 800 CFU/100 mL of fecal coliforms. The
study reviewed monthly discharge reports from three WWTPs from 1998-2008 for fecal coliform
measurements and from 2008 to 2011 for E. coli measurements. Of the monthly reports reviewed, 13-
15% exceeded the maximum concentration for fecal coliforms and 16-34% exceeded the maximum E.
coli concentration. The study demonstrates that although municipal wastewater was treated prior to
discharge, the concentration of pathogens still exceeded state water quality limits (299).
Gennaccaro et al. (300) examined the presence of Cryptosporidium parvum at six reclamation
facilities in the US over the course of five to twelve months. The various treatment plants used
different filtration processes (e.g. shallow or deep-bed sand and anthracite filters or fabric disk
filters) and disinfection (chlorine or UV). Infectious Cryptosporidium oocysts were detected at each
stage in the treatment process with 40% of final effluent samples being positive for infectious
oocysts (Appendix A, Table 7) (300).

54
Rose et al. (288) conducted a year-long study of a wastewater reclamation plant in Florida to
evaluate the treatment efficiency for the removal of various pathogens. The reclamation facility
processed 16 million gallons per day using preliminary screening, biological treatment with activated
sludge, dual-media rapid sand filtration with in-line addition of alum and polymer coagulants. After
filtration, effluent was chlorinated and stored in storage tank for 16-24 hours before being
discharged. The resulting sludge was then treated using thickening, anaerobic digestion, and
dewatering (288).
Complete treatment of wastewater as described above yielded high reductions (>99.999%) of total
coliforms, fecal coliforms, and phages. Enteroviruses, Giardia, and Cryptosporidium removal rates
were 99.999%, 99.993%, and 99.95% respectively. Complete sludge treatment resulted in 92%, 90%,
83% and 68% removal rates for total coliforms, fecal coliforms, coliphages, and enteroviruses,
respectively. However, the final concentration of fecal coliforms was still high (geometric mean 2.4 x
105 CFU/g). Removal rates were >99% and 97% for Cryptosporidium and Giardia, respectively, while
there was complete removal of helminths (288) (Additional data from the study is available in
Appendix A, Tables 8 and 9).
A comparison study of centralized and decentralized treatment processes in Sydney, Australia
measured the concentration of Cryptosporidium oocysts and enteric viruses in effluent (301). They
found Cryptosporidium oocysts in 76% of samples from sewage WWTP effluent (median 0.7
oocysts/L, max 290 oocysts/L) and in only 8% of septic tank effluent (range 230-510,000 oocysts/L).
Enteric viruses were present in 17% and 50% of effluent samples from sewage WWTPs and
decentralized sewage systems, respectively. The type of treatment processes used by the sewage
treatment plants were not specified (301).
Lim et al. (302) examined the efficiency of two community wastewater treatment systems in
Indonesia. The first system used biological contact filters and surface aeration while the second
system uses a rotating biological contactor process. The E. coli concentrations in the effluent from
the two systems ranged from 5.4 x 10⁶ MPN/100 mL (dry season) to 1.6 x 10⁹ MPN/100 mL (wet
season) and 2.4 x 10⁶ MPN/100 mL (dry season) to 5.4 x 10⁷ MPN/100 mL (wet season), respectively.
No data was reported on the treatment efficiency of either system, however, the effluent still
contained high concentrations of fecal indicator bacteria. While Indonesia has wastewater effluent
standards, there is no specific limit for E. coli. The effluent was discharged into irrigation canals that
eventually flow into rice paddies. The E. coli concentration in the irrigation canals downstream of the
WWTP ranged from 1.7 x 10⁵ – 1.6 x 10⁷ MPN/100 mL (302).
5.5.3 Disposal
Disposal locations of treated wastewater A study of 138 wastewater treatment facilities throughout the Caribbean region reported 29% of
plants discharged into marine environments, 22% discharged into freshwater, 14% discharged into the
sub-surface, and 14% discharged on-site (storm drains, street drains, gullies, and fields) (212). They
found the effluent from 21% of surveyed facilities was reused in irrigation or flush water for toilets
(212). In the Gaza strip, effluent from two WWTPs are discharged into the sea as well as 18 pipelines
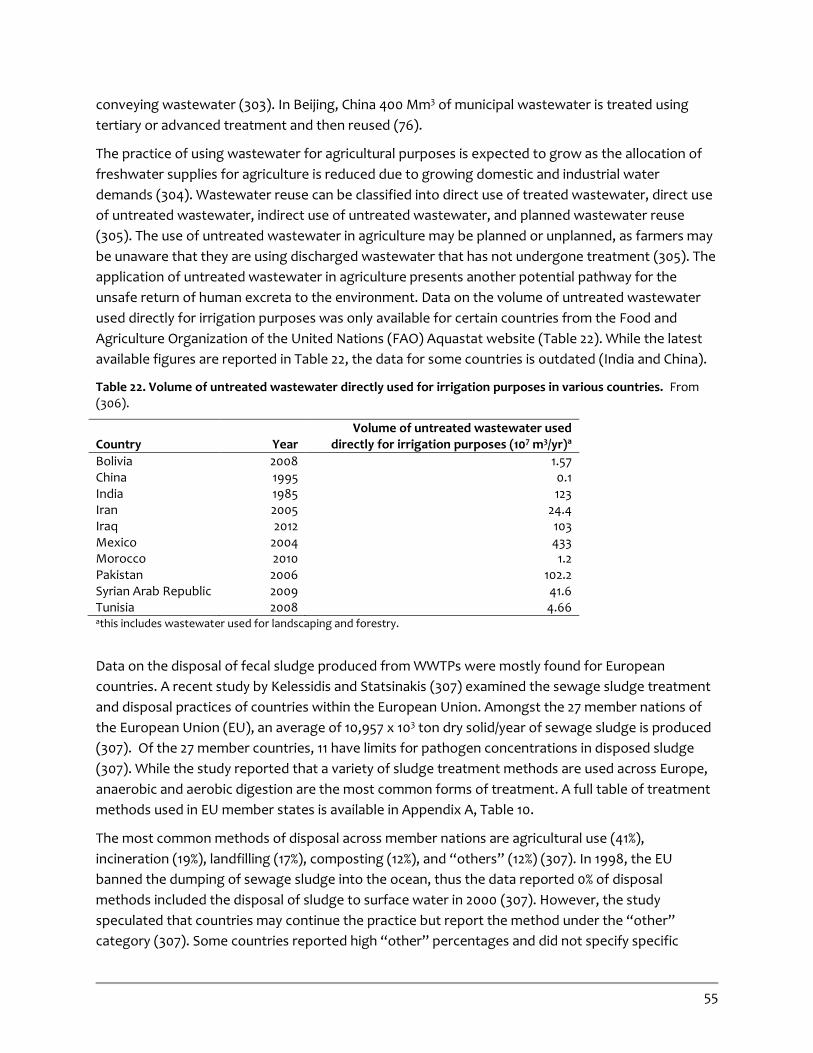
55
conveying wastewater (303). In Beijing, China 400 Mm3 of municipal wastewater is treated using
tertiary or advanced treatment and then reused (76).
The practice of using wastewater for agricultural purposes is expected to grow as the allocation of
freshwater supplies for agriculture is reduced due to growing domestic and industrial water
demands (304). Wastewater reuse can be classified into direct use of treated wastewater, direct use
of untreated wastewater, indirect use of untreated wastewater, and planned wastewater reuse
(305). The use of untreated wastewater in agriculture may be planned or unplanned, as farmers may
be unaware that they are using discharged wastewater that has not undergone treatment (305). The
application of untreated wastewater in agriculture presents another potential pathway for the
unsafe return of human excreta to the environment. Data on the volume of untreated wastewater
used directly for irrigation purposes was only available for certain countries from the Food and
Agriculture Organization of the United Nations (FAO) Aquastat website (Table 22). While the latest
available figures are reported in Table 22, the data for some countries is outdated (India and China).
Table 22. Volume of untreated wastewater directly used for irrigation purposes in various countries. From (306).
Country Year Volume of untreated wastewater used
directly for irrigation purposes (107 m3/yr)a
Bolivia 2008 1.57 China 1995 0.1 India 1985 123 Iran 2005 24.4 Iraq 2012 103 Mexico 2004 433 Morocco 2010 1.2 Pakistan 2006 102.2 Syrian Arab Republic 2009 41.6 Tunisia 2008 4.66 athis includes wastewater used for landscaping and forestry.
Data on the disposal of fecal sludge produced from WWTPs were mostly found for European
countries. A recent study by Kelessidis and Statsinakis (307) examined the sewage sludge treatment
and disposal practices of countries within the European Union. Amongst the 27 member nations of
the European Union (EU), an average of 10,957 x 103 ton dry solid/year of sewage sludge is produced
(307). Of the 27 member countries, 11 have limits for pathogen concentrations in disposed sludge
(307). While the study reported that a variety of sludge treatment methods are used across Europe,
anaerobic and aerobic digestion are the most common forms of treatment. A full table of treatment
methods used in EU member states is available in Appendix A, Table 10.
The most common methods of disposal across member nations are agricultural use (41%),
incineration (19%), landfilling (17%), composting (12%), and “others” (12%) (307). In 1998, the EU
banned the dumping of sewage sludge into the ocean, thus the data reported 0% of disposal
methods included the disposal of sludge to surface water in 2000 (307). However, the study
speculated that countries may continue the practice but report the method under the “other”
category (307). Some countries reported high “other” percentages and did not specify specific
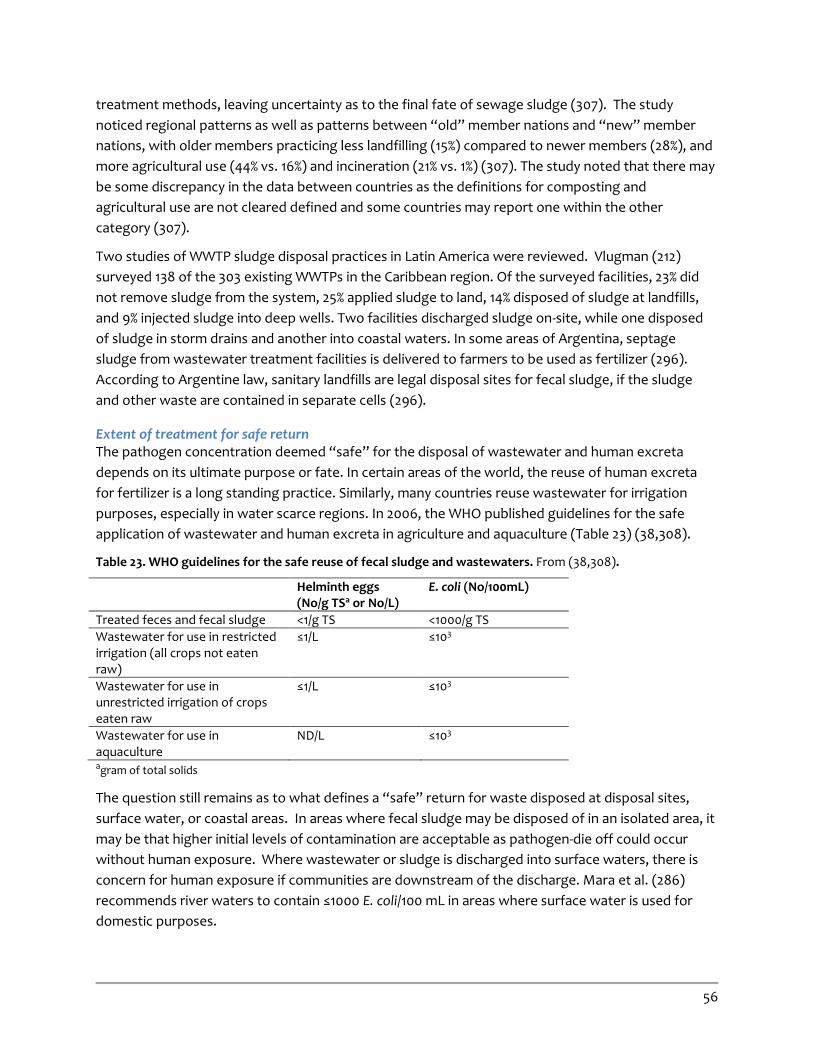
56
treatment methods, leaving uncertainty as to the final fate of sewage sludge (307). The study
noticed regional patterns as well as patterns between “old” member nations and “new” member
nations, with older members practicing less landfilling (15%) compared to newer members (28%), and
more agricultural use (44% vs. 16%) and incineration (21% vs. 1%) (307). The study noted that there may
be some discrepancy in the data between countries as the definitions for composting and
agricultural use are not cleared defined and some countries may report one within the other
category (307).
Two studies of WWTP sludge disposal practices in Latin America were reviewed. Vlugman (212)
surveyed 138 of the 303 existing WWTPs in the Caribbean region. Of the surveyed facilities, 23% did
not remove sludge from the system, 25% applied sludge to land, 14% disposed of sludge at landfills,
and 9% injected sludge into deep wells. Two facilities discharged sludge on-site, while one disposed
of sludge in storm drains and another into coastal waters. In some areas of Argentina, septage
sludge from wastewater treatment facilities is delivered to farmers to be used as fertilizer (296).
According to Argentine law, sanitary landfills are legal disposal sites for fecal sludge, if the sludge
and other waste are contained in separate cells (296).
Extent of treatment for safe return The pathogen concentration deemed “safe” for the disposal of wastewater and human excreta
depends on its ultimate purpose or fate. In certain areas of the world, the reuse of human excreta
for fertilizer is a long standing practice. Similarly, many countries reuse wastewater for irrigation
purposes, especially in water scarce regions. In 2006, the WHO published guidelines for the safe
application of wastewater and human excreta in agriculture and aquaculture (Table 23) (38,308).
Table 23. WHO guidelines for the safe reuse of fecal sludge and wastewaters. From (38,308).
Helminth eggs (No/g TSa or No/L)
E. coli (No/100mL)
Treated feces and fecal sludge <1/g TS <1000/g TS
Wastewater for use in restricted irrigation (all crops not eaten raw)
≤1/L ≤103
Wastewater for use in unrestricted irrigation of crops eaten raw
≤1/L ≤103
Wastewater for use in aquaculture
ND/L ≤103
agram of total solids
The question still remains as to what defines a “safe” return for waste disposed at disposal sites,
surface water, or coastal areas. In areas where fecal sludge may be disposed of in an isolated area, it
may be that higher initial levels of contamination are acceptable as pathogen-die off could occur
without human exposure. Where wastewater or sludge is discharged into surface waters, there is
concern for human exposure if communities are downstream of the discharge. Mara et al. (286)
recommends river waters to contain ≤1000 E. coli/100 mL in areas where surface water is used for
domestic purposes.

57
With regards to coastal waters, there is concern for public health in areas where people regularly
swim and in areas where seafood is harvested. The Council of the European Communities (309)
recommends bathing water to contain ≤2000 E. coli/100 mL and areas of commercial shellfisheries to
contain ≤10 E. coli/100 mL. However, the Aruba Protocol limits the concentration of E. coli in marine
waters to ≤200 E. coli/100 mL in areas with fragile marine life such as coral reefs, seagrasses, and
mangroves (310). According to Feachem et al. (29), bacterial and viral survival times decrease in
seawater, however protozoa and helminth survival times remain relatively the same.
In 1986, the US Environmental Protection Agency provided guidance for the development of
microbial standards for recreational and marine waters (311). For recreational waters, where there is
full body contact, the geometric mean of a statistically representative sample size (≥ 5 samples over
30 days) should not exceed 126 CFU E. coli/100 mL or 33 CFU Enterococci/mL. However, within the US,
individual states set their own water quality standards for recreational water.
6. Discussion
While latrines provide a relatively low-cost, low maintenance sanitation solution, this review found
numerous factors that should be considered to ensure latrines properly contain human excreta. Not
all latrines observed within the reviewed studies had a slab as part of their design, however the
presence of a slab has been shown to reduce E. coli contamination in the latrine vicinity (312). The
results and recommendations of the reviewed studies on pit latrine and groundwater quality were
varied. Four studies concluded pit latrines did not pose a risk to groundwater. In contrast, 17 studies
found a relationship between pit latrines and microbial contamination of groundwater.
Recommendations on reducing the impact of pit latrines on groundwater varied among studies
included in the review by Graham and Polizzotto (18). Some suggested pit liners, others
recommended elevating latrines, and others advised against constructing pit latrines in certain soil
types (18).
In areas with heavy rainfall and frequent flooding, additional considerations are needed to ensure
latrines are not compromised and fecal waste is safely contained. From the reviewed studies, it is
unclear the fraction of waste that is dislodged from pit latrines during a flooding event. UDDTs may
be a suitable alternative to pit latrines in flood prone areas, since they are constructed above ground
and have a water-tight chamber for excreta (46). However, in some regions the cost of elevated
toilets may be prohibitive for households (46). During flooding events, sanitation facilities may be
compromised and households could be left without appropriate sanitation alternatives, resulting in
open defecation and potentially leading to health outbreaks (313,314). Therefore choosing resilient
sanitation technologies and restoring impaired facilities quickly after a flood event are important to
reducing the risk of additional fecal contamination.
The percentage of households that emptied their latrine varied widely across reviewed studies, as
one study reported all households emptied their latrine (15) and another study reported only 1.9% of
surveyed households had emptied their latrine (64). The methods reported by households for pit
emptying were different amongst the reviewed studies. Access to services, technological limitations,
58
and cost were found to be barriers to households using hygienic latrine emptying methods.
Education about the role of pit latrines in containing human excreta may also serve to reduce unsafe
return of human excreta through household behaviors such as the ‘flooding out’ of latrines. As one
study highlighted the lack of knowledge about pit emptying services amongst households (41),
education and social marketing programs could help raise awareness of the availability of these
services.
The Philippines and South Africa implemented scheduled emptying services (78,315). However, the
variability of filling rates for on-site sanitation facilities results in different timelines for household
demand for emptying services (316). In the case of Durban, South Africa, the municipality found the
practice too resource intensive and in some areas, pit latrines were inappropriate due to soil and
groundwater depth (317). Therefore the municipality proposed an alternative sanitation technology,
a double vaulted UDDT that can be manually emptied after a year of residence time (317). In the case
of the Philippines, a scheduled emptying program has been more effective since most households
have septic tanks that are well designed. This enables a more accurate estimation of filling rates (78).
Reviewed studies on FSM were only from a handful of developing countries, mainly from West Africa
and Southeast Asia. The current JMP framework monitors household access to ‘improved’ sanitation
based on the type of sanitation facility and does not consider if the entire sanitation delivery chain is
in place beyond containment. However if the safe return of human excreta is added to the definition
of ‘improved sanitation’, it is estimated that 4 billion people lack access (318). There is a need to plan,
develop, and implement effective FSM chains in areas with on-site sanitation facilities.
The results of FSM case studies emphasize context specific analysis is key to developing an effective,
sustainable FSM program (78,169). Typically, sanitation services are fragmented, as interventions
focus on sanitation technology provision at the household level, but neglect emptying, transport,
and treatment needs (316). Data such as the volume of fecal waste generated and filling rates will
need to be estimated in order to plan adequate transport, treatment and disposal systems (169).
National governments may need to partner with the private sector to develop or refine the FSM
system to determine appropriate tariffs, locations of FSTP sites, and hours of operation (76). In areas
where hygienic services are non-existent, social franchising could be used to develop small emptying
businesses (94).
Septic systems Septic systems are widely used across developed and developing settings and in both urban and
rural areas. Properly functioning septic systems were found to provide effective on-site wastewater
treatment. Studies reported substantial pathogen reduction in the septic tank, supporting previous
comparisons of septic tank effluent with effluent of primary sedimentation tanks (188,319,320), and
reductions between 99-100% after effluent dispersal through 60 cm of unsaturated soil.
Discharging septic tank effluent into canals or drains was found a common practice in some
Southeast Asian cities. In Vientiane, the city government reportedly advocates discharging effluent
in drains because the high water table in the city makes drain fields less effective (47). The review
findings suggest that wastewater receives only partial treatment in the septic tank and that effluent
is hazardous without secondary treatment. Discharging effluent directly into drains can be
59
considered “safe” disposal when drains lead to sewers (104) and, ultimately, wastewater treatment,
but discharging effluent into drains leading to the environment can introduce high levels of bacteria,
viruses, and helminth eggs into soils, groundwater, or receiving surface waters, which may be used
for food production, drinking water, recreation, or other purposes.
A few studies in the review reported high prevalence of septic systems in unsuitable soils and high
probabilities of system failure as a result. In the US, where nearly a quarter of the population uses
septic systems, only a third of the land has soil suitable for septic system drain fields, and it is
unknown how many systems are poorly sited (117). Similarly, approximately a third the population of
Ireland uses septic tanks, and 39% of the land has high and very high susceptibility to groundwater
contamination by on-site wastewater treatment, as determined by the EPA Risk-Based Methodology
to Assist in the Regulation of Domestic Wastewater Treatment Systems (167). Installation of septic
systems in poor sites or soils increases risk of groundwater contamination, and prevalence of septic
systems on poor soils is largely unknown.
Groundwater contamination by septic systems is a major public health concern for areas where
groundwater serves as a source for the drinking water supply. Domestic wells in areas with a high
density of septic systems are more likely to pump septic system leachate (321), and well water
contaminated by septic systems is the most common cause of waterborne disease outbreaks in the
US (130). Septic systems and sewage were the most frequently reported sources of microbial
groundwater contamination in a recent systematic review (17); over half of the studies on US
groundwater contamination reported that septic systems and municipal sewage were potential
contamination sources. Among US state water quality agencies, septic systems are the second-most
frequently cited concern for groundwater contamination (322).
Septic systems were reported causes of groundwater and surface water contamination in several
included studies, although most of these studies did not use statistical methods to analyze a
correlation between septic systems and contamination. Failing systems were shown to introduce
higher groundwater contamination, as were wet and rainy conditions, consistent with previous
research (323). Few studies researched groundwater contamination by septic systems in developing
countries, and the vulnerability to groundwater and surface water in these settings is not well-
characterized in literature.
Different regulatory structures are available for monitoring installation and maintenance of septic
systems. Septic system regulations are established at the state level in the US and are largely
prescriptive, with varying standards for setback distance, maximum land slope, trench width, and
distance between seasonally high water tables and the bottom of the drain field (117,324). An
alternative regulatory approach is the performance-based approach, which evaluates use of
alternative treatment systems in areas that are not suitable for conventional systems
(325). Performance-based regulations take public and environmental health into account for system
evaluation and incorporate education, monitoring, and enforcement into the evaluation framework
(325). Using performance-based or hybrid prescriptive- and performance-based regulatory
frameworks connects septic system users with alternative solutions specific to their local conditions,
information, and incentives to maintain their systems.

60
Maintenance and desludging of septic systems were generally found to be infrequent across
developed and developing settings. A few studies reported median desludging intervals of 4-8 years,
but the range was wide, and many households either could not remember the last time their system
was desludged or had never desludged the tank. Desludging knowledge and awareness as well as
availability and cost of desludging services were common limiting factors but were highly regional
and not generalizable.
Only a few countries have established regulations for septic tank desludging. Until 2008, Malaysia
had a mandate for desludging septic systems at regular intervals; half of the country’s households
with septic tanks had scheduled desludging under federal law (163). After the mandate was lifted,
demand for desludging services dropped and many private service operators went out of business
(93). Under the Philippines’ Clean Water Act and National Sewerage and Septage Management
Programme (NSSMP), septage management is regulated, and some cities have enacted mandates
for regular desludging (163). NSSMP will contribute up to 40% of costs to implement sewerage
projects in local cities and municipalities (169). In San Fernando City, Philippines, trained plumbers
were organized to survey septic system performance and survey users on sanitation conditions and
interest in participating in the city’s fecal sludge management program (169). Dedicated oversight
can also ensure proper service delivery. For example, in Maharashtra, India, urban local bodies
(ULBs) are tasked with septic system maintenance, and while several institutions oversee ULBs, no
one institution monitors ULB service provision (163).
Sewerage Sewerage as a sanitation technology has been shown to reduce diarrheal incidence by 30% according
to a recent systematic review (326). Often, the high capital cost of sewers is cited as the major
concern as a sanitation solution. However, as the reviewed studies show, sewer connections alone
are not sufficient to ensure adequate separation of humans from fecal waste. If wastewater is simply
contained and transported away from one household, yet dumped in another household’s vicinity,
then the public health gains may be null across all households.
From the reviewed studies, it is uncertain what the extent and frequency of misconnections,
exfiltration, and CSOs are on a global scale. Only a few studies were retrieved on the degree of
misconnections and exfiltration. Most of the studies were from developed countries, therefore
estimates within low and lower-middle countries are unknown. However, some of the reviewed
studies demonstrated that large volumes of untreated wastewater are discharged to receiving
waters through illicit connections to stormwater drains. Since combined sewers are only used in
certain countries, it is not surprising that most reviewed studies were from developed countries.
Misconnections may result in untreated sewage being discharged in surface water that may have
direct health implications. The investigation of a recent outbreak of Cryptosporidium in Sweden
identified misconnections or sewage overflow as potential sources of contaminated wastewater that
was discharged into receiving waters used for drinking water (327). Visual inspection, dye testing,
smoke testing, distributed temperature sensing, infrared thermography, and water quality
monitoring are methods that have been developed to detect misconnections and illegal connections
61
(328). However some of these methods may require highly trained personnel or advanced
equipment that may not be appropriate for all settings.
Only a few of the studies on CSOs and SSOs quantified the frequency of events, however the results
demonstrated overflows usually result in a high load of viruses, bacteria, and protozoa on receiving
waters. A recent study on health outcomes and CSOs found an association between ER visits for
gastrointestinal illness and heavy rainfall in areas with CSO outfalls to a water source used for
drinking water (329). Different interventions such as storage, sewer rehabilitation, sewer separation,
inflow reduction, disinfection, and constructed wetlands have been implemented in various areas to
reduce the impact of CSOs on receiving waters (259,330–332).
The results of reviewed studies indicate high percentages of wastewater are discharged untreated
into surface water bodies and leached into the ground. This Although Malik et al. reported on the
percentage of wastewater treated in 107 countries, they found little data available on the level of
wastewater treatment by country (271). Similarly, this review found only some reports and studies
contained descriptions of treatment processes and usually only for developed countries at the
national level and for a handful of developing countries but only at the city or regional level.
Therefore it is difficult to determine on a global scale how much wastewater is treated using primary,
secondary, and tertiary treatment. Even in cases where wastewater is treated, the results of
reviewed studies reveal treatment facilities do not always operate effectively. Existing WWTP were
often reported to be operating over or under their design capacity, which can negatively impact
treatment processes.
In reviewing the effectiveness of different treatment processes, most efficiencies are reported in log
reductions or percent removals. Log-reductions or percent removals do not reflect the final
concentration of pathogens present in the effluent. In cases where waste streams contain high
concentrations of pathogens, even 2-4 log reductions may not result in a final effluent that would
qualify as a “safe” return of human excreta. A 2007 study estimated the raw wastewater
concentration threshold for various pathogens that would result in an acceptable limit of 1 in 10,000
annual risk of infection (37). Assuming a 5 log reduction in pathogens based on conventional
wastewater treatment methods, the study calculated raw concentrations of pathogens in
wastewater would need to be between 0.022 to 191 organisms/L to meet the acceptable risk limit. As
this review has shown, most raw wastewater concentrations are well above this range (37).
Pathogens with a low infectious dose, that are resistant to treatment, and have the ability to persist
in the environment pose unique challenges to wastewater treatment, and merit particular
consideration in public health implications for downstream users.
The findings of this review have limitations. While the search for literature was strategic and
extensive, it was not conducted systematically, and relevant articles from peer-reviewed and grey
literature may not have been included in the review. The literature gaps identified in the review are
indicative of readily accessible literature, but cannot fully characterize available literature. Only
articles published in English and a handful of French studies were included in the review, therefore
there may be additional relevant studies published in other languages. Additionally, assessment of
study quality was not possible in the review timeframe, so study findings reported in the review are

62
subject to varying degrees of bias. Few studies described household sanitation practices, fecal
sludge management, and wastewater treatment, and study results may not be generalizable to
other settings. Furthermore, many of these studies were cross-sectional or observational and
gathered data during one time period, so results may not fully represent current waste management
in the described areas. For these reasons, interpretations of individual study results were limited
within the review analysis, and the review conclusions drew more heavily from emergent findings
across multiple studies.
7. Conclusions
Latrines and septic systems are infrequently emptied across developed and developing areas.
Full latrines are “flooded out” in some regions, releasing excreta directly into the environment.
In other areas pits are buried once they become full which limits human exposure to excreta.
Unlined pits, damaged latrines, and latrines in flood-prone areas pose contamination risks for
groundwater. Methods for pit latrine emptying vary by setting, although manual emptying is a
common practice in many regions.
Contamination of groundwater by latrines and septic systems has been reported in many
settings. Areas with a high density of latrines and/or septic systems have a higher probability of
groundwater contamination, although vulnerability to contamination is dependent on a number
of geological and climatic factors, such as soil type and rainfall.
While many studies reported volumes of fecal sludge collected and transported in major cities,
the disposal practices were underreported. Some cities reportedly dispose of sludge in the
ocean, and others have no designated disposal sites.
There are few estimates on frequency of sewerage misconnections, extent of exfiltration, and
frequency of combined sewer overflows.
The percentage of wastewater receiving treatment is available at the country level, but the
amount of wastewater receiving primary, secondary, and tertiary treatment is largely unknown.
The efficiency of wastewater treatment processes often focus on log reductions rather than final
pathogen concentration, therefore treated effluent discharged to water bodies may still be an
‘unsafe’ return of excreta into the environment.
63
8. References
1. WHO, UNICEF. The Sanitation and Drinking Water Ladders [Internet]. 2015 [cited 2015 Mar 23]. Available from: http://www.wssinfo.org/definitions-methods/watsan-ladder/
2. Esrey S a, Potash JB, Roberts L, Shiff C. Effects of improved water supply and sanitation on ascariasis, diarrhoea, drcunculiasis, hookworm infection, schistosomiasis, and trachoma. Bull World Health Organ. 1991;69(5):609–21.
3. Fewtrell L, Kaufmann R, Kay D, Enanoria W, Haller L, Colford J. Water, sanitation, and hygiene interventions to reduce diarrhoea in less developed countries: a systematic review and meta-analysis. Lancet. 2005;5(1):42–52.
4. Ziegelbauer K, Speich B, Mäusezahl D, Bos R, Keiser J, Utzinger J. Effect of sanitation on soil-transmitted helminth infection: Systematic review and meta-analysis. PLoS Med. 2012;9(1).
5. Peal A, Evans B, Blackett I, Hawkins P, Heymans C. Fecal sludge management (FSM): analytical tools for assessing FSM in cities. Water, Sanit Hyg Dev. 2014;4(3):1–13.
6. U.S. Environmental Protection Agency. Decentralized Wastewater Treatment Systems: A Program Strategy. 2005.
7. Montangero A, Strauss M. Fecal Sludge Treatment. 2004.
8. Bassan M, Mbeguere M, Tchonda T, Zabsonre F, Strande L. Delivering Water, Sanitation and Hygiene Services in an Uncertain Environment-Characterization of Faecal Sludge During Dry and Rainy Seasons in Ouagadougou, Burkina Faso. 36th WEDC Int Conf kenya. 2013;3(2):216–21.
9. Opel A, Bashar MK. Inefficient technology or misperceived demand: The failure of vacutug-based pit-emptying services in Bangladesh. Waterlines. 2013;32(3):213–20.
10. Cofie O, Kone D, Rothenberger S, Moser D, Zubruegg C. Co-composting of faecal sludge and organic solid waste for agriculture: Process dynamics. Water Res [Internet]. Elsevier Ltd; 2009;43(18):4665–75. Available from: http://dx.doi.org/10.1016/j.watres.2009.07.021
11. Vodounhessi A. Financial and institutional challenges to make fecal sludge management integrated part of ecosan approach in West Africa. Case study of Kumasi, Ghana. UNESCO-IHE Institute for Water Education; 2006.
12. Fernandes AM, Kirshen P, Vogel RM. Optimal Siting of Regional Fecal Sludge Treatment Facilities: St. Elizabeth, Jamaica. J Water Resour Plan Manag. 2008;134(1):55–63.
13. (HPCIDBC) HPC for ID of the BC. Status and Strategy for Faecal Sludge Management in the Kathmandu Valley. Kathmandu, Nepal; 2011.
64
14. Seck A, Gold M, Niang S, Mbéguéré M, Diop C, Strande L. Faecal sludge drying beds: increasing drying rates for fuel resource recovery in Sub-Saharan Africa. J Water, Sanit Hyg Dev [Internet]. 2015;5(1):72. Available from: http://www.iwaponline.com/washdev/005/washdev0050072.htm
15. Bill and Melinda Gates Foundation. Landscape Analysis & Business Model Assessment in Fecal Sludge Management: Extraction & Transportation Models in Africa- Senegal. Bill and Melinda Gates Foundation. 2011.
16. WHO, UNICEF. Progress on Drinking Water and Sanitation: 2012 Update [Internet]. Update. 2012. Available from: http://www.wssinfo.org/fileadmin/user_upload/resources/JMP-report-2012-en.pdf
17. Hynds PD, Thomas MK, Pintar KDM. Contamination of Groundwater Systems in the US and Canada by Enteric Pathogens, 1990–2013: A Review and Pooled-Analysis. PLoS One [Internet]. 2014;9(5):e93301. Available from: http://dx.plos.org/10.1371/journal.pone.0093301
18. Graham JP, Polizzotto ML. Pit latrines and their impacts on groundwater quality: A systematic review. Environ Health Perspect. 2013;121(5):521–30.
19. Von Münch E, Mayumbelo KMK. Methodology to compare costs of sanitation options for low-income peri-urban areas in Lusaka, Zambia. Water SA. 2007;33(5):593–602.
20. Thye YP, Templeton MR, Ali M. A Critical Review of Technologies for Pit Latrine Emptying in Developing Countries. Crit Rev Environ Sci Technol. 2011;41(20):1793–819.
21. Boot NLD, Scott RE. Faecal sludge in Accra, Ghana: Problems of urban provision. Water Sci Technol. 2009;60(3):623–31.
22. Van Vuuren L. Back to basics: Research looks down the pit. Water Wheel. 2008;7(5 SUPPL.):10–3.
23. Bongi S, Morel A. Understanding small scale providers of sanitation services: A case study of Kibera. Water Sanit Progr F Note [Internet]. 2005;2013(6 May). Available from: http://www.wsp.org/sites/wsp.org/files/publications/
24. Kulabako NR, Roger T. Characterization of Peri-Urban Anthropogenic Pollution in Kampala , Uganda. 30th WEDC International Conference. Vientiane, Lao PDR; 2004. p. 474–82.
25. Dunk MJ, McMath SM, Arikans J. A new management approach for the remediation of polluted surface water outfalls to improve river water quality. Water Environ J. 2008;22(1):32–41.
26. Gokhale S, Graham J a. A new development in locating leaks in sanitary sewers. Tunn Undergr Sp Technol. 2004;19(1):85–96.
65
27. Passerat J, Ouattara NK, Mouchel JM, Vincent Rocher, Servais P. Impact of an intense combined sewer overflow event on the microbiological water quality of the Seine River. Water Res [Internet]. Elsevier Ltd; 2011;45(2):893–903. Available from: http://dx.doi.org/10.1016/j.watres.2010.09.024
28. Baum R, Luh J, Bartram J. Sanitation: A global estimate of sewerage connections without treatment and the resulting impact on MDG progress. Environ Sci Technol. 2013;47(4):1994–2000.
29. Feachem RG, Bradley DJ, Garelick H, Mara DD. Sanitation and disease: health aspects of excreta and wastewater management [Internet]. John Wiley & Sons; 1983. Available from: http://go.worldbank.org/ZS7F3M9XG1
30. Ramakrishna BS. The Normal Bacterial Flora of the Human Intestine and Its Regulation. J Clin Gastroenterol. 2007;41(Supplement 1):S2–6.
31. Strauss M, Larmie S a., Heinss U. Treatment of sludges from on-site sanitation - Low-cost options. Water Science and Technology. 1997. p. 129–36.
32. Yen-Phi VT, Rechenburg A, Vinneras B, Clemens J, Kistemann T. Pathogens in septage in Vietnam. Sci Total Environ [Internet]. Elsevier B.V.; 2010;408(9):2050–3. Available from: http://dx.doi.org/10.1016/j.scitotenv.2010.01.030
33. Jiménez B, Mara D, Carr R, Brissaud F. Wastewater treatment for pathogen removal and nutrient conservation: Suitable systems for use in developing countries. In: Drechsel P, Scott CA, Raschid-Sally L, Redwood M, Bahri A, editors. Wastewater Irrigation and Health: Assessing and Mitigation Risk in Low Income Countries. Sterling, VA: Earthscan and IDRC; 2010.
34. Strauss M, Larmie S a., Helnss U, Montangero a. Treating faecal sludges in ponds. Water Sci Technol. 2000;42(10-11):283–90.
35. Lucena F, Méndez X, Morón a., Calderón E, Campos C, Guerrero a., et al. Occurrence and densities of bacteriophages proposed as indicators and bacterial indicators in river waters from Europe and South America. J Appl Microbiol. 2003;94(5):808–15.
36. Torrella F, López JP, Banks CJ. Survival of indicators of bacterial and viral contamination in wastewater subjected to low temperatures and freezing: Application to cold climate waste stabilisation ponds. Water Sci Technol. 2003;48(2):105–12.
37. Crockett CS. The Role of Wastewater Water Supplies Emerging Treatment Against in Protecting Pathogens. Water Environ Res Spec Issue Pathog. 2007;79(3):221–32.
38. World Health Organization. WHO Guidelines for the safe use of wastewater, excreta and greywater, vol 4. Excreta and greywater use in agriculture. Geneva, Switzerland; 2006.
66
39. Dzwairo B, Hoko Z, Love D, Guzha E. Assessment of the impacts of pit latrines on groundwater quality in rural areas: A case study from Marondera district, Zimbabwe. Phys Chem Earth. 2006;31(15-16):779–88.
40. Jenkins MW, Cumming O, Scott B, Cairncross S. Beyond “improved” towards “safe and sustainable” urban sanitation: assessing the design, management and functionality of sanitation in poor communities of Dar es Salaam, Tanzania. J Water, Sanit Hyg Dev [Internet]. 2014;4(1):131. Available from: http://www.iwaponline.com/washdev/004/washdev0040131.htm
41. Grimason a M, Davison K, Tembo KC, Jabu GC, Jackson MH. Problems associated with the use of pit latrines in Blantyre, Republic of Malawi. J R Soc Promot Health. 2000;120(3):175–82.
42. Shimi AC, Parvin GA, Biswas C, Shaw R. Impact and adaptation to flood: A focus on water supply, sanitation and health problems of rural community in Bangladesh. Disaster Prev Manag. 2010;19(3):298–313.
43. Kolsky P. Storm Drainage: An Engineering Guide to the Low-cost Evaluation of System Performance. Intermediate Technology Publications; 1998.
44. Hoque B, Huttly S, Aziz K, Hasan Z, Patwary M. Effects Of Floods On the Use and Cindition of Pit Latrines in Rural Bangladesh. Disasters. 1989;13(4):315–21.
45. Denslow S a, Edwards J, Horney J, Peña R, Wurzelmann D, Morgan D. Improvements to water purification and sanitation infrastructure may reduce the diarrheal burden in a marginalized and flood prone population in remote Nicaragua. BMC Int Health Hum Rights [Internet]. BioMed Central Ltd; 2010;10(1):30. Available from: http://www.biomedcentral.com/1472-698X/10/30
46. Uddin SM, Ronteltap M, van Lier JB. Assessment of urine diverting dehydrating toilets as a flood-resilient and affordable sanitation technology in the context of Bangladesh. J Water, Sanit Hyg Dev [Internet]. 2013;3(2):87. Available from: http://www.iwaponline.com/washdev/003/washdev0030087.htm
47. Baetings E, O’Leary D. Rapid Assessment of Household Sanitation Services Vientiane, Lao PDR. 2010.
48. Nsubuga FB, Kansiime F, Okot-Okumu J. Pollution of protected springs in relation to high and low density settlements in Kampala - Uganda. Phys Chem Earth. 2004;29(15-18 SPEC.ISS.):1153–9.
49. Jenkins M, Cumming O, Cairncross S. Pit Latrine Emptying Behavior and Demand for Sanitation Services in Dar Es Salaam, Tanzania. Int J Environ Res Public Health [Internet]. 2015;12(3):2588–611. Available from: http://www.mdpi.com/1660-4601/12/3/2588/
50. Knappett PSK, Escamilla V, Layton A, McKay LD, Emch M, Williams DE, et al. Impact of population and latrines on fecal contamination of ponds in rural Bangladesh. Sci Total Environ
67
[Internet]. Elsevier B.V.; 2011;409(17):3174–82. Available from: http://dx.doi.org/10.1016/j.scitotenv.2011.04.043
51. Verheyen J, Timmen-Wego M, Laudien R, Boussaad I, Sen S, Koc A, et al. Detection of adenoviruses and rotaviruses in drinking water sources used in rural areas of benin, west africa. Appl Environ Microbiol. 2009;75(9):2798–801.
52. Lewis WJ, Foster SSD, Drasar BS. The Risk of Groundwater Pollution by On-Site Sanitation in Developing Countries: A Literature Review. 1982.
53. Zingoni E, Love D, Magadza C, Moyce W, Musiwa K. Effects of a semi-formal urban settlement on groundwater quality. Phys Chem Earth. 2005;30(11-16):680–8.
54. Dillon P. Groundwater pollution by sanitation on tropical islands. 1997;33.
55. Nichols DS, Prettyman D, Gross M. Movement of bacteria and nutrients from pit latrines in the boundary waters canoe area wilderness. Water Air Soil Pollut. 1983;20(2):171–80.
56. Chaggu E, Mashauri D, Van Buuren J, Sanders W, Lettinga G. Excreta disposal in Dar-es-Salaam. Environ Manage. 2002;30(5):609–20.
57. Katukiza a. Y, Ronteltap M, Oleja a., Niwagaba CB, Kansiime F, Lens PNL. Selection of sustainable sanitation technologies for urban slums - A case of Bwaise III in Kampala, Uganda. Sci Total Environ [Internet]. Elsevier B.V.; 2010;409(1):52–62. Available from: http://dx.doi.org/10.1016/j.scitotenv.2010.09.032
58. Mbuligwe SE, Kaseva ME. Pollution and self-cleansing of an urban river in a developing country: A case study in Dar es Salaam, Tanzania. Environ Manage. 2005;36(2):328–42.
59. Ahmed K, Khandkar Z, Lawrence A, Macdonald D, Islam M. Appendix A: An Investiagation of the impact ofon-site sanitation on the quality of groundwater supplies in two peri-urban areas of Dhaka, Bangladesh. In: Assessing Risk to Groundwater from On-site Sanitation: Scientific Review and Case Studies. Kenworth, UK; 2002.
60. Howard G, Pedley S, Barrett M, Nalubega M, Johal K. Risk factors contributing to microbiological contamination of shallow groundwater in Kampala, Uganda. Water Res. 2003;37(14):3421–9.
61. Tandia a. a., Diop ES, Gaye CB. Pollution par les nitrates des nappes phreatiques sous environnement semi-urbain non assaini: Exemple de la nappe de Yeumbeul, Senegal. J African Earth Sci. 1999;29(4):809–22.
62. Wright J a., Cronin A, Okotto-Okotto J, Yang H, Pedley S, Gundry SW. A spatial analysis of pit latrine density and groundwater source contamination. Environ Monit Assess. 2013;185(5):4261–72.
63. Cave B, Kolsky P. Groundwater, Latrines and Health. 1999;(163):30.
68
64. Appiah-Effah E, Nyarko KB, Gyasi SF, Awuah E. Faecal sludge management in low income areas: a case study of three districts in the Ashanti region of Ghana. J Water, Sanit Hyg Dev [Internet]. 2014;4(2):189. Available from: http://www.iwaponline.com/washdev/004/washdev0040189.htm
65. Chaggu EJ, Sanders W, Lettinga G. Demonstration of anaerobic stabilization of black water in accumulation systems under tropical conditions. Bioresour Technol. 2007;98(16):3090–7.
66. Still D a. After the Pit Latrine is full... What then? Effective Options for Pit Latrine Management. Bienn Conf Water Inst South Africa. 2002;(May):10.
67. Adubofour K, Obiri-Danso K, Quansah C. Sanitation survey of two urban slum Muslim communities in the Kumasi metropolis, Ghana. Environ Urban [Internet]. 2012;25(1):189–207. Available from: <Go to ISI>://WOS:000317237900013\nhttp://eau.sagepub.com/content/25/1/189.full.pdf
68. Isunju JB, Etajak S, Mwalwega B, Kimwaga R, Atekyereza P, Bazeyo W, et al. Financing of sanitation services in the slums of Kampala and Dar es Salaam. Health (Irvine Calif) [Internet]. 2013;05(04):783–91. Available from: http://www.scirp.org/journal/PaperDownload.aspx?DOI=10.4236/health.2013.54104
69. Murungi C, van Dijk MP. Emptying, Transportation and Disposal of feacal sludge in informal settlements of Kampala Uganda: The economics of sanitation. Habitat Int [Internet]. Elsevier Ltd; 2014;42:69–75. Available from: http://dx.doi.org/10.1016/j.habitatint.2013.10.011
70. DGAEUE. Enquête nationale sur l’accès des ménages aux ouvrages d'assainissement familial 2010. Ouagadougou, Burkina Faso; 2011.
71. Kariuki M, Mbuvi J. Water and Environmental Sanitation Needs of Kibera: A Rapid Needs Assessment. Field Note. Nairobi; 1997.
72. Bolomey S. Amélioration de la gestion de boues de vidange par le renforcement de secteur privé local: Enquête socio-économique sur la gestion des boues de vidange dans la Commune VI du District de Bamako. Dübendorf, Switzerland; 2003.
73. Kassa M’Voubou F. Evaluation de la gestion communautaire des boues de vidange dans la Commune d’Arrondissement de Sahm-Notaire. Ville de Guédiawaye- Région de Dakar-Sénégal. Ecole Inter-états d’Ingénieurs de l’Equipement Rural/Ecole Polytechnique Fédérale de Lausanne. 2004.
74. Mbéguéré M, Gning JB, Dodane PH, Koné D. Socio-economic profile and profitability of faecal sludge emptying companies. Resour Conserv Recycl. 2010;54(12):1288–95.
75. Roma E, Philp K, Buckley C, Xulu S, Scott D. User perceptions of urine diversion dehydration toilets: Experiences from a cross-sectional study in eThekwini municipality. Water SA. 2013;39(2):305–11.
69
76. Murray A, Mekala GD, Chen X. Evolving policies and the roles of public and private stakeholders in wastewater and faecal-sludge management in India, China and Ghana. Water Int. 2011;36(4):491–504.
77. Jeuland M, Koné D, Strauss M. Private Sector Management of Fecal Sludge : A Model for the Future ? Focus on an innovative planning experience in Bamako , Mali. Eawag. 2004.
78. Peal A, Evans B, Blackett I, Hawkins P. Fecal Sludge Management : A Comparative Analysis of 12 cities. J Water, Sanit Hyg Dev. 2014;4(4):563–75.
79. Mills F. Assessment of Sludge Accumulation and Pit Filling Rates in Indonesia. Jakarta, Indonesia; 2013.
80. Ronteltap M, Khadka R, Sinnathurai AR, Maessen S. Integration of human excreta management and solid waste management in practice. Desalination [Internet]. Elsevier B.V.; 2009;248(1-3):369–76. Available from: http://dx.doi.org/10.1016/j.desal.2008.05.077
81. Surinkul N, Koottatep T. Advanced Sanitation Planning Tool with Health Risk Assessment: Case Study of a Peri-Urban Community in Thailand. Hum Ecol Risk Assess An Int J. 2009;15(5):1064–77.
82. Murray A, Drechsel P. Why do some wastewater treatment facilities work when the majority fail? Case study from the sanitation sector in Ghana. Waterlines. 2011;30(2):135–49.
83. Vollaard AM, Ali S, Smet J, Asten H van, Widjaja S, Visser LG, et al. A Survey of the supply and bacteriologic quality of drinking water and sanitation in Jakarta, Indonesia. Southeast Asian J Trop Med Public Health. 2005;36(6).
84. Oyoo R, Leemans R, Mol a. PJ. Future projections of urban waste flows aand their impacts in African metropolises cities. Int J Environ Res. 2011;5(3):705–24.
85. Montangero A, Koné D, Strauss M. Planning towards improved excreta management. 5th IWA Conference on Small Water and Wastewater Treatment Systems. Istanbul, Turkey; 2002. p. 24–6.
86. Owusu-Bennoah, E. Visker C. Organic wastes hijacked. ILEIA Newsl. 1994;10:12–3.
87. Cofie OO, Kranjac-Berisavljevic G, Drechsel P. The use of human waste for peri-urban agriculture in Northern Ghana. Renew Agric Food Syst. 2005;20(02):73–80.
88. Phuc PD, Konradsen F, Phuong PT, Cam PD, Dalsgaard A. Practice of using human excreta as fertilizer and implications for health in Nghean province, Vietnam. Southeast Asian J Trop Med Public Health. 2006;37(1):222–9.
89. Boot NLD. The use of transfer stations for faecal sludge management in Accra, Ghana. Waterlines. 2008;27(1):71–81.

70
90. Diener S, Semiyaga S, Niwagaba CB, Muspratt AM, Gning JB, Mbéguéré M, et al. A value proposition: Resource recovery from faecal sludge - Can it be the driver for improved sanitation? Resour Conserv Recycl [Internet]. Elsevier B.V.; 2014;88:32–8. Available from: http://dx.doi.org/10.1016/j.resconrec.2014.04.005
91. Collignon B. Les entreprises de vidange mécanique des systèmes d’assainissement autonome dans les grandes villes africaines. 2002.
92. Bereziat E. The market for mechanical pit-emptying in Dakar & the realities of engaging entrepreneurs. United Kingdom; 2009.
93. Kone D, Chowdhry S, Officer SP, Foundation MG, North FA. Profitability of private fecal sludge emptying businesses in Africa and Asia. In: Cross P, Coombes Y, editors. Sanitation and Hygiene in Africa:Where do we stand? London: IWA Publishing; 2014. p. 77–88.
94. Wall K, Ive O, Bhagwan J, Kirwan F, Birkholtz W, Lupuwana N, et al. Demonstrating the effectiveness of social franchising principles: the emptying of household ventilated improved pits: a case study from South Africa. J Water, Sanit Hyg Dev [Internet]. 2013;3(4):623. Available from: http://www.iwaponline.com/washdev/003/washdev0030623.htm
95. Massoud M a., Tarhini A, Nasr J a. Decentralized approaches to wastewater treatment and management: Applicability in developing countries. J Environ Manage [Internet]. Elsevier Ltd; 2009;90(1):652–9. Available from: http://dx.doi.org/10.1016/j.jenvman.2008.07.001
96. (UNEP) UNEP. International Source Book on Environmentally Sound Technologies for Wastewater and Stormwater Management [Internet]. 2000 [cited 2015 Aug 4]. Available from: http://www.unep.or.jp/Ietc/Publications/TechPublications/TechPub-15/3-3AsiaPacific/3-1-2.asp
97. Ahmed W, Neller R, Katouli M. Evidence of septic system failure determined by a bacterial biochemical fingerprinting method. J Appl Microbiol. 2005;98(4):910–20.
98. Zawahri N, Sowers J, Weinthal E. The politics of assessment: Water and sanitation MDGs in the Middle East. Dev Change. 2011;42(5):1153–78.
99. Tsagarakis KP, Mara DD, Angelakis a N. Wastewater management in Greece: experience and lessons for developing countries. Water Sci Technol. 2001;44(6):163–72.
100. (CSO) CSO. Census 2011, Principal Demographic Results. Dublin; 2011.
101. Gunn IW. Engineering management of wastewaters from urban and rural areas. New Zeal Sanit. 1974;(September):61–95.
102. Burubai W, Akor AJ, Lilly MT, Ayawari DT. An Evaluation of Septic Tank Performance in Bayelsa State , Nigeria. Agric Eng Int CIGR Ejournal. 2007;IX:1–9.
103. Geest S Van Der, Opareh O. Bulletin de l ’ APAD. 2002;24.

71
104. Andrews CT, Yñiguez CE, editors. Water in Asian Cities: Utilities’ Performance and Civil Society Views. Asian Development Bank; 2004.
105. Mbuligwe S. The need for integrating water and sani- tation provision in developing countries: a case of Dar es Salaam city in Tanzania, in managing water and waste in the new millenium. the challenges for developing areas. Midrand, Johannesburg, South Africa; 2000. p. 3A – 4.
106. Montangero A, Cau LN, Anh NV, Tuan VD, Nga PT, Belevi H. Optimising water and phosphorus management in the urban environmental sanitation system of Hanoi, Vietnam. Sci Total Environ. 2007;384(1-3):55–66.
107. Laquian AA. Beyond metropolis, the planning and governance of Asia’s mega-urban regions. Washington, D.C. and Baltimore; 2005.
108. Kouamé P, Dongo K, Nguyen-Viet H, Zurbrügg C, Lüthi C, Hattendorf J, et al. Ecohealth Approach to Urban Waste Management: Exposure to Environmental Pollutants and Health Risks in Yamoussoukro, Côte d’Ivoire. Int J Environ Res Public Health. 2014;11(10):10292–309.
109. Swann C. The Influence of Septic Systems at the Watershed Level. Urban Lake Manag. 2001;3(4):821–34.
110. DeWalle FB. Failure Analysis of Large Septic Tank Systems. J Environ Eng Div. 1981;107(1):229–40.
111. Butler D, Payne J. Septic Tanks: Problems and Practice. Build Environ. 1995;30(3):419–25.
112. (MOSDTF) MO-SSDTF. Reducing the Nutrient Impacts From On-Site Sewage Disposal Systems. 1999.
113. Heaney C, Wilson S, Wilson O, Cooper J, Bumpass N, Snipes M. Use of community-owned and -managed research to assess the vulnerability of water and sewer services in marginalized and underserved environmental justice communities. J Environ Health. 2011;74(1):8–17.
114. Conn KE, Habteselassie MY, Denene Blackwood A, Noble RT. Microbial water quality before and after the repair of a failing onsite wastewater treatment system adjacent to coastal waters. J Appl Microbiol. 2011;112(1):214–24.
115. Habteselassie MY, Kirs M, Conn KE, Blackwood a. D, Kelly G, Noble RT. Tracking microbial transport through four onsite wastewater treatment systems to receiving waters in eastern North Carolina. J Appl Microbiol. 2011;111(4):835–47.
116. Glasoe S, Tompkins J. Sanitary Surveys in Mason County. Puget Sound Notes. 1996;39:295.
117. U.S. Environmental Protection Agency. Onsite Wastewater Treatment Systems Manual. 2002.
118. He J, Dougherty M, Zellmer R, Martin G. Assessing the Status of Onsite Wastewater Treatment Systems in the Alabama Black Belt Soil Area. Environ Eng Sci. 2011;28(10):693–9.

72
119. Tumeo MA, Newland J. Survey of the Home Sewage Disposal Systems in Northeast Ohio. J Environ Health. 2009;72(2):17–22.
120. Reneau RB, Elder JH, Pettry DE, Weston CW. Influence of Soils on Bacterial Contamination of a Watershed from Septic Sources. J Environ Qual. 1975;4(2):249–52.
121. Dey A, Truax DD. Evaluation of on-site wastewater disposal systems in Mississippi coastal areas. Water Air Soil Pollut. 2012;223(5):2145–56.
122. Day RL, Zhu Y, Bruce S, Franklin A. An Examination of Failing Private Septic Systems in Pennsylvania [Internet]. 2008. Available from: http://www.rural.palegislature.us/septic_systems2008.pdf
123. Barry C, Byrne P, Campbell D, Campbell E, Cockerill C, Doody D, et al. Lough Melvin Catchment Management Plan. Campbell E, Foy B, editors. County Donegal: Northern Regional Fisheries Board; 2008. 252 p.
124. Moelants N, Dekort B, Smets I, Van Impe J. Towards An Optimal And Sustainable Performance Of Small Scale Wastewater Treatment Systems. Proceedings of the conference on Biofilm Systems VI. 2006. p. 77–86.
125. Moelants N, Janssen G, Smets I, Van Impe J. Field performance assessment of onsite individual wastewater treatment systems. Water Sci Technol. 2008;58(1):1–6.
126. Fink S. The Sustainability of Toilets in Hanoi, Vietnam. Int J Econ Dev. 2001;3(3).
127. Harder DS, Sajise a. JU, Galing EM. Willingness to pay for sanitation services in Dagupan City, Philippines. J Water, Sanit Hyg Dev [Internet]. 2013;3(2):165. Available from: http://www.iwaponline.com/washdev/003/washdev0030165.htm
128. Jiawkok S, J SP, Koottatep T. Evaluation of the Onsite Sanitation Systems and Faecal Sludge Management in Thailand. Int Symp Southeast Asian Water Environ. 2007;5:121–8.
129. Fujita M, Suzuki J, Sato D, Kuwahara Y, Yokoki H, Kayanne H. Anthropogenic impacts on water quality of the lagoonal coast of Fongafale Islet, Funafuti Atoll, Tuvalu. Sustain Sci. 2013;8(3):381–90.
130. Yates M V. Septic Tank Density and Ground-Water Contamination. Ground Water. 1985;23(5):586–91.
131. Arnscheidt J, Jordan P, Li S, McCormick S, McFaul R, McGrogan HJ, et al. Defining the sources of low-flow phosphorus transfers in complex catchments. Sci Total Environ. 2007;382(1):1–13.
132. Levett KJ, Vanderzalm JL, Page DW, Dillon PJ. Factors affecting the performance and risks to human health of on-site wastewater treatment systems. Water Sci Technol. 2010;62(7):1499–509.
73
133. Carroll S, Goonetilleke A. Assessment of high density of onsite wastewater treatment systems on a shallow groundwater coastal aquifer using PCA. Environmetrics. 2005;16(3):257–74.
134. Stewart LW, Reneau RB. Spatial and Temporal Variation of Fecalal Coliform Movement Surrounding Septic Tank-Soil Absorption Systems in Two Atlantic Coastal Plain Soils. J Environ Qual. 1981;10(4):528–31.
135. Close ME, Hodgson LR, Tod G. Field evaluation of fluorescent whitening agents and sodium tripolyphosphate as indicators of septic tank contamination in domestic wells. New Zeal J Mar Freshw Res. 1989;23(4):563–8.
136. Sinton LW. A groundwater quality survey of an unsewered, semi‐rural area. New Zeal J Mar Freshw Res. 1982;16(3-4):317–26.
137. Tuthill J, Miekle D, Alavanja M. Coliform bacteria and nitrate contamination of wells in major sils of Frederick, Maryland. J Environ Health. 1998;60(8):16–21.
138. Borchardt MA, Bertz PD, Spencer SK, Battigelli DA. Incidence of Enteric Viruses in Groundwater from Household Wells in Wisconsin. Appl Environ Microbiol. 2003;69(2):1172–80.
139. Arnade LJ. Seasonal Correlation of Well Contamination and Septic Tank Distance. Ground Water. 1999;920–3.
140. Hagedorn C, Hansen DT, Simonson GH. Survival and Movement of Fecal Indicator Bacteria in Soil under Conditions of Saturated Flow Limited information is available on the potential for ground water contamination from recharged sewage plant or septic tank effluents . Site ratings for septic ta. J Environ Qual. 1978;7(1):55–9.
141. Katz BG, Griffin DW, McMahon PB, Harden HS, Wade E, Hicks RW, et al. Fate of effluent-borne contaminants beneath septic tank drainfields overlying a Karst aquifer. J Environ Qual. 2010;39(4):1181–95.
142. Gondwe E, Mwanuzi FL, Mbwette TSA. Septic Tank-Soakpit Systems in Dar Es Salaam, Tanzania. J Environ Eng. 1997;(January):93–5.
143. Massone HE, Martinez DE, Cionchi JL, Bocanegra E. Suburban Areas in Developing Countries and Their Relationship to Groundwater Pollution: A Case Study of Mar del Plata, Argentina. Environ Manag [Internet]. 1998;22(2):245. Available from: http://libproxy.lib.unc.edu/login?url=http://search.proquest.com/docview/14479331?accountid=14244
144. McCoy EL, Hagedorn C. Quantitatively tracing bacterial transport in saturated soil systems. Water Air Soil Pollut. 1979;11:467–79.
145. Craun GF. Waterborne disease outbreaks in the United States. J Environ Health. 1979;41:259–65.
74
146. Melnick JL, Gerba CP. Viruses in water and soil. Public Heal Rev. 1980;9(3-4):28.
147. Paul JH, Rose JB, Brown J, Shinn E a., Miller S, Farrah SR. Viral tracer studies indicate contamination of marine waters by sewage disposal practices in Key Largo, Florida. Appl Environ Microbiol. 1995;61(6):2230–4.
148. Crane SR, Moore JA. Bacterial Pollution of Groundwater: A Review. Water Air Soil Pollut. 1984;22:67–83.
149. Lipp EK, Farrah S a., Rose JB. Assessment and impact of microbial fecal pollution and human enteric pathogens in a coastal community. Mar Pollut Bull. 2001;42(4):286–93.
150. Meeroff DE, Bloetscher F, Bocca T, Morin F. Evaluation of water quality impacts of on-site treatment and disposal systems on urban coastal waters. Water Air Soil Pollut. 2008;192(1-4):11–24.
151. Reay WG. Septic tank impacts on ground water quality and nearshore sediment nutrient flux. Ground Water. 2004;42(7):1079–89.
152. O’Luanaigh ND, Gill LW, Misstear BDR, Johnston PM. The attenuation of microorganisms in on-site wastewater effluent discharged into highly permeable subsoils. J Contam Hydrol [Internet]. Elsevier B.V.; 2012;142-143:126–39. Available from: http://dx.doi.org/10.1016/j.jconhyd.2011.12.003
153. Philip H, Maunoir S, Rambaud A, Philippi L. Septic Tank Sludges: Accumulation Rate and Biochemical Characteristics. Water Sci Technol. 1993;28(10):57–64.
154. Gray NF. The Influence of Sludge Accumulation Rate on Septic Tank Design. Environ Technol. 1995;16(8):795–800.
155. Brandes M. Accumulation characteristics sludge rate of septage septic tank and. J Water Pollut Control Fed. 2013;50(5):936–43.
156. U.S. Environmental Protection Agency. Do your Part — Be SepticSmart! A Homeowners’ Guide to Septic Systems. 2012.
157. Kinsley C, Crolla A, Joy D. Impact of Water Softeners on Septic Tanks Field Evaluation Study Final Report. 2006.
158. Harada H, Dong NT, Matsui S. A measure for provisional-and-urgent sanitary improvement in developing countries: Septic-tank performance improvement. Water Sci Technol. 2008;58(6):1305–11.
159. Babcock RW, Lamichhane KM, Cummings MJ, Cheong GH. Condition assessment survey of onsite sewage disposal systems (OSDSs) in Hawaii. Water Sci Technol [Internet]. 2014;70(6):1083. Available from: http://www.iwaponline.com/wst/07006/wst070061083.htm
75
160. Kaminsky J, Javernick-Will A. Contested Factors for Sustainability: Construction and Management of Household On-Site Wastewater Treatment Systems. J Constr Eng Manag [Internet]. 2013;139(12):-1. Available from: 10.1061/(ASCE)CO.1943-7862.0000757\nhttp://search.ebscohost.com/login.aspx?direct=true&db=bth&AN=92005121&lang=es&site=ehost-live
161. Penjor K, Yetsho T, Bond M. Sustainable Sanitation and Hygiene for All in Small Towns. Chukha Baseline Assessment Report. Bhutan; 2011.
162. Halcrow G, Yetsho T, Nguyen N, Tshering G. Developing behaviour change communication for improving faecal sludge management in Bhutan. J Water, Sanit Hyg Dev [Internet]. 2014;4(1):164. Available from: http://www.iwaponline.com/washdev/004/washdev0040164.htm
163. Murty JVR. Faecal Sludge and Sullage Management in Urban Maharashtra Faecal Sludge and Sullage Management in Urban Maharashtra. Ahmedabad, India; 2013.
164. Eawag/Sandec. Urban excreta management - situation, challenges, and promising solutions. Dakar, Senegal: 1st International Faecal Sludge Management Policy Symposium and Workshop; 2006.
165. Chowdry S, Kone DD. Business Analysis of Fecal Sludge Management: Emptying and Transportation Services in Africa and Asia. 2012.
166. Cimab. Baseline Analysis on Domestic Wastewater Management in the Wider Caribbean Region. La Habana; 2010.
167. Dubber D, Gill L. Application of On-Site Wastewater Treatment in Ireland and Perspectives on Its Sustainability. Sustainability. 2014;6(3):1623–42.
168. Nam NH, Visvanathan C, Jegatheesan V. Performance Evaluation of Septic Tanks as onsite Sanitation System. Southeast Asian Water Environ. 2009;3.
169. Robbins BD, Strande L, Doczi J. Opportunities in Fecal Sludge Management for Cities in Developing Countries: Experiences from the Philippines. Research Triangle Park, NC; 2012.
170. Tsuzuki Y, Koottatep T, Sinsupan T, Jiawkok S, Wongburana C, Wattanachira S, et al. A concept for planning and management of on-site and centralised municipal wastewater treatment systems, a case study in Bangkok, Thailand. I: Pollutant discharge indicators and pollutant removal efficiency functions. Water Sci Technol. 2013;67(9):1923–33.
171. Zhang K, Farahbakhsh K. Removal of native coliphages and coliform bacteria from municipal wastewater by various wastewater treatment processes: Implications to water reuse. Water Res. 2007;41(12):2816–24.
76
172. Higgins JJ, Heufelder G, Foss S. Removal efficiency of standard septic tank and leach trench septic systems for MS2 coliphage. Proc 10th Northwest On-Site Wastewater Treatment Short Course and Equipment Exhibition. Seattle, WA: University of Washington; 1999. p. 81–8.
173. Majumder N, Prakasam T, Suryaprakasam M. A critical study of septic tank performance in rural areas. Inst Eng. 1960;743–61.
174. Harrison RB, Turner NS, Hoyle J a, Krejsl J, Tone DD, Henry CL, et al. Treatment of Septic Effluent for Fecal Coliform and Nitrogen in Coarse-Textured Soils: Use of Soil-Only and Sand Filter Systems. 1999;205–15.
175. Charles KJ, Ashbolt NJ, Roser DJ, McGuinness R, Deere D a. Effluent quality from 200 on-site sewage systems: Design values for guidelines. Water Sci Technol. 2005;51(10):163–9.
176. Dong H-Y, Qiang Z-M, Wang W-D, Jin H. Evaluation of rural wastewater treatment processes in a county of eastern China. J Environ Monit. 2012;14(7):1906.
177. Brandes M. Characteristics effluents black of from and tanks water septic. J Water Pollut Control Fed. 1978;50(11):2547–59.
178. Viraraghavan T, Warnock RG. Treatment through soil of septic tank effluent. Proc Intern Confer Land for Waste Management. Ottawa, Canada; 1973.
179. Pang L, Close M, Goltz M, Sinton L, Davies H, Hall C, et al. Estimation of septic tank setback distances based on transport of E. coli and F-RNA phages. Environ Int. 2003;29(7):907–21.
180. Pang L, Close ME, Sinton LW. Protection zones of the major water supply springs in the Rotorua District. Technical Report No. CSC 96/7. 1996.
181. Pang L, Close ME, Sinton LW. Protection zones of the major water supply springs in the Rotorua District. Technical Report No. CSC 96/7. 1996.
182. Appling D, Habteselassie M, Radcliffe D, Bradshaw J. Preliminary Study on the Effect of Wastewater Storage in Septic Tank on E. coli Concentration in Summer. Water [Internet]. 2013;5(3):1141–51. Available from: http://www.mdpi.com/2073-4441/5/3/1141/
183. Paruch AM. Possible scenarios of environmental transport, occurrence and fate of helminth eggs in light weight aggregate wastewater treatment systems. Rev Environ Sci Biotechnol. 2010;9(1):51–8.
184. Rose JB, Gerba CP. Use of risk assessment for development of microbial standards. Water Sci Technol. 1991;24(2):29–34.
185. Navarro I, Jiménez B, Cifuentes E, Lucario S. Application of Helminth ova infection dose curve to estimate the risks associated with biosolid application on soil. J Water Health. 2009;7(1):31–44.

77
186. Keegan M, Kilroy K, Nolan D, Dubber D, Johnston PM, Misstear BDR, et al. Assessment of the impact of traditional septic tank soakaway systems on water quality in Ireland. Water Sci Technol [Internet]. 2014;70(4):634. Available from: http://www.iwaponline.com/wst/07004/wst070040634.htm
187. Van Cuyk S, Siegrist R, Logan a., Masson S, Fischer E, Figueroa L. Hydraulic and purification behaviors and their interactions during wastewater treatment in soil infiltration systems. Water Res. 2001;35(4):953–64.
188. Gill LW, O’Súlleabháin C, Misstear BDR, Johnston PJ. The treatment performance of different subsoils in Ireland receiving on-site wastewater effluent. J Environ Qual. 2007;36(6):1843–55.
189. Van Cuyk S, Siegrist R, Lowe K, Harvey RW. Vadose Zone Processes and Chemical Transport. J Environ Qual. 2004;33:316–29.
190. Reneau RB, Pettry DE. Movement of coliform bacteria from septic tank effluent through selected coastal plain soils of Virginia. J Environ Qual. 1975;4(1):41–4.
191. Nicosia L a, Rose JB, Stark L, Stewart MT. A field study of virus removal in septic tank drainfields. J Environ Qual. 2001;30(6):1933–9.
192. Oakley S, Greenwood WP, Lee M. Monitoring nitrogen and virus removal in the vadose zone with suction lysimeters. Proc 10th Northwest On-Site Wastewater Treatment Short Course and Equipment Exhibition. Seattle, WA: University of Washington; 1999. p. 211–32.
193. Magdoff FR, Keeney DR, Bouma J, Ziebell WA. Columns representing mound-type disposal systems for septic tank effluents: II Nutrient transformations and bacterial populations. J Environ Qual. 1974;3(3):228–34.
194. Bouma J, Converse JC, Magdoff FR. A mound system for disposal of septic tank effluent in shallow soils over creviced bedrock. Proceedings of the International Conference on Land for Waste Management. Ottawa, Canada: Agricultural Institute of Canada; 1974.
195. Ziebell WA, Anderson JL, Bouma J, McCoy EL. Fecal bacteria: Removal from sewage by soils. Winter meeting ASAE. Chicago, Illinois; 1975.
196. Stewart LW, Carlile BL, Cassel DK. An evaluation of alternative simulated treatments of septic tank effluent. J Environ Qual. 1979;8(3):397–403.
197. Butler RG, Orlob GT, McGauhey PH. Underground movement of bacterial and chemical pollutants. J Am Water Work Assoc. 1954;46(2):97–111.
198. Brown KW, Wolf HW, Donnelly KC, Slowey JF. The movement of fecal coliforms and coliphages below septic lines. J Environ Qual. 1979;8(1):121–5.
199. Aulenbach DB, Glavin TP, Romero Rojas JA. Protracted recharge of treated sewage into sand. Part I - Quality changes in vertical transport through the sand. Groundwater. 1974;12(3):161–9.
78
200. Anderson DL, Lewis AL, Sherman KM. Human enterovirus monitoring at onsite sewage disposal systems in Florida. Proc 6th Natl Symp on Small Sewage Systems. St. Joseph, MI: ASAE Publishing; 1991. p. 94–104.
201. Gilbert RS, Gerba CP, Rice RC, Bouwer H, Wallis C, Melnick J. Virus and bacteria removal from wastewater by land treatment. Appl Environ Microbiol. 1976;32:333–8.
202. Allen MJ, Morrison SM. Bacterial movement through fractured bedrock. Groundwater. 1973;11(2):6–10.
203. Edworthy KJ, Wilkinson WB, Young CP. The effect of the disposal of effluents and sewage sludge on groundwater quality in the chalk of the United Kingdom. Prog Water Technol. 1978;10(5/6):479–93.
204. Martin GN, Noonan MJ. Effects of domestic wastewater disposal by land irrigation on groundwater quality of the Central Canterbury Plains. Water and Soil Technical Publication. Wellington, New Zealand; 1977.
205. Dawes L, Goonetilleke A. An investigation into the role of site and soil characteristics in onsite sewage treatment. Environ Geol. 2003;44(4):467–77.
206. Cogger CG, Hajjar LM, Moe CL, Sobsey MD. Septic System Performance on a Coastal Barrier Island. J Environ Qual. 1988;17(3):401.
207. Tare V, Bokil SD. Wastewater Treatment by Soils: Role of Particle-Size Distribution. J Environ Qual. 1982;11(4):596–602.
208. Karathanasis a. D, Mueller TG, Boone B, Thompson YL. Effect of soil depth and texture on fecal bacteria removal from septic effluents. J Water Health. 2006;4(3):395–404.
209. Hagedorn C, Mc Coy EL, Rahe TM. The Potential for Ground Water Contamination from Septic Effluents. J Environ Qual [Internet]. 1981;10(1):1–8. Available from: https://www.agronomy.org/publications/jeq/abstracts/10/1/1
210. Scandura JE, Sobsey MD. Viral and Bacterial Contamination of Groundwater from On-Site Sewage Treatment Systems. Water Sci Technol. 1997;35(11-12):141–6.
211. Stoll U, Parameswaran K. Treatment and disposal of domestic sewage sludge and nightsoil sludge for Bangkok. Water Sci Technol. 1996;34(11):209–17.
212. Vlugman A. Assessment of Operational Status of Wastewater Treatment Plants in the Caribbean. 1992.
213. Heinss U, Larmie SA, Strauss M. Solids Separation and Pond Systems for the Treatment of Faecal Sludges in the Tropics. 1998.

79
214. Kone D. Making urban excreta and wastewater management contribute to cities ’ economic development : a paradigm shift. Water Policy. 2010;12:602–10.
215. Fernandez, R. G. Ingallinella, A. M. Sanguinetti GS, Ballan GE, Bortolotti V, Montangero A, Strauss M. Septage treatment in waste stabilization ponds. Proceedings, 9th International IWA Specialist Group Conference on Wetlands 27 September–1 October [Internet]. Avignon, France; 2004. Available from: www.sandec.ch/FaecalSludge/Documents/Settage%treatment WSP.pdf
216. Koottatep T, Surinkul N, Polprasert C, Kamal ASM, Koné D, Montangero A, et al. Treatment of septage in constructed wetlands in tropical climate: Lessons learnt from seven years of operation. Water Sci Technol. 2005;51(9):119–26.
217. Kengne IM, Akoa A, Kone D. Recovery of Biosolids from Constructed Wetlands Used for Faecal Sludge Dewatering in Tropical Regions. Environ Sci Technol. 2009;43(17):6816–21.
218. Ghermandi A, Bixio D, Traverso P, Cersosimo I, Thoeye C. The removal of pathogens in surface-flow constructed wetlands and its implications for water reuse. Water Sci Technol. 2007;56(3):207–16.
219. Cofie OO, Agbottah S, Strauss M, Esseku H, Montangero A, Awuah E, et al. Solid – liquid separation of faecal sludge using drying beds in Ghana : Implications for nutrient recycling in urban agriculture. Water Res. 2006;40:75–82.
220. Kone D, Cofie O, Zurbrugg C, Gallizzi K, Moser D, Drescher S, et al. Helminth eggs inactivation efficiency by faecal sludge dewatering and co-composting in tropical climates. Water Res. 2007;41:4397–402.
221. El Fels L, Ouhdouch Y, Hafidi M. Use of the co-composting time extract agar to evaluate the microbial community changes during the co-composting of activated sludge and date palm waste. Int J Recycl Org Waste Agric. 2015;
222. Khalil AI, Hassouna MS, Fawzi M. Changes in physical , chemical and microbial parameters during the composting of municipal sewage sludge. Water J Microbiol Biotechnol. 2011;27:2359–69.
223. Chien BT, Nga NH, Stenström T-A, Winblad U. Biological study on retention time of microorganisms in faecal materials in urine-diverting eco-san latrines in Vietnam. 1st International Conference on Ecological Sanitation, Nanning, People’s Republic of China, internet dialogue on ecological sanitation [Internet]. 2001. Available from: www.ias.unu.
224. Gantzer C, Gaspard P, Galvez L, Huyard A, Dumouthier, N. Schwartzbrod J. Monitoring of bacterial and parasitological contamination during various treatment of sludge. Water Res. 2001;35(16):3763–70.
225. Avery LM, Yongabi K, Tumwesige V, Strachan N, Goude PJ. Potential for Pathogen reduction in anaerobic digestion and biogas generation in Sub-Saharan Africa. Biomass and Bioenergy
80
[Internet]. Elsevier Ltd; 2014;70(0):112–24. Available from: http://dx.doi.org/10.1016/j.biombioe.2014.01.053
226. Ward R, McFeters G, Yeager J. Pathogens in sludge: Occurrence, inactivation and potential for regrowth. Sandia Rept DAND83-0557, TTC-0428, UC- 71. Albuquerque, NM; 1984.
227. Straub TM, Pepper IL, Gerba CP. Hazards from Pathogenic Microorganisms in Land-Disposed Sewage Sludge. 1993;132.
228. Rihani M, Malamis D, Bihaoui B, Etahiri S, Loizidou M, Assobhei O. In-vessel treatment of urban primary sludge by aerobic composting. Bioresour Technol [Internet]. Elsevier Ltd; 2010;101(15):5988–95. Available from: http://dx.doi.org/10.1016/j.biortech.2010.03.007
229. Heck K and M ’Vilin GD and HABB and KM and SFR and SST Van Der. Temperatura de degrada\c c \~ a o de res’ \i duos em processo de compostagem e qualidade microbiol' o gica do composto final Evaluation of degradation temperature of compounds in a composting process and microbiological quality of the compost. 2013;54–9.
230. Lopez-Vazquez CM, Dangol B, Hooijmans CM, Damir B. Co-Treatment of Faecal Sludge in Municipal Wastewater Treatment Plants. In: Strande L, Ronteltap M, Damir B, editors. Fecal Sludge Management: Systems Approach for Implementation and Operation. London: IWA Publishing; 2014. p. 177–201.
231. Carr R, Strauss M. Excreta-related infections and the role of sanitation in the control of transmission. Water Qual Stand Heal [Internet]. 2001;89–113. Available from: http://books.google.com/books?hl=en&lr=&id=d0i6rc0NO5kC&oi=fnd&pg=PA89&dq=Excreta-related+infections+and+the+role+of+sanitation+in+the+control+of+transmission&ots=7IafOTis14&sig=uEU6g1C8IUpN0PzENarP-bOP958\nhttp://books.google.com/books?hl=en&lr=&id=d0i6r
232. Cox WR, Wright MD, Woodruff GD. The Importance of Intense Trend Bacteriological Monitoring for Evaluating a Recreational Water Quality Enchancement Program. Proc Okla Acad Sci. 1981;61:58–61.
233. Johnson B, Toumari D. The impact of on-site sewage systems and illicit discharges on the Rouge River. Detriot, MI; 1997.
234. Li T, Zhang W, Feng C, Shen J. Performance assessment of separate and combined sewer systems in metropolitan areas in Southern China. Water Sci Technol [Internet]. 2014;69(2):422–9. Available from: http://www.ncbi.nlm.nih.gov/pubmed/24473315
235. Xu Z, Yin H, Li H. Quantification of non-stormwater flow entries into storm drains using a water balance approach. Sci Total Environ [Internet]. Elsevier B.V.; 2014;487(1):381–8. Available from: http://dx.doi.org/10.1016/j.scitotenv.2014.04.035
236. Lerner DN. Identifying and quantifying urban recharge: A review. Hydrogeol J. 2002;10(1):143–52.
81
237. Barrett M, Howard G, Pedley S, Taylor R, Nalubega M. A comparison of the extent and impacts of sewage contamination on urban groundwater in developed and developing countries. Schriftenr Ver Wasser Boden Lufthyg. 2000;105:179–85.
238. Rutsch M, Rieckermann J, Cullmann J, Ellis JB, Vollertsen J, Krebs P. Towards a better understanding of sewer exfiltration. Water Res. 2008;42(10-11):2385–94.
239. Ellis JB, Revitt DM, Blackwood DJ, Gilmour DJ. Leaky sewers: assessing the hydrology and impact of exfiltration in urban sewers. 2004;II(3):266–71. Available from: http://eprints.mdx.ac.uk/6072/
240. Borst B, Mahmoud NJ, van der Steen NP, Lens PNL. A case study of urban water balancing in the partly sewered city of Nablus-East (Palestine) to study wastewater pollution loads and groundwater pollution. Urban Water J [Internet]. 2013;(June 2013):1–13. Available from: http://www.tandfonline.com/doi/abs/10.1080/1573062X.2012.750373
241. Yang Y, Lerner DN, Barrett MH, Tellam JH. Quantification of groundwater recharge in the city of Nottingham, UK. Environ Geol. 1999;38(3):183–98.
242. Fenz R, Blaschke a. P, Clara M, Kroiss H, Mascher D, Zessner M. Monitoring of carbamazepie concentrations in wastewater and groundwater to quantify sewer leakage. Water Sci Technol. 2005;52(5):205–13.
243. Vázquez-Suñe E, Castillo O, Sánchez-Vila X, Albreich C, Carrera J. Use of anthropogenic to identify sources of groundwater recharge in urban areasin Barcelona. Tracers Model Hydrogeol. 2000;(262):363–9.
244. Härig F. Effects on Groundwater Due to Water Exchange Between Leaky Sewers and Aquifer. Mitteilungen des Institutes für Wasserwirtschaft, Hydrol und Wasserbau, Univ Hann. 1991;
245. Rueedi J, Cronin a. a., Morris BL. Estimation of sewer leakage to urban groundwater using depth-specific hydrochemistry. Water Environ J. 2009;23(2):134–44.
246. Trauth R, Hahn HH, Xanthopoulos C. In-situ method to determine water exchange between sewerage and groundwater. Abwassertechnik. 1995;4:55–7.
247. Karpf C, Krebs P. Sewers as drainage systems – quantification of groundwater infiltration. Novatech 2004, 6th Int Conf Sustain Tech Strateg urban water Manag Manag. 2004;969–75.
248. Amick RS, Burgess EH, Selvakumar A. Exfiltration in Sewer Systems by. US Environ Prot Agency. 2000;
249. Rieckermann J, Sydler D, Gujer W. More reliable risk assessment of sewer exfiltration by means of bayesian statistics. Proc DWA-DECHEMAGemeinschaftstagung “‘Undichte Kana¨ le-(k)ein Risiko,’” Frankfurt, Germany. 2006. p. 143–60.

82
250. Rutsch M. Assessment of sewer leakage by means of exfiltration measurements and modelling tests [Internet]. Dresden University of Technology, Institute for Urban Water Management, Dresden, Germany, Dresdner Berichte 27; 2007. Available from: /http://nbn-resolving.de/urn:nbn:de:swb:14-1175685350577-
251. Prigiobbe V, Giulianelli M. Quantification of sewer leakage by a continuous tracer method. Water Sci Technol. 2011;64(1):132–8.
252. Ullmann F, editor. Environmental evaluation of waste water exfiltration of leaky sewers in barracks of the German federal armed forces. Gesellschaft zur Fo¨ rderung d. Siedlungswasserwirtschaft an d. RWTH Aachen, Gewa¨ sserschutz, Wasser, Abwasser (GWA). 1994.
253. Dohmann M, Decker J, Menzenbach B. Water Contamination Due to Sewer Leakage. Berlin, Heidelberg: Springer; 1999.
254. Klinger J, Wolf L, Hotzl H. Leaky sewers—measurements under operating conditions. In: Fourth World Wide Workshop for Young Environmental Scientists (WWW-YES), Domaine de Cherioux, Vitry sur Seine, France. 2005.
255. Rauch W, Stegner T. The colmation of leaks in sewer systems during dry weather flow. Water Sci Technol. 1994;30(1):205–10.
256. Vollertsen J, Hvitved-Jacobsen T. Exfiltration from gravity sewers: A pilot scale study. Water Sci Technol. 2003;47(4):69–76.
257. Blackwood DJ, Gilmour DJ, Ellis JB, Revitt DM, Stainess A. Exfiltration from sewers - is it a serious problem? In: Proceedings of the 10th International Conference on Urban Drainage, Copenhagen [Internet]. 2005. p. 21–6. Available from: http://eprints.mdx.ac.uk/6039/
258. Leschik S, Musolff A, Martienssen M, Krieg R, Bayer-Raich M, Reinstorf F, et al. Investigation of sewer exfiltration using integral pumping tests and wastewater indicators. J Contam Hydrol [Internet]. Elsevier B.V.; 2009;110(3-4):118–29. Available from: http://dx.doi.org/10.1016/j.jconhyd.2009.10.001
259. US Environmental Protection Agency. Chapter 4: Characterization of CSOs and SSOs from Report to Congress: Impacts and Control of CSOs and SSOs. Washington, D.C.; 2004.
260. McLellan SL, Hollis EJ, Depas MM, Van Dyke M, Harris J, Scopel CO. Distribution and Fate of Escherichia coli in Lake Michigan Following Contamination with Urban Stormwater and Combined Sewer Overflows. J Great Lakes Res. 2007;33(3):566.
261. Li T, Tan Q, Zhu S. Characteristics of combined sewer overflows in Shanghai and selection of drainage systems. Water Environ J. 2010;24(1):74–82.

83
262. Ham YS, Kobori H, Takasago M. Effects of combined sewer overflow and stormwater on indicator bacteria concentrations in the tama river due to the high population density of Tokyo metropolitan area. Environ Monit Assess. 2009;152(1-4):459–68.
263. Ellis JB, Yu W. Bacteriology of urban runoff: The combined sewer as a bacterial reactor and generator. Water Sci Technol. 1995;31(4):303–10.
264. McLellan SL, Salmore a. K. Evidence for localized bacterial loading as the cause of chronic beach closings in a freshwater marina. Water Res. 2003;37(11):2700–8.
265. Rechenburg A, Koch C, ClaBen T, Kistemann T. Impact of sewage treatment plants and combined sewer overflow basins on the microbiological quality of surface water. Water Sci Technol. 2006;54(3):95–9.
266. Gibson III C, Stadterman K, States S, Sykora J. Combined sewer overflows: A source of Cryptoporidium and Giardia? Water Sci Technol. 1998;38(12):67–72.
267. Donovan E, Unice K, Roberts JD, Harris M, Finley B. Risk of gastrointestinal disease associated with exposure to pathogens in the water of the Lower Passaic River. Appl Environ Microbiol. 2008;74(4):994–1003.
268. Fong TT, Phanikumar MS, Xagoraraki I, Rose JB. Quantitative detection of human adenoviruses in wastewater and combined sewer overflows influencing a Michigan river. Appl Environ Microbiol. 2010;76(3):715–23.
269. Katayama H, Okuma K, Furumai H, Ohgaki S. Series of surveys for enteric viruses and indicator organisms in Tokyo Bay after an event of combined sewer overflow. Water Sci Technol. 2004;50(1):259–62.
270. WHO, UNICEF. Global Water Supply and Sanitation Assessment 2000 Report [Internet]. 2000. Available from: http://scholar.google.com/scholar?hl=en&btnG=Search&q=intitle:Global+Water+Supply+and+Sanitation+Assessment+2000+Report#0
271. Malik O a., Hsu A, Johnson L a., de Sherbinin A. A global indicator of wastewater treatment to inform the Sustainable Development Goals (SDGs). Environ Sci Policy [Internet]. Elsevier Ltd; 2015;48:172–85. Available from: http://linkinghub.elsevier.com/retrieve/pii/S1462901115000076
272. OECD. Wastewater Treatment [Internet]. Environment at a Glance 2013. 2013. Available from: http://www.oecd-ilibrary.org/sites/9789264185715-en/01/07/g1-20.html?itemId=/content/chapter/9789264185715-11-en&mimeType=text/html&_csp_=b11d19db56ef840f33c46d96e22c085f
273. Yapo RI, Koné B, Bonfoh B, Cissé G, Zinsstag J, Nguyen-Viet H. Quantitative microbial risk assessment related to urban wastewater and lagoon water reuse in Abidjan, Côte d’Ivoire. J Water Health [Internet]. 2014;12(2):301. Available from: http://www.iwaponline.com/jwh/012/jwh0120301.htm
84
274. Pandey R, Kaul S. Status of domestic wastewater management India. Schriftenr Ver Wasser Boden Lufthyg. 2000;105:405–11.
275. Winrock International India. Urban wastewater: livelihoods, health and environmental impacts in India. Colombo, Sri Lanka; 2007.
276. Water and Sanitation Program. Economic Assessment of Sanitation Interventions in Indonesia: A six-country study conducted in Lao PDR , the Philippines and Vietnam under the Economics of Sanitation Initiative (ESI). Jakarta, Indonesia; 2011.
277. Alfarra A, Lubad S. Health effect due to poor wastewater treatments in Gaza Strip. 2nd Israel-Palestinian Conference, Turkey (10-14 October). Turkey; 2004. p. 1–10.
278. Department of Water Affairs South Africa. Report on the Status of sanitation services in South Africa. 2012;(March):40.
279. Jamwal P, Mittal AK, Mouchel JM. Point and non-point microbial source pollution: A case study of Delhi. Phys Chem Earth [Internet]. Elsevier Ltd; 2011;36(12):490–9. Available from: http://dx.doi.org/10.1016/j.pce.2008.09.005
280. Caribbean Environment Programme. Assessment of Wastewater Management Technologies in the Wider Caribbean Region, CEP Technical Report 63. 2010.
281. Dodane P-H, Mbéguéré M, Sow O, Strande L. Capital and Operating Costs of Full-Scale Faecal Sludge Management and Wastewater Treatment Systems in Dakar, Senegal. Environ Sci Technol. 2012;46(7):3705–11.
282. Fair GM, Geyer JC, Okun D. Water and waste-water engineering. Volume 2. Water purification and waste-water treatment and disposal.". New York: John Wiley & Sons. Inc.; 1968.
283. Water Environment Federation. Wastewater Disinfection. 1996.
284. Rowe DR, Abdel-Magid IM. Handbook of Wastewater Reclamation and Reuse. CRC Press; 1995.
285. Feachem RG, Bradley DJ, Garelick H, Mara DD. Sanitation and disease: Health aspects of excreta and wastewater management. [Internet]. John Wiley & Sons; 1983. Available from: http://go.worldbank.org/ZS7F3M9XG1
286. Mara D. Domestic wastewater treatment in developing countries [Internet]. London, Sterling, VA: Earthscan; 2003. Available from: http://books.google.com/books?hl=en&lr=&id=K_wBiWACaPUC&oi=fnd&pg=PR2&dq=Domestic+Wastewater+Treatment+in+Developing+Countries&ots=aJM60yr7sz&sig=qA6MD510tNb6TD5tHqvkaP_5u08
85
287. Robertson LJ, Paton C a., Campbell a. T, Smith PG, Jackson MH, Gilmour R a., et al. Giardia cysts and Cryptosporidium oocysts at sewage treatment works in Scotland, UK. Water Res. 2000;34(8):2310–22.
288. Rose JB, Dickson LJ, Farrah SR, Carnahan RP. Removal of pathogenic and indicator microorganisms by a full-scale water reclamation facility. Water Res. 1996;30(11):2785–97.
289. Abo-Shehada MN, Sallal AJ. Preliminary studies on the bacterial and parasitic microflora and microfauna of domestic sewage in northern Jordan. Int J Environ Health Res. 2008;6(1):31–8.
290. Oliveira SC, Von Sperling M. Reliability analysis of wastewater treatment plants. Water Res. 2008;42(4-5):1182–94.
291. Sharafi K, Fazlzadehdavil M, Pirsaheb M, Derayat J, Hazrati S. The comparison of parasite eggs and protozoan cysts of urban raw wastewater and efficiency of various wastewater treatment systems to remove them. Ecol Eng [Internet]. Elsevier B.V.; 2012;44:244–8. Available from: http://dx.doi.org/10.1016/j.ecoleng.2012.03.008
292. Kerstens SM, Legowo HB, Hendra Gupta IB. Evaluation of DEWATS in Java, Indonesia. J Water, Sanit Hyg Dev. 2012;2(4):254.
293. Ayres RM, Alabaster GP, Mara DD, Lee DL. A design equation for human intestinal nematode egg removal in waste stabilization ponds. Water Res. 1992;26(6):863–5.
294. Mara D, Alabaster G, Pearson H, Mills S. Waste Stabilisation Ponds - A Design Manual for Eastern Africa. Leeds: Lagoon Technology International Ltd.; 1992.
295. Nelson KL, Cisneros BJ, Tchobanoglous G, Darby JL. Sludge accumulation, characteristics, and pathogen inactivation in four primary waste stabilization ponds in central Mexico. Water Res. 2004;38(1):111–27.
296. Ingallinella a. M, Sanguinetti G, Fernández RG, Strauss M, Montangero a. Cotreatment of sewage and septage in waste stabilization ponds. Water Sci Technol. 2002;45(1):9–15.
297. Knappett PSK, McKay LD, Layton A, Williams DE, Alam MJ, Huq MR, et al. Implications of fecal bacteria input from latrine-polluted ponds for wells in sandy aquifers. Environ Sci Technol. 2012;46(3):1361–70.
298. Hendricks R, Pool EJ. The effectiveness of sewage treatment processes to remove faecal pathogens and antibiotic residues. J Environ Sci Health A Tox Hazard Subst Environ Eng [Internet]. 2012;47(2):289–97. Available from: http://www.pubmedcentral.nih.gov/articlerender.fcgi?artid=3293510&tool=pmcentrez&rendertype=abstract
299. Sanders EC, Yuan Y, Pitchford A. Fecal coliform and E. coli concentrations in effluent-dominated streams of the upper santa cruz watershed. Water (Switzerland). 2013;5(1):243–61.

86
300. Gennaccaro AL, Mclaughlin MR, Huffman DE, Rose JB, Quintero-betancourt W. Infectious Cryptosporidium parvum Oocysts in Final Reclaimed Effluent Infectious Cryptosporidium parvum Oocysts in Final Reclaimed Effluent. Appl Environ. 2003;69(8):4983–5.
301. Charles K, Ashbolt N, Ferguson C, Roser D, McGuinness R, Deere D. Centralised versus decentralised sewage systems: A comparison of pathogen and nutrient loads released into Sydney’s drinking water catchments. Water Sci Technol. 2003;48(11-12):53–60.
302. Lim HS, Lee LY, Bramono SE. Community-based wastewater treatment systems and water quality of an Indonesian village. J Water Health. 2014;12(1):196–209.
303. UNEP. Desk Study on the Environment in the Occupied Palestinian Territories. 2003.
304. Sato T, Qadir M, Yamamoto S, Endo T, Zahoor A. Global, regional, and country level need for data on wastewater generation, treatment, and use. Agric Water Manag [Internet]. Elsevier B.V.; 2013;130:1–13. Available from: http://dx.doi.org/10.1016/j.agwat.2013.08.007
305. Scheierling SM, Bartone C, Mara DD, Drechsel P. Improving Wastewater Use in Agriculture : An Emerging Priority. 2010.
306. FAO. Aquastat [Internet]. [cited 2015 Feb 6]. Available from: http://www.fao.org/nr/water/aquastat/data/query/index.html?lang=en
307. Kelessidis A, Stasinakis AS. Comparative study of the methods used for treatment and final disposal of sewage sludge in European countries. Waste Manag [Internet]. Elsevier Ltd; 2012;32(6):1186–95. Available from: http://dx.doi.org/10.1016/j.wasman.2012.01.012
308. World Health Organization. WHO Guidelines for the safe use of wastewater, excreta and greywater, vol 2. Wastewater use in agriculture. Geneva, Switzerland; 2006.
309. Offical Journal of the European Communities. Council Directive of 30 October 1979 on the Quality Required of Shellfish Waters [Internet]. 1979 p. 47–52. Available from: http://europa.eu.int/eur-lex/en/consleg/pdf/1979/en_1979L0923_do_001.prf
310. Caribbean Environment Programme. Convention for the Protection and Development of the Marine Environment of the Wider Caribbean Region (and its three Protocols) [Internet]. Kingston; 2002. Available from: http://www.cep.unep.org
311. US Environmental Protection Agency. Bacterial water quality standards for recreational waters (Freshwater and Marine waters). 2003.
312. Exley JLR, Liseka B, Cumming O, Ensink JHJ. The Sanitation Ladder, What Constitutes an Improved Form of Sanitation? Environ Sci Technol [Internet]. 2015;49(2):1086–94. Available from: http://pubs.acs.org/doi/abs/10.1021/es503945x
313. Sanderson D. Cities, Disasters and Livelihoods. Risk Manag. 2000;2(4):49–58.
87
314. Wisner B, Adams J. Environmental health in emergencies and disasters. A practical guide. 2002; Available from: http://www.who.int/entity/water_sanitation_health/hygiene/emergencies/em2002intro.pdf
315. Brouckaert CJ, Foxon KM, Wood K. Modelling the filling rate of pit latrines. Water SA. 2013;39(4):555–62.
316. Schaub-Jones D, Eales K, Tyers L. Sanitation partnerships: Harnessing their potential for urban on-site sanitation. Water. 2006.
317. Flores a., Buckley C, Fenner R. Selecting sanitation systems for sustainability in developing countries. Water Sci Technol. 2009;60(11):2973–82.
318. Verhagen J, Carrasco M. Non-sewered Sanitation Services Full-Chain Sanitation Services that Last : IRC Int Water Sanit Cent. 2013;(July).
319. Nicoll EH. Small Water Pollution Control Works: Design and Practice. Chichester: Ellis Horwood; 1988.
320. O’Luanaigh N, Johnston P, Misstear B, Patel T, Gill L. A comparative study on the treatment performance of a conventional septic tank system and reed bed-soil absorption system receiving domestic effluent. Desalin Water Treat. 2009;4(1-3):45–53.
321. Bremer JE, Harter T. Domestic wells have high probability of pumping septic tank leachate. Hydrol Earth Syst Sci. 2012;16(8):2453–67.
322. U.S. Environmental Protection Agency. Ground Water. National Water Quality Inventory: 1998 Report to Congress. Office of Water; 2000. p. 157–89.
323. Atherholt TB, LeChevallier MW, Norton WD, Rosen JS. Effect of rainfall on Giardia and crypto. J / Am Water Work Assoc. 1998;90(9):66–80.
324. Kreissl JF. Evaluation of State Codes and Their Implications. Proceedings of the Fourth Northwest On-Site Wastewater Disposal Short Course. Seattle, WA: University of Washington; 1982.
325. (NOWRA) NOWRA. Strategic Framework for Unsewered Wastewater Infrastructure [Internet]. National Onsite Wastewater Recycling Association. 1999 [cited 2015 Jun 5]. Available from: http://www.nowra.org/content.asp?pl=35&sl=25&contentid=72
326. Norman G, Pedley S, Takkouche B. Effects of sewerage on diarrhoea and enteric infections: A systematic review and meta-analysis. Lancet Infect Dis [Internet]. Elsevier Ltd; 2010;10(8):536–44. Available from: http://dx.doi.org/10.1016/S1473-3099(10)70123-7
327. Smittskyddsinstitutet (SMI). Cryptosporidium i Östersund - Smittskyddsinstitutets arbete med det dricksvattenburna utbrottet i Östersund 2010-2011 [Internet]. 2011. Available from: www.smittskyddsinstitutet.se
88
328. Panasiuk O, Hedström A, Marsalek J, Ashley RM, Viklander M. Contamination of stormwater by wastewater: A review of detection methods. J Environ Manage [Internet]. 2015;152:241–50. Available from: http://linkinghub.elsevier.com/retrieve/pii/S0301479715000663
329. Jagai JS, Li Q, Wang S, Messier KP, Wade TJ, Hilborn ED. Environmental Health Perspectives. Environ Health Perspect. 2015;110(4):A174.
330. Wojtenko I, Stinson MK, Field R. Challenges of combined sewer overflow disinfection by ultraviolet light irradiation. Crit Rev Environ Sci Technol. 2001;31(3):223–39.
331. Smith Jr. JE, Perdek JM. Assessment and Management of Watershed Microbial Contaminants. Crit Rev Environ Sci Technol. 2004;34(2):109–39.
332. Meyer D, Molle P, Esser D, Troesch S, Masi F, Dittmer U. Constructed wetlands for combined sewer overflow treatment-comparison of German, French and Italian approaches. Water (Switzerland). 2013;5(1):1–12.
333. EPRI. Advanced On-Site Wastewater Treatment and Management Market Study: Volume 2: State Reports. Palo Alto, CA; 2000.
334. Bureau USC. Historical Census of Housing Tables: Sewage Disposal. 1990.
335. Yeager CH. Well pollution and safe sites for bored-hole latrines. Malayan Med J. 1929;4(4):118–25.
336. Dyer BR, Bhaskaran TR. Investigations of groundwater pollution, Part II: Soil characteristics in West Bengal, India, at the site of groundwater pollution investigations. Indian J Med Res. 1945;33:17–22.
337. Lewis WJ, Farr JL, Foster SSD. The pollution hazard to village water supplies in eastern Botswana. Proceedings of the Institution of Civil Engineers. 1980. p. 281–93.
338. Caldwell EL. Pollution flow from pit latrines when an impervious stratum closely underlies the flow. J Infect Dis. 1937;61:270–88.
339. Caldwell EL, Parr LW. Groundwater pollution and the bored hole latrine. J Infect Dis. 1937;61:148–83.
340. Caldwell EL. Pollution flow from pit latrines when an impervious stratum closely underlies the flow. J Infect Dis. 1938;62:225–58.
341. Brandes M. Studies on subsurface movement of effluent from private sewage disposal systems using radioactive and dye tracers. Parts 1 and 2. Toronto, Canada; 1974.
342. Rahe TM, Hagedorn C, McCoy EL, Kling GF. Transport of antibiotic-resistant Escherichia coli through Western Oregon hillslope soils under conditions of saturated flow. J Environ Qual. 1978;7(4):487–94.
89
343. Viraraghavan T. Travel of micro-organisms from a septic tile. Water Air Soil Pollut. 1978;9:355–62.
344. Stiles CW, Crohurst HR. The principles underlying the movement of Bacillus coi in groundwater with resultant pollution of wells. US Public Heal Rep. 1923;38:1350 – .
345. Warrick LF, Muegge J. Safeguarding Wisconsin’s water supplies. J Am Water Work Assoc. 1930;22:215–30.
346. Schaub SA, Sorber CA. Virus and bacteria removal from wastewater by rapid infiltration through soil. Appl Environ Microbiol. 1977;33(3):609–19.
347. Bouwer H, Lance JC, Riggs MS. High-rate land treatment. II: Water quality and economic aspects of flushing meadows project. J Water Poll Cont Fed. 1974;46:844 – .
348. McMichael FA, McKee JE. Final report of research on wastewater reclamation at Whitter narrows. State Calif Water Qual Cont Bd. 1966;33.
349. Young RH. Effects of groundwater. J Water Poll Cont Fed. 1973;46:1269–301.
350. Anan’ev NI, Demin ND. On the spread of pollutants in subsurface waters. Hyg Sanit. 1971;36:292–4.
351. Merrell JC. The Santee recreation project, Santee, California final report. Water Poll. Res. Series. Cincinnati, OH; 1967.
352. Baars JV. Travel of pollution, and purification en route, in sandy soils. Bull World Health Organ. 1957;16:727–47.
353. Fournelle MJ. Experimental groundwater pollution at Anchorage, Alaska. US Public Heal Dep Bull. 1957;72:203–9.
354. McGauhey PH, Krone RB. No Title. Sanit Eng Res Lab Pub. 1967;67(1).
355. Krone RB, Orlob GT, Hodgkinson C. Movement of coliform bacteria through porous media. Sewage Ind Waste. 1958;30(1):1–13.
356. Wesner GM, Baier DC. No Title. J Am Water Work Assoc. 1970;62:203 – .
357. Pyle BH, Sinton LW, Noonan MJ, McNabb JF. The movement of micro-organisms in groundwater. Proc of New Zealand Institution of Engineers Technical Group on Water, Groundwater Symposium. Wellington, New Zealand: Victoria University; 1979.
358. Dappert AF. Tracing the travel and changes in composition of underground pollution. Water Works Sewerage. 1932;79(8):265–9.
90
359. Thorpe HR. Movement of contaminants into and through the Heretaunga Plains aquifer, Hawkes Bay, New Zealand. Groundwater Pollution Conference. Perth, Australia: Australian Water Resources Council; 1979.
360. Silva SA. On the treatment of domestic sewage in waste stabilization ponds in Northeast Brazil. University of Dundee; 1982.
361. Oragui JI, Curtis TP, Silva SA, Mara DD. The removal of excreted bacteria and viruses in deep waste stabilization ponds in Northeast Brazil. Water Sci Technol. 1987;19:569–73.
362. Grimason A, Smith H, Thitai W, Smith P, Jackson M, Girdwood R. Occurrence and Rremoval of Cryptosporidium spp. oocysts and Giardia spp. cysts in Kenyan waste stabilization pnds. Water Sci Technol. 1993;27(3-4):97–104.
363. Amahmid O, Asmama S, Bouhoum K. Urban wastewater treatment in stabilization ponds: Occurrence and removal of pathogens. Urban Water. 2002;4(3):255–62.
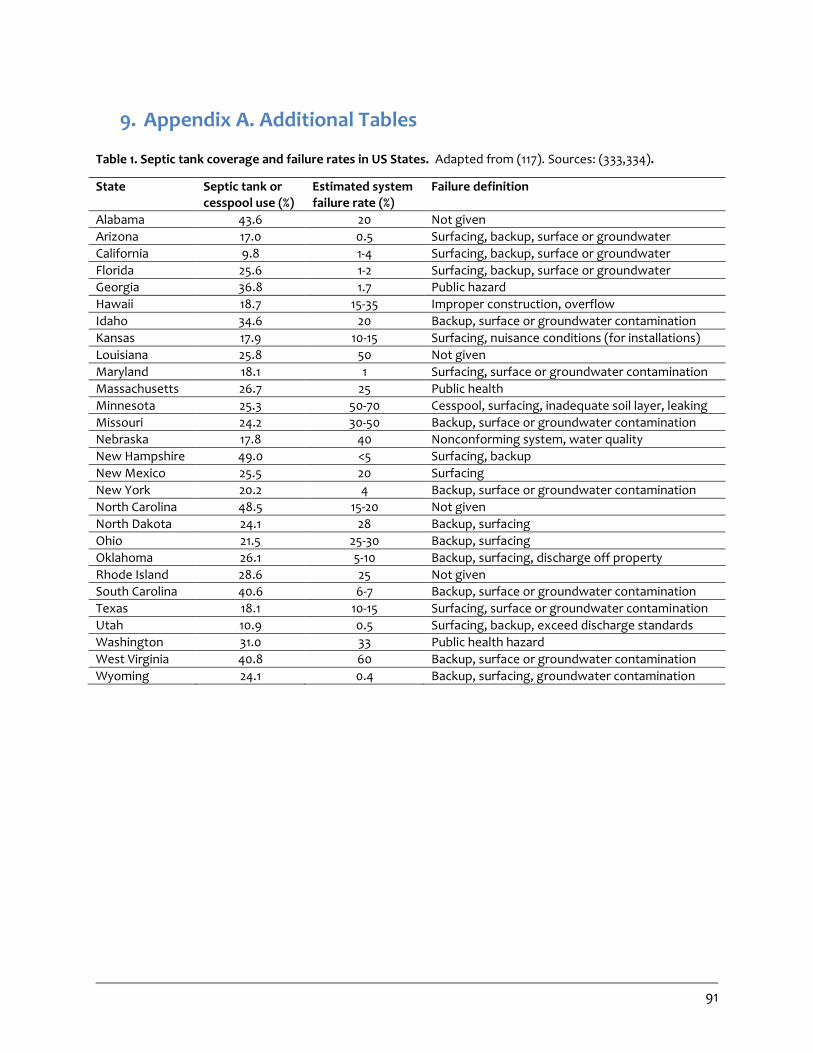
91
9. Appendix A. Additional Tables
Table 1. Septic tank coverage and failure rates in US States. Adapted from (117). Sources: (333,334).
State Septic tank or cesspool use (%)
Estimated system failure rate (%)
Failure definition
Alabama 43.6 20 Not given
Arizona 17.0 0.5 Surfacing, backup, surface or groundwater
California 9.8 1-4 Surfacing, backup, surface or groundwater
Florida 25.6 1-2 Surfacing, backup, surface or groundwater
Georgia 36.8 1.7 Public hazard
Hawaii 18.7 15-35 Improper construction, overflow
Idaho 34.6 20 Backup, surface or groundwater contamination
Kansas 17.9 10-15 Surfacing, nuisance conditions (for installations)
Louisiana 25.8 50 Not given
Maryland 18.1 1 Surfacing, surface or groundwater contamination
Massachusetts 26.7 25 Public health
Minnesota 25.3 50-70 Cesspool, surfacing, inadequate soil layer, leaking
Missouri 24.2 30-50 Backup, surface or groundwater contamination
Nebraska 17.8 40 Nonconforming system, water quality
New Hampshire 49.0 <5 Surfacing, backup
New Mexico 25.5 20 Surfacing
New York 20.2 4 Backup, surface or groundwater contamination
North Carolina 48.5 15-20 Not given
North Dakota 24.1 28 Backup, surfacing
Ohio 21.5 25-30 Backup, surfacing
Oklahoma 26.1 5-10 Backup, surfacing, discharge off property
Rhode Island 28.6 25 Not given
South Carolina 40.6 6-7 Backup, surface or groundwater contamination
Texas 18.1 10-15 Surfacing, surface or groundwater contamination
Utah 10.9 0.5 Surfacing, backup, exceed discharge standards
Washington 31.0 33 Public health hazard
West Virginia 40.8 60 Backup, surface or groundwater contamination
Wyoming 24.1 0.4 Backup, surfacing, groundwater contamination
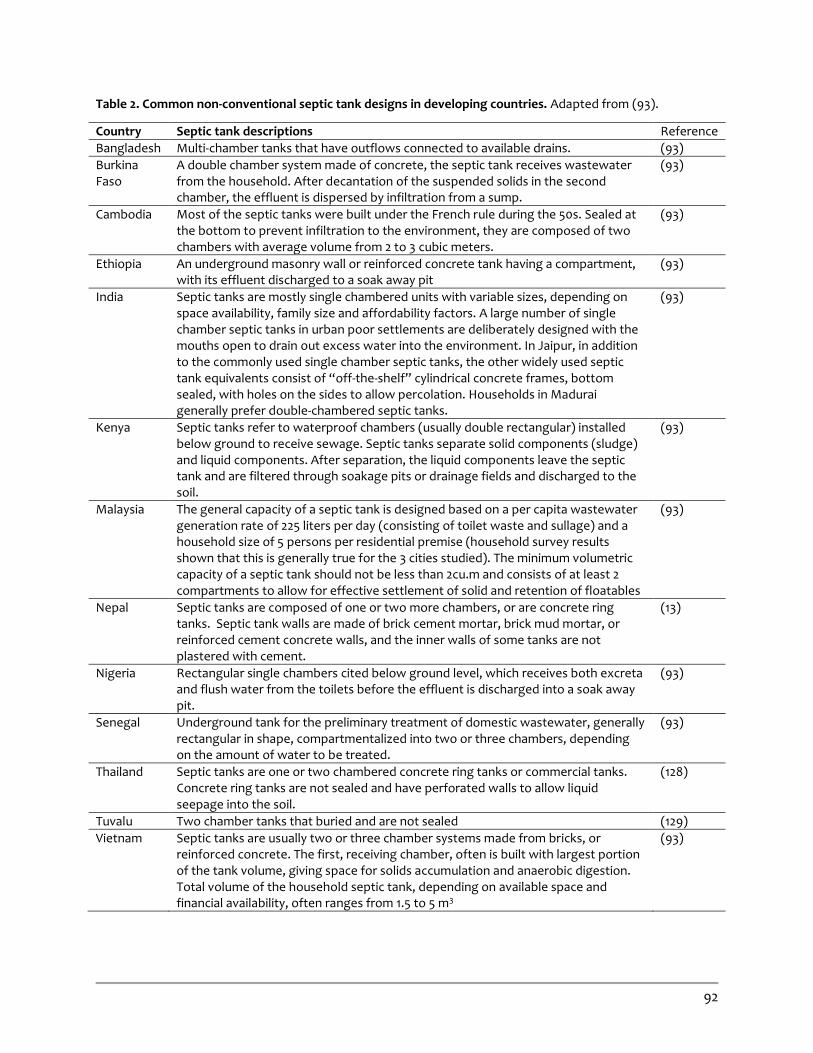
92
Table 2. Common non-conventional septic tank designs in developing countries. Adapted from (93).
Country Septic tank descriptions Reference
Bangladesh Multi-chamber tanks that have outflows connected to available drains. (93)
Burkina Faso
A double chamber system made of concrete, the septic tank receives wastewater from the household. After decantation of the suspended solids in the second chamber, the effluent is dispersed by infiltration from a sump.
(93)
Cambodia Most of the septic tanks were built under the French rule during the 50s. Sealed at the bottom to prevent infiltration to the environment, they are composed of two chambers with average volume from 2 to 3 cubic meters.
(93)
Ethiopia An underground masonry wall or reinforced concrete tank having a compartment, with its effluent discharged to a soak away pit
(93)
India Septic tanks are mostly single chambered units with variable sizes, depending on space availability, family size and affordability factors. A large number of single chamber septic tanks in urban poor settlements are deliberately designed with the mouths open to drain out excess water into the environment. In Jaipur, in addition to the commonly used single chamber septic tanks, the other widely used septic tank equivalents consist of “off-the-shelf” cylindrical concrete frames, bottom sealed, with holes on the sides to allow percolation. Households in Madurai generally prefer double-chambered septic tanks.
(93)
Kenya Septic tanks refer to waterproof chambers (usually double rectangular) installed below ground to receive sewage. Septic tanks separate solid components (sludge) and liquid components. After separation, the liquid components leave the septic tank and are filtered through soakage pits or drainage fields and discharged to the soil.
(93)
Malaysia The general capacity of a septic tank is designed based on a per capita wastewater generation rate of 225 liters per day (consisting of toilet waste and sullage) and a household size of 5 persons per residential premise (household survey results shown that this is generally true for the 3 cities studied). The minimum volumetric capacity of a septic tank should not be less than 2cu.m and consists of at least 2 compartments to allow for effective settlement of solid and retention of floatables
(93)
Nepal Septic tanks are composed of one or two more chambers, or are concrete ring tanks. Septic tank walls are made of brick cement mortar, brick mud mortar, or reinforced cement concrete walls, and the inner walls of some tanks are not plastered with cement.
(13)
Nigeria Rectangular single chambers cited below ground level, which receives both excreta and flush water from the toilets before the effluent is discharged into a soak away pit.
(93)
Senegal Underground tank for the preliminary treatment of domestic wastewater, generally rectangular in shape, compartmentalized into two or three chambers, depending on the amount of water to be treated.
(93)
Thailand Septic tanks are one or two chambered concrete ring tanks or commercial tanks. Concrete ring tanks are not sealed and have perforated walls to allow liquid seepage into the soil.
(128)
Tuvalu Two chamber tanks that buried and are not sealed (129)
Vietnam Septic tanks are usually two or three chamber systems made from bricks, or reinforced concrete. The first, receiving chamber, often is built with largest portion of the tank volume, giving space for solids accumulation and anaerobic digestion. Total volume of the household septic tank, depending on available space and financial availability, often ranges from 1.5 to 5 m3
(93)

93
Table 3. Bacterial travel in soil. Adapted from (52,148).
Source Medium Organisms Distance traveled (m)
Travel time (d)
Reference
Pit latrines
Borehole latrine intersecting GW
Medium sand - 21 - (335)a
Borehole latrine intersecting GW
Medium sand - 3 - (336)a
Pit latrine dug to weathered and fractured bedrock
Fractured rock - 25+ - (337)a
Pit latrine intersecting GW Fine and coarse sand
Bacillus coli 24.4 - (338)a,b
Pit latrine intersecting GW Sand and sandy clay
Bacillus coli 10.7 56 (339)a,b
Pit latrine intersecting GW Fine and medium sand
Bacillus coli 3.1 - (340)a,b
Septic tanks
STE with shallow water table
Silty sand - 3 - (341)a
STE with imported fill material
Fine sand - 16 - (341)a
STE, rapid flow through macropores
Silty clay loam - 15+ - (342)a
STE in mountainous terrain
Fractured rock - 28+ - (202)a
Septic tank drain field 0.15 m above GW
Sandy clay - 15 - (343)a
Septic tank tile effluent Fine loamy soil Total coliforms 6.1 - (190)b
Septic tank tile effluent Fine loamy soil Fecal coliforms 13.5 - (190)b
Inoculated effluent in tile line
Silty clay loam E. coli 20 0.2 (144)b
Septic tank drain field submerged in perched water table
Silty clay loam - 15+ - (342)a
Infiltration beds
Sewage trenches intersecting GW
Fine sand Bacillus coli 19.8 189 (344)b
Sewage trenches intersecting GW
- Coliforms 70.7 - (345)b
Primary sewage in infiltration basins
Silty sand and gravel
Fecal streptococci 183 - (346)b
Primary and treated sewage in infiltration basins
Fine sandy loam
Coliforms 0.6-4 - (197)b
Secondary sewage effluent in infiltration beds
Fine loamy sand
Fecal coliforms and fecal streptococci
9 - (201)b
Secondary sewage in infiltration basins
Fine loamy sand to gravel
Fecal coliforms 9.1 - (347)b
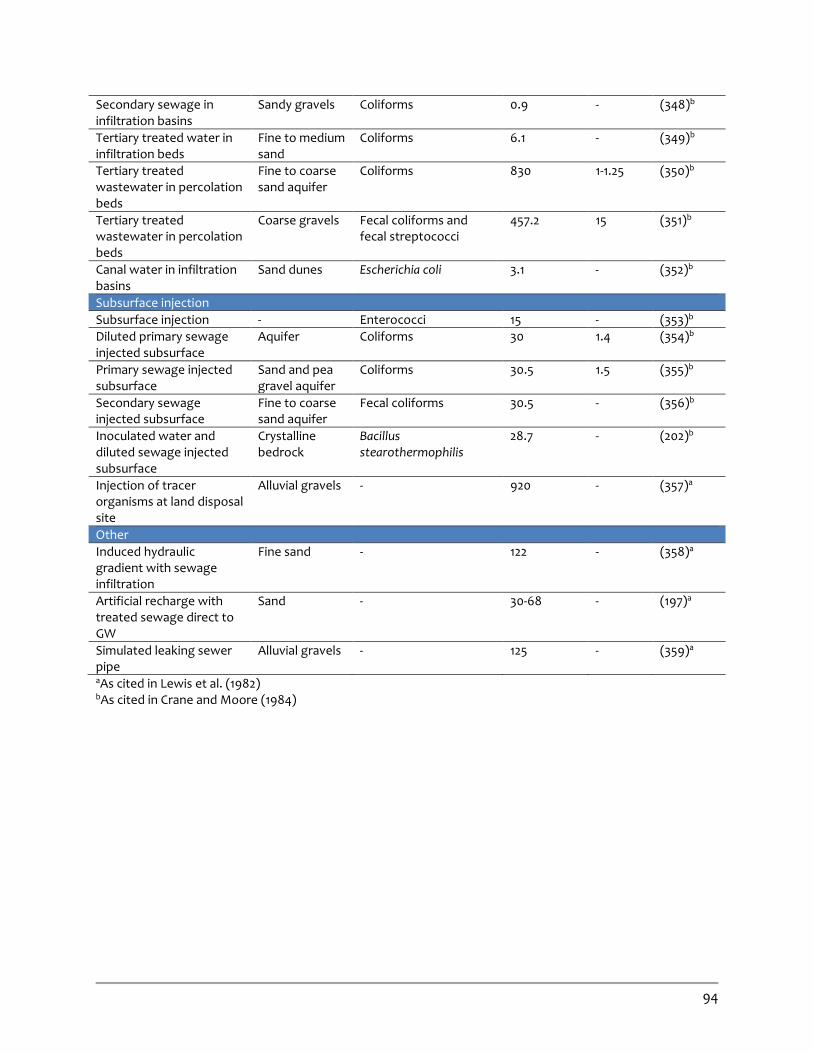
94
Secondary sewage in infiltration basins
Sandy gravels Coliforms 0.9 - (348)b
Tertiary treated water in infiltration beds
Fine to medium sand
Coliforms 6.1 - (349)b
Tertiary treated wastewater in percolation beds
Fine to coarse sand aquifer
Coliforms 830 1-1.25 (350)b
Tertiary treated wastewater in percolation beds
Coarse gravels Fecal coliforms and fecal streptococci
457.2 15 (351)b
Canal water in infiltration basins
Sand dunes Escherichia coli 3.1 - (352)b
Subsurface injection
Subsurface injection - Enterococci 15 - (353)b
Diluted primary sewage injected subsurface
Aquifer Coliforms 30 1.4 (354)b
Primary sewage injected subsurface
Sand and pea gravel aquifer
Coliforms 30.5 1.5 (355)b
Secondary sewage injected subsurface
Fine to coarse sand aquifer
Fecal coliforms 30.5 - (356)b
Inoculated water and diluted sewage injected subsurface
Crystalline bedrock
Bacillus stearothermophilis
28.7 - (202)b
Injection of tracer organisms at land disposal site
Alluvial gravels - 920 - (357)a
Other
Induced hydraulic gradient with sewage infiltration
Fine sand - 122 - (358)a
Artificial recharge with treated sewage direct to GW
Sand - 30-68 - (197)a
Simulated leaking sewer pipe
Alluvial gravels - 125 - (359)a
aAs cited in Lewis et al. (1982) bAs cited in Crane and Moore (1984)
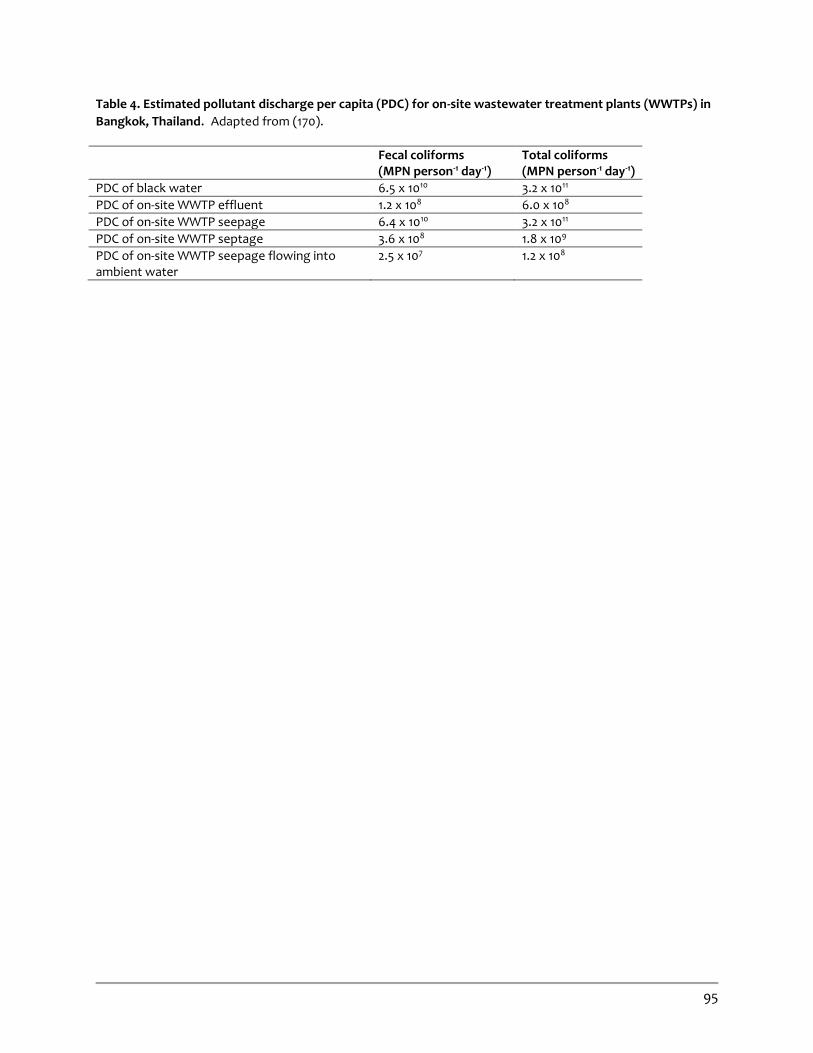
95
Table 4. Estimated pollutant discharge per capita (PDC) for on-site wastewater treatment plants (WWTPs) in
Bangkok, Thailand. Adapted from (170).
Fecal coliforms (MPN person-1 day-1)
Total coliforms (MPN person-1 day-1)
PDC of black water 6.5 x 10¹⁰ 3.2 x 10¹¹
PDC of on-site WWTP effluent 1.2 x 10⁸ 6.0 x 10⁸
PDC of on-site WWTP seepage 6.4 x 10¹⁰ 3.2 x 10¹¹
PDC of on-site WWTP septage 3.6 x 10⁸ 1.8 x 10⁹
PDC of on-site WWTP seepage flowing into ambient water
2.5 x 10⁷ 1.2 x 10⁸
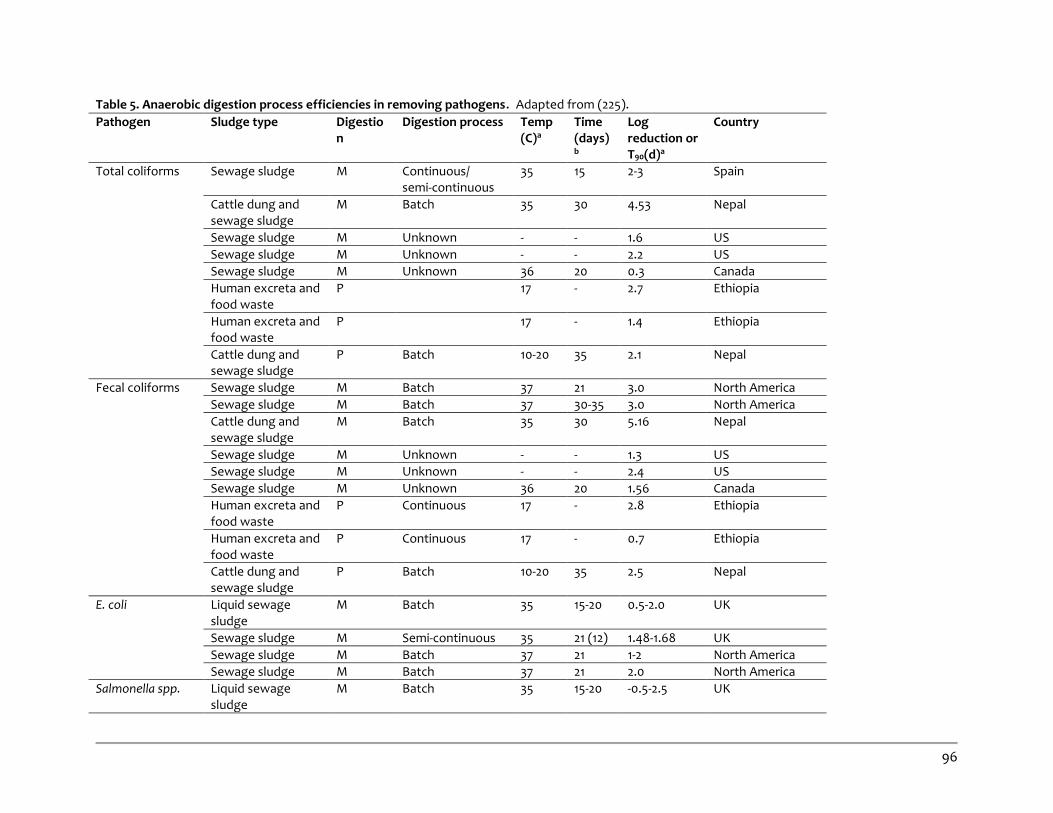
96
Table 5. Anaerobic digestion process efficiencies in removing pathogens. Adapted from (225).
Pathogen Sludge type Digestion
Digestion process Temp (C)a
Time (days)b
Log reduction or T90(d)a
Country
Total coliforms Sewage sludge M Continuous/ semi-continuous
35 15 2-3 Spain
Cattle dung and sewage sludge
M Batch 35 30 4.53 Nepal
Sewage sludge M Unknown - - 1.6 US
Sewage sludge M Unknown - - 2.2 US
Sewage sludge M Unknown 36 20 0.3 Canada
Human excreta and food waste
P 17 - 2.7 Ethiopia
Human excreta and food waste
P 17 - 1.4 Ethiopia
Cattle dung and sewage sludge
P Batch 10-20 35 2.1 Nepal
Fecal coliforms Sewage sludge M Batch 37 21 3.0 North America
Sewage sludge M Batch 37 30-35 3.0 North America
Cattle dung and sewage sludge
M Batch 35 30 5.16 Nepal
Sewage sludge M Unknown - - 1.3 US
Sewage sludge M Unknown - - 2.4 US
Sewage sludge M Unknown 36 20 1.56 Canada
Human excreta and food waste
P Continuous 17 - 2.8 Ethiopia
Human excreta and food waste
P Continuous 17 - 0.7 Ethiopia
Cattle dung and sewage sludge
P Batch 10-20 35 2.5 Nepal
E. coli Liquid sewage sludge
M Batch 35 15-20 0.5-2.0 UK
Sewage sludge M Semi-continuous 35 21 (12) 1.48-1.68 UK
Sewage sludge M Batch 37 21 1-2 North America
Sewage sludge M Batch 37 21 2.0 North America
Salmonella spp. Liquid sewage sludge
M Batch 35 15-20 -0.5-2.5 UK

97
Sewage sludge M Semi-continuous 35 15 2.23 UK
Sewage sludge M Semi-continuous 35 22 (12) 1.91 UK
Sewage sludge M Continuous/ Semi-continuous
35 15 0.2 Spain
Sewage sludge M Unknown - - 1.6 US
Enterococcus spp. Sewage sludge M Unknown - - 0.7 US
Sewage sludge M Unknown - - 1.6 US
Sewage sludge M Unknown 36 20 No change Canada
Listeria monocytogenes
Sewage sludge M Semi-continuous 35 21 (12) 2.23 UK
Campylobacter jejuni
Sewage sludge M Semi-continuous 35 21 (12) -1.0 UK
Vibrio cholera Human night soil M Semi-continuous 23-27 20 (10) 6 India
Human night soil M Semi-continuous 23-27 30 (20)
3.5 India
Clostridium perfringens
Sewage sludge M Unknown 36 20 No change Canada
Enteroviruses Sewage sludge M Unknown - - 1.6 US
Sewage sludge M Unknown - - 1.1 US
Sewage sludge M Semi-continuous 34 2 2.0 UK
Sewage sludge M Unknown 400 0-2.0 US
Poliovirus Sewage sludge M Semi-continuous 35 21 (12) 6.2 UK
Somatic coliphages
Sewage sludge M Unknown 36 20 0.09 Canada
Cryptosporidium Sewage sludge M Unknown 36 20 0.30 Canada
Giardia Sewage sludge M Unknown 36 20 No change Canada
Sewage sludge M Unknown 400 0 to -2.0 US
Ascaris suum ova Sewage sludge M Semi-continuous 34 26 No change UK
M- mesophilic, P-psychrophilic aIn some cases data have been summarized, calculated, or approximated from original paper. bTime taken for log reduction.

98
Table 6. Reported treatment efficiencies for waste stabilization ponds in literature.
Country WSP system
RT (days)
Treatment Facilities (N)
FC % removal Fecal coliforms Inlet Outlet
Ca
mp
ylo
ba
cter
(/10
0 m
L)
Sa
lmo
nel
la
(/10
0 m
L)
En
tero
viru
ses
(/10
mL)
Ro
tavi
ruse
s
(/10
mL)
He
lmin
ths
(eg
gs/
L)
Gia
rdia
(oo
cyst
s/L)
Ref
Brazil FP NA 65 97.5% 5.3 x 10⁷ (MPN/100 mL) 1.2 x 10⁶
(MPN/100 mL)
(290)
Brazil AP + FP 40 99.4% 2.0 x 10⁸ (MPN/100 mL) 4.3 x 10⁵
(MPN/100 mL)
(290)
Brazil AP + FP 6.8 5.5
99.4% 5 x 10⁷
(CFU/100 mL) 3 x 10⁵
(CFU/100 mL)
99.88% 804 1 99.33% 1489 10
(360)
Brazil AP + FP +3 MP
6.8 5.5 5.5-5.8 4.0 3.2 3.2-3.4
99.9999% 5 x 10⁷
(CFU/100 mL) 30 (CFU/100 mL)
100% 804 0 99.73% 1489 4
(360)
Brazil AP+ FP 1 5
96% 2 x 10⁷
(CFU/100 mL) 8 x 10⁵
(CFU/100 mL)
99.97% 70 0.2
99.5% 20 0.1
90% 1 x 10⁴ 1 x 10³
91.25% 800 70
(361)
Brazil AP + FP + 3 MP
1 5 5
99.97% 2 x 10⁷
(CFU/100 mL)
100% 70 0
0% 20 0
99.91% 1 x 10⁴ 9
99.63% 800 3
(361)

99
7 x 10³
(CFU/100 mL)
Kenya 11 SP 14-133 100% 13-73 0 100% 213-6213 0
(362)
Morocco SP 16 100% 0
(363)
Iran SP NR 2 100% 37.99 0 100% 29.98 0
100% 9.11 0 100% 7.6 0
(291)
AP – anaerobic pond FP – facultative pond MP- maturation pond SP- stabilization pond
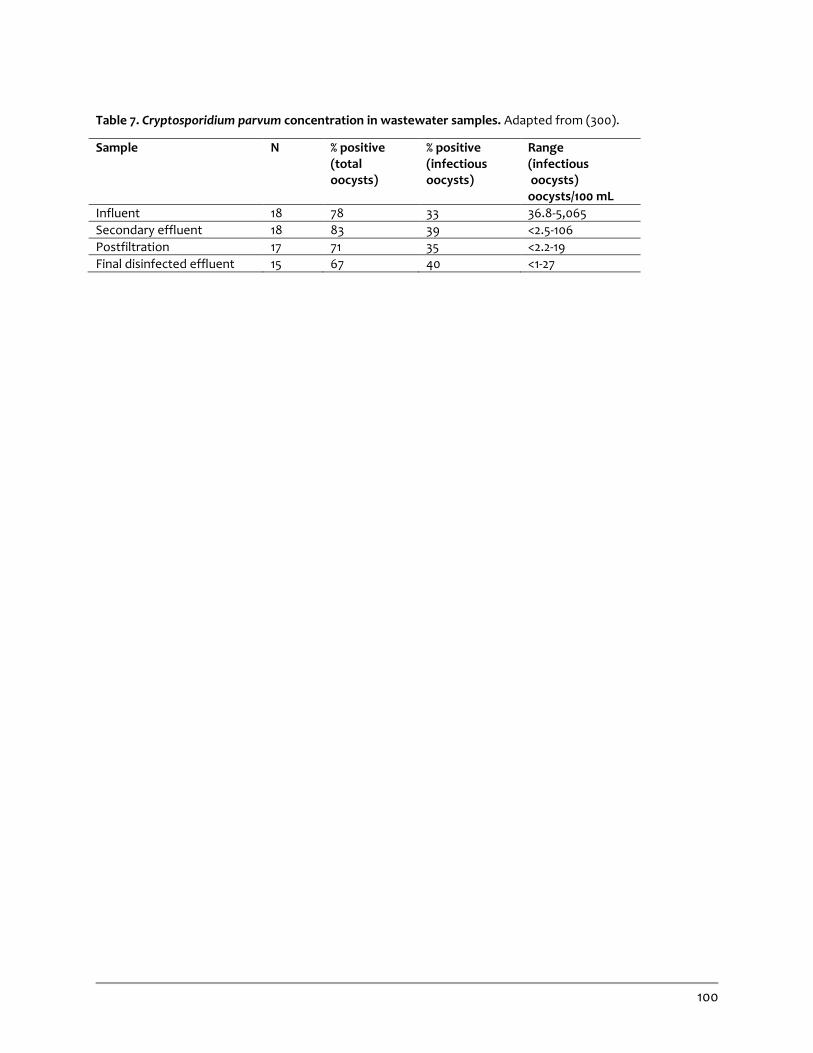
100
Table 7. Cryptosporidium parvum concentration in wastewater samples. Adapted from (300).
Sample N % positive (total oocysts)
% positive (infectious oocysts)
Range (infectious oocysts) oocysts/100 mL
Influent 18 78 33 36.8-5,065
Secondary effluent 18 83 39 <2.5-106
Postfiltration 17 71 35 <2.2-19
Final disinfected effluent 15 67 40 <1-27
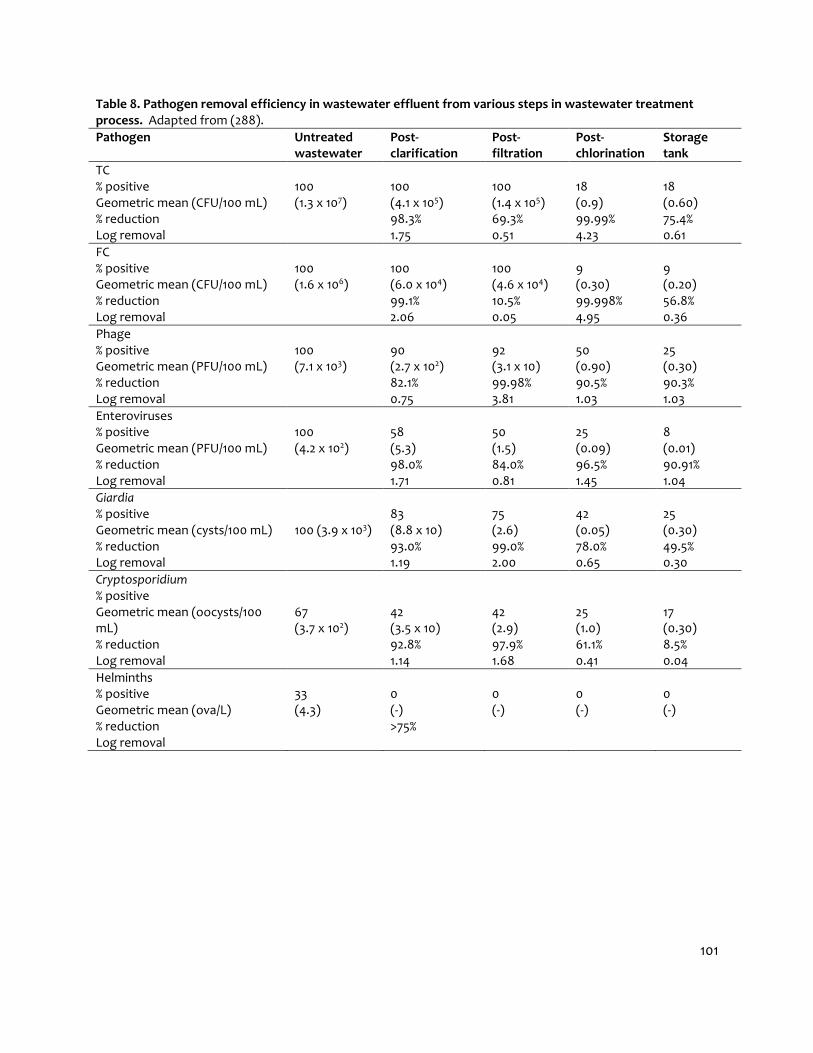
101
Table 8. Pathogen removal efficiency in wastewater effluent from various steps in wastewater treatment process. Adapted from (288).
Pathogen Untreated wastewater
Post-clarification
Post-filtration
Post-chlorination
Storage tank
TC % positive Geometric mean (CFU/100 mL) % reduction Log removal
100 (1.3 x 10⁷)
100 (4.1 x 10⁵) 98.3% 1.75
100 (1.4 x 10⁵) 69.3% 0.51
18 (0.9) 99.99% 4.23
18 (0.60) 75.4% 0.61
FC % positive Geometric mean (CFU/100 mL) % reduction Log removal
100 (1.6 x 10⁶)
100 (6.0 x 10⁴) 99.1% 2.06
100 (4.6 x 10⁴) 10.5% 0.05
9 (0.30) 99.998% 4.95
9 (0.20) 56.8% 0.36
Phage % positive Geometric mean (PFU/100 mL) % reduction Log removal
100 (7.1 x 10³)
90 (2.7 x 10²) 82.1% 0.75
92 (3.1 x 10) 99.98% 3.81
50 (0.90) 90.5% 1.03
25 (0.30) 90.3% 1.03
Enteroviruses % positive Geometric mean (PFU/100 mL) % reduction Log removal
100 (4.2 x 10²)
58 (5.3) 98.0% 1.71
50 (1.5) 84.0% 0.81
25 (0.09) 96.5% 1.45
8 (0.01) 90.91% 1.04
Giardia % positive Geometric mean (cysts/100 mL) % reduction Log removal
100 (3.9 x 10³)
83 (8.8 x 10) 93.0% 1.19
75 (2.6) 99.0% 2.00
42 (0.05) 78.0% 0.65
25 (0.30) 49.5% 0.30
Cryptosporidium % positive Geometric mean (oocysts/100 mL) % reduction Log removal
67 (3.7 x 10²)
42 (3.5 x 10) 92.8% 1.14
42 (2.9) 97.9% 1.68
25 (1.0) 61.1% 0.41
17 (0.30) 8.5% 0.04
Helminths % positive Geometric mean (ova/L) % reduction Log removal
33 (4.3)
0 (-) >75%
0 (-)
0 (-)
0 (-)
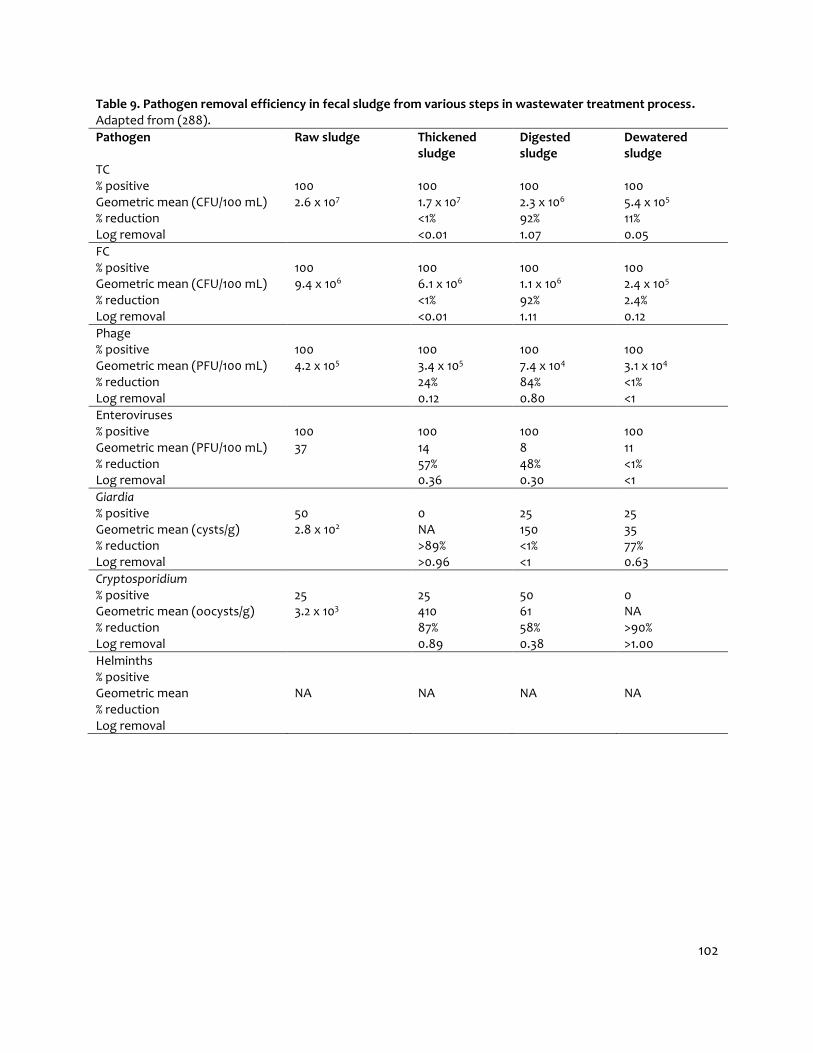
102
Table 9. Pathogen removal efficiency in fecal sludge from various steps in wastewater treatment process. Adapted from (288).
Pathogen Raw sludge Thickened sludge
Digested sludge
Dewatered sludge
TC % positive Geometric mean (CFU/100 mL) % reduction Log removal
100 2.6 x 10⁷
100 1.7 x 10⁷
<1% <0.01
100 2.3 x 10⁶
92% 1.07
100 5.4 x 10⁵
11% 0.05
FC % positive Geometric mean (CFU/100 mL) % reduction Log removal
100 9.4 x 10⁶
100 6.1 x 10⁶
<1% <0.01
100 1.1 x 10⁶ 92% 1.11
100 2.4 x 10⁵
2.4% 0.12
Phage % positive Geometric mean (PFU/100 mL) % reduction Log removal
100 4.2 x 10⁵
100 3.4 x 10⁵
24% 0.12
100 7.4 x 10⁴
84% 0.80
100 3.1 x 10⁴
<1% <1
Enteroviruses % positive Geometric mean (PFU/100 mL) % reduction Log removal
100 37
100 14 57% 0.36
100 8 48% 0.30
100 11 <1% <1
Giardia % positive Geometric mean (cysts/g) % reduction Log removal
50 2.8 x 10²
0 NA >89% >0.96
25 150 <1% <1
25 35 77% 0.63
Cryptosporidium % positive Geometric mean (oocysts/g) % reduction Log removal
25 3.2 x 10³
25 410 87% 0.89
50 61 58% 0.38
0 NA >90% >1.00
Helminths % positive Geometric mean % reduction Log removal
NA
NA
NA
NA
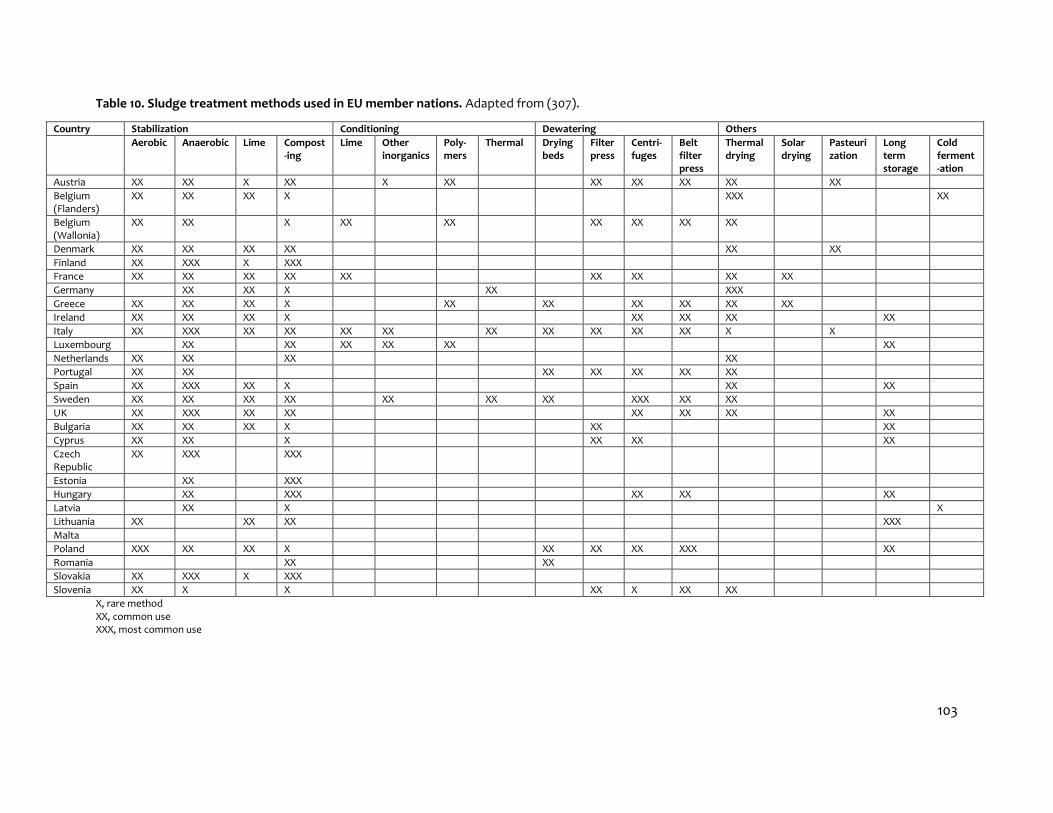
103
Table 10. Sludge treatment methods used in EU member nations. Adapted from (307).
Country Stabilization Conditioning Dewatering Others
Aerobic Anaerobic Lime Compost-ing
Lime Other inorganics
Poly-mers
Thermal Drying beds
Filter press
Centri-fuges
Belt filter press
Thermal drying
Solar drying
Pasteurization
Long term storage
Cold ferment-ation
Austria XX XX X XX X XX XX XX XX XX XX
Belgium (Flanders)
XX XX XX X XXX XX
Belgium (Wallonia)
XX XX X XX XX XX XX XX XX
Denmark XX XX XX XX XX XX
Finland XX XXX X XXX
France XX XX XX XX XX XX XX XX XX
Germany XX XX X XX XXX
Greece XX XX XX X XX XX XX XX XX XX
Ireland XX XX XX X XX XX XX XX
Italy XX XXX XX XX XX XX XX XX XX XX XX X X
Luxembourg XX XX XX XX XX XX
Netherlands XX XX XX XX
Portugal XX XX XX XX XX XX XX
Spain XX XXX XX X XX XX
Sweden XX XX XX XX XX XX XX XXX XX XX
UK XX XXX XX XX XX XX XX XX
Bulgaria XX XX XX X XX XX
Cyprus XX XX X XX XX XX
Czech Republic
XX XXX XXX
Estonia XX XXX
Hungary XX XXX XX XX XX
Latvia XX X X
Lithuania XX XX XX XXX
Malta
Poland XXX XX XX X XX XX XX XXX XX
Romania XX XX
Slovakia XX XXX X XXX
Slovenia XX X X XX X XX XX
X, rare method XX, common use XXX, most common use