unsteady discharge calibration of a large v-notch...
TRANSCRIPT

Flow Measurement and Instrumentation 29 (2013) 19–24
Contents lists available at SciVerse ScienceDirect
Flow Measurement and Instrumentation
0955-59
http://d
n Corr
E-m
URL
journal homepage: www.elsevier.com/locate/flowmeasinst
Unsteady discharge calibration of a large V-notch weir
Hubert Chanson n, Hang Wang
The University of Queensland, School of Civil Engineering, Brisbane, QLD 4072, Australia
a r t i c l e i n f o
Article history:
Received 13 July 2012
Received in revised form
16 October 2012
Accepted 16 October 2012Available online 29 October 2012
Keywords:
901 V-notch weir
Unsteady experiments
Calibration
Discharge measurement
Seiche
Sloshing
Dam break wave
Physical modelling
Triangular V-notch thin-plate weir
86/$ - see front matter & 2012 Elsevier Ltd. A
x.doi.org/10.1016/j.flowmeasinst.2012.10.010
esponding author. Tel.: þ61 7 3365 3619; fax
ail address: [email protected] (H. Chanso
: http://www.uq.edu.au/~e2hchans/ (H. Chan
a b s t r a c t
Thin-plate weirs are commonly used as measuring devices in flumes and channels, enabling an accurate
discharge measurement with simple instruments. The calibration formulae of such devices rely upon
some empirical coefficients and there is a need to obtain new accurate physical data to complement the
existing evidence. In the present study, the discharge calibration of a large 901 V-notch thin plate weir
was performed using an unsteady volume per time technique. The V-notch weir was initially closed by
a fast-opening gate. The sudden opening induced an initial phase of the water motion dominated by the
free-falling motion of a volume of fluid in the vicinity of the weir, followed by a gradually-varied phase,
during which some seiche was observed in the tank. The relationship between water discharge and
upstream water elevation was derived from the integral form of the continuity equation. The results
yielded a dimensionless discharge coefficient Cd¼0.58 close to previous experiments for 901 V-notch
weirs. The findings showed that the unsteady discharge calibration of the V-notch weir yielded similar
results to a more traditional calibration approach based upon steady flow experiments, allowing a rapid
testing over a broad range of flow rates.
& 2012 Elsevier Ltd. All rights reserved.
1. Introduction
In open channel flows, the knowledge of the water discharge isa key parameter, and a range of measurement techniques weredeveloped [4,8,10]. Many techniques rely upon some empiricalcoefficients [1] and there is a need to obtain new accuratephysical data to complement the existing evidence. Flow measur-ing structures in waterworks, canals and wastewater plantsconsist mainly of flumes and thin plate weirs [5,9]. Thin-plateweirs enable an accurate discharge measurement with simpleinstruments [16]. The V-notch weirs, also called triangular weirs,have an overflow edge in the form of an isosceles triangle. Fig. 1presents a sketch of a 901 V-notch weir. Ref. [3] expresses thedischarge calibration of a triangular V-notch thin-plate weir inthe form:
Q ¼ Cd �8
15� tana�
ffiffiffiffiffiffiffiffiffiffiffiffiffiffiffiffiffiffiffiffiffiffiffi2� g � h5
qð1Þ
where Q is the water discharge, Cd a dimensionless dischargecoefficient, a the notch opening angle, g the gravity accelerationand h the upstream water elevation above the notch (Fig. 1). Basicdimensional considerations show that the discharge coefficient Cd
is a function of the notch angle a, the relative weir height p/W andrelative upstream depth h/p (Fig. 1). Ref. [13] presented someseminal experiments conducted with five different fluids (Table 1),
ll rights reserved.
: þ61 7 3365 4599.
n).
son).
while Refs. [5] and [9] reviewed recent findings based upon steadyflow experiments.
A very robust discharge measurement technique is the volumeper time method: ‘‘the only rational method of calibrating weirs,i.e. in accordance with hydrometric principles, is the volumetricmethod, which depends on measuring the volume, with ameasuring reservoir, and the time of flow’’ ([16], p. 310). Thetechnique may be adapted to unsteady flow situations (e.g.,[6,15]). The contribution herein presents a novel approach todetermine the discharge calibration of a large 901 V-notch weirand associated accuracy based upon a comprehensive physicalstudy. The calibration was undertaken using a volume per timeapproach by measuring the upstream water level at high fre-quency following a sudden gate opening. The results showed theapplication of the technique and highlighted a number of prac-tical issues. The paper is complemented by a digital appendixwith two movies (Table 2).
Supplementary material related to this article can be foundonline at http://dx.doi.org/10.1016/j.flowmeasinst.2012.10.010.
2. Materials and methods
2.1. Experimental facility and instrumentation
The experiments were performed with a 400 mm high 901V-notch thin-plate weir. The weir was installed at one end of a2.36 m long, 1.66 m wide and 1.22 m deep tank (Figs. 2 and 3,Table 1). The bottom of the V-notch was located 0.82 m above the

Fig. 1. Sketch of a triangular V-notch thin-plate weir.
Table 1Experimental studies of 901 V-notch weirs.
Ref. [1] Fluid(s) (2) h (m) (3) p (m) (4) B (m) (5) Fluid properties (7) Remarks (7)
[13] Water 0.070–0.152 0.91 1.07 s¼1 Tests at the University of Wisconsin
Fuel oil (Oil A) 0.018–0.122 s¼0.90–0.91
n¼0.5 to 1.5�10�4 m2/s
s¼0.03–0.031 N/m
Dustproofing oil (Oil G) 0.046–0.122 s¼0.89–0.91
n¼0.12 to 0.5�10�4 m2/s
s¼0.03–0.032 N/m
Oil C 0.03–0.055 – 0.263 s¼0.87–0.88 Tests at the University of California, Berkeley
n¼0.25 to 0.7�10�4 m2/s
s¼0.033 N/m
Oil M 0.037 to 0.061 s¼0.85�0.86
n¼0.07 to 0.2�10�4 m2/s
s¼0.032 N/m
Water 0.046–0.67 2.44 1.83 s¼1 Tests at the Cornell University
Present study Water 0.40 0.82 1.66 s¼1 Unsteady tests. L¼2.36 m. B¼1.66 m.
Water temperature: 16.5 1C
r¼998.8 kg/m3
n¼1.10�10�6 m2/s
s¼0.0739 N/m
Notes: h: upstream water elevation above notch; s: relative density; r: density; n: kinematic viscosity; s: surface tension.
H. Chanson, H. Wang / Flow Measurement and Instrumentation 29 (2013) 19–2420
tank invert. The V-notch was made out of brass and designedbased upon Ref. [3] (also [11]). The notch was initially closed witha fast-opening gate hinging outwards and upwards (Table 2).
During static tests, the water depths were measured using apointer gauge. For the dynamic tests, the unsteady water depthwas measured using a series of three acoustic displacementmeters MicrosonicTM Micþ25/IU/TC located 1.11 m upstream ofthe weir (Fig. 3). The displacement sensors had a range of220 mm, and they were positioned at various elevations to coverthe full range of free-surface elevations (i.e. 400 mm). The dataaccuracy and response time of the acoustic displacement meterswere 0.18 mm and 50 ms respectively. All the displacementsensors were synchronised and sampled simultaneously at 200 Hz.
Additional visual observations were recorded with two HDdigital video cameras, two dSLR cameras PentaxTM K-01 and K-7,and a PentaxTM Optio WG-01 digital camera. The dSLR camerasPentaxTM K-01 and K-7 were equipped with PentaxTM DA40 mmf2.8 XS and PentaxTM SMC FA31 mm f1.8 Limited prime lensesrespectively, exhibiting only slight barrel distortions: that is, about0.6% and 0.8% respectively. Some coloured vegetable dye wasadded to the water to improve the visibility of the streamlines (e.g.Fig. 3). Further details of the experiments were reported in [7].
2.2. Experimental flow conditions
The displacement meters were located 1.11 m upstream of theweir about the tank centreline (Fig. 3). The video-cameras wereplaced around the tank at various locations to cover both thewater motion in the tank and weir overflow during each test.
For each experimental run, the tank was filled slowly to thebrink of the brass plate. The tests were conducted with the reservoirinitially full: i.e., ho¼0.4 m where ho is the initially steady waterlevel above the lower edge of the notch. The water was left to settlefor several minutes prior to start. The experiment started when thegate was opened rapidly and the water level was recordedcontinuously for 500 s. The gate was operated manually and theopening times were less than 0.15–0.2 s. Such an opening time wassmall enough to have a negligible effect on the water motion in thetank [12]. After the rapid gate opening, the gate did not intrude intothe flow as seen in the photographs and movies (Table 2).
3. Results
The water level in the tank was initially still prior to gateopening. The water level fluctuations recorded by the sensorswere within the accuracy of the sensor: ho
0E0.17 mm on averagewhere ho
0 is the standard deviation of the initially steady waterlevel above the lower edge of the notch. The gate opening wasrapid and lasted less than 0.2 s. Figs. 2 and 3 illustrate sometypical gate opening sequence. The unsteady flow above the weirconsisted of an initial phase dominated by the free-falling motionof a volume of fluid in the vicinity of the notch, followed by agradually-varied flow motion. The manuscript is supplementedby two video movies: IMGP0123.mpg and IMGP0571.mpg (Table2). The movie IMGP0123.mpg shows the side view of sudden gateduring Run 2 (Duration: 8 s). The movie IMGP0571.mpg presentsa view from upstream of the tank and sudden gate opening duringRun 5 (Duration: 12 s).

Fig. 2. Side view photographs of the gate opening—experimental run no. 2, ho¼0.40 m, camera: Pentax K-7, lens: Pentax FA31 mm f1.8 Limited, shutter 1/80s—from left
to right, top to bottom: t¼0, 0.19 s, 0.38 s and 0.58 s.
Fig. 3. General view of the reservoir and V-notch weir during the gate opening—ho¼0.40 m—camera: Pentax K-7, lens: Pentax FA31 mm f1.8 Limited, shutter
1/125s—from left to right, top to bottom: t¼To, Toþ0.19 s, Toþ0.38 s, Toþ0.58 s, Toþ2.31 s, Toþ4.61 s.
H. Chanson, H. Wang / Flow Measurement and Instrumentation 29 (2013) 19–24 21
The sudden opening of the gate initiated an initial phasedominated by a free-falling motion in the close proximity of theV-notch weir and the generation of a negative wave propagating
upstream into the reservoir. Only a limited volume of water wasreached by the initial wave and the rest of the upstreamtank water was still unaffected by the gate opening. The extent
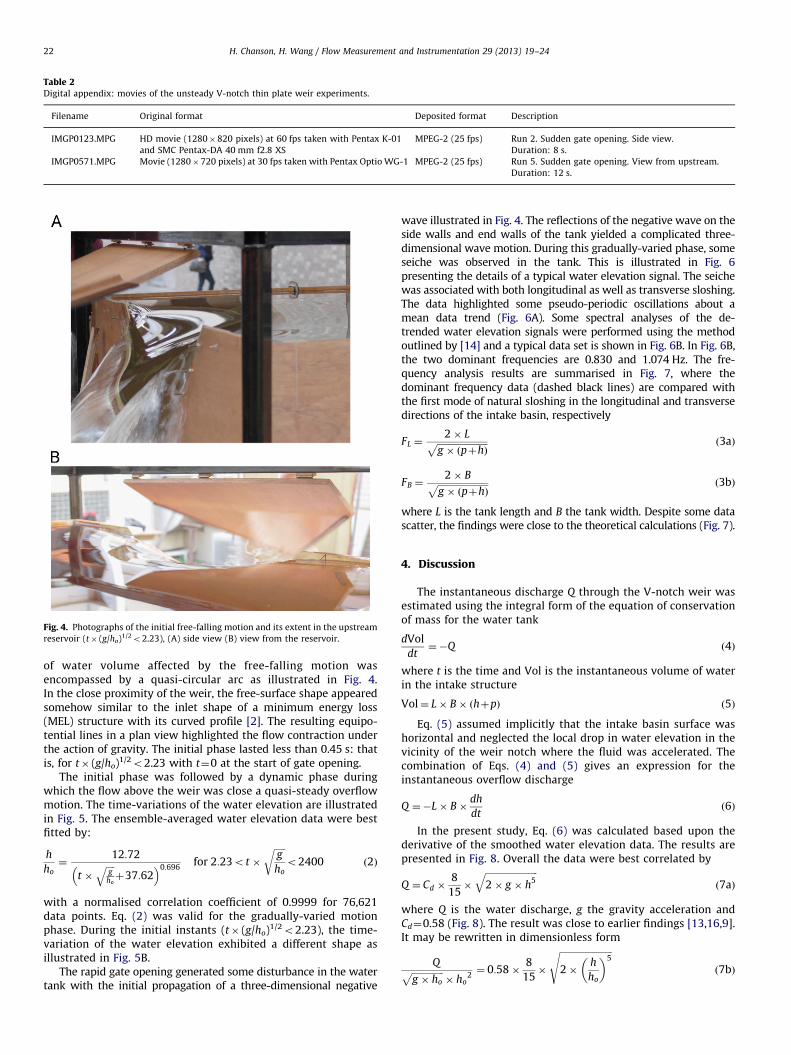
Table 2Digital appendix: movies of the unsteady V-notch thin plate weir experiments.
Filename Original format Deposited format Description
IMGP0123.MPG HD movie (1280�820 pixels) at 60 fps taken with Pentax K-01
and SMC Pentax-DA 40 mm f2.8 XS
MPEG-2 (25 fps) Run 2. Sudden gate opening. Side view.
Duration: 8 s.
IMGP0571.MPG Movie (1280�720 pixels) at 30 fps taken with Pentax Optio WG-1 MPEG-2 (25 fps) Run 5. Sudden gate opening. View from upstream.
Duration: 12 s.
Fig. 4. Photographs of the initial free-falling motion and its extent in the upstream
reservoir (t� (g/ho)1/2o2.23), (A) side view (B) view from the reservoir.
H. Chanson, H. Wang / Flow Measurement and Instrumentation 29 (2013) 19–2422
of water volume affected by the free-falling motion wasencompassed by a quasi-circular arc as illustrated in Fig. 4.In the close proximity of the weir, the free-surface shape appearedsomehow similar to the inlet shape of a minimum energy loss(MEL) structure with its curved profile [2]. The resulting equipo-tential lines in a plan view highlighted the flow contraction underthe action of gravity. The initial phase lasted less than 0.45 s: thatis, for t� (g/ho)1/2o2.23 with t¼0 at the start of gate opening.
The initial phase was followed by a dynamic phase duringwhich the flow above the weir was close a quasi-steady overflowmotion. The time-variations of the water elevation are illustratedin Fig. 5. The ensemble-averaged water elevation data were bestfitted by:
h
ho¼
12:72
t �ffiffiffiffigho
qþ37:62
� �0:696for 2:23ot �
ffiffiffiffiffig
ho
ro2400 ð2Þ
with a normalised correlation coefficient of 0.9999 for 76,621data points. Eq. (2) was valid for the gradually-varied motionphase. During the initial instants (t� (g/ho)1/2o2.23), the time-variation of the water elevation exhibited a different shape asillustrated in Fig. 5B.
The rapid gate opening generated some disturbance in the watertank with the initial propagation of a three-dimensional negative
wave illustrated in Fig. 4. The reflections of the negative wave on theside walls and end walls of the tank yielded a complicated three-dimensional wave motion. During this gradually-varied phase, someseiche was observed in the tank. This is illustrated in Fig. 6presenting the details of a typical water elevation signal. The seichewas associated with both longitudinal as well as transverse sloshing.The data highlighted some pseudo-periodic oscillations about amean data trend (Fig. 6A). Some spectral analyses of the de-trended water elevation signals were performed using the methodoutlined by [14] and a typical data set is shown in Fig. 6B. In Fig. 6B,the two dominant frequencies are 0.830 and 1.074 Hz. The fre-quency analysis results are summarised in Fig. 7, where thedominant frequency data (dashed black lines) are compared withthe first mode of natural sloshing in the longitudinal and transversedirections of the intake basin, respectively
FL ¼2� Lffiffiffiffiffiffiffiffiffiffiffiffiffiffiffiffiffiffiffiffiffiffi
g � pþhð Þp ð3aÞ
FB ¼2� Bffiffiffiffiffiffiffiffiffiffiffiffiffiffiffiffiffiffiffiffiffiffi
g � pþhð Þp ð3bÞ
where L is the tank length and B the tank width. Despite some datascatter, the findings were close to the theoretical calculations (Fig. 7).
4. Discussion
The instantaneous discharge Q through the V-notch weir wasestimated using the integral form of the equation of conservationof mass for the water tank
dVol
dt¼�Q ð4Þ
where t is the time and Vol is the instantaneous volume of waterin the intake structure
Vol¼ L� B� hþpð Þ ð5Þ
Eq. (5) assumed implicitly that the intake basin surface washorizontal and neglected the local drop in water elevation in thevicinity of the weir notch where the fluid was accelerated. Thecombination of Eqs. (4) and (5) gives an expression for theinstantaneous overflow discharge
Q ¼�L� B�dh
dtð6Þ
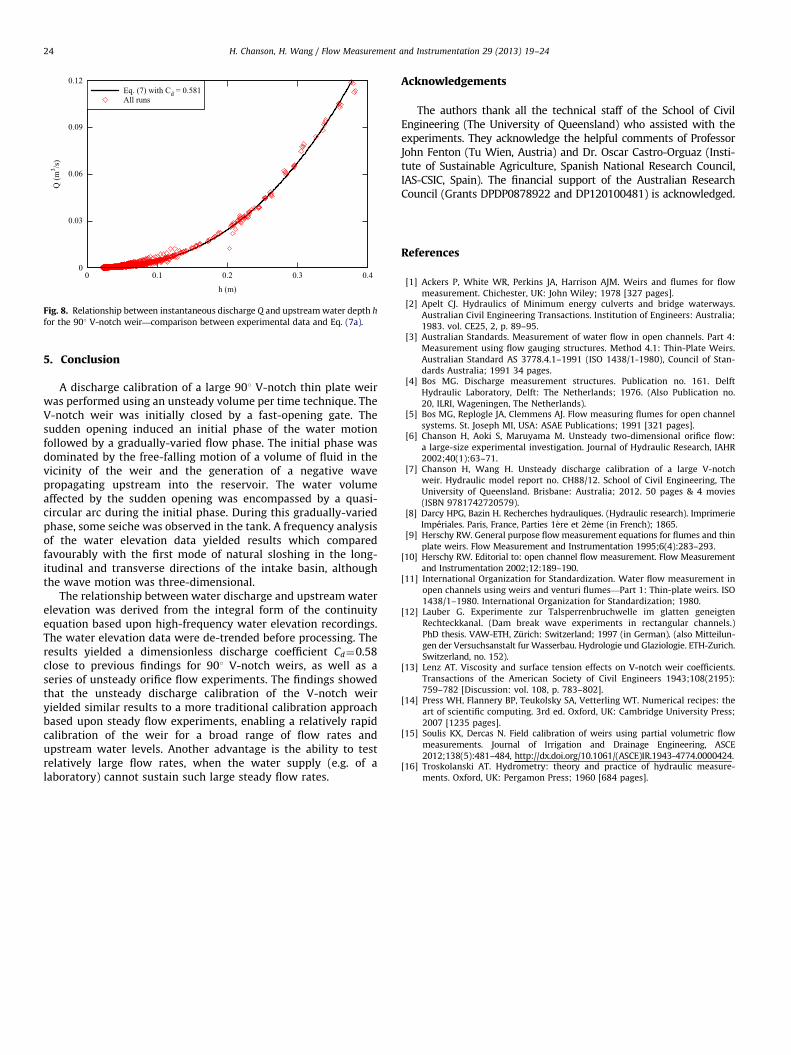
In the present study, Eq. (6) was calculated based upon thederivative of the smoothed water elevation data. The results arepresented in Fig. 8. Overall the data were best correlated by
Q ¼ Cd �8
15�
ffiffiffiffiffiffiffiffiffiffiffiffiffiffiffiffiffiffiffiffiffiffiffi2� g � h5
qð7aÞ
where Q is the water discharge, g the gravity acceleration andCd¼0.58 (Fig. 8). The result was close to earlier findings [13,16,9].It may be rewritten in dimensionless form
Qffiffiffiffiffiffiffiffiffiffiffiffiffiffig � ho
p� ho
2¼ 0:58�
8
15�
ffiffiffiffiffiffiffiffiffiffiffiffiffiffiffiffiffiffiffiffiffiffiffi2�
h
ho
� �5s
ð7bÞ

t×(g/ho)1/2
h/h o
0 300 600 900 1200 1500 1800 2100 24000
0.1
0.2
0.3
0.4
0.5
0.6
0.7
0.8
0.9
1Run 1Ensemble-average
t×(g/ho)1/2
h/h o
-2 -1 0 1 2 30.9
0.91
0.92
0.93
0.94
0.95
0.96
0.97
0.98
0.99
1
1.01
1.02
4 5
Initial phase
Run 3
Fig. 5. Dimensionless time-variation of the upstream water elevation in the water tank, (A, left) comparison between a single data set and ensemble averaged data,
(B, right) details of the initial phase during a single data set.
t×(g/ho)1/2
h/h o -
det
rend
ed d
ata
0 4 8 12 16 20 24 28 32 36 400 4 8 12 16 20 24 28 32 36 4
-0.02
3.0 3.0
h/h o
-0.06
0.02
0.06
0.1
41.0 41.0
81.0 81.0
22.0 22.0
62.0 62.0
43.0 43.01
5.0.
55.0.
6.0.
56.0.
7.0 7.
57.0 57.0
8.0 8.0
58.0 58.0
9.0 9.0
59.0 59.0
1Run 3TrendDe-trended signal
Frequency (Hz)
PSD
(Dep
th -
Tren
d)
0.2 0.3 0.40.5 0.7 1 2 3 4 550.01
0.020.03
0.050.070.1
0.20.3
0.50.7
1
23
Fig. 6. Frequency analysis of the water elevation signal, (A) raw signal and de-trended water elevation signal, (B) power spectrum density function of the de-trended signal
for 0oto12 s and 0.205oho0.4 m.
Natural sloshing frequency, Observed frequency (Hz)
h (m
)
0 0.2 0.4 0.6 0.8 1 1.2 1.4 1.6 1.8 20
0.05
0.1
0.15
0.2
0.25
0.3
0.35
0.4
0.45
Longitudinal sloshing
Transverse sloshing
Sensor 3
Sensor 2
Sensor 1
LongitudinalTransversePhysical data
Fig. 7. Summary of frequency analyses of the free-surface elevation data—com-
parison between experimental observations (black dashed lines) and the first
mode of natural sloshing frequency.
H. Chanson, H. Wang / Flow Measurement and Instrumentation 29 (2013) 19–24 23
Basically the present findings showed that the unsteadydischarge calibration of the V-notch weir yielded similar resultsto a more traditional calibration approach based upon steady flowexperiments. A feature of the present unsteady method was theability to test Eq. (7b) for a relatively wide range of dischargesduring each experimental run, without the need for a sustainedsteady flow rate.
The measurements herein were recorded for 0.022oho0.40 m.Although the results herein focused on water elevations withinthe range 0.025oho0.40 m, the Reynolds number Q= h� nð Þ
became less than 1�104 for ho0.038 m. It is conceivable thatviscous scale effects might affect the findings for the smallestwater elevations.
For completeness, during some unsteady experiments with atwo-dimensional orifice flow, Chanson et al. [6] used the follow-ing discharge equation:
Q ¼ Cd � A�ffiffiffiffiffiffiffiffiffiffiffiffiffiffiffiffiffiffiffiffi2� g � h
pð8Þ
where A is the orifice cross-section area and Cd was found to beCdE0.58. Assuming A¼h2 for a triangular V-notch weir, Eq. (8)becomes basically identical to Eq. (7a) despite the differentgeometries.
h (m)
Q (m
3 /s)
0 0.1 0.2 0.3 0.40
0.03
0.06
0.09
0.12Eq. (7) with Cd = 0.581All runs
Fig. 8. Relationship between instantaneous discharge Q and upstream water depth h
for the 901 V-notch weir—comparison between experimental data and Eq. (7a).
H. Chanson, H. Wang / Flow Measurement and Instrumentation 29 (2013) 19–2424
5. Conclusion
A discharge calibration of a large 901 V-notch thin plate weirwas performed using an unsteady volume per time technique. TheV-notch weir was initially closed by a fast-opening gate. Thesudden opening induced an initial phase of the water motionfollowed by a gradually-varied flow phase. The initial phase wasdominated by the free-falling motion of a volume of fluid in thevicinity of the weir and the generation of a negative wavepropagating upstream into the reservoir. The water volumeaffected by the sudden opening was encompassed by a quasi-circular arc during the initial phase. During this gradually-variedphase, some seiche was observed in the tank. A frequency analysisof the water elevation data yielded results which comparedfavourably with the first mode of natural sloshing in the long-itudinal and transverse directions of the intake basin, althoughthe wave motion was three-dimensional.
The relationship between water discharge and upstream waterelevation was derived from the integral form of the continuityequation based upon high-frequency water elevation recordings.The water elevation data were de-trended before processing. Theresults yielded a dimensionless discharge coefficient Cd¼0.58close to previous findings for 901 V-notch weirs, as well as aseries of unsteady orifice flow experiments. The findings showedthat the unsteady discharge calibration of the V-notch weiryielded similar results to a more traditional calibration approachbased upon steady flow experiments, enabling a relatively rapidcalibration of the weir for a broad range of flow rates andupstream water levels. Another advantage is the ability to testrelatively large flow rates, when the water supply (e.g. of alaboratory) cannot sustain such large steady flow rates.
Acknowledgements
The authors thank all the technical staff of the School of CivilEngineering (The University of Queensland) who assisted with theexperiments. They acknowledge the helpful comments of ProfessorJohn Fenton (Tu Wien, Austria) and Dr. Oscar Castro-Orguaz (Insti-tute of Sustainable Agriculture, Spanish National Research Council,IAS-CSIC, Spain). The financial support of the Australian ResearchCouncil (Grants DPDP0878922 and DP120100481) is acknowledged.
References
[1] Ackers P, White WR, Perkins JA, Harrison AJM. Weirs and flumes for flowmeasurement. Chichester, UK: John Wiley; 1978 [327 pages].
[2] Apelt CJ. Hydraulics of Minimum energy culverts and bridge waterways.Australian Civil Engineering Transactions. Institution of Engineers: Australia;1983. vol. CE25, 2, p. 89–95.
[3] Australian Standards. Measurement of water flow in open channels. Part 4:Measurement using flow gauging structures. Method 4.1: Thin-Plate Weirs.Australian Standard AS 3778.4.1–1991 (ISO 1438/1-1980), Council of Stan-dards Australia; 1991 34 pages.
[4] Bos MG. Discharge measurement structures. Publication no. 161. DelftHydraulic Laboratory, Delft: The Netherlands; 1976. (Also Publication no.20, ILRI, Wageningen, The Netherlands).
[5] Bos MG, Replogle JA, Clemmens AJ. Flow measuring flumes for open channelsystems. St. Joseph MI, USA: ASAE Publications; 1991 [321 pages].
[6] Chanson H, Aoki S, Maruyama M. Unsteady two-dimensional orifice flow:a large-size experimental investigation. Journal of Hydraulic Research, IAHR2002;40(1):63–71.
[7] Chanson H, Wang H. Unsteady discharge calibration of a large V-notchweir. Hydraulic model report no. CH88/12. School of Civil Engineering, TheUniversity of Queensland. Brisbane: Australia; 2012. 50 pages & 4 movies(ISBN 9781742720579).
[8] Darcy HPG, Bazin H. Recherches hydrauliques. (Hydraulic research). ImprimerieImperiales. Paris, France, Parties 1�ere et 2�eme (in French); 1865.
[9] Herschy RW. General purpose flow measurement equations for flumes and thinplate weirs. Flow Measurement and Instrumentation 1995;6(4):283–293.
[10] Herschy RW. Editorial to: open channel flow measurement. Flow Measurementand Instrumentation 2002;12:189–190.
[11] International Organization for Standardization. Water flow measurement inopen channels using weirs and venturi flumes—Part 1: Thin-plate weirs. ISO1438/1–1980. International Organization for Standardization; 1980.
[12] Lauber G. Experimente zur Talsperrenbruchwelle im glatten geneigtenRechteckkanal. (Dam break wave experiments in rectangular channels.)PhD thesis. VAW-ETH, Zurich: Switzerland; 1997 (in German). (also Mitteilun-gen der Versuchsanstalt fur Wasserbau. Hydrologie und Glaziologie. ETH-Zurich.Switzerland, no. 152).
[13] Lenz AT. Viscosity and surface tension effects on V-notch weir coefficients.Transactions of the American Society of Civil Engineers 1943;108(2195):759–782 [Discussion: vol. 108, p. 783–802].
[14] Press WH, Flannery BP, Teukolsky SA, Vetterling WT. Numerical recipes: theart of scientific computing. 3rd ed. Oxford, UK: Cambridge University Press;2007 [1235 pages].
[15] Soulis KX, Dercas N. Field calibration of weirs using partial volumetric flowmeasurements. Journal of Irrigation and Drainage Engineering, ASCE2012;138(5):481–484, http://dx.doi.org/10.1061/(ASCE)IR.1943-4774.0000424.
[16] Troskolanski AT. Hydrometry: theory and practice of hydraulic measure-ments. Oxford, UK: Pergamon Press; 1960 [684 pages].