(untitled) | us epa archive document · page 1 introduction the purpose of this document is to...
TRANSCRIPT


Not To Scale8-hrOZnonATT
07-15-03
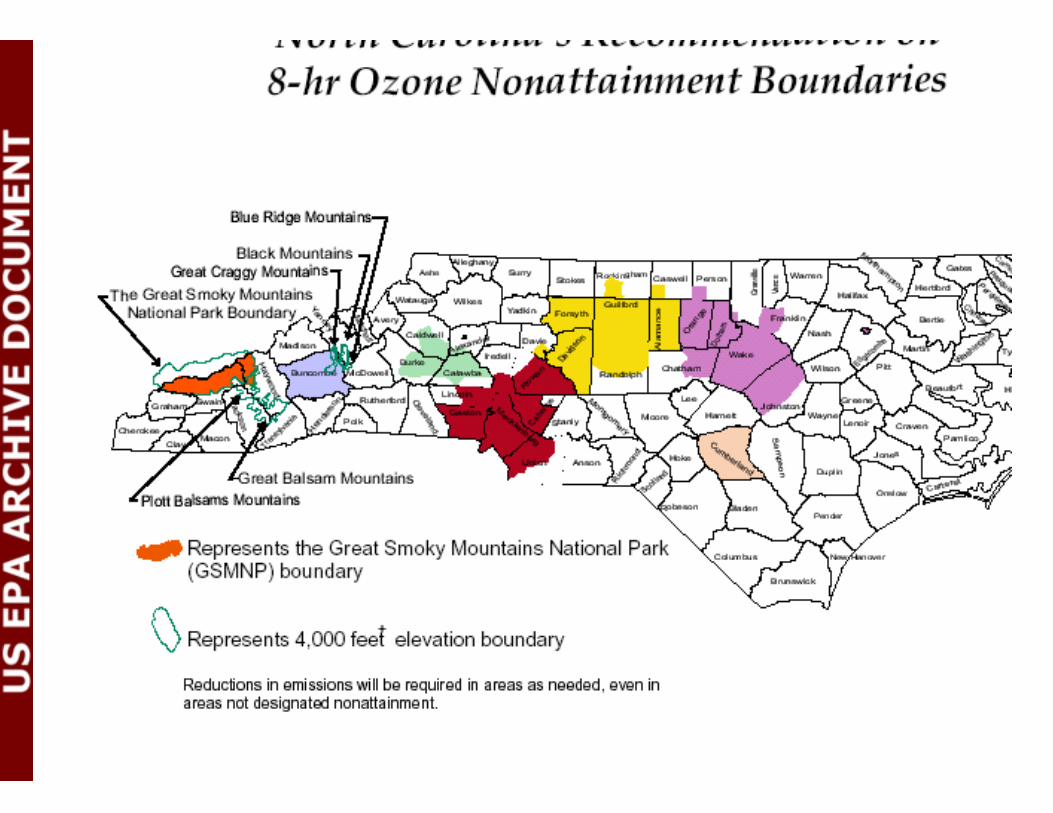
North Carolina’s Recommendation on
8-hr Ozone Nonattainment Boundaries
Columbus
Robeson Bladen
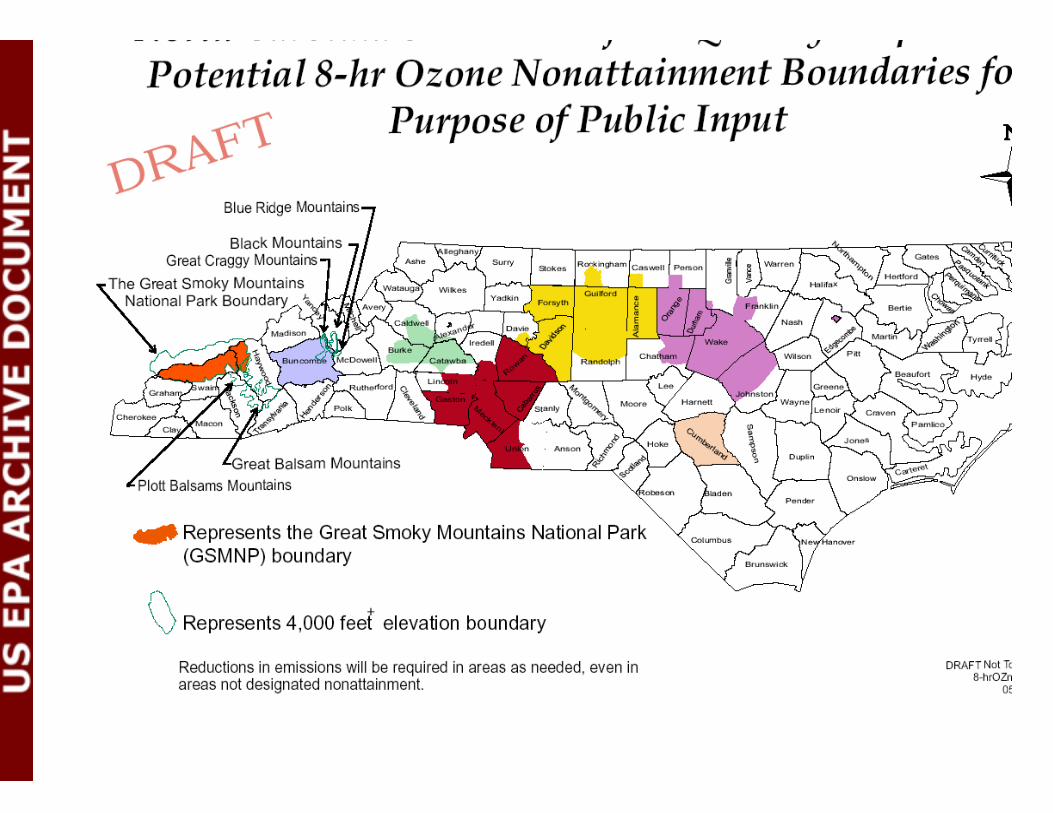
Reductions in emissions will be required in areas as needed, even in areas not designated nonattainment.
Represents the Great Smoky Mountains National Park (GSMNP) boundary
Represents 4,000 feet elevation boundary+
Cherokee
Clay
Graham
MaconTra
nsylv
ania
Buncombe McDowell
Madison
Yance
y
Rutherford
Iredell
Hen
ders
on
Polk
Swain Jackson
Ashe SurryStokes
Alleghany
YadkinWilkes
Davie
Rockingham
Avery
Mitch
ell
GuilfordWatauga
Gaston
Anson
Moore
Lee
Stanly
Montgom
ery
Ric
hm
ond
Cle
vela
nd
Hoke
Scotla
nd
Brunswick
LenoirWayne
Greene
Sam
pson
Pender
Duplin
Onslow
Craven
Carteret
Pamlico
Jones
Beaufort
New Hanover
Gra
nvill
e
Vanc
e Warren
Hertford
Pitt
Dare
Halifax
PersonCaswell
Hyde
Martin
Wash
ingto
n
Tyrrell
Bertie
Gates
Chowan
Pasquotank
Camden
Currituck
Perquimans
Wake
Wilson
Nash
Edgecombe
Ora
nge
Johnston
Dur
ham
Ala
ma
nce
Cum
berland
Northam
pton
Harnett
Hayw
ood
The Great Smoky MountainsNational Park Boundary
Black Mountains
Great Balsam Mountains
Forsyth
Dav
idso
n
Row
an
Franklin
Lincoln
Chatham
Plott Balsams Mountains
Caldwell
Burke
Catawba
Alexander
Randolph
Blue Ridge Mountains
Great Craggy Mountains
Union
Mecklenburg
Cab
arru
s

State of North Carolina’sRecommendation on Boundaries
of 8-Hour OzoneNonattainment Areas
July 15, 2003Governor Michael F. Easley

Table of Contents
Introduction ..................................................................................................................1Background ..................................................................................................................1Summary of Recommendations ....................................................................................1North Carolina Counties with 8-Hour Ozone Violations 2000-2002 Map......................2North Carolina’s Proposal on Potential 8-Hour Ozone Nonattainment Areas ................3North Carolina’s Proposal Presented at Public Meetings ...............................................6Potential 8-hour Ozone Nonattainment Designations Map Following Full MSA
And Full County Boundaries .............................................................................7Appendix A: Public Comments ReceivedAppendix B: National Park Service Letter of SupportAppendix C: Boundary Guidance on Air Quality Designations for the 8-Hour Ozone
National Ambient Air Quality Standards (NAAQS or Standard)Appendix D: North Carolina’s Vehicle Inspection and Maintenance County Phase-In MapAppendix E: North Carolina MSA Map and County Township MapsAppendix F: 1997 North Carolina Emissions DataAppendix G: North Carolina 2000 Population Map and Population Density MapAppendix H: North Carolina 2001 Daily Vehicle Miles Traveled Data and MapAppendix I: Commuting Patterns for Larger Urbanized Counties in North CarolinaAppendix J: North Carolina Population Growth RatesAppendix K: Wind Backward Trajectories

Page 1
IntroductionThe purpose of this document is to provide the State of North Carolina’s recommendation onboundaries for the 8-hour ozone standard nonattainment areas.The United States Environmental Protection Agency (EPA) established a new standard for ozonein July 1997. The new standard is referred to as the 8-hour standard because it is based on thehighest rolling 8-hour average of ozone concentrations. The new standard was tied up inlitigation, but recently cleared all legal hurdles. EPA has instructed the States to submit theirrecommendations for nonattainment boundaries for any monitors violating the 8-hour ozonestandard by July 15, 2003. EPA will then provide comments back to the States by October 2003.These written comments from EPA begin a 120-day period during which the States and EPA canwork out any issues on the nonattainment boundaries. EPA will make the final decision onboundaries by April 15, 2004. This decision on 8-hour ozone nonattainment areas willsubsequently be published in the Federal Register and codified in 40 CFR 81.
BackgroundThe Clean Air Act (CAA) requires EPA to designate areas as attainment or nonattainmentfollowing the promulgation of a new national ambient air quality standard (NAAQS). Thenonattainment boundaries are to be based on the data collected at the ambient air monitoringstations. The State and local air programs operate the monitoring sites. The data is qualityassured, and then submitted to EPA where it becomes part of a national database. The CAArequires that the monitoring data be evaluated to determine which monitors meet the standardand which monitors violate the standard. For the 8-hour ozone standard, three years worth ofdata for each monitor is evaluated. The fourth highest value for each of the three years isaveraged together. The resulting average is then compared to the standard. The three-yearaverage is referred to as the design value. EPA set the 8-hour ozone standard at 0.08 parts permillion (ppm). However, in evaluating the monitoring data, EPA allows a rounding conventionto account for the uncertainty in the monitoring devices. Therefore, a monitored three-yearaverage of 0.084 ppm is considered to meet or attain the standard, while a three-year average of0.085 ppm or greater is considered to violate the ambient standard.North Carolina has evaluated the monitoring data for the State for the most recent three yearperiod of 2000-2002, and has determined that a total of 33 out of 45 monitors currently violatethe 8-hour ozone standard. A map showing the highest design value in each county is includedas Figure 1. The highest design value in the State at 0.102 ppm is observed at a monitor locatedin Mecklenburg County. The lowest design value in the State at 0.074 ppm is observed at theBryson City monitor in Swain County. The higher design values tend to occur along the I-85/I-40 corridor from Charlotte through the Triad and over to the Triangle, where most of the peoplelive and work.Summary of Recommendation
The State of North Carolina’s recommendation for the nonattainment designation for the8-hour ozone standard is reflected in the attached map entitled, “North Carolina’s Proposal onPotential 8-hour Ozone Nonattainment Boundaries” (Figure 2). The

Page 1
Page 2

Page 4
recommendation includes full county designation for Alamance, Buncombe, Cumberland,Davidson, Durham, Forsyth, Gaston, Guilford, Mecklenburg, Orange, and Wake Counties, andpartial county designations for Alexander, Burke, Cabarrus, Caldwell, Caswell, Catawba,Chatham, Davie, Edgecombe, Franklin, Granville, Haywood, Iredell, Jackson, Johnston,Lincoln, McDowell, Person, Randolph, Rockingham, Rowan, Swain, Union, and YanceyCounties.
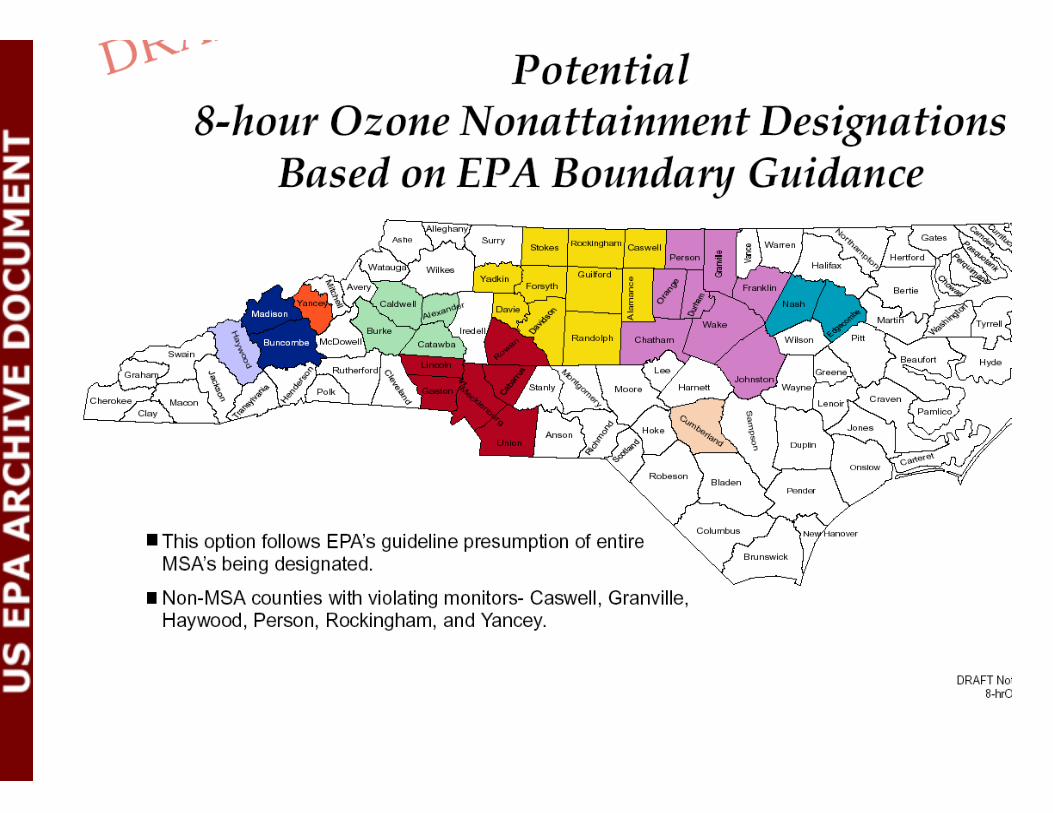
In May of 2003, 12 public meetings were held across the State where a proposal by theNorth Carolina Division of Air Quality was presented (Figure 3). Additionally, potentialnonattainment boundaries following full county designations of entire metropolitan statisticalareas (MSA) violating the standard, non-MSA counties with violating monitors and countiesbelieved to contribute to the ozone problem were also presented (Figure 4).
This designation recommendation takes into consideration comments received during the12 public meetings and during the public comment period that ended on May 31, 2003.Appendix A contains the comments received. The rationale for the designationrecommendations is that in the core urban areas where the higher ozone design values areobserved, whole counties are selected. In the less urbanized areas where the population andvehicle miles traveled are somewhat low, yet the monitoring data shows violations of the 8-hourozone standard, partial counties are selected. In most instances, the partial county designationswere represented by city or township boundaries. In the mountain areas (Buncombe, Haywood,Jackson, McDowell, Swain and Yancey Counties), the North Carolina portion of the GreatSmokey Mountain National Park, and elevations above 4000 feet in the Great Balsams, PlottBalsams, Great Craggy and Black Mountains and a portion of the Blue Ridge Mountains arebeing recommended for designation. This is due to the violations occurring only at highelevations in these areas. The full discussion of the partial county designations, including adiscussion on the mountain area designations, is discussed later. In addition, attached inAppendix B is a letter from the U.S. National Park Service supporting the nonattainmentboundary recommendations. This letter was done in 2000 during an earlier boundaryrecommendation process, but recent discussions with the U.S. National Park Service revealedthat they continue to believe that the entire Great Smokey Mountain National Park should bedesignated as nonattainment based on violations of the 8-hour ozone standard occurring atmonitoring sites on the Tennessee side of the Park.
This designation recommendation addresses the designation area boundaries criteria laidout in the March 28, 2000 memo from John Seitz, Director of EPA Office of Air QualityPlanning and Standards entitled, “Boundary Guidance on Air Quality Designations for the 8-Hour Ozone National Ambient Air Quality Standards (NAAQS or Standard)”. This guidance isattached in Appendix C. An additional and important consideration is that North Carolina hasthe legal authority to regulate emission sources in any area of the State irrespective of Federaldesignation status.
The actual designation is only the first step in the implementation of the new 8-hourozone standard. The next major requirement is the development of the State implementationplan that contains the necessary rules for the state so that all areas can attain the standard by theattainment date. In order to accomplish this requirement, North Carolina is in the process of amodeling analysis to conclude what control strategies are necessary to address the 8-hourviolations in the State. This modeling analysis will be completed in 2004 to support the Early

Page 5
Action Compact areas. Clean air legislation was passed in the 1999 session of the GeneralAssembly. This legislation requires the expansion of the vehicle inspection and maintenanceprogram to 48 counties and requires that the test be changed to On-Board Diagnostics systemcheck, which addresses NOx emissions. Appendix D contains a map showing theimplementation of this progressive inspection and maintenance program. This programdemonstrates North Carolina’s willingness and ability to establish control programs in countiesregardless of the nonattainment designation. The legislation also sets goals for AFV fleets,telecommuting for state employees, and reduction of the VMT growth rate. This legislation,combined with the additional strategies identified in the modeling analysis will ensure compliancewith the 8-hour ozone standard.
Finally, North Carolina implements an extensive ozone action day program in six areas,the Greater Charlotte area, Triad, Triangle, Fayetteville, Hickory and Asheville. This programwarns citizens of upcoming ozone events so that the public can better protect their health, andtake action to reduce their own emission producing activities.
Page 1
Page 2
[Insert DAQ Proposal Map – Figure 3] –in T:/sholman/jpg&PDF/ file that ends in public
Page 8
Following in Table 1 is North Carolina’s recommendation of areas as either nonattainment orattainment under the 8-hour ozone standard.
Table 1: North Carolina – Ozone (8-Hour Standard)
Designated Area Designation Type
ClassificationType
Asheville Area:Buncombe CountyCharlotte-Gastonia-Rock Hill Area:Gaston CountyMecklenburg CountyCabarrus County
Central Cabarrus TownshipConcord TownshipGeorgeville TownshipHarrisburg TownshipKannapolis TownshipMidland TownshipNew Gilead TownshipOdell TownshipPoplar Tent Township
Iredell CountyDavidson TownshipCoddle Creek Township
Lincoln CountyAll parts east of South Fork of CatawbaRiver from Catawba County Line toHighway 150 to Gaston County Line
Rowan CountyAtwell TownshipChina Grove TownshipFranklin TownshipGold Hill TownshipLitaker TownshipLocke TownshipMorgan TownshipProvidence TownshipSalisbury Township
Union CountyMecklenburg Union MetropolitanPlanning Organization Boundary asadopted May 2003
Fayetteville Area:Cumberland County
Nonattainment – EarlyAction Compact AreaNonattainment
Nonattainment – EarlyAction Compact Area

Page 9
Greensboro-Winston-Salem-High PointArea:Alamance CountyDavidson CountyForsyth CountyGuilford CountyCaswell County
Stoney Creek TownshipDavie County
Jerusalem TownshipRandolph County
North of Highway 64 and including theAsheboro municipal boundary
Rockingham CountyNew Bethel Township
Hickory-Newton-Conover Area:Alexander County
Taylorsville municipal boundaryUnifour Metropolitan PlanningOrganization Boundary
Burke CountyUnifour Metropolitan PlanningOrganization Boundary
Caldwell CountyUnifour Metropolitan PlanningOrganization Boundary
Catawba CountyUnifour Metropolitan PlanningOrganization Boundary
Raleigh-Durham-Chapel Hill Area:Durham CountyOrange CountyWake CountyChatham County
Baldwin TownshipCenter TownshipNew Hope TownshipWilliams Township
Franklin CountyFranklinton TownshipYoungsville Township
Granville CountyDutchville Township
Johnston CountyWest of Interstate 95
Person County
Nonattainment – EarlyAction Compact Area
Nonattainment – EarlyAction Compact Area
Nonattainment

Page 10
Bushy Fork TownshipRocky Mount Area:Edgecombe County
Leggett municipal boundaryGreat Smoky Mountains National ParkHaywood County
Park BoundarySwain County
Park BoundaryGreat Balsam and Plott Balsam MountainsAbove 4000 feet elevation in these mountainranges in Haywood and Jackson CountiesBlue Ridge, Black and Great CraggyMountainsAbove 4000 feet elevation in these mountainranges in Buncombe, McDowell and YanceyCountiesRest of State
Nonattainment
Nonattainment
Nonattainment
Nonattainment
Attainment

Page 11
North Carolina’s Recommendations on Boundaries for 8-hour OzoneNonattainment AreasPurpose: The purpose of this documentation is to address the criteria EPA established forconsidering boundaries less than the full MSA for designation. This document only covers areaswhere the recommendation is less than the full MSA, or where additional areas beyond the MSAare recommended for nonattainment designation.
Charlotte/Gastonia/Rock Hill Area
Figure 5: Map showing location of ozone monitors and their 3 year design values in parts per billion in theCharlotte/Gastonia/Rock Hill MSA. The green shaded counties indicate the area for which the ozone forecast isdeveloped each day from May 1 through September 30.
The monitors in the Charlotte/Gastonia/Rock Hill MSA currently measure the highestozone values in the State. North Carolina recommends, relative to the North Carolina Counties,that the whole counties of Gaston and Mecklenburg, and partial counties of Cabarrus, Iredell,Lincoln, Rowan and Union be designated as nonattainment. The partial countyrecommendations are discussed below, along with the 11 criteria EPA identified in theirnonattainment boundary guidance that should be addressed.
Χ Cabarrus County -This is an MSA county, and it does not have a monitor located in theCounty. The recommendation includes the entire county except for three smalltownships in the northeastern corner of the county located in 1 Census tract containing
Page 12
50-100 people per square mile. Appendix E contains the North Carolina MSA map andthe county maps showing the Townships and population of each Township.
Χ The recommendation is that the townships of Central Cabarrus, Concord, GeorgevilleHarrisburg, Kannapolis, Midland, New Gilead, Odell, and Poplar Tent be designated asnonattainment.
Χ Emissions and Air Quality in Adjacent Areas: Based on 1997 emissions inventories,Cabarrus County has 24.35 tons per day of NOx (state total is 2529 tons per day) and thecounty has 22.99 tons per day of VOC (state total is 1842 tons per day – anthropogeniconly). Appendix F contains the 1997 emissions data. This data was generated for the 8-hour ozone modeling project, and is based on the mobile emissions factor model,MOBILE5b. The emissions are currently being recalculated using EPA’s new mobileemission factor model, MOBILE6.
Χ Population Density and Degree of Urbanization: 131,063 people live in CabarrusCounty, 122,451 people live in the townships recommended as nonattainment. Thenortheastern portion of County has low population density, with 1 tract containing 50-100people per square mile. The three townships in this Census tract have 8,612 people livingin them and we recommend keeping these three townships in attainment. Appendix Gcontains the 2000 population map, and population density map.
Χ Monitoring Data: As shown in Figure 5 above, this area has 7 monitors with designvalues ranging from 0.088 ppm to 0.102 ppm. The monitors located nearest CabarrusCounty are in neighboring Rowan County in Enochville with a design value of 0.101ppm, and Mecklenburg County at the County Line monitor with a design value of 0.102ppm.
Χ Location of Emission Sources: There are some industrial sources in the county, but thetotal point source NOx emissions are only 2.44 tons per day.
Χ Traffic and Commuting Patterns: Cabarrus County has 3,645,950 Daily VMT.Cabarrus County contributes 4.8 percent of the commuters who drive in to MecklenburgCounty to work each day, or about 22,693 people. Cabarrus ranks number 4 in thecommuting counties into Mecklenburg. Appendix H contains a table showing the 2001Daily VMT per county, along with the 2000 population and the current design value forthose counties that have monitors. Additionally, a map of the 2001 Daily VMT isprovided. Appendix I contains the commuting pattern maps and data for each of thelarger metropolitan counties, showing the number of workers commuting in to the coreurbanized counties each day. This data was obtained from the 2000 Census.
Χ Expected Growth: The population in Cabarrus County is expected to grow between2000 and 2010, with a total increase of 28.0%. Appendix J contains a table showing thepopulation growth by county from 1990 to 2000, as well as the projected populationgrowth from 2000 to 2010.
Χ Meteorology: Winds across Cabarrus County are climatologically from the southwest.With this climatological wind pattern, the emissions in the southern part of the countywill likely impact the Rowan County monitors. On days when the winds are from thenorth, the emissions will add to the Charlotte area’s pollution.
Χ Geography/Topography: There are no special geography or topography issues toconsider in this region.
Χ Jurisdictional Boundaries: The existing 1-hour ozone standard maintenance areaincludes Mecklenburg and Gaston Counties, both of which are included in NorthCarolina’s recommendation as nonattainment for the 8-hour ozone standard.
Χ Level of control of emissions sources: Currently there are few major point sources in

Page 13
Cabarrus County to control. The majority of the NOx emissions are from mobile sources(12.93 tons of the 24.35 tons come from mobile sources each day, and an additional 8.16tons per day comes from nonroad sources), and the combined Federal and state controlprograms will address these emissions. Low sulfur gasoline will be required statewide.Cabarrus County has an I/M program that requires both idle testing for older cars andOBD testing for model year 1996 and newer cars.
Χ Regional Emissions Reductions: Duke Energy’s Marshall facility located in nearbyCatawba County is one of the utility sources subject to control under the NOx SIP call, asis the Transco Natural Gas Pumping Station in Iredell County.
Χ DENR’s ability to control sources throughout the state: The North Carolina GeneralStatute allows sources anywhere in the state to be controlled under an attainment strategy,regardless of designation. North Carolina believes this is an important consideration forsetting nonattainment boundaries. The new inspection and maintenance program thatrequires on-board diagnostic testing in 48 counties (phased in between 2002 and 2006) isan example of North Carolina’s ability to control sources in counties regardless of thenonattainment designations. The new I/M program was adopted in 1999.
Χ Iredell County -This is not an MSA county, and it does not have a monitor located in theCounty. This is a high commuter county into the Charlotte area along the I-77 corridor.The northern portion of the county is rural, so the recommendation is for a smaller areathan the entire county.
Χ The recommendation is that the two townships in the southern portion of Iredell County,Coddle Creek and Davidson Townships, as defined by the 2000 Census, be designated asnonattainment.
Χ Emissions and Air Quality in Adjacent Areas: Based on 1997 emissions inventories,Iredell County has 44.29 tons per day of NOx (state total is 2529 tons per day) and thecounty has 28.13 tons per day of VOC (state total is 1842 tons per day – anthropogeniconly).
Χ Population Density and Degree of Urbanization: 122,660 people live in Iredell County,39,885 people live in the two townships recommended as nonattainment. The northernportion of County has low population density, with 2 tracts containing 50-100 people persquare mile, and 6 tracts with 100-250 people per square mile. The northern portion alsoincludes Statesville, with 1 tract containing 250-500 people per square mile, and 5 smalltracts with 500-1500 people per square mile. The portion that is recommended to bedesignated nonattainment has 1 tract with 250-500 people per square mile, and 2 smalltracts with 500-1500 people per square mile.
Χ Monitoring Data: As shown in Figure 5 above, this area has 7 monitors with designvalues ranging from 0.088 ppm to 0.102 ppm. The monitor located nearest IredellCounty is in neighboring Rowan County in Enochville with a design value of 0.101 ppm.However, on days when this monitor has the highest readings, the winds are generally outof the southwest, indicating that the emissions from southern Iredell County are not likelyto contribute to the Enochville monitor’s high ozone levels.
Χ Location of Emission Sources: There are some industrial sources in the county,including a natural gas pumping station, which is subject to the NOx SIP call.
Χ Traffic and Commuting Patterns: Iredell County has 4,579,180 Daily VMT. IredellCounty contributes 2 percent of the commuters who drive in to Mecklenburg County towork each day, or about 9,604 people. Iredell ranks number 5 in the commuting counties

Page 14
into Mecklenburg. There is a substantial drop, though from the number 4 commutingcounty, which is Cabarrus. Each day, approximately 22,693 people drive from CabarrusCounty into Mecklenburg County to work.
Χ Expected Growth: The population in Iredell County is expected to grow between 2000and 2010, with a total increase of 26.0%.
Χ Meteorology: Winds across Iredell County are climatologically from the southwest.With this climatological wind pattern, the emissions in the southern part of the countywill likely impact the Triad area. On days when the winds are from the north, theemissions will add to the Charlotte area’s pollution.
Χ Geography/Topography: There are no special geography or topography issues toconsider in this region.
Χ Jurisdictional Boundaries: The existing 1-hour ozone standard maintenance areaincludes Mecklenburg and Gaston Counties, both of which are included in NorthCarolina’s recommendation as nonattainment for the 8-hour ozone standard.
Χ Level of control of emissions sources: Currently there are few major point sources inIredell County to control. The majority of the NOx emissions are from mobile sources(27.35 tons of the 44.29 tons come from mobile sources each day), and the combinedFederal and state control programs will address these emissions. Low sulfur gasoline willbe required statewide. An I/M program will begin in Iredell County on July 1, 2003.
Χ Regional Emissions Reductions: Duke Energy’s Marshall facility located inneighboring Catawba County is one of the utility sources subject to control under theNOx SIP call, as is the Transco Natural Gas Pumping Station in Iredell County.
Χ DENR’s ability to control sources throughout the state: The North Carolina GeneralStatute allows sources anywhere in the state to be controlled under an attainment strategy,regardless of designation. North Carolina believes this is an important consideration forsetting nonattainment boundaries. The new inspection and maintenance program thatrequires on-board diagnostic testing in 48 counties (phased in between 2002 and 2006) isan example of North Carolina’s ability to control sources in counties regardless of thenonattainment designations. The new I/M program was adopted in 1999.
Χ Lincoln County -This is an MSA county, and it does have a monitor located in theCounty. The western portion of the county is rural, so the recommendation is for asmaller area than the entire county.
Χ The recommendation is that the area east of the South Fork of the Catawba River fromthe Catawba/Lincoln County line south to Highway 150 to the Lincoln/Gaston CountyLine be designated as nonattainment.
Χ Emissions and Air Quality in Adjacent Areas: Based on 1997 emissions inventories,Lincoln County has 10.31 tons per day of NOx (state total is 2529 tons per day) and thecounty has 12.15 tons per day of VOC (state total is 1842 tons per day – anthropogeniconly).
Χ Population Density and Degree of Urbanization: 63,780 people live in Lincoln County.The western portion of County has low population density, with 2 tracts containing 50-100 people per square mile, and 2 tracts with 100-250 people per square mile. Theportion that is recommended to be designated nonattainment has 4 tracts with 250-500people per square mile, and 3 tracts with 100-250 people per square mile.
Χ Monitoring Data: As shown in Figure 5 above, this area has 7 monitors with designvalues ranging from 0.088 ppm to 0.102 ppm. The monitor located in Lincoln County is

Page 15
in the community of Crouse with a design value of 0.094 ppm.Χ Location of Emission Sources: There are some industrial sources in the county, with
3.91 tons per day of the NOx emissions coming from the point sources.Χ Traffic and Commuting Patterns: Lincoln County has 1,432,320 Daily VMT. Lincoln
County contributes 1.4 percent of the commuters that drive to Mecklenburg County towork each day, or about 6,545 people. Lincoln County ranks number 6 in the commutingcounties into Mecklenburg. There is a substantial drop, though from the number 4commuting county, which is Cabarrus. Each day, approximately 22,693 people drivefrom Cabarrus County into Mecklenburg County to work.
Χ Expected Growth: The population in Lincoln County is expected to grow between 2000and 2010, with a total increase of 22.1%.
Χ Meteorology: Winds across Lincoln County are climatologically from the southwest.With this climatological wind pattern, the emissions in the county will likely impact theHickory area. On days when the winds are from the north, the emissions will add to theCharlotte area’s pollution. For each county that has a violating monitor and NorthCarolina is recommending less than full county boundaries as nonattainment, windtrajectories were done for each day the monitor exceeded the 8-hour ozone standard in2000, 2001, and 2002. Appendix K contains the wind trajectories for the monitorslocated in counties where the State is not recommending full county boundaries asnonattainment. Appendix K also contains a summary for each day in which a trajectorywas done showing the likely primary and secondary sources of air pollution for thesemonitors. Wind trajectories were done only on days when the 8-hour standard wasexceeded.
Χ Geography/Topography: There are no special geography or topography issues toconsider in this region.
Χ Jurisdictional Boundaries: The existing 1-hour ozone standard maintenance areaincludes Mecklenburg and Gaston Counties, both of which are included in NorthCarolina’s recommendation as nonattainment for the 8-hour ozone standard.
Χ Level of control of emissions sources: Currently there are few major point sources inLincoln County to control. The majority of the NOx emissions are from mobile andnonroad sources (3.61 tons from mobile and 2.55 tons from nonroad of the total 10.31tons), and the combined Federal and state control programs will help address theseemissions. Low sulfur gasoline will be required statewide. An I/M program will begin inLincoln County on January 1, 2004.
Χ Regional Emissions Reductions: Duke Energy’s Marshall facility located inneighboring Catawba County is one of the utility sources subject to control under theNOx SIP call, as is the Transco Natural Gas Pumping Station in Iredell County.
Χ DENR’s ability to control sources throughout the state: The North Carolina GeneralStatute allows sources anywhere in the state to be controlled under an attainment strategy,regardless of designation. North Carolina believes this is an important consideration forsetting nonattainment boundaries. The new inspection and maintenance program thatrequires on-board diagnostic testing in 48 counties (phased in between 2002 and 2006) isan example of North Carolina’s ability to control sources in counties regardless of thenonattainment designations. The new I/M program was adopted in 1999.
Χ Rowan County -This is an MSA county, and it does have two monitors located in theCounty. The recommendation includes the entire county except for five small townships

Page 16
in the northwestern corner of the county located in 2 Census tracts containing 50-100people per square mile.
Χ The recommendation is that the townships of Atwell, China Grove, Franklin, Gold Hill,Litaker, Locke, Morgan, Providence and Salisbury be designated as nonattainment.
Χ Emissions and Air Quality in Adjacent Areas: Based on 1997 emissions inventories,Rowan County has 47.67 tons per day of NOx (state total is 2529 tons per day) and thecounty has 26.70 tons per day of VOC (state total is 1842 tons per day – anthropogeniconly).
Χ Population Density and Degree of Urbanization: 130,340 people live in Rowan County,120,515 people live in the townships recommended as nonattainment. The northwesternportion of County has low population density, with 2 tracts containing 50-100 people persquare mile. The five townships in these Census tracts have 9,825 people living in themand we recommend keeping these five townships in attainment.
Χ Monitoring Data: As shown in Figure 5 above, this area has 7 monitors with designvalues ranging from 0.088 ppm to 0.102 ppm. The monitors located in Rowan Countyare in Enochville with a design value of 0.101 ppm, and Rockwell with a design value of0.098 ppm.
Χ Location of Emission Sources: There are some industrial sources in the county, and onepower plant (Buck Steam Station). The total point source NOx emissions are 24.87 tonsper day.
Χ Traffic and Commuting Patterns: Rowan County has 3,366,430 Daily VMT. RowanCounty contributes 1.0 percent of the commuters who drive in to Mecklenburg County towork each day, or about 4,942 people. Rowan ranks number 7 in the commuting countiesinto Mecklenburg.
Χ Expected Growth: The population in Rowan County is expected to grow between 2000and 2010, with a total increase of 16.2%.
Χ Meteorology: Winds across Rowan County are climatologically from the southwest.With this climatological wind pattern, the emissions from the county will likely impactthe Triad area. On days when the winds are from the north, the emissions will add to theCharlotte area’s pollution.
Χ Geography/Topography: There are no special geography or topography issues toconsider in this region.
Χ Jurisdictional Boundaries: The existing 1-hour ozone standard maintenance areaincludes Mecklenburg and Gaston Counties, both of which are included in NorthCarolina’s recommendation as nonattainment for the 8-hour ozone standard.
Χ Level of control of emissions sources: Currently there are some major point sources inRowan County to control. In particular, the Buck Steam Station is one of the major NOxsources. The units at this facility will have controls put on to meet both the NOx SIP Calland the Clean Smokestacks Act. Another major source of the NOx emissions are mobilesources (16.36 tons of the 47.67 tons come from mobile sources each day, and anadditional 6.03 tons per day comes from nonroad sources), and the combined Federal andstate control programs will address these emissions. Low sulfur gasoline will be requiredstatewide. In July 2003 Rowan County will begin implementing an I/M program thatrequires OBD testing for model year 1996 and newer cars.
Χ Regional Emissions Reductions: As mentioned above, the Buck Steam Station is one ofthe utility sources subject to control under the NOx SIP call, as is the Transco NaturalGas Pumping Station in Iredell County.
Page 17
Χ DENR’s ability to control sources throughout the state: The North Carolina GeneralStatute allows sources anywhere in the state to be controlled under an attainment strategy,regardless of designation. North Carolina believes this is an important consideration forsetting nonattainment boundaries. The new inspection and maintenance program thatrequires on-board diagnostic testing in 48 counties (phased in between 2002 and 2006) isan example of North Carolina’s ability to control sources in counties regardless of thenonattainment designations. The new I/M program was adopted in 1999.
Χ Union County -This is an MSA county, and it does have a monitor located in theCounty. The eastern portion of the county is rural, so the recommendation is for asmaller area than the entire county.
Χ The recommendation is that the portion of Union County in the Mecklenburg/UnionCounty Metropolitan Planning Area Boundary, which includes the area of the County inthe more populated region, and excludes the more rural part of the County.
Χ Emissions and Air Quality in Adjacent Areas: Based on 1997 emissions inventories,Union County has 15.01 tons per day of NOx (state total is 2529 tons per day) and thecounty has 23.51 tons per day of VOC (state total is 1842 tons per day – anthropogeniconly).
Χ Population Density and Degree of Urbanization: 123,677 people live in Union County.The eastern portion of County has low population density, with 4 tracts containing 50-100 people per square mile, and 1 tract with 100-250 people per square mile. The portionthat is recommended to be designated nonattainment has 4 tracts with 100-250 people persquare mile, 4 tracts with 250-500 people per square mile, and 4 tracts with 500-1500people per square mile. This portion contains 104, 276 people of the total population of123, 677
Χ Monitoring Data: As shown in Figure 5 above, this area has 7 monitors with designvalues ranging from 0.088 ppm to 0.102 ppm. The monitor located in Union County is inthe community of Monroe with a design value of 0.088 ppm.
Χ Location of Emission Sources: There are very few industrial sources in the county, with0.15 tons per day of the NOx emissions coming from the point sources.
Χ Traffic and Commuting Patterns: Union County has 3,072,790 Daily VMT. UnionCounty contributes 5.2 percent of the commuters that drive to Mecklenburg County towork each day, or about 24,892 people. Union County ranks number 1 in the commutingcounties into Mecklenburg. By following the MPO boundary, North Carolina believesthe majority of the commuters from Union to Mecklenburg would be captured in thisnonattainment boundary. Additionally, Union County already has an inspection andmaintenance program to address the vehicle maintenance.
Χ Expected Growth: The population in Union County is expected to grow between 2000and 2010, with a total increase of 35.7%.
Χ Meteorology: Winds across Union County are climatologically from the southwest.With this climatological wind pattern, the emissions in the county will likely impact thesandhills region of North Carolina. On days when the winds are from the north, theemissions will drift into South Carolina.
Χ Geography/Topography: There are no special geography or topography issues toconsider in this region.
Χ Jurisdictional Boundaries: The existing 1-hour ozone standard maintenance areaincludes Mecklenburg and Gaston Counties, both of which are included in NorthCarolina’s recommendation as nonattainment for the 8-hour ozone standard.

Page 18
Χ Level of control of emissions sources: Currently there are few major point sources inUnion County to control. The majority of the NOx emissions are from mobile andnonroad sources (7.19 tons from mobile and 7.26 tons from nonroad of the total 15.01tons), and the combined Federal and state control programs will help address theseemissions. Low sulfur gasoline will be required statewide. An I/M program is already inplace in Union County.
Χ Regional Emissions Reductions: Duke Energy’s Marshall facility located in CatawbaCounty, and Allen and Riverbend facilities in Gaston County are some of the utilitysources subject to control under the NOx SIP call, as is the Transco Natural Gas PumpingStation in Iredell County.
Χ DENR’s ability to control sources throughout the state: The North Carolina GeneralStatute allows sources anywhere in the state to be controlled under an attainment strategy,regardless of designation. North Carolina believes this is an important consideration forsetting nonattainment boundaries. The new inspection and maintenance program thatrequires on-board diagnostic testing in 48 counties (phased in between 2002 and 2006) isan example of North Carolina’s ability to control sources in counties regardless of thenonattainment designations. The new I/M program was adopted in 1999.

Page 19
Greensboro/Winston-Salem/High Point Area
Figure 6: Map showing location of ozone monitors and their 3 year design values in parts per billion in theGreensboro/Winston-Salem/High Point MSA. The green shaded counties indicate the area for which the ozoneforecast is developed each day from May 1 through September 30.
The monitors in the Greensboro/ Winston Salem/High Point MSA currently measure thesecond highest ozone values in the State. North Carolina recommends that the whole counties ofAlamance, Davidson, Forsyth, and Guilford and partial counties of Davie, Caswell, Randolphand Rockingham be designated as nonattainment. The partial county recommendations arediscussed below, along with the 11 criteria EPA identified in their nonattainment boundaryguidance that should be addressed.
Χ Caswell County - This is not an MSA county, but it does have a monitor located in theCherry Grove community. This is a very rural county and is measuring ozone levelsgenerated in the Triad area, so the recommendation is for a smaller area than the entirecounty.
Χ The recommendation is that the Stoney Creek Township portion of Caswell Countywhere the monitor is located be designated as nonattainment.
Χ Emissions and Air Quality in Adjacent Areas: Based on 1997 emissions inventories,Caswell County has 2.58 tons per day of NOx (state total is 2529 tons per day) and thecounty has 3.33 tons per day of VOC (state total is 1842 tons per day – anthropogeniconly).

Page 20
Χ Population Density and Degree of Urbanization: 23,501 people live in Caswell County.Entire County has low population density, with 2 tracts falling in the 0-50 people persquare mile and 4 tracts containing 50-100 people per square mile.
Χ Monitoring Data: As shown in Figure 6 above, this area has 9 monitors with designvalues ranging from 0.084 ppm to 0.095 ppm. The monitor located in Caswell County isin the community of Cherry Grove with a design value of 0.091 ppm.
Χ Location of Emission Sources: There are currently no point sources in the county.Χ Traffic and Commuting Patterns: Caswell County has 598,960 Daily VMT. Caswell
County contributes 0.3 percent of the commuters that drive to Guilford County to workeach day, or about 800 people. Caswell County ranks number 7 in the commutingcounties into Guilford.
Χ Expected Growth: The population in Caswell County is expected to grow between 2000and 2010, with a total increase of 12.2%.
Χ Meteorology: Winds across Caswell County are climatologically from the southwest.With this climatological wind pattern, the county is not in an upwind sector that wouldroutinely have an impact on air quality in any portion of North Carolina. On the dayswhen the monitor exceeds the 8-hour standard, it appears to be measuring the urbanplume or pollution from the Triad. As the pollution in the Triad area is reduced, themonitor should observe lower ozone levels. Currently, the design value for the CherryGrove monitor is 0.091ppm.
Χ Geography/Topography: There are no special geography or topography issues toconsider in this region.
Χ Jurisdictional Boundaries: The existing 1-hour ozone standard maintenance areaincludes the full counties of Forsyth, Guilford and Davidson, and a small portion ofDavie County all of which are included in North Carolina’s recommendation asnonattainment for the 8-hour ozone standard.
Χ Level of control of emissions sources: Currently there are no major point sources inCaswell County to control. The majority of the NOx emissions are from mobile andnonroad sources (1.79 tons from mobile and 0.70 tons from nonroad of the total 2.58tons), and the combined Federal and state control programs will help address theseemissions. Low sulfur gasoline will be required statewide.
Χ Regional Emissions Reductions: Duke Energy’s Belews Creek facility located in StokesCounty, and Progress Energy’s Roxboro and Mayo facilities in Person County are someof the utility sources subject to control under the NOx SIP call.
Χ DENR’s ability to control sources throughout the state: The North Carolina GeneralStatute allows sources anywhere in the state to be controlled under an attainment strategy,regardless of designation. North Carolina believes this is an important consideration forsetting nonattainment boundaries. The new inspection and maintenance program thatrequires on-board diagnostic testing in 48 counties (phased in between 2002 and 2006) isan example of North Carolina’s ability to control sources in counties regardless of thenonattainment designations. The new I/M program was adopted in 1999.
Χ Stokes County – This is an MSA county, but there is no monitor located here. This is arural county, so the recommendation is that no portion of the county be designatednonattainment.
Χ Emissions and Air Quality in Adjacent Areas: Based on 1997 emissions inventories,Stokes County has 339.65 tons per day of NOx (state total is 2529 tons per day) and the
Page 21
county has 7.04 tons per day of VOC (state total is 1842 tons per day – anthropogeniconly). The large source of NOx emissions are from the Duke Energy Belews Creekfacility, which will reduce the NOx emissions to about 31 tons per day under the NOxSIP call.
Χ Population Density and Degree of Urbanization: 44,711 people live in Stokes County.Entire County has fairly low population density, with 1 tract falling in the 0-50 people persquare mile, 3 tracts containing 50-100 people per square mile, 2 tracts containing 100-250 people per square mile, and 2 small tracts containing 250-500 people per square mile.
Χ Monitoring Data: As shown in Figure 6 above, this area has 9 monitors with designvalues ranging from 0.084 ppm to 0.095 ppm. There is no monitor in Stokes County, butthe closest monitor located in Rockingham County has a design value of 0.090 ppm, andthe closest monitor in Forsyth County has a design value of 0.084 ppm.
Χ Location of Emission Sources: There is one large emission source in the county, DukeEnergy’s Belews Creek power plant, which is located in the southeastern corner of thecounty. As stated earlier, this source is subject to the NOx SIP call.
Χ Traffic and Commuting Patterns: Stokes County has 920,820 Daily VMT. StokesCounty contributes 6.0 percent of the commuters that drive to Forsyth County to workeach day, or about 10,259 people. Stokes County ranks number 2 in the commutingcounties into Forsyth.
Χ Expected Growth: The population in Stokes County is expected to grow between 2000and 2010, with a total increase of 16.2%.
Χ Meteorology: Winds across Stokes County are climatologically from the southwest.With this climatological wind pattern, the county is not in an upwind sector that wouldroutinely have an impact on air quality in any portion of the MSA or North Carolina. Theexception is in the case of northerly winds.
Χ Geography/Topography: There are no special geography or topography issues toconsider in this region.
Χ Jurisdictional Boundaries: The existing 1-hour ozone standard maintenance areaincludes the full counties of Forsyth, Guilford and Davidson, and a small portion ofDavie County all of which are included in North Carolina’s recommendation asnonattainment for the 8-hour ozone standard.
Χ Level of control of emissions sources: Currently there is one major point source inStokes County to control and this facility is subject to the NOx SIP call. The remainingNOx emissions are from mobile sources (2.74 tons come from mobile sources each day),and the combined Federal and state control programs will address these emissions.Stokes County will have an I/M program beginning in July 2005. Low sulfur gasolinewill be required statewide.
Χ Regional Emissions Reductions: Duke Energy’s Belews Creek facility located in StokesCounty, and Progress Energy’s Roxboro and Mayo facilities in Person County are someof the utility sources subject to control under the NOx SIP call.
Χ DENR’s ability to control sources throughout the state: The North Carolina GeneralStatute allows sources anywhere in the state to be controlled under an attainment strategy,regardless of designation. North Carolina believes this is an important consideration forsetting nonattainment boundaries. The new inspection and maintenance program thatrequires on-board diagnostic testing in 48 counties (phased in between 2002 and 2006) isan example of North Carolina’s ability to control sources in counties regardless of thenonattainment designations. The new I/M program was adopted in 1999.

Page 22
Χ Yadkin County – This is an MSA county, but there is no monitor located here. This is arural county, so the recommendation is that no portion of the county be designatednonattainment.
Χ Emissions and Air Quality in Adjacent Areas: Based on 1997 emissions inventories,Yadkin County has 7.88 tons per day of NOx (state total is 2529 tons per day) and thecounty has 7.29 tons per day of VOC (state total is 1842 tons per day – anthropogeniconly).
Χ Population Density and Degree of Urbanization: 36,348 people live in Yadkin County.The entire County has fairly low population density, with 5 tracts containing 50-100people per square mile and 2 tracts containing 100-250 people per square mile.
Χ Monitoring Data: As shown in Figure 6 above, this area has 9 monitors with designvalues ranging from 0.084 ppm to 0.095 ppm. There is no monitor in Yadkin County, butthe closest monitor is located in Forsyth County and has a design value of 0.084 ppm.
Χ Location of Emission Sources: There are no large point sources in the county.Χ Traffic and Commuting Patterns: Yadkin County has 1,327,920 Daily VMT. Yadkin
County contributes 3.2 percent of the commuters that drive to Forsyth County to workeach day, or about 5,504 people. Yadkin County ranks number 4 in the commutingcounties into Forsyth.
Χ Expected Growth: The population in Yadkin County is expected to grow between 2000and 2010, with a total increase of 17.7%.
Χ Meteorology: Winds across Yadkin County are climatologically from the southwest.With this climatological wind pattern, the majority of the county is not in an upwindsector that would routinely have an impact on air quality in the urban portion of theMSA.
Χ Geography/Topography: There are no special geography or topography issues toconsider in this region.
Χ Jurisdictional Boundaries: The existing 1-hour ozone standard maintenance areaincludes the full counties of Forsyth, Guilford and Davidson, and a small portion ofDavie County all of which are included in North Carolina’s recommendation asnonattainment for the 8-hour ozone standard.
Χ Level of control of emissions sources: Currently there are no major point sources inYadkin County to control. The majority of the NOx emissions are from mobile sources(6.44 tons of the total 7.88 tons come from mobile sources each day), and the combinedFederal and state control programs will address these emissions. Low sulfur gasoline willbe required statewide.
Χ Regional Emissions Reductions: Duke Energy’s Belews Creek facility located in StokesCounty, and Progress Energy’s Roxboro and Mayo facilities in Person County are someof the utility sources subject to control under the NOx SIP call.
Χ DENR’s ability to control sources throughout the state: The North Carolina GeneralStatute allows sources anywhere in the state to be controlled under an attainment strategy,regardless of designation. North Carolina believes this is an important consideration forsetting nonattainment boundaries. The new inspection and maintenance program thatrequires on-board diagnostic testing in 48 counties (phased in between 2002 and 2006) isan example of North Carolina’s ability to control sources in counties regardless of thenonattainment designations. The new I/M program was adopted in 1999.

Page 23
Χ Davie County – This is an MSA county, and there is a monitor located in thesoutheastern corner of the county and it is in violation of the 8-hour standard. This is arural county, so the recommendation is that the township where the monitor is located bedesignated nonattainment.
Χ The recommendation is that the Jerusalem Township portion of Davie County where themonitor is located be designated as nonattainment.
Χ Emissions and Air Quality in Adjacent Areas: Based on 1997 emissions inventories,Davie County has 8.68 tons per day of NOx (state total is 2529 tons per day) and thecounty has 8.08 tons per day of VOC (state total is 1842 tons per day – anthropogeniconly).
Χ Population Density and Degree of Urbanization: 34,835 people live in Davie County.The entire County has fairly low population density, with 2 tracts containing 50-100people per square mile, 4 tracts containing 100-250 people per square mile, and 1 smalltract containing 250-500 people per square mile.
Χ Monitoring Data: As shown in Figure 6 above, this area has 9 monitors with designvalues ranging from 0.084 ppm to 0.095 ppm. There is a monitor in Davie County, with adesign value of 0.095 ppm.
Χ Location of Emission Sources: There are no large point sources in the county.Χ Traffic and Commuting Patterns: Davie County has 1,252,030 Daily VMT. Davie
County contributes 3.1 percent of the commuters that drive to Forsyth County to workeach day, or about 5,242 people. Davie County ranks number 5 in the commutingcounties into Forsyth.
Χ Expected Growth: The population in Davie County is expected to grow between 2000and 2010, with a total increase of 20.8%.
Χ Meteorology: Winds across Davie County are climatologically from the southwest.With this climatological wind pattern, the northwestern portion of the county is not in anupwind sector that would routinely have an impact on air quality in the urban portion ofthe MSA.
Χ Geography/Topography: There are no special geography or topography issues toconsider in this region.
Χ Jurisdictional Boundaries: The existing 1-hour ozone standard maintenance areaincludes the full counties of Forsyth, Guilford and Davidson, and a small portion ofDavie County all of which are included in North Carolina’s recommendation asnonattainment for the 8-hour ozone standard.
Χ Level of control of emissions sources: Currently there are no major point sources inDavie County to control. The majority of the NOx emissions are from mobile sources(7.27 tons of the total 8.68 tons come from mobile sources each day), and the combinedFederal and state control programs will address these emissions. Low sulfur gasoline willbe required statewide.
Χ Regional Emissions Reductions: Duke Energy’s Belews Creek facility located in StokesCounty, and Progress Energy’s Roxboro and Mayo facilities in Person County are someof the utility sources subject to control under the NOx SIP call.
Χ DENR’s ability to control sources throughout the state: The North Carolina GeneralStatute allows sources anywhere in the state to be controlled under an attainment strategy,regardless of designation. North Carolina believes this is an important consideration forsetting nonattainment boundaries. The new inspection and maintenance program thatrequires on-board diagnostic testing in 48 counties (phased in between 2002 and 2006) is

Page 24
an example of North Carolina’s ability to control sources in counties regardless of thenonattainment designations. The new I/M program was adopted in 1999.
Χ Rockingham County - This is not an MSA county, but it does have a monitor located inthe Bethany community. This is a fairly rural county and is measuring ozone levelsgenerated in the Triad area, so the recommendation is for a smaller area than the entirecounty.
Χ The recommendation is that the New Bethel Creek Township portion of RockinghamCounty where the monitor is located be designated as nonattainment.
Χ Emissions and Air Quality in Adjacent Areas: Based on 1997 emissions inventories,Rockingham County has 42.72 tons per day of NOx (state total is 2529 tons per day) andthe county has 18.14 tons per day of VOC (state total is 1842 tons per day –anthropogenic only).
Χ Population Density and Degree of Urbanization: 91,928 people live in RockinghamCounty. Much of the County has low population density, with 5 tracts falling in the 50-100 people per square mile, 5 tracts containing 100-250 people per square mile, and 10smaller tracts containing 250-500 people per square mile,
Χ Monitoring Data: As shown in Figure 6 above, this area has 9 monitors with designvalues ranging from 0.084 ppm to 0.095 ppm. The monitor located in RockinghamCounty is in the community of Bethany with a design value of 0.090 ppm.
Χ Location of Emission Sources: The majority of the County’s NOx emissions come frompoint sources (31.09 tons per day). The largest sources in the county are Duke Energy’sDan River power plant averaging 14 tons per day of NOx in 1997, and TranscontinentalGas Pipeline pumping station averaging 15 tons per day of NOx in 1997. Both of thesesources are targeted for control under the NOx SIP call.
Χ Traffic and Commuting Patterns: Rockingham County has 2,350,130 Daily VMT.Rockingham County contributes 4.4 percent of the commuters that drive to GuilfordCounty to work each day, or about 11,960 people. Rockingham County ranks number 4in the commuting counties into Guilford.
Χ Expected Growth: The population in Rockingham County is expected to grow between2000 and 2010, with a total increase of 5.6%.
Χ Meteorology: Winds across Rockingham County are climatologically from thesouthwest. With this climatological wind pattern, the county is not in an upwind sectorthat would routinely have an impact on air quality in any portion of North Carolina or anyarea of Virginia. On the days when the monitor exceeds the 8-hour standard, it appears tobe measuring the urban plume or pollution from the Triad. As the pollution in the Triadarea is reduced, the monitor should observe lower ozone levels. Currently, the designvalue for the Rockingham County (Bethany) monitor is 0.090 ppm.
Χ Geography/Topography: There are no special geography or topography issues toconsider in this region.
Χ Jurisdictional Boundaries: The existing 1-hour ozone standard maintenance areaincludes the full counties of Forsyth, Guilford and Davidson, and a small portion ofDavie County all of which are included in North Carolina’s recommendation asnonattainment for the 8-hour ozone standard.
Χ Level of control of emissions sources: Duke Energy’s Dan River facility is located inRockingham County, with emissions around 14 tons per day. There is a natural gaspumping station in the county as well. Both of these facilities are subject to the NOx SIPcall and will install controls in the next couple of years to comply with this rule. The

Page 25
other large source category of NOx emissions is mobile sources (7.80 tons per day), andthe combined Federal and state control programs will address these emissions. Theinspection and maintenance program will begin in Rockingham County on July 1, 2004.Low sulfur gasoline will be required statewide.
Χ Regional Emissions Reductions: Duke Energy’s Belews Creek facility located in StokesCounty, and Progress Energy’s Roxboro and Mayo facilities in Person County are someof the utility sources subject to control under the NOx SIP call.
Χ DENR’s ability to control sources throughout the state: The North Carolina GeneralStatute allows sources anywhere in the state to be controlled under an attainment strategy,regardless of designation. North Carolina believes this is an important consideration forsetting nonattainment boundaries. The new inspection and maintenance program thatrequires on-board diagnostic testing in 48 counties (phased in between 2002 and 2006) isan example of North Carolina’s ability to control sources in counties regardless of thenonattainment designations. The new I/M program was adopted in 1999.

Page 26
Raleigh/Durham/Chapel Hill Area
Figure 7: Map showing location of ozone monitors and their 3 year design values in parts per billion in theRaleigh/Durham/Chapel Hill MSA. The green shaded counties indicate the area for which the ozone forecast isdeveloped each day from May 1 through September 30.
The monitors in the Raleigh/Durham/Chapel Hill MSA currently measure the thirdhighest ozone values in the State. North Carolina recommends that the whole counties of Wake,Durham and Orange and partial counties of Chatham, Franklin, Granville, Johnston and Personbe designated as nonattainment. The partial county recommendations are discussed below, alongwith the 11 criteria EPA identified in their nonattainment boundary guidance that should beaddressed.
Χ Chatham County -This is an MSA county, and it does have a monitor located in theCounty. The recommendation includes four townships in the northeastern part of theCounty.
Χ The recommendation is that the townships of Baldwin, Center, New Hope, and Williamsbe designated as nonattainment.
Χ Emissions and Air Quality in Adjacent Areas: Based on 1997 emissions inventories,Chatham County has 27.99 tons per day of NOx (state total is 2529 tons per day) and thecounty has 12.80 tons per day of VOC (state total is 1842 tons per day – anthropogeniconly).
Χ Population Density and Degree of Urbanization: 49,329 people live in ChathamCounty, 21,320 people live in the townships recommended as nonattainment. Thenortheastern portion of County has about 43 percent of the total county population. In thearea that the State is recommending remain attainment, the majority of the county’scensus tracts have very low population density, with all but one small tract containing 0-
Page 27
50 people per square mile. The remaining tract has 250-500 people per square mile andis located near the Chatham/Randolph County line.
Χ Monitoring Data: As shown in Figure 7 above, this area has 10 monitors with designvalues ranging from 0.083 ppm to 0.094 ppm. The monitor located in Chatham Countyin the town of Pittsboro has a design value of 0.083 ppm and is the only monitor in thearea attaining the 8-hour ozone standard.
Χ Traffic and Commuting Patterns: Chatham County has 1,699,720 Daily VMT.Chatham County contributes 1.6 percent of the commuters who drive in to DurhamCounty to work each day, or about 2,739 people. Chatham County contributes 0.8percent of the commuters who drive in to Wake County to work each day, or about 2,743people. Chatham ranks number 5 in the commuting counties into Durham, and number 7in the commuting counties into Wake.
Χ Expected Growth: The population in Chatham County is expected to grow between2000 and 2010, with a total increase of 21.8%.
Χ Meteorology: Winds across Chatham County are climatologically from the southwest.With this climatological wind pattern, the emissions in the county will likely impact theWake County monitors.
Χ Geography/Topography: There are no special geography or topography issues toconsider in this region.
Χ Jurisdictional Boundaries: The existing 1-hour ozone standard maintenance areaincludes Wake and Durham Counties, and the Dutchville Township in Granville County,all of which are included in North Carolina’s recommendation as nonattainment for the 8-hour ozone standard.
Χ Level of control of emissions sources: The Cape Fear Steam Station is the largest NOxsource in Chatham County, and this facility is subject to control under both the NOx SIPCall and the Clean Smokestacks Act. The majority of the remaining NOx emissions arefrom mobile sources (4.74 tons come from mobile sources each day), and nonroadsources (3.41 tons per day) and the combined Federal and state control programs willaddress these emissions. The inspection and maintenance program will begin in ChathamCounty on January 1, 2004. Low sulfur gasoline will be required statewide.
Χ Regional Emissions Reductions: As stated above, the Cape Fear Steam Station is one ofthe utility sources subject to control under the NOx SIP call.
Χ DENR’s ability to control sources throughout the state: The North Carolina GeneralStatute allows sources anywhere in the state to be controlled under an attainment strategy,regardless of designation. North Carolina believes this is an important consideration forsetting nonattainment boundaries. The new inspection and maintenance program thatrequires on-board diagnostic testing in 48 counties (phased in between 2002 and 2006) isan example of North Carolina’s ability to control sources in counties regardless of thenonattainment designations. The new I/M program was adopted in 1999.
Χ Franklin County -This is an MSA county, and it does have a monitor located in theCounty. The recommendation includes two townships in the southwestern part of theCounty.
Χ The recommendation is that the townships of Youngsville and Franklinton be designatedas nonattainment.
Χ Emissions and Air Quality in Adjacent Areas: Based on 1997 emissions inventories,Franklin County has 6.08 tons per day of NOx (state total is 2529 tons per day) and the

Page 28
county has 10.16 tons per day of VOC (state total is 1842 tons per day – anthropogeniconly).
Χ Population Density and Degree of Urbanization: 47,260 people live in FranklinCounty, 15,691 people live in the townships recommended as nonattainment. Thenorthern portion of County is very rural, with two large census tracts with 0-50 peopleper square mile and one census tract with 50-100 people per square mile. The fiveremaining census tracts all have 100-250 people per square mile. The area recommendedas nonattainment is adjacent to Wake County and the monitor is located in theFranklinton township.
Χ Monitoring Data: As shown in Figure 7 above, this area has 10 monitors with designvalues ranging from 0.083 ppm to 0.094 ppm. The monitor located in Franklin County inthe town of Franklinton has a design value of 0.091 ppm.
Χ Traffic and Commuting Patterns: Franklin County has 1,223,720 Daily VMT. FranklinCounty contributes 0.6 percent of the commuters who drive in to Durham County to workeach day, or about 951 people. Franklin County contributes 2.9 percent of the commuterswho drive in to Wake County to work each day, or about 13,347 people. FranklinCounty ranks number 8 in the commuting counties into Durham, and number 3 in thecommuting counties into Wake.
Χ Expected Growth: The population in Franklin County is expected to grow between 2000and 2010, with a total increase of 24.8%.
Χ Meteorology: Winds across Franklin County are climatologically from the southwest.With this climatological wind pattern, the county is not in an upwind sector that wouldroutinely have an impact on air quality in the urban portion of the MSA. On the dayswhen the monitor exceeds the 8-hour standard, it appears to be measuring the urbanplume or pollution from the Triangle. As the pollution in the Triangle area is reduced,the monitor should observe lower ozone levels. Currently, the design value for theFranklinton monitor is 0.091 ppm.
Χ Geography/Topography: There are no special geography or topography issues toconsider in this region.
Χ Jurisdictional Boundaries: The existing 1-hour ozone standard maintenance areaincludes Wake and Durham Counties, and the Dutchville Township in Granville County,all of which are included in North Carolina’s recommendation as nonattainment for the 8-hour ozone standard.
Χ Level of control of emissions sources: The majority of the total 6.08 tons per day ofNOx emissions are from mobile sources (3.57 tons come from mobile sources each day),and nonroad sources (2.25 tons per day) and the combined Federal and state controlprograms will address these emissions. The inspection and maintenance program willbegin in Franklin County on January 1, 2004. Low sulfur gasoline will be requiredstatewide.
Χ Regional Emissions Reductions: The NOx emissions from the nearby utilities (Roxboroand Mayo units in Person County, Cape Fear units in Chatham County) are subject tocontrol under the NOx SIP call.
Χ DENR’s ability to control sources throughout the state: The North Carolina GeneralStatute allows sources anywhere in the state to be controlled under an attainment strategy,regardless of designation. North Carolina believes this is an important consideration forsetting nonattainment boundaries. The new inspection and maintenance program thatrequires on-board diagnostic testing in 48 counties (phased in between 2002 and 2006) is

Page 29
an example of North Carolina’s ability to control sources in counties regardless of thenonattainment designations. The new I/M program was adopted in 1999.
Χ Granville County - This is not an MSA county, but it does have a monitor located in theCounty. This is a fairly rural county, so the recommendation is for a smaller area thanthe entire county.
Χ The recommendation is that the township of Dutchville, where the monitor is located bedesignated as nonattainment. This area was previously designated as nonattainmentunder the one-hour standard.
Χ Emissions and Air Quality in Adjacent Areas: Based on 1997 emissions inventories,Granville County has 10.63 tons per day of NOx (state total is 2529 tons per day) and thecounty has 10.53 tons per day of VOC (state total is 1842 tons per day – anthropogeniconly).
Χ Population Density and Degree of Urbanization: 48,498 people live in GranvilleCounty, 13,801 people live in the township recommended as nonattainment. Thenorthern portion of County is very rural, with one very large census tracts with 0-50people per square mile. In the southern part of the county, there are four census tractswith 100-250 people per square mile and one small census tract with 250-500 people persquare mile. The area recommended as nonattainment is adjacent to Wake County andDurham County, and the monitor is located in the Butner community in the Dutchvilletownship.
Χ Monitoring Data: As shown in Figure 7 above, this area has 10 monitors with designvalues ranging from 0.083 ppm to 0.094 ppm. The monitor located in Granville Countyin the town of Butner has a design value of 0.094 ppm.
Χ Traffic and Commuting Patterns: Granville County has 1,666,470 Daily VMT.Granville County contributes 2.8 percent of the commuters who drive in to DurhamCounty to work each day, or about 4,609 people. Granville County contributes 0.7percent of the commuters who drive in to Wake County to work each day, or about 2,489people. Granville County ranks number 3 in the commuting counties into Durham, andnumber 8 in the commuting counties into Wake.
Χ Expected Growth: The population in Granville County is expected to grow between2000 and 2010, with a total increase of 20.3%.
Χ Meteorology: Winds across Granville County are climatologically from the southwest.With this climatological wind pattern, the county is not in an upwind sector that wouldroutinely have an impact on air quality in any portion of North Carolina. On the dayswhen the monitor exceeds the 8-hour standard, it appears to be measuring the urbanplume or pollution from the Triangle. As the pollution in the Triangle area is reduced,the monitor should observe lower ozone levels. Currently, the design value for theGranville County (Butner) monitor is 0.094 ppm.
Χ Geography/Topography: There are no special geography or topography issues toconsider in this region.
Χ Jurisdictional Boundaries: The existing 1-hour ozone standard maintenance areaincludes Wake and Durham Counties, and the Dutchville Township in Granville County,all of which are included in North Carolina’s recommendation as nonattainment for the 8-hour ozone standard.
Χ Level of control of emissions sources: The majority of the NOx emissions are frommobile sources (8.40 tons of the total 10.63 total tons come from mobile sources eachday), and the combined Federal and state control programs will address these emissions.

Page 30
The inspection and maintenance program will begin in Granville County on July 1, 2004.Low sulfur gasoline will be required statewide.
Χ Regional Emissions Reductions: The NOx emissions from the nearby utilities (Roxboroand Mayo units in Person County, Cape Fear units in Chatham County) are subject tocontrol under the NOx SIP call.
Χ DENR’s ability to control sources throughout the state: The North Carolina GeneralStatute allows sources anywhere in the state to be controlled under an attainment strategy,regardless of designation. North Carolina believes this is an important consideration forsetting nonattainment boundaries. The new inspection and maintenance program thatrequires on-board diagnostic testing in 48 counties (phased in between 2002 and 2006) isan example of North Carolina’s ability to control sources in counties regardless of thenonattainment designations. The new I/M program was adopted in 1999.
Χ Johnston County - This is an MSA county, with a monitor in the western portion of thecounty. This monitor is in violation of the 8-hour standard with a design value of 0.085ppm. This is a fairly rural county, so the recommendation is for only the western portionof the county (west of I-95), a smaller area than the entire county.
Χ The recommendation is for the western portion of the county that covers both the monitorsite, and the expansion of the housing developments from the Raleigh urban area.
Χ Emissions and Air Quality in Adjacent Areas: Based on 1997 emissions inventories,Johnston County has 33.89 tons per day of NOx (state total is 2529 tons per day) and thecounty has 28.27 tons per day of VOC (state total is 1842 tons per day – anthropogeniconly).
Χ Population Density and Degree of Urbanization: 121,965 people live in JohnstonCounty, approximately 98,116 people live in the area recommended as nonattainment.The eastern portion of the County is fairly rural, with one large census tract with 0-50people per square mile and two census tracts with 50-100 people per square mile. Thetwo remaining census tracts all have 100-250 people per square mile. The arearecommended as nonattainment is adjacent to Wake County and the monitor is locatedsoutheast of Clayton.
Χ Monitoring Data: As shown in Figure 7 above, this area has 10 monitors with designvalues ranging from 0.083 ppm to 0.094 ppm. The monitor located in Johnston Countyhas a design value of 0.085 ppm.
Χ Traffic and Commuting Patterns: Johnston County has 4,898,440 Daily VMT.Johnston County contributes 1.0 percent of the commuters that drive to Durham Countyto work each day, or about 1,645 people. Johnston County contributes 6.6 percent of thecommuters who drive in to Wake County to work each day, or about 23,628 people.Johnston County ranks number 7 in the commuting counties into Durham, and number 1in the commuting counties into Wake.
Χ Expected Growth: The population in Johnston County is expected to grow between 2000and 2010, with a total increase of 38.0%.
Χ Meteorology: Winds across Johnston County are climatologically from the southwest.With this climatological wind pattern, the county is not in an upwind sector that wouldroutinely have an impact on air quality in the urban portion of the MSA. On the dayswhen the monitor exceeds the 8-hour standard, it appears to be measuring the urbanplume or pollution from the Triangle. As the pollution in the Triangle area is reduced,the monitor should observe lower ozone levels. Currently, the design value for the west
Page 31
Johnston monitor is 0.085ppm.Χ Geography/Topography: There are no special geography or topography issues to
consider in this region.Χ Jurisdictional Boundaries: The existing 1-hour ozone standard maintenance area
includes Wake and Durham Counties, and the Dutchville Township in Granville County,all of which are included in North Carolina’s recommendation as nonattainment for the 8-hour ozone standard.
Χ Level of control of emissions sources: The majority of the total 33.89 tons per day ofNOx emissions are from mobile sources (25.59 tons come from mobile sources eachday), and nonroad sources (7.80 tons per day) and the combined Federal and state controlprograms will address these emissions. The inspection and maintenance program willbegin in Johnston County on July 1, 2003. Low sulfur gasoline will be requiredstatewide.
Χ Regional Emissions Reductions: The NOx emissions from the nearby utilities (Roxboroand Mayo units in Person County, Cape Fear units in Chatham County) are subject tocontrol under the NOx SIP call.
Χ DENR’s ability to control sources throughout the state: The North Carolina GeneralStatute allows sources anywhere in the state to be controlled under an attainment strategy,regardless of designation. North Carolina believes this is an important consideration forsetting nonattainment boundaries. The new inspection and maintenance program thatrequires on-board diagnostic testing in 48 counties (phased in between 2002 and 2006) isan example of North Carolina’s ability to control sources in counties regardless of thenonattainment designations. The new I/M program was adopted in 1999
Χ Person County - This is not an MSA county, but it does have a monitor located in theCounty. This is a rural county, so the recommendation is for a smaller area than theentire county.
Χ The recommendation is for the Bushy Fork Township where the monitor is located bedesignated as nonattainment.
Χ Emissions and Air Quality in Adjacent Areas: Based on 1997 emissions inventories,Person County has 221.37 tons per day of NOx (state total is 2529 tons per day) and thecounty has 7.11 tons per day of VOC (state total is 1842 tons per day – anthropogeniconly).
Χ Population Density and Degree of Urbanization: 35,623 people live in Person County,2,353 people live in the townships recommended as nonattainment. The entire county isvery rural, with 4 large census tracts of 50-100 people per square mile. The tworemaining small tracts have 250-500 people per square mile.
Χ Monitoring Data: As shown in Figure 7 above, this area has 10 monitors with designvalues ranging from 0.083 ppm to 0.094 ppm. The monitor located in Person County inthe town of Bushy Fork has a design value of 0.090 ppm.
Χ Traffic and Commuting Patterns: Person County has 743,090 Daily VMT. PersonCounty contributes 2.4 percent of the commuters who drive in to Durham County to workeach day, or about 3,939 people. Person County contributes 0.2 percent of thecommuters who drive in to Wake County to work each day, or about 614 people. Personranks number 4 in the commuting counties into Durham, and number 16 in thecommuting counties into Wake.
Χ Expected Growth: The population in Person County is expected to grow between 2000

Page 32
and 2010, with a total increase of 14.8%.Χ Meteorology: Winds across Person County are climatologically from the southwest.
With this climatological wind pattern, the county is not in an upwind sector that wouldroutinely have an impact on air quality in any portion of North Carolina. On the dayswhen the monitor exceeds the 8-hour standard, it appears to be measuring the urbanplume or pollution from the Triangle. As the pollution in the Triangle area is reduced,the monitor should observe lower ozone levels. Currently, the design value for thePerson County (Bushy Fork) monitor is 0.090 ppm.
Χ Geography/Topography: There are no special geography or topography issues toconsider in this region.
Χ Jurisdictional Boundaries: The existing 1-hour ozone standard maintenance areaincludes Wake and Durham Counties, and the Dutchville Township in Granville County,all of which are included in North Carolina’s recommendation as nonattainment for the 8-hour ozone standard.
Χ Level of control of emissions sources: Currently there are two major NOx point sourcesin Person County (Roxboro and Mayo facilities) that are subject to the NOx SIP Call andthe Clean Smokestacks Act. The remaining NOx emissions are from mobile sources (2.14tons come from mobile sources each day), and the combined Federal and state controlprograms will address these emissions. Low sulfur gasoline will be required statewide.
Χ Regional Emissions Reductions: As stated above, the Roxboro and Mayo facilities areboth subject to controls under the NOx SIP call and Clean Smokestacks Act.
Χ DENR’s ability to control sources throughout the state: The North Carolina GeneralStatute allows sources anywhere in the state to be controlled under an attainment strategy,regardless of designation. North Carolina believes this is an important consideration forsetting nonattainment boundaries. The new inspection and maintenance program thatrequires on-board diagnostic testing in 48 counties (phased in between 2002 and 2006) isan example of North Carolina’s ability to control sources in counties regardless of thenonattainment designations. The new I/M program was adopted in 1999.
Edgecombe CountyΧ Edgecombe County - This site is part of the Rocky Mount MSA, but the emissions from
the MSA are about one seventh of the Triangle area emissions. Our wind analysis hasshown that on the majority of days when the monitor exceeded the 8-hour standard, theplume from the Triangle impacts this area. Therefore, our recommendation is for asmaller area than the MSA since the nearby Triangle MSA appears to have a significantimpact on air quality in this area. Additionally, the majority of emissions in the MSA arefrom mobile sources. These sources will be addressed as part of the Federal and statestrategy. Finally, the monitor is measuring .088 ppm, and as emissions are reduced in theTriangle, we will see improvement in this area.
Χ The recommendation is for the municipal boundary of Leggett, where the monitor site islocated.
Χ Emissions and Air Quality in Adjacent Areas: Based on 1997 emissions inventories,Edgecombe County has 14.53 tons per day of NOx (state total is 2529 tons per day) andthe county has 10.49 tons per day of VOC (state total is 1842 tons per day –anthropogenic only).

Page 33
Χ Population Density and Degree of Urbanization: 55,606 people live in EdgecombeCounty. The county is fairly rural, with 2 large census tracts containing 0-50 people persquare mile, 4 tracts with 50-100 people per square mile, 2 small tracts with 100-250people per square mile, and 6 small tracts with 250-500 people per square mile.Monitoring Data: The monitor located in Edgecombe County in the town of Leggett hasa design value of 0.088 ppm.
Χ Traffic and Commuting Patterns: Edgecombe County has 1,521,420 Daily VMT.Χ Expected Growth: The population in Edgecombe County decreased by 1.9% between
1990 and 2000, and is expected to decrease another 3.0% between 2000 and 2010.Χ Meteorology: On the days when this monitor exceeds the 8-hour standard, it appears to
be measuring the urban plume or pollution from the Triangle. As the pollution in theTriangle area is reduced, this monitor should observe lower ozone levels. Currently, it ismeasuring at .088 ppm. The trajectories included in Appendix K show that there were 23days in which the Leggett monitor exceeded the 8-hour ozone standard from 2000-2002.Of these 23 days, only 4 days were attributable to local circulation. The Triangle regionwas identified as the primary source of air pollution on seven of those days. The I-95corridor was identified as the primary air pollution source on nine of the days.Fayetteville was identified as the primary source on two of the days. The power plants inPerson County were likely contributors to air pollution on two of the days. Longer-rangetransport from Virginia and West Virginia was identified as primary sources on two ofthe days. Since local emissions were the primary source of pollution on only four days,and the region will benefit from Federal engine standards, as well as the NOx SIP Calland the Clean Smokestacks Act, North Carolina believes it is appropriate to onlydesignate a small area near this monitor.
Χ Geography/Topography: There are no special geography or topography issues toconsider in this region.
Χ Jurisdictional Boundaries: There are no jurisdictional boundaries to consider in thisarea.
Χ Level of control of emissions sources: The majority of the emissions are generated frommobile and nonroad sources (4.5 tons per day from mobile and an additional 3.75 tonsper day from nonroad). Edgecombe County and neighboring Nash County will beimplementing an inspection and maintenance program. The other Federal and statemobile strategies will also reduce these emissions. The I/M program will beimplemented in both Nash and Edgecombe Counties by January 2005. Low sulfurgasoline will be required statewide.
Χ Regional Emissions Reductions: It is anticipated that the NOx SIP Call controls willbenefit the air quality in this region.
Χ DENR’s ability to control sources throughout the state: The North Carolina GeneralStatute allows sources anywhere in the state to be controlled under an attainment strategy,regardless of designation. North Carolina believes this is an important consideration forsetting nonattainment boundaries. The new inspection and maintenance program thatrequires on-board diagnostic testing in 48 counties (phased in between 2002 and 2006) isan example of North Carolina’s ability to control sources in counties regardless of thenonattainment designations. The new I/M program was adopted in 1999.

Page 34
Hickory/Morganton MSA
Figure 8: Map showing location of ozone monitors and their 3 year design values in parts per billion in theHickory/Morganton/Lenoir MSA. The green shaded counties indicate the area for which the ozone forecast isdeveloped each day from May 1 through September 30.
Χ There are two sites located in this MSA, one in Lenoir in Caldwell County and one inTaylorsville in Alexander County. Both sites have marginal violations (.086 ppm at theLenoir site and .091 ppm at the Taylorsville site). A wind analysis suggests that thesesites are impacted by transport from the west and northwest, and that pollution comesover the mountains and mixes down into the valleys where the monitors are located.There are also a number of days when both Charlotte and the Triad are having impacts onthese sites. For these reasons, we recommend a smaller area than the full MSA.
Χ The recommendation is for the Unifour Metropolitan Planning Organization PlanningBoundary and the municipal boundary of Taylorsville.
Χ Emissions and Air Quality in Adjacent Areas: Catawba County has 121.62 tons per dayof NOx (state total is 2529 tons per day) and the county has 55.09 tons per day of VOC(state total is 1842 tons per day). Caldwell County has 9.37 tons per day of NOx andthe county has 39.19 tons per day of VOC. Burke County has 15.80 tons per day of NOxand the county has 21.22 tons per day of VOC. Alexander County has 3.90 tons per dayof NOx and the county has 12.24 tons per day of VOC.
Χ Population Density and Degree of Urbanization: 141,685 people in Catawba County,89,148 people in Burke County, 77,415 in Caldwell County and 33,603 in AlexanderCounty. The MPO Planning boundary captures 257,572 people, of the total 341,851people living in the four county MSA, or 75 percent of the population is represented inthe MPO planning boundary.
Χ Monitoring Data: The monitor located in Caldwell County in the town of Lenoir has adesign value of 0.086 ppm, and the monitor in Alexander County in Taylorsville has a

Page 35
design value of 0.091 ppm.Χ Traffic and Commuting Patterns: 4,027,490 Daily VMT in Catawba, 2,482,960 in
Burke County, 598,770 in Alexander County, and 1,687,920 in Caldwell CountyΧ Expected Growth: Alexander County’s expected population growth is 18.8% between
2000 and 2010, while Burke County’s is 14.5%, Caldwell County’s is 7.4%, and CatawbaCounty’s is 17.1%.
Χ Meteorology: On the days when these monitors exceed the 8-hour standard, they appearto be measuring pollution from several other areas, including Tennessee, the Ohio RiverValley, Charlotte and the Triad. As the pollution in these areas is reduced, these monitorsshould observe lower ozone levels. Currently, the design value for the Lenoir monitor is0.086 ppm and the Taylorsville monitor is 0.091 ppm. The recommendation for theTaylorsville monitor is the municipal boundary of Taylorsville. This is due to thetrajectory analysis included in Appendix K. The summary for the Taylorsville monitorshows that there were 32 days over the 8-hour ozone standard. Only two days were dueto local recirculation. The Hickory area was the primary source of pollution on 7 of thedays, and the entire MPO boundary is being recommended as nonattainment. Othercommon source regions include South Carolina (5 days), Virginia (4 days), the Triad (7days) and Charlotte/Gastonia (3 days). As these areas reduce emissions, the Taylorsvillemonitor will attain the standard. Alexander County is extremely rural in nature.
Χ Geography/Topography: The mountains in the western part of the Burke and Caldwellcounties need to be factored in to the nonattainment designation.
Χ Jurisdictional Boundaries: There are no jurisdictional boundaries to consider in thisarea.
Χ Level of control of emissions sources: The majority of the emissions are generated frommobile sources and three of these counties will be implementing an inspection andmaintenance program. The other Federal and state mobile strategies will also reducethese emissions. The I/M program begins in Catawba County in July 2003, and inCaldwell and Burke Counties in July 2005. Low sulfur gasoline will be requiredstatewide. The Marshall Steam Station in Catawba County will be required to reduce theNOx emissions to meet the NOx SIP Call and the Clean Smokestacks Act.
Χ Regional Emissions Reductions: It is anticipated that the NOx SIP Call controls both inNorth Carolina and in neighboring states will benefit the air quality in this region.
Χ DENR’s ability to control sources throughout the state: The North Carolina GeneralStatute allows sources anywhere in the state to be controlled under an attainment strategy,regardless of designation. North Carolina believes this is an important consideration forsetting nonattainment boundaries. The new inspection and maintenance program thatrequires on-board diagnostic testing in 48 counties (phased in between 2002 and 2006) isan example of North Carolina’s ability to control sources in counties regardless of thenonattainment designations. The new I/M program was adopted in 1999.
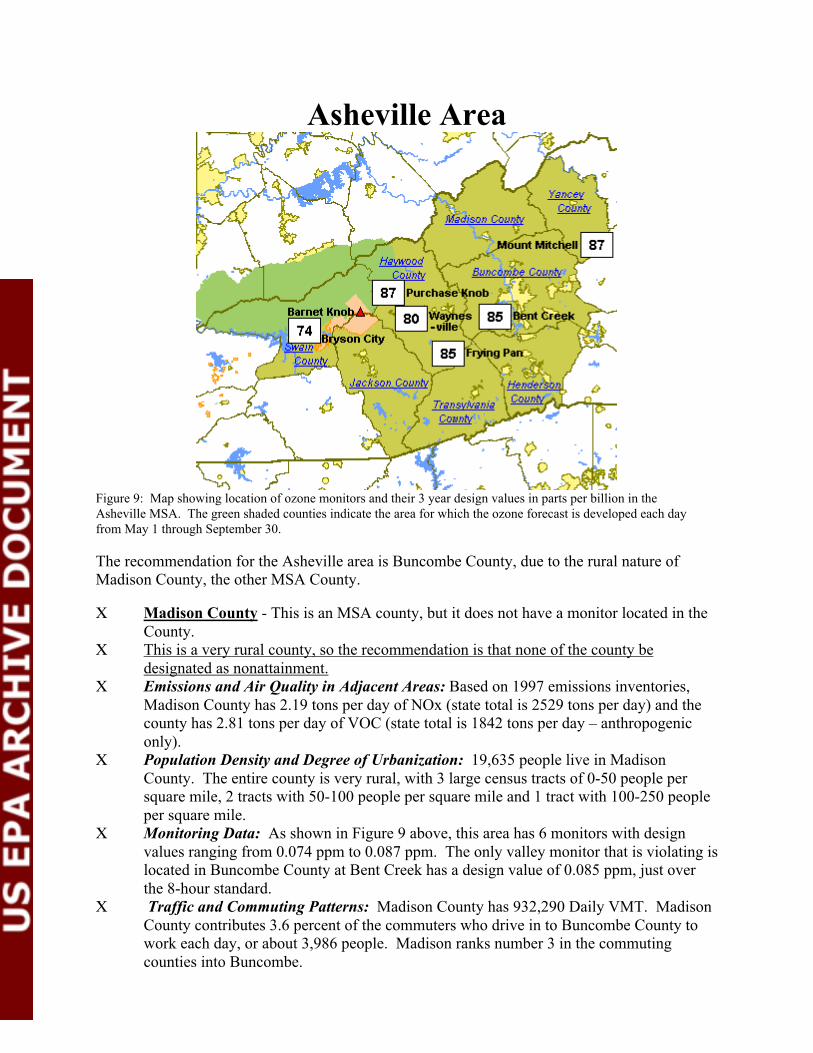
Page 36
Asheville Area
Figure 9: Map showing location of ozone monitors and their 3 year design values in parts per billion in theAsheville MSA. The green shaded counties indicate the area for which the ozone forecast is developed each dayfrom May 1 through September 30.
The recommendation for the Asheville area is Buncombe County, due to the rural nature ofMadison County, the other MSA County.Χ Madison County - This is an MSA county, but it does not have a monitor located in the
County.Χ This is a very rural county, so the recommendation is that none of the county be
designated as nonattainment.Χ Emissions and Air Quality in Adjacent Areas: Based on 1997 emissions inventories,
Madison County has 2.19 tons per day of NOx (state total is 2529 tons per day) and thecounty has 2.81 tons per day of VOC (state total is 1842 tons per day – anthropogeniconly).
Χ Population Density and Degree of Urbanization: 19,635 people live in MadisonCounty. The entire county is very rural, with 3 large census tracts of 0-50 people persquare mile, 2 tracts with 50-100 people per square mile and 1 tract with 100-250 peopleper square mile.
Χ Monitoring Data: As shown in Figure 9 above, this area has 6 monitors with designvalues ranging from 0.074 ppm to 0.087 ppm. The only valley monitor that is violating islocated in Buncombe County at Bent Creek has a design value of 0.085 ppm, just overthe 8-hour standard.
Χ Traffic and Commuting Patterns: Madison County has 932,290 Daily VMT. MadisonCounty contributes 3.6 percent of the commuters who drive in to Buncombe County towork each day, or about 3,986 people. Madison ranks number 3 in the commutingcounties into Buncombe.

Page 37
Χ Expected Growth: The population in Madison County is expected to grow between 2000and 2010, with a total increase of 12.9%.
Χ Meteorology: Winds in the mountains can be quite complex. To understand transport inthe mountains, it is helpful to review the wind trajectories in Appendix K. On any givenday, the winds can be from any of several different states.
Χ Geography/Topography: As stated above, the topography issues are the mountains and akey issue is understanding mountain air flow, and the interchange of ridge top and valleyair.
Χ Jurisdictional Boundaries: There are no jurisdictional boundaries to consider in thisarea.
Χ Level of control of emissions sources: Since Madison County only emits roughly 2 tonsof NOx per day , and 1.53 tons of that is from mobile sources, North Carolina expectsthat the combined Federal and state control programs will address these emissions
Χ Regional Emissions Reductions: The NOx SIP Call will result in NOx emissionreductions from the Skyland facility in Buncombe County, as well as sources inTennessee and Georgia that routinely impact air quality in the mountains.
Χ DENR’s ability to control sources throughout the state: The North Carolina GeneralStatute allows sources anywhere in the state to be controlled under an attainment strategy,regardless of designation. North Carolina believes this is an important consideration forsetting nonattainment boundaries. The new inspection and maintenance program thatrequires on-board diagnostic testing in 48 counties (phased in between 2002 and 2006) isan example of North Carolina’s ability to control sources in counties regardless of thenonattainment designations. The new I/M program was adopted in 1999.
Mountain Sites -Recommended boundary: Great Smoky Mountains National Park (entire area regardless
of elevation), and the Great Balsams, Plott Balsams, Great Craggy Mountains, Blue RidgeMountains (a portion along the Tennessee Valley Divide from Graybeard Mountain north toBuck Creek Gap) and Black Mountains above 4000 feet in ranges where violating monitors arelocated. This represents the area observing 8-hour violations, since the nearby valley sites areattaining the standard. Additionally, the exceedances are occurring in the middle of the night,rather than in the afternoon. This timing of the exceedances is indicative of transport and notlocal generation of ozone, since the ozone chemisty stops once the sun goes down. Figure 10below shows the difference in the timing of the ozone exceedances. The red line shows theozone peak occurs at the Purchase Knob site in the nighttime, when the valley or low elevationsites observe lower ozone levels. The areas where the violations are occurring are very sparselypopulated and the emissions densities are low compared to urban areas of North Carolina. Thetrajectories of air parcels suggest most pollution is being transported to the mountain sites fromGeorgia, Tennessee, and the Ohio Valley. North Carolina will carefully analyze strategiesexpected to be implemented in these areas and work closely with these states to define anyadditional controls to reduce the pollution in the mountains.

Page 38
Figure 10: Comparison of diurnal ozone profile for Purchase Knob (High Elevation Site), Bent Creek (Valley Sitein Buncombe County, and one of the Charlotte area sites.