unveiling pure-metal ejecta x-ray emission in supernova
TRANSCRIPT

Astronomy&Astrophysics
A&A 638, A101 (2020)https://doi.org/10.1051/0004-6361/202038092© ESO 2020
Unveiling pure-metal ejecta X-ray emission in supernovaremnants through their radiative recombination continuum
Emanuele Greco1,2,3, Jacco Vink3,4,5, Marco Miceli1,2, Salvatore Orlando2, Vladimir Domcek3,4, Ping Zhou3,Fabrizio Bocchino2, and Giovanni Peres1,2
1 Dipartimento di Fisica e Chimica, Università degli Studi di Palermo, Piazza del Parlamento 1, 90134 Palermo, Italy2 INAF – Osservatorio Astronomico di Palermo, Piazza del Parlamento 1, 90134, Palermo Italy
e-mail: [email protected] Anton Pannekoek Institute for Astronomy, University of Amsterdam, Science Park 904, 1098 XH Amsterdam, The Netherlands4 GRAPPA, University of Amsterdam, Science Park 904, 1098 XH Amsterdam, The Netherlands5 SRON, Netherlands Institute for Space Research, Utrech, The Netherlands
Received 3 April 2020 / Accepted 26 April 2020
ABSTRACT
Context. Spectral analysis of X-ray emission from ejecta in supernova remnants (SNRs) is hampered by the low spectral resolutionof CCD detectors, which typically creates a degeneracy between the best-fit values of chemical abundances and the plasma emissionmeasure. The combined contribution of shocked ambient medium and ejecta to the emerging X-ray emission further complicates thedetermination of the ejecta mass and chemical composition. This degeneracy leads to big uncertainties in mass estimates and canintroduce a bias in the comparison between the ejecta chemical composition derived from the observations and the yields predicted byexplosive nucleosynthesis models.Aims. We explore the capabilities of present and future spectral instruments with the aim of identifying a spectral feature that mayallow us to discriminate between metal-rich and pure-metal plasmas in X-ray spectra of SNRs.Methods. We studied the behavior of the most common X-ray emission processes of an optically thin plasma in the high-abundanceregime. We investigated spectral features of bremsstrahlung, radiative recombination continua (RRC), and line emission, by exploring awide range of chemical abundances, plasma temperatures, and ionization parameters. We then synthesized X-ray spectra from a state-of-the-art 3D hydrodynamic simulation of Cas A, by using the response matrix from the Chandra ACIS-S charged-coupled devicedetector and that of the XRISM/Resolve X-ray calorimeter spectrometer.Results. We found that a bright RRC shows up when the plasma is made of pure-metal ejecta, and a high spectral resolution isneeded to actually identify this ejecta signature. We tested and verified the applicability of our novel diagnostic tool and we propose apromising target for the future detection of such spectral feature: the southeastern Fe-rich clump of Cas A.Conclusions. While there is no way to unambiguously reveal pure-metal ejecta emission with CCD detectors, X-ray calorimeters willbe able to pinpoint the presence of pure-metal RRC and to recover correctly absolute mass and the chemical composition of the ejecta,opening a new window on the link between progenitor star, supernova and SNRs.
Key words. ISM: abundances – ISM: supernova remnants – ISM: individual objects: Cas A – X-rays: general –X-rays: individuals: Cas A
1. Introduction
Supernova remnants (SNRs), the outcome of supernova (SN)explosions, are extended sources with a complex morphologythat depends on the properties of the progenitor star and ofthe ambient medium, and on the processes associated with theSN explosion. After the explosion, the ejecta of the progenitorstar expand behind the SN blast wave, which interacts with theinterstellar medium (ISM) by heating it up to X-ray emitting tem-peratures. As the forward shock moves outwards, a reverse shockpenetrates and heats the cold expanding ejecta to X-ray emittingtemperatures, leading to additional X-ray emission.
X-ray spectral analysis of SNRs is a powerful tool to studythe chemical composition and mass of the shocked ejecta. Hav-ing information on these quantities is fundamental to knowingmore about the progenitor star, the SN explosion, and the explo-sive nucleosynthesis processes. X-ray spectra of SNRs typicallyalso include the contribution of the shocked ISM, thus making itmore difficult to disentangle the contributions of the continuum
and line emission from the ejecta and the swept-up gas, andto infer their physical and chemical properties. Moreover, X-rayspectral analysis of SNRs performed with charge-coupled device(CCD) detectors with moderate spectral resolution (R ∼ 5−100)is usually affected by a degeneracy between the best-fit valuesof chemical abundances and the plasma emission measure. Infact, because of the low energy resolution, the blending betweendifferent emission lines can create a “false continuum”, whichmakes it difficult to constrain the real continuum flux, especiallybelow 4 keV. Thus, it is possible to describe a certain spectrumeither with high abundances and low emission measure, or viceversa. This degeneracy leads to big uncertainties in the massestimates and may even hide the existence of pure-metal ejectaplasma in SNRs (Vink et al. 1996).
Such uncertainty can be partially addressed by measuringrelative abundances between elements, typically by adoptingSi or Fe as a reference (e.g., Willingale et al. 2002; Miceliet al. 2006, 2008; Kumar et al. 2012; Lopez et al. 2014; Franket al. 2015; Zhou & Vink 2018; Zhou et al. 2019). On the other
Article published by EDP Sciences A101, page 1 of 12

A&A 638, A101 (2020)
hand, this approach does not allow us to unambiguously deriveabsolute mass estimates for the yields in SNe. The comparisonwith theoretical nucleosynthesis yields (e.g., Woosley & Weaver1995; Thielemann et al. 1996; Nomoto et al. 1997; Nakamuraet al. 1999; Sukhbold et al. 2016) can only be performed throughabundances ratios and may lead to a misunderstanding of theeffective explosion mechanism or of the actual progenitor starproperties. In order to have a fully reliable estimate of the abun-dance and of the mass of each element and to correctly comparethese values with the theoretical predictions, a tool able toprecisely estimate the absolute abundances of ejecta is required.
In this paper, we present a study on the behavior of themain emission processes in SNRs in the high-abundance regime:Bremmstrahlung (free–free process, indicated with FF), radia-tive recombination continua (free-bound process, RRC or FB)and line emission. We performed a set of spectral simulationsin order to identify a signature of pure-metal ejecta emission inthe X-ray spectra of SNRs. We identified a novel diagnostic tooland successfully tested its applicability by adopting the GalacticSNR Cassiopeia A (hereafter Cas A) as a benchmark.
The paper is organized as follows: we identify and describethe nature of the pure-metal ejecta signature in Sect. 2; in Sect. 3we describe the synthesis method and the resulting syntheticspectra; in Sect. 4 we investigate the possible detection of pure-metal ejecta emission in Cas A; in Sect. 5 we discuss our resultsand summarize our conclusions.
2. X-ray emission of metal-rich plasma
In this section we recall the physics involved in the thermalemission of an optically thin plasma by focusing especially onthe high-abundance regime. We show the results of our spectralsimulations and the most relevant features related to the X-rayemission of a pure-metal plasma.
2.1. Main X-ray emission processes
The X-ray emitting plasma in SNRs is optically thin and its emis-sion depends on binary collisions between electrons and ions. Ata fixed temperature, T , the emissivity is determined by the emis-sion measure (EM), defined as EM =
∫nenHdV, where ne is the
electron density and nH is the ion density of hydrogen (H) (forsolar abundances, ne ≈ nH). In the following, we briefly recall theemissivity equations for all the emission processes mentioned inSect. 1.
The emissivity of the line emission for a particular transitionj→ i of an element z is (Mewe 1999)
P ji ∝ AznHneF(T ) photons cm−3s−1, (1)
where Az is the abundance of the element z and F(T ) is a func-tion indicating the temperature dependence due to the combinedeffects of ionization and excitation, which sharply peaks at thecharacteristic line temperature.
The total bremsstrahlung emissivity is given by the sum ofthe emissivities of all ion species (Eq. (2), Mewe 1999),
εff ∝∑
i
Z2i neniT−1/2 exp
(−hνkT
)erg cm−3s−1Hz−1, (2)
where Zi and ni are the effective charge and density of theion i. In a plasma with solar (or mildly enhanced) abundances,the main contribution to the bremsstrahlung emission originatesfrom H ions and electrons stripped from H atoms, since thiselement is by far the most abundant (values of the proto-solar
Table 1. Proto-solar abundances, expressed in logarithmic units withH = 12.0, by definition, according to Lodders et al. (2009).
Element Abundance (log units)
H 12He 10.987C 8.443O 8.782Ne 8.103Mg 7.599Si 7.586S 7.210Ar 6.553Ca 6.367Fe 7.514Ni 6.276
abundances in logarithmic units according to Lodders et al. 2009are shown in Table 1). In the pure-metal ejecta (or extremelymetal-rich) scenario, instead, we expect the heavy ions and elec-trons stemming from them to significantly contribute to the FFemission.
Equation (3) shows the emissivity for the FB process(Liedahl 1999):
εfb ∝ neni+1
(hν
kT 1/2
)3
exp(−hν + χ
kT
)erg cm−3s−1Hz−1, (3)
where ni+1 is the ion density of the recombining ion, hν is theX-ray photon energy, and χ is the ionization energy. The widthof the RRC is ∆ν ≈ kT and if kT � hν the emission resultsin relatively narrow, line-like emission peaks near the serieslimits of lines. If kT � hν the RRC is wide and looks like acontinuum distribution, similar in shape to FF above the RRCedge. Up to now, this contribution has been observed only inrecombining (overionized) plasmas like those detected in a largesample of mixed morphology SNRs during the last decade (e.g.,Yamaguchi et al. 2009; Matsumura et al. 2017; Greco et al. 2018for IC443; Ozawa et al. 2009; Miceli et al. 2010 for W49b, Zhouet al. 2011; Uchida et al. 2012 for W44; Sawada & Koyama 2012for W28).
2.2. X-ray spectral signatures of pure-metal ejecta
We performed spectral simulations using the X-ray spectralanalysis code SPEX (version 3.04.00 with SPEXACT 2.07.00,Kaastra et al. 1996) with the aim of investigating the behavior ofthe X-ray emission processes at high abundances. Consideringa plasma in collisional ionization equilibrium (CIE), we studiedthe dependence of the flux on the abundance of two elements:silicon (Si) and iron (Fe). For our simulations, we considered theenergy ranges reported in Table 21. The SiLine band includesthe Si XIII (1.865 keV) and Si XIV (2.006 keV) emission lines,while the SiCont band was chosen to cover the emission at ener-gies slightly above that of the Si XIII recombination edge (2.438keV) and excluding the Si XIV recombination edge (2.673 keV).The FeLine band includes the forest of Fe L-lines for ions FeXVII-XXIII, while the FeCont band covers the emission at ener-gies above the Fe XXIV recombination edge (2.023 keV). Values
1 The S abundance, as well the abundance of all other elements, isfixed to 1. Thus, even if the S XVI line is present at 2.623 keV, it doesnot affect our results.
A101, page 2 of 12

E. Greco et al.: Radiative recombination continua in pure-metal ejecta
Table 2. Energy bands adopted for the X-ray fluxes in Fig. 1.
Band name Energy range (keV)
SiLine 1.79–2.01SiCont 2.47–2.67FeLine 1.2–1.4FeCont 2.05–2.15
Fig. 1. X-ray fluxes of different emission processes (in the correspond-ing energy bands, see Table 2) as a function of Si abundance fora plasma temperature of 1 keV. All values are normalized to thoseobtained for solar abundances.
of the ionization energy are taken from Lide (2003) and the lineenergies are taken from AtomDB WebGuide2.
In the following, we present the results obtained for Si forthe sake of clarity, since the Fe emission shows a very complexline pattern up to energies close to those of its RRC. The resultsobtained for Fe are analogous to those obtained for Si and aredescribed in detail in Appendix A.
Figure 1 shows the integrated flux for each emission processin the corresponding energy band, for a plasma temperature of1 keV, normalized to that obtained for solar abundances. The fluxof line emission increases linearly with the abundance (as pre-dicted by Eq. (1)). The total FB emission shows a weak increasefor abundance values between 1 and 10 because the FB emissionassociated with Si is only a fraction of the total FB emission.Once ASi >∼ 10, the total FB emission is due mainly to the Si FBand we observe a linear dependence (as predicted by Eq. (3)).The FF emission is substantially insensitive to the increasingabundance until values of a few hundred are reached; then, itincreases with the abundance like the FB and line processes. Thisis because for abundances ASi <∼ 102, the FF emission producedby electrons originally belonging to H (hereafter H-electrons)overcomes that of electrons stripped from Si (Si-electrons). Forsolar abundances the number of H-electrons is about 104 timesthe number of Si-electrons (Table 1 and Eq. (2)), therefore, byonly slightly increasing the Si abundance, the global contribu-tion to the FF emission is still mainly associated with H-electrons(and H ions).
As abundances on the order of a few hundred are reached,the number of Si-electrons is not negligible with respect to thenumber of H-electrons. Moreover, in this regime, which we callthe pure-metal ejecta regime, the contribution of Si ions to theelectron scattering becomes important. For these high abun-dances, therefore, the term including the Si contribution
2 http://www.atomdb.org/Webguide/webguide.php.
Fig. 2. Ratio between the FF and FB fluxes shown in Fig. 1 as a functionof the Si abundance for a plasma temperature of 1 keV.
Fig. 3. Same as Fig. 2 for plasma temperatures of 0.2 keV (red line), 0.9keV (green), and 1.7 keV (blue).
becomes the dominant one in the summation of Eq. (2) (giventhe dependence on Z2
i , with Z = 12 for He-like Si) and wethus observe the expected linear increase with the abundance.Figure 2 shows the FB over FF flux ratio: the observed flatteningin the flux ratio reflects the pure-metal ejecta regime discussedso far.
We also investigated how the FB to FF flux ratio depends onthe plasma temperature. We repeated the simulations describedabove by exploring temperatures in the range kT = 0.2−3 keVwith a step of 0.1 keV. Figure 3 shows the FB to FF fluxratios for three different temperatures, namely kT = 0.2 keV,kT = 0.9 keV, and kT = 1.7 keV. By increasing the tempera-ture in the range 0.2–0.8 keV, the slope σ of the FB to FF ratioas a function of Si abundance increases; that is, with high plasmatemperature, the FB contribution becomes more visible than theFF. However, at kT ∼ 0.9 keV, σ reaches its maximum and afurther increase in temperature leads to lower values of σ. Theobserved trend at energies below 0.9 keV is due to the increasingdegree of Si ionization and the subsequent higher number of freeelectrons combined with the increasing width of the RRC, whichis spread out at higher temperatures thus reducing the effect inthe 2.47–2.67 keV band. On the other hand, at energies abovethis threshold, the electrons are so energetic that they can escaperecombination while still increasing the FF emission. The valueof the temperature threshold depends on the element considered,because of the different degree of ionization at a given temper-ature and of the corresponding number of vacancies in the ionitself. Heavier elements have higher thresholds (see Fig. A.1 forthe Fe case) also because of the stronger ion electrostatic field.We found that, in the Si case, the FB to FF ratio is maximized
A101, page 3 of 12

A&A 638, A101 (2020)
Table 3. Main characteristics of ACIS-S (Chandra) and Resolve(XRISM) detectors.
Detector ACIS-S Resolvetechnology CCD microcal.
Field of view 9′ × 9′ 3′ × 3′PSF 0.5′′ 1.7′
Energy res. at 6 keV (eV) 50 5Eff. Area at 1 keV (cm2) 340 160Eff. Area at 6 keV (cm2) 230 210
Energy range (keV) 0.15–12 0.3–12
when the electron temperature is in the range kT = 0.6−1.2 keV.In the Fe case, the corresponding range is kT = 1.5−3.5 keV (seeAppendix A).
In conclusion, we expect that the spectral signature of pure-metal ejecta must be related to the enhanced FB emission.Therefore, a careful study of edges continua can be adopted as adiagnostic tool to reveal pure-metal ejecta in SNRs.
3. Synthetic X-ray spectra
To investigate the observability of pure-metal ejecta emissionin SNRs, we produced synthetic spectra by folding our spec-tral models with the response matrix of actual detectors. We alsoincluded the contribution of the ISM X-ray emission. Pure-metalejecta can be distributed on large, expanding shells as well asconcentrated in dense clumps embedded in an environment ofshocked ISM, where the mixing between ISM and ejecta is lessremarkable (as Hwang & Laming 2003 found for the Fe cloudletsin Cas A). In any case, the ejecta emission is always superim-posed onto the emission stemming from the shocked ISM. Inthis section, we assume a generic value for the column densityequal to nH = 5 × 1021 cm−2, unless otherwise stated.
For our simulations, we used the response matrices of ACIS-S3, a CCD detector on board the Chandra X-ray telescope4 andResolve, a microcalorimeter that will be on board XRISM5,the JAXA/NASA X-ray telescope expected to be launched in2021. The main instrumental characteristics of these instrumentsare summarized in Table 3. XRISM will have lower effectivearea and spatial resolution than Chandra but, thanks to themicrocalorimeter, its spectral resolution will be better than thatof Chandra by a factor of ten.
3.1. ACIS-S
Here, we show that CCD detectors are not able to detect theRRC edge. To do that, we simulated a Chandra ACIS-S syntheticspectrum (1 Ms of exposure time) of a plasma in CIE with ejectaabundance set to 3 for all the elements except for Si, which isset to 300, and an electron temperature of 0.8 keV (Fig. 4). TheSi abundance is so high that the corresponding emission linesdominate the whole spectrum. Even if this scenario is not real-istic, because we have not yet included the contribution of theISM X-ray emission, it allows us to notice that the correspondingspectrum does not show any spectral signatures related to the
3 Using the XMM-Newton/MOS response matrix instead of theChandra/ACIS-S leads to identical results.4 https://heasarc.gsfc.nasa.gov/docs/chandra/chandra.html5 http://xrism.isas.jaxa.jp
Si Recombination Edge
Fig. 4. Synthetic ACIS-S spectra with high Si abundance. Black: syn-thetic ACIS-S spectrum of a CIE plasma with abundance of all elementsset to 3, with the exception of Si abundance set to 300; kT = 0.8 keV andEM = 1.5 × 1055 cm−3. Red solid: same spectrum but with the Si lineemission subtracted, but Si contributions to the FF and FB continuumare still included.
RRC emission, which is expected to be present on the basis ofthe study of the fluxes discussed in the previous section. Thisis because the poor resolution of the CCD spectrometer makesthe He-Si and H-Si lines heavily broadened. The line broadeningblurs the recombination edges, thus hiding the spectral signatureof pure-metal ejecta emission. In fact, by ignoring only the Siline emission (Si contributions to the FF and FB continuum arestill included), the resulting spectrum (in red in Fig. 4) shows, asexpected, a prominent edge of recombination at the characteristicenergy of Si-RRC.
The difficulty of observing enhanced FB emission and thecontamination by shocked ISM hamper the identification ofpure-metal ejecta in CCD spectra. As an example, we hereshow a synthetic SNR spectrum (a more realistic simulation,performed for a specific case, is presented in Sect. 4). We con-sidered a spherical clump of Si-rich ejecta (Si abundance setto 300, as before) with radius Rclump = 0.5 pc and temperaturekTclump = 0.8 keV, surrounded by a colder ISM with tempera-ture kTISM = 0.15 keV. If we assume a density particle ne equalto 3 cm−3 and pressure equilibrium between the clump and theISM, and extract the spectrum from a box corresponding to aregion of 8 pc × 8 pc (in the plane of the sky) and extending8 pc along the line of sight, the ISM emission measure is fourorders of magnitude larger than that of the clump (see Table 4for details). This case is the one in which the effect is maxi-mized but, as we will also see in Sect. 4, this remains visible inthe whole typical temperature range of SNRs and our conclu-sions do not depend on this choice. We synthesized the ACIS-SX-ray spectrum using the CIE+CIE pure-metal model describedin Table 4. We assumed a distance of 1 kpc and an unrealis-tically high exposure time of 108 s in order to highlight thefeatures. In Sect. 4 we will discuss cases with a more realisticexposure time. We adopted the response and ancillary files pro-duced during the data reduction of Chandra observation 114 (PIHolt). Figure 5 shows the resulting synthetic ACIS-S spectrum.As a comparison, we also produced a spectrum starting from themild-ejecta model described in Table 4, namely a model with thesame parameters as those of the pure-metal model except only forthe Si abundance, which is set to 3 (instead of 300), and for theejecta EM, set to 1.6×1057 cm−3. This new spectrum is shown inFig. 5. A comparison between the two spectra does not reveal
A101, page 4 of 12

E. Greco et al.: Radiative recombination continua in pure-metal ejecta
Table 4. Parameters of the ISM (CIE) plus pure-Si (CIE) or mild-Simodels used for the spectral synthesis with the corresponding inferredSi and ejecta masses.
Parameter ISM Pure-metal Mild-ejecta
EM (cm−3) 1.6 × 1059 1.5 × 1055 1.5 × 1057
kT (keV) 0.15 0.8 0.8Si Abundance 1 300 3
Si mass (M�) / 0.015 0.0016Ejecta mass (M�) / 0.06 0.6
Fig. 5. Synthetic ACIS-S spectra of ISM+pure-Si (pure-metal model,red) and ISM+Si-rich (mild-ejecta model, black) plasmas.
any clear difference that could be related to the pure-metalejecta emission (even with an unrealistically high exposure timeof 108 s). However, as we can see from the derived massesin Table 4, in the pure-metal ejecta the total mass estimategoes down, but the mass of the considered element, Si in thiscase, goes up. We have two different models, with two differ-ent masses prediction, which are substantially indistinguishable.Spectra in Fig. 5 confirm that the degeneracy between abundanceand emission measure is a serious issue, which is intrinsicallydue to the instrumental characteristics of the CCD cameras anddoes not depend on the statistics of the observation. The abilityto close off and identify the presence of FB contributions offers aunique diagnostic tool to assess whether the spectrum is comingfrom a highly enriched, but still hydrogen-dominated plasma, orfrom a pure-metal ejecta plasma.
3.2. Resolve
Here, we further show that the degeneracy between abundanceand emission measure is intrinsically due to the instrumentalcharacteristics of the CCD cameras and does not depend on thestatistics of the observation. We repeated the spectral simula-tions discussed above by folding the pure-metal model and themild-ejecta model with the Resolve response matrix6.
Figure 6 shows the pure-metal case and the mild-ejecta case,again assuming an exposure time of 108 s. Thanks to the high
6 Resolve response and ancillary files used are xarm_res_h5ev_20170818.rmf and xarm_res_flt_fa_20170818.arf, availableon https://heasarc.gsfc.nasa.gov/docs/xrism/proposals/
Si Recombination Edge
Fig. 6. Same as Fig. 5 but the model is folded through the Resolveresponse matrix.
spectral resolution of the microcalorimeter, it is now possibleto observe a clear spectral difference between the two scenar-ios. As expected on the basis of the study presented in Sect. 2,a bright edge of recombination shows up at ∼2.5 keV (i.e., theHe–Si RRC typical energy) when the abundance of Si is 300.Figure 6 also clearly shows that the recombination edge and theRRC are much dimmer in the mild-ejecta case. We stress that, inthe pure-metal ejecta regime, even if the bremsstrahlung emis-sion from the shocked ISM enhances the continuum emissionand strongly reduces the equivalent width of emission lines, theRRC still emerges above the FF emission at energies >2.5 keV.Therefore, according to our simulations, the enhanced FB emis-sion is a better tracer of pure-metal ejecta than the line equivalentwidth.
High resolution spectrometers like Resolve (and, in thefuture, X-IFU on board the Advanced Telescope for High-EnergyAstrophysics, ATHENA) are therefore capable of pinpointing theenhancement in the FB emission associated with a plasma withextremely high metallicity.
4. Pure-metal ejecta in Cas A
The simulations described above show that the enhancement inthe RRC emission can be a strong signature of pure-metal ejectaand that such a spectral signature can be detected with highresolution spectrometers, while being almost impossible to beobserved with CCD detectors. We here apply our diagnostic toolto a real case, by focusing on Cas A. In particular, we aim tounderstand whether it will be possible to pinpoint pure-metalejecta emission with the Resolve spectrometer.
Cas A is one of the brightest and most studied SNR. It is ayoung (330 yr old, Thorstensen et al. 2001) SN IIb-type remnant(Krause et al. 2008) at a distance of 3.4 kpc (Reed et al. 1995),which shows many asymmetries and an overall clumpiness (Reedet al. 1995; Hwang & Laming 2003, 2012; Vink & Laming 2003;Hwang et al. 2004; DeLaney et al. 2010; Milisavljevic & Fesen2013; Lee et al. 2014). In particular, Hwang & Laming (2012)performed a detailed survey of the ejecta distribution in Cas Ahighlighting the presence of three large-scale Fe-rich clumps.They also confirmed the existence of an Fe-rich cloudlet, pre-viously detected by Hughes et al. (2000) and Hwang & Laming(2003), located within the southeastern clump. In this cloudletthe relative Fe/Si abundance is ∼20, while Fe/Si is ∼5 in theother Fe-rich regions of Cas A.
A101, page 5 of 12

A&A 638, A101 (2020)
Fig. 7. Chandra count-rate image of Cas A in the 0.3−7 keV energyband with a logarithmic color scale. The small red box marks the Fe-richcloudlet, the black box indicates the region selected in the southeasternFe-rich clump, the yellow ellipse shows the region chosen for the back-ground, and the dashed white circle marks the nominal position of thereverse shock.
Here, we take advantage of the 3D hydrodynamic (HD) sim-ulation of Cas A performed by Orlando et al. (2016; hereafterO16). This state-of-the-art simulation models the evolution ofCas A from the immediate aftermath of the supernova to the 3Dinteraction of the remnant with the ambient environment. In par-ticular, we adopted the model configuration that best describesthe observed ejecta distribution (run CAS-15MS-1ETA in O16).This model reproduces the observed average expansion rate ofthe remnant and the shock velocities, and constrains the post-explosion anisotropies responsible for the observed structure andchemical distribution of ejecta. The model can reproduce verywell the shocked Fe distribution (both on large and relativelysmall spatial scales) while the Si (and S) mass seem to be slightlyunderestimated. We therefore focused on the Fe emission andadopted the HD simulation as a reference template to synthesizethe expected X-ray emission. We point out that the remnant evo-lution modeled by O16 clearly shows that large regions of Cas Aare expected to be filled with pure Fe-rich ejecta.
We consistently produced synthetic Chandra/ACIS andXRISM/Resolve spectra of the southeastern Fe-rich clump inCas A from the 3D HD simulation. We compared the syntheticspectra with that observed by Chandra and made predictions forthe future Resolve observations.
4.1. Data analysis
We analyzed the Chandra observation with ID 114 (PI Holt), per-formed on 30/01/2000. We used the tool fluximage to produce acount-rate image of Cas A with a bin size of 1′′. Figure 7 showsthe count-rate image in the 0.3−7 keV energy band togetherwith the regions selected for the spectral extraction. Within thesoutheastern Fe-rich clump, non-thermal emission from the CasA reverse shock has been detected (Gotthelf et al. 2001) andmapped accurately (Helder & Vink 2008). Since synchrotronX-ray emission is not taken into account in our spectral synthesiscode, we carefully selected the large box in the southeastern partof the shell by excluding the reverse shock.
By fitting the cloudlet spectrum we found the same best-fitparameters as Hwang & Laming (2003), including an Fe/Siabundance ratio equal to ~20. In addition, we found that theabsolute Fe abundance is not well constrained. In fact, two
1 2 5
10−3
0.0
10.1
110
norm
aliz
ed c
ounts
s−1
keV−1
Energy (keV)emanuele 27−
Si XIII
Fe XXV
S XV
Fe L complex
1 2 50.0
10.1
110
norm
aliz
ed c
ounts
s−1
keV−1
Energy (keV)
data
−
Si XIII
S XV
Fe XXV
Fe L complex
Fig. 8. Comparison between actual Chandra spectra. Upper panel:Chandra ACIS-S spectra extracted from the southeastern Fe-rich clump(black box in Fig. 7) and from the Fe-rich cloudlet (red box in Fig. 7)shown by black and red crosses, respectively. Lower panel: ChandraACIS-S synthetic spectrum clump derived from the HD simulation ofthe southeastern Fe-rich (black crosses). Red crosses show the renor-malized observed spectrum of the Fe-rich cloudlet shown in the upperpanel for easy comparison with the synthetic spectrum.
statistically equivalent fits with χ2red = 1.55 (136 d.o.f.) can be
obtained with AFe = 29 (and EM = 1.4 × 1055 cm−3 for theejecta component) and AFe = 290 (EM = 1.6 × 1054 cm−3).The cloudlet spectrum is shown in the upper panel of Fig. 87:the wide and bright structure at energies ~1 keV, reveals thepresence of a remarkable complex of Fe L lines, but we donot see any Fe RRC. As explained in Sect. 3, the absence ofthis feature can be related to the instrumental characteristics ofChandra. The upper panel of Fig. 8 also shows the spectrumextracted from the black box of Fig. 7, which presents a verystrong Fe emission line complex, but with the addition of brightSi and S emission lines (the Fe/Si abundance ratio is lower thanthat in the Fe-rich cloudlet, being only ∼5). This suggests thepresence of both Fe-rich and Si-rich ejecta though we cannotexclude that the observed silicon emission may be somehowenhanced by the dust scattering in this region.
7 Plots in Fig. 8 are obtained through the spectral analysis softwareXSPEC (Arnaud 1996).
A101, page 6 of 12

E. Greco et al.: Radiative recombination continua in pure-metal ejecta
4.2. Self-consistent X-ray synthesis tool
We developed a tool to self-consistently synthesize the thermalX-ray emission from the 3D HD simulation. In each cell of thecomputational domain we derive the local value of temperature,electron density, ionization parameter (τ, defined as the timeintegral of the electron density computed from the impact withthe shock front), total mass, and mass tracer of each element(see O16 for the list of isotopes included in the simulation). Themass tracer describes the mass of a given species as a fractionof the total mass in the cell. Our tool extracts all the aforemen-tioned quantities for each cell and we use these values as inputparameters for the non-equilibrium of the ionization opticallythin plasma model neij (Kaastra & Jansen 1993) based on theatomic database SPEXACT 2.07.00, within SPEX. In particu-lar, for each atomic species i, we derive the local value of ionand electron density and synthesize the corresponding “pure-i”spectrum in each computational cell. The latter step is done bysetting the abundance of all elements except i equal to 0, while iabundance is set to 1. We then sum the resulting spectra overall the species by weighting each term for the correspondingemission measure. Finally, we sum the spectra of all the com-putational cells within a given region of the domain to derivethe global spectrum of a selected area in the numerical simula-tion. All the spectra are filtered through photoelectric absorptionby the interstellar medium, with the appropriate column den-sity (for this region nH = 1.5 × 1022 cm−2, Hwang & Laming2012) and are estimated assuming a distance of 3.4 kpc (Reedet al. 1995). Each spectrum can be folded through the instrumen-tal response matrix (i.e., Chandra/ACIS-S or XRISM/Resolve).All the spectra are binned using the optimal bin tool present inSPEX (Kaastra et al. 1996). By selecting the ACIS-S responsematrix, we can directly compare the synthetic spectra with thoseobserved, which is crucial for a fine-tuning of the selection ofthe region for the synthesis.
4.3. Synthesis of Cas A spectra
We selected a region in the southeastern Fe-rich clump withthe same size as the black box chosen from the actual Chandradata and displayed in Fig. 7 (the spatial resolution of XRISMis not good enough to resolve the Fe-rich cloudlet marked inred in Fig. 7). The resulting synthetic Chandra ACIS-S spec-trum, obtained assuming an exposure time of 1 Ms, is shownin the lower panel of Fig. 8. The spectrum clearly shows signa-tures of bright Fe line emission, broadly similar to those actuallyobserved in the corresponding region. At odds with the observa-tions, the synthetic spectrum does not show very bright emissionlines from Si and S ions, thus indicating that intermediate masselements are somehow under-represented in the simulation inthis particular region. We point out that we are not aiming tofind a perfect agreement between synthetic and observed spectra,but we are interested in providing reliable and robust predic-tions on the X-ray emission from Fe-rich ejecta. We show belowthat the lack of bright Si and S emission lines in the syntheticspectra does not affect our conclusions. We here notice that thesynthetic spectrum is a good proxy of the real Fe-rich ejectaemission, given that it is extremely similar to the actual spec-trum of the Fe-rich cloudlet (red box in Fig. 7). This is shownin Fig. 8, where the observed and renormalized spectra of thecloudlet can be compared with that derived from the HD sim-ulation. We only note some discrepancies in the brightness ofthe Fe XXV emission line, which is slightly overestimated in thesynthetic spectrum. This is due to the fact that, in this region,
the simulated temperature is slightly (∼30%) higher than thatobserved. However, this excess does not affect our conclusionssince both actual and modeled temperatures lie in the range inwhich the Fe FB to FF ratio is maximized (see Appendix A).We only expect a slightly narrower edge of Fe RRC in the actualspectra with respect to that derived from the simulation.
As in the actual data, we found that it is not possible to con-strain the Fe abundance in the ACIS-S spectrum of this region.In fact, two statistically equivalent fits that have χ2
red = 1.06 (138d.o.f.) can be obtained with AFe = 45 (and EM = 1.3 ×1057 cm−3
for the ejecta component) and AFe = 1200 (EM = 6 ×1055 cm−3).The corresponding Fe mass is therefore highly uncertain,spanning from MFe = 2 ×10⁻⁴ M� to MFe = 4 × 10⁻³ M�.
We then synthesized the XRISM/Resolve spectrum fromthe same region, by assuming an exposure time of 1 Ms. Theresulting spectrum is shown in Fig. 9. The microcalorimeterspectrometer provides a superior spectral resolution, allowing usto clearly identify all the emission lines and spectral features. Wehere show that, by analyzing the Resolve synthetic spectrum, it ispossible to unambiguously identify the enhanced RRC emissionfrom the recombination of Fe ions, thus revealing the presenceof pure-metal ejecta (as predicted in Sect. 3).
We fitted the spectrum with two isothermal components ofan optically thin plasma in non-equilibrium of ionization asso-ciated with the shocked ISM and ejecta, respectively (hereafterNEI+NEI model). We considered two different scenarios: mild-ejecta and pure-metal ejecta. In the first case, we kept the Feabundance fixed to ten in the ejecta component (the spectrumwith the best-fit model and residuals is shown in the upper panelof Fig. 9); in the second case we left the Fe abundance of theejecta component free to vary (mid panel of Fig. 9). Best-fitparameters are shown in Table 5.
The spectral residuals and χ2 show that an Fe abundance>100 is necessary to properly fit the Fe RRC. The mild-ejectascenario leads to strong residuals at the recombination edgeenergy and to a global misrepresentation of the spectrum. Asalready mentioned in Sect. 3.1, we expect that in the pure-metalejecta scenario the total mass estimate goes down, but the massof the considered element, Fe in this case, goes up. Indeed,by fitting the spectrum synthesized with XRISM, we obtainedMFe = 4.8+0.5
−0.4 × 10⁻³ M�, in good agreement with the valueused in the simulation, 4.6 × 10⁻³ M�. The high spectral res-olution provided by the microcalorimeters allows us to revealthe enhanced RRC emission of pure-metal ejecta and this clearlyremoves the degeneracy between abundance and emission mea-sure in the fitting procedure, leading to a correct estimate of theabsolute Fe mass in this area.
As explained above, the HD simulation provides an accu-rate description of the actual distribution of Fe-rich ejecta in CasA and is able to reproduce the spectral features observed withChandra. However, the moderate spectral resolution of Chandra(and CCD detectors in general) does not allow us to confirm thatpure-metal ejecta are present in Cas A, as predicted by the O16model. If pure-Fe ejecta are actually present in the southeasternlimb of Cas A, we expect to pinpoint their presence with XRISMand to correctly derive their mass (see Sect. 5).
As explained above, we expect that the actual spectrum willshow more Si and S line emission than that predicted by our sim-ulation (see Fig. 8). Therefore, we should observe brighter Si andS lines and a bright RRC from Si (at energies E > 2.5 keV, seeFig. 6) and S (E > 3 keV). These features will not mask out theFe RRC, thus not affecting our conclusions. In fact, the Si and Slines will be well resolved by the XRISM spectrometer without
A101, page 7 of 12

A&A 638, A101 (2020)
Fe Recombination Edge
Mild-ejecta
Fe Recombination Edge
Pure-metal 1 Ms
Fe Recombination Edge
Pure-metal 250ks
Fig. 9. Synthetic XRISM spectra of the Fe-rich southeastern clump withthe corresponding best-fit models and residuals obtained for the mild-ejecta case (upper panel), the pure-metal ejecta case (middle panel),and the pure-metal ejecta case with an exposure time of 250 ks (lowerpanel). Table 5 provides details of the best-fit parameters.
contaminating the Fe RRC and the Si (and S) RRC; also, edgesshow up at energies higher than the Fe XXIV recombinationenergy (2.023 keV).
We note that the residuals at low energy in the lower panelof Fig. 9 are due to our simplified spectral model that includesonly one isothermal component for the ejecta. Indeed, our HDsimulation shows a relatively broad distribution of plasma tem-peratures and ionization parameters in the region selected, but
we are fitting the spectrum with only two temperatures and ion-ization parameters. A multi-component model provides a muchbetter fit to the emission line complexes, but this is beyond thescope of this paper. In any case, even with this more complexspectral model, we verified that an Fe abundance >100 is alwaysrequired to fit the spectrum.
So far, we have shown the synthetic spectra produced assum-ing an exposure time of 1 Ms. We are aware that it may not bepossible to observe this region of Cas A for such a large amountof time. Therefore, we synthesized the same spectrum as in theupper panel of Fig. 9 assuming an exposure time of 250 ks(lower panel in Fig. 9). The enhanced Fe RRC remains visi-ble in the spectrum and the pure-metal ejecta model describesthe spectrum significantly better than the mild-ejecta model.An exposure time shorter than 250 ks may not be sufficient tounambiguously detect the pure-metal ejecta.
5. Discussion and conclusions
In this paper we have shown that spectral analysis carried outwith current X-ray detectors suffers from an intrinsic degener-acy in measuring the abundances using line-dominated spectrafrom SNRs. We studied the behavior of the X-ray emission pro-cesses at high abundances, identifying the enhanced RRC as thespectral signature of pure-metal ejecta. We showed that the lowenergy resolution of current CCD detectors hampers our under-standing of the spectra, hiding the characteristic RRC. We foundthat future microcalorimeter spectrometers, such as Resolve,which will be onboard the XRISM telescope, can address thisissue. We also presented a very promising case for the detectionof pure-Fe emission in the southeastern clump of Cas A, by usingboth Chandra data and a 3D HD simulation to derive quantitativepredictions of the expected Resolve spectrum. The resulting syn-thetic spectra show bright Fe RRC at an energy of around 2 keVand the fits performed on such spectra can definitely pinpoint thepresence, if any, of pure-metal ejecta.
5.1. Implications for SNRs with overionized ejectacomponents
The RRC features discussed here have a different physical ori-gin with respect to those associated with overionized plasmasthat have been detected so far in spectra of mixed-morphologySNR, namely those remnants that show bright radio emissionin the outer shells and peaked X-ray emission in the internalones. When a plasma in equilibrium of ionization undergoesa rapid cooling, the electron temperature is drastically loweredand the plasma degree of ionization is higher than that expectedin CIE for the observed electron temperature. In this scenario,the plasma is in a phase of strong recombination and the char-acteristic spectra show very bright recombination edges. Thephysical mechanism that causes the rapid cooling of the plasmais still debated and both thermal conduction with nearby molec-ular clouds (e.g., Okon et al. 2020) and adiabatic expansion(e.g., Zhou et al. 2011, Yamaguchi et al. 2009) have been pro-posed as viable cooling processes (even for the same object, seeMatsumura et al. 2017 and Greco et al. 2018 for IC 443). Weverified that the enhanced recombination features related to pure-metal ejecta can be distinguished from those associated withoverionization. The upper panel of Fig. 10 shows the contin-uum emission of an overionized plasma with τrec = 1011 s cm−3,cooled down to kTfin = 0.5 keV from an initial temperaturekT0 = 5 keV (typical values for overionized plasmas in SNRs,Matsumura et al. 2017; Greco et al. 2018), and the continuum
A101, page 8 of 12

E. Greco et al.: Radiative recombination continua in pure-metal ejecta
Table 5. Best-fit values for the fitting of the synthetic XRISM/Resolve spectrum of the Cas A southeastern region by adopting two thermalcomponents, in the mild-ejecta and pure-metal ejecta scenarios.
Parameter NEI+NEI (mild-ejecta) NEI+NEI (pure-metal ejecta) NEI+NEI (pure-metal ejecta) 250ks
nH (1022cm−2) 1.5 (frozen)
kT (keV) 0.5+0.3−0.001 1.96 ± 0.05 1.62+0.11
−0.06
τ (1011s cm−3) 1.10+0.08−0.05 1.13 ± 0.04 1.8+0.3
−0.2
EM (1058 cm−3) 0.19+0.002−0.17 0.150± 0.004 0.20+0.02
−0.01
kT (keV) 3.9+0.3−0.15 2.90 ± 0.01 2.89±0.03
τ (1011 s cm−3) 1.53+0.05−0.08 2.51± 0.02 2.51+0.05
−0.03
EM (1058 cm−3) 0.34+0.04−0.001 0.056 ± 0.005 0.002+0.0003
−0.001
Si 0.415+0.003−0.011 0.77 ± 0.08 1 ±1
S 0.377+0.005−0.013 0.93+0.08
−0.07 2.0+2−0.2
Ar 0.25 ± 0.02 0.4±0.2 1+15−1
Ca 0.15+0.02−0.03 0.49 ± 0.2 1+7
−1
Fe 10 (frozen) 119+11−9 300+400
−100
χ2red (d.o.f.) 11.85 (5005) 2.11 (5004) 0.65 (4709)
Counts 1.4× 10⁶ 3.5× 10⁵
Notes. The abundances of the first component (associated with the ISM) are all frozen to 1. The rightmost column displays the best-fit valuesobtained from the 250 ks spectrum.
emission of ejecta in the pure-Si regime (Si abundance set to300). The RRC produced by the overionized plasma is muchstronger than that of pure-metal ejecta. This is because in thepure-metal ejecta regime the ratio FB/FF does not increase arbi-trarily with the abundance, but reaches a saturation value (seeFig. 2), which is smaller than that obtained for the case of ove-rionization. Moreover, in the case of overionization, the Si-edgeis actually composed of two different edges: the one at lowerenergy is related to the He-like Si, while the second edge, whichis the brightest, is associated with H-like Si. This is a charac-teristic feature of overionized plasmas, since the high degree ofionization leads to an increase in the H-like ions at the expenseof the He-like ions. Therefore, both the shape and the intensityof the RRC and edges make it possible to discriminate betweenpure-metal ejecta and overionized plasmas.
Nevertheless, the case of a pure-metal ejecta overionizedplasma also needs to be considered. This scenario may be real-istic for the Galactic SNR W49B (Ozawa et al. 2009; Miceliet al. 2010; Zhou et al. 2011; Lopez et al. 2013; Zhou & Vink2018). The combination of the two effects (pure-metal plasmaand overionization) further increases the contribution of the RRCemission and needs to be taken into account to correctly esti-mate the ionization parameter. The line emission has a crucialrole in this scenario. In the lower panel of Fig. 10, we show thesame synthetic XRISM spectra displayed in the upper panel ofFig. 10 assuming an exposure time of 100 ks and also includingline emission. Even with this realistic exposure time we can eas-ily distinguish the different shapes of the RRCs and discriminatebetween pure-metal ejecta and overionized plasma. Moreover,the line emission is completely different in the two spectra. Inthe recombining scenario the Si H-like lines dominate the spec-trum and the He-like ones are significantly fainter. At the sametime, the overall brightness of Si lines is higher in the pure-metal
scenario, as we expect because of the high abundance. In conclu-sion, a careful analysis of the line emission is needed to correctlydistinguish between the pure-metal ejecta and the recombiningscenarios.
5.2. Recovering the absolute mass thanks to RRC withResolve spectra
The capability of detecting pure-metal ejecta emission is crucialto recover the correct mass of the atomic species in the ejecta.We here show that from the synthetic XRISM spectrum of CasA (discussed in the previous section) it is possible to properlyderive the Fe mass. We compared the Fe mass calculated fromthe best-fit models of the synthetic XRISM and Chandra spectrawith the correct value, known from the HD simulation. In orderto estimate the filling factor of ejecta and ISM from the analy-sis of the synthetic spectra, we followed the recipe by Bocchinoet al. (1999) under the assumption of pressure equilibrium. Asexplained in Sect. 4.3, by fitting the Chandra synthetic spectrum,we found that the Fe abundance can vary from a few tens to morethan 103. By fitting the spectrum synthesized with XRISM, weinstead obtained MFe = 4.8+0.5
−0.4 × 10⁻³ M�. From the simulation,we know that the correct value of the Fe mass in the region is4.6 × 10−3 M�. Despite the lower statistics, by fitting the 250ks XRISM spectrum we obtain MFe = 6+5
−2 × 10⁻³, which is con-sistent with the correct value. We stress that an exposure timeshorter than 250 ks could lead to an ambiguous detection of thepure-metal ejecta feature. By analyzing the XRISM spectra, weremarkably recover the real mass of the Fe-rich ejecta withoutthe degeneracy present in the Chandra analysis. The analysis ofCCD spectra can be misleading in the estimation of Fe massby up to a factor of 20. This comparison further confirms thatin order to correctly evaluate the ejecta mass it is crucial to
A101, page 9 of 12

A&A 638, A101 (2020)
Fig. 10. Comparison between spectra produced by a pure-metal plasmaand an overionized plasma. Upper panel: in red, continuum-only spec-trum of a typical overionized SNR (Si abundance set to 3, τrec =1011 s cm−3, kTfin = 0.5 keV and kT0 = 5 keV); in black, continuum-only spectrum of a typical pure-ejecta plasma in CIE (Si abundanceset to 300 and kT = 0.5 keV). Both spectra are synthesized assuming anexposure time of 108 ks. Lower panel: same as upper panel but assumingan exposure time of 100 ks and also including the line emission.
accurately study the RRC of the elements, and high-resolutionspectrometers are needed. This is critical since the element massis used in comparisons with theoretical nucleosynthesis yields.
Acknowledgements. We thank S. Ustamujic and A. Petralia for helpful advicein the development of spectral synthesis tools and J. Mao for help in the useof SPEX software. P.Z. acknowledges support from the NWO Veni Fellowship,grant no. 639.041.647 and NSFC grants 11503008 and 11590781.
ReferencesArnaud, K. A. 1996, ASP Conf. Ser., 101 17Bocchino, F., Maggio, A., & Sciortino, S. 1999, A&A, 342, 839
DeLaney, T., Rudnick, L., Stage, M. D., et al. 2010, ApJ, 725, 2038Frank, K. A., Burrows, D. N., & Park, S. 2015, ApJ, 810, 113Gotthelf, E. V., Koralesky, B., Rudnick, L., et al. 2001, ApJ, 552, L39Greco, E., Miceli, M., Orlando, S., et al. 2018, A&A, 615, A157Helder, E. A., & Vink, J. 2008, ApJ, 686, 1094Hughes, J. P., Rakowski, C. E., Burrows, D. N., & Slane, P. O. 2000, ApJ, 528,
L109Hwang, U., & Laming, J. M. 2003, ApJ, 597, 362Hwang, U., & Laming, J. M. 2012, ApJ, 746, 130Hwang, U., Laming, J. M., Badenes, C., et al. 2004, ApJ, 615, L117Kaastra, J. S., & Jansen, F. A. 1993, A&AS, 97, 873Kaastra, J. S., Mewe, R., & Nieuwenhuijzen, H. 1996, in UV and X-ray Spec-
troscopy of Astrophysical and Laboratory Plasmas, eds. K. Yamashita, &T. Watanabe (Cambridge: Cambridge University Press), 411
Krause, O., Birkmann, S. M., Usuda, T., et al. 2008, Science, 320, 1195Kumar, H. S., Safi-Harb, S., & Gonzalez, M. E. 2012, ApJ, 754, 96Lee, J.-J., Park, S., Hughes, J. P., & Slane, P. O. 2014, ApJ, 789, 7Lide, D. 2003, CRC Handbook of Chemistry and Physics, 84th edn. (Boca Raton:
Taylor & Francis)Liedahl, D. A. 1999, The X-Ray Spectral Properties of Photoionized Plasma and
Transient Plasmas, eds. J. van Paradijs, & J. A. M. Bleeker, Lect. Notes Phys.(Berlin: Springer), 520, 189
Lodders, K., Palme, H., & Gail, H. P. 2009, Landolt Boumlrnstein, 4B, 712Lopez, L. A., Pearson, S., Ramirez-Ruiz, E., et al. 2013, ApJ, 777, 145Lopez, L. A., Castro, D., Slane, P. O., Ramirez-Ruiz, E., & Badenes, C. 2014,
ApJ, 788, 5Matsumura, H., Tanaka, T., Uchida, H., Okon, H., & Tsuru, T. G. 2017, ApJ, 851,
73Mewe, R. 1999, Atomic Physics of Hot Plasmas, eds. J. van Paradijs, & J. A. M.
Bleeker, Lect. Notes Phys. (Berlin: Springer), 520, 109Miceli, M., Decourchelle, A., Ballet, J., et al. 2006, A&A, 453, 567Miceli, M., Bocchino, F., & Reale, F. 2008, ApJ, 676, 1064Miceli, M., Bocchino, F., Decourchelle, A., Ballet, J., & Reale, F. 2010, A&A,
514, L2Milisavljevic, D., & Fesen, R. A. 2013, ApJ, 772, 134Nakamura, T., Umeda, H., Nomoto, K., Thielemann, F.-K., & Burrows, A. 1999,
ApJ, 517, 193Nomoto, K., Hashimoto, M., Tsujimoto, T., et al. 1997, Nucl. Phys. A, 616,
79Okon, H., Tanaka, T., Uchida, H., et al. 2020, ApJ, 890, 62Orlando, S., Miceli, M., Pumo, M. L., & Bocchino, F. 2016, ApJ, 822, 22Ozawa, M., Koyama, K., Yamaguchi, H., Masai, K., & Tamagawa, T. 2009, ApJ,
706, L71Reed, J. E., Hester, J. J., Fabian, A. C., & Winkler, P. F. 1995, ApJ, 440, 706Sawada, M., & Koyama, K. 2012, PASJ, 64, 81Sukhbold, T., Ertl, T., Woosley, S. E., Brown, J. M., & Janka, H.-T. 2016, ApJ,
821, 38Thielemann, F.-K., Nomoto, K., & Hashimoto, M.-A. 1996, ApJ, 460, 408Thorstensen, J. R., Fesen, R. A., & van den Bergh, S. 2001, AJ, 122, 297Uchida, H., Koyama, K., Yamaguchi, H., et al. 2012, PASJ, 64, 141Vink, J., & Laming, J. M. 2003, ApJ, 584, 758Vink, J., Kaastra, J. S., & Bleeker, J. A. M. 1996, A&A, 307, L41Willingale, R., Bleeker, J. A. M., van der Heyden, K. J., Kaastra, J. S., & Vink,
J. 2002, A&A, 381, 1039Woosley, S. E., & Weaver, T. A. 1995, ApJS, 101, 181Yamaguchi, H., Ozawa, M., Koyama, K., et al. 2009, ApJ, 705, L6Zhou, P., & Vink, J. 2018, A&A, 615, A150Zhou, X., Miceli, M., Bocchino, F., Orlando, S., & Chen, Y. 2011, MNRAS, 415,
244Zhou, P., Vink, J., Safi-Harb, S., & Miceli, M. 2019, A&A, 629, A51
A101, page 10 of 12

E. Greco et al.: Radiative recombination continua in pure-metal ejecta
Appendix A: Spectral simulations for the Fe case
Fig. A.1. X-ray fluxes of different emission processes in the correspond-ing energy bands (see Table 2) as a function of Fe abundance. Upperpanel: same as Fig. 1 with Fe instead of Si. Lower panel: ratio betweenthe FF and FB fluxes shown in the upper panel as a function of Feabundance for a plasma temperature of 1 keV.
In this section we show the results of the spectral simula-tions described in Sect. 2.2, by focusing on the Fe abundance.Figure A.1 shows the integrated and normalized fluxes in the cor-responding energy bands (see Table 2) of the various emissionprocesses as functions of the Fe abundance, and the correspond-ing FB over FF ratio. The trend is the same as that alreadydiscussed for the Si case with saturation occurring when the Feabundance is close to one hundred. The study on the temperaturedependence of the FB to FF ratio showed that the observabilityof the Fe RRC is maximized when the electron temperature is inthe range 1.5-3.5 keV (see Fig. A.2). We also notice that thereare different recombination edges, corresponding to the differentFe ionization states, and that the brightest RRC depends on thetemperature and on the degree of ionization of the plasma. Inany case, the conclusions obtained for a specific Fe RRC are alsovalid for the other ones.
For all the syntheses we are going to discuss in this sectionwe consider a distance of 1 kpc and an absorbing column densityof nH = 5× 1021cm−2, unless otherwise stated. We synthesized apure-Fe spectrum with abundances of all elements except Fe setto 3, Fe abundance set to 300, kT = 1.5 keV, and a particle den-sity of 3 particles per cm3. The resulting spectrum (black crossesin Fig. A.3), synthesized assuming that the emission originatesfrom a clump with radius Rclump = 1.6 pc, showed the sameissues faced with Si synthesis, due to the spectral resolution ofthe CCD detectors. We here chose a clump larger than that of theSi case because the considered RRC is in a part of the spectrumwhere the ISM emission is more significant (i.e., the ejecta FBemission is less visible). In any case, we verified that the good-ness of our conclusions are not affected by this choice, as wealso showed by discussing the realistic case of Cas A in Sect. 4.
Fig. A.2. Same as lower panel of Fig. A.1 for plasma temperatures of0.7 keV (red line), 2.1 keV (green), and 4.0 keV (blue).
Fe Recombination Edge
Fig. A.3. Synthetic ACIS-S spectra with high Fe abundance. Black:synthetic ACIS-S spectrum of a CIE plasma with abundance of allelements but Fe set to 3, Fe abundance set to 300, kT = 1.5 keV,and EM = 1.5 × 1056 cm−3. Red solid: same spectrum but with the lineemission subtracted.
In addition, the scenario is even more complex because of thehuge amount of Fe lines (from Fe XIV to Fe XXIV) presentat energies around 1 keV. By ignoring the line emission of allthe elements, we notice that the effective continuum contribu-tion (red solid line of Fig. A.3) to the emission shows an edge ofrecombination at the characteristic energy of Fe XXIV RRC.
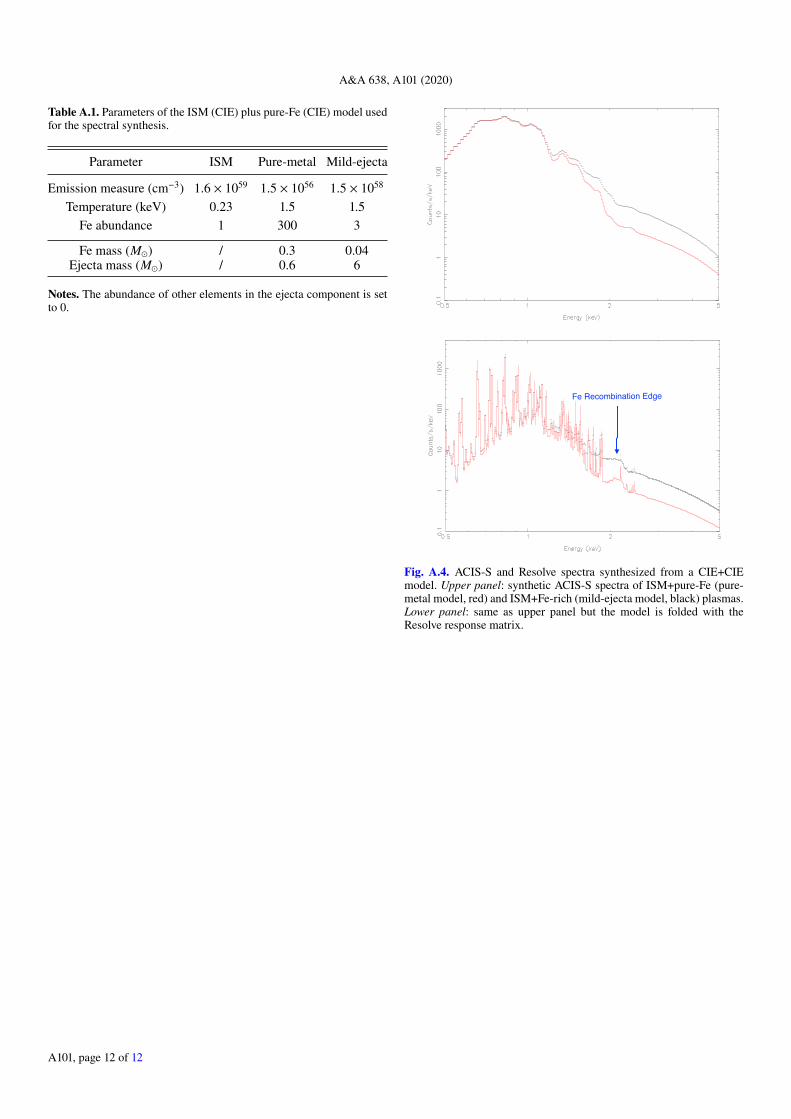
We then produced synthetic spectra by adding another CIEcomponent related to the ISM emission, considering the sameregion described in Sect. 3.1 for the Si case. We chose TISM= 0.23 keV and Tclump = 1.5 keV. Even though the high tem-perature chosen for the clump maximizes the FB emission (asdiscussed above), we here show that CCD spectrometers can-not reveal the recombination edge. The parameters used for thispure-metal model and the derived Fe and total ejecta mass aresummarized in Table A.1. The produced spectra, folded withACIS-S/Chandra and Resolve/XRISM response matrices, areshown in the upper and lower panels of Fig. A.4, respectively.
We also produced a spectrum considering the mild-ejectascenario (see again Table A.1) in which the Fe abundance is setto 3 (instead of 300) and the ejecta EM is set to 1.5 × 1058 cm−3.This spectrum is shown in both panels of Fig. A.4. The results ofthe simulations performed on Fe are analogous to the Si ones andconfirm that the instrumental broadening of the line completelyhides the possible presence of RRC related to the pure-metalejecta emission.
A101, page 11 of 12
A&A 638, A101 (2020)
Table A.1. Parameters of the ISM (CIE) plus pure-Fe (CIE) model usedfor the spectral synthesis.
Parameter ISM Pure-metal Mild-ejecta
Emission measure (cm−3) 1.6 × 1059 1.5 × 1056 1.5 × 1058
Temperature (keV) 0.23 1.5 1.5Fe abundance 1 300 3
Fe mass (M�) / 0.3 0.04Ejecta mass (M�) / 0.6 6
Notes. The abundance of other elements in the ejecta component is setto 0.
Fe Recombination Edge
Fig. A.4. ACIS-S and Resolve spectra synthesized from a CIE+CIEmodel. Upper panel: synthetic ACIS-S spectra of ISM+pure-Fe (pure-metal model, red) and ISM+Fe-rich (mild-ejecta model, black) plasmas.Lower panel: same as upper panel but the model is folded with theResolve response matrix.
A101, page 12 of 12