uob group · 3-mth sor (lhs) 3-mth sibor (lhs) sgd vs usd (rhs) sources: bloomberg . southeast...
TRANSCRIPT
1
UOB Group
Sustained Growth in Core
Income;
Strong Balance Sheet Position
February 2016
Overview of UOB Group
Macroeconomic Outlook
Strong UOB Fundamentals
Our Growth Drivers
Latest Financials
Agenda
1
2
3
4
2
5

Overview of UOB Group
3
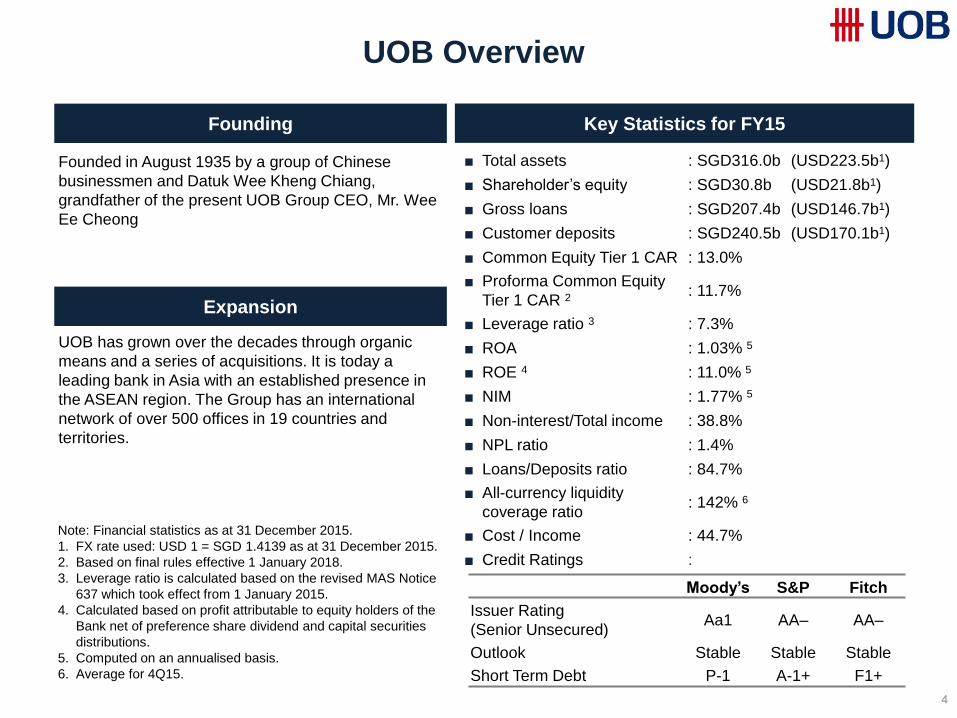
UOB Overview
4
UOB has grown over the decades through organic
means and a series of acquisitions. It is today a
leading bank in Asia with an established presence in
the ASEAN region. The Group has an international
network of over 500 offices in 19 countries and
territories.
Founding Key Statistics for FY15
Expansion
Founded in August 1935 by a group of Chinese
businessmen and Datuk Wee Kheng Chiang,
grandfather of the present UOB Group CEO, Mr. Wee
Ee Cheong
Note: Financial statistics as at 31 December 2015.
1. FX rate used: USD 1 = SGD 1.4139 as at 31 December 2015.
2. Based on final rules effective 1 January 2018.
3. Leverage ratio is calculated based on the revised MAS Notice
637 which took effect from 1 January 2015.
4. Calculated based on profit attributable to equity holders of the
Bank net of preference share dividend and capital securities
distributions.
5. Computed on an annualised basis.
6. Average for 4Q15.
Moody’s S&P Fitch
Issuer Rating
(Senior Unsecured) Aa1 AA– AA–
Outlook Stable Stable Stable
Short Term Debt P-1 A-1+ F1+
■ Total assets : SGD316.0b (USD223.5b1)
■ Shareholder’s equity : SGD30.8b (USD21.8b1)
■ Gross loans : SGD207.4b (USD146.7b1)
■ Customer deposits : SGD240.5b (USD170.1b1)
■ Common Equity Tier 1 CAR : 13.0%
■ Proforma Common Equity
Tier 1 CAR 2 : 11.7%
■ Leverage ratio 3 : 7.3%
■ ROA : 1.03% 5
■ ROE 4 : 11.0% 5
■ NIM : 1.77% 5
■ Non-interest/Total income : 38.8%
■ NPL ratio : 1.4%
■ Loans/Deposits ratio : 84.7%
■ All-currency liquidity
coverage ratio : 142% 6
■ Cost / Income : 44.7%
■ Credit Ratings :
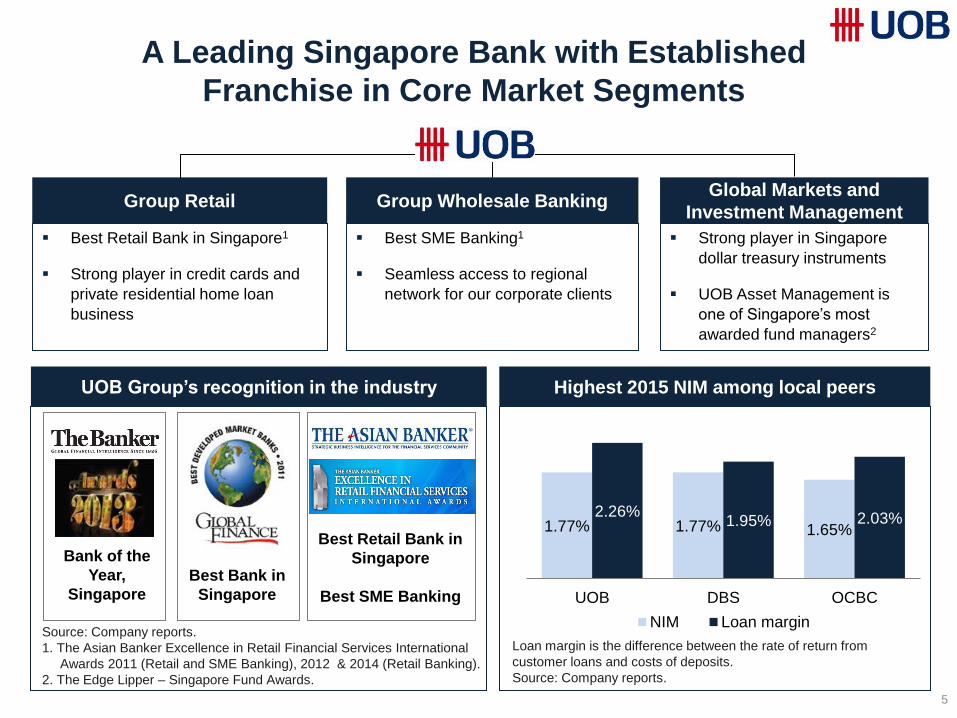
A Leading Singapore Bank with Established
Franchise in Core Market Segments
Best Retail Bank in Singapore1
Strong player in credit cards and
private residential home loan
business
Best SME Banking1
Seamless access to regional
network for our corporate clients
Strong player in Singapore
dollar treasury instruments
UOB Asset Management is
one of Singapore’s most
awarded fund managers2
Group Retail Group Wholesale Banking Global Markets and
Investment Management
Best Retail Bank in
Singapore
Best SME Banking
Bank of the
Year,
Singapore
UOB Group’s recognition in the industry Highest 2015 NIM among local peers
Source: Company reports.
1. The Asian Banker Excellence in Retail Financial Services International
Awards 2011 (Retail and SME Banking), 2012 & 2014 (Retail Banking).
2. The Edge Lipper – Singapore Fund Awards.
Best Bank in
Singapore 33% 58%
40% 41% 1.77% 1.77% 1.65% 2.26%
1.95% 2.03%
UOB DBS OCBC
NIM Loan margin
Loan margin is the difference between the rate of return from
customer loans and costs of deposits.
Source: Company reports.
5
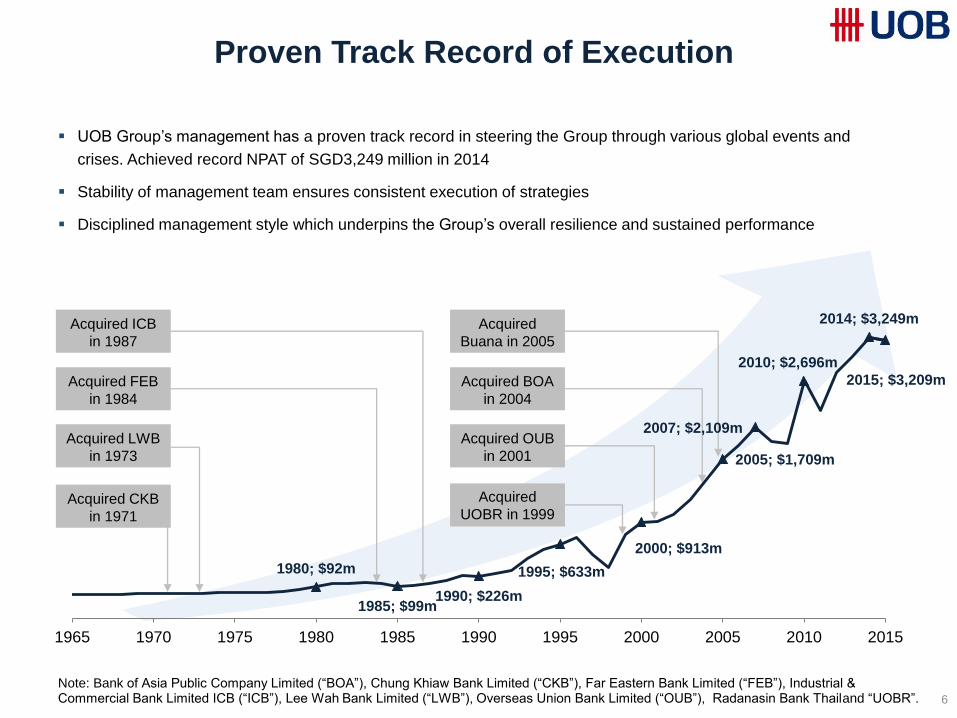
Proven Track Record of Execution
UOB Group’s management has a proven track record in steering the Group through various global events and
crises. Achieved record NPAT of SGD3,249 million in 2014
Stability of management team ensures consistent execution of strategies
Disciplined management style which underpins the Group’s overall resilience and sustained performance
Acquired
UOBR in 1999
Acquired BOA
in 2004
Acquired OUB
in 2001
Acquired CKB
in 1971
Acquired LWB
in 1973
Acquired FEB
in 1984
Acquired ICB
in 1987
Acquired
Buana in 2005
Note: Bank of Asia Public Company Limited (“BOA”), Chung Khiaw Bank Limited (“CKB”), Far Eastern Bank Limited (“FEB”), Industrial & Commercial Bank Limited ICB (“ICB”), Lee Wah Bank Limited (“LWB”), Overseas Union Bank Limited (“OUB”), Radanasin Bank Thailand “UOBR”. 6
1980; $92m
1985; $99m 1990; $226m
1995; $633m
2000; $913m
2005; $1,709m
2007; $2,109m
2010; $2,696m
2014; $3,249m
2015; $3,209m
1965 1970 1975 1980 1985 1990 1995 2000 2005 2010 2015
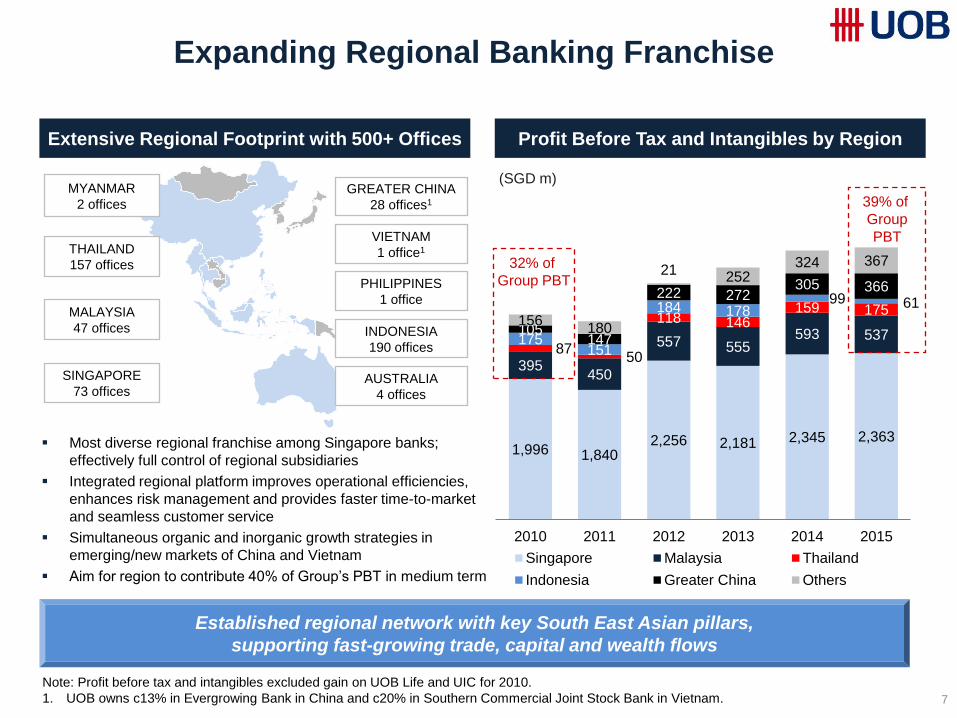
Expanding Regional Banking Franchise
7
SINGAPORE
73 offices
THAILAND
157 offices
MALAYSIA
47 offices INDONESIA
190 offices
VIETNAM
1 office1
GREATER CHINA
28 offices1
Established regional network with key South East Asian pillars,
supporting fast-growing trade, capital and wealth flows
Profit Before Tax and Intangibles by Region Extensive Regional Footprint with 500+ Offices
Most diverse regional franchise among Singapore banks;
effectively full control of regional subsidiaries
Integrated regional platform improves operational efficiencies,
enhances risk management and provides faster time-to-market
and seamless customer service
Simultaneous organic and inorganic growth strategies in
emerging/new markets of China and Vietnam
Aim for region to contribute 40% of Group’s PBT in medium term
(SGD m) MYANMAR
2 offices
1,996 1,840 2,256 2,181 2,345 2,363
395 450
557 555 593 537
87 50
118 146 159 175
175 151
184 178 99 61
105 147
222 272 305 366
156 180
21 252
324 367
2010 2011 2012 2013 2014 2015
Singapore Malaysia Thailand
Indonesia Greater China Others
32% of
Group PBT
39% of
Group
PBT
Note: Profit before tax and intangibles excluded gain on UOB Life and UIC for 2010.
1. UOB owns c13% in Evergrowing Bank in China and c20% in Southern Commercial Joint Stock Bank in Vietnam.
AUSTRALIA
4 offices
PHILIPPINES
1 office
Macroeconomic Outlook
8
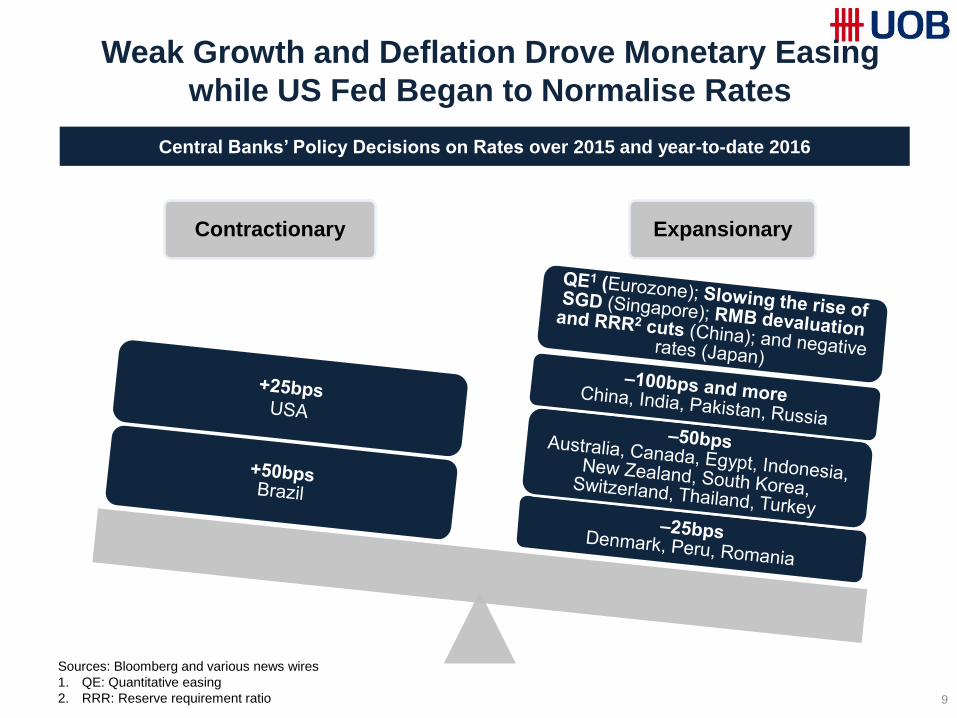
Weak Growth and Deflation Drove Monetary Easing
while US Fed Began to Normalise Rates
9
Central Banks’ Policy Decisions on Rates over 2015 and year-to-date 2016
Contractionary Expansionary
Sources: Bloomberg and various news wires
1. QE: Quantitative easing
2. RRR: Reserve requirement ratio
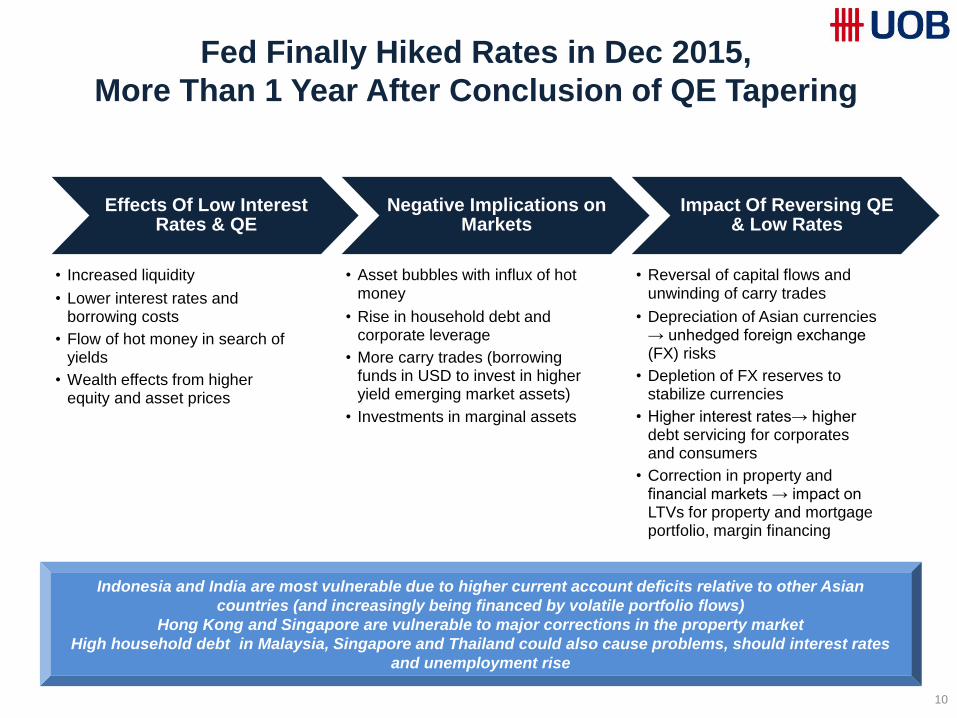
Fed Finally Hiked Rates in Dec 2015,
More Than 1 Year After Conclusion of QE Tapering
10
Indonesia and India are most vulnerable due to higher current account deficits relative to other Asian
countries (and increasingly being financed by volatile portfolio flows)
Hong Kong and Singapore are vulnerable to major corrections in the property market
High household debt in Malaysia, Singapore and Thailand could also cause problems, should interest rates
and unemployment rise
Effects Of Low Interest Rates & QE
• Increased liquidity
• Lower interest rates and borrowing costs
• Flow of hot money in search of yields
• Wealth effects from higher equity and asset prices
Negative Implications on Markets
• Asset bubbles with influx of hot money
• Rise in household debt and corporate leverage
• More carry trades (borrowing funds in USD to invest in higher yield emerging market assets)
• Investments in marginal assets
Impact Of Reversing QE & Low Rates
• Reversal of capital flows and unwinding of carry trades
• Depreciation of Asian currencies → unhedged foreign exchange (FX) risks
• Depletion of FX reserves to stabilize currencies
• Higher interest rates→ higher debt servicing for corporates and consumers
• Correction in property and financial markets → impact on LTVs for property and mortgage portfolio, margin financing
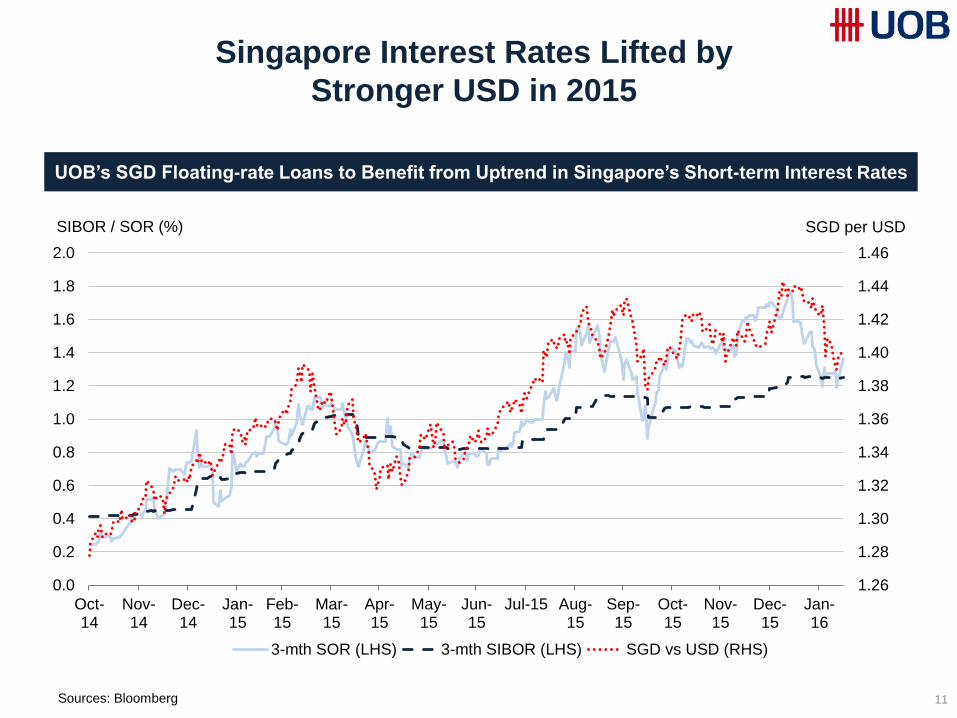
Singapore Interest Rates Lifted by
Stronger USD in 2015
11
UOB’s SGD Floating-rate Loans to Benefit from Uptrend in Singapore’s Short-term Interest Rates
1.26
1.28
1.30
1.32
1.34
1.36
1.38
1.40
1.42
1.44
1.46
0.0
0.2
0.4
0.6
0.8
1.0
1.2
1.4
1.6
1.8
2.0
Oct-14
Nov-14
Dec-14
Jan-15
Feb-15
Mar-15
Apr-15
May-15
Jun-15
Jul-15 Aug-15
Sep-15
Oct-15
Nov-15
Dec-15
Jan-16
SGD per USD SIBOR / SOR (%)
3-mth SOR (LHS) 3-mth SIBOR (LHS) SGD vs USD (RHS)
Sources: Bloomberg
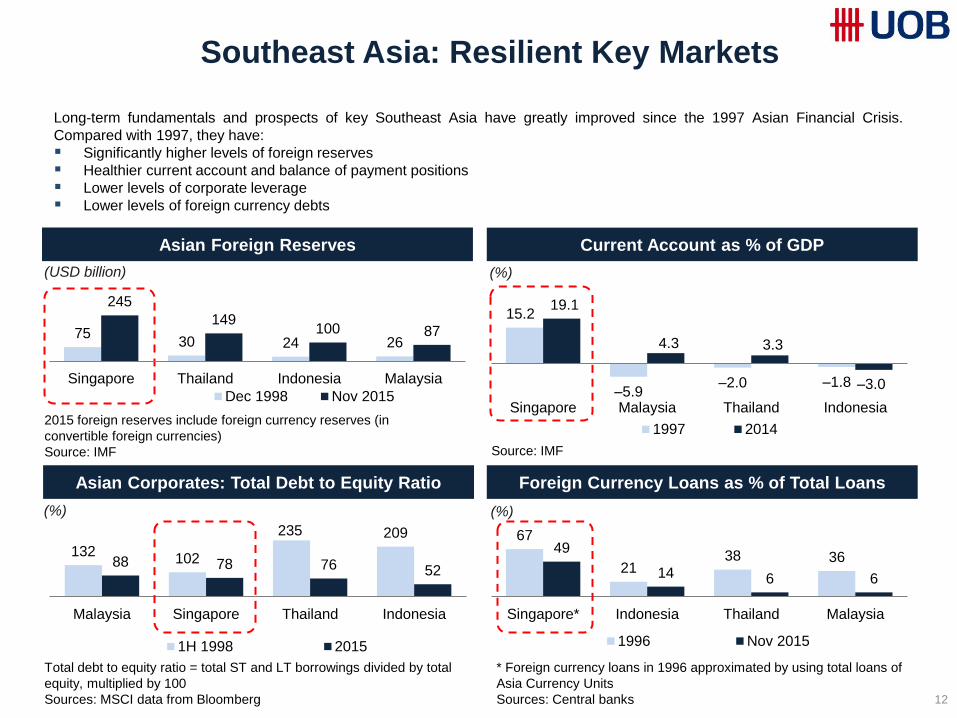
Southeast Asia: Resilient Key Markets
67
21 38 36
49
14 6 6
Singapore* Indonesia Thailand Malaysia
1996 Nov 2015
132 102
235 209
88 78 76 52
Malaysia Singapore Thailand Indonesia
1H 1998 2015
15.2
–5.9 –2.0 –1.8
19.1
4.3 3.3
–3.0
Singapore Malaysia Thailand Indonesia
1997 2014
Asian Corporates: Total Debt to Equity Ratio
Asian Foreign Reserves
Long-term fundamentals and prospects of key Southeast Asia have greatly improved since the 1997 Asian Financial Crisis.
Compared with 1997, they have:
Significantly higher levels of foreign reserves
Healthier current account and balance of payment positions
Lower levels of corporate leverage
Lower levels of foreign currency debts
2015 foreign reserves include foreign currency reserves (in
convertible foreign currencies)
Source: IMF
(USD billion)
Total debt to equity ratio = total ST and LT borrowings divided by total
equity, multiplied by 100
Sources: MSCI data from Bloomberg
(%)
Current Account as % of GDP
Foreign Currency Loans as % of Total Loans
(%)
Source: IMF
(%)
* Foreign currency loans in 1996 approximated by using total loans of
Asia Currency Units
Sources: Central banks
75
30 24 26
245
149 100 87
Singapore Thailand Indonesia Malaysia
Dec 1998 Nov 2015
12
-2
0
2
4
6
8
2001 2003 2005 2007 2009 2011 2013 2015
(%) Headline Inflation Core Inflation
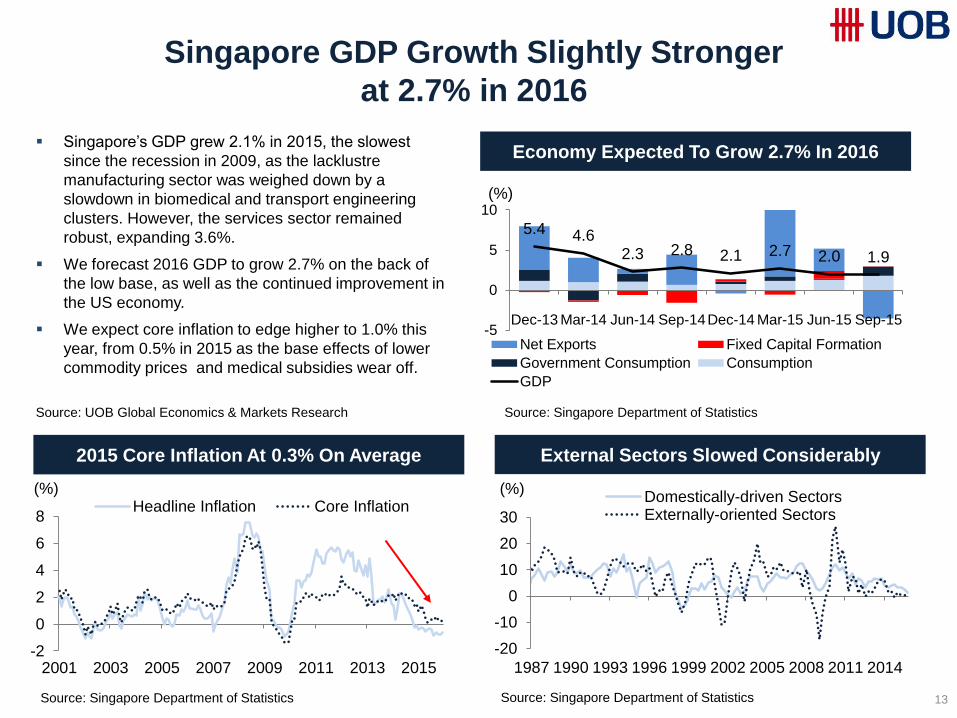
Singapore GDP Growth Slightly Stronger
at 2.7% in 2016
13
Economy Expected To Grow 2.7% In 2016
External Sectors Slowed Considerably
Singapore’s GDP grew 2.1% in 2015, the slowest
since the recession in 2009, as the lacklustre
manufacturing sector was weighed down by a
slowdown in biomedical and transport engineering
clusters. However, the services sector remained
robust, expanding 3.6%.
We forecast 2016 GDP to grow 2.7% on the back of
the low base, as well as the continued improvement in
the US economy.
We expect core inflation to edge higher to 1.0% this
year, from 0.5% in 2015 as the base effects of lower
commodity prices and medical subsidies wear off.
Source: Singapore Department of Statistics
2015 Core Inflation At 0.3% On Average
Source: UOB Global Economics & Markets Research Source: Singapore Department of Statistics
Source: Singapore Department of Statistics
-20
-10
0
10
20
30
1987 1990 1993 1996 1999 2002 2005 2008 2011 2014
(%) Domestically-driven SectorsExternally-oriented Sectors
5.4 4.6 2.3 2.8 2.1 2.7 2.0 1.9
-5
0
5
10
Dec-13 Mar-14 Jun-14 Sep-14Dec-14 Mar-15 Jun-15 Sep-15
(%)
Net Exports Fixed Capital Formation
Government Consumption Consumption
GDP
ASEAN Banking Sector: Strong
Fundamentals Remain Intact
Key Banking Trends
Stable Funding; Adequate Loan/Deposit Ratios Robust Capital Positions
Higher NIM in Lightly Penetrated Markets
(Net interest margin and private-sector credit / GDP, in %)
(Tier 1 CAR, in %) (Loan-to-deposit ratio, in %)
Source: Research estimates, World Bank
Source: Research estimates Source: Research estimates
Source: Research estimates, Monetary Authority of Singapore
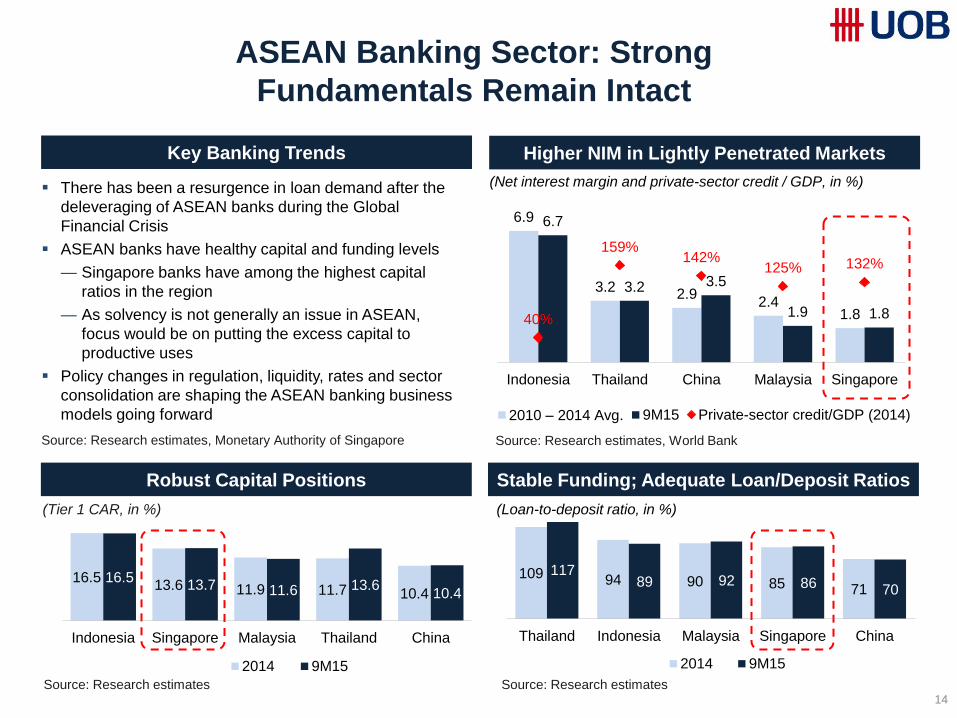
There has been a resurgence in loan demand after the
deleveraging of ASEAN banks during the Global
Financial Crisis
ASEAN banks have healthy capital and funding levels
— Singapore banks have among the highest capital
ratios in the region
— As solvency is not generally an issue in ASEAN,
focus would be on putting the excess capital to
productive uses
Policy changes in regulation, liquidity, rates and sector
consolidation are shaping the ASEAN banking business
models going forward
14
6.9
3.2 2.9
2.4 1.8
6.7
3.2 3.5
1.9 1.8 40%
159% 142%
125% 132%
Indonesia Thailand China Malaysia Singapore
2010 – 2014 Avg. 9M15 Private-sector credit/GDP (2014)
16.5 13.6 11.9 11.7 10.4
16.5 13.7 11.6 13.6
10.4
Indonesia Singapore Malaysia Thailand China
2014 9M15
109 94 90 85 71
117 89 92 86 70
Thailand Indonesia Malaysia Singapore China
2014 9M15
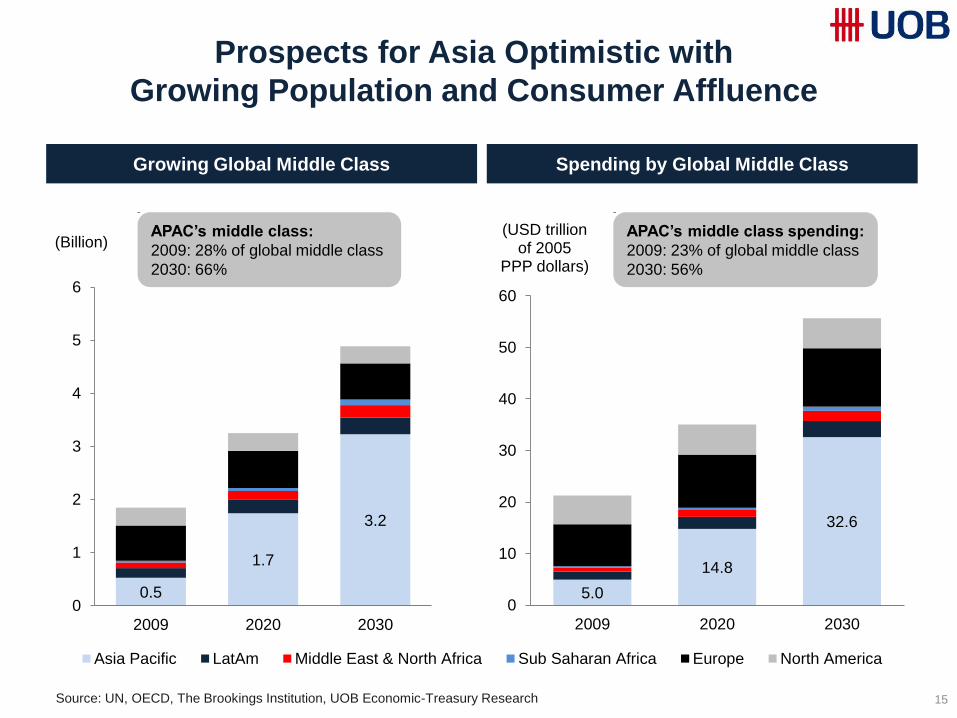
Prospects for Asia Optimistic with
Growing Population and Consumer Affluence
Growing Global Middle Class Spending by Global Middle Class
APAC’s middle class:
2009: 28% of global middle class
2030: 66%
Source: UN, OECD, The Brookings Institution, UOB Economic-Treasury Research
0.5
1.7
3.2
0
1
2
3
4
5
6
2009 2020 2030
(Billion)
Asia Pacific LatAm Middle East & North Africa Sub Saharan Africa Europe North America
5.0
14.8
32.6
0
10
20
30
40
50
60
2009 2020 2030
(USD trillion of 2005
PPP dollars)
APAC’s middle class spending:
2009: 23% of global middle class
2030: 56%
15
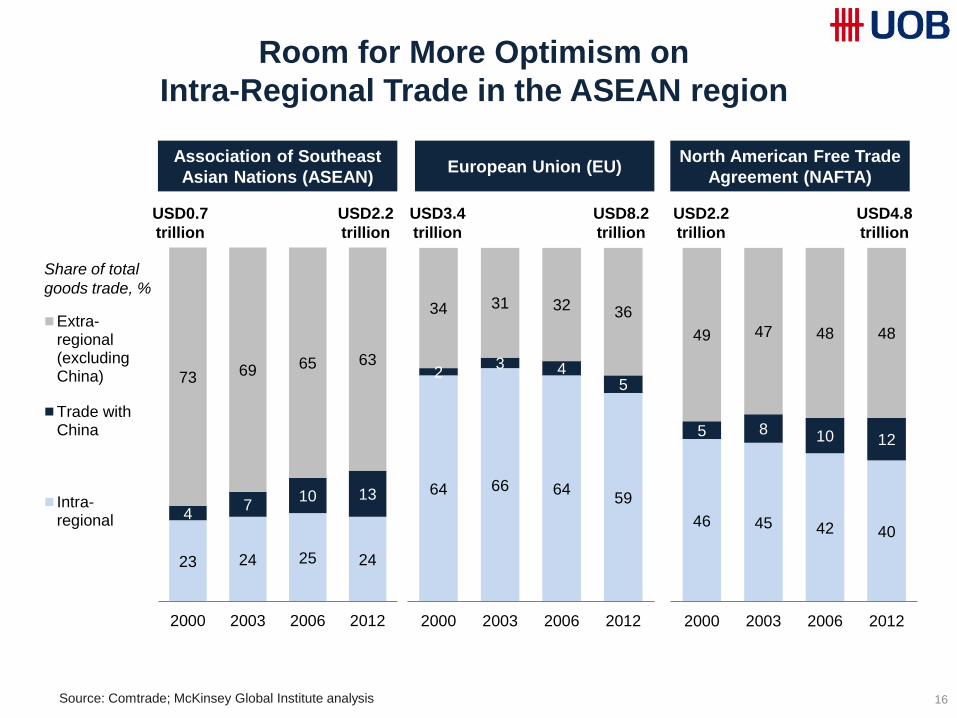
Room for More Optimism on
Intra-Regional Trade in the ASEAN region
16
23 24 25 24
4 7
10 13
73 69 65 63
2000 2003 2006 2012
Extra-regional(excludingChina)
Trade withChina
Intra-regional
64 66 64 59
2 3 4
5
34 31 32 36
2000 2003 2006 2012
46 45 42 40
5 8 10 12
49 47 48 48
2000 2003 2006 2012
Association of Southeast
Asian Nations (ASEAN)
Share of total
goods trade, %
European Union (EU) North American Free Trade
Agreement (NAFTA)
USD0.7
trillion
USD2.2
trillion
USD3.4
trillion
USD8.2
trillion
USD2.2
trillion
USD4.8
trillion
Source: Comtrade; McKinsey Global Institute analysis
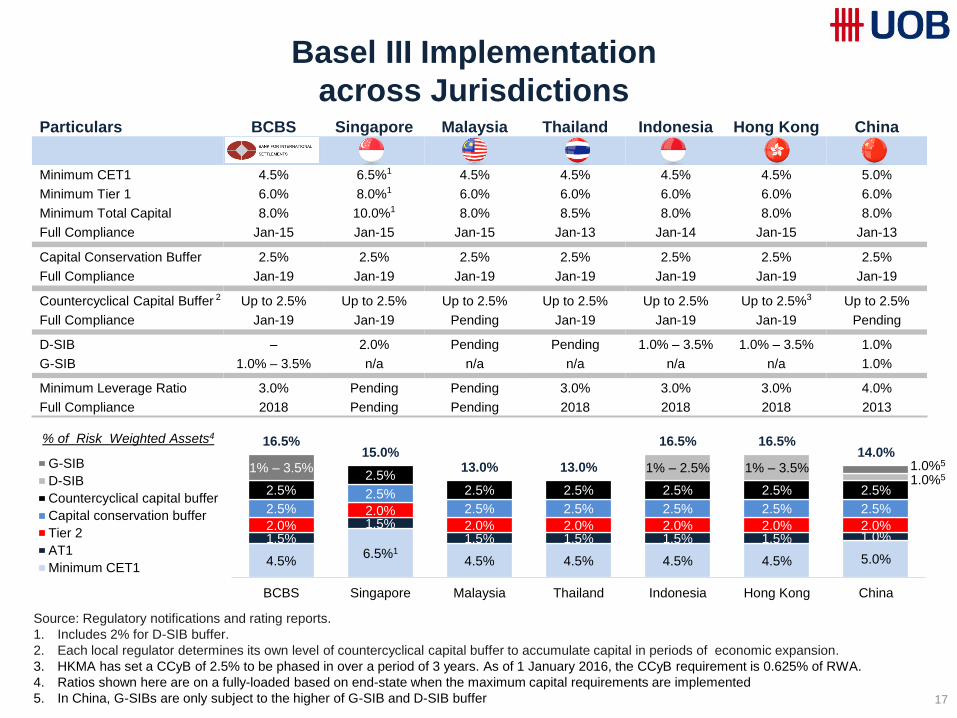
Basel III Implementation
across Jurisdictions
17
Particulars BCBS Singapore Malaysia Thailand Indonesia Hong Kong China
Minimum CET1 4.5% 6.5%1 4.5% 4.5% 4.5% 4.5% 5.0%
Minimum Tier 1 6.0% 8.0%1 6.0% 6.0% 6.0% 6.0% 6.0%
Minimum Total Capital 8.0% 10.0%1 8.0% 8.5% 8.0% 8.0% 8.0%
Full Compliance Jan-15 Jan-15 Jan-15 Jan-13 Jan-14 Jan-15 Jan-13
Capital Conservation Buffer 2.5% 2.5% 2.5% 2.5% 2.5% 2.5% 2.5%
Full Compliance Jan-19 Jan-19 Jan-19 Jan-19 Jan-19 Jan-19 Jan-19
Countercyclical Capital Buffer 2 Up to 2.5% Up to 2.5% Up to 2.5% Up to 2.5% Up to 2.5% Up to 2.5%3 Up to 2.5%
Full Compliance Jan-19 Jan-19 Pending Jan-19 Jan-19 Jan-19 Pending
D-SIB – 2.0% Pending Pending 1.0% – 3.5% 1.0% – 3.5% 1.0%
G-SIB 1.0% – 3.5% n/a n/a n/a n/a n/a 1.0%
Minimum Leverage Ratio 3.0% Pending Pending 3.0% 3.0% 3.0% 4.0%
Full Compliance 2018 Pending Pending 2018 2018 2018 2013
4.5% 6.5%1
4.5% 4.5% 4.5% 4.5% 5.0%
1.5% 1.5%
1.5% 1.5% 1.5% 1.5% 1.0% 2.0%
2.0% 2.0% 2.0% 2.0% 2.0% 2.0%
2.5% 2.5%
2.5% 2.5% 2.5% 2.5% 2.5%
2.5% 2.5%
2.5% 2.5% 2.5% 2.5% 2.5%
1% – 2.5% 1% – 3.5% 1.0%5
1% – 3.5% 1.0%5
16.5% 15.0%
13.0% 13.0%
16.5% 16.5% 14.0%
BCBS Singapore Malaysia Thailand Indonesia Hong Kong China
% of Risk Weighted Assets4
G-SIB
D-SIB
Countercyclical capital buffer
Capital conservation buffer
Tier 2
AT1
Minimum CET1
Source: Regulatory notifications and rating reports.
1. Includes 2% for D-SIB buffer.
2. Each local regulator determines its own level of countercyclical capital buffer to accumulate capital in periods of economic expansion.
3. HKMA has set a CCyB of 2.5% to be phased in over a period of 3 years. As of 1 January 2016, the CCyB requirement is 0.625% of RWA.
4. Ratios shown here are on a fully-loaded based on end-state when the maximum capital requirements are implemented
5. In China, G-SIBs are only subject to the higher of G-SIB and D-SIB buffer

Resolution Regime Overview
18
Country Public
discussion
Existing resolution
powers
Factors influencing
views on bail-in 1
How past resolution
been handled
Singapore Yes
Statutory bail-in proposed
to apply to only
subordinated debt
Role as an global financial hub;
strength of system; good coordination
between regulator and local banks
Crisis prevention tools;
no record of bank failures
in the past
Indonesia No Transfer powers;
no statutory bail-in History of public sector bailouts Liquidation; public funds
Hong Kong Yes, ended Transfer powers;
statutory bail-in proposed
Role as an international financial
centre and presence of G-SIBs
Liquidation; public funds;
M&A
China No Transfer powers;
no statutory bail-in
Risk of contagion in debt market; role of
government in banking sector
Capital injections; NPL
disposals; forbearance
1. Bold text indicates factors in favor of implementing a bail-in regime; italic text indicates factors against
Resolution Regime: Priorities for 2015 2
As per Financial Stability Board (FSB), any systemically significant financial institution that fails should be subject to a resolution
regime as set out in The Key Attributes of Effective Resolution Regimes for Financial Institutions. In Nov 2015, the FSB released
two finalised guidance papers on the Principles for Cross-border Effectiveness of Resolution Actions, and Guidance on Cooperation
and Information Sharing with Host Authorities of Jurisdictions.
• Jurisdictions should have in place a transparent and efficient process for resolution measures by a foreign resolution authority to
have cross-border effect, provided that domestic creditors are treated equitably.
• Authorities must have the confidence that resolution powers are legally enforceable, especially where instruments are governed
by a foreign law.
• Jurisdictions should continue to develop statutory frameworks but in the interim use contractual approaches to aid the
enforceability of resolution actions. Even after implementation of statutory frameworks, contractual approach can continue to
complement such regimes.
2. Source: Financial Stability Board’s The Key Attributes of Effective Resolution Regimes for Financial Institutions
Note: Malaysia and Thailand have yet to implement a framework for resolution regime.
Resolution Regime in Asia
Strong UOB
Fundamentals
19
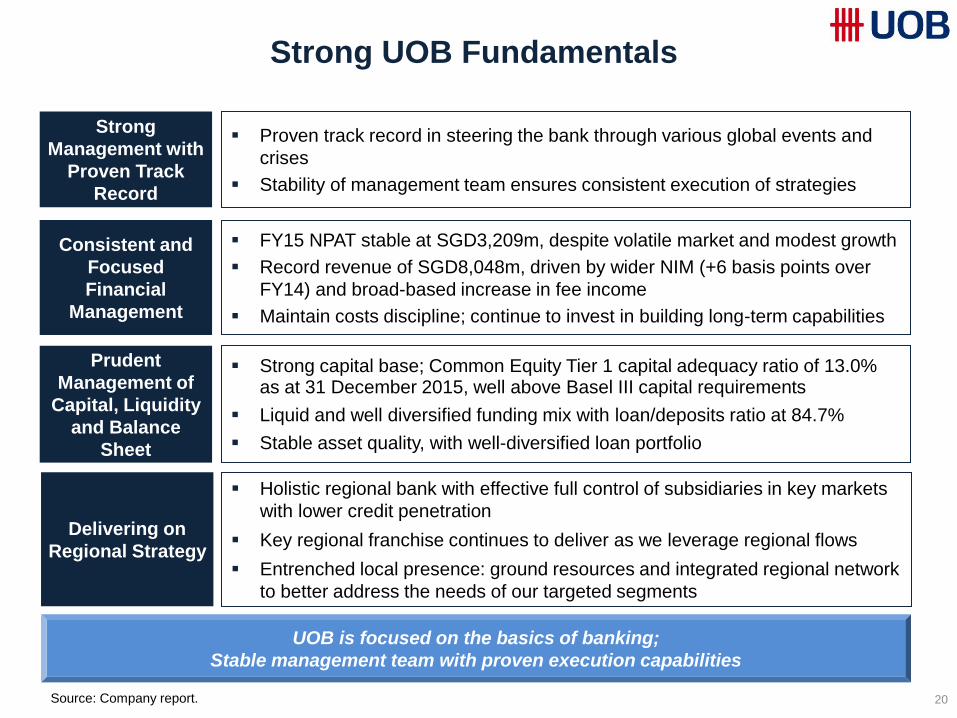
Strong UOB Fundamentals
20
UOB is focused on the basics of banking;
Stable management team with proven execution capabilities
Consistent and
Focused
Financial
Management
FY15 NPAT stable at SGD3,209m, despite volatile market and modest growth
Record revenue of SGD8,048m, driven by wider NIM (+6 basis points over
FY14) and broad-based increase in fee income
Maintain costs discipline; continue to invest in building long-term capabilities
Strong
Management with
Proven Track
Record
Proven track record in steering the bank through various global events and
crises
Stability of management team ensures consistent execution of strategies
Prudent
Management of
Capital, Liquidity
and Balance
Sheet
Strong capital base; Common Equity Tier 1 capital adequacy ratio of 13.0% as at 31 December 2015, well above Basel III capital requirements
Liquid and well diversified funding mix with loan/deposits ratio at 84.7%
Stable asset quality, with well-diversified loan portfolio
Delivering on
Regional Strategy
Holistic regional bank with effective full control of subsidiaries in key markets
with lower credit penetration
Key regional franchise continues to deliver as we leverage regional flows
Entrenched local presence: ground resources and integrated regional network
to better address the needs of our targeted segments
Source: Company report.
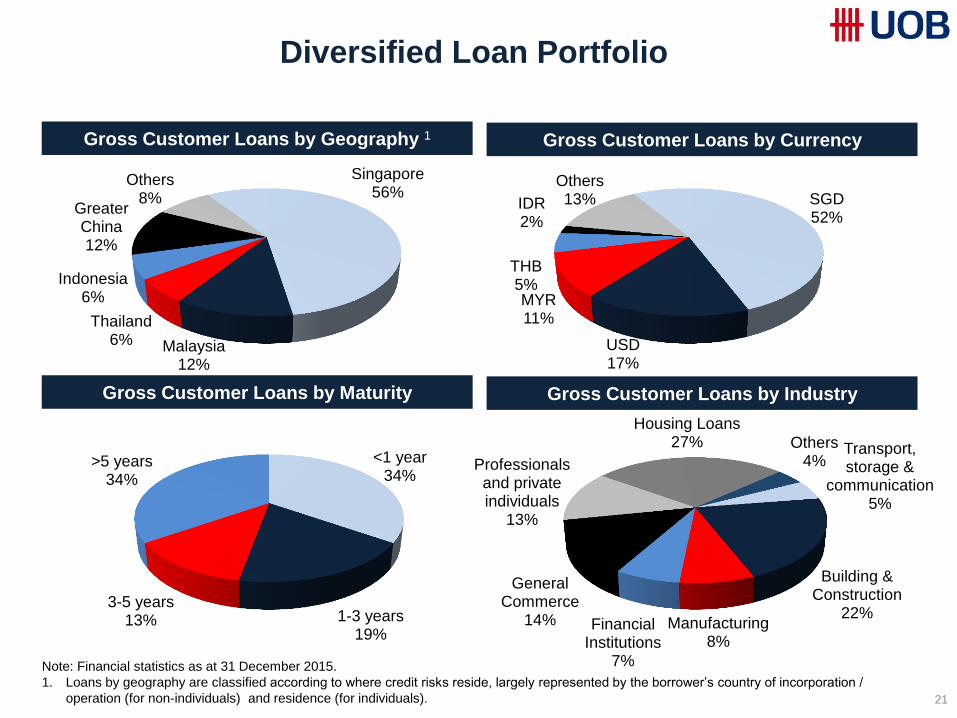
Diversified Loan Portfolio
21
Gross Customer Loans by Maturity
Gross Customer Loans by Industry
Gross Customer Loans by Currency Gross Customer Loans by Geography 1
Singapore 56%
Malaysia 12%
Thailand 6%
Indonesia 6%
Greater China 12%
Others 8% SGD
52%
USD 17%
MYR 11%
THB 5%
IDR 2%
Others 13%
<1 year 34%
1-3 years 19%
3-5 years 13%
>5 years 34%
Transport, storage &
communication 5%
Building & Construction
22% Manufacturing
8% Financial
Institutions 7%
General Commerce
14%
Professionals and private individuals
13%
Housing Loans 27% Others
4%
Note: Financial statistics as at 31 December 2015.
1. Loans by geography are classified according to where credit risks reside, largely represented by the borrower’s country of incorporation /
operation (for non-individuals) and residence (for individuals).
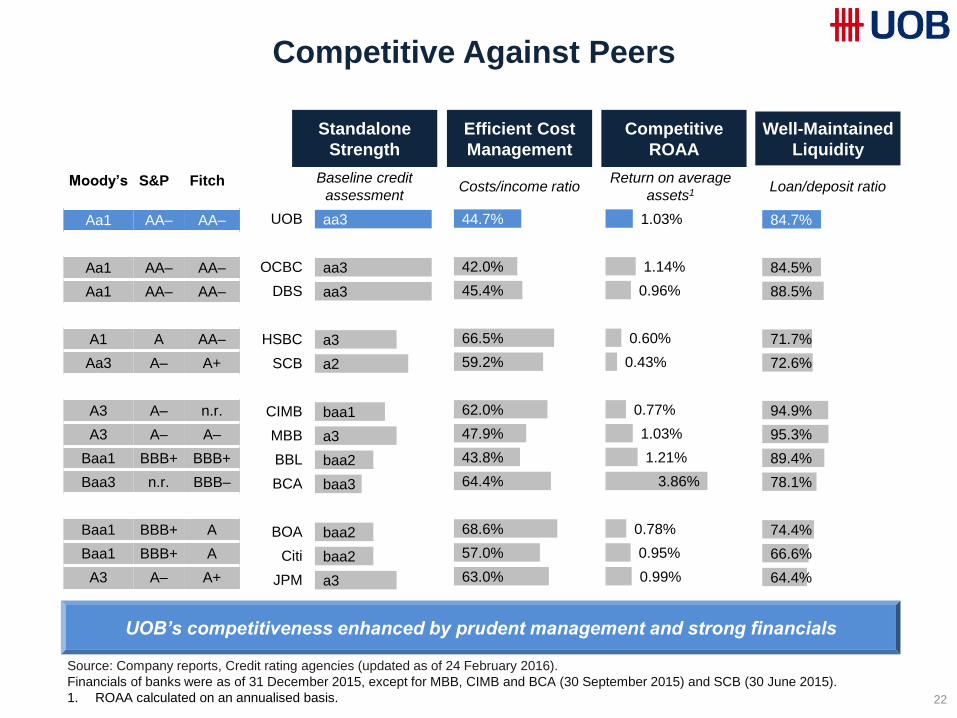
Competitive Against Peers
22
Source: Company reports, Credit rating agencies (updated as of 24 February 2016).
Financials of banks were as of 31 December 2015, except for MBB, CIMB and BCA (30 September 2015) and SCB (30 June 2015).
1. ROAA calculated on an annualised basis.
UOB’s competitiveness enhanced by prudent management and strong financials
Moody’s S&P Fitch
Aa1 AA– AA–
Aa1 AA– AA–
Aa1 AA– AA–
A1 A AA–
Aa3 A– A+
A3 A– n.r.
A3 A– A–
Baa1 BBB+ BBB+
Baa3 n.r. BBB–
Baa1 BBB+ A
Baa1 BBB+ A
A3 A– A+
Standalone
Strength
Efficient Cost
Management
Competitive
ROAA
Well-Maintained
Liquidity
Baseline credit
assessment Costs/income ratio Return on average
assets1 Loan/deposit ratio
aa3
aa3
aa3
a3
a2
baa1
a3
baa2
baa3
baa2
baa2
a3
UOB
OCBC
DBS
HSBC
SCB
CIMB
MBB
BBL
BCA
BOA
Citi
JPM
44.7%
42.0%
45.4%
66.5%
59.2%
62.0%
47.9%
43.8%
64.4%
68.6%
57.0%
63.0%
1.03%
1.14%
0.96%
0.60%
0.43%
0.77%
1.03%
1.21%
3.86%
0.78%
0.95%
0.99%
84.7%
84.5%
88.5%
71.7%
72.6%
94.9%
95.3%
89.4%
78.1%
74.4%
66.6%
64.4%
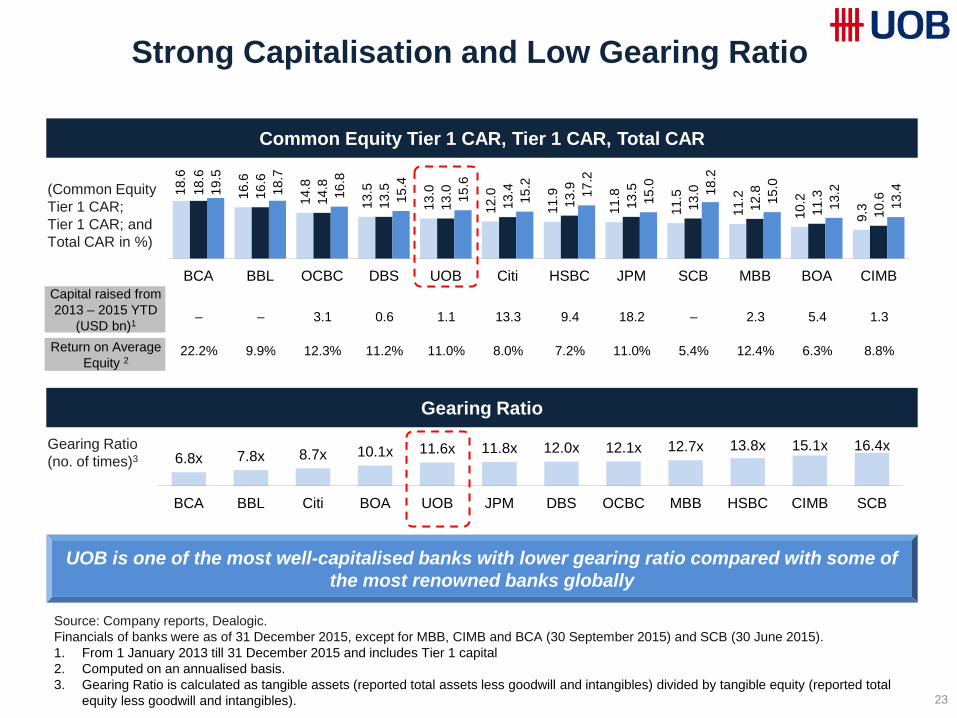
Strong Capitalisation and Low Gearing Ratio
23
6.8x 7.8x 8.7x 10.1x 11.6x 11.8x 12.0x 12.1x 12.7x 13.8x 15.1x 16.4x
BCA BBL Citi BOA UOB JPM DBS OCBC MBB HSBC CIMB SCB
18
.6
16.6
14.8
13.5
13.0
12.0
11
.9
11.8
11.5
11.2
10.2
9.3
18
.6
16.6
14.8
13.5
13.0
13.4
13.9
13.5
13.0
12.8
11.3
10.6
19
.5
18
.7
16.8
15.4
15.6
15.2
17.2
15.0
18
.2
15.0
13.2
13.4
BCA BBL OCBC DBS UOB Citi HSBC JPM SCB MBB BOA CIMB
Gearing Ratio
Common Equity Tier 1 CAR, Tier 1 CAR, Total CAR
UOB is one of the most well-capitalised banks with lower gearing ratio compared with some of
the most renowned banks globally
(Common Equity
Tier 1 CAR;
Tier 1 CAR; and
Total CAR in %)
Gearing Ratio
(no. of times)3
Capital raised from
2013 – 2015 YTD
(USD bn)1
Return on Average
Equity 2
Source: Company reports, Dealogic.
Financials of banks were as of 31 December 2015, except for MBB, CIMB and BCA (30 September 2015) and SCB (30 June 2015).
1. From 1 January 2013 till 31 December 2015 and includes Tier 1 capital
2. Computed on an annualised basis.
3. Gearing Ratio is calculated as tangible assets (reported total assets less goodwill and intangibles) divided by tangible equity (reported total
equity less goodwill and intangibles).
22.2% 9.9% 12.3% 11.2% 11.0% 8.0% 7.2% 11.0% 5.4% 12.4% 6.3% 8.8%
– – 3.1 0.6 1.1 13.3 9.4 18.2 – 2.3 5.4 1.3
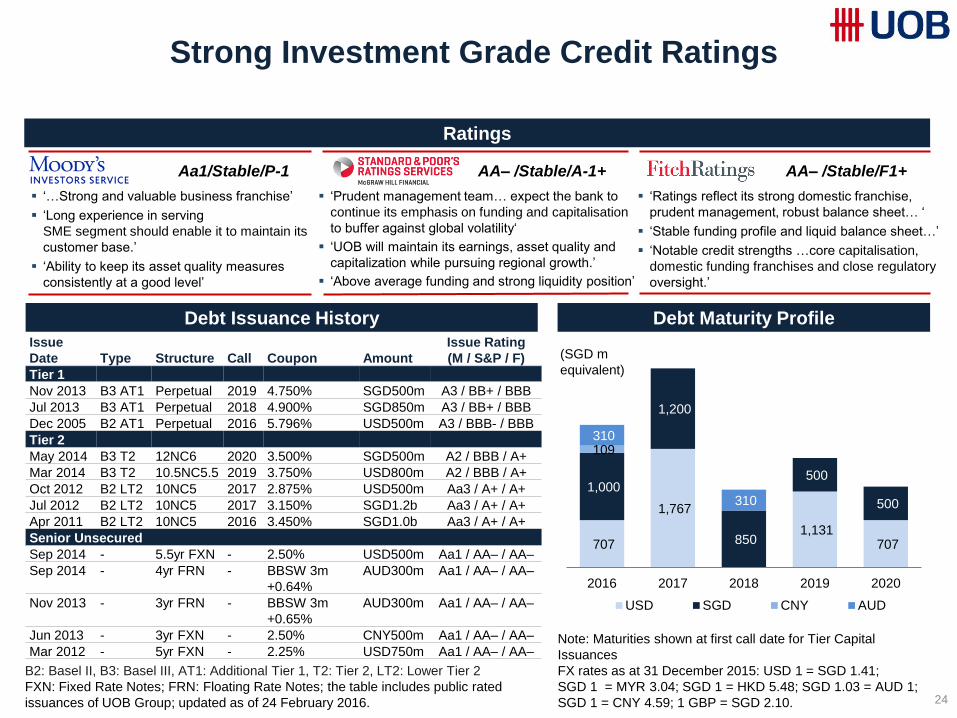
Strong Investment Grade Credit Ratings
24
Aa1/Stable/P-1 AA– /Stable/A-1+ AA– /Stable/F1+
‘…Strong and valuable business franchise’
‘Long experience in serving
SME segment should enable it to maintain its
customer base.’
‘Ability to keep its asset quality measures
consistently at a good level’
‘Prudent management team… expect the bank to
continue its emphasis on funding and capitalisation
to buffer against global volatility‘
‘UOB will maintain its earnings, asset quality and
capitalization while pursuing regional growth.’
‘Above average funding and strong liquidity position’
‘Ratings reflect its strong domestic franchise,
prudent management, robust balance sheet… ‘
‘Stable funding profile and liquid balance sheet…’
‘Notable credit strengths …core capitalisation,
domestic funding franchises and close regulatory
oversight.’
Ratings
B2: Basel II, B3: Basel III, AT1: Additional Tier 1, T2: Tier 2, LT2: Lower Tier 2
FXN: Fixed Rate Notes; FRN: Floating Rate Notes; the table includes public rated
issuances of UOB Group; updated as of 24 February 2016.
Debt Issuance History Debt Maturity Profile
Note: Maturities shown at first call date for Tier Capital
Issuances
FX rates as at 31 December 2015: USD 1 = SGD 1.41;
SGD 1 = MYR 3.04; SGD 1 = HKD 5.48; SGD 1.03 = AUD 1;
SGD 1 = CNY 4.59; 1 GBP = SGD 2.10.
(SGD m
equivalent)
Issue
Date Type Structure Call Coupon Amount
Issue Rating
(M / S&P / F)
Tier 1
Nov 2013 B3 AT1 Perpetual 2019 4.750% SGD500m A3 / BB+ / BBB
Jul 2013 B3 AT1 Perpetual 2018 4.900% SGD850m A3 / BB+ / BBB
Dec 2005 B2 AT1 Perpetual 2016 5.796% USD500m A3 / BBB- / BBB
Tier 2
May 2014 B3 T2 12NC6 2020 3.500% SGD500m A2 / BBB / A+
Mar 2014 B3 T2 10.5NC5.5 2019 3.750% USD800m A2 / BBB / A+
Oct 2012 B2 LT2 10NC5 2017 2.875% USD500m Aa3 / A+ / A+
Jul 2012 B2 LT2 10NC5 2017 3.150% SGD1.2b Aa3 / A+ / A+
Apr 2011 B2 LT2 10NC5 2016 3.450% SGD1.0b Aa3 / A+ / A+
Senior Unsecured
Sep 2014 - 5.5yr FXN - 2.50% USD500m Aa1 / AA– / AA–
Sep 2014 - 4yr FRN - BBSW 3m
+0.64%
AUD300m Aa1 / AA– / AA–
Nov 2013 - 3yr FRN - BBSW 3m
+0.65%
AUD300m Aa1 / AA– / AA–
Jun 2013 - 3yr FXN - 2.50% CNY500m Aa1 / AA– / AA–
Mar 2012 - 5yr FXN - 2.25% USD750m Aa1 / AA– / AA–
707
1,767
1,131 707
1,000
1,200
850
500
500
109 310
310
2016 2017 2018 2019 2020
USD SGD CNY AUD
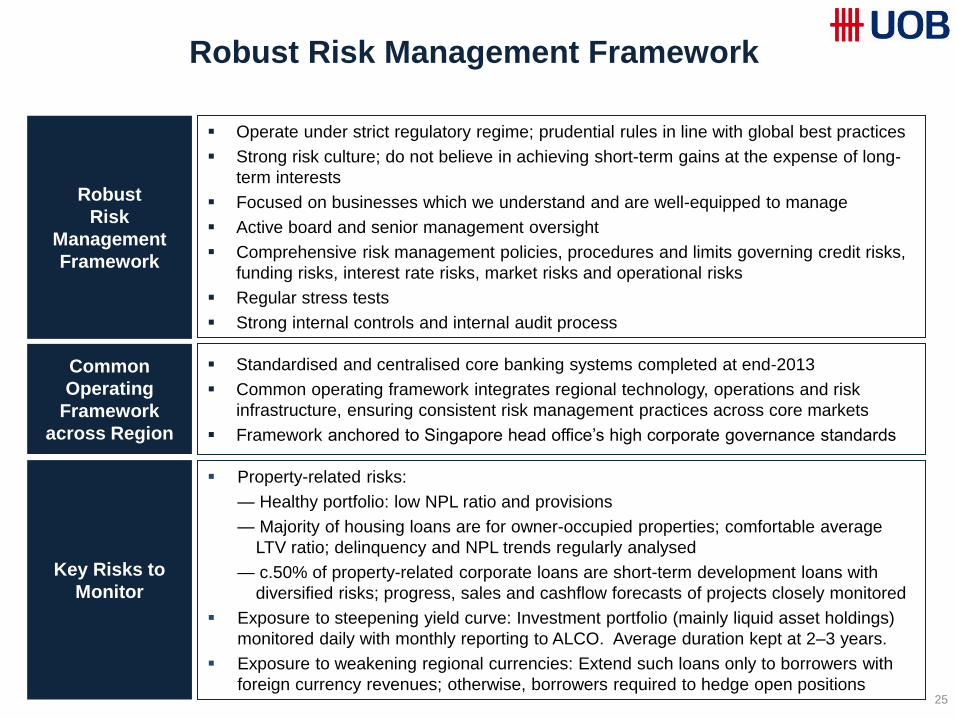
Robust Risk Management Framework
25
Key Risks to
Monitor
Property-related risks:
— Healthy portfolio: low NPL ratio and provisions
— Majority of housing loans are for owner-occupied properties; comfortable average
LTV ratio; delinquency and NPL trends regularly analysed
— c.50% of property-related corporate loans are short-term development loans with
diversified risks; progress, sales and cashflow forecasts of projects closely monitored
Exposure to steepening yield curve: Investment portfolio (mainly liquid asset holdings)
monitored daily with monthly reporting to ALCO. Average duration kept at 2–3 years.
Exposure to weakening regional currencies: Extend such loans only to borrowers with
foreign currency revenues; otherwise, borrowers required to hedge open positions
Robust
Risk
Management
Framework
Operate under strict regulatory regime; prudential rules in line with global best practices
Strong risk culture; do not believe in achieving short-term gains at the expense of long-
term interests
Focused on businesses which we understand and are well-equipped to manage
Active board and senior management oversight
Comprehensive risk management policies, procedures and limits governing credit risks,
funding risks, interest rate risks, market risks and operational risks
Regular stress tests
Strong internal controls and internal audit process
Common
Operating
Framework
across Region
Standardised and centralised core banking systems completed at end-2013
Common operating framework integrates regional technology, operations and risk
infrastructure, ensuring consistent risk management practices across core markets
Framework anchored to Singapore head office’s high corporate governance standards
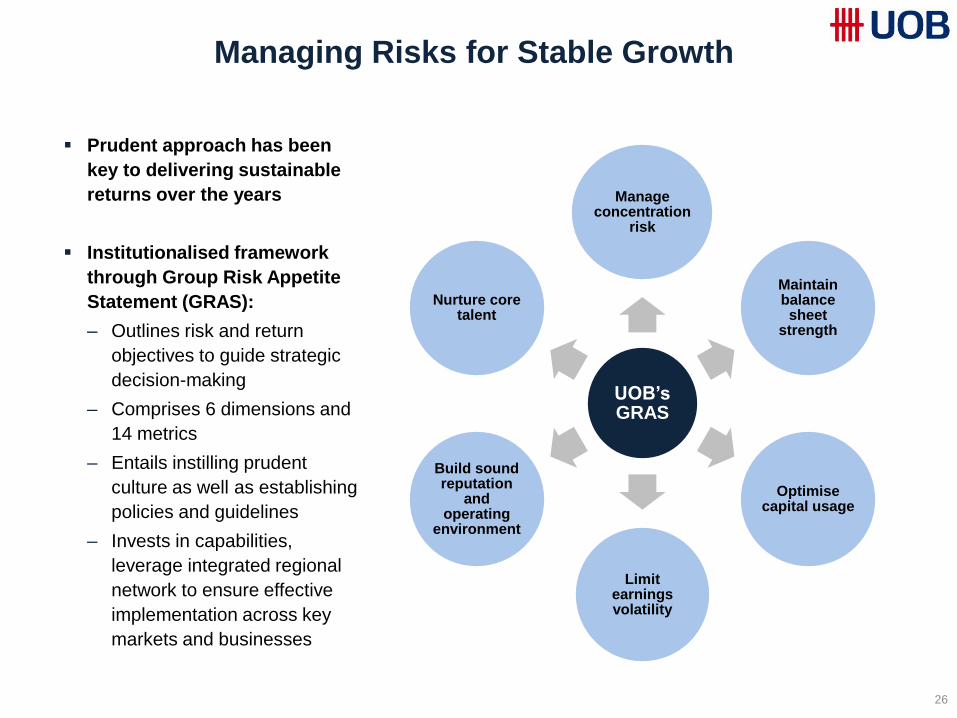
Managing Risks for Stable Growth
26
UOB’s GRAS
Manage concentration
risk
Maintain balance sheet
strength
Optimise capital usage
Limit earnings volatility
Build sound reputation
and operating
environment
Nurture core talent
Prudent approach has been
key to delivering sustainable
returns over the years
Institutionalised framework
through Group Risk Appetite
Statement (GRAS):
– Outlines risk and return
objectives to guide strategic
decision-making
– Comprises 6 dimensions and
14 metrics
– Entails instilling prudent
culture as well as establishing
policies and guidelines
– Invests in capabilities,
leverage integrated regional
network to ensure effective
implementation across key
markets and businesses
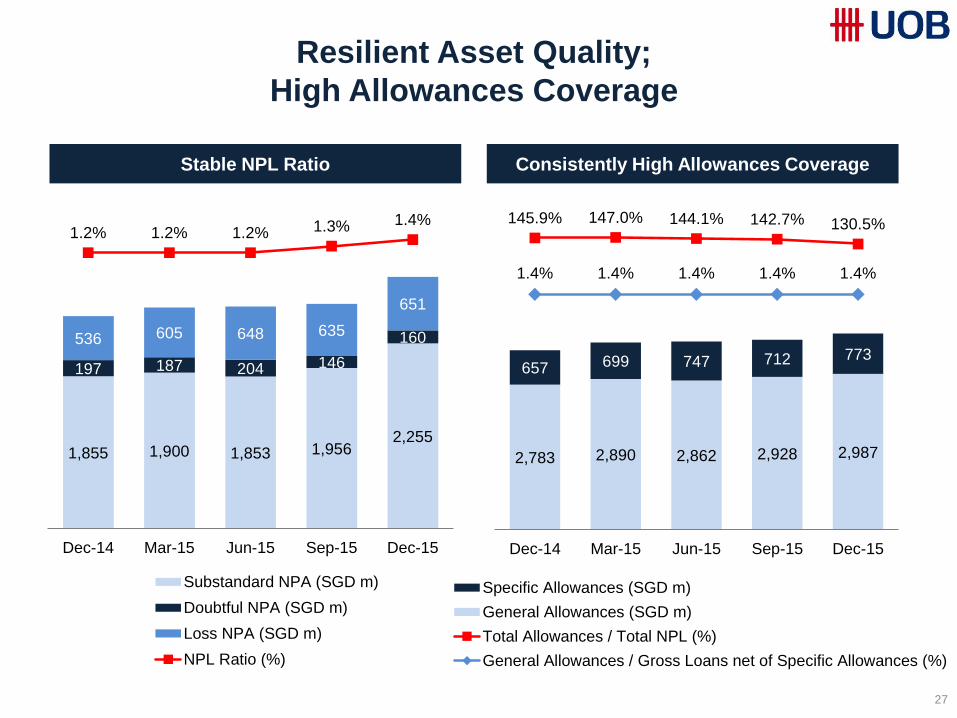
1,855 1,900 1,853 1,956 2,255
197 187 204 146
160 536 605 648 635
651
1.2% 1.2% 1.2% 1.3% 1.4%
-3.0%
-2.0%
-1.0%
0.0%
1.0%
2.0%
0
500
1,000
1,500
2,000
2,500
3,000
3,500
4,000
Dec-14 Mar-15 Jun-15 Sep-15 Dec-15
Substandard NPA (SGD m)
Doubtful NPA (SGD m)
Loss NPA (SGD m)
NPL Ratio (%)
Resilient Asset Quality;
High Allowances Coverage
27
2,783 2,890 2,862 2,928 2,987
657 699 747 712 773
145.9% 147.0% 144.1% 142.7% 130.5%
1.4% 1.4% 1.4% 1.4% 1.4%
-600%
-500%
-400%
-300%
-200%
-100%
0%
100%
200%
0
1,000
2,000
3,000
4,000
5,000
6,000
Dec-14 Mar-15 Jun-15 Sep-15 Dec-15
Specific Allowances (SGD m)
General Allowances (SGD m)
Total Allowances / Total NPL (%)
General Allowances / Gross Loans net of Specific Allowances (%)
Stable NPL Ratio Consistently High Allowances Coverage
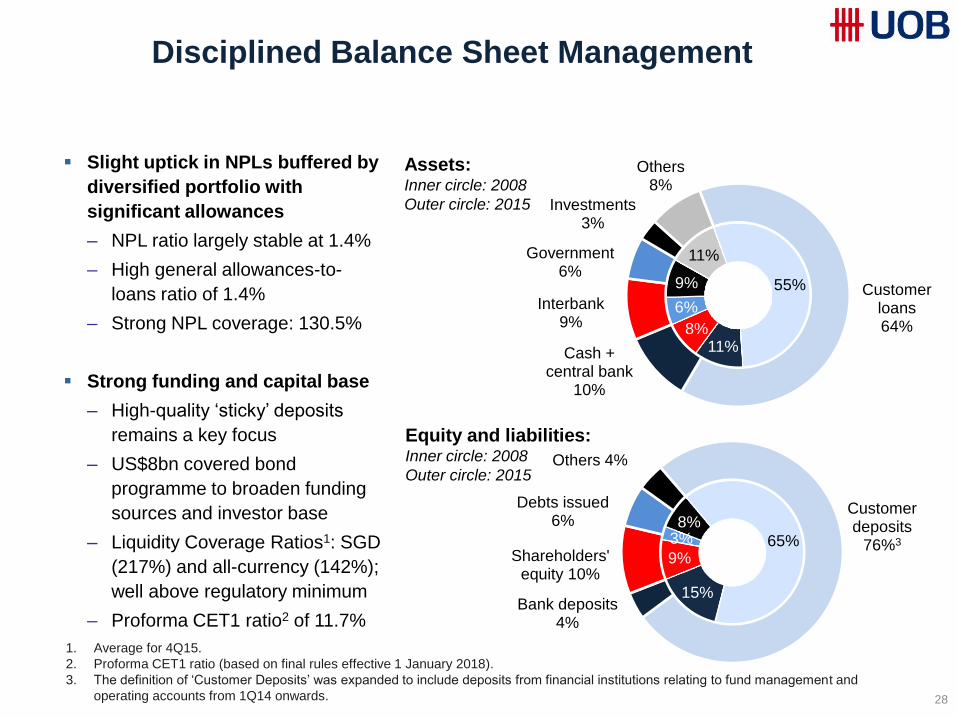
Disciplined Balance Sheet Management
28
Slight uptick in NPLs buffered by
diversified portfolio with
significant allowances
– NPL ratio largely stable at 1.4%
– High general allowances-to-
loans ratio of 1.4%
– Strong NPL coverage: 130.5%
Strong funding and capital base
– High-quality ‘sticky’ deposits
remains a key focus
– US$8bn covered bond
programme to broaden funding
sources and investor base
– Liquidity Coverage Ratios1: SGD
(217%) and all-currency (142%);
well above regulatory minimum
– Proforma CET1 ratio2 of 11.7%
Assets: Inner circle: 2008
Outer circle: 2015
65%
15%
9%
3% 8%
Customer deposits
76%3
Bank deposits 4%
Shareholders' equity 10%
Debts issued 6%
Others 4%
55%
11% 8%
6%
9%
11%
Customer loans 64%
Cash + central bank
10%
Interbank 9%
Government 6%
Investments 3%
Others 8%
Equity and liabilities: Inner circle: 2008
Outer circle: 2015
1. Average for 4Q15.
2. Proforma CET1 ratio (based on final rules effective 1 January 2018).
3. The definition of ‘Customer Deposits’ was expanded to include deposits from financial institutions relating to fund management and
operating accounts from 1Q14 onwards.

Our Growth Drivers
29
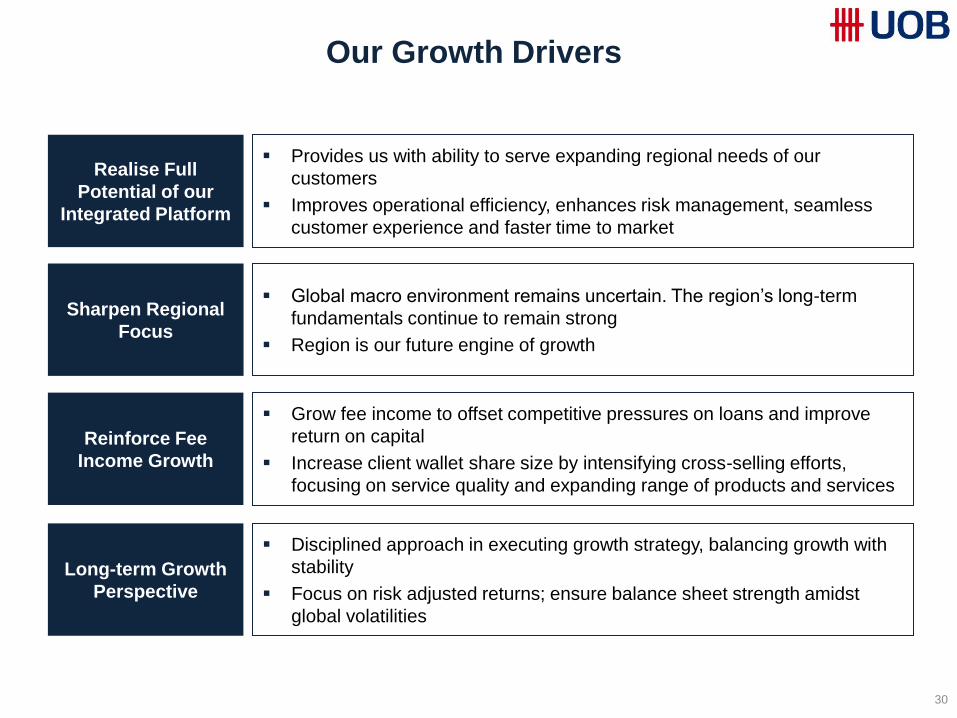
Our Growth Drivers
30
Realise Full
Potential of our
Integrated Platform
Provides us with ability to serve expanding regional needs of our
customers
Improves operational efficiency, enhances risk management, seamless
customer experience and faster time to market
Sharpen Regional
Focus
Global macro environment remains uncertain. The region’s long-term
fundamentals continue to remain strong
Region is our future engine of growth
Grow fee income to offset competitive pressures on loans and improve
return on capital
Increase client wallet share size by intensifying cross-selling efforts,
focusing on service quality and expanding range of products and services
Long-term Growth
Perspective
Disciplined approach in executing growth strategy, balancing growth with
stability
Focus on risk adjusted returns; ensure balance sheet strength amidst
global volatilities
Reinforce Fee
Income Growth

Wholesale Banking: Forging Ahead
31
Higher Income Mainly Due to
Stronger Liability Management and Fees
Wholesale Banking Business Stronger wholesale banking income
– Driven by stronger liability
management and cross-selling efforts
Investing and developing strong
product coverage and advisory
capabilities
Capturing regional opportunities
– Helped more than 700 companies
expand in the region since 2011
Transaction banking FinancialInstitutions Group
Treasury
2014 2015+14% YoY
+45% YoY +26% YoY
2.03% 1.81% 1.83%
0.00%
1.00%
2.00%
3.00%
4.00%
0
500
1000
1500
2000
2500
3000
3500
4000
2013 2014 2015
Total Income ($m) Gross Loans ($bn)
2013 2014 2015
+13%
YoY +10%
YoY +8%
YoY
+23%
YoY
+10%
YoY
+6%
YoY
ROA1
1. ROA: Ratio of “Profit before tax” to “Average Assets”
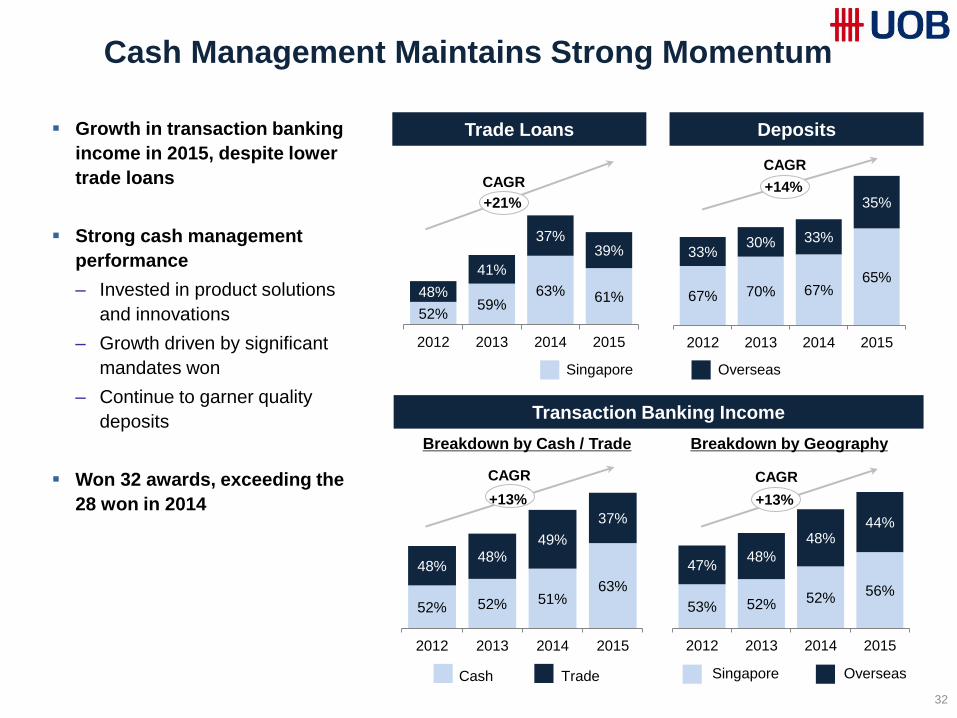
Cash Management Maintains Strong Momentum
32
Transaction Banking Income
Growth in transaction banking
income in 2015, despite lower
trade loans
Strong cash management
performance
– Invested in product solutions
and innovations
– Growth driven by significant
mandates won
– Continue to garner quality
deposits
Won 32 awards, exceeding the
28 won in 2014
52% 59%
63% 61% 48%
41%
37% 39%
2012 2013 2014 2015
67% 70% 67% 65%
33% 30% 33%
35%
2012 2013 2014 2015
Singapore Overseas
Breakdown by Cash / Trade Breakdown by Geography
Singapore Overseas
52% 52% 51% 63%
48% 48%
49%
37%
2012 2013 2014 2015
53% 52% 52% 56%
47% 48%
48% 44%
2012 2013 2014 2015
Cash Trade
Trade Loans Deposits
+13%
CAGR
+13%
CAGR
+14%
CAGR
+21%
CAGR
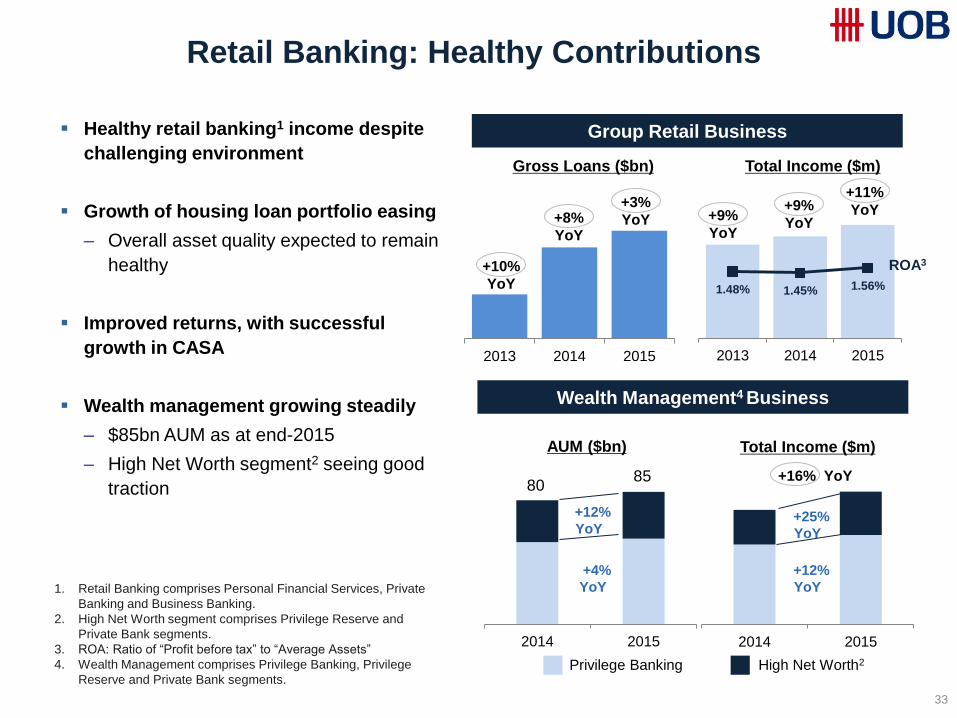
Retail Banking: Healthy Contributions
33
Wealth Management4 Business
Group Retail Business Healthy retail banking1 income despite
challenging environment
Growth of housing loan portfolio easing
– Overall asset quality expected to remain
healthy
Improved returns, with successful
growth in CASA
Wealth management growing steadily
– $85bn AUM as at end-2015
– High Net Worth segment2 seeing good
traction
1.48% 1.45% 1.56%
0.00%
0.50%
1.00%
1.50%
2.00%
2.50%
3.00%
0
500
1000
1500
2000
2500
3000
3500
4000
2013 2014 2015
Total Income ($m) Gross Loans ($bn)
+11%
YoY
1. Retail Banking comprises Personal Financial Services, Private
Banking and Business Banking.
2. High Net Worth segment comprises Privilege Reserve and
Private Bank segments.
3. ROA: Ratio of “Profit before tax” to “Average Assets”
4. Wealth Management comprises Privilege Banking, Privilege
Reserve and Private Bank segments.
2013 2014 2015
2014 2015
Total Income ($m) AUM ($bn)
2014 2015
80 85
+12%
YoY
+4%
YoY
+25%
YoY
+12%
YoY
Privilege Banking High Net Worth2
+9%
YoY +9%
YoY
+10%
YoY
+8%
YoY
+3%
YoY
ROA3
+16% YoY
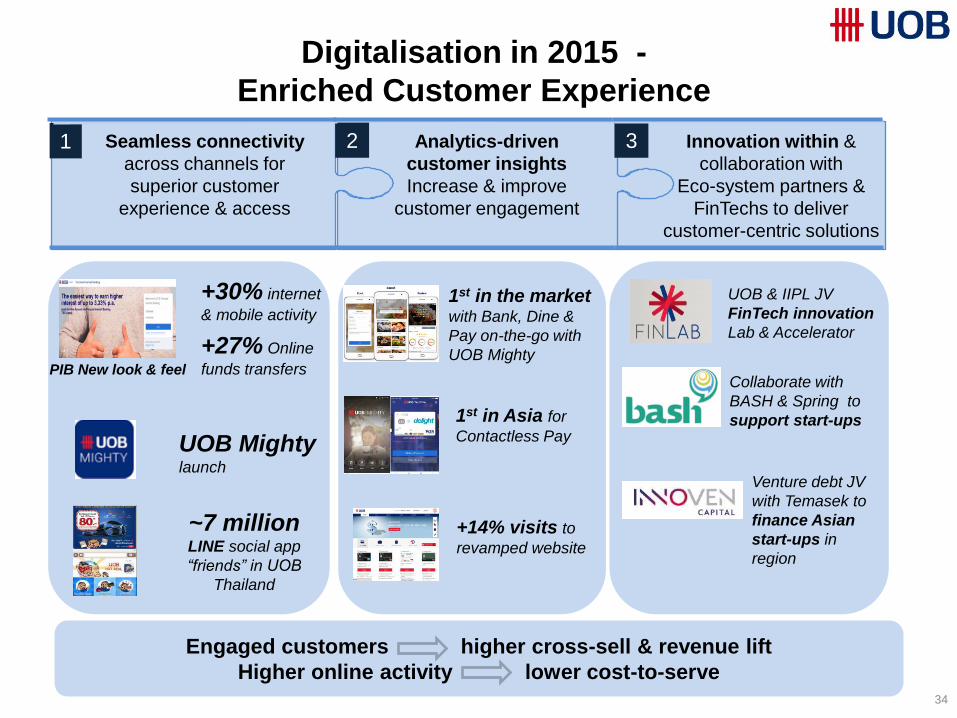
34
1 2 3 Innovation within &
collaboration with
Eco-system partners &
FinTechs to deliver
customer-centric solutions
Seamless connectivity
across channels for
superior customer
experience & access
Engaged customers higher cross-sell & revenue lift
Higher online activity lower cost-to-serve
Collaborate with
BASH & Spring to
support start-ups
UOB & IIPL JV
FinTech innovation
Lab & Accelerator
Venture debt JV
with Temasek to
finance Asian
start-ups in
region
1st in the market with Bank, Dine &
Pay on-the-go with
UOB Mighty
~7 million LINE social app
“friends” in UOB
Thailand
+14% visits to
revamped website
Analytics-driven
customer insights
Increase & improve
customer engagement
1st in Asia for
Contactless Pay UOB Mighty launch
+30% internet
& mobile activity
+27% Online
funds transfers PIB New look & feel
Digitalisation in 2015 -
Enriched Customer Experience
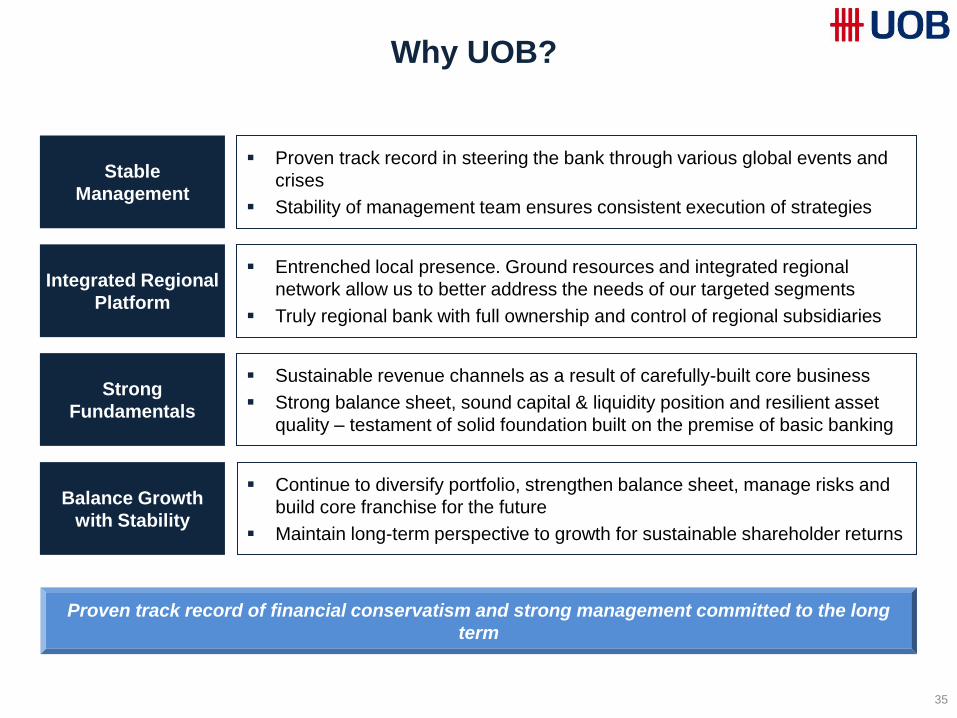
Why UOB?
35
Integrated Regional
Platform
Entrenched local presence. Ground resources and integrated regional
network allow us to better address the needs of our targeted segments
Truly regional bank with full ownership and control of regional subsidiaries
Stable
Management
Proven track record in steering the bank through various global events and
crises
Stability of management team ensures consistent execution of strategies
Strong
Fundamentals
Sustainable revenue channels as a result of carefully-built core business
Strong balance sheet, sound capital & liquidity position and resilient asset
quality – testament of solid foundation built on the premise of basic banking
Balance Growth
with Stability
Continue to diversify portfolio, strengthen balance sheet, manage risks and
build core franchise for the future
Maintain long-term perspective to growth for sustainable shareholder returns
Proven track record of financial conservatism and strong management committed to the long
term
Latest Financials
36
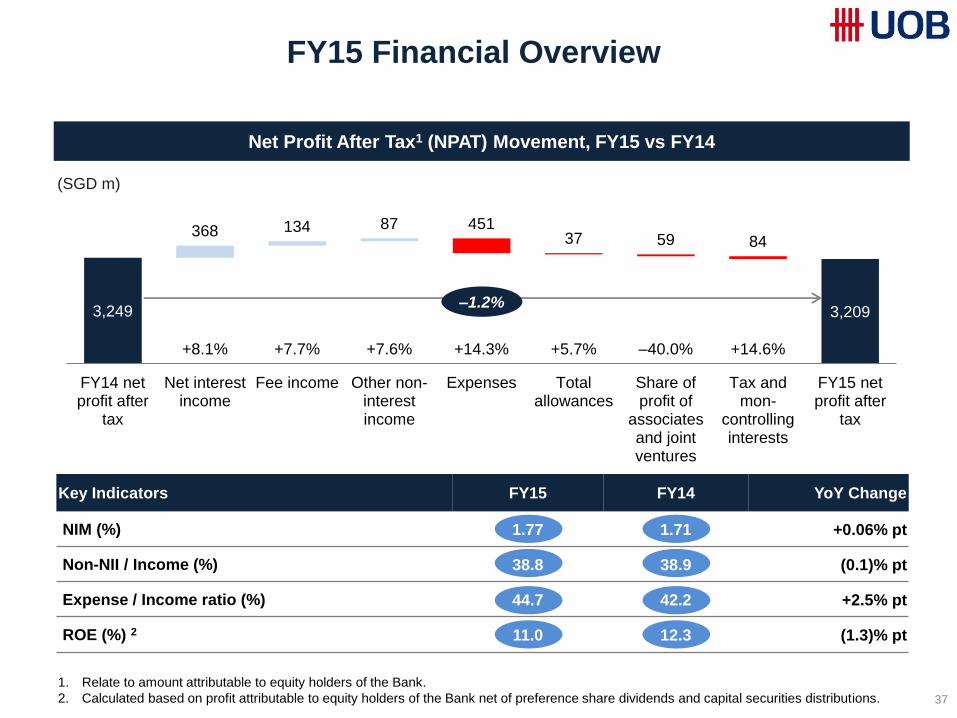
Key Indicators FY15 FY14 YoY Change
NIM (%) 1.77 1.71 +0.06% pt
Non-NII / Income (%) 38.8 38.9 (0.1)% pt
Expense / Income ratio (%) 44.7 42.2 +2.5% pt
ROE (%) 2 11.0 12.3 (1.3)% pt
37
FY15 Financial Overview
Net Profit After Tax1 (NPAT) Movement, FY15 vs FY14
(SGD m)
+8.1% +7.7% +7.6% +14.3% +5.7% +14.6% –40.0%
3,249 3,209
368 134 87 451 37 59 84
FY14 netprofit after
tax
Net interestincome
Fee income Other non-interestincome
Expenses Totalallowances
Share ofprofit of
associatesand jointventures
Tax andmon-
controllinginterests
FY15 netprofit after
tax
–1.2%
1. Relate to amount attributable to equity holders of the Bank.
2. Calculated based on profit attributable to equity holders of the Bank net of preference share dividends and capital securities distributions.
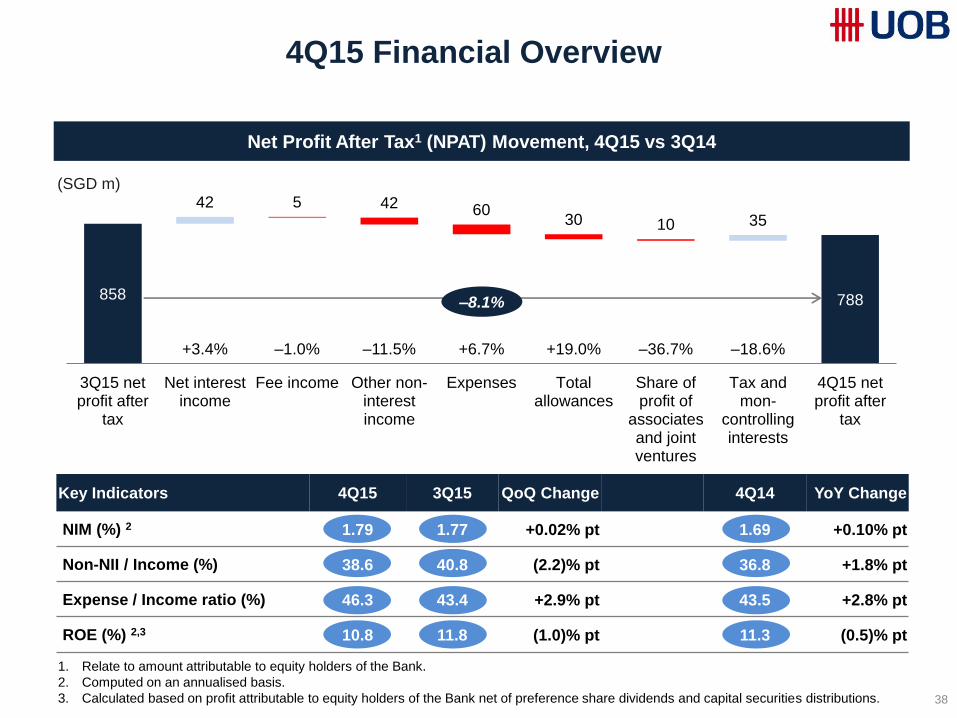
Key Indicators 4Q15 3Q15 QoQ Change 4Q14 YoY Change
NIM (%) 2 1.79 1.77 +0.02% pt 1.69 +0.10% pt
Non-NII / Income (%) 38.6 40.8 (2.2)% pt 36.8 +1.8% pt
Expense / Income ratio (%) 46.3 43.4 +2.9% pt 43.5 +2.8% pt
ROE (%) 2,3 10.8 11.8 (1.0)% pt 11.3 (0.5)% pt
38
4Q15 Financial Overview
Net Profit After Tax1 (NPAT) Movement, 4Q15 vs 3Q14
(SGD m)
+3.4% +6.7% +19.0% –1.0% –11.5% –36.7% –18.6%
858 788
42 35
5 42 60 30 10
3Q15 netprofit after
tax
Net interestincome
Fee income Other non-interestincome
Expenses Totalallowances
Share ofprofit of
associatesand jointventures
Tax andmon-
controllinginterests
4Q15 netprofit after
tax
–8.1%
1. Relate to amount attributable to equity holders of the Bank.
2. Computed on an annualised basis.
3. Calculated based on profit attributable to equity holders of the Bank net of preference share dividends and capital securities distributions.
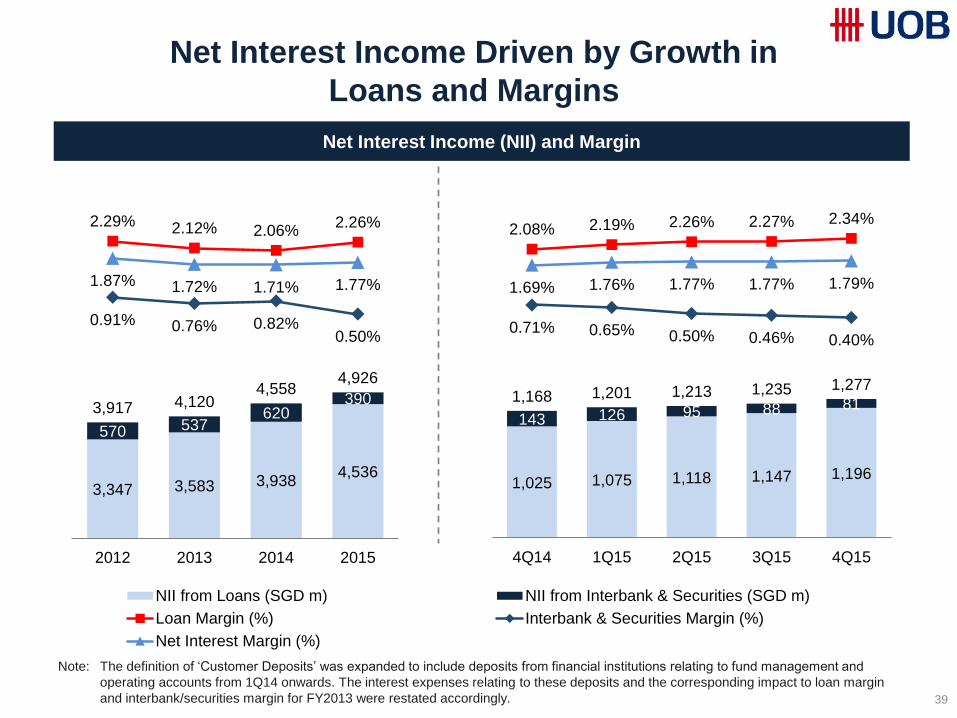
Net Interest Income Driven by Growth in
Loans and Margins
39
Note: The definition of ‘Customer Deposits’ was expanded to include deposits from financial institutions relating to fund management and
operating accounts from 1Q14 onwards. The interest expenses relating to these deposits and the corresponding impact to loan margin
and interbank/securities margin for FY2013 were restated accordingly.
3,347 3,583 3,938 4,536
570 537 620
390 3,917 4,120
4,558 4,926
2.29% 2.12% 2.06% 2.26%
0.91% 0.76% 0.82% 0.50%
1.87% 1.72% 1.71% 1.77%
-5.00%
-4.00%
-3.00%
-2.00%
-1.00%
0.00%
1.00%
2.00%
3.00%
0
2,000
4,000
6,000
8,000
10,000
2012 2013 2014 2015
NII from Loans (SGD m) NII from Interbank & Securities (SGD m)
Loan Margin (%) Interbank & Securities Margin (%)
Net Interest Margin (%)
1,025 1,075 1,118 1,147 1,196
143 126 95 88 81 1,168 1,201 1,213 1,235 1,277
2.08% 2.19% 2.26% 2.27% 2.34%
0.71% 0.65% 0.50% 0.46% 0.40%
1.69% 1.76% 1.77% 1.77% 1.79%
-5.00%
-4.00%
-3.00%
-2.00%
-1.00%
0.00%
1.00%
2.00%
3.00%
0
500
1,000
1,500
2,000
2,500
3,000
4Q14 1Q15 2Q15 3Q15 4Q15
Net Interest Income (NII) and Margin
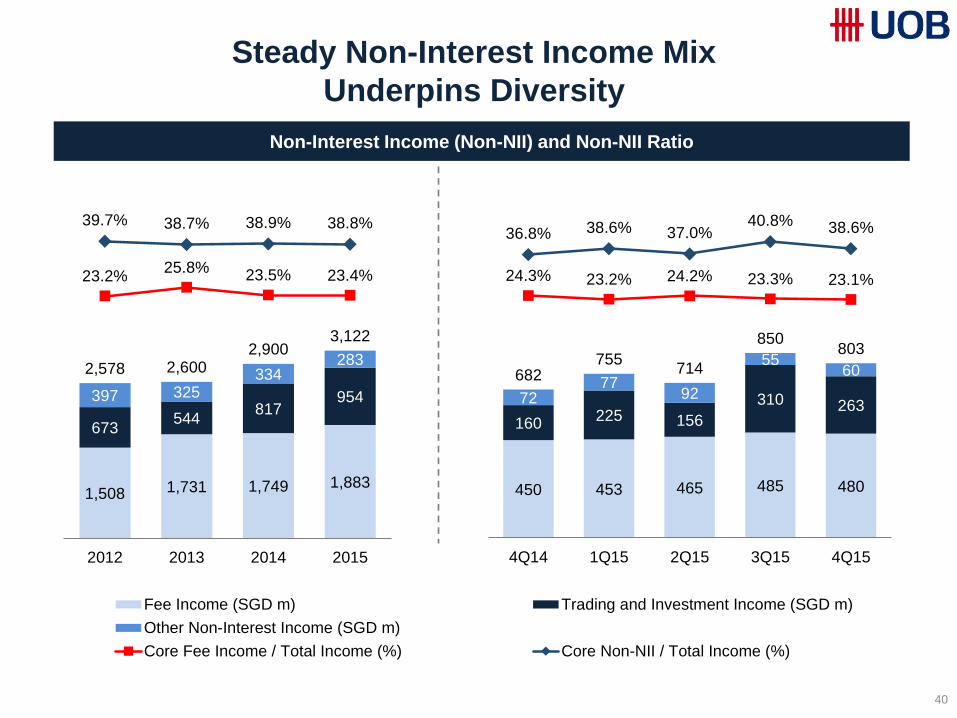
Steady Non-Interest Income Mix
Underpins Diversity
40
1,508 1,731 1,749 1,883
673 544
817 954 397 325
334 283
2,578 2,600 2,900
3,122
23.2% 25.8%
23.5% 23.4%
39.7% 38.7% 38.9% 38.8%
-50.0%
-40.0%
-30.0%
-20.0%
-10.0%
0.0%
10.0%
20.0%
30.0%
40.0%
50.0%
0
1,000
2,000
3,000
4,000
5,000
2012 2013 2014 2015
Fee Income (SGD m) Trading and Investment Income (SGD m)
Other Non-Interest Income (SGD m)
Core Fee Income / Total Income (%) Core Non-NII / Total Income (%)
450 453 465 485 480
160 225 156
310 263 72
77 92
55 60 682
755 714
850 803
24.3% 23.2% 24.2% 23.3% 23.1%
36.8% 38.6% 37.0% 40.8% 38.6%
-50.0%
-40.0%
-30.0%
-20.0%
-10.0%
0.0%
10.0%
20.0%
30.0%
40.0%
50.0%
0
200
400
600
800
1000
1200
1400
4Q14 1Q15 2Q15 3Q15 4Q15
Non-Interest Income (Non-NII) and Non-NII Ratio
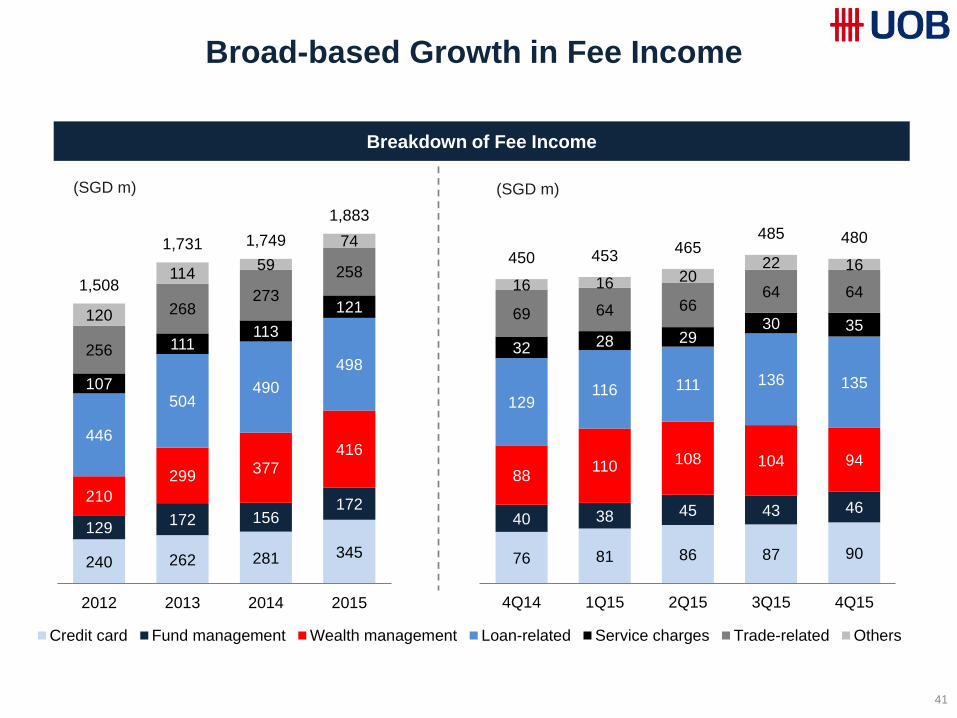
Broad-based Growth in Fee Income
41
240 262 281 345
129 172 156
172 210
299 377
416 446
504 490
498
107
111 113
121
256
268 273
258
120
114 59
74
1,508
1,731 1,749
1,883
0
200
400
600
800
1,000
1,200
1,400
1,600
1,800
2,000
2012 2013 2014 2015
Credit card Fund management Wealth management Loan-related Service charges Trade-related Others
76 81 86 87 90
40 38 45 43 46
88 110 108 104 94
129 116 111 136 135
32 28 29 30 35
69 64 66 64 64 16 16 20 22 16 450 453
465 485 480
0
100
200
300
400
500
4Q14 1Q15 2Q15 3Q15 4Q15
(SGD m) (SGD m)
Breakdown of Fee Income
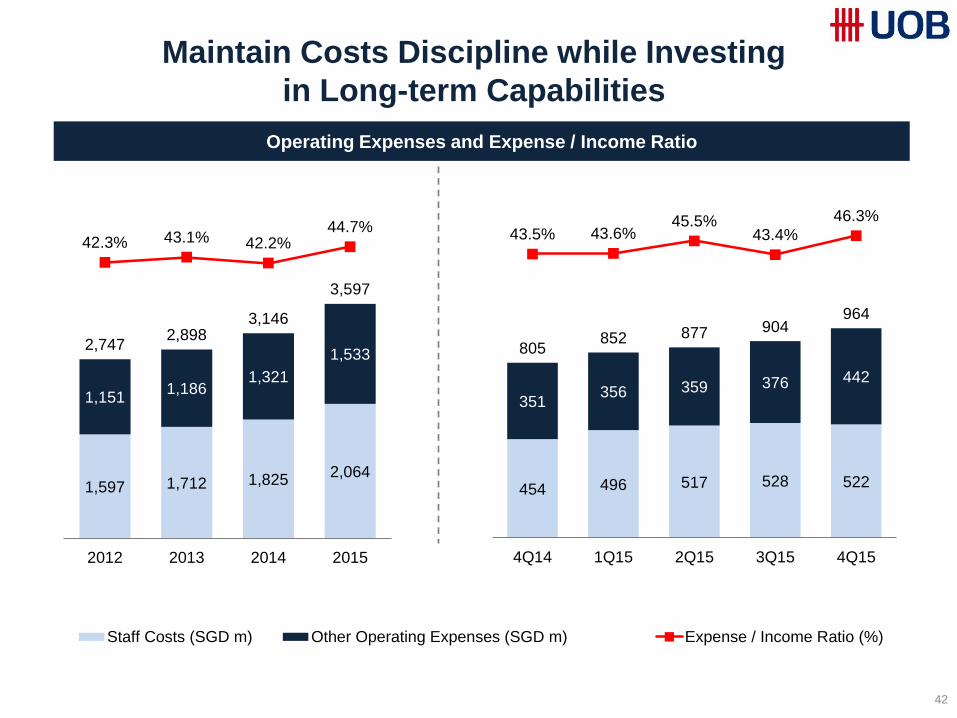
Maintain Costs Discipline while Investing
in Long-term Capabilities
42
1,597 1,712 1,825 2,064
1,151 1,186
1,321
1,533 2,747
2,898 3,146
3,597
42.3% 43.1% 42.2% 44.7%
0.0%
5.0%
10.0%
15.0%
20.0%
25.0%
30.0%
35.0%
40.0%
45.0%
50.0%
0
500
1,000
1,500
2,000
2,500
3,000
3,500
4,000
4,500
5,000
2012 2013 2014 2015
Staff Costs (SGD m) Other Operating Expenses (SGD m) Expense / Income Ratio (%)
454 496 517 528 522
351 356 359 376 442
805 852 877 904
964
43.5% 43.6% 45.5%
43.4%
46.3%
0.0%
5.0%
10.0%
15.0%
20.0%
25.0%
30.0%
35.0%
40.0%
45.0%
50.0%
0
200
400
600
800
1,000
1,200
1,400
4Q14 1Q15 2Q15 3Q15 4Q15
Operating Expenses and Expense / Income Ratio
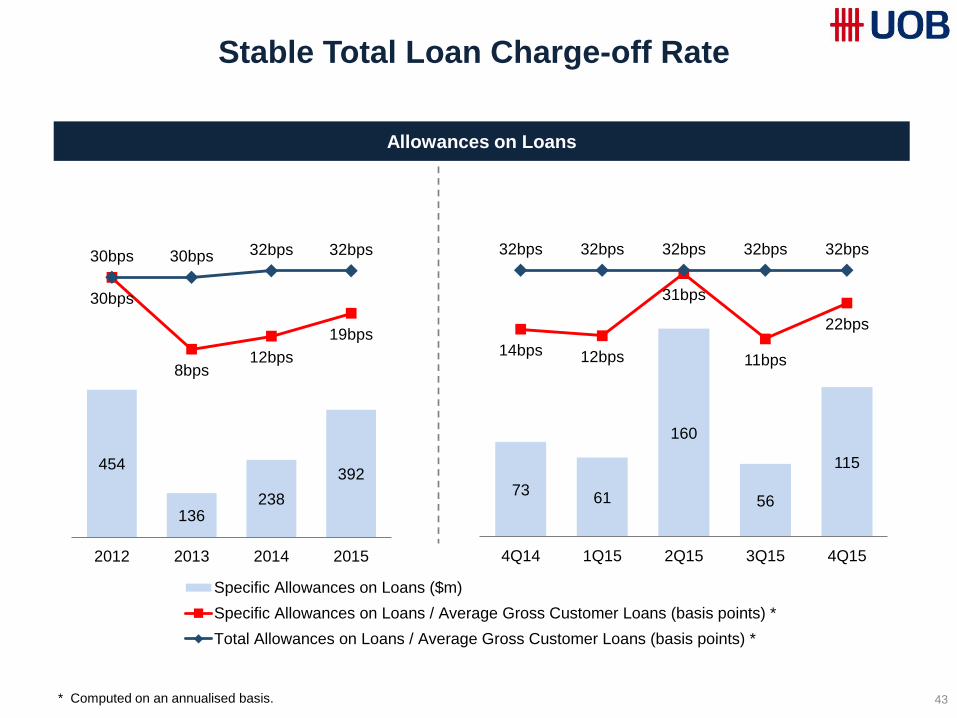
Stable Total Loan Charge-off Rate
43
454
136 238
392
30bps
8bps 12bps
19bps
30bps 30bps 32bps 32bps
(50)bps
(40)bps
(30)bps
(20)bps
(10)bps
0bps
10bps
20bps
30bps
40bps
50bps
(4)
196
396
596
796
996
2012 2013 2014 2015
Specific Allowances on Loans ($m)
Specific Allowances on Loans / Average Gross Customer Loans (basis points) *
Total Allowances on Loans / Average Gross Customer Loans (basis points) *
* Computed on an annualised basis.
73 61
160
56
115
14bps 12bps
31bps
11bps
22bps
32bps 32bps 32bps 32bps 32bps
(50)bps
(40)bps
(30)bps
(20)bps
(10)bps
0bps
10bps
20bps
30bps
40bps
50bps
(1)
49
99
149
199
249
4Q14 1Q15 2Q15 3Q15 4Q15
Allowances on Loans
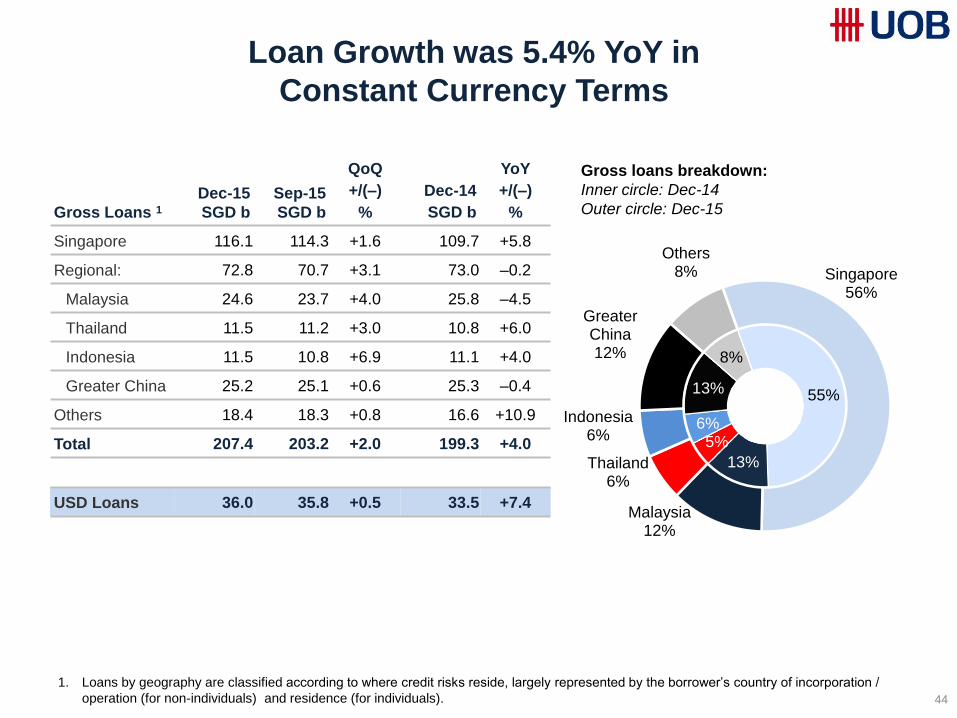
Loan Growth was 5.4% YoY in
Constant Currency Terms
44
Gross Loans 1
Dec-15
SGD b
Sep-15
SGD b
QoQ
+/(–)
%
Dec-14
SGD b
YoY
+/(–)
%
Singapore 116.1 114.3 +1.6 109.7 +5.8
Regional: 72.8 70.7 +3.1 73.0 –0.2
Malaysia 24.6 23.7 +4.0 25.8 –4.5
Thailand 11.5 11.2 +3.0 10.8 +6.0
Indonesia 11.5 10.8 +6.9 11.1 +4.0
Greater China 25.2 25.1 +0.6 25.3 –0.4
Others 18.4 18.3 +0.8 16.6 +10.9
Total 207.4 203.2 +2.0 199.3 +4.0
USD Loans 36.0 35.8 +0.5 33.5 +7.4
Gross loans breakdown:
Inner circle: Dec-14
Outer circle: Dec-15
55%
13%
5% 6%
13%
8%
Singapore 56%
Malaysia 12%
Thailand 6%
Indonesia 6%
Greater China 12%
Others 8%
1. Loans by geography are classified according to where credit risks reside, largely represented by the borrower’s country of incorporation /
operation (for non-individuals) and residence (for individuals).
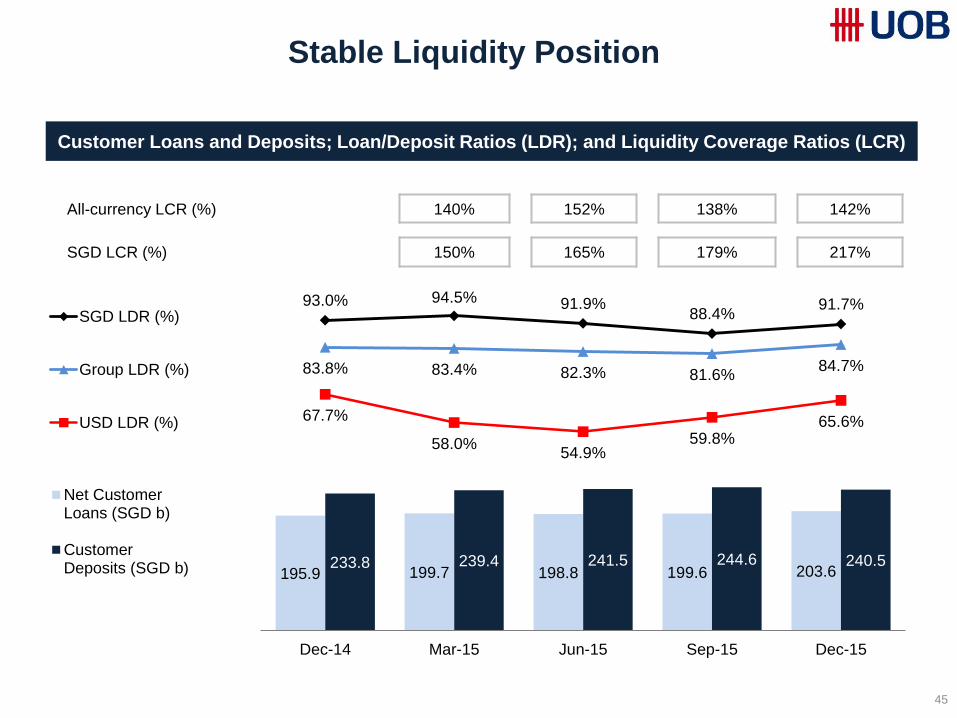
Stable Liquidity Position
45
All-currency LCR (%) 140% 152% 138% 142%
SGD LCR (%) 150% 165% 179% 217%
195.9 199.7 198.8 199.6 203.6 233.8 239.4 241.5 244.6 240.5
0.0
50.0
100.0
150.0
200.0
250.0
300.0
Dec-14 Mar-15 Jun-15 Sep-15 Dec-15
Net CustomerLoans (SGD b)
CustomerDeposits (SGD b)
93.0% 94.5% 91.9% 88.4%
91.7%
83.8% 83.4% 82.3% 81.6% 84.7%
67.7%
58.0% 54.9%
59.8% 65.6%
50.0%
60.0%
70.0%
80.0%
90.0%
100.0%SGD LDR (%)
Group LDR (%)
USD LDR (%)
Customer Loans and Deposits; Loan/Deposit Ratios (LDR); and Liquidity Coverage Ratios (LCR)
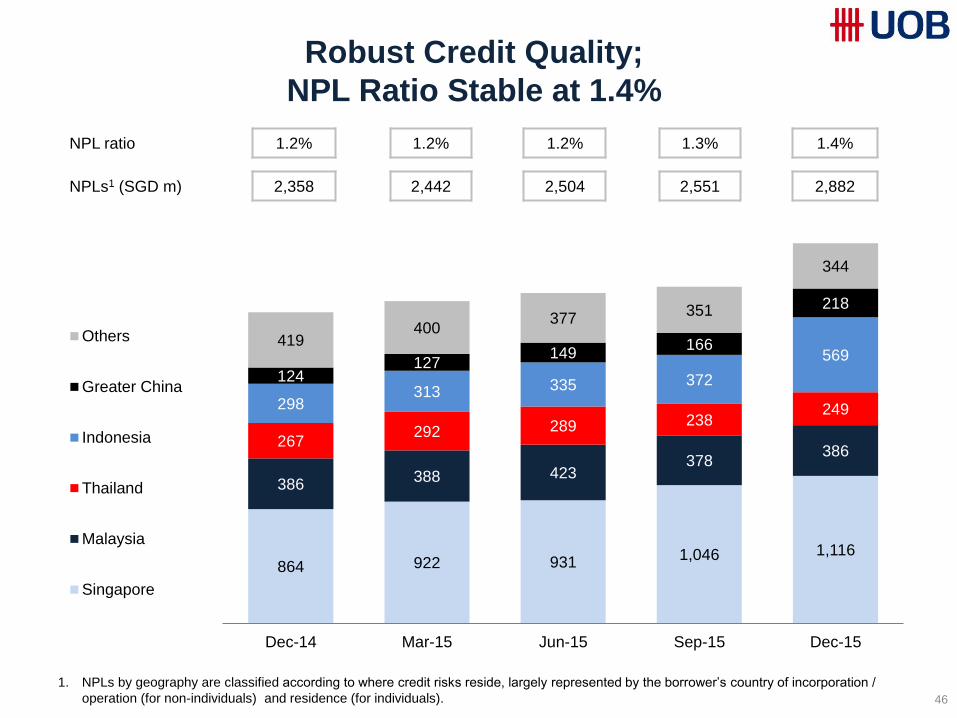
Robust Credit Quality;
NPL Ratio Stable at 1.4%
46
NPL ratio 1.2% 1.2% 1.2% 1.3% 1.4%
NPLs1 (SGD m) 2,358 2,442 2,504 2,551 2,882
864 922 931 1,046 1,116
386 388 423
378 386
267 292 289 238
249 298 313 335 372
569
124 127
149 166
218
419 400
377 351
344
0
500
1,000
1,500
2,000
2,500
3,000
Dec-14 Mar-15 Jun-15 Sep-15 Dec-15
Others
Greater China
Indonesia
Thailand
Malaysia
Singapore
1. NPLs by geography are classified according to where credit risks reside, largely represented by the borrower’s country of incorporation /
operation (for non-individuals) and residence (for individuals).
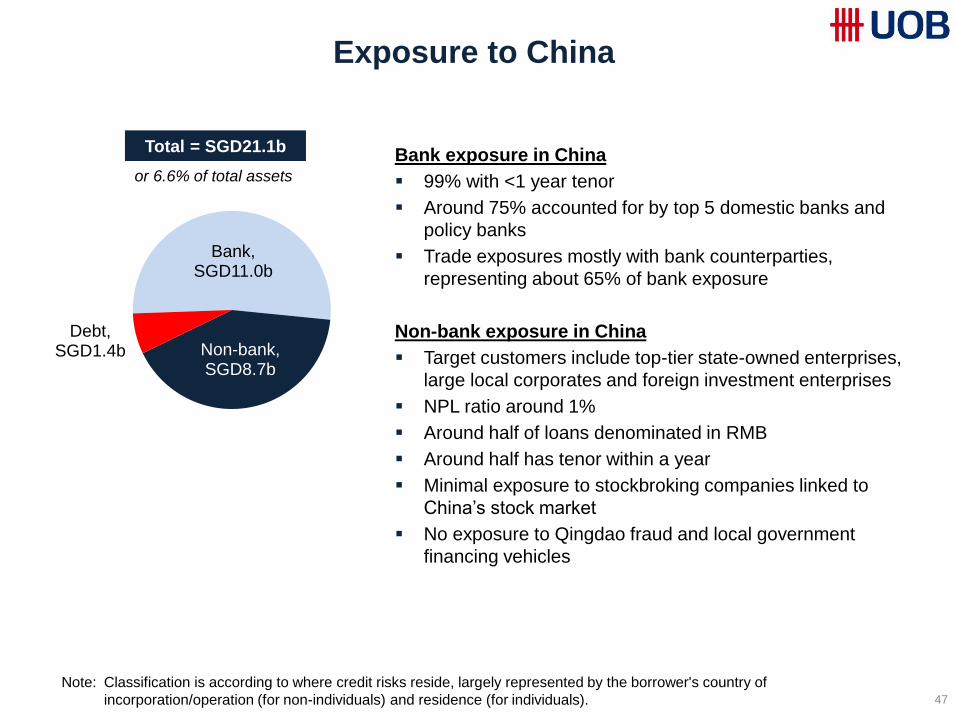
Exposure to China
47
Bank exposure in China
99% with <1 year tenor
Around 75% accounted for by top 5 domestic banks and
policy banks
Trade exposures mostly with bank counterparties,
representing about 65% of bank exposure
Non-bank exposure in China
Target customers include top-tier state-owned enterprises,
large local corporates and foreign investment enterprises
NPL ratio around 1%
Around half of loans denominated in RMB
Around half has tenor within a year
Minimal exposure to stockbroking companies linked to
China’s stock market
No exposure to Qingdao fraud and local government
financing vehicles
Note: Classification is according to where credit risks reside, largely represented by the borrower's country of
incorporation/operation (for non-individuals) and residence (for individuals).
Bank, SGD11.0b
Non-bank, SGD8.7b
Debt, SGD1.4b
Total = SGD21.1b
or 6.6% of total assets
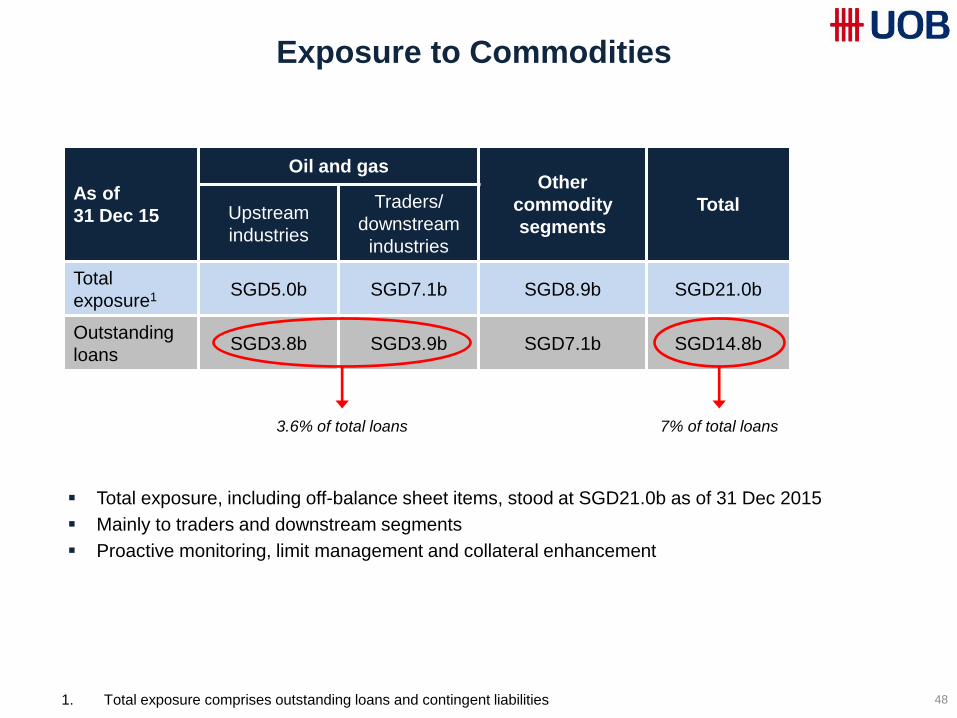
Exposure to Commodities
48
Total exposure, including off-balance sheet items, stood at SGD21.0b as of 31 Dec 2015
Mainly to traders and downstream segments
Proactive monitoring, limit management and collateral enhancement
As of
31 Dec 15
Oil and gas Other
commodity
segments
Total Upstream
industries
Traders/
downstream
industries
Total
exposure1 SGD5.0b SGD7.1b SGD8.9b SGD21.0b
Outstanding
loans SGD3.8b SGD3.9b SGD7.1b SGD14.8b
1. Total exposure comprises outstanding loans and contingent liabilities
3.6% of total loans 7% of total loans
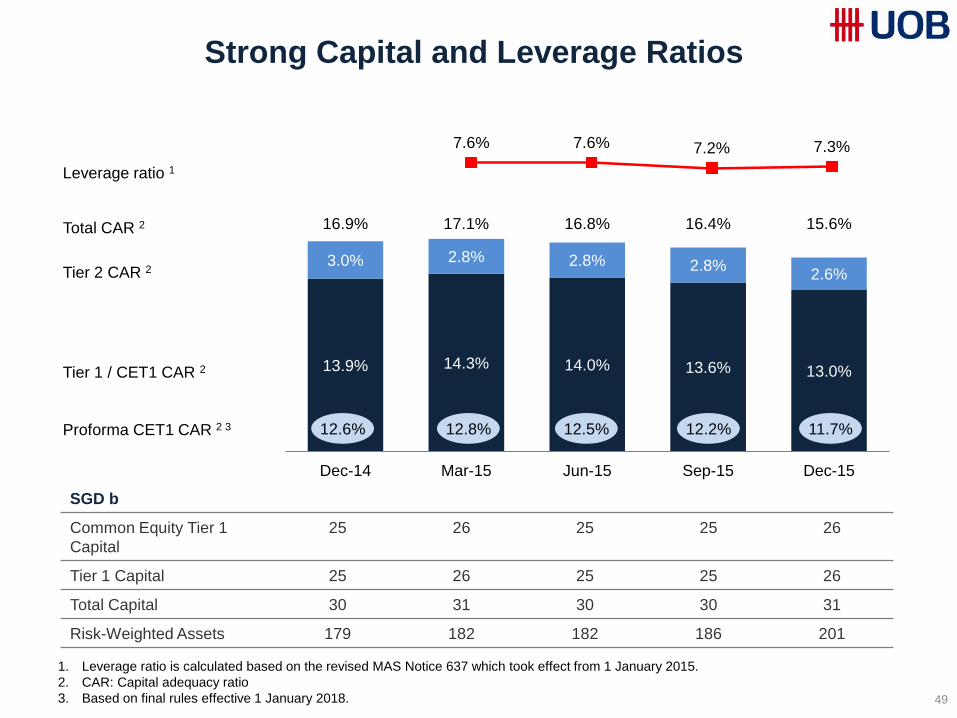
Strong Capital and Leverage Ratios
49
Tier 2 CAR 2
Total CAR 2
Tier 1 / CET1 CAR 2
SGD b
Common Equity Tier 1
Capital
25 26 25 25 26
Tier 1 Capital 25 26 25 25 26
Total Capital 30 31 30 30 31
Risk-Weighted Assets 179 182 182 186 201
Leverage ratio 1
1. Leverage ratio is calculated based on the revised MAS Notice 637 which took effect from 1 January 2015.
2. CAR: Capital adequacy ratio
3. Based on final rules effective 1 January 2018.
13.9% 14.3% 14.0% 13.6% 13.0%
3.0% 2.8% 2.8% 2.8% 2.6%
16.9% 17.1% 16.8% 16.4% 15.6%
-100000%
-80000%
-60000%
-40000%
-20000%
0%
0.0%
2.0%
4.0%
6.0%
8.0%
10.0%
12.0%
14.0%
16.0%
18.0%
Dec-14 Mar-15 Jun-15 Sep-15 Dec-15
11.7% 12.2% 12.5% 12.8% 12.6% Proforma CET1 CAR 2 3
7.6% 7.6% 7.2% 7.3%
5.0%
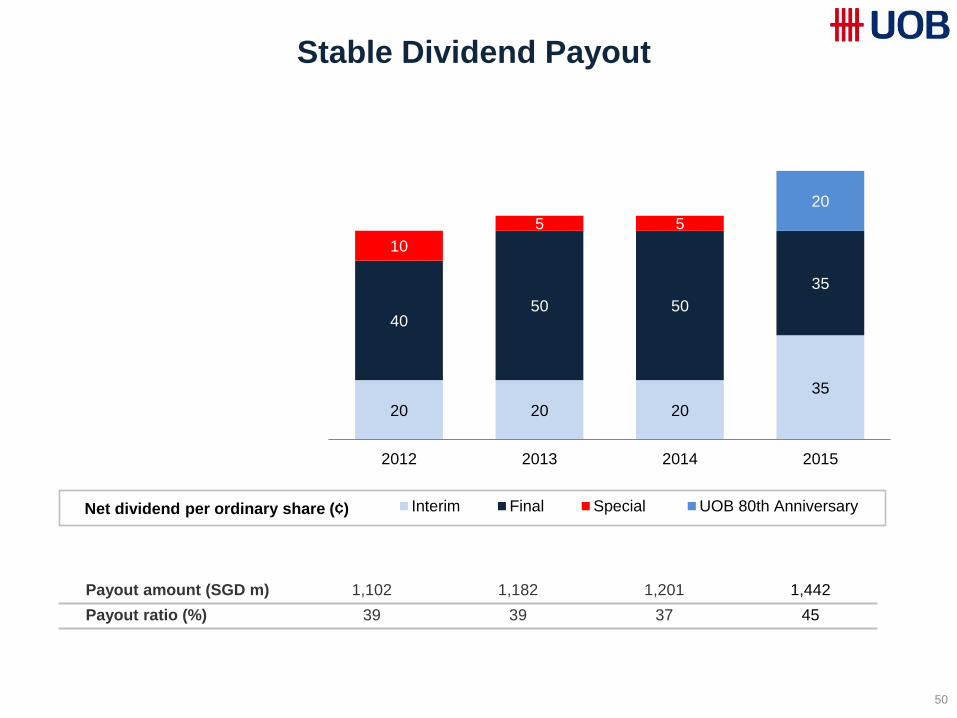
Stable Dividend Payout
50
Net dividend per ordinary share (¢)
Payout amount (SGD m) 1,102 1,182 1,201 1,442
Payout ratio (%) 39 39 37 45
20 20 20
35
40 50 50
35
10
5 5
20
2012 2013 2014 2015
Interim Final Special UOB 80th Anniversary
51
Thank you