up and running with labview web services - · pdf fileup and running with labview web services...
TRANSCRIPT

Up and Running with LabVIEW Web Services
July 7, 2014 – Jon McBee – Bloomy Controls, Inc.
LabVIEW Web Services were introduced in LabVIEW 8.6 and provide a standard way to interact with an application over the web. National Instruments significantly changed the development experience of LabVIEW Web Services in LabVIEW 2013. This whitepaper will act as an introduction to LabVIEW Web Services in LabVIEW 2013. We will step through the process of creating a LabVIEW Web Service that will publish data to a thin client rendered in a web browser.
Terminology As we progress through the example we will come across terminology commonly used in the world of web development. I will do my best to define these terms here; I encourage you to explore www.w3schools.com for more information.
• HTML: HyperText Markup Language is the language used to create web pages. To see an example of HTML right click on any webpage within any web browser and select “View page source”.
• URL: Uniform Resource Locators are web addresses • CSS: Cascading Style Sheets is a language used for defining the look and formatting of an HTML
web page. • JavaScript: JavaScript is a computer programming language. JavaScript can be called from or
embedded in HTML documents in order to change the content of an HTML element. • JSON: JavaScript Object Notation is an open standard format that uses human readable text to
describe data objects. • jQuery: jQuery is a cross-platform JavaScript library designed to simplify the client-side scripting
of HTML1 • AJAX: Asynchronous JavaScript and XML allows us to exchange data with a web server using
XML or JSON, without reloading the entire page. • Thin Client: User interface provided by an application through a web browser. • Web Service: The software running on the server that responds to the requests of the client. • SQLite: SQLite is a software library that implements a self-contained, server less, zero-
configuration, transactional SQL database engine2.
Tools You will need a text editor in order to interact with the HTML, JSON, CSS and JavaScript code detailed below. I recommend using Sublime Text, which can be downloaded for free here: http://www.sublimetext.com/. You will also need LabVIEW 2013 Full, Professional, or Developer Suite. It is important that you use LabVIEW 2013 or newer, as LabVIEW Web Services were refactored for
1 "jQuery: The write less, do more, JavaScript library". The jQuery Project. Retrieved 29 April 2010. 2 http://www.sqlite.org/
Copyright © 2014 Bloomy Controls, Inc. www.bloomy.com

LabVIEW 2013 and most of the process detailed below would be completely different for prior versions of LabVIEW. The example program uses a SQLite library for LabVIEW called “SQLite LabVIEW” which can be downloaded from LAVA here: http://lavag.org/files/file/212-sqlite-labview/. This library will need to be installed prior to following the steps below. I also recommend downloading the SQLite Database Browser from here: http://sqlitebrowser.org/. It is a free SQLite database viewer that may be useful while working through this example.
Google Charts Google Charts is a collection of free libraries that can be used to add data visualization to a thin client. Google Charts are used by embedding JavaScript into the HTML document that defines our thin client. This example will make use of Google Charts as they provide an easy way for us to get up and running with thin client development without needing to know too much about JavaScript or HTML coding. One thing worth mentioning is that Google Charts only work if the machine hosting the LabVIEW Web Service is connected to the internet. To learn more about Google Charts: https://developers.google.com/chart/.
Copyright © 2014 Bloomy Controls, Inc. www.bloomy.com

Creating a LabVIEW Web Service This section will step through the process of creating a LabVIEW Web Service from scratch.
1. From within LabVIEW 2013 go to File>>Create Project
Figure 1: Create Project
2. Select Blank Project from the Create Project dialog box and click the Finish button
Figure 2: Create Blank Project
3. Save the project to disk as Google Charts Example.lvproj. Let’s take a minute and structure our disk hierarchy. In the folder where you saved your LabVIEW project, create two subfolders named “Web Service” and “db”. Within the Web Service directory create folders titled “dist”, “Private”, and “Web Resources”. Within the dist directory create a folder named “static”.
Copyright © 2014 Bloomy Controls, Inc. www.bloomy.com

Within the static directory created folders named “css”, “js”, and “json”.
Figure 3: Top Level of Folder Hierarchy
Figure 4: Static Directory Hierarchy
Copyright © 2014 Bloomy Controls, Inc. www.bloomy.com

Open the zipped folder attached to this white paper and copy the Random.db file from the “db” folder from the zipped directory to the “db” folder in your new hierarchy.
4. Within the LabVIEW project, right-click on My Computer and select New>>Web Service
Figure 5: Create Web Service
Copyright © 2014 Bloomy Controls, Inc. www.bloomy.com

5. Notice how you now have a Web Service target named “WebService1” under My Computer in
the LabVIEW project explorer. Right-click on the Web Service and select Rename to rename it GoogleCharts.
Figure 6: Rename Web Service
6. We now have a LabVIEW Project with a LabVIEW Web Service named Google Charts.
Figure 7: Project with Web Service
Copyright © 2014 Bloomy Controls, Inc. www.bloomy.com

Building a Simple LabVIEW Application The next step is to build a simple LabVIEW application that can generate data to be served up by the GoogleCharts Web Service and visualized in the Thin Client. For our purposes we need a random number generator that will save the random numbers and a timestamp of when they were generated to a SQLite database. You will use the SQLite database located in your “db” folder for this exercise.
1. We need to create a VI that will acquire random data and write it to the SQLite database. Within the LabVIEW project right-click on My Computer and select New>>VI.
Figure 8: Create New VI
2. Save the VI as Main.vi at the same level as your Google Charts Example.lvproj in your folder hierarchy.
Figure 9: Save Main.vi
3. We are going to use the SQLite LabVIEW toolkit to write our random data and a timestamp to
Copyright © 2014 Bloomy Controls, Inc. www.bloomy.com

the database once every 60 seconds.
Figure 10: Main.vi Timeout Event
Copyright © 2014 Bloomy Controls, Inc. www.bloomy.com

Figure 11: Main.vi Panel Close Event
4. Main.vi can be replaced with a real world application. You should be able to run Main.vi entirely separately from the Web Services.
Copyright © 2014 Bloomy Controls, Inc. www.bloomy.com
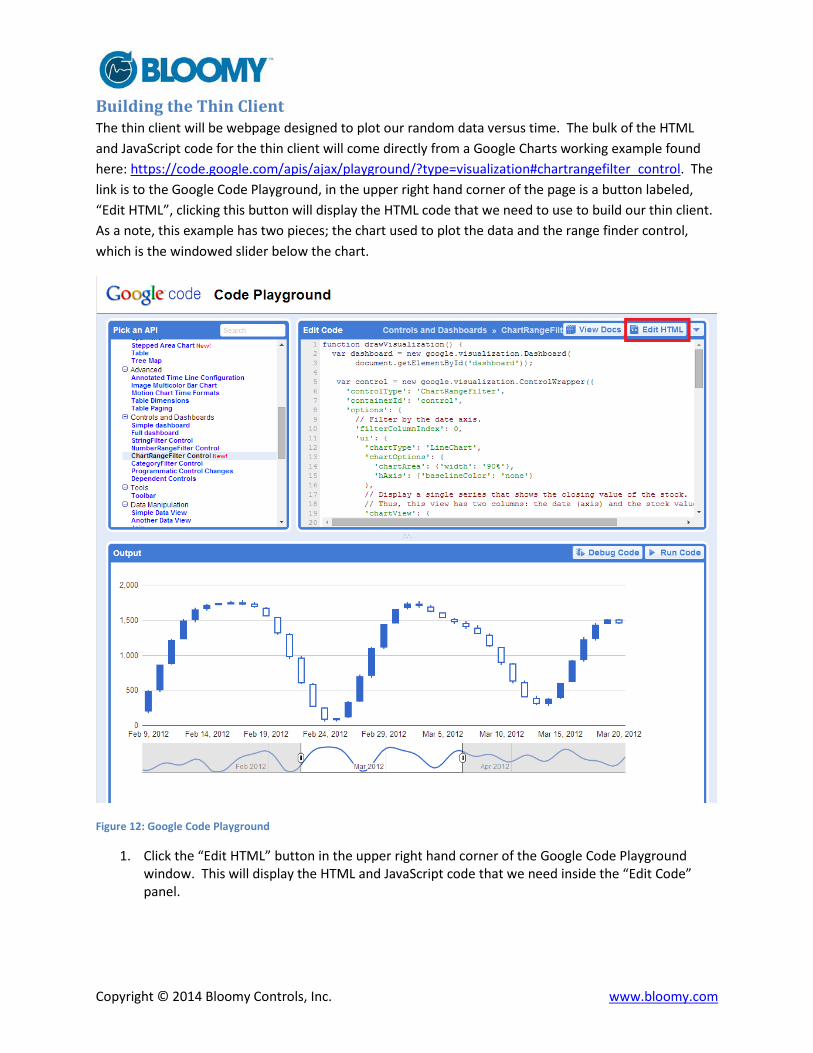
Building the Thin Client The thin client will be webpage designed to plot our random data versus time. The bulk of the HTML and JavaScript code for the thin client will come directly from a Google Charts working example found here: https://code.google.com/apis/ajax/playground/?type=visualization#chartrangefilter_control. The link is to the Google Code Playground, in the upper right hand corner of the page is a button labeled, “Edit HTML”, clicking this button will display the HTML code that we need to use to build our thin client. As a note, this example has two pieces; the chart used to plot the data and the range finder control, which is the windowed slider below the chart.
Figure 12: Google Code Playground
1. Click the “Edit HTML” button in the upper right hand corner of the Google Code Playground window. This will display the HTML and JavaScript code that we need inside the “Edit Code” panel.
Copyright © 2014 Bloomy Controls, Inc. www.bloomy.com

2. Highlight the HTML code in the “Edit Code” panel and copy it to your clipboard.
Figure 13: Highlight HTML
Copyright © 2014 Bloomy Controls, Inc. www.bloomy.com

3. Open Sublime Text and paste the HTML code into the editor. The syntax highlighting won’t kick
in until the document has been saved as an HTML file.
Figure 14: HTML in Sublime Text
4. Within Sublime Text go to File>>Save, and save the file as …\Google Charts Example\Web Service\dist\static\Google Charts.html. Once Sublime Text knows it is working with an HTML document it will turn syntax highlighting on.
Figure 15: Google Charts.HTML
5. At this point we can add this file as a public document to our LabVIEW Web Service. The main benefit to doing this now is that you can see that we can view a rendered version of this HTML document in a web browser as published by our LabVIEW Web Service. Go to the LabVIEW
Copyright © 2014 Bloomy Controls, Inc. www.bloomy.com

project and right click on the GoogleCharts web service and select Add Public Content Folder.
Figure 16: Add Public Content Folder
In the popup file path browser, navigate to …\Google Charts Example\Web Service\dist\static\, and select the static folder as your public content folder. Your project explorer should now look like Figure 17: Populated Public Content Folder.
Figure 17: Populated Public Content Folder
Copyright © 2014 Bloomy Controls, Inc. www.bloomy.com

6. We can publish the GoogleCharts web service by right-clicking on the GoogleCharts web service
and selecting Start. It will take a few seconds start the web service and window will popup telling you that the web service is being published.
Figure 18: Start Web Service
Figure 19: Web Service Starting Dialog
7. Now that the web service has been started, within the LabVIEW project under My Computer>>Google Charts>>Public Content right-click on Google Charts.html and select “Show
Copyright © 2014 Bloomy Controls, Inc. www.bloomy.com

Public URL…”
Figure 20: Show Public URL
8. When the Public Content URL window popup click on the “Copy URL” button to copy the URL to the clipboard
Figure 21: Public Content URL
Copyright © 2014 Bloomy Controls, Inc. www.bloomy.com

9. Open a web browser, I am using Google Chrome, and paste the URL in the address bar. If all
went well, you should be seeing the Google Chart.html file
Figure 22: Thin Client
At this point we have our web service serving up web pages for us; the next step is to have the thin client visualize the data that we are storing in our database.
Copyright © 2014 Bloomy Controls, Inc. www.bloomy.com

Updating the Data Source If we take a look at our HTML code in Sublime Text you will see that the HTML code generates dummy data every time the webpage gets rendered (take a look at line 76). Our goal is to have the webpage display real data acquired by our LabVIEW application. To accomplish this goal we will have our Google Chart render with data from a JSON file being stored on the server. We will also need to write a Web Resource method that will populate that JSON file with the latest data from our database when invoked, for our purposes we can invoke the Web Resource method by button press.
1. The first step is to create a Web Resource as part of our Web Service. Within the LabVIEW project, right-click on the Web Resources folder in the GoogleCharts web service and select “New VI”.
Figure 23: New VI
2. Save the VI as Random.vi, the name is important as we will be referencing this VI as a web resource in our HTML code. Save the VI in the following location: …\Google Charts
Copyright © 2014 Bloomy Controls, Inc. www.bloomy.com

Example\Web Service\Web Resources.
3. Add code to Random.vi to query the SQLite database to return all random data, format it as a
JSON string, and save the JSON string to file. You will find the subVI’s in the sample code directory named “Format Data as JSON.vi” and “Save JSON File.vi” located at …Google Charts Example\Web Service\Private. You may need to stop your Web Service if it is still running; you can do this by right-clicking on the GoogleCharts Web Service and selecting Stop.
Figure 24: Random.vi Block Diagram
4. Now that we have created a web resource method that will build a JSON file with the data the Google Chart will plot we need to update our HTML document to include a way to call it. Open Google Chart.html in Sublime Text and scroll down to line 99, this is where the body of the
Copyright © 2014 Bloomy Controls, Inc. www.bloomy.com

HTML document starts. Right now the body of the document is made up of one division, and within that division are the Google Chart and the Range Finder control. We are going to add a new division and add a button to that new division that will trigger our web resource method to fire when pressed.
Figure 25: HTML Document Body
5. Copy and paste the following HTML code at line 101 in the HTML document.
6. Your HTML document should now look like Figure 26: HTML with Button
Figure 26: HTML with Button
7. A quick sidebar on what the new HTML code in Figure 26: HTML with Button is doing. a. Line 101 is creating a new division in the body of the HTML document where we will
place our button. b. Line 102 is creating an HTML form; forms are used for capturing user input. The
“method” attribute is used to specify an HTTP method to use when sending form data, and the “action” attribute is used to specify where to send the form data when a form is submitted. These attributes allow us to call web resource Random.vi.
<div class="container"> <form method="GET" action="/GoogleCharts/Random" role="form"> <button type="submit" class="btn btn-info btn-sm" name="Random" value="random">Get Data</button> </form> </div>
Copyright © 2014 Bloomy Controls, Inc. www.bloomy.com

c. Line 103 is creating a button. The “type” attribute dictates that we are using a “submit”
button. A submit button is used to send form data to a server, in this case to the web resource method specified in the “action” attribute from line 102.
d. For more information visit www.w3schools.com/html.
8. Now it is time to test. We can add a One Button Dialog to the block diagram of our Random.vi Web Resource method, which will provide feedback that the button press on the thin client triggered the Web Resource HTTP method to fire. This test will also validate that we are able to generate a JSON file based on the data in our SQLite database, and save that file to disk. We have not yet changed the source of data for the chart in our HTML code so it should still display randomly generated data. You may need to stop your Web Service if it is still running; you can do this by right-clicking on the GoogleCharts Web Service and selecting Stop.
Figure 27: One Button Dialog Box
Copyright © 2014 Bloomy Controls, Inc. www.bloomy.com

9. Ensure that your Web Service is started, enter the public URL to the HTML document in a web
browser, and you should see the thin client with the new “Get Data” button in the upper left hand corner. If you don’t see the button, make sure that your HTML document was saved to disk after the previous changes were made.
Figure 28: Thin Client with Button
10. When you press the “Get Data” button, the Web Resource method will run triggering the One Button Dialog message from LabVIEW. We should also now have a JSON file named data.json saved to … \Google Charts Example\Web Service\dist\static\json.
Figure 29: Popup Dialog
11. At this point, go ahead and delete the One Button Dialog from the Random.vi Web Resource.
Copyright © 2014 Bloomy Controls, Inc. www.bloomy.com

12. The last thing that we need to do is change the data source for the chart from randomly generated data to data served up from the data.json file. We will need to go through the HTML code we pulled from Google Code Playground and customize it along the way.
13. The JavaScript code for the chart starts on line 17 and ends on line 97. Lines 22 through 45 define the Range Finder control and can be left as is with two exceptions. Line 37 defines the series of JSON data to be displayed within the Range Finder control, it is stating the Range Finder should use columns 0 and 3 from the JSON data, where column 0 is the X axis and column 3 is the Y axis. Our dataset only has two columns, column 0 is DateTime and column 1 is Random data. We need to update line 37 to reflect our dataset, it should look like this: 'columns': [0, 1]. The second exception is on line 44. Line 44 dictates the start and end dates to be used for the dataset being displayed. We do not know the start and end dates for our dataset, so we can comment this line out by placing a “//” to the left of the code.
Figure 30: Updated Range Finder JavaScript
14. Lines 47 through 67 define the chart, comment these lines out by placing a “//” to the left of the code.
Figure 31: Disable Chart Code
Copyright © 2014 Bloomy Controls, Inc. www.bloomy.com

15. Copy and paste the following code at line 68:
Figure 32: New Chart Code
var chart; var serverData = $.ajax({ url: 'json/data.json', dataType: 'json', success: function(ServerData) { data = new google.visualization.DataTable(ServerData); chart = new google.visualization.ChartWrapper({ 'chartType': 'LineChart', 'containerId': 'chart', 'options': { // Use the same chart area width as the control for axis alignment. 'chartArea': {'height': '80%', 'width': '90%'}, 'hAxis': {'slantedText': false}, 'vAxis': {'viewWindow': {'min': 0, 'max': 100}}, 'legend': {'position': 'none'} }, }); dashboard.bind(control, chart); dashboard.draw(data); } });
Copyright © 2014 Bloomy Controls, Inc. www.bloomy.com

This new code changes the chart type to LineChart on line 76, and changes the data source for the chart to the JSON file located on the server on line 71.
16. Lines 90 through 113 generate random data for the chart to plot. We no longer need this code as we are now pulling the data from the JSON file on the server. Comment out lines 90 through 113 by placing a “//” to the left of the code.
Figure 33: Disabled Random Data Generation Code
17. The last thing that we need to do is include jQuery for AJAX calls, this is necessary because we use an AJAX call on line 70 of the HTML document. To add the library copy and paste the following after line 16: <script src="//ajax.googleapis.com/ajax/libs/jquery/2.0.0/jquery.min.js"></script>
Copyright © 2014 Bloomy Controls, Inc. www.bloomy.com

Figure 34: Include jQuery for AJAX
18. Save the HTML file, ensure that the Web Service is running, copy the Public URL for the HTML document and paste it in a browser and you should see the data from the JSON file plotted on the chart.
Figure 35: Thin Client
Copyright © 2014 Bloomy Controls, Inc. www.bloomy.com

19. At this point if you go back into LabVIEW and run Main.vi you should be able to generate
random data points and display them in your thin client.
Figure 36: Putting it all Together
Recommendations This walk through was intended to get you up and running with LabVIEW Web Services and Google Charts. We covered a small fraction of what is possible with these technologies. To further your learning check out the following links:
• Twitter Bootstrap • jQuery UI • Google Charts • D3 • Chartjs • Highcharts • amCharts • W3 Schools
If you are unsure about any of the content covered in this whitepaper and/or would like a consultation, contact Bloomy using our online Contact form.
About the Author
Jon McBee is a Senior Project Engineer and the Education Development Manager at Bloomy Controls and is a Certified LabVIEW Architect, Certified TestStand Developer, Certified Professional Instructor and a LabVIEW Champion.
Bloomy Controls is a National Instruments Platinum Alliance partner and winner of the “Most Outstanding Technical Resources” award by National Instruments (NI) at NIWeek 2013.
Copyright © 2014 Bloomy Controls, Inc. www.bloomy.com