up department of science and technology - innovation ...€¢ we had to tell the respondents the...
TRANSCRIPT

1
UP Department of Science and Technology -
Innovation Research
Fieldwork Report

Background of the survey:
This survey is part of a nine-country study on the
determinants of innovation at the level of firms.
More particularly, on the characteristics of the firm as well
as on the innovative activities.
The aim of this survey is to provide evidence-based policy
making on innovation and productivity issues so that firms
in South Africa (as a developing country) will profit from
better innovation policy and institutions

Project Timelines:
Slide 3
Original timelines as set-out in the negotiation stage

Project Timelines: Continue
Slide 4
Agreed timelines when initial fieldwork started
Week ending ---->
14-0
3-1
5
14-0
3-2
2
14-0
3-2
9
14-0
4-0
5
14-0
4-1
2
14-0
4-1
9
14-0
4-2
6
14-0
5-0
3
14-0
5-1
0
14-0
5-1
7
14-0
5-2
4
14-0
6-1
6
14-0
6-2
3
14-0
6-3
0
14-0
7-0
7
14-0
7-1
4
14-0
7-2
1
14-0
7-2
8
14-0
8-0
4
14-0
8-1
1
14-0
8-1
8
Acceptance of proposal
Project meeting with project team
Questionnaire design
Training of interviewers
Pilot interviews
Pilot review, relook, changes, evaluation
Pilot interviews
Pilot review, relook, changes, evaluation
Questionnaire sign-off from UP Ethics Department
Re-briefing of Interviewers by the Supervisors
Setting of Appointments
Actual fieldwork
Data file preparation, scanning, coding and proof-reading
Data analysis
Presentation of results- delivery of clean data file

Project Timelines: Continue
Slide 5
Actual realized Timelines
Week beginning ---->
14-0
3-2
2
14-0
3-2
9
14-0
4-0
5
14-0
4-1
2
14-0
4-1
9
14-0
4-2
6
14-0
5-0
3
14-0
5-1
0
14-0
5-1
7
14-0
5-2
4
14-0
6-1
6
14-0
6-2
3
14-0
6-3
0
14-0
7-0
7
14-0
7-1
4
14-0
7-2
1
14-0
7-2
8
14-0
8-0
4
14-0
8-1
1
14-0
8-1
8
14-0
8-2
5
14-0
9-0
1
14-0
9-0
8
14-0
9-1
5
Acceptance of proposal
Project meeting with project team
Questionnaire design
Training of interviewers
Pilot interviews
Pilot review, relook, changes, evaluation
Pilot interviews
Pilot review, relook, changes, evaluation
Questionnaire sign-off from UP Ethics Department
Re-briefing of Interviewers by the Supervisors
Setting of Appointments
Actual fieldwork
Strikes in the Metal & Steel Industry
Data file preparation, scanning, coding and proof-reading
Data analysis
Presentation of results- delivery of clean data file

Sample requirements
Slide 6
Samples was based on the population of companies received from the list provider
Population Sample
TERRITORY SECTORSVery Small (1
- 20)
Small (21 -
50)
Medium (51 -
200)Large (201+)
TOTAL
PER
SECTOR
Automotive 66 29 24 13 132
Chemicals 7 16 5 16 44
Defence 3 4 0 2 9
Food Production 10 29 27 15 81
Pharmaceutical 4 0 0 0 4
Textile 15 18 3 1 37
TOTALS 105 96 59 47 307
Automotive 3 8 6 18 35
Chemicals 0 3 5 6 14
Defence 0 3 0 0 3
Food Production 12 16 24 13 65
Pharmaceutical 1 0 0 0 1
Textile 9 6 3 7 25
TOTALS 25 36 38 44 143
Automotive 160 221 132 110 623
Chemicals 126 213 150 156 645
Defence 20 74 84 81 259
Food Production 223 214 133 134 704
Pharmaceutical 49 62 37 25 173
Textile 33 90 54 64 241
TOTALS 611 874 590 570 2645
Automotive 72 44 20 29 165
Chemicals 4 32 12 26 74
Defence 25 6 6 4 41
Food Production 38 34 28 34 134
Pharmaceutical 3 19 7 6 35
Textile 7 8 13 19 47
TOTALS 149 143 86 118 496
Automotive 68 51 48 37 204
Chemicals 28 84 76 79 267
Defence 0 17 7 9 33
Food Production 58 82 55 70 265
Pharmaceutical 5 7 12 2 26
Textile 100 130 76 64 370
TOTALS 259 371 274 261 1165
Automotive 49 57 32 32 170
Chemicals 15 50 41 77 183
Defence 10 6 13 25 54
Food Production 157 226 161 159 703
Pharmaceutical 8 14 7 2 31
Textile 126 98 48 33 305
TOTALS 365 451 302 328 1446
Western Cape
PE
EL
Kwazulu-Natal
PTA
JHB
TERRITORY SECTORSVery Small (1 -
20)Small (21 - 50)
Medium (51 -
200)Large (201+)
TOTAL
PER
SECTOR
Automotive 2 3 2 0 7
Chemicals 0 2 0 1 3
Defence 0 0 0 0 0
Food Production 1 3 1 0 5
Pharmaceutical 0 0 0 0 0
Textile 1 1 0 0 2
TOTALS 4 9 3 1 17
Automotive 0 1 0 1 2
Chemicals 0 0 0 0 0
Defence 0 0 0 0 0
Food Production 2 5 2 0 9
Pharmaceutical 0 0 0 0 0
Textile 1 1 0 0 2
TOTALS 3 7 2 1 13
Automotive 12 30 5 2 49
Chemicals 11 20 5 1 37
Defence 1 6 4 1 12
Food Production 12 30 5 2 49
Pharmaceutical 2 5 4 1 12
Textile 2 8 5 2 17
TOTALS 40 99 28 9 176
Automotive 7 7 3 2 19
Chemicals 0 5 1 1 7
Defence 4 1 0 0 5
Food Production 4 6 4 2 16
Pharmaceutical 0 5 1 0 6
Textile 2 1 3 1 7
TOTALS 17 25 12 6 60
Automotive 2 5 2 1 10
Chemicals 1 5 2 1 9
Defence 0 1 0 0 1
Food Production 5 8 3 1 17
Pharmaceutical 0 1 2 0 3
Textile 9 17 3 1 30
TOTALS 17 37 12 4 70
Automotive 5 6 2 2 15
Chemicals 1 6 2 2 11
Defence 1 1 2 1 5
Food Production 17 44 18 3 82
Pharmaceutical 0 2 1 0 3
Textile 16 28 3 2 49
TOTALS 40 87 28 10 165
Western Cape
PE
EL
Kwazulu-Natal
PTA
JHB

Sample requirements cont.
Slide 7
Sample Required Sample CompletedTERRITORY SECTORS
Very Small (1 -
20)
Small (21 -
50)
Medium (51 -
200)Large (201+)
TOTAL PER
SECTOR
Automotive 0 1 0 0 1
Chemicals 0 0 0 0 0
Defence 0 0 0 0 0
Food Production 6 1 0 0 7
Pharmaceutical 0 0 0 0 0
Textile 3 0 0 0 3
TOTALS 9 2 0 0 11
Automotive 0 1 0 0 1
Chemicals 0 0 0 0 0
Defence 0 0 0 0 0
Food Production 2 0 0 0 2
Pharmaceutical 0 0 0 0 0
Textile 1 0 0 0 1
TOTALS 3 1 0 0 4
Automotive 12 24 7 3 46
Chemicals 12 14 4 1 31
Defence 0 8 4 0 12
Food Production 12 27 7 4 50
Pharmaceutical 2 4 2 0 8
Textile 3 9 5 2 19
TOTALS 41 86 29 10 166
Automotive 5 8 5 1 19
Chemicals 1 3 2 0 6
Defence 4 1 0 0 5
Food Production 5 7 4 2 18
Pharmaceutical 2 2 2 0 6
Textile 4 4 3 0 11
TOTALS 21 25 16 3 65
Automotive 2 6 1 1 10
Chemicals 1 3 1 1 6
Defence 0 1 0 0 1
Food Production 5 8 1 1 15
Pharmaceutical 0 2 0 0 2
Textile 9 14 1 0 24
TOTALS 17 34 4 3 58
Automotive 8 9 2 3 22
Chemicals 4 10 2 2 18
Defence 2 1 2 1 6
Food Production 17 44 18 5 84
Pharmaceutical 0 2 1 0 3
Textile 16 30 12 2 60
TOTALS 47 96 37 13 193
Western Cape
PE
EL
JHB
PTA
Kwazulu-Natal

Sample requirements cont.
Slide 8
Populations is representative of the Manufacturing population of South Africa
Sample allocation based on the percentage per Region & SIC Classification
Sample realization therefore is representative of the Manufacturing Companies in
South Africa

Fieldwork Process
Slide 9
• Training was done in all Regions face-to-face during the weeks 29th of March 2014
to the 5th of April 2014
• First Pilots was done during the weeks 5th April 2014 to the 19th of April 2014
• First Pilot review, relook, changes, evaluations was done during the weeks of 26th of
April 2014 to the 10th of May 2014
• Second Pilots was done during the weeks of 17th of May 2014 to the 24th of May
2014
• Second Pilot review, relook, changes, evaluations was done during the week of 16th
of June 2014
• Questionnaire sign-off from UP Ethics Department was done during the week of the
16th of June 2014
• Re-briefing of interviewers based on the Pilot feedback was done during the week
of the 23rd of June 2014
• Fieldwork was done during the weeks of 7th of July 2014 to the 1st of September
2014
• Data file preparation, scanning, coding, spellchecking was done during the weeks of
11th of August 2014 to the 1st of September 2014
• Data file cleaning and cross tabulation analysis was done during the weeks of 8th of
September 2014 to the 15th of September
Fieldwork challenges
Slide 10
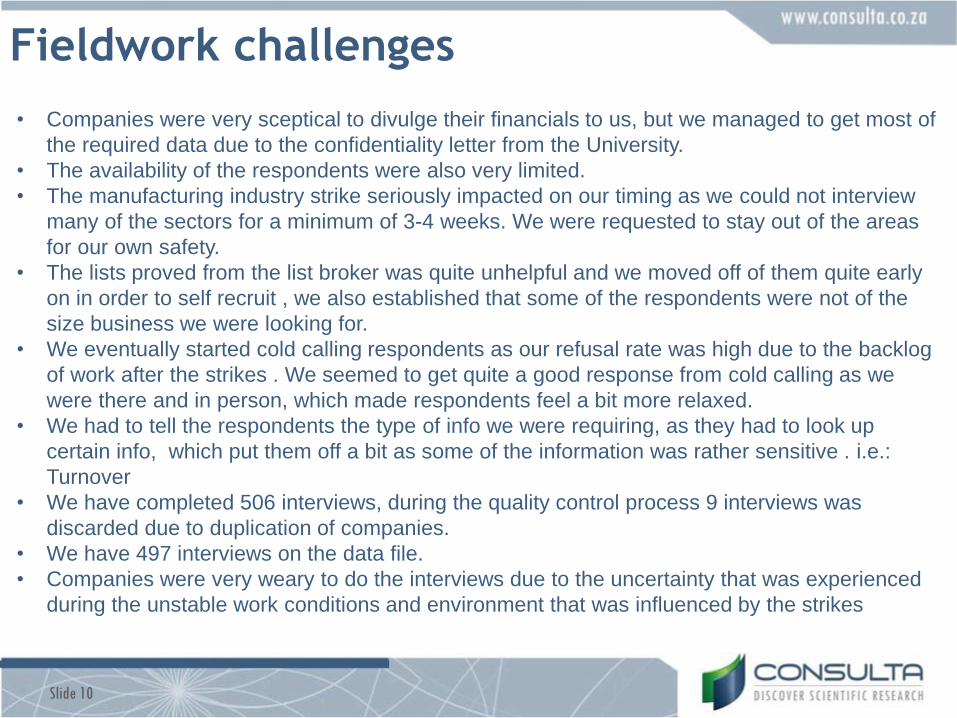
• Companies were very sceptical to divulge their financials to us, but we managed to get most of
the required data due to the confidentiality letter from the University.
• The availability of the respondents were also very limited.
• The manufacturing industry strike seriously impacted on our timing as we could not interview
many of the sectors for a minimum of 3-4 weeks. We were requested to stay out of the areas
for our own safety.
• The lists proved from the list broker was quite unhelpful and we moved off of them quite early
on in order to self recruit , we also established that some of the respondents were not of the
size business we were looking for.
• We eventually started cold calling respondents as our refusal rate was high due to the backlog
of work after the strikes . We seemed to get quite a good response from cold calling as we
were there and in person, which made respondents feel a bit more relaxed.
• We had to tell the respondents the type of info we were requiring, as they had to look up
certain info, which put them off a bit as some of the information was rather sensitive . i.e.:
Turnover
• We have completed 506 interviews, during the quality control process 9 interviews was
discarded due to duplication of companies.
• We have 497 interviews on the data file.
• Companies were very weary to do the interviews due to the uncertainty that was experienced
during the unstable work conditions and environment that was influenced by the strikes

Interviewer Quality
Slide 11
InterviewerQnre
done
Check
backs done
Interviewer
scoreInterviewer
Qnre
done
Check
backs
done
Intervie
wer
score
Anna Du Toit 7 2 95.00 Leonora Tressidor 32 9 84.44
Annamarie van Graan 7 4 86.00 Liandra Meyer 3 1 80.00
Barbara Pick 21 8 77.14 Linda Hartzer 23 5 82.00
Brenda Hudges 15 5 86.00 Lumka Qunta 56 8 87.50
Clive Henning 3 1 70.00 Mariam Hanif 11 4 97.50
Comien Jordaan 10 4 73.50 Mzuyanda Fundani 41 6 85.00
Desree Subramoney 8 2 100.00 Noelene Ikin 4 1 70.00
Elaine De Jager 6 2 85.00 Nomathandazo Adonisi 33 7 82.86
Gert Kotze 1 1 100.00 Rachel Sokana 20 5 71.00
Gloria Ngcongo 18 3 96.67 Reginald Maringa 3 1 80.00
Hannerie van Tonder 39 8 87.00 Renee Stander 2 1 80.00
Helena Nel 8 1 80.00 Riaan Behr 8 1 90.00
Jane West 18 4 85.00 Talitha Carney 33 8 88.75
Kittie de hart 23 7 82.86 Thabisa Mthomde 28 8 80.80
Zandra Coetzee 16 4 70.00
SAMRA requirement is 10% check backs, we did 24%
