u–pb geochronological evidence for devonian deformation ... · u–pb geochronological evidence...
TRANSCRIPT

Current Research (2006) Newfoundland and Labrador Department of Natural ResourcesGeological Survey, Report 06-1, pages 45-60
U–Pb GEOCHRONOLOGICAL EVIDENCE FOR DEVONIANDEFORMATION AND GOLD MINERALIZATION IN THE
EASTERN DUNNAGE ZONE, NEWFOUNDLAND
V.J. McNicoll, G.C. Squires1, R.J. Wardle2, G R. Dunning3 and B.H.O’Brien2
Geochronology Laboratory, Geological Survey of Canada, 601 Booth St. Ottawa, ON K1A 0E8
ABSTRACT
New U–Pb age determinations from the eastern Dunnage Zone provide evidence for periods of Early and Late Devoniandeformation and also constrain the age of epithermal and mesothermal gold mineralization. Uranium–lead SHRIMP ages of41l ± 5 and 381 ± 5 Ma from mafic dykes that intrude the Indian Islands Group indicate that unit to be no younger than ca.406 Ma (compatible with fossil evidence for an Early Devonian minimum age) and to have been deformed in Early Devonianand Late Devonian times. Uranium–lead TIMS crystallization ages of 413 ± 2 and 411 ± 1.4 Ma from syntectonic, gneissicgranodiorite and massive crosscutting granodiorite phases of the Long Island pluton respectively, bracket an Early Devonianepisode of deformation. The Early Devonian deformation seems to have been focussed along the boundaries of the DunnageMélange and the northern and southern margins of the Silurian-deformed Botwood Group. The Late Devonian deformationis restricted to south of the Dog Bay Line and may mark a distal effect of the Acadian deformation in the Gander and Avalonzones to the east. The Dog Bay Line therefore marks an important contrast in age of deformation in the northeast DunnageZone.
At least some of the gold mineralization north of the Dog Bay Line appears to be associated with the Early Devonian plu-tonic rocks, however, the mesothermal gold mineralization south of the Dog Bay Line is at least, locally, Late Devonian oryounger. The epithermal mineralization in this area is also likely to be Late Devonian or younger.
INTRODUCTION
The eastern Dunnage Zone of northeast Newfoundlandcontains a number of epithermal and mesothermal goldoccurrences. These have been the subject of extensiveexploration in recent years but little is known about theirage. Some preliminary U–Pb dating was undertaken in 1993in conjunction with regional mapping by the GeologicalSurvey of Newfoundland and Labrador (O’Brien, 2003) toprovide constraints on the age of deformation and gold min-eralization. Additional samples were collected during ametallogenic study in 2004 (Squires, 2005) and preliminaryages reported by McNicoll (2005). The purpose of this paperis to present the final results for these samples and to discusstheir regional tectonic and metallogenic implications.
REGIONAL GEOLOGY
Northeast Newfoundland is divided into the Dunnage,Gander and Avalon zones (Figure 1) that collectively repre-sent the eastern side of the Lower Paleozoic AppalachianOrogen. The Dunnage Zone is divided by the Red IndianLine (Figure 2), which marks the fundamental Iapetansuture separating the peri-Laurentian Notre Dame Subzoneto the west from the peri-Gondwanan Exploits Subzone tothe east. The Exploits Subzone consists of Cambro-Ordovi-cian magmatic arc-related sequences and is divided into twosegments by the Dog Bay Line (a series of faults and shearzones, Williams et al., 1993). Both segments are overlain bysediment-dominated overstep sequences that range fromLate Ordovician to Early Devonian. The sequential destruc-
45
1Messina Minerals Incorporated, 2300-1066 West Hastings Street, Vancouver, BC, V6E 3X2
2Geological Survey, Newfoundland and Labrador Department of Natural Resources, P.O. Box 8700, St. John’s, NL, A1B 4J6
3Department of Earth Sciences, Memorial University of Newfoundland, St. John’s, NL, A1B 3X5

CURRENT RESEARCH, REPORT 06-1
tion of these synorogenic overstep basins records the termi-nal closure of the Iapetus Ocean.
The position of the Dog Bay Line has been redefined byDickson ( this volume) and for the purposes of this paper, isdefined as the faulted, northwestern boundary of the IndianIslands Group on Figure 2, where in its inland extent, itcoincides with the Reach Fault.
North of the Dog Bay Line, the Exploits Subzone con-sists predominantly of lower to middle Ordovician volcanicand associated sedimentary rocks, including the DunnageMélange, and Exploits Group, which formed in island-arcand subduction-zone environments, overlain by a blanket ofUpper Ordovician (Caradocian) black shale and chert. TheDunnage Mélange and its correlatives are a highly tec-tonized olistostromal unit of Middle Ordovician and olderrocks that occur east and west of the Dog Bay Line(Williams et al., 1993). The mélange and the Caradoc shaleare generally conformably overlain by a shallowing-upwardsequence of turbidites and arc-derived conglomeratesassigned to the Late Ordovician–Early Silurian BadgerGroup. This group is, in turn, conformably to discon-formably overlain (Williams, 1993; Williams et al., 1993)by the Silurian Botwood Group, a series of mafic and felsicvolcanic rocks overlain by grey sandstones and terrestrialred sandstones. The Botwood Group is locally uncon-
formably overlain by the latest Silurian Stony Lake Forma-tion volcanic rocks (423 +3/-2 Ma, Dunning et al., 1990).
In the Bay of Exploits, the Dunnage Mélange, Exploits,Badger and Botwood groups are intruded by the Long Islandand Loon Bay granitic plutons (Figure 3). The Loon Baypluton has been dated as Early Devonian (408 ± 2 Ma; Elliotet al., 1991) and correlated with the compositionally similarLong Island pluton, which, in turn, has been correlated witha dyke of unfoliated tonalite dated at 407 ± 3 Ma (Elliot etal., 1991). The Long Island pluton truncates regional foldsand cleavage in the Badger Group (O’Brien, 2003). TheLoon Bay pluton also crosscuts earlier fabric and metamor-phic assemblages in the other Ordovician–Siluriansequences. On the Port Albert Peninsula, immediately westof the Dog Bay Line, Elliot et al. (1991) obtained a 422 ± 2Ma crystallization age from a minor microgranitic intrusionbelonging to a variably sheared and locally altered swarm ofcomposite felsic–mafic dykes that intrude the Wigwam For-mation of the Botwood Group. These Late Silurian intru-sions are reported to crosscut minor structures related to sev-eral phases of regional ductile deformation but have beenthemselves deformed by folds and kink bands coeval withhigh-angle brittle faulting in their host rocks.
South of the Dog Bay Line, the sequence consists ofOrdovician rocks, including parts of the Dunnage Mélange,Duder Group (described as mostly mélange by Currie, 1997)and Early to Late Ordovician Davidsville Group shales andarc-derived turbidites. These are conformably overlain bythe Indian Islands Group, which consists of a shallowing-upward sequence of grey to red marine shales and calcare-ous siltstones (Williams et al. , 1993; Dickson this volume).On the basis of fossil evidence (Boyce et al., 1993) the Indi-an Islands Group ranges from Early Silurian (Llandovery) tolatest Silurian–Early Devonian (Prídolí to Gedinnian), how-ever, on the basis of recent work (Boyce and Dickson, thisvolume) the bulk of the unit is of Wenlock-Ludlow age. Thedistribution of the Indian Islands Group as shown on Figure2 is after Dickson (this volume) who has redefined its extentfrom the earlier work of Williams et al. (1993).
An important plutonic feature of the area is the MountPeyton Intrusive Suite, which forms an elliptical mass ofgabbros and granites north of the Dog Bay Line (Figure 2).A gabbro phase of the suite has given a U–Pb zircon TIMSage of 424 ± 2 Ma (Dunning, 1992, 1994). O’Driscoll andWilton (2005) have reported a number of LAM-ICP-MSages from the Mount Peyton Intrusive Suite and some smallplutons intrusive into the Indian Islands Group that havebeen interpreted by O’Driscoll and Wilton (op. cit.) to definea 430 to 424 Ma period of magmatism. On this basis, theMount Peyton Intrusive Suite is no younger than Late Sil-urian and should predate the Indian Islands Group, given
46
Figure 1. Tectonic zones of Newfoundland. Location of thestudy area is outlined in red and shown in more detail inFigure 2.

V.J. McNICOLL, G.C. SQUIRES, R.J. WARDLE, G.R. DUNNING AND B.H. O’BRIEN
that the latter is potentially as young as Early Devonian.However, this is contradicted by an apparent intrusive rela-tionship between granite of the southwest Mount PeytonIntrusive Suite and the Indian Islands Group (Lake andWilton, this volume), which suggests that parts of the MountPeyton Intrusive Suite are younger than ca. 424 Ma.
AGE OF DEFORMATION
In the northeast Dunnage Zone, north of the Dog BayLine, most stratified units display at least one phase of slatycleavage and have been affected by low-grade metamor-phism. The Silurian rocks of the Botwood Group experi-
47
Figure 2. Generalized geology of the northeast Dunnage and Gander zones, modified after Dickson (this volume) , and show-ing U–Pb geochronology sample sites and gold occurrences.

CURRENT RESEARCH, REPORT 06-1
enced regional deformation prior to intrusion of the 424 ± 2Ma Mount Peyton Intrusive Suite and eruption of the 423+3/-2 Ma Stony Lake Formation. Deformation was thus pre-dominantly Mid- to Late Silurian and related to the SalinicOrogeny (Dunning et al., 1990) of ca. 455 to 423 Ma range(van Staal, 2005). Evidence of a localized younger event onthe north side of the Dog Bay Line is provided by the brit-tle-ductile deformation that affected the 422 ± 2 Ma Siluri-an minor intrusions of the Port Albert Peninsula (see above).South of the Dog Bay Line, the Indian Islands Group wasnot deformed until post-Prídolí to Gedinnian time.
The distinct difference in timing of deformation indi-cates a major tectonic break between the Botwood Group,which was being deformed in the mid-late Silurian (430 to423 Ma) and the Indian Islands Group, which was still beingdeposited. The Dog Bay Line (Williams et al., 1993) andReach Fault (Dickson, this volume) are regarded as the sitesof this break.
REGIONAL GOLD METALLOGENY
The northeast Dunnage Zone contains numerousepithermal and mesothermal gold occurrences (Figure 2;Squires, 2005; O’Driscoll and Wilton, 2005). Evans (1996)has described the mesothermal occurrences as havingformed at shallower depths than normal for this type and tobe transitional between epithermal and “true mesothermal”styles. The epithermal occurrences are low- to intermediate-sulphidation quartz-breccia vein systems. They are foundmostly in the Botwood and Indian Islands groups and, as istypically the case with these systems (e.g., Hedenquist,2000), were probably formed within 1 to 2 km of the earth’ssurface. The age of the epithermal systems must be Silurianor younger and they generally show close proximity to theMount Peyton Plutonic Suite. A key question, therefore, iswhether the mineralization is genetically related to the Sil-urian magmatism (e.g., O’Driscoll and Wilton, 2005) oryounger events.
48
Figure 3. Simplified geological map of the southern Bay of Exploits showing the location of the Long Island and Loon Bayplutons and the geochronology sample sites.

V.J. McNICOLL, G.C. SQUIRES, R.J. WARDLE, G.R. DUNNING AND B.H. O’BRIEN
The mesothermal occurrences are generally late tecton-ic quartz-vein systems hosted by mafic dykes, metasedi-mentary rocks and, locally, felsic dykes and veins. Most ofthe occurrences seem to have formed in the late stages ofregional deformation and are often spatially associated withshear zones. As is typical of mesothermal occurrences, theyare inferred to have formed at deeper crustal levels than theepithermal systems. To date, there have been few constraintson their age in the northeastern Dunnage Zone. However,dating elsewhere in the Dunnage Zone (Evans, 2005 and ref-erences therein) has indicated mineralization ages between437 Ma (Early Silurian) and 374 Ma (Late Devonian).
U–Pb GEOCHRONOLOGY SAMPLING
To constrain the age of deformation and gold mineral-ization, samples were collected from two mafic dykes in theIndian Islands Group; one (CGS-04-54) from the area of theRoad Breccia epithermal gold occurrence, and the other(CGS-04-92) from the Titan mesothermal gold prospect inthe northern part of the Indian Islands Group (Figure 2).
To shed further light on the timing of post-ca. 422 Madeformation west of the Reach Fault and its relationship toDevonian plutonism, samples were collected from thesouthern, highly sheared margin of the Long Island plutonand its complexly deformed amphibolite-facies countryrocks in the Bay of Exploits area (Figure 3). These rocks arewell exposed in coastal sections near the Shoal Tickle of Lit-tle Burnt Bay (O’Brien, 2003). Two samples, one of a gneis-sic granodiorite (93GD01) and one of a crosscutting mas-sive granodiorite (93GD02), were collected.
Sample location information (UTM coordinates) is pro-vided below.
U–Pb ANALYTICAL METHODS
Heavy-mineral concentrates of samples CGS-04-54and 92 were prepared using standard crushing, grinding,Wilfley table, and heavy liquid techniques. Mineral sepa-rates were sorted by magnetic susceptibility using a FrantzTM
isodynamic separator. These samples did not yield much zir-con and many of the grains were of only fair quality, con-taining abundant inclusions and fractures. As a result, in situanalyses of the zircons were performed on the SHRIMP II(Sensitive High Resolution Mass Spectrometer) at the Geo-logical Survey of Canada.
SHRIMP analyses were conducted using analytical pro-cedures described by Stern (1997), and using the standardsand U–Pb calibration methods following Stern and Amelin(2003). Zircons from the Titan Prospect (CGS-04-92;z8429) and the Road Breccia Zone (CGS-04-54; z8430)
gabbro samples were cast in 2.5 cm diameter epoxy mounts(GSC mount #355 for z8429 and GSC mount #350 forz8430) along with fragments of the GSC laboratory standardzircon (z6266, with 206Pb/238U age = 559 Ma). A laboratoryzircon standard, Temora 2, was also analyzed on the twoSHRIMP grain mounts (GSC mounts #355 and #350) withresulting dates of 415.3 ± 4.4 Ma (MSWD=1.4, n=12) and417.8 ± 1.7 Ma (MSWD=1.0, n=12), respectively. The mid-sections of the zircons were exposed using 9, 6, and 1 µmdiamond compound, and the internal features of the zirconswere characterized with backscatter electrons (BSE) utiliz-ing a Cambridge Instruments scanning electron microscope(SEM). Mount surfaces were evaporatively coated with 10nm of high purity Au. Analyses were conducted using an 16O-
primary beam, projected onto the zircons at 10 kV. The sput-tered area used for analysis was ca. 25 µm in diameter andhaving a beam current of ca. 9 nA and 6 nA for z8429 andz8430, respectively. The count rates of ten isotopes of Zr+,U+, Th+, and Pb+ in zircon were sequentially measured over7 scans with a single electron multiplier and a pulse-count-ing system with deadtime of 35 ns. Off-line data processingwas accomplished using customized in-house software. The1F external errors of 206Pb/238U ratios reported in Table 1incorporate a ± 1.0 % error in calibrating the standard zircon(see Stern and Amelin, 2003). No fractionation correctionwas applied to the Pb-isotope data; common Pb correctionutilized the measured 204Pb/206Pb and compositions modelledafter Cumming and Richards (1975). The 206Pb/238U ages forthe analyses have been corrected for common Pb using boththe 204- and 207-methods (Stern, 1997), but there is gener-ally no significant difference in the results (Table 1). Isoplotv. 2.49 (Ludwig, 2001) was used to generate the U–Pb con-cordia diagrams where data are plotted with errors at the 2Flevel (see e.g., Figures 5 and 8). Concordia ages (Ludwig,1998) are calculated for the samples presented herein. TheseConcordia ages incorporate errors on the decay constantsand include both an evaluation of concordance and an eval-uation of equivalence of the data. The calculated Concordiaages and errors quoted in the text are at 2F with decay-con-stant errors included.
Samples 93GD01 and 93GD02, collected for U–PbTIMS dating, were processed and analyzed at MemorialUniversity using the methods described in Dubé et al.(1996). Both samples yielded large amounts of simple euhe-dral prismatic zircon. The highest quality, clearest, euhedralgrains were selected for analysis and some were abraded.Zircon fractions were washed in distilled HNO3, doubly dis-tilled H2O, and then distilled acetone, prior to weighing on amicrobalance and loading in Krogh-type TEFLON dissolu-tion bombs. A mixed 205Pb/235U tracer was added in propor-tion to the sample weight, along with ca. 20 drops distilledHF and 1 drop HNO3, then the bomb was sealed and placedin an oven at 210°C for 5 days. Ion exchange chemistry was
49

CURRENT RESEARCH, REPORT 06-1
50
Tab
le 1
.Ura
nium
–lea
d SH
RIM
P an
alyt
ical
dat
a fo
r sa
mpl
es C
GS-
04-5
4 (R
oad
Bre
ccia
) an
d C
GS-
04-9
2 (T
itan
pros
pect
)
Age
s (M
a)1
Age
s (M
a)2
Spot
UTh
ThPb
*20
4 Pb
204 P
b±20
4 Pb
208 P
b±20
8 Pb
207 P
b±20
7 Pb
206 P
b±20
6 Pb
Cor
r20
7 Pb
±207 P
b20
6 Pb
±206 P
b20
7 PB
±207 P
b20
6 Pb
±206 P
bna
me
(ppm
)(p
pm)
U(p
pm)
(ppb
)20
6 Pb
206 P
bf(
206)
204
206 P
b20
6 Pb
235 U
235 U
238 U
238 U
Coe
ff20
6 Pb
206 P
b23
8 U23
8 U20
6 Pb
206 P
b23
8 U23
8 U
"Roa
d B
recc
ia Z
one
Gab
bro
Dyk
e: C
GS-
04-5
4 (z
8430
); U
TM
zon
e 21
, NA
D 2
7, 6
5049
4E -
542
4541
Nn
± 10
m"
8430
-4.1
164
790.
496
119
0.00
0962
0.00
0217
0.01
670.
1399
0.00
920.
4553
0.03
480.
0657
0.00
130.
367
0.05
030.
0036
410
820
817
541
28
8430
-5.1
7944
0.58
26
40.
0007
930.
0004
320.
0138
0.18
630.
0177
0.50
220.
0653
0.06
600.
0014
0.28
30.
0552
0.00
6941
28
421
308
411
884
30-7
.111
051
0.48
27
110.
0016
820.
0003
390.
0292
0.13
950.
0145
0.42
100.
0533
0.06
500.
0013
0.27
70.
0470
0.00
5840
68
4926
940
98
8430
-8.1
7331
0.43
45
60.
0013
670.
0004
150.
0237
0.14
080.
0169
0.54
720.
0663
0.06
610.
0015
0.31
00.
0601
0.00
7041
29
606
273
410
984
30-1
2.1
9137
0.42
46
60.
0012
130.
0003
820.
0210
0.14
190.
0184
0.48
950.
0604
0.06
630.
0014
0.29
50.
0536
0.00
6441
49
352
294
414
884
30-1
1.1
175
830.
488
128
0.00
0773
0.00
0238
0.01
340.
1573
0.00
990.
5209
0.03
930.
0665
0.00
130.
379
0.05
680.
0040
415
848
516
441
48
8430
-10.
176
380.
516
57
0.00
1582
0.00
0578
0.02
740.
1767
0.02
290.
5614
0.08
820.
0669
0.00
150.
267
0.06
090.
0093
417
963
636
841
48
8430
-11.
212
470
0.57
89
90.
0012
300.
0003
100.
0213
0.17
810.
0128
0.51
670.
0487
0.06
650.
0014
0.34
10.
0563
0.00
5041
58
465
211
414
884
30-1
2.2
130
760.
603
97
0.00
0917
0.00
0258
0.01
590.
2012
0.01
100.
5148
0.04
070.
0654
0.00
130.
364
0.05
710.
0042
408
849
617
340
78
8430
-8.2
7642
0.56
85
110.
0024
960.
0004
520.
0433
0.15
540.
0202
0.41
690.
0674
0.06
460.
0013
0.24
60.
0468
0.00
7440
48
3942
940
77
"Tita
n Pr
ospe
ct G
abbr
o D
yke:
CG
S-04
-92
(z84
29);
UT
M z
one
21, N
AD
27,
675
730E
- 5
4655
23N
± 1
0m"
8429
-7.1
106
380.
373
69
0.00
1697
0.00
0307
0.02
940.
1076
0.01
340.
4228
0.04
450.
0585
0.00
130.
327
0.05
240.
0053
367
830
324
636
78
8429
-20.
194
380.
420
611
0.00
2097
0.00
0362
0.03
630.
1308
0.01
470.
4863
0.05
260.
0605
0.00
100.
272
0.05
840.
0061
378
654
324
837
76
8429
-40.
195
610.
663
65
0.00
1047
0.00
0262
0.01
820.
2101
0.01
570.
4932
0.03
840.
0610
0.00
110.
346
0.05
870.
0043
382
755
416
938
06
8429
-54.
118
190
0.51
511
110.
0011
890.
0003
530.
0206
0.15
420.
0149
0.44
990.
0503
0.06
120.
0013
0.30
50.
0533
0.00
5738
38
342
263
383
784
29-1
8.1
119
840.
734
813
0.00
1954
0.00
0305
0.03
390.
2018
0.01
470.
4148
0.04
340.
0614
0.00
100.
272
0.04
900.
0050
384
614
922
238
46
8429
-51.
111
985
0.73
78
40.
0006
580.
0003
790.
0114
0.23
010.
0153
0.48
300.
0536
0.06
160.
0011
0.28
70.
0569
0.00
6138
57
487
256
386
684
29-4
1.1
7134
0.49
45
70.
0017
150.
0003
520.
0297
0.14
600.
0146
0.44
050.
0526
0.06
230.
0016
0.32
90.
0513
0.00
5839
09
254
254
391
984
29-5
2.1
9644
0.47
56
50.
0010
040.
0003
770.
0174
0.13
280.
0150
0.44
550.
0552
0.06
480.
0011
0.25
80.
0498
0.00
6040
57
188
259
406
684
29-4
7.1
9245
0.50
96
60.
0012
420.
0004
570.
0215
0.15
670.
0204
0.49
840.
0701
0.06
510.
0011
0.24
30.
0556
0.00
7640
67
434
340
406
784
29-5
6.1
155
940.
626
118
0.00
0869
0.00
0183
0.01
510.
2030
0.00
840.
5208
0.02
960.
0653
0.00
110.
416
0.05
790.
0030
408
752
511
940
75
8429
-42.
186
360.
432
65
0.00
1023
0.00
0302
0.01
770.
1447
0.01
230.
5500
0.04
600.
0656
0.00
090.
287
0.06
080.
0049
409
663
318
440
76
8429
-5.1
7234
0.48
65
40.
0009
060.
0003
500.
0157
0.16
900.
0169
0.56
340.
0544
0.06
610.
0012
0.31
10.
0619
0.00
5741
27
669
211
409
784
29-8
.110
560
0.58
67
50.
0007
480.
0002
060.
0130
0.19
000.
0090
0.50
860.
0360
0.06
620.
0009
0.30
50.
0557
0.00
3841
35
440
159
413
584
29-4
9.1
144
630.
449
101
0.00
0147
0.00
0113
0.00
260.
1498
0.00
530.
5396
0.02
150.
0665
0.00
080.
423
0.05
880.
0021
415
556
181
413
584
29-1
.194
470.
517
73
0.00
0578
0.00
0216
0.01
000.
1604
0.01
030.
5396
0.03
430.
0667
0.00
080.
308
0.05
870.
0036
416
555
513
941
55
8429
-2.1
9340
0.43
76
50.
0008
700.
0002
050.
0151
0.13
120.
0087
0.48
500.
0326
0.06
700.
0008
0.29
80.
0525
0.00
3441
85
307
154
419
584
29-4
6.1
106
480.
468
87
0.00
1099
0.00
0307
0.01
900.
1511
0.01
240.
5634
0.04
890.
0681
0.00
100.
292
0.06
000.
0050
424
660
519
242
26
8429
-12.
118
784
0.46
513
60.
0005
400.
0001
580.
0094
0.14
510.
0097
0.52
600.
0258
0.06
810.
0008
0.35
60.
0561
0.00
2642
55
454
106
424
584
29-5
0.1
309
620.
206
228
0.00
0417
0.00
0073
0.00
720.
0539
0.00
380.
5390
0.01
490.
0750
0.00
080.
489
0.05
210.
0013
466
529
157
467
584
29-1
4.1
178
980.
566
144
0.00
0374
0.00
0152
0.00
650.
1787
0.00
770.
5764
0.02
770.
0753
0.00
090.
367
0.05
550.
0025
468
543
410
446
85
8429
-19.
140
210
30.
265
306
0.00
0245
0.00
0077
0.00
420.
0869
0.00
320.
5976
0.01
560.
0753
0.00
080.
521
0.05
760.
0013
468
551
350
468
584
29-3
9.1
260
199
0.79
222
70.
0004
120.
0000
740.
0071
0.24
700.
0042
0.58
410.
0164
0.07
560.
0009
0.53
90.
0560
0.00
1347
06
453
5447
05
8429
-55.
121
411
40.
551
224
0.00
0212
0.00
0076
0.00
370.
1679
0.00
380.
8188
0.02
170.
0955
0.00
120.
589
0.06
220.
0013
588
767
947
586
7
Not
es (
see
Ster
n, 1
997)
:
Unc
erta
intie
s re
port
ed a
t 1F
(abs
olut
e) a
nd a
re c
alcu
late
d by
num
eric
al p
ropa
gatio
n of
all
know
n so
urce
s of
err
orf2
0620
4re
fers
to m
ole
frac
tion
of to
tal 20
6 Pb
that
is d
ue to
com
mon
Pb,
cal
cula
ted
usin
g th
e 20
4 Pb-
met
hod;
com
mon
Pb
com
posi
tion
used
is th
e su
rfac
e bl
ank
120
4-co
rrec
ted
ages
; 2
207-
corr
ecte
d ag
es (
Ster
n, 1
997)

V.J. McNICOLL, G.C. SQUIRES, R.J. WARDLE, G.R. DUNNING AND B.H. O’BRIEN
carried out using the procedure of Krogh (1973), with mod-ified columns and reagent volumes scaled down to one tenthof those reported in 1973. The purified Pb and U were col-lected in a clean beaker in a single drop of ultrapure H3PO4.
Lead and uranium were loaded together on outgassedsingle Re filaments with silica gel and dilute H3PO4. Massspectrometry was carried out using a multi-collector MAT262. For most mineral fractions, Pb was measured in staticmode with 204Pb measured in the SEM in ion counting mode.The faraday cups are calibrated with NBS 981 and the ioncounting system is calibrated against a faraday cup by meas-uring a known ratio. Small amounts of Pb are measured bypeak jumping on the ion counter, with measurement timesweighted according to the amounts of each mass present; Uwas measured by static double faraday collection. A seriesof datasets are measured in the temperature range 1400° to1550°C for Pb and 1550 to 1640°C for U, and the best setscombined to produce a mean value for each ratio. The meas-ured ratios are corrected for Pb and U fractionation of0.1%/amu and 0.03%/amu respectively as determined fromrepeat measurements of NBS standards. The ratios are alsocorrected for laboratory procedure blanks (2 to 10picograms - Pb, 1 picogram - U) and for common Pb abovethe laboratory blank, and with Pb of the composition pre-dicted by the two-stage model of Stacey and Kramers (1975)for the age of the sample. Ages are calculated using thedecay constants recommended by Jaffey et al. (1971).
The uncertainties on the isotopic ratios were calculatedusing an unpublished program and are reported at 2F.Sources of uncertainty considered (at 2F) include uncertain-ties on the isotopic ratio measurements by mass spectrome-try, uncertainty on the Pb and U fractionation, assigned 50%uncertainty on the amount of the Pb and U blanks, and a 4%uncertainty on the isotopic composition of the Pb used tosubtract the common Pb present above laboratory blank.These uncertainties are quadratically added to arrive at final2F uncertainties that are reported after the isotopic ratios inthe data table. Ages calculated are the weighted average ofthe 207Pb/206Pb ages using ISOPLOT for these variably dis-cordant data points and uncertainties are reported at the 95%confidence interval.
U–Pb SAMPLES AND RESULTS – SHRIMP DATING
ROAD BRECCIA ZONE (NTS 2D/14, UTM 650494E/5424541N, NAD 27, ZONE 21)
Sample CGS-04-54, a dark green, fine-grained gabbro,was collected from an east-southeast-trending gabbro dykethat intruded cleaved, vertically dipping and north-north-
east-trending calcareous siltstones of the Indian IslandsGroup. The dyke postdates cleavage development in thehost siltstones, but is fractured and cut by some thin quartzveins. A nearby, epithermal quartz-breccia vein containinganomalous gold values and termed the Road Breccia show-ing, strikes parallel to the dyke and also crosscuts beddingand cleavage in the host siltstones. Timing relationshipsbetween the vein and the gabbro dyke could not be deter-mined.
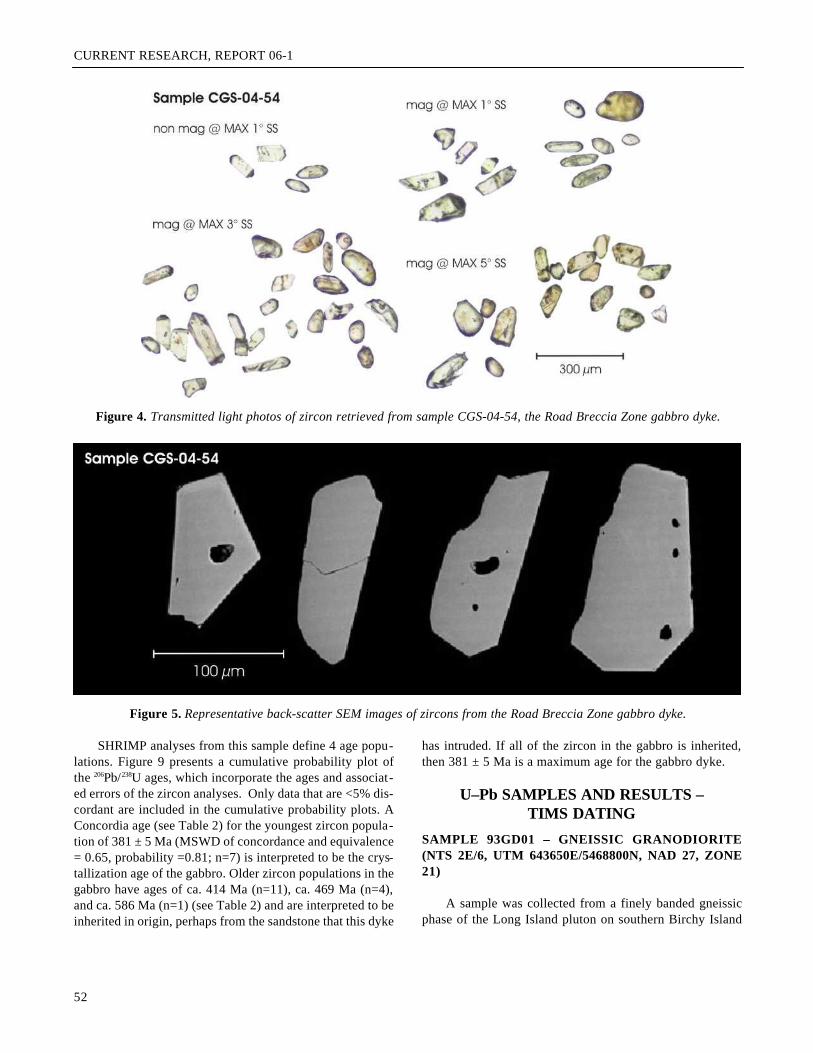
A small number of zircons were retrieved from thissample, composed predominantly of well-faceted grains butalso some rounded ones (Figure 4). A selection of well-faceted, euhedral zircons, most of which contain abundantinclusions, were put on a grain mount for SHRIMP analysis.Figure 5 presents representative back-scatter SEM imagesof zircons from this sample. All of the SHRIMP analysesfrom the gabbro overlap concordia and each other, defininga single age population (Figure 6). A Concordia age, utiliz-ing all of the analyses (Table 2), is calculated to be 411 ± 5Ma (MSWD of concordance and equivalence = 0.44; prob-ability = 0.98; n=10). This Early Devonian date of 411 ± 5Ma is interpreted as the crystallization age of the gabbrodyke.
TITAN PROSPECT (NTS 2E/7; UTM 675730E/5465523N, NAD 27, ZONE 21)
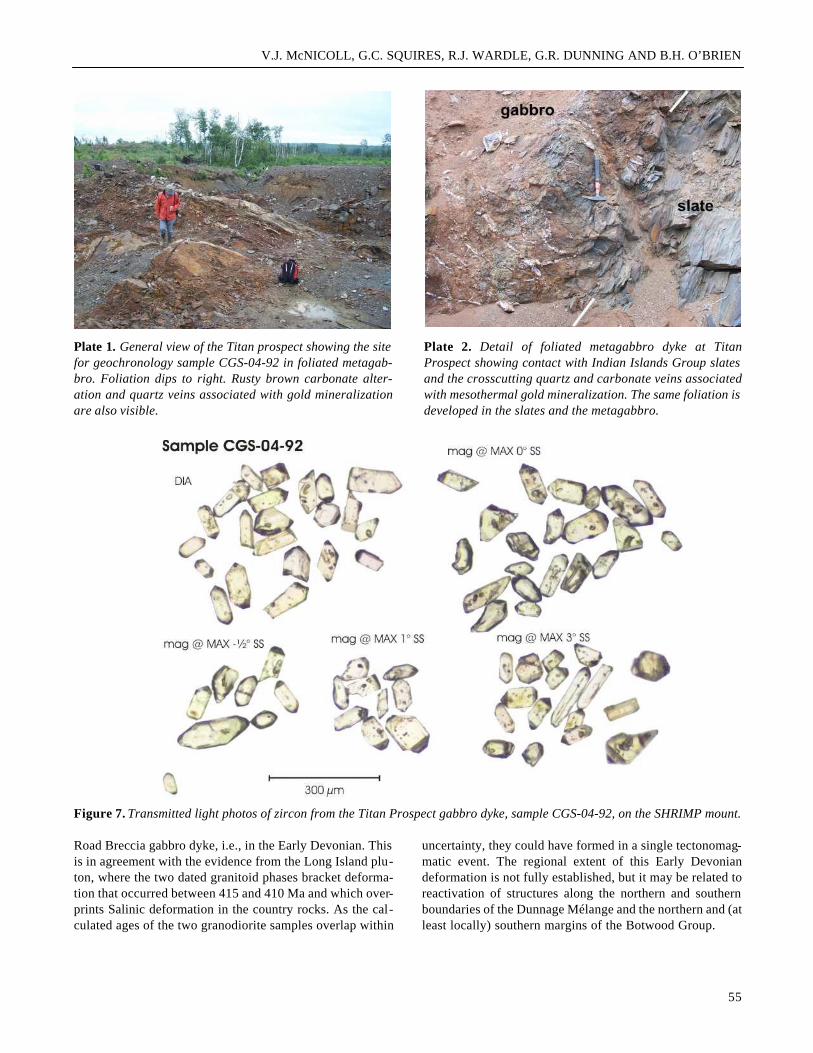
Sample CGS-04-92 was collected from a trench expo-sure of a coarse-grained, rusty carbonate-altered gabbrodyke that intrudes thin-bedded, Indian Islands Group sand-stone (Plate 1). The gabbro is variably foliated and sharesthe same strong cleavage as the host sandstone. The defor-mation also postdates the carbonate alteration in the gabbro.The alteration and the dyke are cut by a series of quartz andcarbonate veins, locally of oblique tension-gash nature(Plate 2), which developed in the late, brittle stages of defor-mation. The veins locally contain visible gold mineraliza-tion and appear to be of mesothermal style (Squires, 2005).The dyke was sampled to place a maximum age on the goldmineralization and alteration.
Some zircons were retrieved from sample CGS-04-92and include a range of morphologies from well faceted tosomewhat rounded. A selection of euhedral, prismatic tostubby prismatic zircon was placed on a SHRIMP grainmount to obtain a crystallization age for the gabbro (Figure7). Most of the zircons in this rock contain abundant inclu-sions that are colourless to dark brown and elongate to roundand equant. Figure 8 includes back-scatter SEM images ofrepresentative zircons from this sample with the ages of thegrains highlighted (Table 1).
51
CURRENT RESEARCH, REPORT 06-1
SHRIMP analyses from this sample define 4 age popu-lations. Figure 9 presents a cumulative probability plot ofthe 206Pb/238U ages, which incorporate the ages and associat-ed errors of the zircon analyses. Only data that are <5% dis-cordant are included in the cumulative probability plots. AConcordia age (see Table 2) for the youngest zircon popula-tion of 381 ± 5 Ma (MSWD of concordance and equivalence= 0.65, probability =0.81; n=7) is interpreted to be the crys-tallization age of the gabbro. Older zircon populations in thegabbro have ages of ca. 414 Ma (n=11), ca. 469 Ma (n=4),and ca. 586 Ma (n=1) (see Table 2) and are interpreted to beinherited in origin, perhaps from the sandstone that this dyke
has intruded. If all of the zircon in the gabbro is inherited,then 381 ± 5 Ma is a maximum age for the gabbro dyke.
U–Pb SAMPLES AND RESULTS – TIMS DATING
SAMPLE 93GD01 – GNEISSIC GRANODIORITE(NTS 2E/6, UTM 643650E/5468800N, NAD 27, ZONE21)
A sample was collected from a finely banded gneissicphase of the Long Island pluton on southern Birchy Island
52
Figure 4. Transmitted light photos of zircon retrieved from sample CGS-04-54, the Road Breccia Zone gabbro dyke.
Figure 5. Representative back-scatter SEM images of zircons from the Road Breccia Zone gabbro dyke.

V.J. McNICOLL, G.C. SQUIRES, R.J. WARDLE, G.R. DUNNING AND B.H. O’BRIEN
(O’Brien, 2003) where the pluton concordantly intrudespsammites, amphibolites and pebbly pelites of the DunnageMélange. The unbroken parts of the mélange have beendeformed and infolded with granodiorite veins or, in otherlocalities, tectonically straightened and injected by dykes ofgranodioritic gneiss.
Four small fractions composed of 2 to 10 unabraded zir-con grains were analysed. One analysis, Z4, contains anolder inherited component and has a 207Pb/206Pb age of 511Ma. Fractions Z1, Z2, and Z3 are closely spaced, with Z1and Z2 essentially coincident (Figure 10), and all have207Pb/206Pb ages of 413 Ma. The weighted average of thesethree analyses yields a date of 413 ± 2 Ma (95% confidenceinterval (CI), MSWD <0.001), calculated using ISOPLOT(Ludwig, 2001).
SAMPLE 93GD02 – MASSIVE GRANODIORITE(NTS 2E/6, UTM 643650E/5468800N, NAD 27, ZONE21)
Massive, equigranular, coarse-grained hornblende gran-odiorite that cuts the tectonic fabric in the orthogneiss of
93GD01 (Plate 3) and the foliation in the country rock wassampled. This rock type is associated with moderately dip-ping sheets of megacrystic biotite granite present at the mar-gins of the Long Island pluton and within the adjacent con-tact aureole.
Four fractions, each composed of ca. 20 to 50 cleareuhedral zircons, were analyzed from this sample. FractionsZ1 and Z2 were abraded and are less discordant than Z3 andZ4 (Figure 10). All of the analyses are collinear, plotting ona line with a lower intercept at the origin within uncertainty.The 207Pb/206Pb ages of the analyses range from 411.7 to 409Ma, overlapping within error. The weighted average of the207Pb/206Pb ages yields a date of 411 ± 1.4 Ma (95% CI,MSWD = 1.09).
DISCUSSION
IMPLICATIONS FOR TIMING OF DEFORMATION
The development of the main slaty cleavage in the Indi-an Islands Group must have occurred after Indian IslandsGroup deposition and prior to intrusion of the ca. 411 Ma
53
Figure 6. Uranium–lead concordia diagram of SHRIMP analyses from the Road Breccia Zone gabbro dyke.

CURRENT RESEARCH, REPORT 06-1
54
Tab
le 2
.Ura
nium
–lea
d T
IMS
zirc
on d
ata
for
sam
ples
93G
D01
and
93G
D02
fro
m w
est o
f th
e D
og B
ay L
ine
Con
cent
ratio
nM
easu
red
Cor
rect
ed A
tom
ic R
atio
s*A
ge (M
a)
tota
lW
eigh
tU
Pb ra
dco
mm
on20
6 Pb
208 P
b20
6 Pb
207 P
b20
7 Pb
206 P
b20
7 Pb
207 P
bFr
actio
n(m
g)(p
pm)
Pb (p
g)20
4 Pb
206 P
b23
8 U±
235 U
±20
6 Pb
±23
8 U23
5 U20
6 Pb
93G
D01
GN
EIS
SIC
GR
AN
OD
IOR
ITE
Z1
clr
euh
need
les
0.02
251
632
.213
3573
0.08
000.
0639
622
0.48
5316
0.05
502
1040
040
241
3.2
Z2
clr
euh
pris
ms
0.03
354
433
.719
3819
0.07
170.
0639
422
0.48
5016
0.05
502
1040
040
241
3.0
Z3
clr
euh
pris
ms
0.03
155
434
.525
2721
0.09
300.
0631
530
0.47
9122
0.05
502
1039
539
741
3.2
Z4
clr
euh
pris
ms
0.00
750
433
.721
738
0.08
860.
0677
144
0.53
7036
0.05
752
2442
243
651
1.4
93G
D02
GR
AN
OD
IOR
ITE
Z1 c
lr eu
h ab
r0.
092
318
20.8
5322
520.
1195
0.06
481
300.
4913
220.
0549
812
405
406
411.
4Z
2 st
ubby
clr
abr
0.09
239
625
.425
5817
0.10
920.
0641
524
0.48
5918
0.05
493
840
140
240
9.4
Z3
clr
need
les
0.22
948
529
.819
422
390.
0983
0.06
190
240.
4693
180.
0549
94
387
391
411.
7Z
4 ne
edle
s+fl
at p
rism
s0.
253
511
30.9
196
2549
0.09
330.
0612
316
0.46
3612
0.05
492
438
338
740
9.0
Not
es: Z
=zir
con,
clr
=cle
ar, e
uh=e
uhed
ral,
abr=
abra
ded.
* A
tom
ic r
atio
s co
rrec
ted
for
frac
tiona
tion,
spi
ke, l
abor
ator
y bl
ank
of c
a. 1
0 pi
cogr
ams
of c
omm
on le
ad, a
nd in
itial
com
mon
lead
at t
he a
ge o
f th
e sa
mpl
e ca
lcu-
late
d fr
om th
e m
odel
of
Stac
ey a
nd K
ram
ers
(197
5), a
nd 1
pic
ogra
m U
bla
nk. 2
Fun
cert
aint
ies
are
repo
rted
aft
er th
e ra
tios
and
refe
r to
the
fina
l dig
its.
V.J. McNICOLL, G.C. SQUIRES, R.J. WARDLE, G.R. DUNNING AND B.H. O’BRIEN
Road Breccia gabbro dyke, i.e., in the Early Devonian. Thisis in agreement with the evidence from the Long Island plu-ton, where the two dated granitoid phases bracket deforma-tion that occurred between 415 and 410 Ma and which over-prints Salinic deformation in the country rocks. As the cal-culated ages of the two granodiorite samples overlap within
uncertainty, they could have formed in a single tectonomag-matic event. The regional extent of this Early Devoniandeformation is not fully established, but it may be related toreactivation of structures along the northern and southernboundaries of the Dunnage Mélange and the northern and (atleast locally) southern margins of the Botwood Group.
55
Plate 1. General view of the Titan prospect showing the sitefor geochronology sample CGS-04-92 in foliated metagab-bro. Foliation dips to right. Rusty brown carbonate alter-ation and quartz veins associated with gold mineralizationare also visible.
Plate 2. Detail of foliated metagabbro dyke at TitanProspect showing contact with Indian Islands Group slatesand the crosscutting quartz and carbonate veins associatedwith mesothermal gold mineralization. The same foliation isdeveloped in the slates and the metagabbro.
Figure 7. Transmitted light photos of zircon from the Titan Prospect gabbro dyke, sample CGS-04-92, on the SHRIMP mount.

CURRENT RESEARCH, REPORT 06-1
In contrast, the results from the Titan metagabbro dykeindicate that the main development of foliation in the north-eastern part of the Indian Islands Group did not occur untilafter 381 ± 5 Ma, i.e., in the Late Devonian or younger. Onthis basis, two periods of deformation must have affectedthe Indian Islands Group. However, it is difficult to separatethese in the field. Although the Indian Islands Group hasbeen affected by polyphase deformation, the fabrics at both
the Road Breccia and Titan locations seem to be early (S1)fabrics. Clearly, though, they are not of the same age andpose a problem for structural correlation that can only beresolved through further work.
The post-381 Ma age of deformation in the IndianIslands Group is broadly comparable to the 400 to 385 Mamuscovite and biotite 40Ar–39Ar ages from the Gander Zone
56
Figure 8. Representative back-scatter SEM images of zircon from the Titan Prospect gabbro dyke.
Figure 9. Cumulative probability plot of SHRIMP analyses from the Titan Prospect gabbro dyke.

V.J. McNICOLL, G.C. SQUIRES, R.J. WARDLE, G.R. DUNNING AND B.H. O’BRIEN
(O’Neill and Lux, 1989), and 390 to 370 Ma 40Ar–39Arwhole-rock metamorphic ages from the western AvalonZone (Dallmeyer et al., 1983). These ages have been gener-ally ascribed to the Acadian orogenic event, the upper agelimit of which is otherwise provided by posttectonic granitebatholiths of ca. 385 to 378 Ma in the Gander and Avalonzones (O’Neill et al., 1991; Kontak et al., 1988). Devoniandeformation has also been recognized in southwest New-foundland along the Dunnage–Gander zone boundary,where a complex series of structural events took placebetween 415 and 386 Ma (Dubé et al., 1996). The ReachFault and Dog Bay Line therefore seem to mark the easternlimit of Salinic deformation in northeastern Newfoundland;the Indian Islands Group and other units to the east havingbeen principally deformed in the Acadian Orogeny.
IMPLICATIONS FOR AGE OF THE INDIANISLANDS GROUP
The 411 ± 5 Ma date from the Road Breccia dyke indi-cates that the Indian Islands Group can be no younger than
ca. 406 Ma, which using the age of the Silurian–Devonianboundary as 418 ± 2 Ma (Tucker et al., 1998; Okulitch,2002), is consistent with the Silurian-possibly Early Devon-ian fossil evidence of Boyce et al. (1993), Boyce and Dick-son (this volume).
IMPLICATIONS FOR THE AGE OF GOLD MINER-ALIZATION
The mesothermal mineralization at Titan is associatedwith late-tectonic quartz veining and pre- or syn-deforma-tion carbonate alteration that must be Late Devonian oryounger. Some of the mesothermal gold prospects north ofthe Dog Bay Line(Figure 2), notably those at the Port Albert,New World trend and Powderhouse Cove occurrences(Evans 1996), are, in part, associated with mineralized felsicdykes likely related to the Long Island and Loon Bay plu-tons. The unfoliated dykes intrude Silurian and Devoniandeformation zones in which they crosscut penetrative fab-rics but are locally affected by late fracturing and brittleshearing associated with gold mineralization. The mineral-ization is probably, therefore, Early Devonian. The PondIsland gold-bismuth showing (Evans, 1996), which is host-ed by quartz-carbonate veins in Long Island granite, may beof similar age.
The epithermal mineralization cuts slaty cleavage in theIndian Islands Group, e.g., at the Road Breccia occurrence,and also at the Horwood breccia vein at Gander Bay (Figure2; Squires, 2005) and must, therefore, be younger than EarlyDevonian. Since the epithermal systems occur in close prox-imity to the mesothermal ones, and given that epithermalsystems generally form at higher, cooler crustal levels, itmay also be reasonable to assume that they are younger thanthe mesothermal systems, i.e., also Late Devonian oryounger.
57
Figure 10. Uranium–lead concordia diagrams for samples93GD01 and 93GD02.
Plate 3. Intrusive relationship between Sample 93GD01 andSample 93GD02, as exposed near the Shoal Tickle of LittleBurnt Bay.

CURRENT RESEARCH, REPORT 06-1
There has been speculation (e.g., O’Driscoll andWilton, 2005) that gabbro-granite intrusions, such as theMount Peyton Intrusive Suite, may have driven hydrother-mal systems to produce epithermal and mesothermal miner-alization. Based on their (O’Driscoll and Wilton, op. cit.)interpreted 430 to 424 Ma (Early Silurian) ages for theseplutons, and the evidence presented herein that mineraliza-tion is likely Early Devonian or younger, this does not seemlikely. The possibility remains, however, that the southwestpart of the Mount Peyton Intrusive Suite is younger than thereported ages (Lake and Wilton, this volume), thus leavingroom for a genetic relationship. For the mesothermal min-eralization in the Indian Islands Group, a more likely rela-tionship is with the regional Acadian deformation and low-grade metamorphism of ca. 390 to 370 Ma.
The age of mesothermal gold mineralization elsewherein Newfoundland is not well constrained but available evi-dence from the Baie Verte Peninsula indicates an age rangefrom 437 to 374 Ma (Evans, 2005) and from the Cape Raydeposit in western Newfoundland (Dubé and Lauzière,1997), a range of 415 to 386 Ma. These ages range fromEarly Silurian to Late Devonian and, as noted by Evans(2005), coincide with the range of the Salinic and Acadianorogenies. This report emphasizes the importance of Earlyand Late Devonian (or younger) mineralization ages. Thishas parallels with the results of Dubé and Lauzière, (1997)(see above) and also with the recent results of Kerr et al.(this volume) who report 40Ar–39Ar ages of 412.3 ± 2.3 and413 ± 4.3 Ma for mafic dykes that bracket a period of EarlyDevonian gold mineralization in the White Bay area ofnorthern Newfoundland. With respect to Late Devonianevents, the Titan maximum age of 381 Ma is similar to theca. 374 Ma age (Bédard et al., 1997) of the mesothermalNugget Pond deposit on the Baie Verte Peninsula, and to theyounger limit of ca. 386 Ma for gold mineralization at CapeRay.
ACKNOWLEDGMENTS
The manuscript was critically reviewed and muchimproved by Lawson Dickson and Neil Rogers. Staff of theGeochronology Laboratories at GSC Ottawa and MemorialUniversity Department of Earth Sciences are thanked fortheir assistance in generating the U–Pb data.
REFERENCES
Bédard, J.H., Lauzière, K., Sangster, A. and Boisverte, É.1997: Geological map of the Betts Cove OphioliticMassif and its cover rocks. Geological Survey of Cana-da, Open File Preliminary Map 3271.
Boyce, W.D. and Dickson, W.L.This volume: Recent fossil finds in the Indian IslandsGroup, central Newfoundland.
Boyce, W.D., Ash, J.S. and Dickson, W.L.1993: The significance of a new bivalve fauna from theGander map area (2D/15) and a review of Silurianbivalve-bearing faunas in central Newfoundland. InCurrent Research. Newfoundland Department of Minesand Energy, Geological Survey Branch, Report 93-1,pages 187-194.
Cumming, G.L. and Richards, J.R.1975: Ore lead in a continuously changing Earth. Earthand Planetary Sciences Letters, Volume 28, pages 55-171.
Currie, K.L.1997: Geology Gander River - Gander Bay region,Newfoundland (2E east half). Geological Survey ofCanada, Open File 3467, scale 1:100,000.
Dallmeyer, R.D., Hussey, E.M., O’Brien, S.J. andO’Driscoll, C.F.
1983: Chronology of tectonothermal events in the west-ern Avalon Zone of the Newfoundland Appalachians.Canadian Journal of Earth Sciences, Volume 20, pages355-363.
Dickson, W.L.This volume: The Silurian Indian Islands Group and itsrelationships to adjacent units.
Dubé, B. and Lauzière, K.1997: Gold metallogeny of the Cape Ray Fault Zone,SW Newfoundland, Canada. Geological Survey ofCanada, Bulletin 508, 90 pages.
Dubé, B., Dunning, G.R., Lauzière, K. and Roddick, J.C.1996: New insights into the Appalachian Orogen fromgeology and geochronology along the Cape Ray faultzone, southwest Newfoundland. Geological Society ofAmerica Bulletin, Volume 108, pages 101-116.
Dunning, G.R.1992: U-Pb geochronological research agreement finalreport for the Newfoundland Department of Mines andEnergy. Unpublished report.
1994: U-Pb geochronological research agreement finalreport for the Newfoundland Department of Mines andEnergy. Unpublished report.
58

V.J. McNICOLL, G.C. SQUIRES, R.J. WARDLE, G.R. DUNNING AND B.H. O’BRIEN
Dunning, G.R., O’Brien S.J., Colman-Sadd, S.P., Black-wood, R.F., Dickson, W.L., O’Neil, P.P. and Krogh, T.E.
1990: Silurian orogeny in the NewfoundlandAppalachians. Journal of Geology, Volume 98, pages985-913.
Elliot, C.G., Dunning, G.R. and Williams, P.F.1991: New U/Pb zircon age constraints on the timing ofdeformation in north-central Newfoundland and impli-cations for early Paleozoic Appalachian orogenesis.Geological Society of America Bulletin, Volume 103,pages 125-135.
Evans, D.T.W.1996: Epigenetic gold occurrences, eastern and centralDunnage Zone, Newfoundland. Newfoundland Depart-ment of Mines and Energy, Geological Survey, MineralResource Report 9, 135 pages.
2005: Epigenetic gold occurrences, Baie Verte Peninsu-la, (NTS 12H/09, 16 and 12I/01). Newfoundland andLabrador Department of Natural Resources, GeologicalSurvey, Mineral Resource Report 11, 157 pages.
French, V.A.1988: Assessment report on first-year explorationrequirements, Carters Cove claim group, New WorldIsland, Notre Dame Bay (unpublished report of Noran-da Exploration Co. Ltd.) Newfoundland Department ofMines and Energy, Geological Survey, Geofile 2E(590), 22 pages.
Hedenquist, J.W.2000: Exploration for epithermal gold deposits. SEGReviews, Volume 13, pages 245-277.
Jaffey, A.H., Flynn, K.F., Glendenin, L.E., Bentley, W.C.and Essling, A.M.
1971: Precision measurement of the half lives and spe-cific activities of 235U and 238U. Physical review, sec-tion C, Nuclear Physics, Volume 4, pages 1889-1906.
Kerr, A., van Breemen, O. and Creaser, C.This volume: The timing of gold mineralization at theRattling Brook deposit, White Bay: Constraints fromRe–Os and 40Ar–39Ar geochonology.
Kontak, D.J., Tuach, J., Strong, D.F., Archibald, D.A. andFarrar, E.
1988: Plutonic and hydrothermal events in the AckleyGranite, southeast Newfoundland, as indicated by total-fusion Ar/Ar geochronology. Canadian Journal of EarthSciences, Volume 25, pages 1151-1160.
Krogh, T.E.1973: A low contamination method for hydrothermaldecomposition of zircon and extraction of U and Pb forisotopic age determination. Geochimica et Cosmochim-ica Acta, Volume 37, pages 485-494.
Lake, J. and Wilton, D.H.C.This volume: Structural and stratigraphic controls onmineralization at the Beaver Brook antimony deposit,central Newfoundland.
Ludwig, K.R.1998: On the treatment of concordant uranium-leadages. Geochimica et Cosmchimica Acta, Volume 62,pages 665-676.
2001: User’s manual for Isoplot/Ex rev. 2.49: aGeochronological Toolkit for Microsoft Excel. SpecialPublication, 1a, Berkeley Geochronology Center,Berkeley, 55 pages.
McNicoll, V.2005: U–Pb Geochronology report for the Botwoodbasin project. Report submitted to, and available from,the Newfoundland and Labrador Department of Natur-al Resources, Geological Survey.
O’Brien, B.H.2003: Geology of the central Notre Dame Bay region(parts of NTS areas 2E/3,6,11) northeastern Newfound-land. Newfoundland and Labrador Department ofMines and Energy, Geological Survey, Report 03-03,147 pages.
O’Driscoll, J.M. and Wilton, D.H.C.2005: Preliminary geochronological, geochemical andisotopic studies of auriferous systems in the Botwoodbasin and environs, central Newfoundland. In CurrentResearch. Newfoundland and Labrador Department ofNatural Resources, Geological Survey, Report 05-1,pages 207-222.
Okulitch, A.V2002: Geological Time Chart, 2002. Geological Surveyof Canada Open File 3040 (National Earth ScienceSeries, Geological Atlas) - Revision.
O’Neill, P.P.1991: Geology of the Weir’s Pond area, Newfoundland(NTS 2E/1). Newfoundland Department of Mines andEnergy, Geological Survey Branch, Report 91-3, 144pages.
59

CURRENT RESEARCH, REPORT 06-1
O’Neill, P.P. and Lux, D.1989: Tectonothermal history and 49Ar/39Ar geochronol-ogy of northeastern Gander Zone, Weir’s Pond area(2E/1). In Current Research. Newfoundland andLabrador Department of Mines, Geological Survey,Report 89-1, pages 131-139.
Squires, G.C.2005: Gold and antimony occurrences of the ExploitsSubzone and Gander Zone: A review of recent discov-eries and their interpretations. In Current Research.Newfoundland and Labrador Department of NaturalResources, Geological Survey, Report 05-1, pages 223-237.
Stacey, J.S. and Kramers, J.D.1975: Approximation of terrestrial lead isotope evolu-tion by a two-stage model. Earth and Planetary ScienceLetters, Volume 26, pages 207-221.
Stern, R.A.1997: The GSC Sensitive High Resolution Ion Micro-probe (SHRIMP): analytical techniques of zircon U-Th-Pb age determinations and performance evaluation. InRadiogenic Age and Isotopic Studies, Report 10. Geo-logical Survey of Canada, Paper 1997-F, pages 1-31.
Stern, R.A. and Amelin, Y.2003: Assessment of errors in SIMS zircon U-Pbgeochronology using a natural zircon standard andNIST SRM 610 glass. Chemical Geology, Volume 197,pages 111-146.
Tucker, R.D., Bradley, D.C., Ver Straeten, C.A., Harris,A.G., Ebert, J.R. and McCutcheon, S.R.
1998: New U-Pb zircon ages and the duration and divi-sion of Devonian time. Earth and Planetary ScienceLetters, Volume 158, pages 175-186.
van Staal, C.L.2005: North America, northern Appalachians. In Ency-clopaedia of Geology. Edited by R.C. Selley, L. Robin,M. Cocks and I.R. Plimer. Elsevier, pages 81-92.
Williams, H.1993: Stratigraphy and structure of the Botwood beltand definition of the Dog Bay Line in northeast New-foundland. In Current Research, Part D. GeologicalSurvey of Canada, Paper 93-1D, pages 19-27.
Williams, H., Currie, K.L. and Piasecki, M.A.J.1993: The Dog Bay Line: a major Silurian tectonicboundary in northeast Newfoundland. Canadian Journalof Earth Sciences, Volume 30, pages 2481-2494.
60