update 01-2013 children in poverty - amazon s3...children in poverty intelligence update 01-2013 gla...
TRANSCRIPT

GLA Intelligence 1
Children in Poverty Update 01-2013 January 2013
Introduction
The Child Poverty Act has committed British governments to eliminate child poverty by 2020. However, there are a number of measures of child poverty available, each with particular strengths and weaknesses. The detail, in terms of geography and other associated information, and the accuracy of the information varies.
This Update is based on one such measure, published by HM Revenue & Customs (HMRC) and derived largely from administrative records. The measure is the proportion of children living in families in receipt of out of work (means tested) benefits or in receipt of tax credits where their reported income is less than 60 per cent of median income1. It was previously known as National Indicator 116 (NI116). The latest data is for August 2010 and this Update focuses on that. Comparable figures have been produced since 2006 for England and this series largely replicates the Income Deprivation Affecting Children Index from the Indices of Deprivation 2007, which used data from 2005, though there are important differences in the definitions. Some data from the previous years is also presented here. The data from 2009 onwards gives comparable data across the whole of the UK.
Key Findings
More than one in four of London’s children were in poverty in 2010.
Child poverty rates have fallen in London on this measure, but are still higher than in any other region of the UK.
Child poverty in Tower Hamlets (nearly 50 per cent) was the highest in the country, and nearly five times as high as in Richmond upon Thames.
Four boroughs, Tower Hamlets, Islington, Westminster and Redbridge, include pockets where more than three in five children were in poverty.
Over the last four years, most boroughs have seen decreases in the percentage of children in poverty on this measure, though Bromley has seen virtually no change, while Havering and Bexley have seen increases in most years.
1 A precise definition is given in the glossary section.

Children in Poverty Intelligence Update 01-2013
GLA Intelligence 2
Latest Results
Almost 28 per cent of London’s children were in poverty in 2010, according to this measure. This compares with just over 21 per cent in England as a whole, and is the highest of any region of the UK (see Chart 1). The North East, West Midlands and North West were the next highest regions, while the South East had the lowest levels of child poverty according to this measure, followed by the South West and East of England.
In fact when listed in order of child poverty levels, the regions were the same in the five years since the measure had been published, although the size of the differences changed. In particular all of the regions except for London followed the pattern for England as shown in Chart 2 in that they were lowest in 2006, higher in 2007, lower in 2008 and again higher in 2009. In contrast, the proportion for London decreased down to a lower level in 2008 than in 2006 and decreased still further by 2010.
Chart 1: Percentage of Children in Poverty by Region, 2010
0%
5%
10%
15%
20%
25%
30%
NorthEast
NorthWest
Yorkshireand theHumber
EastMidlands
WestMidlands
East ofEngland
London SouthEast
SouthWest
Wales Scotland NorthernIreland
Source: HMRC Child Poverty Statistics, 2010
Chart 2: Change Over Time in Percentage of Children in Poverty
Source: HMRC Child Poverty Statistics, 2010
0%
5%
10%
15%
20%
25%
30%
35%
2006 2007 2008 2009 2010
London England

Children in Poverty Intelligence Update 01-2013
GLA Intelligence 3
While this indicator has some disadvantages2, one of the biggest advantages of this dataset is that, as it is based on administrative records, it is a complete count. Hence detailed geographical data are available. This reveals the huge variation in child poverty levels within London, with children in Tower Hamlets almost five times as likely to be in poverty as those in Richmond upon Thames. (See Chart 3).
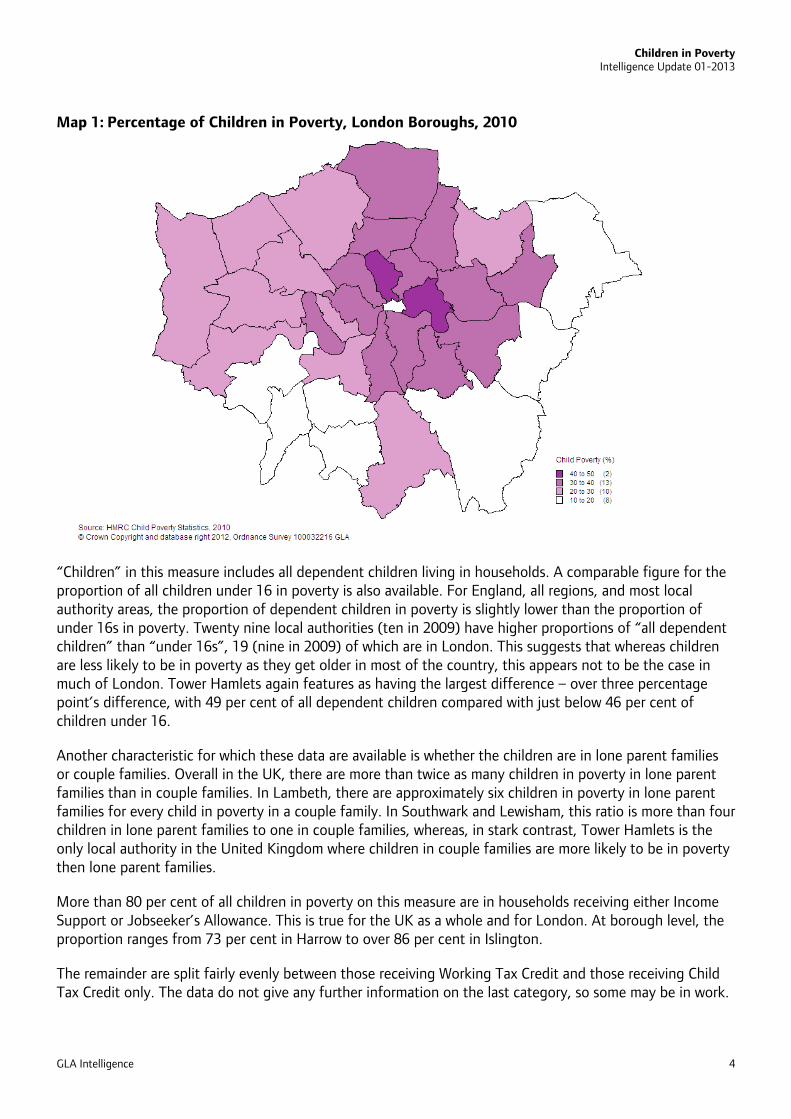
These figures are shown in Map 1, revealing that the boroughs with the highest levels of child poverty are close together bordering the City of London, spreading North into Enfield and spreading East to Barking and Dagenham. Tower Hamlets and Islington have more than two in five children in poverty, the highest percentage of children in poverty in Britain. Four other local authorities in London, along with Manchester and Derry in Northern Ireland have child poverty levels over 35 per cent. Glasgow City had the highest level in Scotland, at 33 per cent, and Blaenau Gwent the highest child poverty in Wales at just over 30 per cent. While Richmond upon Thames has by far the lowest child poverty levels within London, there are 54 local authorities with lower levels outside London. In fact, out of more than four hundred local authority areas in the UK, child poverty levels were below one in five in over 250 of them, but just eight of these were within London.
Chart 3: Percentage of Children Living in Poverty, London Boroughs, 2010
0%
10%
20%
30%
40%
50%
60%
To
we
r H
am
lets
Islin
gto
n
Ha
ckn
ey
We
stm
inst
er
Ne
wh
am
Ca
md
en
Ba
rkin
g a
nd
Da
ge
nh
am
Ha
rin
ge
y
En
field
La
mb
eth
Ha
mm
ers
mith
an
d F
ulh
am
So
uth
wa
rk
Le
wis
ha
m
Wa
ltha
m F
ore
st
Gre
en
wic
h
Bre
nt
Ea
ling
Ke
nsi
ng
ton
an
d C
he
lse
a
Ho
un
slo
w
Re
db
rid
ge
Cro
ydo
n
Hill
ing
do
n
Wa
nd
swo
rth
Ha
rro
w
Ba
rne
t
Be
xle
y
Ha
veri
ng
City
of L
on
do
n
Me
rto
n
Bro
mle
y
Su
tton
Kin
gst
on
up
on
Th
am
es
Ric
hm
on
d u
po
n T
ha
me
s
Source: HMRC Child Poverty Statistics, 2010
2 It is reliant on a benefit system which is subject to change, captures only those that claim (not all those entitled to claim) and it does not include people who are not eligible for these benefits, but may nonetheless be living in poverty.
Children in Poverty Intelligence Update 01-2013
GLA Intelligence 4
Map 1: Percentage of Children in Poverty, London Boroughs, 2010
“Children” in this measure includes all dependent children living in households. A comparable figure for the proportion of all children under 16 in poverty is also available. For England, all regions, and most local authority areas, the proportion of dependent children in poverty is slightly lower than the proportion of under 16s in poverty. Twenty nine local authorities (ten in 2009) have higher proportions of “all dependent children” than “under 16s”, 19 (nine in 2009) of which are in London. This suggests that whereas children are less likely to be in poverty as they get older in most of the country, this appears not to be the case in much of London. Tower Hamlets again features as having the largest difference – over three percentage point’s difference, with 49 per cent of all dependent children compared with just below 46 per cent of children under 16.
Another characteristic for which these data are available is whether the children are in lone parent families or couple families. Overall in the UK, there are more than twice as many children in poverty in lone parent families than in couple families. In Lambeth, there are approximately six children in poverty in lone parent families for every child in poverty in a couple family. In Southwark and Lewisham, this ratio is more than four children in lone parent families to one in couple families, whereas, in stark contrast, Tower Hamlets is the only local authority in the United Kingdom where children in couple families are more likely to be in poverty then lone parent families.
More than 80 per cent of all children in poverty on this measure are in households receiving either Income Support or Jobseeker’s Allowance. This is true for the UK as a whole and for London. At borough level, the proportion ranges from 73 per cent in Harrow to over 86 per cent in Islington.
The remainder are split fairly evenly between those receiving Working Tax Credit and those receiving Child Tax Credit only. The data do not give any further information on the last category, so some may be in work.

Children in Poverty Intelligence Update 01-2013
GLA Intelligence 5
There is limited other information available within the data. There is nothing, for example, about the ethnicity of the children or their parents. The only other data supplied relates to the number and age of children, but without denominators, this is difficult to use. However, the geographic information means that we can get a detailed picture of child poverty across London. Map 2 shows the data for small areas (LSOAs3) across London. Four London boroughs have at least one area where more than three in five children are in poverty, compared to ten last year. The areas with the highest proportions are concentrated in Tower Hamlets, with half of all areas in this very highest category situated within the borough. Perhaps more surprising is that some other boroughs, such as Hackney and Haringey, with high overall levels of child poverty have no individual areas with these very high levels.
Map 2: Percentage of Children in Poverty, London LSOAs3, 2010 change in levels of Child Poverty
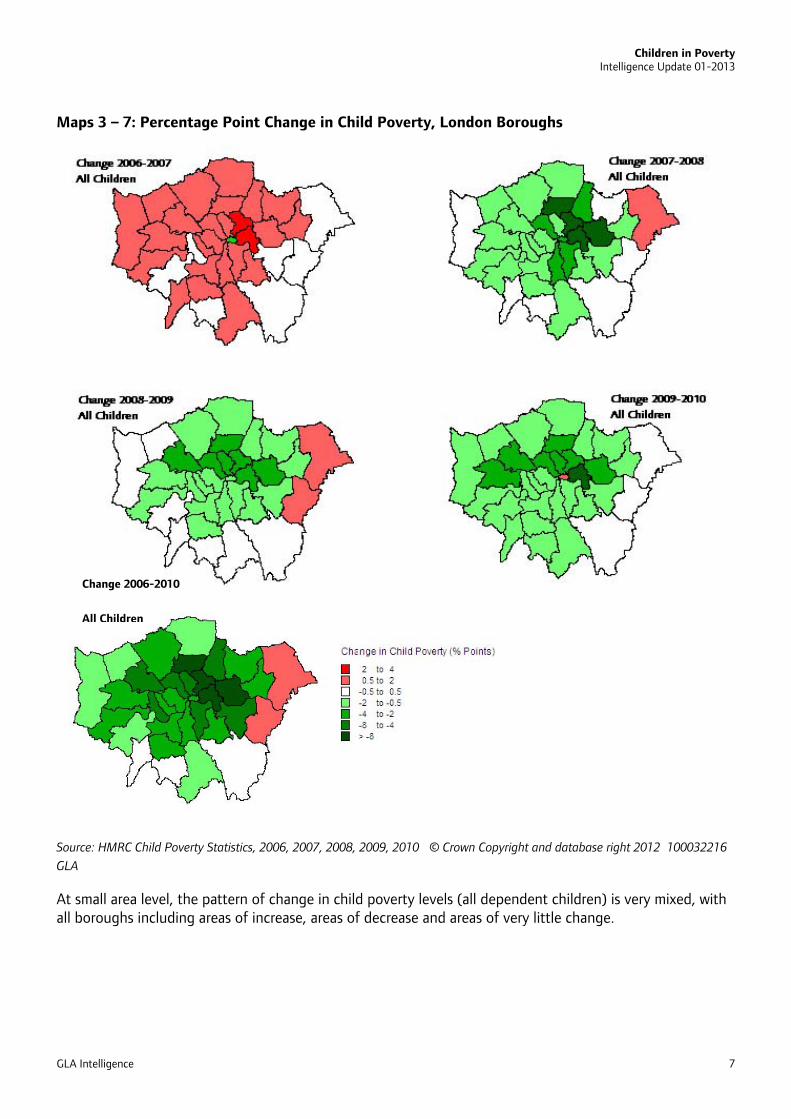
Comparable data is now available for five years, so patterns of change from year to year in the levels of child poverty under this measure are feasible and these are illustrated at borough level in Maps 3-6. Levels of poverty among all dependent children increased in all the London boroughs between 2006 and 2007, although in seven of the boroughs the increase was small (City of London is not a London borough) Between 2007 and 2008 the level of child poverty decreased in most boroughs, with Havering bucking the trend and showing the largest increase. Hackney and Tower Hamlets stand out as having both the largest increases and among the largest decreases. This may be a feature of the way the measure is calculated, rather than real change in living standards. Between 2008 and 2009 again more boroughs saw a further decrease than an increase. From 2009 to 2010 levels of poverty among all dependent children decreased in all boroughs.
3 Lower Layer Super Output Areas. These are areas designed to be approximately similar in size across the whole of England. They averaged 1,500 residents, based on 2001 Census results.

Children in Poverty Intelligence Update 01-2013
GLA Intelligence 6
When looking at the overall change from 2006 to 2010, levels of poverty among all dependent children showed a decrease in all but two boroughs, Bexley and Havering.
Children in Poverty Intelligence Update 01-2013
GLA Intelligence 7
Maps 3 – 7: Percentage Point Change in Child Poverty, London Boroughs
Source: HMRC Child Poverty Statistics, 2006, 2007, 2008, 2009, 2010 © Crown Copyright and database right 2012 100032216
GLA
At small area level, the pattern of change in child poverty levels (all dependent children) is very mixed, with all boroughs including areas of increase, areas of decrease and areas of very little change.
Change 2006-2010
All Children

Children in Poverty Intelligence Update 01-2013
GLA Intelligence 8
Map 8: Percentage Point Change in Child Poverty, 2006-2010, London LSOAs
Background
The measure of child poverty presented in this Update is one of several produced by government departments. It is the sum of the number of children in families receiving either one of two out of work means-tested benefits – Income Support or Income Based Job Seeker’s Allowance – and the number of children in households receiving Child Tax Credit where the household taxable income before housing costs (excluding Housing Benefit and certain other benefits) is below 60 per cent of the specifically calculated median income, all as a proportion of the total number of children receiving Child Benefit.
It has advantages in that, unlike other measures, it is based on administrative data, rather than survey data, and is therefore a complete count of what it measures. On the other hand, it is not a complete count of children in low income households, as it only counts children in households claiming the relevant benefits, which means that those potentially the worst off, ie children in households entitled to, but not claiming benefits, are excluded. For example, children in asylum seeking families, where they are not entitled to claim any of these benefits, though they may be living on very low incomes. It is also a snapshot of the children reliant on these benefits at a particular point in time, rather than looking at their circumstances over a longer period of time, which is more useful for indicating living standards.
The change maps shown here are possibly more indicative of the volatility of the measure than necessarily of real change in circumstances. This volatility may arise from changes in unemployment rates or from changes in the low income threshold.
This is not the Government’s primary measure of child poverty, and Chart 4 shows the regional figures and how this measure compares with the latest child poverty figures from the Households Below Average Income (HBAI) series, which are used to monitor progress towards the Government’s target of eradicating

Children in Poverty Intelligence Update 01-2013
GLA Intelligence 9
child poverty. Two measures are published at regional level showing income levels; Before (BHC) and After (AHC) Housing Costs. This chart clearly shows a different pattern in London compared to other regions. It is the only region where the benefit-based NI116 measure is higher than the income based primary measure from the HBAI series (BHC). This is, at least in part, a reflection of the definitions used in calculating the income under these two different measures.
Chart 4: Percentage of Children in Poverty, Comparing Different Measures, by Region, 2010
0
5
10
15
20
25
30
35
40
Engla
nd
Nor
th E
ast
Nor
th W
est
Yor
kshi
re a
nd th
e Hum
ber
Eas
t Midl
ands
W
est M
idlan
ds
Eas
t of E
nglan
d
Lo
ndon
Sou
th E
ast
Sou
th W
est
Wale
s
Scotla
nd
North
ern
Irelan
d
HMRC Child Poverty BHC AHC
Source: HMRC Child Poverty Statistics, 2006-2010

Children in Poverty Intelligence Update 01-2013
GLA Intelligence 10
Glossary of key terms:
Children in Poverty
The proportion of children in poverty is calculated for the HMRC Child Poverty Statistics as:
Number of children in families in receipt of any of:
Income Support (IS)
Income Based Jobseekers Allowance (JSA-IB)
Child Tax Credit (with or without Working Tax Credit) where the equivalised family (reported) income is less than the low income threshold (60 per cent of the median (mid point) income).
As a proportion of:
Total number of children (as measured by the number of children for whom child benefit is claimed.)
Child
The indicator includes children under the age of 20. A dependent child is defined as an individual aged under 16. A person will also be defined as a child if they are 16 to 19-years old and they are:
not married nor in a Civil Partnership nor living with a partner; and living with parents; and in full-time non-advanced education or in unwaged government training
Income
The weekly income data used to calculate the low income threshold is taken from the Family Resources Survey. It includes total family taxable income (for tax credit purposes), the calculated weekly entitlement to Child Benefit and the weekly value of entitlement to tax credits (as at August 31). Income is equivalised and is Before Housing Costs (BHC).
Note: As some benefits included in total income in the Family Resources Survey are non-taxable (such as Housing Benefit, Disability Living Allowance, Attendance Allowance, Council Tax Benefit) these benefits are paid on top of tax credits and therefore are not included in the income or low income threshold used in this local indicator.
Equivalisation
Income equivalisation takes into account variations in the size and composition of the families in which children live. This reflects the common sense notion that, in order to enjoy a comparable standard of living, a family with say three children will need a higher income than a single person living alone.
Low income threshold
This is taken as children living in households whose income falls below 60 per cent of the contemporary median income (income is BHC and equivalised). See “Income” above for what is included in this calculation. The threshold is not applied to children in families in receipt of out of work means-tested benefits as the necessary income information is not available. Children living in these families are included because they are

Children in Poverty Intelligence Update 01-2013
GLA Intelligence 11
known to have a high risk of low income poverty and are often used as a proxy measure for income deprivation.
Means-tested out of work benefits
The means-tested benefits included in this category for this indicator are Income Support and Income-Based Jobseekers’ Allowance
Tax Credits
Tax credits are based on household circumstances and can be claimed jointly by members of a couple, or by singles. Tax credits are part of wider government policy to provide support to parents returning to work, reduce child poverty and increase financial support for all families. Tax credits are made up of Child Tax Credit and Working Tax Credit. Each has a number of elements. More details can be found on the HMRC Website at: http://www.hmrc.gov.uk/taxcredits/start/who-qualifies/index.htm
Income Deprivation Affecting Children Index
This is one of the Indices of Deprivation produced by Communities and Local Government. It is similar to the HMRC Child Poverty Statistics, but also includes figures for Asylum Seekers receiving support and uses an estimate of the total number of children in an area, rather than those receiving Child Benefit as a denominator.
For full definitions of these terms and further details on the technical aspects of the dataset, see:
http://www.hmrc.gov.uk/stats/personal-tax-credits/ni116-tech-note.pdf
For more information please contact Jack Ryan, GLA Intelligence Greater London Authority, City Hall, The Queen’s Walk, More London, London SE1 2AA Tel:020 7983 4000 e-mail:[email protected] Copyright © Greater London Authority, 2013