update on full-scale activated carbon injection for ...update on full-scale activated carbon...
TRANSCRIPT

Update on Full-Scale Activated Carbon Injection for Control of Mercury Emissions
Michael D. Durham, Ph.D., MBAADA Environmental Solutions
8100 SouthPark Way B-2Littleton, CO 80120
303 734-1727
Presentation to Utility MACT Working Group
August 8, 2002Washington D.C.
Outline
! ADA-ES DOE/NETL Hg Control Program! Summary of Previous Results from PAC
with a FF and an ESP! Preliminary results from Brayton Point! Conclusions and Future Plans
ADA-ES Hg Control Program! Full-scale field testing of sorbent-based mercury control on
non-scrubbed coal-fired boilers! Primary funding from DOE National Energy Technology
Laboratory (NETL)! Cofunding provided by:
– Southern Company – We Energies– PG&E NEG– EPRI– Ontario Power Generation– TVA– First Energy– Kennecott Energy– Arch Coal
Project Overview
! Perform first full-scale evaluations of mercury control on coal-fired boilers (up to 150 MW equivalent).
! Evaluate effectiveness of sorbent-based Hg control (activated carbon).
! Test several different power plant configurations.
! Document all costs associated with Hg control.
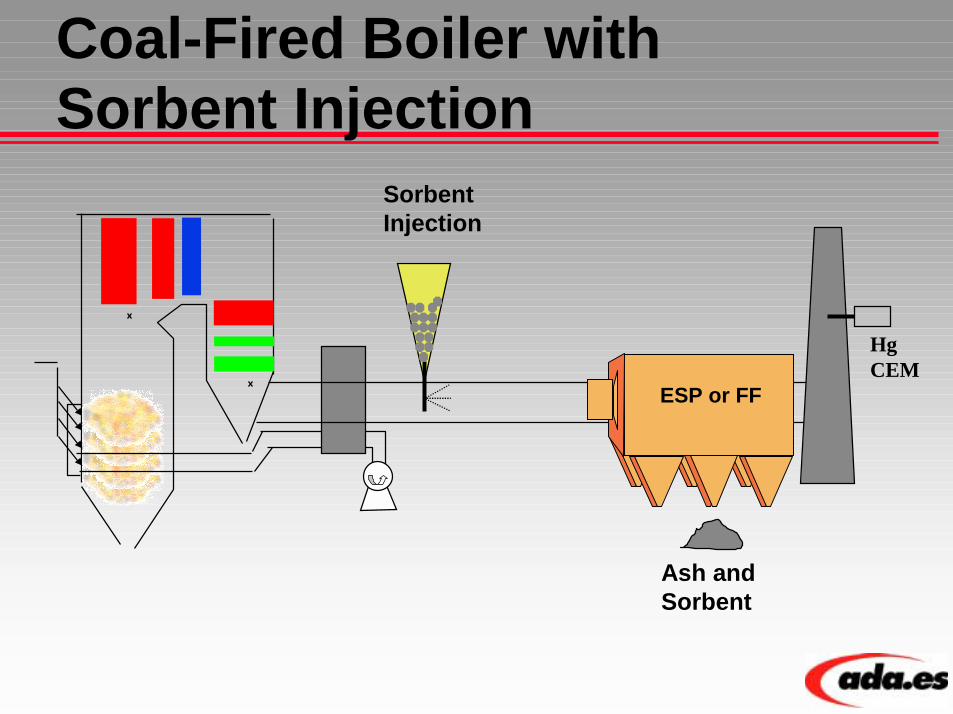
Coal-Fired Boiler with Sorbent Injection
Sorbent Injection
Ash and Sorbent
ESP or FF
Hg CEM
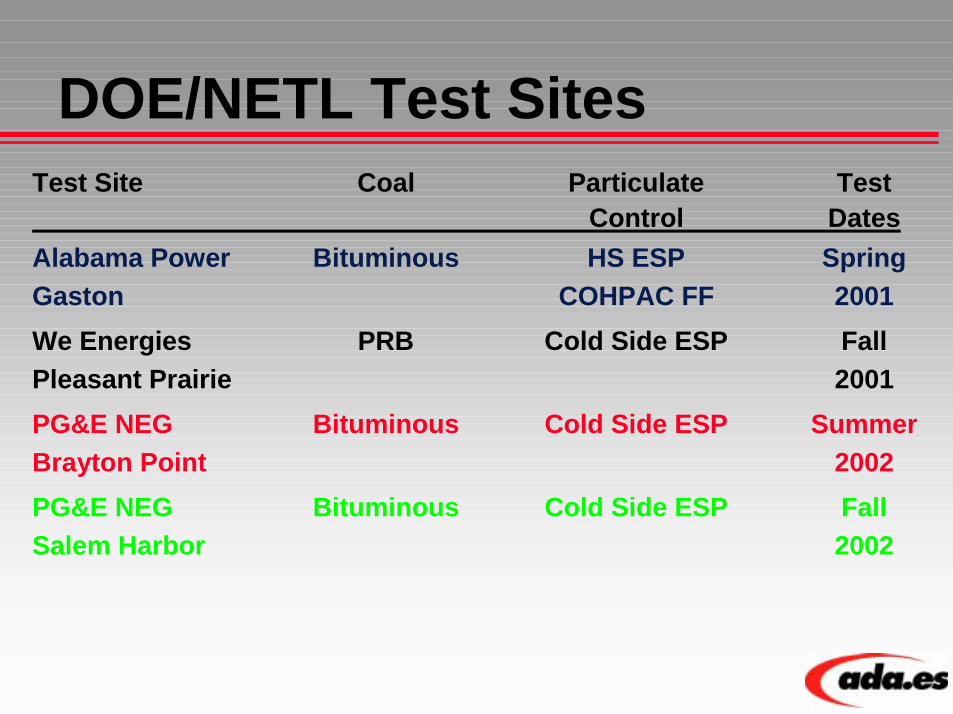
DOE/NETL Test SitesTest Site Coal Particulate Test
Control DatesAlabama Power Bituminous HS ESP SpringGaston COHPAC FF 2001We Energies PRB Cold Side ESP FallPleasant Prairie 2001PG&E NEG Bituminous Cold Side ESP SummerBrayton Point 2002PG&E NEG Bituminous Cold Side ESP FallSalem Harbor 2002
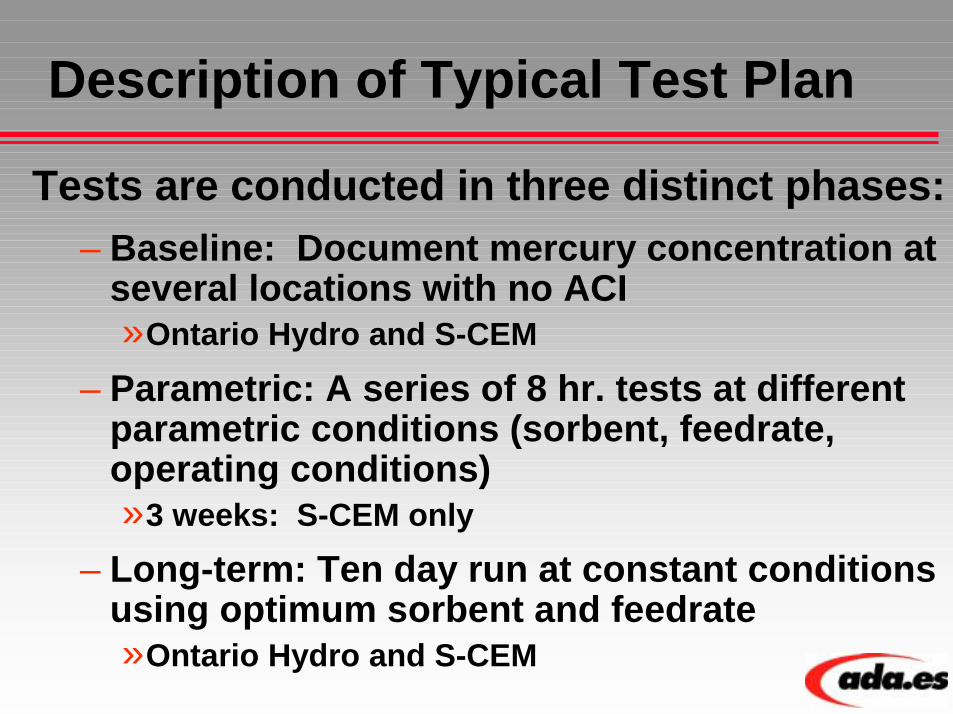
Description of Typical Test Plan
Tests are conducted in three distinct phases:– Baseline: Document mercury concentration at
several locations with no ACI »Ontario Hydro and S-CEM
– Parametric: A series of 8 hr. tests at different parametric conditions (sorbent, feedrate, operating conditions)»3 weeks: S-CEM only
– Long-term: Ten day run at constant conditions using optimum sorbent and feedrate»Ontario Hydro and S-CEM
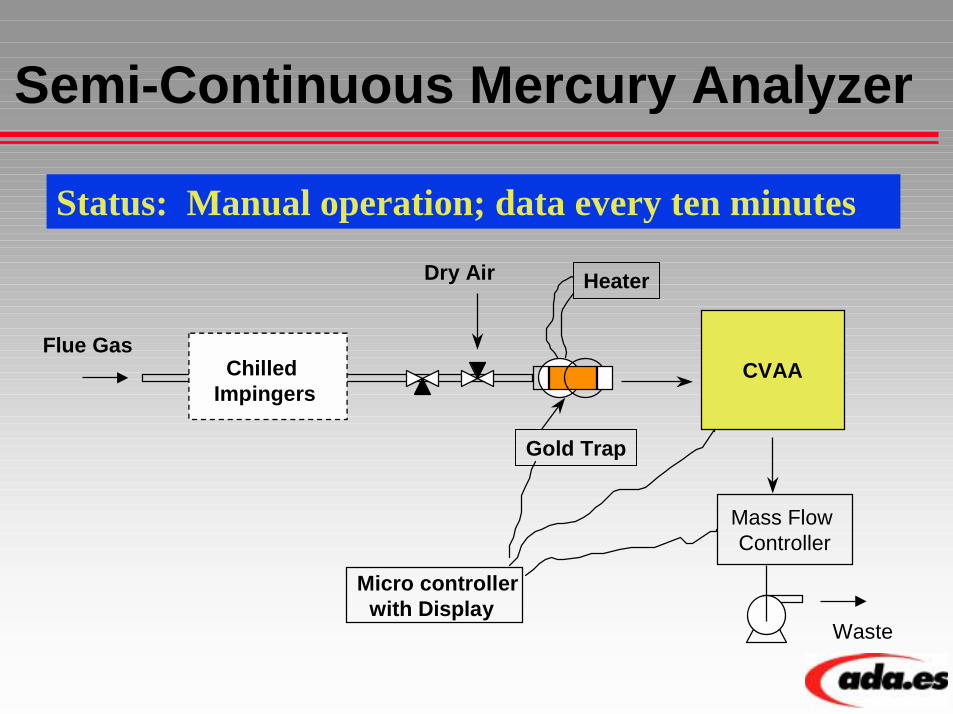
Semi-Continuous Mercury Analyzer
Waste
Chilled Impingers
Flue GasCVAA
Mass Flow Controller
Gold Trap
Heater
Micro controller with Display
Dry Air
Status: Manual operation; data every ten minutes
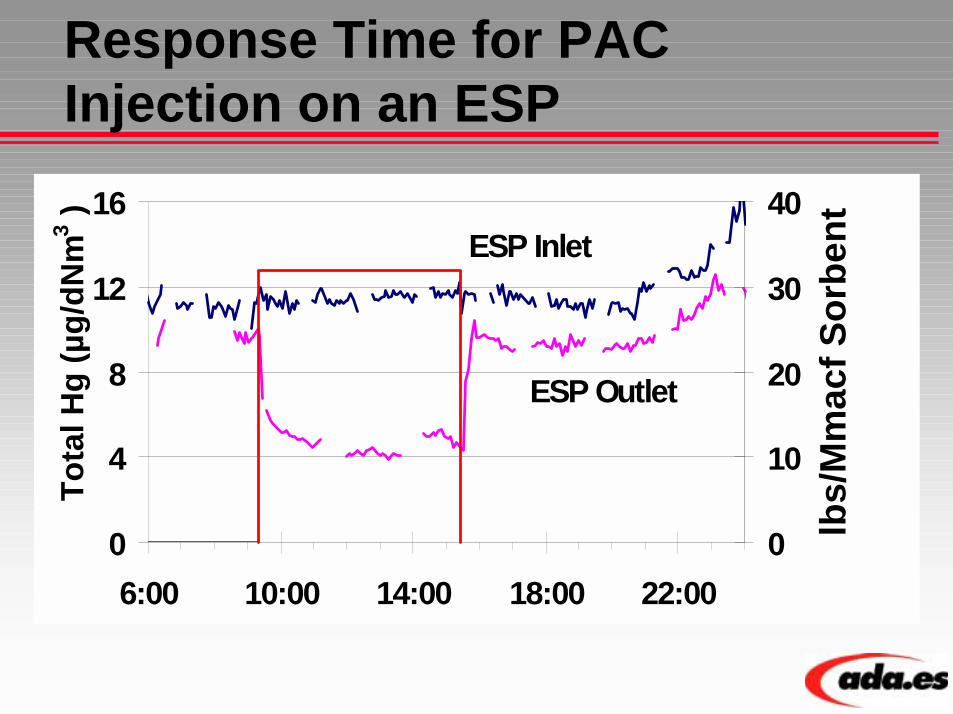
Response Time for PAC Injection on an ESP
0
4
8
12
16
6:00 10:00 14:00 18:00 22:00
Tota
l Hg
(µg/
dNm
3 )
0
10
20
30
40
lbs/
Mm
acf S
orbe
ntESP Inlet
ESP Outlet

Alabama Power E.C. Gaston Unit 3
! 270 MW Wall Fired Boiler! Particulate Collection System
– Hot-side ESP, SCA = 274 ft2/1000 acfm– COHPAC baghouse supplied by Hamon
Research-Cottrell
! Washed Eastern low-sulfur bituminous coal
– 11,902 Btu/lb– 1.2% S– 14.7% ash– 0.14 ppm Hg– 0.017 % Cl
! Baghouse Temperature: 250-270 oF
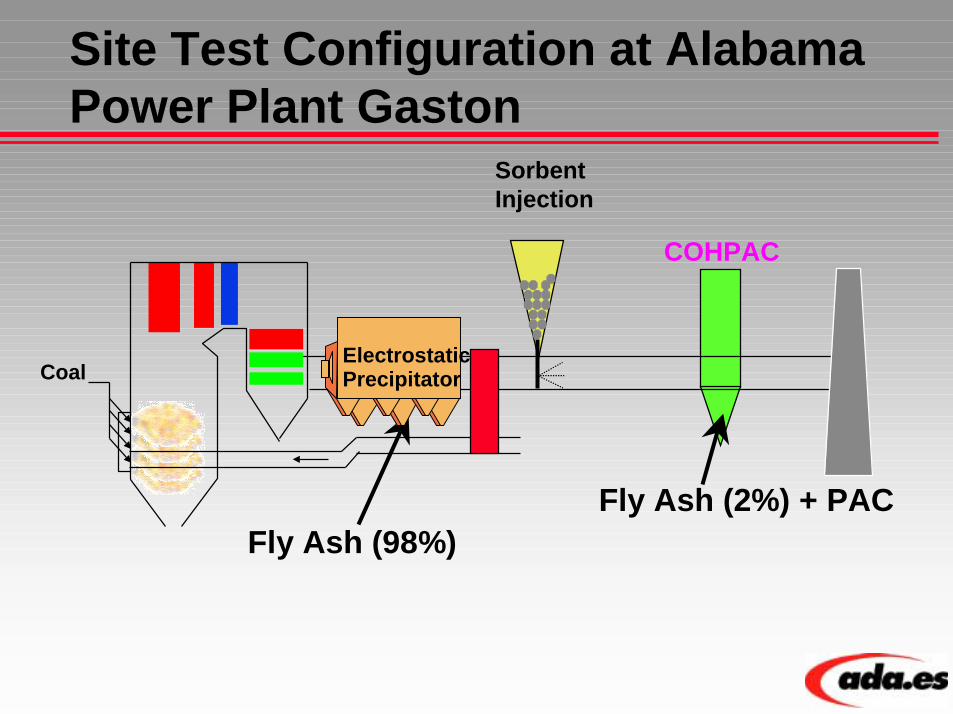
Site Test Configuration at Alabama Power Plant Gaston
Sorbent Injection
COHPAC
Fly Ash (2%) + PACFly Ash (98%)
CoalElectrostaticPrecipitator
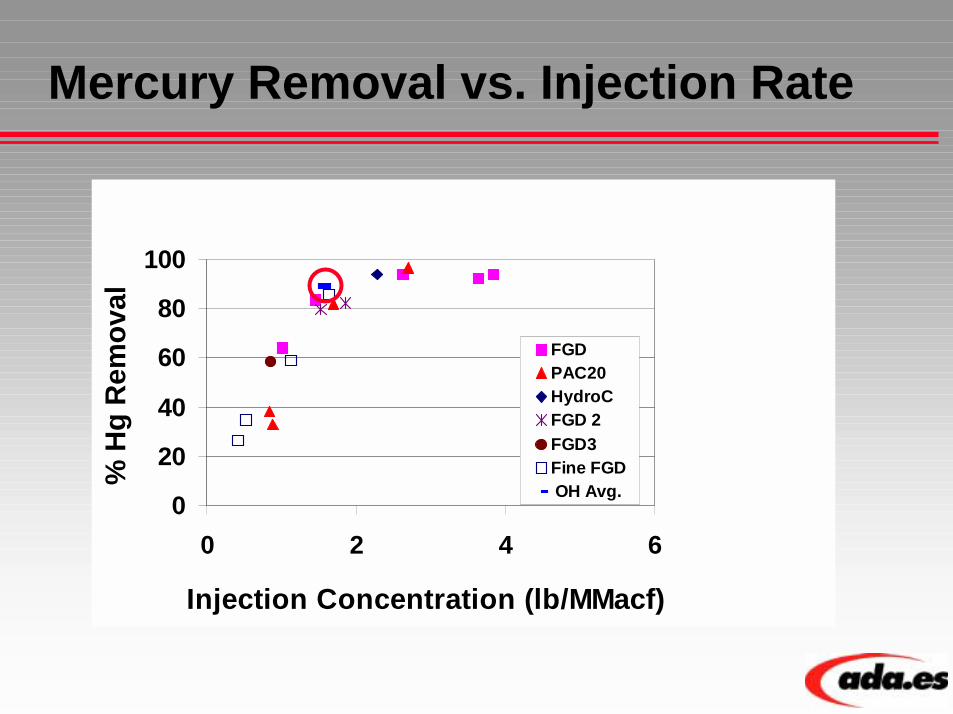
Mercury Removal vs. Injection Rate
0
20
40
60
80
100
0 2 4 6
Injection Concentration (lb/MMacf)
% H
g R
emov
al
FGDPAC20HydroCFGD 2FGD3Fine FGD OH Avg.

Ontario Hydro Measurements at Gaston
(microgram/dncm)PARTICULATE OXIDIZED ELEMENTAL TOTAL
Baseline (no ACI)COHPAC Inlet 0.09 9.54 5.97 15.60COHPAC Outlet 0.01 11.19 3.34 14.54Removal Efficiency 89.1% -17.3% 44.1% 6.8%
PAC InjectionCOHPAC Inlet 0.23 6.37 4.59 11.19COHPAC Outlet 0.12 0.91 0.03 1.05Removal Efficiency 45.6% 85.7% 99.3% 90.6%
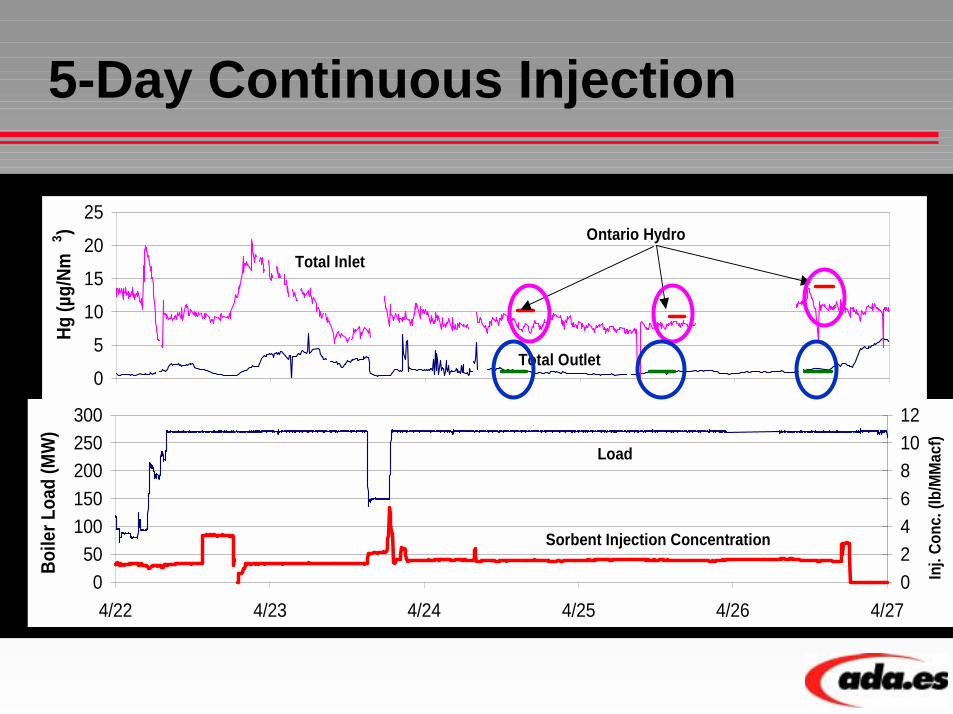
5-Day Continuous Injection
0
5
10
15
20
25
4/22 4/23 4/24 4/25 4/26 4/27
Hg (µ
g/Nm
3 )
Total Inlet
Total Outlet
Ontario Hydro
050
100150200250300
4/22 4/23 4/24 4/25 4/26 4/27
Boile
r Loa
d (M
W)
024681012
Inj.
Conc
. (lb
/MM
acf)
Load
Sorbent Injection Concentration
0
20
40
60
80
100
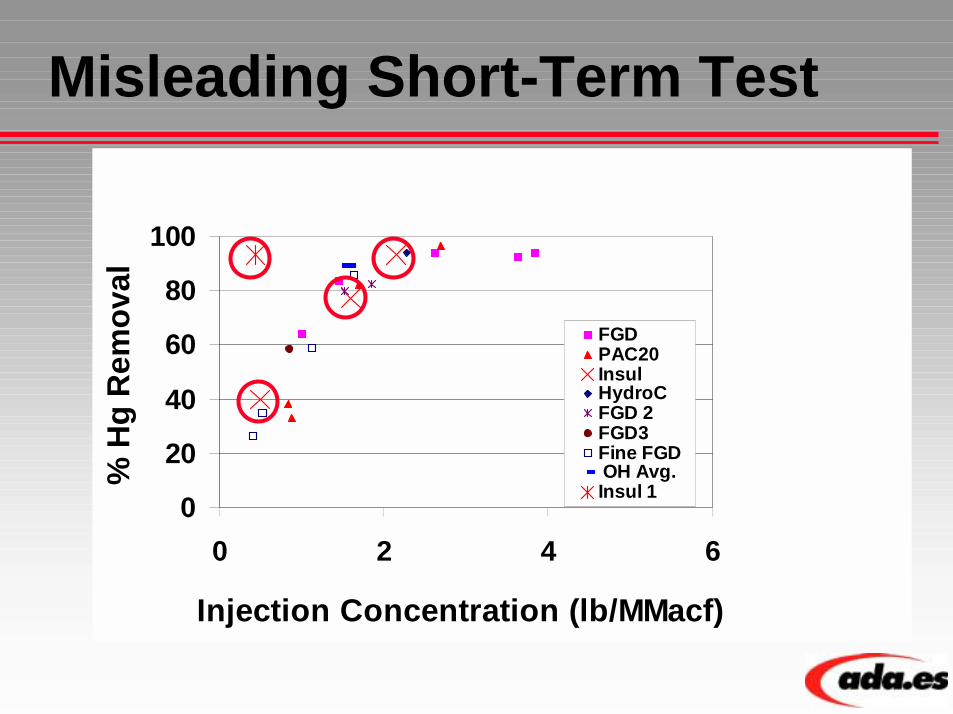
0 2 4 6
Injection Concentration (lb/MMacf)
% H
g R
emov
al
FGDPAC20InsulHydroCFGD 2FGD3Fine FGD OH Avg.Insul 1
Misleading Short-Term Test
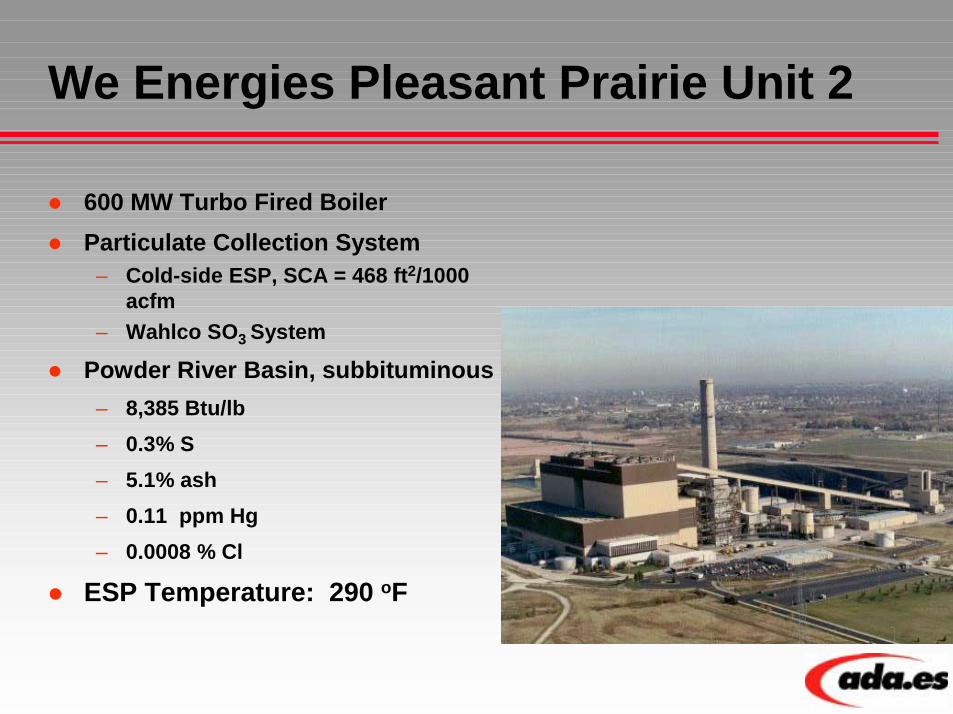
We Energies Pleasant Prairie Unit 2
! 600 MW Turbo Fired Boiler! Particulate Collection System
– Cold-side ESP, SCA = 468 ft2/1000 acfm
– Wahlco SO3 System
! Powder River Basin, subbituminous– 8,385 Btu/lb– 0.3% S– 5.1% ash– 0.11 ppm Hg– 0.0008 % Cl
! ESP Temperature: 290 oF
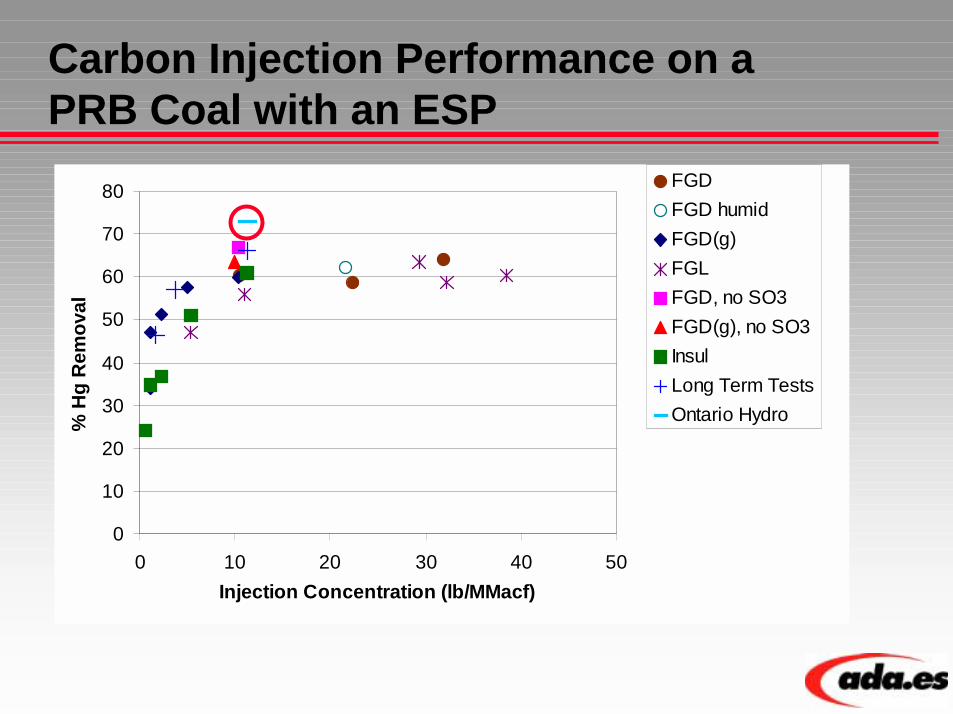
Carbon Injection Performance on a PRB Coal with an ESP
0
10
20
30
40
50
60
70
80
0 10 20 30 40 50Injection Concentration (lb/MMacf)
% H
g R
emov
al
FGDFGD humidFGD(g)FGLFGD, no SO3FGD(g), no SO3InsulLong Term TestsOntario Hydro

Speciated Mercury Measured by Ontario Hydro Method (10 lbs/MMacf)
PARTICULATE ELEMENTAL OXIDIZED TOTAL
Baseline (no ACI)ESP Inlet 1.97 12.22 2.51 16.71ESP Outlet 0.01 9.80 6.01 15.82Removal Efficiency 99.5% 19.8% -139.3 5.3%
(microgram/dncm)
PAC InjectionESP Inlet 0.98 14.73 1.73 17.44ESP Outlet 0.00 4.27 0.44 4.71Removal Efficiency 100.0% 71.0% 74.5% 73.0%
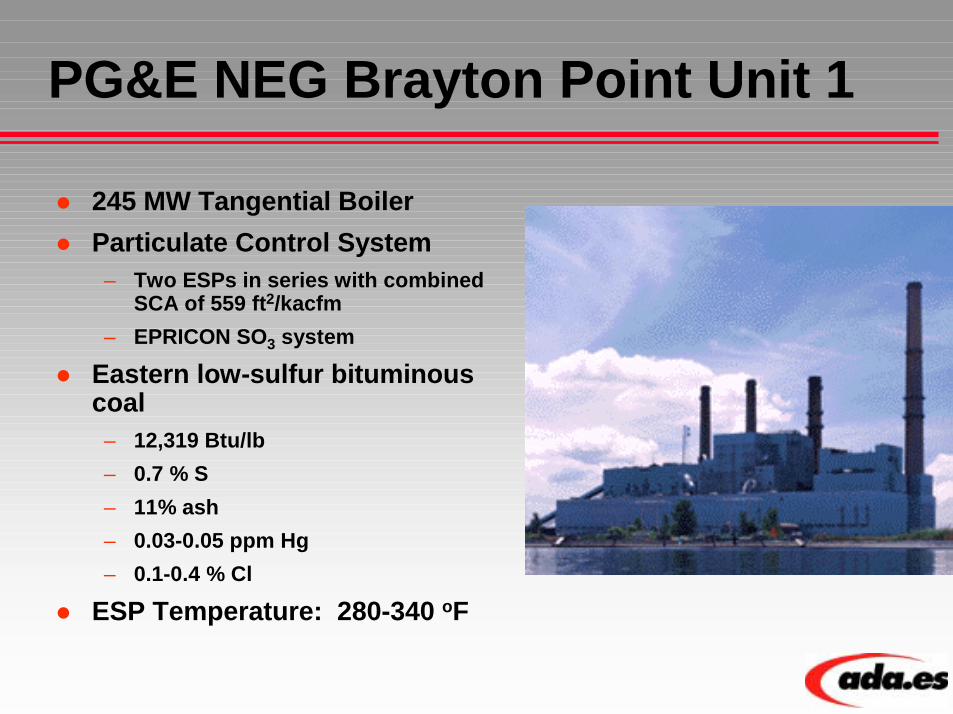
PG&E NEG Brayton Point Unit 1
! 245 MW Tangential Boiler! Particulate Control System
– Two ESPs in series with combined SCA of 559 ft2/kacfm
– EPRICON SO3 system
! Eastern low-sulfur bituminous coal
– 12,319 Btu/lb– 0.7 % S– 11% ash– 0.03-0.05 ppm Hg– 0.1-0.4 % Cl
! ESP Temperature: 280-340 oF

Sampling Locations
New ESP
APH
Old ESP
East Stack#1
#3 #4#2
#0
New ESP
APH
Old ESP
East Stack#1
#3 #4#2
#0
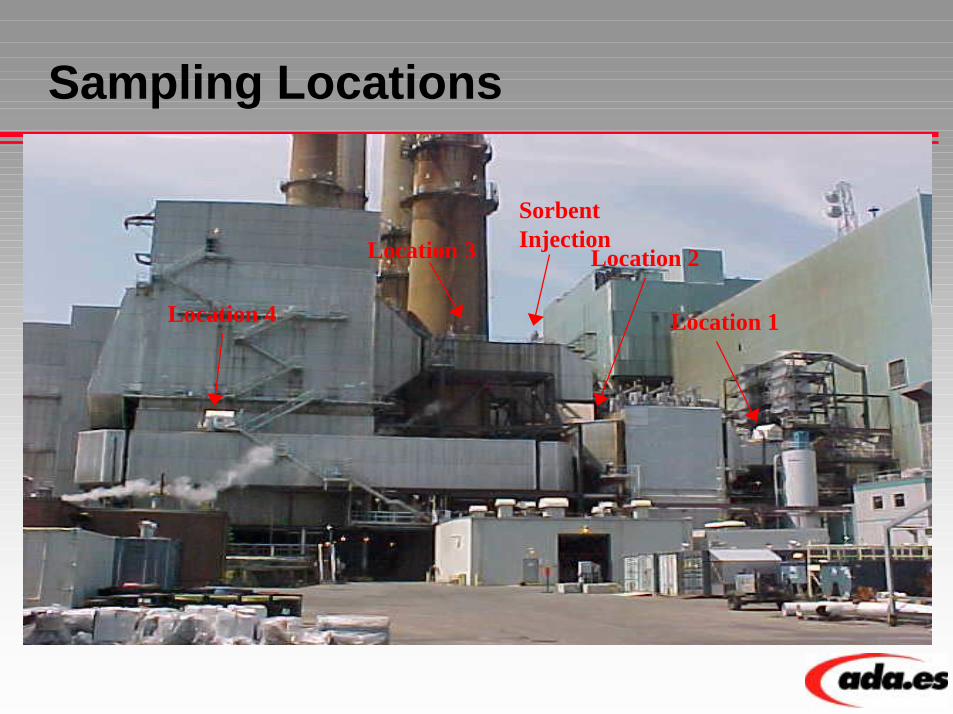
Sampling Locations
Location 1
Location 2Location 3
Location 4
Sorbent Injection

Variability of Baseline (no ACI) Mercury Removal at Brayton Point
Five sets of Ontario Hydro measurements have been made since 1999 documenting baseline mercury removal
! The coal specification for the West Virginia low-sulfur bituminous coal has been the same during this time period
! Measured variability:" Mercury in coal: 0.03-0.08 ppm" Chlorine in coal: 0.08-0.4 %" Mercury in flue gas: 2.9-6.4 ug/m3
" Percent of mercury(as oxidized or particulate): 89-95%
" Removal across ESP: 30-91%

Preliminary Results with ACI from S-CEM Measurements at BP
0
20
40
60
80
100
0 5 10 15 20 25
Injection Rate (lb/MMacf)
Mer
cury
Cap
ture
(%
Different symbols represent different sorbents or operating conditions

Mercury Removal Trends with ACI
0
20
40
60
80
100
0 5 10 15 20 25 30Injection Concentration (lb/MMacf)
Mer
cury
Rem
oval
(%) Brayton Point
PPPP
Gaston
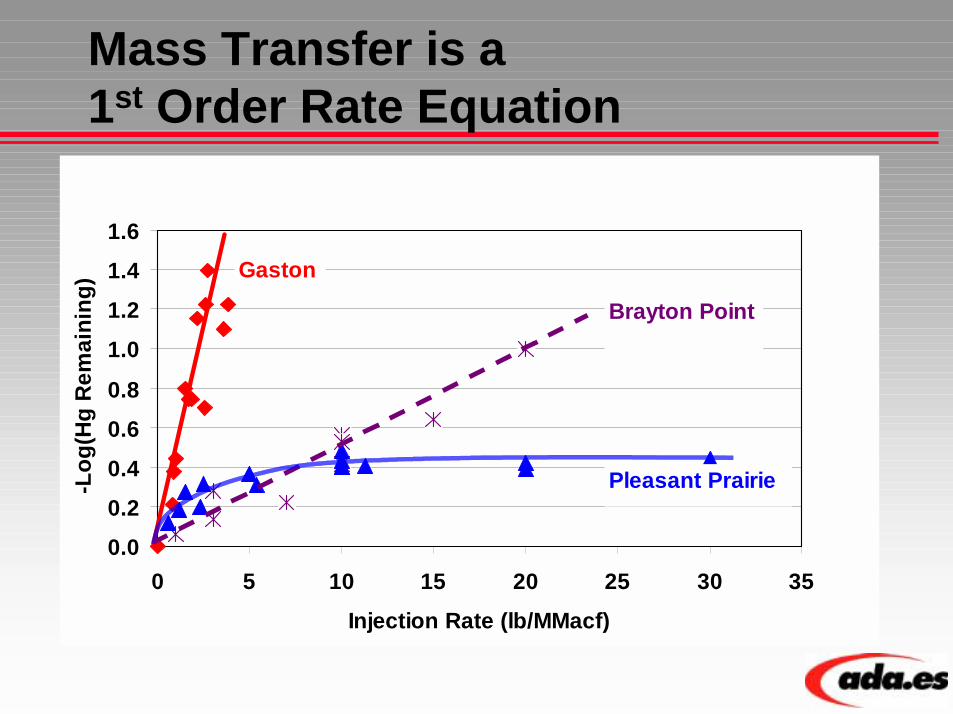
Mass Transfer is a 1st Order Rate Equation
0.00.20.40.60.8
1.01.21.41.6
0 5 10 15 20 25 30 35Injection Rate (lb/MMacf)
-Log
(Hg
Rem
aini
ng) Gaston
Pleasant Prairie
Brayton Point
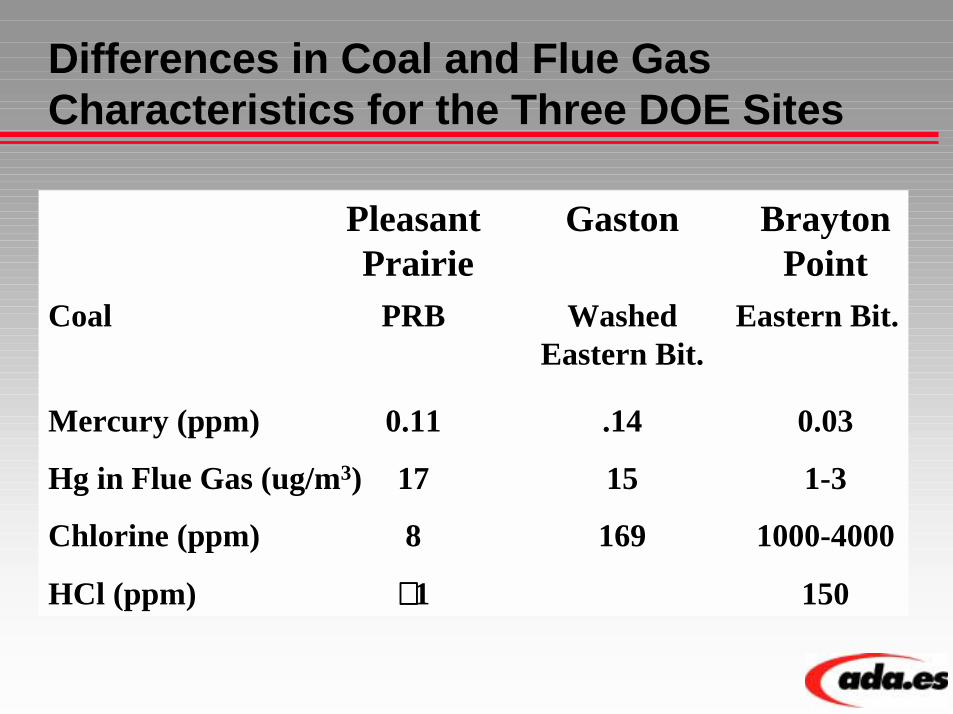
Differences in Coal and Flue Gas Characteristics for the Three DOE Sites
Pleasant Gaston Brayton Prairie Point
Coal PRB Washed Eastern Bit.Eastern Bit.
Mercury (ppm) 0.11 .14 0.03
Hg in Flue Gas (ug/m3) 17 15 1-3
Chlorine (ppm) 8 169 1000-4000
HCl (ppm) ≅≅≅≅ 1 150

Reasons to be Cautious in Extrapolating Preliminary Results from BP
! Bituminous coals present measurement challenges for S-CEMs
! Very low mercury concentrations in coal and flue gas (sorbent capacity and measurement issues)
! Unusual two ESPs in series configuration
! Exceptionally large ESP
! Documented variability in day to day performance

Spray Cooling and ACI! At Pleasant Prairie, no improvement in mercury removal
were observed when spray cooling by 50 oF
! Sorbents such as activated carbon have excess capacity and therefore are unlikely to benefit from spray cooling
! At Brayton Point, high levels of mercury removal were measured at ESP temperatures of 280-340 oF without cooling the gas
! Therefore, spray cooling should not be necessary for most applications of PAC injection
! May be beneficial when gas temperature is above 350 oF (i.e. lignite sites may require spray cooling)

Carbon-in-Flyash Issues
! Even small amounts of carbon in flyash can limit use as a cement admixture.
! If currently selling flyash, must address loss of sales and disposal
! Several developing technologies to address the problem:– Separation– Combustion– Chemical treatment– Configuration solutions such as TOXECON.
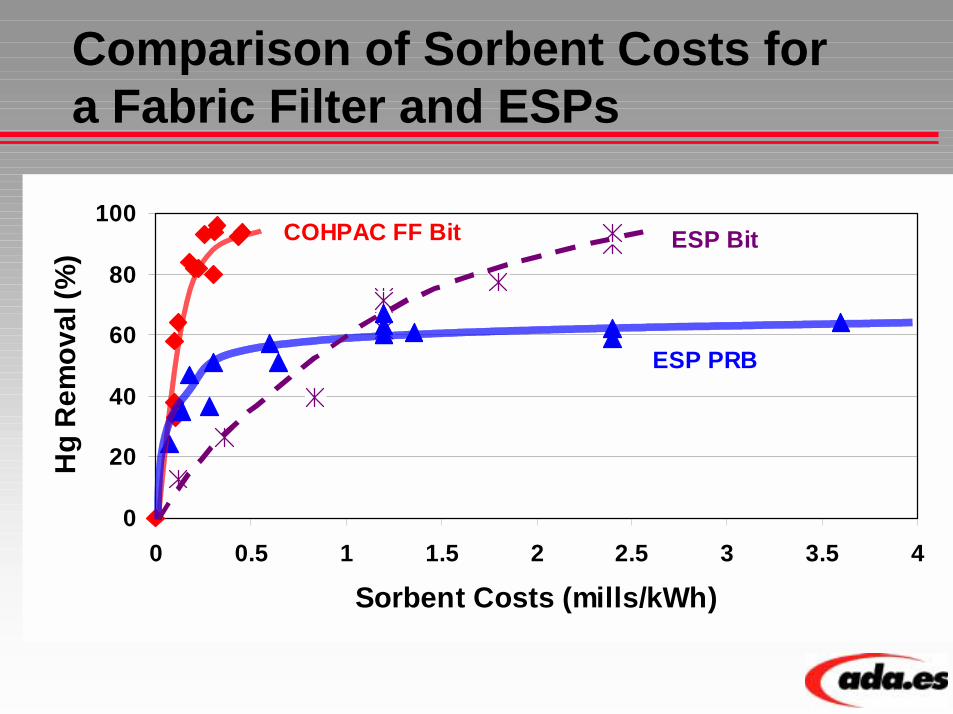
Comparison of Sorbent Costs for a Fabric Filter and ESPs
0
20
40
60
80
100
0 0.5 1 1.5 2 2.5 3 3.5 4
Sorbent Costs (mills/kWh)
Hg
Rem
oval
(%)
COHPAC FF Bit ESP Bit
ESP PRB

Conclusions! PAC injection can effectively capture elemental and
oxidized mercury from both bituminous and subbituminous coals
! Additional field tests and long-term demonstrations are necessary to continue to mature the technology
! Fabric filters provide better contact between the sorbent and mercury than ESPs resulting in higher removal levels at lower sorbent costs
! New COHPAC FF’s will have to be designed to handle higher loadings of PAC to insure high (>90%) mercury removal
! Coal characteristics appear to effect ACI performance with an ESP
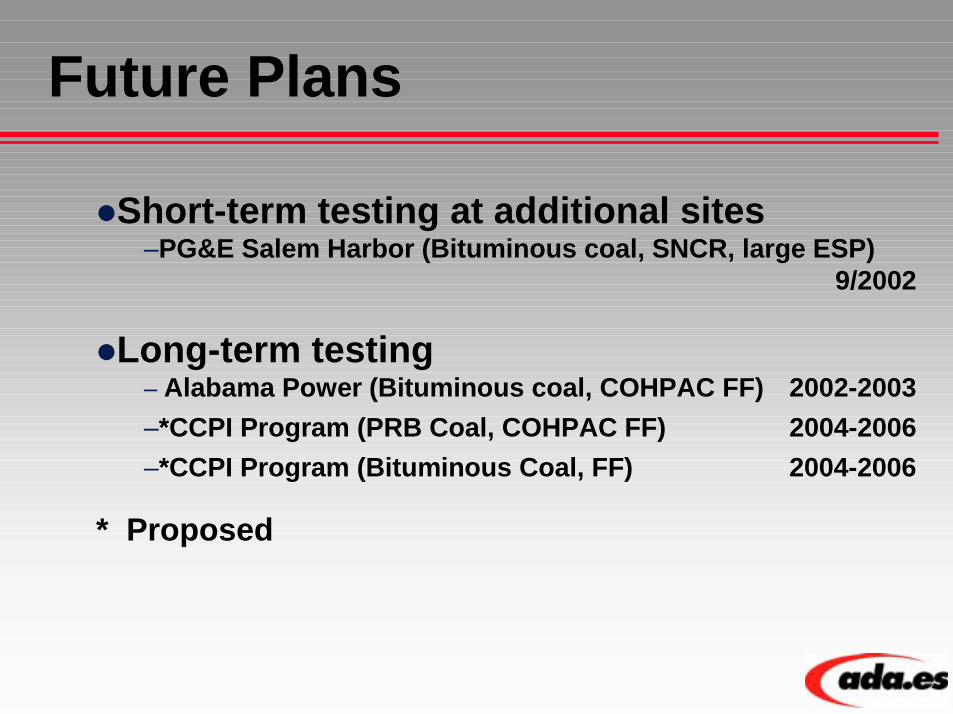
Future Plans
!Short-term testing at additional sites–PG&E Salem Harbor (Bituminous coal, SNCR, large ESP)
9/2002
!Long-term testing– Alabama Power (Bituminous coal, COHPAC FF) 2002-2003–*CCPI Program (PRB Coal, COHPAC FF) 2004-2006–*CCPI Program (Bituminous Coal, FF) 2004-2006
* Proposed