update on part c child outcomes lynne kahn eco at unc the early childhood outcomes (eco) center june...
Post on 19-Dec-2015
214 views
TRANSCRIPT
Update on Part C Child Outcomes
Lynne KahnECO at UNC
The Early Childhood Outcomes (ECO) Center
June 2011
Kathy HebbelerECO at SRI International
What we will cover
• Quick review of the reporting requirement and state approaches
• Share the national data• Describe how the national data were
computed• Discuss the quality of the national data• Discuss the meaning of the numbers
2Early Childhood Outcomes Center

3Early Childhood Outcomes Center
OSEP Reporting Requirements: Child Outcomes
• Positive social emotional skills (including positive social relationships)
• Acquisition and use of knowledge and skills (including early language/ communication)
• Use of appropriate behaviors to meet their needs
4Early Childhood Outcomes Center
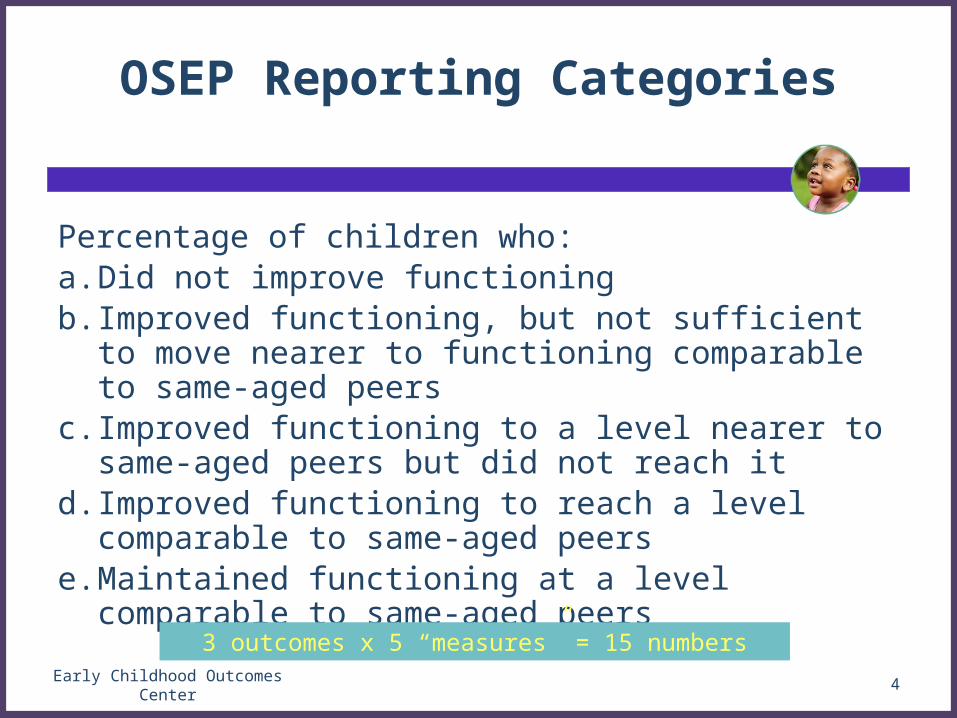
OSEP Reporting Categories
Percentage of children who: a. Did not improve functioningb. Improved functioning, but not sufficient to move nearer
to functioning comparable to same-aged peers c. Improved functioning to a level nearer to same-aged
peers but did not reach itd. Improved functioning to reach a level comparable to
same-aged peerse. Maintained functioning at a level comparable to same-
aged peers
3 outcomes x 5 “measures” = 15 numbers
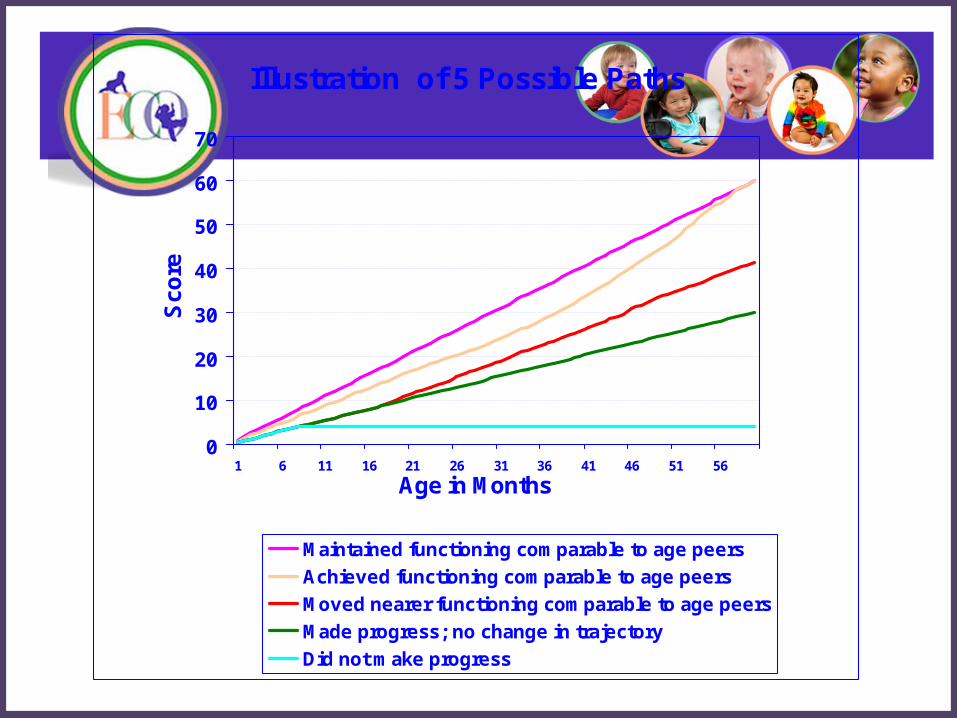
Illustration of 5 Possible Paths
0
10
20
30
40
50
60
70
1 6 11 16 21 26 31 36 41 46 51 56
Age in Months
Sco
re
Maintained functioning comparable to age peers
Achieved functioning comparable to age peers
Moved nearer functioning comparable to age peers
Made progress; no change in trajectory
Did not make progress
The Summary Statements
1. Of those children who entered the program below
age expectations in each outcome, the percent who
substantially increased their rate of growth by the
time they turned 6 years of age or exited the
program.
2. The percent of children who were functioning within
age expectations in each outcome by the time they
turned 6 years of age or exited the program.
6Early Childhood Outcomes Center
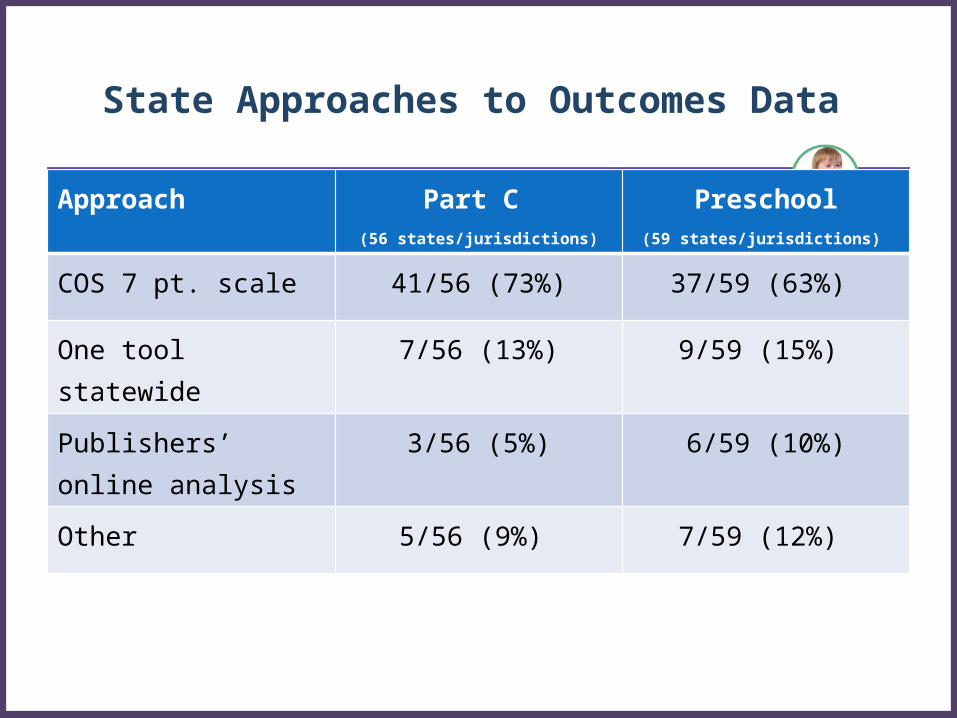
State Approaches to Outcomes Data
Approach Part C (56 states/jurisdictions)
Preschool(59 states/jurisdictions)
COS 7 pt. scale 41/56 (73%) 37/59 (63%)
One tool statewide 7/56 (13%) 9/59 (15%)
Publishers’ online analysis
3/56 (5%) 6/59 (10%)
Other 5/56 (9%) 7/59 (12%)
Early Childhood Outcomes Center 8
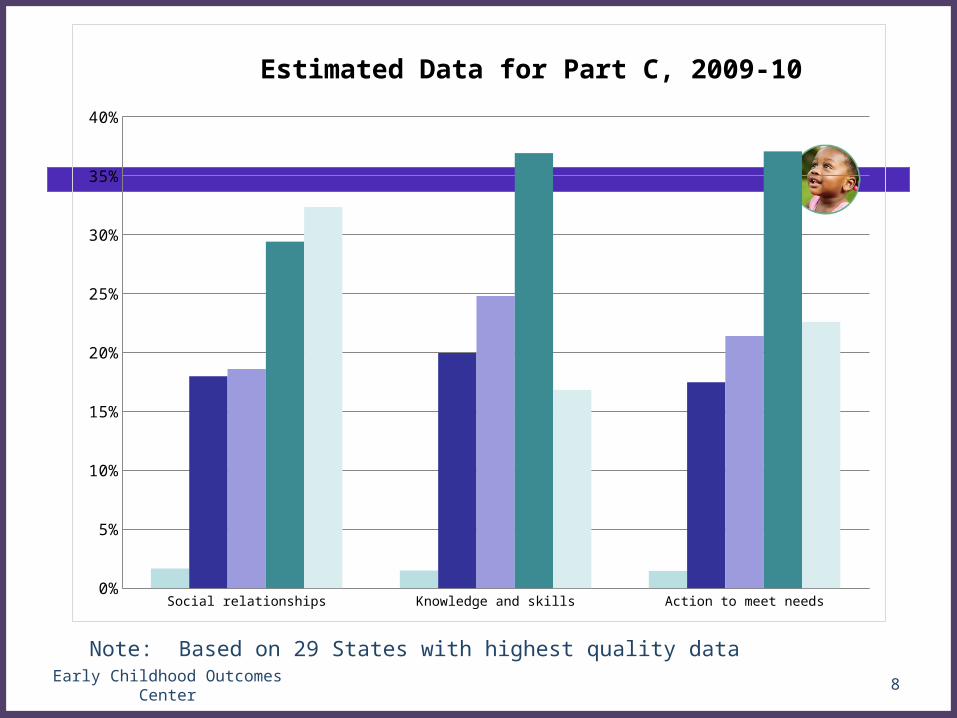
Note: Based on 29 States with highest quality data
Social relationships Knowledge and skills Action to meet needs
a 0.0165481765021159 0.0148974177446063 0.0145225115393538
b 0.179791044501508 0.199542744006336 0.174681665026758
c 0.185932320590047 0.2479939571384 0.214074779812331
d 0.294138593838745 0.369311305766877 0.370708975497372
e 0.323587775084595 0.168236271568792 0.22601676946091
3%
8%
13%
18%
23%
28%
33%
38%
Estimated Data for Part C, 2009-10

Early Childhood Outcomes Center 9
Note: Based on 29 States with highest quality data
Social relationships Knowledge and skills Action to meet needs
SS1 0.70973347275746 0.742180533377054 0.755546347980436
SS2 0.61772636892334 0.537547577335669 0.596725744958282
5%
15%
25%
35%
45%
55%
65%
75%
Estimated Summary Statement Data for Part C, 2009-10
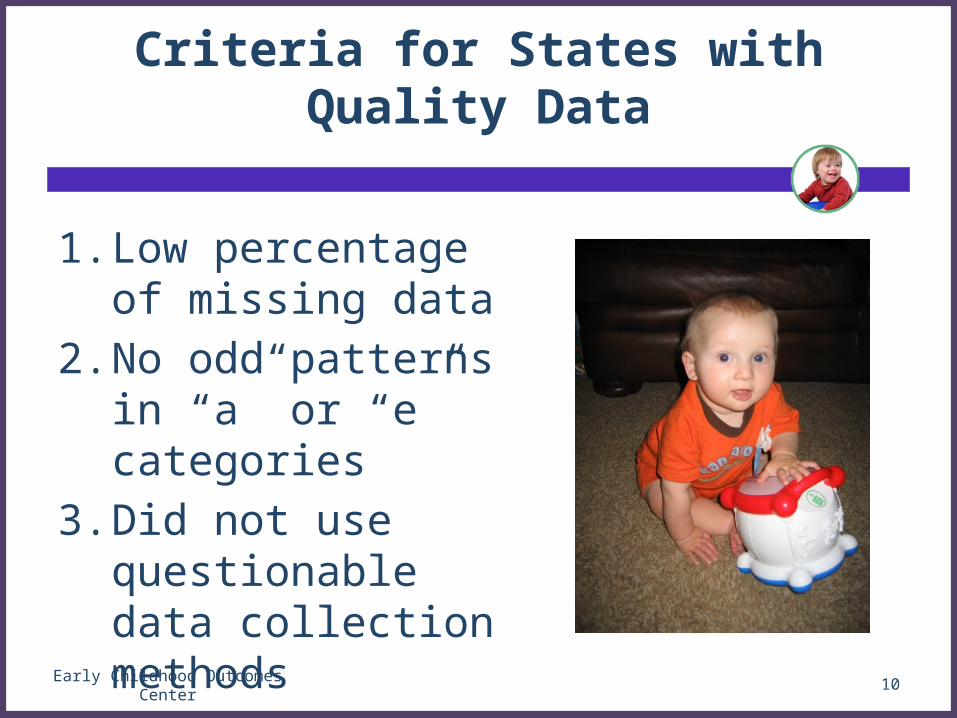
Criteria for States with Quality Data
1. Low percentage of missing data
2. No odd patterns in “a” or “e” categories
3. Did not use questionable data collection methods
10Early Childhood Outcomes Center

Calculating Missing Data for Part C
Proxy for missing data =
Number with data for C3/
Exiting Data (618)
11Early Childhood Outcomes Center
• Do not expect this number to be 100%
• ..but we don’t expect it to be 10% either
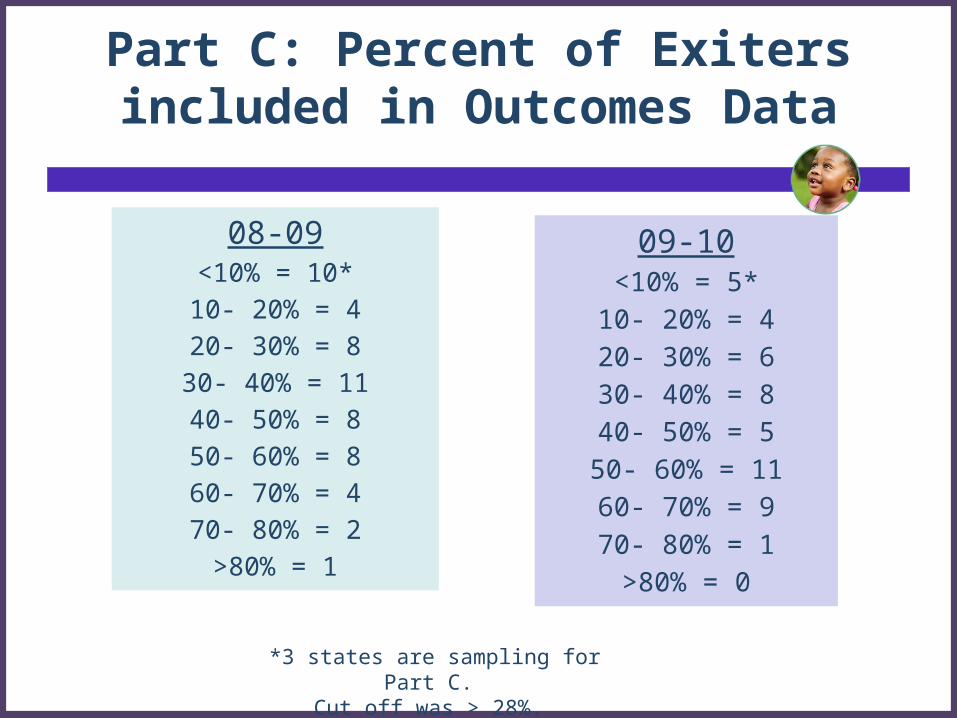
Part C: Percent of Exiters included in Outcomes Data
08-09<10% = 10*
10- 20% = 4
20- 30% = 8
30- 40% = 11
40- 50% = 8
50- 60% = 8
60- 70% = 4
70- 80% = 2
>80% = 1
09-10<10% = 5*
10- 20% = 4
20- 30% = 6
30- 40% = 8
40- 50% = 5
50- 60% = 11
60- 70% = 9
70- 80% = 1
>80% = 0
*3 states are sampling for Part C. Cut off was > 28%.
Problem with Missing Data
• We don’t know how well the data the state has represent the entire state.
• If the data are representative, the percentages for the a to e Progress Categories and the Summary Statements won’t change as data are added on more children.
13Early Childhood Outcomes Center
Early Childhood Outcomes Center 14
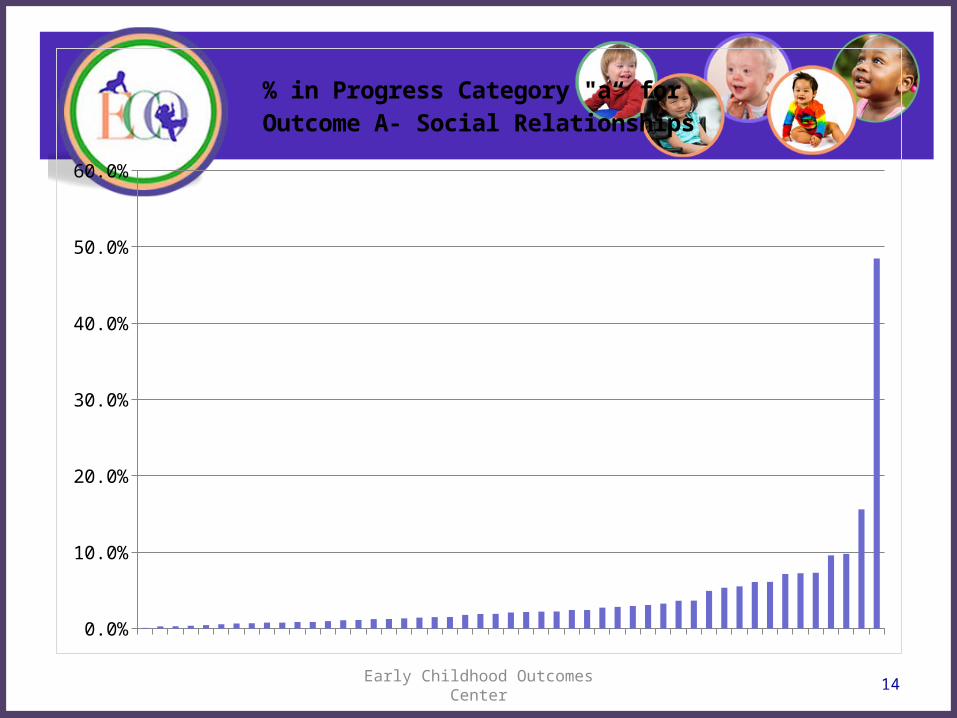
0.0%
10.0%
20.0%
30.0%
40.0%
50.0%
60.0%
% in Progress Category "a“ for Outcome A- Social Relationships
Can we trust these data?
15Early Childhood Outcomes Center
Pattern checking for validity
• Checking across years– How do the 2009-10 compare to the data
for 2008-09?• Checking across methods
– How do the data for all states compare to states with highest quality data?
16Early Childhood Outcomes Center
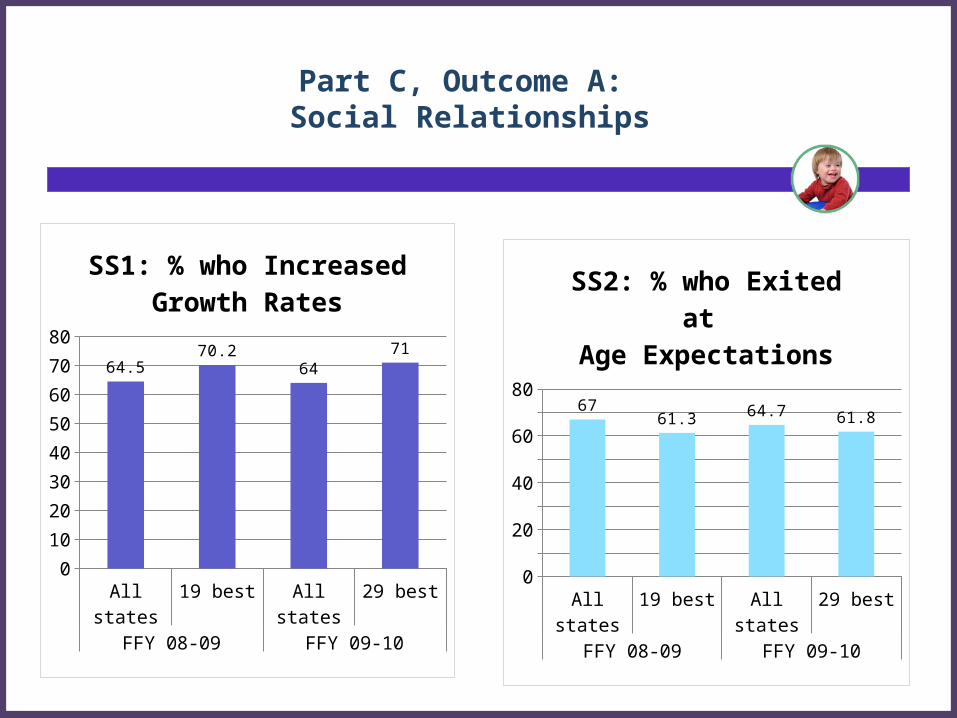
All states 19 best All states 29 bestFFY 08-09 FFY 09-10
0
10
20
30
40
50
60
70
80
64.570.2
64
71
SS1: % who IncreasedGrowth Rates
Part C, Outcome A: Social Relationships
All states 19 best All states 29 bestFFY 08-09 FFY 09-10
0
10
20
30
40
50
60
70
80
6761.3
64.761.8
SS2: % who Exited at Age Expectations
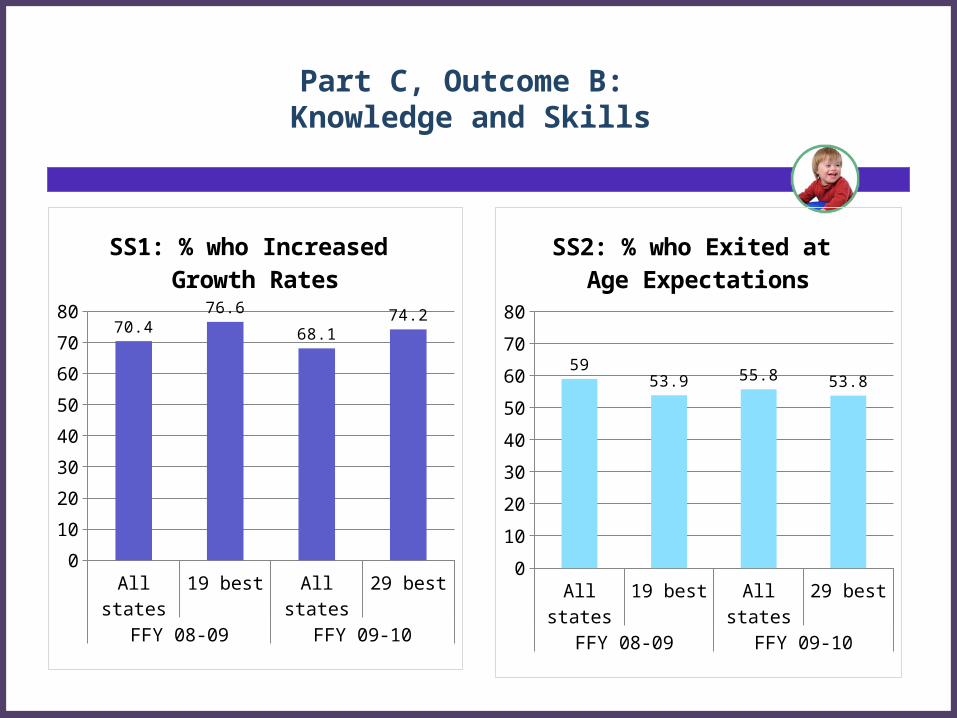
Part C, Outcome B: Knowledge and Skills
All states 19 best All states 29 bestFFY 08-09 FFY 09-10
0
10
20
30
40
50
60
70
8070.4
76.6
68.1
74.2
SS1: % who Increased Growth Rates
All states 19 best All states 29 bestFFY 08-09 FFY 09-10
0
10
20
30
40
50
60
70
80
5953.9 55.8 53.8
SS2: % who Exited at Age Expectations
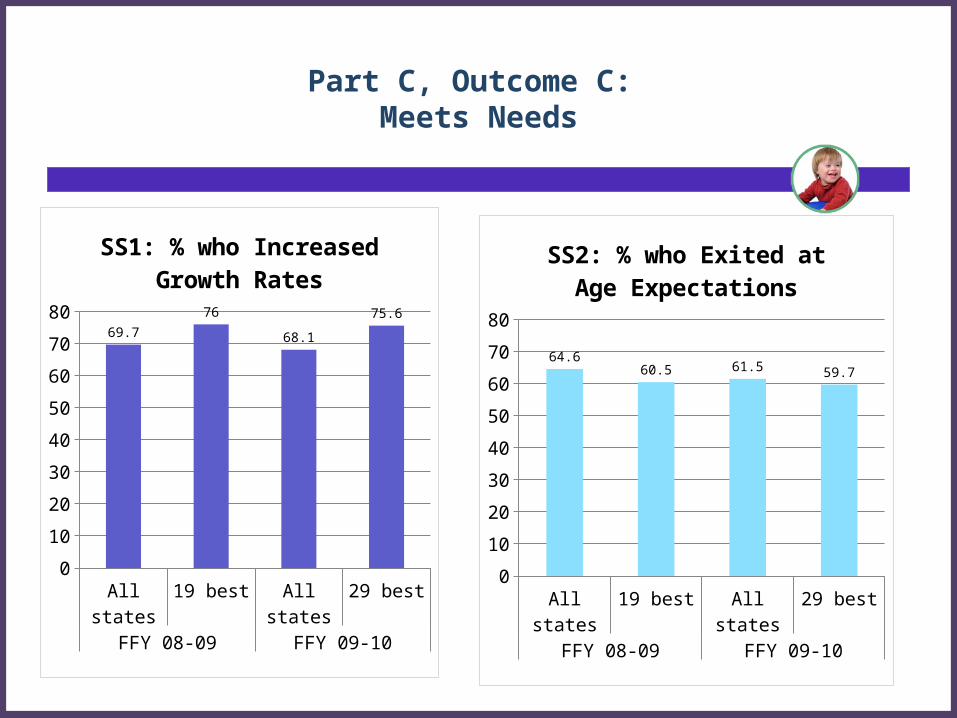
Part C, Outcome C: Meets Needs
All states 19 best All states 29 bestFFY 08-09 FFY 09-10
0
10
20
30
40
50
60
70
80
69.7
76
68.1
75.6
SS1: % who Increased Growth Rates
All states 19 best All states 29 bestFFY 08-09 FFY 09-10
0
10
20
30
40
50
60
70
80
64.660.5 61.5 59.7
SS2: % who Exited at Age Expectations
What to these data tell us?
• Nationally, a high proportion of children who receive Part C services are showing greater than expected progress
• Nationally, many (over half) are exiting the program functioning like same age peers in at least one of the outcomes.
20Early Childhood Outcomes Center
Should your state data look like the national data?
• Probably not• More important that each state continue to
focus on the quality of its own data– Getting outcomes data on all children who exit– Working with programs whose data look
unusual to address possible data quality issues
21Early Childhood Outcomes Center
Additional information
For information on improving data quality and using data for program improvement
www.the-eco-center.org
22Early Childhood Outcomes Center
Measuring and Improving Child and Family Outcomes Conference, September 18-21,
2011 in New Orleans, LA