update on the implementation of senate bill 1 (2009) interim joint committee on education june 10,...
TRANSCRIPT

Update on the Implementation of Senate Bill 1 (2009)
Interim Joint Committee on EducationJune 10, 2013
Kentucky Department of Education

Senate Bill 1 (2009) New academic standards New assessments Program Reviews Improved professional
development New accountability system Unified plan for improving college/career
readiness
Unbridled Learning
2
2

Senate Bill 1 (2009) required new standards that: Focus on the “critical knowledge, skills and
capacities needed for success in the global economy.”
“Consider international benchmarks” and “consider standards that have been adopted by national content advisory groups and professional education consortia.”
Are aligned across all levels – elementary, middle, high and postsecondary.
3

The new standards: Were developed by education experts and state
partners. Included broad input from Kentucky and other states’
teachers, administrators, higher education officials, business and industry, and the staffs of the Council on Postsecondary Education (CPE) and KDE.
Over 340 teachers and education professionals participated in discussions and negotiations to revise Kentucky’s academic standards.
4

Standards vs. CurriculumKRS 160.345 / SB 1
Standards• Are broad statements of WHAT
we want students to know/be able to do by a set time.
• Define the ‘what’ of teaching and learning – but not the how.
• Typically involve multiple skills/reasoning.
• Define WHAT we plan to ensure students have learned at key points in schooling – typically our end of year, high stakes tests focus on these.
Curriculum• Takes the WHAT and translates it
into HOW – typically through a backwards design process that views the STANDARD as the end point, and considers all the steps it will take to get there:
• Deconstructed Standards• Curriculum Maps • Unit Development• Unit Assessments• Materials and Resources
5

Professional Learning and SupportRegional Leadership Networks
• 550+ English/language arts teachers • 500+ mathematics teachers • 600+ school and district leaders
6

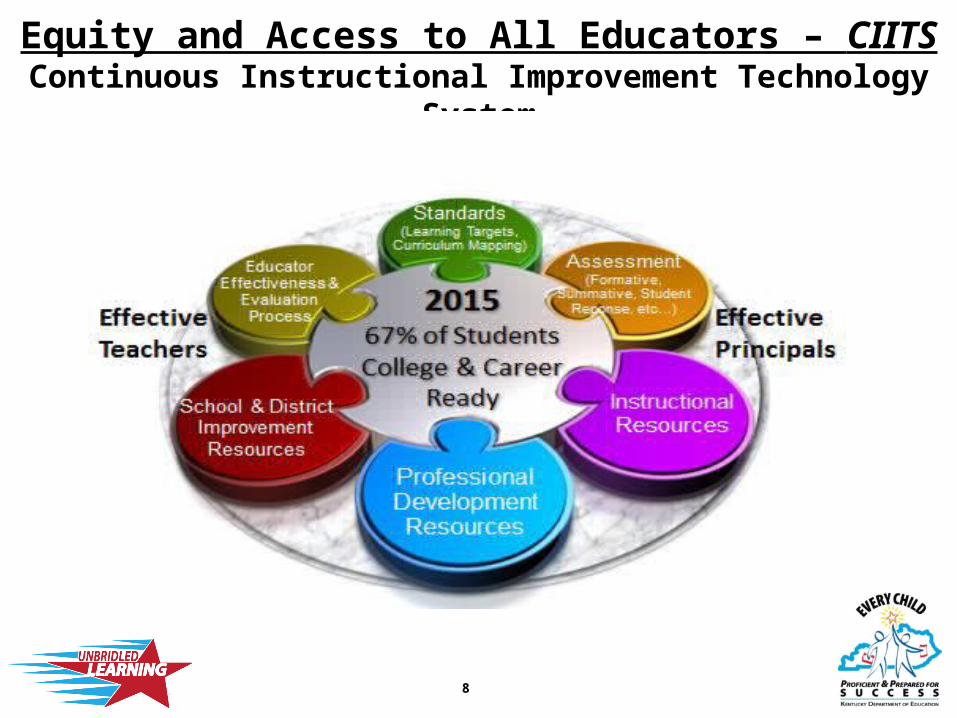
Equity and Access to All Educators – CIITSContinuous Instructional Improvement Technology System
CIITS is a multi-phase, multi-year project designed to provide Kentucky public school educators with the 21st-century resources they need to carry out highly-effective teaching and learning in every classroom in Kentucky.
CIITS went live statewide on August 1, 2011. In CIITS, teachers are able to access Kentucky Core Academic
Standards and access to high-quality, multi-media instructional resources. CIITS contains a lesson planning tool and scheduler to help teachers manage standards-based instruction in their classrooms. Teachers may also share instructional resources they design through CIITS.
Log In Data: 17,679 Teachers 869 Leaders
Professional Development Logged (PD 360) Access: 341,368 Minutes (5,689 Hours)
7
Equity and Access to All Educators – CIITSContinuous Instructional Improvement Technology System
8

Develop Adopt Implement Assess
May 2009 – KY’s participation in Common Core Standards Initiative. •State led with over 340 teachers, leaders, faculty, business and community involved.•Opportunities to provide feedback•KDE calls with content experts.
December 2009 – First Review by KBE of 704 KAR 3:303, Kentucky Core Academic Standards. February 2010 – The KBE, CPE and the EPSB jointly adopted these Common Core Standards and the Administrative Regulation Review Subcommittee approved.June 2013 – KBE adopts resolution reaffirming support.
Summer 2010 –Leadership Networks launched.2010-Present – Number of Teachers implementing:•Over 1,050 teachers met regionally to deconstruct standards and design instructional resources and curriculum.
Assessment redesign began.Summer 2010 – Teachers met to align assessments to new standards.Fall 2011 – Field tested new items .Spring 2012 – Students were first assessed. Fall 2012 – Accountability for the 2011-12 school year on new items aligned to new standards.
9

Voices from Kentucky Practitioners
Kentucky Department of Education
10

TELL KY Data 2013Shifts in Instructional Practices Showed Highest
Rates of Agreement; Second in Growth
Rate
of A
gree
men
t
+5.1 85.9
80.8
2 Years of KCAS Implementation
11

TELL KY 2013 Highlights 2 Years of KCAS
Implementation
12

Senate Bill 1 Goals
… the Council on Postsecondary Education, the Kentucky Board of Education and the Kentucky Department of Education are hereby directed to develop a unified strategy to reduce college remediation rates by at least 50% by 2014 from what they are in 2010 and increase college completion rates of students enrolled in one or more remedial classes by 3% annually from 2009 to 2014.
13

College and Career Readiness Goals
• Increase the Averaged Freshman Graduation Rate from 76% (36,480 students) to 90% (43,200 students) by 2015.
• Increase the percentage of students who are college and career ready from 34% (16,320 students) to 67% (32,160 students) by 2015.
14

Persistence to graduation Course and assessment alignment Unbridled Learning
accountability model Targeted interventions Career readiness pathways Acceleration (AdvanceKY, Project Lead the
Way, Early College Designs) Academic and career advising Priority Schools’ interventions
College and Career Readiness Strategies
15

16

Percent Students Meeting College and Career Ready Benchmarks
34%
38%
47.2%
13,0
00 S
tude
nts
13,0
00 S
tude
nts
15,0
00 S
tude
nts
15,0
00 S
tude
nts
20,3
43 S
tude
nts
20,3
43 S
tude
nts
17

Voices from the Field
Student Learning: Then and Now
Kentucky Department of Education
18

Senate Bill 1 (2009) required new standards that: Focus on the “critical knowledge, skills and
capacities needed for success in the global economy.”
“Consider international benchmarks” and “consider standards that have been adopted by national content advisory groups and professional education consortia.”
Are aligned across all levels – elementary, middle, high and postsecondary.
19

Shifts• Three dimensions integrated (Science &
Engineering Practices, Core Ideas, Crosscutting Concepts).
• Standards stated as student performance expectations, many with assessment boundaries.
• Engineering integrated into K-12.• Increased emphasis on the practices of science, not
just content.
20

21

Develop Adopt Implement Assess
Summer 2011 – Framework releasedSeptember 2011 –Kentucky accepted as a lead stateMay 2012 –First public draft releasedJanuary 2013 – Second public draftApril 2013 –Final release of standards
April 2013 – First review by KBE of 704 KAR 3:303, Kentucky Core Academic Standards (KCAS)June 2013 –KBE adopted the new Kentucky Core Academic Standards for Science Fall 2013 – Updated regulation will go to ARRS and then IJC on Education for legislative review.
September 2013 –Launch Science Networks
2014-15 School Year – Assess new KCAS for Science
22

ACT QualityCore® End-of-Course Kentucky Online Testing Update
Kentucky Department of Education
23
End Of Course Assessments English II Algebra II Biology U.S. History
100% of High Schools Use Score for Grading Addresses student motivation Provides rich set of instructional materials Uses score for local and state purposes
Background
24

In 2012, 34% or 59,755 students were successfully tested with the ACT online system.
Because of the immediate results and other changes to the end-of-course (EOC) assessments, there was an increased interest in the online testing in 2013.
65% of schools were planning to use online testing in 2013.
Over 10,000 students were successfully tested throughout the 2012-13 school year prior to April 29.
Background
25

From April 29 to May 3, ACT ran into significant capacity issues while trying to handle online testing from high schools in Alabama, Ohio, and Kentucky.
ACT informed KDE on May 3 that they were closing the online system to make repairs.
KDE decided to require all schools to move to a paper version of the test.
Problem
26

Some schools were allowed to complete their tests using the repaired online system starting on May 8. These schools either had partially completed tests in the online system, severe scheduling issues or problems with delivery of paper tests.
Approximately 2,000 students in 30 schools are known to have had interrupted online test sessions but were able to complete the tests.
Impact
27

Schools converting from online tests to paper administration experienced challenges in rescheduling.
Local grading policies were reviewed for impact. Some schools revised policies or delayed grade reports.
100% of high school students expected to take EOC tests completed testing in the online system or with paper.
Impact (continued)
28

KDE, Education Measurement, HumRRO and ACT psychometricians will evaluate the impact of the testing problems on scores for individual students and schools.
KDE will review accountability scores for the affected schools for appropriate use.
KDE will contact district staff as this process evolves.
Accountability
29

Two important issues are being discussed:
Contractual impact for the 2013 testing program
Contractual impact for the 2013-14 school year
Decisions for the Future
30

ACT QualityCore® End-of-Course Constructed Response (CR) Update
Kentucky Department of Education
31

The Call for a New Assessment System
• Senate Bill 1 (SB 1), enacted in the 2009 Kentucky General Assembly, required a new public school assessment program beginning in the 2011-12 school year.
• The legislation allowed, with approval by the Kentucky Board of Education (KBE), an end-of-course (EOC) assessment program at the high school level.
32
End-of-Course: Dual Purpose
• Instruction
– Objectives
– Syllabus
– Course Outline
– Instructional Units
– Formative Item Pool/Benchmark Assessments
• Accountability
– Student
– School
– District
– State
33

Issues with State-Administered Constructed Response
• Unable to add instructional value• Lack of student motivation• Security of CR items• Return of CR scores untimely• Confusion with two different scores
– Scale Score (MC/MC)– Super Scale Score (MC/MC/CR)
34

Local Administration Instructional Value
• Constructed Response administered locally will render more instructional value.– Students, parents, teachers have student work
to score and analyze.– Teachers can identify strengths and
weaknesses in student writing and content.– Instruction can be based on current data.
35

Constructed Response Shift to Local Administration
• Local staff may obtain CR items from various locations:– Formative Item Bank (ACT System)– Benchmark Assessment (ACT System)– Local Source
• Textbook• Locally-developed• Open source
36

• Constructed Response will not be part of state-administered assessment.• Students will take multiple choice sections for state
accountability.• Schools will receive Scale Score (MC/MC).
• Constructed Response will be administered at the local level.• Local administration and scoring • Inclusion in student’s final exam grade• Instructional value
Constructed Response Shift to Local Administration (continued)
37

EOC Results Included in Student Grades
• End-of-course (EOC) test results may be used for a percentage of a student’s final grade in the course, as outlined in local policy. If that percentage is less than 20 percent, school districts will submit reports to KDE providing justification.
• KDE has developed a collection tool that is to be completed by December 31 of each year.
• Percentage used for student’s final grade• Justification• Utilization of Constructed Response items will be
added to this survey
38

Financial Benefit
• Potential savings of $2 million annually.
39