updated 2011 shsp
TRANSCRIPT

LA SHSP Update – October 2011
i

LA SHSP Update – October 2011
i
Table of Contents
Executive Summary ............................................................................................................................... ES-1
1. Background and Introduction ..................................................................................................... 1-1
1.1 History and Purpose .............................................................................................................. 1-1
1.2 Challenges ............................................................................................................................ 1-2
1.3 Accomplishments .................................................................................................................. 1-4
2. Vision, Mission, Goals, and Performance Measures ................................................................. 2-1
2.1 Vision and Mission ................................................................................................................ 2-1
2.2 Goal ....................................................................................................................................... 2-1
2.3 Performance Measures ......................................................................................................... 2-2
3. Problem Identification and Emphasis Area Selection ............................................................... 3-1
3.1 Alcohol-Related Driving ......................................................................................................... 3-2
3.2 Occupant Protection .............................................................................................................. 3-5
3.3 Infrastructure and Operations ................................................................................................ 3-8
3.4 Crashes Involving Young Drivers .......................................................................................... 3-14
4. SHSP Management, Implementation, and Evaluation ............................................................... 4-1
4.1 SHSP Update Process .......................................................................................................... 4-1
4.2 Management and Implementation ......................................................................................... 4-2
4.3 Evaluation.............................................................................................................................. 4-6


LA SHSP Update – October 2011
ii
List of Tables
1.1 Trends in Fatalities, Serious Injuries, and Rates by 100 Million Vehicle Miles Traveled ....... 1-3
1.2 Trends in Vehicles Miles of Travel and Number of Licensed Drivers ...................................... 1-3
3.1 Percent Alcohol-Related Fatal Crashes ...................................................................................... 3-2

LA SHSP Update – October 2011
iii
List of Figures
ES.1 Contributors to Fatalities as Percent of Total Problem ............................................................. ES-2
ES.2 Louisiana SHSP Implementation Structure ................................................................................ ES-3
2.1 Benchmarks to Achieve 50 Percent Reduction in Fatalities by 2030 ....................................... 2-1
2.2 Benchmarks to Achieve 50 Percent Reduction in Fatalities and Serious Injuries by 2030 ... 2-2
3.1 Contributors to Fatalities as Percent of Total Problem ............................................................. 3-1
3.2 Alcohol-Related Fatal Crashes and Fatalities ............................................................................ 3-3
3.3 Alcohol-Related Serious Injuries................................................................................................. 3-3
3.4 Benchmarks to Achieve a 50 Percent Reduction in Alcohol-Related Fatalities by 2030 ....... 3-4
3.5 Benchmarks to Achieve a 50 Percent Reduction in Alcohol-Related Injuries by 2030 .......... 3-4
3.6 Observed Safety Belt Use ............................................................................................................ 3-6
3.7 Percent of Unrestrained Fatalities............................................................................................... 3-7
3.8 Benchmarks to Achieve a 50 Percent Reduction in Unrestrained Fatalities by 2030............. 3-7
3.9 Benchmarks to Achieve a 50 Percent Reduction in Unrestrained Injuries by 2030 ............... 3-7
3.10 Percent of All Fatal Crashes and Serious Injury Crashes Involving Roadway Departure ..... 3-8
3.11 Benchmarks to Achieve a 50 Percent Reduction in Roadway Departure Fatalities by 2030 . 3-10
3.12 Benchmarks to Achieve a 50 Percent Reduction in Roadway Departure Injuries by 2030 .... 3-11
3.13 Benchmarks to Achieve a 50 Percent Reduction in Intersection Fatalities by 2030 .............. 3-11
3.14 Benchmarks to Achieve a 50 Percent Reduction in Intersection Injuries by 2030 ................. 3-12
3.15 Young Drivers (Age 14 to 24) Representation in Fatal Crashes ............................................... 3-14
3.16 Fatal Crashes and Serious Injury Crashes Involving Drivers Age 16 to 24 ............................. 3-14
3.17 Alcohol-Related Fatal Crashes and Serious Injury Crashes Involving Drivers Age 16 to 24 3-15
3.18 Benchmarks to Achieve a 50 Percent Reduction in Fatalities Involving Young Drivers by 2030 ................................................................................................................................................ 3-15
3.19 Benchmarks to Achieve a 50 Percent Reduction in Injuries Involving Young Drivers by 2030 ................................................................................................................................................ 3-16
4.1 Louisiana SHSP Project Management Team .............................................................................. 4-2

LA SHSP Update – October 2011
ES-1
Executive Summary
Despite recent major accomplishments, Louisiana has one of the highest fatality rates in the country. From 1993 through 2008, the U.S. average fatality rate steadily decreased while the Louisiana fatality rate remained relatively unchanged until 2009 and 2010 when it fell below two fatalities per 100 million vehicle miles traveled. Although not measurable with precision, the partners and stakeholders associated with the Louisiana Strategic Highway Safety Plan (SHSP) believe the multidisciplinary, data driven strategic plan, which includes a focus on reducing motor vehicle deaths and injuries through engineering, enforcement, education, and emergency response, is at least in part responsible for the reduction in fatalities and serious injuries on Louisiana’s roadways.
This document, which updates the original 2006 Louisiana SHSP, accomplishes the following:
Enhances collaboration across agencies on the update and implementation of the SHSP;
Aligns the safety goals and objectives of the State’s various safety plans;
Narrows the focus of the SHSP to the areas of greatest need and potential for success as identified through a detailed data analysis process;
Reflects recent science-based research which helps quantify the effectiveness of both engineering and behavioral safety countermeasures;
Reinvigorates stakeholder participation in SHSP implementation; and
Provides a focus on countermeasure evaluation.
Analysis of crash data from 2006 to 2008 informed the emphasis areas for the plan. Figure ES.1 shows the leading factors contributing to fatalities in Louisiana, include failure to buckle up, speeding and aggressive driving, run off the road crashes, alcohol-related driving, young drivers, distracted driving, and intersection crashes.

LA SHSP Update – October 2011
ES-2
Figure ES.1 Contributors to Fatalities as Percent of Total Problem 2006-2008
Source: Louisiana State University Highway Safety Research Group (HSRG) Reports – Traffic Data, 2011.
Based on analysis of the data and other considerations, the Louisiana Department of Transportation and Development (DOTD), Louisiana State Police (LSP), and the Louisiana Highway Safety Commission (LHSC) recommended adoption of four emphasis areas for focusing attention, energy, and resources:
Alcohol-Related Driving;
Occupant Protection;
Infrastructure and Operations; and
Crashes Involving Young Drivers.
The ultimate goal is to reduce fatalities in each emphasis area by a minimum of 50 percent by 2030. This plan identifies the strategies for each of the four emphasis areas.
Speeding/aggressive driving and distracted and inattentive driving also are significant problem areas. Task forces are addressing these areas to determine: 1) appropriate methods for analyzing the data to develop a clear and consistent definition of the problem; and 2) effective countermeasures. Once those tasks are successfully accomplished, these problem areas may become SHSP emphasis areas.
Effective implementation of the SHSP vision, goals, and emphasis area strategies requires extensive coordination and cooperation among all stakeholders. The Louisiana SHSP defines a system, organization, and process for managing attributes of the road, the driver, and the vehicle to achieve the highest level of highway safety by integrating the work of the disciplines and agencies involved. The comprehensive process involves stakeholders at every level of government in Louisiana, (i.e., state, local and federal) and includes representation from the “4 Es” of
safety – engineering, enforcement, education, and emergency response. As shown in Figure ES.2, the project management team (e.g., Executive Committee, Implementation Team, Emphasis Area Teams, and Task Forces) meets regularly to provide oversight of SHSP implementation.
64.0% 62.9%
54.4% 48.1%
34.8%
20.1% 19.8%
11.0% 9.1%
1.9%
0%
10%
20%
30%
40%
50%
60%
70%

LA SHSP Update – October 2011
ES-3
Figure ES.2 Louisiana SHSP Implementation Structure
Process and outcome evaluation measures will determine if implementation of planned projects and initiatives is moving forward and the efforts are having an effect on reducing the number of motor vehicle-related fatalities. The Implementation Team will oversee SHSP evaluation and report progress to the Executive Committee at the annual meetings. An annual summary of all relevant data will determine if Louisiana is moving toward the necessary rate of change to achieve a 50 percent reduction in fatalities by 2030.


LA SHSP Update – October 2011
1-1
1.0 Background and Introduction
1.1 HISTORY AND PURPOSE
The Louisiana Department of Transportation and Development (DOTD) launched an initiative to develop a Strategic Highway Safety Plan (SHSP) prior to the requirement established in the Safe, Accountable, Flexible, Efficient Transportation Equity Act – A Legacy for Users (SAFETEA-LU). The SHSP was the State’s first comprehensive,
multidisciplinary approach to reducing motor vehicle-related fatalities and injuries on Louisiana roadways. The purpose is to:
Establish goals, objectives, performance measures and high-priority emphasis areas;
Address issues at all jurisdiction levels;
Identify current and future candidate safety strategies with potential for reducing fatalities and serious injuries;
Establish a mechanism for interagency coordination with respect to safety issues and develop the necessary partnership agreements;
Carry out a program of public outreach and education in support of the SHSP; and
Establish a process for evaluating and updating progress towards the SHSP’s goals and objectives.
The 2006 Louisiana SHSP is a multidisciplinary strategic plan with a focus on reducing motor vehicle deaths and injuries through engineering, enforcement, emergency response, and educational strategies. Although development of the plan was the responsibility of DOTD, per Federal legislation, many safety partners contributed. The plan is data-driven and includes goals and performance measures for tracking progress.
The 2010 update to the Louisiana SHSP includes all of these characteristics, and serves to:
Enhance collaboration across agencies on the update and implementation of the SHSP;
Align the safety goals and objectives of the State’s various safety plans;
Narrow the focus of the SHSP to the areas of greatest need and potential for success as identified through a detailed data analysis process;
Reflect science-based research to quantify the effectiveness of both engineering and behavioral safety countermeasures;
Reinvigorate stakeholder participation in SHSP implementation; and
Focus on countermeasure evaluation.

LA SHSP Update – October 2011
1-2
An update to the Louisiana SHSP is timely for several reasons. 1) The availability of extensive literature on the effectiveness of engineering and behavioral safety countermeasures since the initial SHSP planning process occurred in 2005. 2) In the first SHSP, the goal was to reduce the Louisiana fatality rate to 1.54 per 100 million vehicle miles traveled (100M VMT) by 2010. Louisiana’s fatality rate in 2010 was 1.58 fatalities per 100M VMT. Other key agencies involved in the SHSP process had predefined goals and objectives, and limited ability to align their planning documents and processes. The agencies now have increased flexibility to align their safety goals with the SHSP. 3) An analysis of crash data for the years 2001 to 2004 was the basis for the original SHSP, but significant improvements have occurred since that time. Fatalities decreased by 12.6 percent from 2009 to 2010, while the statewide VMT experienced 1.3 percent increase. Data for years 2006 to 2008 were used as a base line to identify emphasis areas and 2009 and 2010 data is included to provide a comprehensive update on the State’s progress since the base line was established. It is, therefore, timely to review and evaluate changes in the data, as well as current programs and projects.
To update the 2006 SHSP, DOTD, LSP, and the LHSC formed a partnership to review the data and begin the update process by developing an outline. The next step involved a large number of stakeholders who met to review the data, the outline, and suggest modifications to the draft SHSP. Steps taken to update the SHSP include:
Establish overall leadership for the plan and its implementation;
Conduct data analysis and identify emphasis areas with the greatest potential for improvement;
Identify leadership for Emphasis Area Teams;
Examine the literature on countermeasure effectiveness and add new countermeasures where appropriate;
Present a draft update to the plan to stakeholders and incorporate their input;
Ensure compliance with Federal guidelines;
Develop and present the final updated plan; and
Institutionalize a process to ensure the SHSP is implemented and tracked.
1.2 CHALLENGES
Louisiana continues to face challenges, despite improvement in 2008, 2009, and 2010. With a fatality rate of at least two fatalities per 100M VMT from 1993 to 2008, Louisiana has one of the highest fatality rates in the country and consistently exceeds the national average. During this period, the U.S. average fatality rate steadily decreased while the Louisiana fatality rate remained relatively unchanged until 2009 when it fell below two fatalities per 100M VMT in 2009 and 2010.
The 2010 Louisiana fatality rate of 1.58 was 14 percent lower than the 2009 rate of 1.84. Unfortunately, this rate remains substantially higher than the national average of 1.09 in 2010.
In 2010, there were 643 fatal crashes in Louisiana, resulting in 720 fatalities and roughly 10,294 serious injury crashes, resulting in approximately 13,382 serious injuries. Table 1.1 shows the five-year trend (2006 to 2010) in both fatalities and fatality rates per 100M VMT.

LA SHSP Update – October 2011
1-3
Table 1.1 Trends in Fatalities, Serious Injuries, and Rates by 100 Million Vehicle Miles Traveled 2006 to 2010
Year Fatalities Fatality Rate Serious Injuries Serious Injury
Rate
2006 987 2.17 15,459 34.04
2007 992 2.18 15,814 34.83
2008 915 2.03 15,509 34.49
2009 824 1.84 14,785 32.95
2010 720 1.58 13,382 29.44
Table 1.2 shows a slight decrease in the total VMT over the five-year period and an increase in the number of licensed drivers from 2006 to 2010.
Table 1.2 Trends in Vehicles Miles of Travel and Number of Licensed Drivers 2006 to 2010
Year VMT (100 Million Miles Traveled) Licensed Drivers (in 100 Thousands)
2006 455 2,856
2007 455 2,838
2008 451 2,851
2009 448 2,860
2010 455 2,869
Crash Trends – Louisiana continues to have one of the highest fatality rates per 100M VMT in the nation. More than 700 lives are lost each year in motor vehicle crashes, and around 13,500 people are seriously injured. These losses are unacceptable, unaffordable, and largely avoidable.
Cultural Considerations – Impaired driving is a serious problem in Louisiana, in part because alcohol is a part of the culture. For example, drive-through daiquiri bars are legal in some municipalities, which can only serve to encourage drinking and driving. Nearly 41 percent of all fatalities in 2010 were alcohol-related. Louisiana’s citizens
are not as likely to buckle up as citizens in other states. Thirty-nine percent of all passengers killed were unrestrained. Safety belt use in Louisiana is lower than any other state with a primary enforcement law. The Louisiana safety belt use rate was 75.9 percent in 2010, based on observational survey data.
Environmental Considerations – Louisiana’s gulf coast location makes it vulnerable to tropical storms and
hurricanes. The State suffered severe hurricanes in 2005 and 2008. These tragedies required state resources be diverted from pressing highway safety needs, especially law enforcement resources. Louisiana also has vast rural areas. Rural fatal crashes made up 54 percent of the State’s total fatal crashes. Crashes in rural landscapes often
involve high speeds which result in more serious injuries, require more time for emergency response, and greater distances to trauma and emergency care facilities.
LA SHSP Update – October 2011
1-4
Leadership and Legislation – Research shows certain legislative options have an effect on driver behavior (e.g., mandatory screening and treatment for first offense impaired drivers) and controlling the density of alcohol outlets. Louisiana has not been able to pass any of these restrictions. In fact, one legislator submitted a bill to provide alcohol licenses to barber shops, day spas, and hair salons in 2009. The bill failed to pass.
Resources – Louisiana, like most states, lacks sufficient economic and human resources to mitigate its many safety needs. Reliance upon a data-driven planning process is essential to ensure limited resources are invested in areas with the greatest potential for saving lives and reducing injuries.
Data – Significant improvements have been made in crash data collection and sharing in recent years. However, other data necessary for effective highway safety planning is missing, such as citations, arrests, and driver histories. It appears some crash contributing factors, such as speeding, are under reported. The State’s Traffic Records Coordinating Committee (TRCC) has developed a strategic plan for improving the State’s traffic records information systems, but these changes will take time and extensive financial resources.
1.3 ACCOMPLISHMENTS
Louisiana’s traffic safety picture has dramatically improved over the last several years due in part to the
many accomplishments achieved by safety stakeholders throughout the State.
Crash-related fatalities decreased 25 percent from the 2006 to 2008 three-year average of 965 fatalities to 720 fatalities in 2010.
Young driver (15-24 years old) involved fatalities dropped by 34 percent from the 2006 to 2008 three-year average of 335 fatalities to 220 fatalities in 2010.
Alcohol-related fatalities dropped by 34 percent from the 2006 to 2008 three-year average of 464 fatalities to 306 fatalities in 2010.
Roadway departure related fatalities dropped by 28 percent from the 2006 to 2008 three-year average of 525 fatalities to 379 fatalities in 2010.
Intersection related fatalities dropped by 28 percent from the 2006 to 2008 three-year average of 191 fatalities to 138 fatalities in 2010.
In 2009, Louisiana dedicated resources for conducting safety training for numerous safety practitioners, including engineers, law enforcement, highway safety coordinators, and the local safety council. More than 60 practitioners attended the DOTD sponsored Road Safety 101, a course on the fundamentals of transportation safety. The DOTD also sponsored training for the metropolitan planning organizations (MPO) through a two-day course on Safety Conscious Planning (SCP) appropriate for MPO executives, transportation planners, engineers, and board members.
The Highway Safety Manual (HSM) was published by American Association of State Highway Transportation Officials (AASHTO) in the spring of 2010. DOTD conducted its first two HSM training courses in October 2010 to ensure practitioners are able to integrate the HSM into their daily project planning, programming, and engineering activities. Subsequently, two additional trainings were conducted, one in December 2010 and one in April 2011, for a total of four training courses.

LA SHSP Update – October 2011
1-5
The Louisiana Local Technical Assistance Program (LTAP) hosted speed management workshops to explain the methodology used to set speed limits. The workshops informed local politicians and practitioners of the State’s statue on setting speed limits and how speed zoning and traffic calming can make roads safer.
The DOTD has conducted Roadway Safety Assessment (RSA) workshops and provided guidance to state and local agency practitioners on conducting RSAs. The half-day RSA workshop explores RSA team members and roles, pre-briefing meeting expectations, onsite visit procedures, and report writing formats. In addition to the workshop, DOTD provides an official RSA procedure document outlining the RSA procedures. The RSA is a safety performance evaluation conducted by a multidisciplinary team, which qualitatively estimates and reports potential road safety issues, and identifies opportunities for low-cost safety improvements.
The LSP conducted the TACT (Ticketing Aggressive Cars and Trucks) program, which involves stopping unsafe driving behavior by passenger vehicles and commercial motor vehicles, including speeding, unsafe lane changes, and following too closely.
The LTAP and LHSC are coordinating Impaired Driving Workshops for Law Enforcement in each of the nine State Troop areas across Louisiana. The one-day workshops provide updates on the best practices in the arrest and prosecution of impaired drivers. Topics include preparing for court, field sobriety test and blood alcohol concentration (BAC) reviews update, effective driving while intoxicated (DWI) report writing, and the administrative hearing process.
LSP Troop Commands use detailed statistics to identify the problem locations on state roadways, including areas with alcohol/drug involvement, and lack of safety belt and helmet use. The data review also reveals other factors such as the age of the occupants killed in fatal crashes, and the manner of collision (rear-end, head-on, etc.). These data, along with citizens’ complaints, direct the deployment of LSP Traffic
Program assets, such as motorcycle patrols, airplane assisted speed details, and grant-funded overtime enforcement. Troop Commanders also deploy task forces in fully marked police cruisers to saturate these areas and provide highly visible enforcement presence.
In 2009, Louisiana became the 18th state in the nation, along with the District of Columbia, to require seat belt use for all occupants.
For the first time, Louisiana installed 40 miles of cable median barrier based on data driven principles, best practices, and guidance from the AASHTO Roadside Design Guide. The first pilot cable installation occurred on Interstate 10 in St. James Parish and on Interstate 12 in St. Tammany Parish in 2008. As a result of a second system analysis utilizing 3 years of crash data, the entire I-10 corridor from New Orleans to Highland Road is protected by 22 additional miles of cable median barrier in 2011. Concurrently, 19 miles of cable median barrier were installed on I-12 in Tangipahoa Parish which is adjacent to St. Tammany Parish.
Louisiana implemented three systemwide, systematic improvement projects through a Federal Rural Safety Innovation Program (RSIP) grant. Two of the projects addressed roadway departures in Grant and Rapides Parishes ($2 million) and two delta parish projects addressed systematic rural intersection improvements at 204 locations ($1.9 million). DOTD has hired a consultant to implement the Roadway Departure and Intersection Improvement Programs.
Louisiana implemented a new policy to address low-cost safety improvements as part of the Pavement Preservation Program. The policy requires three years of crash history for overall abnormal crashes and for overrepresented crash types be reviewed and analyzed. If the crash data analysis indicates an

LA SHSP Update – October 2011
1-6
abnormal crash history or an overrepresentation of crash type(s) a RSA is conducted. DOTD has hired a consultant to perform the crash data analyses and to coordinate and conduct the RSAs.
The LTAP, in partnership with the DOTD, manages the Louisiana Local Road Safety Program (LRSP), which provides training, technical assistance and outreach to local jurisdictions. LTAP has conducted a statewide analysis of crash locations on this system and are working with local agencies to implement improvements at intersections and on roadway departure corridors. The LRSP focuses on roadway departure crashes and promotes development of local road safety profiles and plans for use by local agencies in safety planning and implementation of low-cost safety improvements. The LRSP also leads the outreach to local agencies during the annual Click it or Ticket Campaign. Currently, the program is managing 139 locally nominated projects in various stages of implementation.
Louisiana has implemented No Refusal programs across the State to prevent impaired driving. The No Refusal program is an enforcement strategy that allows jurisdictions to obtain search warrants for blood samples from suspected impaired drivers who refuse breath tests. Participating jurisdictions allow officers to request warrants via phone from on-call judges or magistrates. This enables law enforcement to legally acquire a proper blood sample from drivers who refuse to give a breath sample. During these enforcement efforts, prosecutors and judges make themselves available to streamline the warrant acquisition process and help build solid cases leading to impaired driving convictions.
Four regional highway safety coalitions have been established to review the SHSP emphasis areas and strategies and develop regional action plans to assist in SHSP implementation. Coalitions in the New Orleans, Houma, Lafayette, and North Shore regions are developing regional actions plans and identifying strategies to reduce fatalities and serious injuries on their roadways.
Louisiana participated as a pilot state for the Federal Highway Administration’s (FHWA) SHSP
Implementation Process Model (IPM), which helps integrate the SHSP with the Highway Safety Plan (HSP), the Long-Range Transportation Plan (LRTP), and the Statewide Transportation Improvement Program (STIP). The State also has committed to pilot test the Evaluation Process Model (EPM) to ensure progress and impact tracking and assessment takes place.

LA SHSP Update – October 2011
2-1
2.0 Vision, Mission, Goals, and Performance Measures
2.1 VISION AND MISSION
The vision of the Louisiana SHSP is to reach destination zero deaths on Louisiana roadways. The mission of the SHSP is to reduce the human and economic toll on Louisiana’s surface transportation
system due to traffic crashes through widespread collaboration and an integrated 4E approach.
2.2 GOAL
One reason for updating the SHSP is to align agency safety goals. In 2009, the LHSC and the DOTD teamed up to identify consistent goals for both agencies. The two agencies agreed to adopt the new AASHTO goal to halve fatalities by 2030. The updated SHSP uses a baseline average of 2006-2008 data to calculate the rate of change to achieve a 50 percent reduction in fatalities by 2030. Figure 2.1 shows the benchmarks for achieving this goal. For example, the goal for 2020 is 702 fatalities. Although this goal will not change from year to year, the annual reduction rate needed to achieve the goal could vary based on each year’s progress.
Figure 2.1 Benchmarks to Achieve 50 Percent Reduction in Fatalities by 2030
965 921
811
702
592
482
0
200
400
600
800
1,000
1,200
3 Yr Avg ('06-'08)
2010 2015 2020 2025 2030
Target Fatalities

LA SHSP Update – October 2011
2-2
Serious injuries sustained in motor vehicle crashes make up a significant portion of the human and economic toll in Louisiana. Figure 2.2 illustrates the benchmarks for reducing serious injuries by 50 percent by 2030.
Figure 2.2 Benchmarks to Achieve 50 Percent Reduction in Serious Injuries by 2030
2.3 PERFORMANCE MEASURES
The annual number of motor vehicle-related fatalities is the performance measure used to track progress toward reaching the goal of cutting fatalities in half by 2030. The same metric will track performance measures for each emphasis area and indicate the number of countermeasures underway, completed, or not started. For purposes of this Plan, the interim targets are established in a linear fashion; however, in reality the correct estimates are probably a non linear function because the advances will be more difficult to achieve in the latter years. Most early targets already have been achieved. In future analysis, a more statistical approach to setting interim targets will be developed.
A companion document to the plan will include detailed emphasis area action plans that identify the steps necessary to implement each strategy or countermeasure, assign responsibility, and suggest a timeline for implementation.
15,594 14,885
13,113
11,341
9,569
7,797
0
2,000
4,000
6,000
8,000
10,000
12,000
14,000
16,000
18,000
3 Yr Avg ('06-'08)
2010 2015 2020 2025 2030
Target Serious Injuries

LA SHSP Update – October 2011
3-1
3.0 Problem Identification and Emphasis Area Selection
The DOTD, LSP, and LHSC based selection of the SHSP emphasis areas on the following factors:
The availability of robust 2006 to 2008 baseline year data which clearly defined the problem and contributing crash factors;
The identification of programs and projects with the greatest potential for improvement; and
The ability of the State to access resources for implementing proven effective countermeasures.
Figure 3.1 shows the leading factors contributing to fatalities, which include failure to buckle up, speeding and aggressive driving, run off the road crashes, alcohol-related driving, young drivers, distracted driving, and intersection crashes. Most crashes involve more than a single factor. For example, a fatally injured driver could be driving impaired, speeding, and not wearing a safety belt.
Figure 3.1 Contributors to Fatalities as Percent of Total Problem 2006-2008
Source: Louisiana State University Highway Safety Research Group (HSRG) Reports – Traffic Data, 2011.
64.0% 62.9%
54.4% 48.1%
34.8%
20.1% 19.8%
11.0% 9.1%
1.9%
0%
10%
20%
30%
40%
50%
60%
70%

LA SHSP Update – October 2011
3-2
Based on analysis of the 2006 to 2008 baseline data and other considerations, the agencies recommended focusing attention, energy, and resources on four emphasis areas:
The remainder of this section discusses each emphasis area, including the goal established for the emphasis area and proposed strategies.
3.1 ALCOHOL-RELATED DRIVING
Louisiana exceeded the national average for the percent of alcohol-related fatalities from 2006 through 2010. Alcohol-related fatalities account for a significant portion of Louisiana’s fatalities. However, Table 3.1 shows the
percentage of such fatalities has declined over the years, from a high of 46.2 percent in 2006 to 42.5 percent in 2010.
Table 3.1 Percent Alcohol-Related Fatal Crashes 2006 to 2010
Year Total Fatalities Alcohol-Related Fatalities Alcohol-Related Fatalities as Percent
of All Fatalities
2006 987 456 46.2%
2007 992 484 48.8%
2008 915 451 49.3%
2009 824 402 48.8%
2010 720 306 42.5%
Figure 3.2 shows the total number of alcohol-related fatal crashes and fatalities increased from 2006 to 2007 and subsequently decreased consistently from 2008 to 2010.
Alcohol-Related Driving
Occupant Protection
Infrastructure and Operations
Young Driver Crashes

LA SHSP Update – October 2011
3-3
Figure 3.2 Alcohol-Related Fatal Crashes and Fatalities 2006 to 2010
The number of alcohol-related serious injuries increased from 2,377 in 2007 to 2,419 in 2008 (Figure 3.3) and then decreased to 1,968 in 2010. The decline in serious injuries and fatalities could indicate higher restraint use for drivers and passengers of vehicles involved in alcohol-related crashes.
Figure 3.3 Alcohol-Related Serious Injuries 2006 to 2010
Louisiana has a Zero Tolerance law (.02 blood alcohol concentration (BAC)) for drivers less than 21 years of age; however, 18- to 20-year-olds are allowed to enter bars in Louisiana.
408
436
399
353
278
456
484
451
402
306
200
250
300
350
400
450
500
2006 2007 2008 2009 2010
Acohol-Related Fatal Crashes Alcohol-Related Fatalities
2377 2377 2419
2131
1968
1500
2000
2500
3000
2006 2007 2008 2009 2010
Alcohol-Related Serious Injuries

LA SHSP Update – October 2011
3-4
Goal
The goal for the Alcohol-Related Driving Emphasis Area Team is to reduce alcohol-related fatalities and injuries by no less than 50 percent by 2030. Figures 3.4 and 3.5 show the benchmarks for fatalities and injuries.
Figure 3.4 Benchmarks to Achieve a 50 Percent Reduction in Alcohol-Related Fatalities by 2030
Figure 3.5 Benchmarks to Achieve a 50 Percent Reduction in Alcohol-Related Injuries by 2030
464 443
390
337
285
232
0
50
100
150
200
250
300
350
400
450
500
3 Yr Avg ('06-'08)
2010 2015 2020 2025 2030
Alcohol-Related Fatalities
2,391 2,282
2,011
1,739
1,467
1,196
0
500
1,000
1,500
2,000
2,500
3,000
3 Yr Avg ('06-'08)
2010 2015 2020 2025 2030
Alcohol-Related Serious Injuries

LA SHSP Update – October 2011
3-5
To achieve these goals, the Alcohol-Related Driving Emphasis Area Team identified the following seven strategies:
Conduct No Refusal Weekends throughout the State. No Refusal Weekends is a program where law enforcement, prosecutors, and judges team up to ensure anyone suspected of DWI is required to submit to a blood draw under a search warrant to collect blood samples from drivers who refuse breath tests.
Close the loophole in existing law that allows underage youth to be in bars.
Conduct prosecutor and judicial training programs, including expansion of current prosecutor training programs and more hands on training experiences for law enforcement officers.
Conduct education and community outreach programs, including responsible vendor programs and high-visibility enforcement campaigns.
Reduce the number of repeat DWI offenders through mandatory evaluation for all DWI offenders and implementation of the ignition interlock law.
Increase the number of high-visibility DWI Programs, including DWI checkpoints and saturation patrols.
Utilize effective communication strategies to allow efficient and timely information sharing among all key stakeholders and the public.
In addition, DOTD will flex up to ten percent of their Highway Safety Improvement Program (HSIP) funding for behavioral countermeasures.
3.2 OCCUPANT PROTECTION
Louisiana enacted primary enforcement legislation in 1995 which allows law enforcement officers to stop and ticket a driver if they observe a safety belt violation. Louisiana’s safety belt use falls below the average for primary
enforcement states, as well as the national average for all states (Figure 3.6). From 2006 to 2010, the safety belt use national average and primary enforcement state average increased each year, while Louisiana remained largely unchanged.

LA SHSP Update – October 2011
3-6
Figure 3.6 Observed Safety Belt Use 2006 to 2010
Figure 3.7 shows the percent of unrestrained fatalities, which increased from 61.5 percent in 2006 to 63.9 percent in 2009 and dropped to 58.4 percent in 2010.
Figure 3.7 Percent of Unrestrained Fatalities 2006 to 2010
Source: Louisiana State University Highway Safety Research Group (HSRG) Reports – Traffic Data, 2011.
81% 82% 83%
84%
85%
85% 87% 88% 88%
88%
75% 75% 76% 75%
76%
65%
70%
75%
80%
85%
90%
2006 2007 2008 2009 2010
U.S. Primary Enforcement States Louisiana
61.5%
62.6%
63.8% 63.9%
58.4%
55.0%
56.0%
57.0%
58.0%
59.0%
60.0%
61.0%
62.0%
63.0%
64.0%
65.0%
2006 2007 2008 2009 2010
LA SHSP Update – October 2011
3-7
Goal
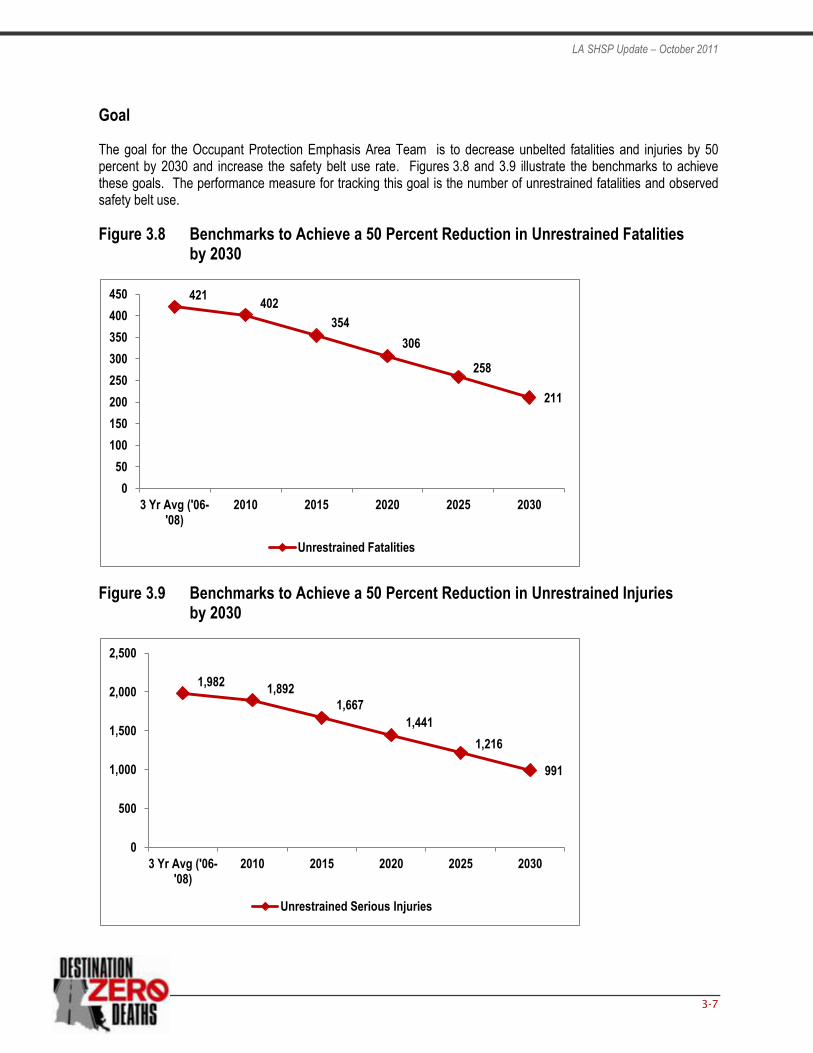
The goal for the Occupant Protection Emphasis Area Team is to decrease unbelted fatalities and injuries by 50 percent by 2030 and increase the safety belt use rate. Figures 3.8 and 3.9 illustrate the benchmarks to achieve these goals. The performance measure for tracking this goal is the number of unrestrained fatalities and observed safety belt use.
Figure 3.8 Benchmarks to Achieve a 50 Percent Reduction in Unrestrained Fatalities by 2030
Figure 3.9 Benchmarks to Achieve a 50 Percent Reduction in Unrestrained Injuries by 2030
421 402
354
306
258
211
0
50
100
150
200
250
300
350
400
450
3 Yr Avg ('06-'08)
2010 2015 2020 2025 2030
Unrestrained Fatalities
1,982 1,892
1,667
1,441
1,216
991
0
500
1,000
1,500
2,000
2,500
3 Yr Avg ('06-'08)
2010 2015 2020 2025 2030
Unrestrained Serious Injuries

LA SHSP Update – October 2011
3-8
To achieve these benchmarks, the Occupant Protection Emphasis Area Team identified the following strategies:
Increase the safety belt use rate by two percentage points per year;
Enhance current media and outreach efforts through effective targeted marketing and education campaigns (leverage current or traditional programs);
Conduct attitudinal surveys to better define public perception of occupant protection laws and issues;
Develop a long-term comprehensive plan to increase enforcement of all occupant protection laws and prioritize efforts geographically and by target population that shows lower than average safety belt use rates;
Develop a plan to enhance current child passenger safety programs; and
Utilize effective communication strategies to allow efficient and timely information sharing among all key stakeholders and the public.
In addition, DOTD will flex up to ten percent of their Highway Safety Improvement Program (HSIP) funding for behavioral countermeasures.
3.3 INFRASTRUCTURE AND OPERATIONS
Louisiana experiences a high incidence of roadway departure and intersection crashes. The Infrastructure and Operations emphasis area addresses both of these issues and includes implementation of Highway Safety Manual (HSM) principles and methods to provide guidance on integrating quantitative safety into transportation planning, design, engineering and maintenance activities.
Roadway Departure
Roadway departure crashes are a significant problem in Louisiana. Contributing factors often include loss of control, misjudging a curve, attempting to avoid a collision with an animal, alcohol use, distracted driving and aggressive driving. Figure 3.10 shows nearly 55 percent of all fatalities and approximately 30 percent of all serious injuries involve a vehicle leaving the roadway.

LA SHSP Update – October 2011
3-9
Figure 3.10 Percent of All Fatalities and Serious Injuries Involving Roadway Departure 2006 to 2010
Source: Louisiana State University Highway Safety Research Group (HSRG) Reports – Traffic Data, 2011.
Intersections
Intersections have a high-crash potential given the many conflict points between vehicles and other road users, such as pedestrians and bicyclists. Figure 3.11 shows intersection crashes accounted for nearly 19 percent of all fatalities and 40 percent of all serious injuries in Louisiana from 2006 to 2010. Intersection-related crashes tend to be less deadly than roadway departure crashes, primarily due to the lower speeds.
Figure 3.11 Percent of All Fatalities and Serious Injuries Involving Intersection 2006 to 2010
54.9% 52.9%
55.5% 54.2% 52.6%
29.7% 30.2% 29.8% 29.6% 28.8%
0%
10%
20%
30%
40%
50%
60%
2006 2007 2008 2009 2010
Roadway Departure Fatalities as Percent of Total Fatalities
Roadway Departure Serious Injuries as Percent of Total Serious Injuries
19.3% 20.6% 19.6% 19.9% 19.2%
41.4% 40.8% 39.4% 40.9% 39.7%
0%
10%
20%
30%
40%
50%
2006 2007 2008 2009 2010
Intersection Fatalities as Percent of Total Fatalities
Intersection Serious Injuries as Percent of Total Serious Injuries

LA SHSP Update – October 2011
3-10
Highway Safety Manual (HSM)
The Highway Safety Manual (HSM) was published by AASHTO in the spring of 2010. The HSM provides methods for quantifying crash frequency in all aspects of a typical project development process: system planning, project planning, preliminary and final design, construction, operations, and maintenance. In addition, the HSM provides tools for integrating HSM into HSIP programs and other traditional safety programming functions.
Goals
The goal for the Infrastructure and Operations Emphasis Area is to reduce roadway departure and intersection fatalities and injuries by 50 percent by 2030 Figures 3.12 through 3.15 show the benchmarks to achieve these goals.
Figure 3.12 Benchmarks to Achieve a 50 Percent Reduction in Roadway Departure Fatalities by 2030
525 501
441
382
322
262
0
100
200
300
400
500
600
3 Yr Avg ('06-'08)
2010 2015 2020 2025 2030
Roadway Departure Fatalities

LA SHSP Update – October 2011
3-11
Figure 3.13 Benchmarks to Achieve a 50 Percent Reduction in Roadway Departure Injuries by 2030
Figure 3.14 Benchmarks to Achieve a 50 Percent Reduction in Intersection Fatalities by 2030
4,662 4,450
3,920
3,391
2,861
2,331
0
500
1,000
1,500
2,000
2,500
3,000
3,500
4,000
4,500
5,000
3 Yr Avg ('06-'08)
2010 2015 2020 2025 2030
Roadway Departure Serious Injuries
191 182
161
139
117
96
0
50
100
150
200
250
3 Yr Avg ('06-'08)
2010 2015 2020 2025 2030
Intersection Fatalities

LA SHSP Update – October 2011
3-12
Figure 3.15 Benchmarks to Achieve a 50 Percent Reduction in Intersection Injuries by 2030
To achieve these goals, the DOTD recommended the following strategies.
Roadway Departure
Conduct a systemic deployment of low-cost countermeasures on state highways, including enhanced signing and pavement markings, centerline, edge line and shoulder rumble strips / stripes, curve delineation, high-friction surface treatments, guardrail upgrades, vegetation removal, and utility pole treatments.
Incorporate cost-effective countermeasures (i.e., centerline, edge line, and shoulder rumble strips / stripes, signing, curve delineation, guardrail, etc.) at crash locations for programmed projects.
Implement roadway departure countermeasures (see above) on local roads.
Conduct education and enforcement corridor initiatives targeting speeding and alcohol impaired driving.
Use a comprehensive approach involving engineering, enforcement, and education for identified corridors.
Implement traditional roadway departure countermeasures such as cable median barriers at appropriate locations.
Implement pavement friction improvements at identified locations.
Intersections
Make signal, signing, and pavement marking improvements on state and local signalized and stop control intersections.
6,321 6,034
5,315
4,597
3,879
3,161
0
1,000
2,000
3,000
4,000
5,000
6,000
7,000
3 Yr Avg ('06-'08)
2010 2015 2020 2025 2030
Intersection Serious Injuries

LA SHSP Update – October 2011
3-13
Install detection control systems, pedestrian enhancements, and lighting at appropriate signalized intersections.
Implement pavement friction improvements at higher speed intersections with wet pavement crashes.
Implement enforcement enhancements (i.e., automated red light running enforcement, red light running confirmation lights) to reduce red light running crashes.
Conduct a corridor 3E (engineering, enforcement, and education) improvement program on 11 state route corridors that have experienced seven or more fatal intersection crashes over the past 5 years along with a significant number of severe injury intersection crashes.
Highway Safety Manual (HSM) Implementation
Develop an Implementation Plan for adopting the HSM as a guideline for DOTD project safety analysis.
Conduct HSM training courses to ensure practitioners are able to integrate the HSM into daily project planning, programming, and engineering activities.
Evaluate and compare state crash, roadway, and traffic volume data availability to HSM data needs.
Implement analytical tools to assist in network screening and project identification.
3.4 CRASHES INVOLVING YOUNG DRIVERS
Like most states, Louisiana’s young drivers are overrepresented in fatal crashes. In 2010, young drivers (15-24
years old) accounted for 30.6 percent of fatalities, but only 14.5 percent of licensed drivers. Figure 3.16 shows this breakdown for 2006 to 2010.

LA SHSP Update – October 2011
3-14
Figure 3.16 Young Drivers (Age 15 to 24) Involved Fatalities as Percent of Total Fatalities 2006 to 2010
Source: Louisiana SHSP Reporting Dashboard, 2011.
Figure 3.17 shows fatalities and serious injuries involving young drivers declined from 2006 to 2010. Serious injuries declined to 5,371, representing a 22.5 percent decrease from 2006. Fatalities involving young drivers decreased 34.9 percent from 341 in 2006 to 220 in 2010.
Figure 3.17 Fatalities and Serious Injuries Involving Drivers Age 15 to 24 2006 to 2010
Source: Louisiana SHSP Reporting Dashboard, 2011.
34.5% 35.1%
34.6%
30.8% 30.6%
28%
29%
30%
31%
32%
33%
34%
35%
36%
2006 2007 2008 2009 2010
Young Driver Involved Fatalities as Percent of Total Fatalities
2006 2007 2008 2009 2010
Serious Injuries 6,930 7,113 6,617 5,819 5,393
Fatalities 341 348 317 254 220
0
1,000
2,000
3,000
4,000
5,000
6,000
7,000
8,000
0
50
100
150
200
250
300
350
400
Per
son
s S
erio
usl
y In
jure
d
Per
son
s K
illed

LA SHSP Update – October 2011
3-15
Figure 3.18 shows alcohol-related fatal and serious injury crashes involving drivers age 15 to 24 decreased notably from 2007 to 2008.
Figure 3.18 Alcohol-Related Fatal Crashes and Serious Injury Crashes Involving Drivers Age 15 to 24 2006 to 2010
Source: Louisiana State University Highway Safety Research Group (HSRG) Reports – Traffic Data, 2011.
Goal
The goal for the Young Drivers Emphasis Area team is to reduce fatalities involving young drivers by 50 percent by 2030. Figures 3.19 and 3.20 illustrate the benchmarks for this goal.
120 132 102 90
66
495 519
450
334
153
0
100
200
300
400
500
600
2006 2007 2008 2009 2010
Alcohol-related Fatal Crashes involving Drivers Aged 15-24 years
Alcohol-related Serious Injury Crashes involving Drivers Aged 15-24 years

LA SHSP Update – October 2011
3-16
Figure 3.19 Benchmarks to Achieve a 50 Percent Reduction in Fatalities Involving Young Drivers by 2030
Figure 3.20 Benchmarks to Achieve a 50 Percent Reduction in Injuries Involving Young Drivers by 2030
To achieve these benchmarks, the Young Driver Emphasis Area Team identified the following strategies:
Identify and expand effective programs aimed at teenage drivers such as Sudden Impact, Think First, etc.;
Reinforce protective factors and minimize risk factors for young drivers by identifying high schools and colleges with driver safety policies and conduct public information and education campaigns on young driver safety;
335 320
282
244
206
168
0
50
100
150
200
250
300
350
400
3 Yr Avg ('06-'08)
2010 2015 2020 2025 2030
Young Driver Involved Fatalities
6,887 6,574
5,791
5,009
4,226
3,444
0
1000
2000
3000
4000
5000
6000
7000
8000
3 Yr Avg ('06-'08)
2010 2015 2020 2025 2030
Young Driver Involved Serious Injuries

LA SHSP Update – October 2011
3-17
Expand programs that focus on enforcement of underage drinking and driving laws and regulations, including ideas on expanding the Tangipahoa Parish Underage Drinking Task Force Program;
Conduct a National Highway Traffic Safety Administration (NHTSA) assessment of driver education programs in Louisiana;
Support model young driver legislation, including identifying the top three priorities to improve young driver safety (e.g., under-21 in bars, Graduated Driver’s Licensing revisions, etc.); and
Utilize effective communication strategies to allow efficient and timely information sharing among all key stakeholders and the public.
In addition, DOTD will flex up to ten percent of their Highway Safety Improvement Program (HSIP) funding for behavioral countermeasures.

LA SHSP Update – October 2011
4-1
4.0 SHSP Management, Implementation, and Evaluation
4.1 SHSP UPDATE PROCESS
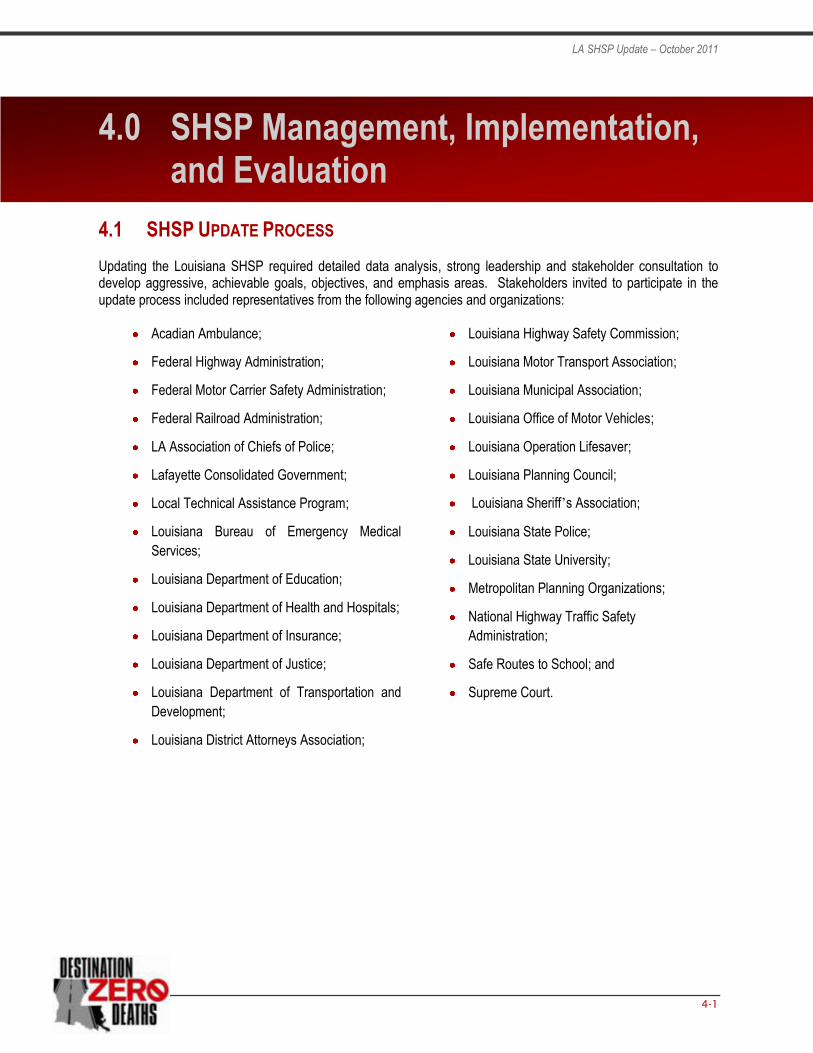
Updating the Louisiana SHSP required detailed data analysis, strong leadership and stakeholder consultation to develop aggressive, achievable goals, objectives, and emphasis areas. Stakeholders invited to participate in the update process included representatives from the following agencies and organizations:
Acadian Ambulance;
Federal Highway Administration;
Federal Motor Carrier Safety Administration;
Federal Railroad Administration;
LA Association of Chiefs of Police;
Lafayette Consolidated Government;
Local Technical Assistance Program;
Louisiana Bureau of Emergency Medical
Services;
Louisiana Department of Education;
Louisiana Department of Health and Hospitals;
Louisiana Department of Insurance;
Louisiana Department of Justice;
Louisiana Department of Transportation and
Development;
Louisiana District Attorneys Association;
Louisiana Highway Safety Commission;
Louisiana Motor Transport Association;
Louisiana Municipal Association;
Louisiana Office of Motor Vehicles;
Louisiana Operation Lifesaver;
Louisiana Planning Council;
Louisiana Sheriff’s Association;
Louisiana State Police;
Louisiana State University;
Metropolitan Planning Organizations;
National Highway Traffic Safety
Administration;
Safe Routes to School; and
Supreme Court.

LA SHSP Update – October 2011
4-2
4.2 MANAGEMENT AND IMPLEMENTATION
Effective implementation of the SHSP vision, goals, and emphasis area strategies requires extensive coordination and cooperation among all stakeholders. The Louisiana SHSP defines a system, organization, and process for managing road safety by integrating all of the disciplines and agencies involved. The comprehensive horizontal and vertical process involves stakeholders at every level of government in Louisiana (i.e., federal, state, regional, and local) and includes appropriate representation for addressing the 4 Es of safety – engineering, enforcement, education, and emergency response. Figure 4.1 shows SHSP implementation is an ongoing process with the project management team (e.g., Executive Committee, Implementation Committee, and Emphasis Area Teams and Task Forces) meeting regularly to develop, implement, and monitor each of the SHSP strategies.
The project management team works with regional highway safety coalitions to identify local safety needs related to the SHSP emphasis areas, assists with development of regional safety action plans, and provides technical and administrative support to facilitate implementation of the regional plans. The project management team assumes responsibility for tracking overall SHSP strategy implementation and conducting regular data analyses to determine if these actions are achieving the desired result of decreasing fatalities and serious injuries on Louisiana roadways.
Figure 4.1 Louisiana SHSP Implementation Structure
The following lists the organizational elements, the role in the SHSP update, and the member agencies and organizations.
Executive Committee
The Executive Committee meets annually with the following objectives:

LA SHSP Update – October 2011
4-3
Establish SHSP policies and procedures, review progress, provide advice and guidance, address challenges, and remove barriers;
Provide support and assistance to specific SHSP strategies;
Strive for collaboration among the agencies and stakeholders;
Align agencies with SHSP goals and objectives; and
Share progress on safety initiatives.
Members of the Committee represent the following agencies:
Secretary, Department of Transportation and Development;
State Superintendent, Department of Education;
Superintendent, Louisiana State Police;
Executive Director, Louisiana Highway Safety Commission;
Commissioner, Office of Motor Vehicles;
Regional Administrator, National Highway Traffic Safety Administration;
Division Administrator, Federal Highway Administration; and
Division Administrator, Federal Motor Carrier Safety Administration.
Implementation Team
The Implementation Team meets biannually with the following objectives:
Review implementation progress and performance in the emphasis areas;
Provide assistance to overcome barriers and solve problems;
Measure performance on SHSP-related campaigns, trainings, and other programs;
Conduct strategic planning to update the SHSP when appropriate;
Plan peer exchanges and reviews when needed; and
Provide guidance on future programs and activities.
The Team consists of the following representation:
Highway Safety Administrator, DOTD;
Lt. Colonel (Patrol), LSP;
Assistant Director, LHSC;
Emphasis Area Team Leaders;
Task Force Chairs;
Regional Safety Team Leaders;

LA SHSP Update – October 2011
4-4
Director, LTAP;
Executive Director, Louisiana Planning Council;
Executive Director, Louisiana Municipal Association;
Regional Administrator, NHTSA;
Division Administrator, FMCSA; and
Division Administrator, FHWA.
Emphasis Area Teams
Alcohol Related Driving
Occupant Protection
Infrastructure and Operations
Young Drivers
Emphasis Area Team Leader Responsibilities
Emphasis Area team leaders meet quarterly with the Emphasis Area Team to accomplish the following objectives:
Ensure team membership is multidisciplinary (engineering, enforcement, education, emergency response);
Follow up with State SHSP Implementation Team if assistance is needed on team composition;
Schedule regular (at least quarterly) Emphasis Area Team meetings, notify participants; and prepare meeting reports, including action items;
Track progress on emphasis area implementation using the tracking tool with assistance from the Task Force and Regional Highway Safety Coalition Leaders and notify the Implementation Team if assistance is needed on action step implementation;
Prepare quarterly progress reports;
Revise or delete strategies and action items when completed or become obsolete;
Identify new strategies and develop action plans;
Participate in biannual SHSP Implementation Team Meetings; and
Ensure team members are informed about the Emphasis Area problem and countermeasure effectiveness.
Emphasis Area Team Members and Action Step Leaders Responsibilities
Responsibilities of Emphasis Area team members and action step leaders include:
Participate in quarterly Emphasis Area team meetings.
Volunteer to serve as Action Step Leaders:
Work with partners to implement the action step.

LA SHSP Update – October 2011
4-5
Update the Emphasis Area team leader monthly on accomplishments.
Report progress using the tracking tool.
Notify the Emphasis Area team leader of problems or issues.
Emphasis Area team members include state and local safety stakeholders from engineering, law enforcement, education and emergency response.
Task Forces
Task Force responsibilities include:
Task Force leaders participates in biannual Implementation Team meetings;
Members participate in quarterly Task Force meetings;
Review the literature and research to identify effective countermeasures;
Review current practice and laws to determine and propose changes
Determine infraction definitions; and
Report findings to the Executive Committee and Implementation Team.
Task Force members include state and local safety stakeholders from engineering, law enforcement, education, and emergency response.
Regional Highway Safety Coalitions
Responsibilities of the Regional Highway Safety Coalitions include:
Participate in regular (quarterly or monthly) meetings;
Review data to identify regional transportation safety problems;
Review the strategies from the statewide plan and determine relevance for the region;
Develop regional action plans;
Assign responsibility for action step implementation; and
Report on progress to the Emphasis Area Team leaders.
Regional Highway Safety Coalition members include the following safety stakeholders:
DOTD districts;
LSP troop commands;
Local law enforcement;
Distracted and Inattentive Driving
Task Force
Aggressive Driving Task Force

LA SHSP Update – October 2011
4-6
MPOs;
Emergency response;
Heathcare and injury prevention;
Parish and city engineers;
Public works departments;
Court personnel; Education;
LHSC grantees; and
Other safety advocates.
4.3 EVALUATION
The evaluation of Louisiana’s SHSP will study both process and outcome measures to determine if the planned projects and initiatives are being implemented and effecting the number of motor vehicle-related fatalities and serious injuries. The Implementation Team will oversee the evaluation of the SHSP and report progress to the Executive Committee at the annual meetings.
Leaders of the regional highway safety coalitions and action steps will report progress quarterly through the use of a tracking and monitoring tool. Using this tool, the Emphasis Area Team Leaders will monitor performance and more global process performance measures such as the number of countermeasures underway, completed, or not started. Emphasis Area Team Leaders will give progress reports at the quarterly Implementation Team meetings.
Outcome measures will be determined through continuing data review. The progress reports provided at the biannual Implementation Team meetings will be augmented with crash data updates of crashes, fatalities, and serious injuries. These data will be further disaggregated by emphasis area. An annual summary of all relevant data will be compiled and analyzed to measure and report progress toward achieving a 50 percent reduction in fatalities by 2030.