updating indonesia's greehouse gas abatement cost curve
DESCRIPTION
ÂTRANSCRIPT

Updating Indonesia’sGreenhouse GasAbatement Cost Curve
Technical Cooperation Project for Capacity Development for the National Focal Point on Climate Change to Enhance
the Coordination and Evaluation on Climate Change Policies in Indonesia
BPPT Building 1,16th Floor, Jl. MH. Thamrin No. 8. Jakarta 10340 - Indonesia
Phone +62 21 3190 4635,Fax + 62 21 3983 8702
September 2014
This report was prepared by McKinsey & Company and Poyry Management Consulting under the “Technical Cooperation Project for Capacity Development for the National Focal Point on Climate Change to Enhance the Coordination and Evaluation of Climate Change Policies in Indonesia” in cooperation between the Japan International Cooperation Agency (JICA) and the National Council on Climate Change (Dewan Nasional Perubahan Iklim or DNPI). Opinions and views expressed in this paper are solely those of author(s) and do not necessarily reflect the official opinion of JICA, DNPI nor the Government of the Republic of Indonesia in general.
1Updating Indonesia’s Greenhouse Gas Abatement Cost Curve
ForewordThe report that follows is our attempt to quickly update the findings of DNPI’s 2009 Greenhouse Gas abatement cost curve for the major GHG emissions-intensive sectors of the Indonesian economy.
The results are a combination of our efforts and data and expert input provided through a broad multi-stakeholder, inter-agency review and comment process. We have learned much as country about our options to mitigate climate change since 2009, and have greatly improved our data collection and monitoring, and the sophistication of our emissions estimates. This report attempts to incorporate the best available new data from across government. We thank all of those who provided time, data, and advice to make this rapid re-assessment as robust as possible.
Remember, however, that the methodology below remains fundamentally a limited, technical analysis of greenhouse gas abatement potential. While we discuss a number of potential options for action that Indonesia might explore as a result of this analysis, all will require more in-depth review and analysis. While we note options that have been successful for some other governments in mitigating their greenhouse emissions, the findings here are limited as they do include an analysis of the costs of different implementing policies.
As well, this is a limited survey in that we have, in a very short time, updated only the four major sectors – forestry and peat (now grouped together as LULUCF), power, and road transport. These sectors represent 80% of the emissions abatement potential we saw in 2009, and continue to do so now. We have not updated the other four sectors from the original 2009 cost curve (cement, buildings, agriculture, and petroleum and petrochemicals), and we have not added any new sectors, e.g., air transport, waste, manufacturing, or steel/basic materials.
Lastly, while we have used the best available information on emissions and abatement costs within Indonesia, there are several areas that merit further analysis and debate to arrive at better, more widely accepted data. The areas of uncertainty which have the greatest impact on the estimates here are:
• The carbon content to be used for Indonesia peat soils and various above ground carbon stocks – we have used data from official government publications such as RAN-GRK from BAPPENAS this time. The carbon stocks/emission factors used by the Indonesian government are significantly lower than data provided in other publications from academics and NGOs. As a result LULUCF emissions projections and also the abatement potential as a consequence are reduced by nearly 50% compared to our last analysis
• The area currently at risk of deforestation – in this analysis, as described in the LULUCF section, we have taken the remaining forested area in the APL area and treated it as forest area under threat of deforestation. Excluded from the analysis were areas with steep slopes (> 30%) and areas which are more than 200 km
2 Updating Indonesia’s Greenhouse Gas Abatement Cost Curve
away from the next coastline as the high transportation costs will very unlikely attract economic interest in these areas and so planned deforestation will be very little. The estimate of the area under threat could be refined if the Ministry of Public Works were to compile and make available the district level land use designations for all of the APL and if the Ministry of Forestry would do the same for land use designations within the Kawasan Hutan; this would allow a more accurate assessment of how much of the APL but also the HKP in the Kawasan Hutan will likely be deforested through 2030.
• Current and future estimates of Indonesia’s total number of motor vehicles – estimates of the number of cars, trucks, and motorcycles on Indonesia’s roads vary widely today. We have used actual vehicle sales data as a basis for our estimates, which differs from official government figures issued by the State Police, and used by the Ministry of Transportation and Statistics Indonesia. Alignment between the State Police, the Ministry of Transportation, the Ministry of Environment, the Ministry of Finance and Indonesian automobile and motorcycle sellers associations on methodology here will be important in the future to produce reliable emissions and abatement figures for road transport
At this time of tremendous change for our country, we hope this report will renew our national conversation on our path forward to mitigate Indonesia’s greenhouse emissions.
Rachmat WitoelarExecutive ChairNational Council on Climate Change

3Updating Indonesia’s Greenhouse Gas Abatement Cost Curve
PrefaceAs we are all aware, uncontrolled climate change poses a severe risk to the entire global community. The Indonesia archipelago, with its rich diversity of flora and fauna, geographical breadth, and many low-lying islands, would be adversely affected should global warming trends not be reversed. At the same time, Indonesia represents a significant portion of the CO2 emissions abatement opportunity available to the world, and is in position to benefit in multiple ways from the global effort to reduce harmful GHG emissions.
To coordinate the implementation of climate change programs and strengthen the position of Indonesia in international forums in controlling climate change, the Government of Indonesia established the National Council on Climate Change (DNPI) in 2008. Since its founding, DNPI has been at the forefront of the climate change dialogue in Indonesia, supporting and coordinating central, provincial, and local government bodies along with the private sector and civil society. In 2009, DNPI published the Indonesia Greenhouse Abatement Cost Curve. The analysis outlined the full potential for Indonesia to reduce its greenhouse gas emissions through the right mixture of domestic policies and international support. The ultimate goal was setting Indonesia on a path of sustainable economic development.
At the time, the cost curve was a ground-breaking effort for Indonesia. Amongst other things, the report:
• Showed Indonesia’s huge potential for emissions reductions from LULUCF measures –at the time estimate at more than 1.2 gigatons CO2e per year in 2030
• Confirmed in the public debate the global importance of ending Indonesia’s soaring peat emissions
• Warned that while Indonesia still has relatively low emissions from fossil power production, the rapid projected growth in coal power risks a lock-in of high emissions investments for decades to come if quick action is not started now to invest in low carbon power
• Calculated a greenhouse gas abatement opportunity for Indonesia more than 70% below the business as usual emissions projection for 2030, at an average cost of USD 2 / ton CO2e, making Indonesia a large and attractive market for other countries seeking to finance climate mitigation efforts
Since the report was published, much has happened. In 2010, President Yudhyono announced Indonesia’s commitment to voluntarily reduce emissions by 26% by 2020. Furthermore, Indonesia entered into a climate partnership with Norway under which the Norwegian Government is making available USD 1 billion in a pay for performance program to support Indonesia in meeting this commitment. More recently, the REDD+ Taskforce has completed its work, and the National REDD+ Agency has been created. In light of these exciting developments, the time is right for DNPI to update its cost curve analysis so that it can continue to serve as a strong analytical base for the new wave of developments.

4 Updating Indonesia’s Greenhouse Gas Abatement Cost Curve
The Head of Secretariat for DNPI and Special Assistant to the President on Climate Change, Agus Purnomo, with the support and close partnership of the Japan International Cooperation Agency (JICA), has now undertaken to update the Indonesia cost curve. DNPI has worked across multiple Indonesian agencies to gather the government’s best thinking on the shifts since 2009 in Indonesia’s emissions trajectory and the available GHG abatement levers, and has begun to syndicate and communicate the implications of the updated analysis more broadly across the government and non-government sectors.
This study builds on the proprietary global GHG abatement database created by the global consultancy McKinsey & Company and developed in partnership with governments, businesses, and non-governmental organizations around the world. The DNPI would like to acknowledge the technical support of McKinsey & Company and Poyry Management Consulting in extending and further developing its methodology for the Indonesian context. The DNPI would also like to thank government, private-sector, and NGO personnel who made important contributions to the sectoral working teams. While the GHG abatement methodology belongs to McKinsey & Company, the conclusions and results set forth in this report are exclusively those of the DNPI. We would also like to express our appreciation to JICA for providing funding, technical, and in-kind support for this work.
This report highlights that while Indonesia’s emissions are significant and expected to grow by more than 65% percent between today and 2030, many opportunities exist to mitigate these emissions. While Indonesia has locked in some additional emissions since 2009, a window of opportunity remains to shift to a less carbon-intensive development model.
This report focuses on the potential for GHG mitigation. It does not address the challenge Indonesia faces in adapting to climate change that has or will occur, although we recognize that the costs of adaptation will be both significant and additive to mitigation costs. While this report provides a number of options for action that other governments have found useful to reduce greenhouse emissions, it explicitly does not endorse any particular policy recommendations.
5Updating Indonesia’s Greenhouse Gas Abatement Cost Curve
AcknowledgementsWhile this has been a rapid update to the 2009 cost curve analysis, we have already had the opportunity to meet with a large number of experts and stakeholders through both bilateral conversations and sectoral inter-agency workshops including the workshop held at DNPI on 22 January 2014. We really appreciate feedback and comments for a draft update report provided by relevant ministries, agencies and institutions as well as individuals after we opened one month public comment period. We would like to thank the following individuals for their assistance and their time, especially for some local experts and stakeholders who conducted intensive review on our data used.
Technical team: Agus Purnomo (DNPI), Farhan Helmy (ICCC), Titi Panjaitan, Dicky Edwin Hindarto, Widiatmini Sih Winanti, Muhammad Farid, Doddy S. Sukadri, Dewi Aprianti, Jannata Giwangkara, Emod Tri Utomo, Ulfah Zul Farisa (DNPI), Jun Ichihara, Bramantyo Dewantoputra, Astri Indirawati (JICA).
For information and input on the LULUCF and peatland sectors: Yetti Rusli, Ruandha Agung Sugardiman, Haryo P (MOF), Rhesa Darojat (MOE), Nirartha Samadhi, Adi Pradana, Listya Kusumawati, Dieni Ulya (UKP4), Umiyatun Hayati Triastuti, Budhi Setiawan (Bappenas), Mukti Sardjono, Mazwar (MOA), Budi Situmorang, Putri Nurul P (PU), Erna Sri A (LAPAN), Surahman, Iin Herawati (BPN), Arif R (ICRAF), Henky Satrio (AMAN), Hultera (WWF), Marissa Malahayati (CCROM SEAP IPB), Eddy S (APHI), Eka Melisa (SKPPI), Farhan Helmy, Dadang Hilman (ICCC), Shigeru Takahara (JICA), Philippe.Guizol (CIRAD), Agus Purnomo, Muhammad Farid, Ari Mochammad, Doddy S. Sukadri (DNPI).
For information and input on the power sector: Arie Pujiwati, Aries Z, Gita Lestari, Hermawan, Hery Nursito, Junifer S, Ilham Rakhman, Tedi Yunanto, Yogi Alwenda (ESDM), Paul Butarbutar (MOF), Ridwan Djamaluddin, Laode M. Abdul Wahid, Ira Fitriana, Wahyu Purwanta (BPPT), Cecilya Malik (former BPPT), Diana Rosdiana (DEN), Amna A, Ishak Burhani, Kamia Handayani (PLN), Asclepias Rachmi, Azis Pusakantara (IIEE), Jon Respati, D.A. Purbasari (Surya University), Fabby Tumiwa (IESR), Surya Darma, Ananda Setiyo Ivannanto, Andhika Prastawa (METI), Verenia Andria (UNDP), Takeshi Enoki (MUFG), Rob Daniel, Tim Boothman (PWC), Leela Raina (Strategic Asia), Artissa Panjaitan (ICCC), Widiatmini Sih Winanti, Moekti Soejachmoen, Dicky Edwin Hindarto (DNPI), Arief Sugiyanto (PLN).
For information and input on the road transport sector: Tonny AS, Fahni Mauludi, Mohammad Malawat (MOT), Budi Prasetyo Susilo, Freddy A. Sutrisno (GAIKINDO), Yusa Cahya (MTI), Jane Romero (ADB), Agus Salim Suseno (PT Honda Prospect Motor).
6 Updating Indonesia’s Greenhouse Gas Abatement Cost Curve
How to read the greenhouse gas abatement cost curve
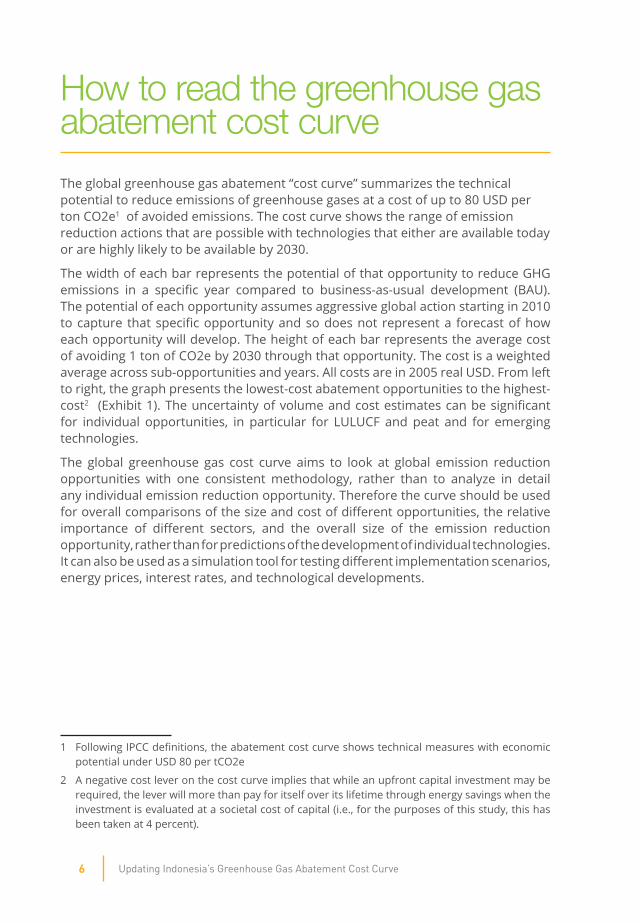
The global greenhouse gas abatement “cost curve” summarizes the technical potential to reduce emissions of greenhouse gases at a cost of up to 80 USD per ton CO2e1 of avoided emissions. The cost curve shows the range of emission reduction actions that are possible with technologies that either are available today or are highly likely to be available by 2030.
The width of each bar represents the potential of that opportunity to reduce GHG emissions in a specific year compared to business-as-usual development (BAU). The potential of each opportunity assumes aggressive global action starting in 2010 to capture that specific opportunity and so does not represent a forecast of how each opportunity will develop. The height of each bar represents the average cost of avoiding 1 ton of CO2e by 2030 through that opportunity. The cost is a weighted average across sub-opportunities and years. All costs are in 2005 real USD. From left to right, the graph presents the lowest-cost abatement opportunities to the highest-cost2 (Exhibit 1). The uncertainty of volume and cost estimates can be significant for individual opportunities, in particular for LULUCF and peat and for emerging technologies.
The global greenhouse gas cost curve aims to look at global emission reduction opportunities with one consistent methodology, rather than to analyze in detail any individual emission reduction opportunity. Therefore the curve should be used for overall comparisons of the size and cost of different opportunities, the relative importance of different sectors, and the overall size of the emission reduction opportunity, rather than for predictions of the development of individual technologies. It can also be used as a simulation tool for testing different implementation scenarios, energy prices, interest rates, and technological developments.
1 Following IPCC definitions, the abatement cost curve shows technical measures with economic potential under USD 80 per tCO2e
2 A negative cost lever on the cost curve implies that while an upfront capital investment may be required, the lever will more than pay for itself over its lifetime through energy savings when the investment is evaluated at a societal cost of capital (i.e., for the purposes of this study, this has been taken at 4 percent).
7Updating Indonesia’s Greenhouse Gas Abatement Cost Curve
Exhibit 1
The cost of abatement is calculated from a societal perspective (i.e., excluding taxes, subsidies, and with a capital cost similar to government bond rates), which is useful to allow comparisons of opportunities and costs across countries, sectors, and individual opportunities. However it also means that the costs calculated are different from the costs a company or consumer would see, as taxes, subsidies, and different interest rates in their calculations would then also be included. Therefore the curve cannot be used for determining switching economics between investments, nor for forecasting CO2 prices. The cost of each opportunity also excludes transaction and program costs to implement the opportunity on a large scale, as these are highly dependent on how policy makers choose to implement each opportunity. The costs to fully implement specific reduction opportunities, therefore, will be higher than those shown in the cost curve.
Lastly, we should note that a zero or negative cost opportunity does not mean the opportunity has no costs; rather, this is the net present value of the costs and benefits from the opportunity. Nearly all the levers due contain some up-front capex requirement to unlock the flow of value. In many cases, Indonesia might need to turn to international financing to capture the opportunities if capital is not available domestically for the up-front investment.
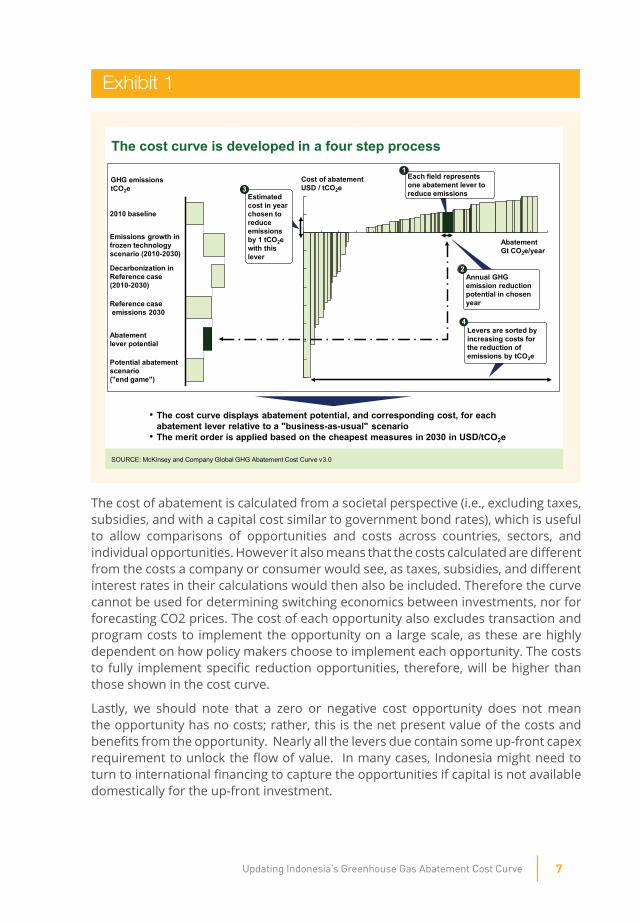
The cost curve is developed in a four step process
Abatement Gt CO2e/year
Cost of abatementUSD / tCO2e
Potential abatement scenario ("end game")
Abatement lever potential
Reference caseemissions 2030
Decarbonization in Reference case(2010-2030)
Emissions growth infrozen technologyscenario (2010-2030)
2010 baseline
GHG emissionstCO2e
Estimated cost in year chosen to reduce emissions by 1 tCO2ewith this lever
3
Each field represents one abatement lever to reduce emissions
1
Annual GHG emission reduction potential in chosen year
2
Levers are sorted by increasing costs for the reduction of emissions by tCO2e
4
• The cost curve displays abatement potential, and corresponding cost, for each abatement lever relative to a "business-as-usual" scenario
• The merit order is applied based on the cheapest measures in 2030 in USD/tCO2e
SOURCE: McKinsey and Company Global GHG Abatement Cost Curve v3.0
8 Updating Indonesia’s Greenhouse Gas Abatement Cost Curve
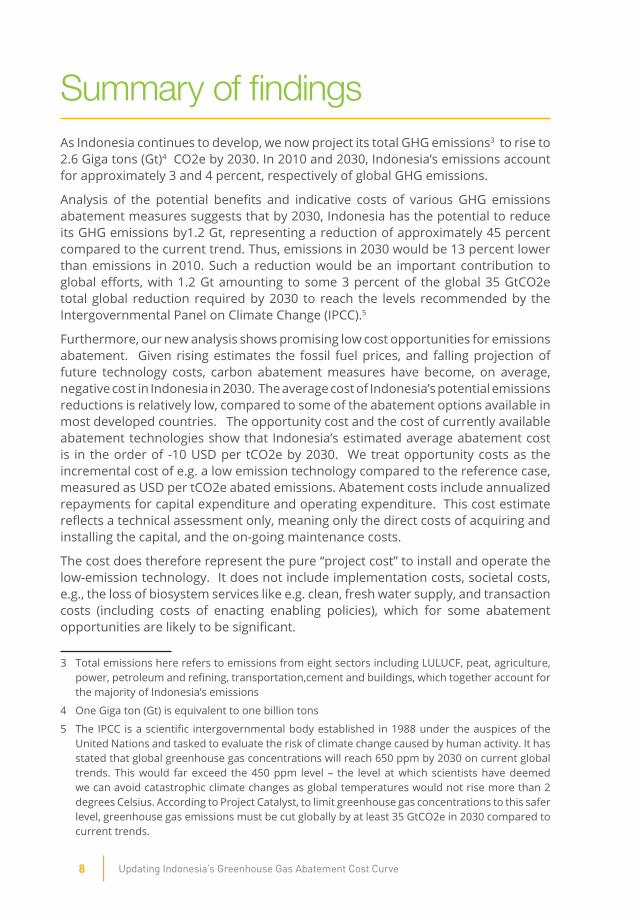
Summary of findingsAs Indonesia continues to develop, we now project its total GHG emissions3 to rise to 2.6 Giga tons (Gt)4 CO2e by 2030. In 2010 and 2030, Indonesia’s emissions account for approximately 3 and 4 percent, respectively of global GHG emissions.
Analysis of the potential benefits and indicative costs of various GHG emissions abatement measures suggests that by 2030, Indonesia has the potential to reduce its GHG emissions by1.2 Gt, representing a reduction of approximately 45 percent compared to the current trend. Thus, emissions in 2030 would be 13 percent lower than emissions in 2010. Such a reduction would be an important contribution to global efforts, with 1.2 Gt amounting to some 3 percent of the global 35 GtCO2e total global reduction required by 2030 to reach the levels recommended by the Intergovernmental Panel on Climate Change (IPCC).5
Furthermore, our new analysis shows promising low cost opportunities for emissions abatement. Given rising estimates the fossil fuel prices, and falling projection of future technology costs, carbon abatement measures have become, on average, negative cost in Indonesia in 2030. The average cost of Indonesia’s potential emissions reductions is relatively low, compared to some of the abatement options available in most developed countries. The opportunity cost and the cost of currently available abatement technologies show that Indonesia’s estimated average abatement cost is in the order of -10 USD per tCO2e by 2030. We treat opportunity costs as the incremental cost of e.g. a low emission technology compared to the reference case, measured as USD per tCO2e abated emissions. Abatement costs include annualized repayments for capital expenditure and operating expenditure. This cost estimate reflects a technical assessment only, meaning only the direct costs of acquiring and installing the capital, and the on-going maintenance costs.
The cost does therefore represent the pure “project cost” to install and operate the low-emission technology. It does not include implementation costs, societal costs, e.g., the loss of biosystem services like e.g. clean, fresh water supply, and transaction costs (including costs of enacting enabling policies), which for some abatement opportunities are likely to be significant.
3 Total emissions here refers to emissions from eight sectors including LULUCF, peat, agriculture, power, petroleum and refining, transportation,cement and buildings, which together account for the majority of Indonesia’s emissions
4 One Giga ton (Gt) is equivalent to one billion tons
5 The IPCC is a scientific intergovernmental body established in 1988 under the auspices of the United Nations and tasked to evaluate the risk of climate change caused by human activity. It has stated that global greenhouse gas concentrations will reach 650 ppm by 2030 on current global trends. This would far exceed the 450 ppm level – the level at which scientists have deemed we can avoid catastrophic climate changes as global temperatures would not rise more than 2 degrees Celsius. According to Project Catalyst, to limit greenhouse gas concentrations to this safer level, greenhouse gas emissions must be cut globally by at least 35 GtCO2e in 2030 compared to current trends.

9Updating Indonesia’s Greenhouse Gas Abatement Cost Curve
Peat And LULUCF Remain The Largest Source Of Emissions Over The Next Decade
LULUCF-related emissions are by far the largest contributors to Indonesia’s current and expected future emissions) under our new projection of emissions through 2030 (Exhibit 2). Power emissions only exceed LULUCF sector in 2030. LULUCF also represents the largest opportunities to abate emissions. High growth rates in power and transport-related emissions mean that, although opportunities in these sectors become progressively more important in the years ahead, strategic choices on the development pathway must begin today. While, as noted above, the other sectors have not been updated in this report, we include them in the exhibit below to provide an illustrative view on the overall business as usual emissions pathway through 2030, and because they represent a small share of total emissions. Any changes to emissions from those sectors are due purely to inter-linkages with LULUCF, power, and road transport.
Exhibit 2
Indonesian emissions are estimated to grow from 1.6 to 2.6 GtCO2e between 2010 and 2030Projected emissions1, Million tons CO2e
145
232
38
31
25
AgriculturePetroleum and gasCement
2030
2,609
995
1,011
15110875
2020
1,846
990
Buildings
14310445
2010
986
22772 389
105261,577
+68%
LULUCF & Peat2
PowerTransport
136
Share of global emissions3
3% 4%
SOURCE: Indonesia GHG Abatement Cost Curve
1 Includes only direct emissions from each sector2 Emissions from LULUCF are based on a net emission approach i.e., including absorption3 Based on 2011 estimates showing global emissions at 51.7 Gt and 67.6 Gt in 2010 and 2030, respectively
10 Updating Indonesia’s Greenhouse Gas Abatement Cost Curve
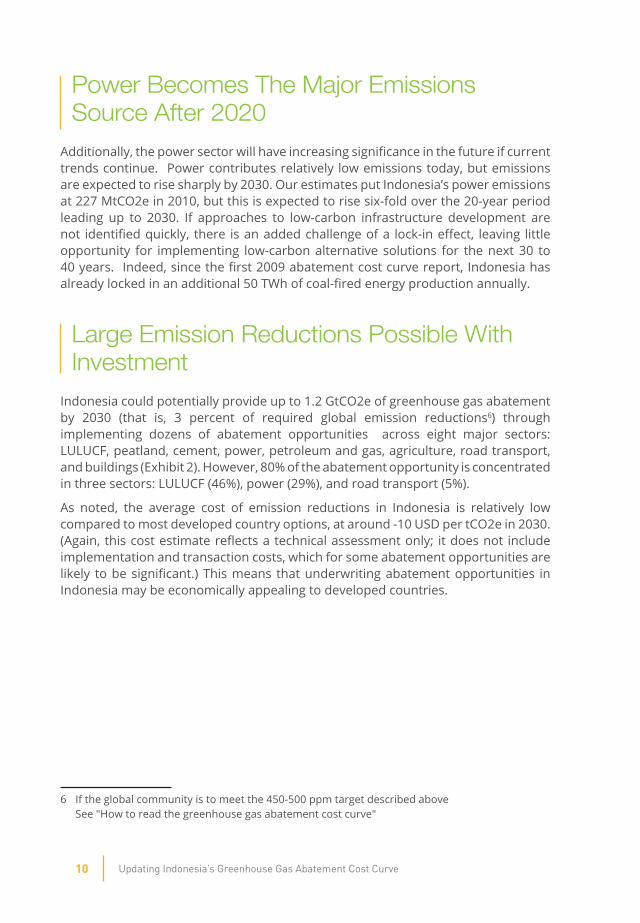
Power Becomes The Major Emissions Source After 2020
Additionally, the power sector will have increasing significance in the future if current trends continue. Power contributes relatively low emissions today, but emissions are expected to rise sharply by 2030. Our estimates put Indonesia’s power emissions at 227 MtCO2e in 2010, but this is expected to rise six-fold over the 20-year period leading up to 2030. If approaches to low-carbon infrastructure development are not identified quickly, there is an added challenge of a lock-in effect, leaving little opportunity for implementing low-carbon alternative solutions for the next 30 to 40 years. Indeed, since the first 2009 abatement cost curve report, Indonesia has already locked in an additional 50 TWh of coal-fired energy production annually.
Large Emission Reductions Possible With Investment
Indonesia could potentially provide up to 1.2 GtCO2e of greenhouse gas abatement by 2030 (that is, 3 percent of required global emission reductions6) through implementing dozens of abatement opportunities across eight major sectors: LULUCF, peatland, cement, power, petroleum and gas, agriculture, road transport, and buildings (Exhibit 2). However, 80% of the abatement opportunity is concentrated in three sectors: LULUCF (46%), power (29%), and road transport (5%).
As noted, the average cost of emission reductions in Indonesia is relatively low compared to most developed country options, at around -10 USD per tCO2e in 2030. (Again, this cost estimate reflects a technical assessment only; it does not include implementation and transaction costs, which for some abatement opportunities are likely to be significant.) This means that underwriting abatement opportunities in Indonesia may be economically appealing to developed countries.
6 If the global community is to meet the 450-500 ppm target described above See "How to read the greenhouse gas abatement cost curve"

11Updating Indonesia’s Greenhouse Gas Abatement Cost Curve
Exhibit 3
Amongst these emissions reduction opportunities, there are 10 priority themes that contain most of the least expensive, often “cost-negative” opportunities, for emissions abatement. Those ten, and their annual abatement potential and costs in 2030, are as follows:
• LULUCF– Forest and peat moratorium extension: 91 MtCO2e at USD 0-3 / ton– Reduced impact logging: 48MtCO2e at USD 2 -5 / ton– Afforestation and reforestation: 54MtCO2e at USD 2 -5 / ton– Improving community practices: 76 MtCO2e below 5 USD / ton– Peatland management: 141 MtCO2e at 6-10 USD / ton– Fire prevention: 45 MtCO2e at 2-5 USD / ton
• Power– Encouraging new hydro power: 125 MtCO2e at cost savings of 10 to 14 USD / ton– Accelerating geothermal scale-up: 74 MtCO2e at 7 USD / ton
• Roadtransport– Electrifying the vehicle market: 18 MtCO2e at cost savings of 375 – 475 USD / ton– Pushing low emissions internal combustion engines: 15 MtCO2e at cost savings
of 200 to 1800 USD / ton
-450
800700600500400300
100
0
-100
-150
-200
-250
-300
-350
-400
200 1,3001000 1,2001,1001,000900
Reduction cost2
USD per tCO2e
Indonesia has the potential to reduce CO2 emissions by up to 1.2 Gt per year by 2030
SOURCE: Indonesia GHG Abatement Cost Curve
1 Societal perspective implies utilizing a 4% discount rate2. The width of each bar represents the volume of potential reduction. The height of each bar represents the cost to capture each reduction initiative
Societal perspective1, 2030
Solar PV
Large hydroAppliances - refrigerators, commercial
Small hydroGrassland management
Afforestation/reforestation
Improve community practices
Peatmanagement
Fire prevention on mineral soils
Geothermal
Spatial planning
Nuclear
Biomass dedicated
Degraded land restoration
Passenger Vehicle gasoline Bundle 4
Sustainableloggingpractice
Clinkersubstitutionby Slag Co-generation - downstream
Two Wheeler Electric
12 Updating Indonesia’s Greenhouse Gas Abatement Cost Curve
Updated emissions scenarios and abatement opportunities in key sectors
Land Use, Land-Use Change, And Forestry (LULUCF) And Peat
2030 –emissions: 995MtCO2e, abatement potential: 593MtCO2e
Indonesia’slandusesystemanditsimplicationsoncarbonstockdevelopments
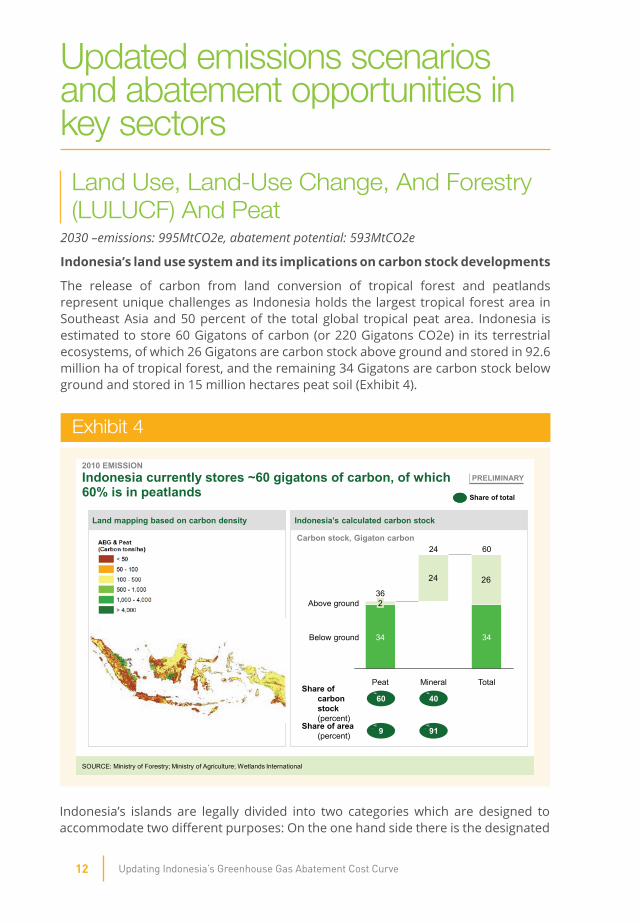
The release of carbon from land conversion of tropical forest and peatlands represent unique challenges as Indonesia holds the largest tropical forest area in Southeast Asia and 50 percent of the total global tropical peat area. Indonesia is estimated to store 60 Gigatons of carbon (or 220 Gigatons CO2e) in its terrestrial ecosystems, of which 26 Gigatons are carbon stock above ground and stored in 92.6 million ha of tropical forest, and the remaining 34 Gigatons are carbon stock below ground and stored in 15 million hectares peat soil (Exhibit 4).
Exhibit 4
Indonesia’s islands are legally divided into two categories which are designed to accommodate two different purposes: On the one hand side there is the designated
Indonesia currently stores ~60 gigatons of carbon, of which 60% is in peatlands
Land mapping based on carbon density Indonesia’s calculated carbon stock
SOURCE: Ministry of Forestry; Ministry of Agriculture; Wetlands International
24 26
24
Mineral
2
34
Peat
60
Below ground
36
34
Above ground
Total
4060
Carbon stock, Gigaton carbon
Share of carbon stock(percent)
919Share of area (percent)
Share of total
PRELIMINARY2010 EMISSION
13Updating Indonesia’s Greenhouse Gas Abatement Cost Curve
8 Ministry of Forestry Indonesia; Annual Statistics 20119 In 2008 Ministry of Forestry published Rekalkulasi Penutupan Lahan Indonesia 2008, which
reported forest cover in Indonesia. As many as 39 million hectares Kawasan Hutan does not have forest cover and as many as 8 million hectares APL still has forest cover.
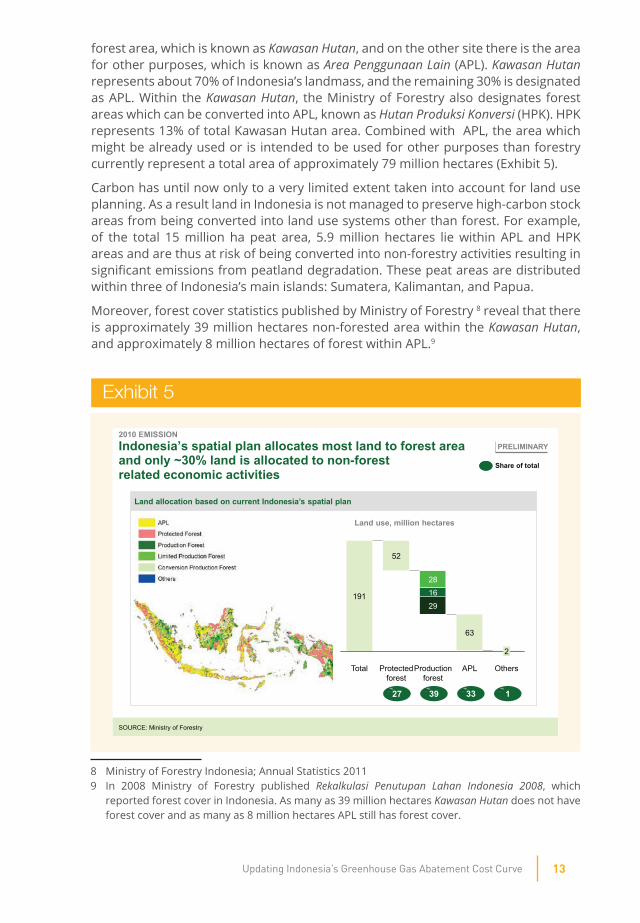
Exhibit 5
Indonesia’s spatial plan allocates most land to forest area and only ~30% land is allocated to non-forest related economic activities
2010 EMISSION
Land allocation based on current Indonesia’s spatial plan
OthersAPLProduction forest
Protected forest
Total
63
52
29
1628
191
2
Land use, million hectares
27 39
Share of total
SOURCE: Ministry of Forestry
PRELIMINARY
33 1
forest area, which is known as Kawasan Hutan, and on the other site there is the area for other purposes, which is known as Area Penggunaan Lain (APL). Kawasan Hutan represents about 70% of Indonesia’s landmass, and the remaining 30% is designated as APL. Within the Kawasan Hutan, the Ministry of Forestry also designates forest areas which can be converted into APL, known as Hutan Produksi Konversi (HPK). HPK represents 13% of total Kawasan Hutan area. Combined with APL, the area which might be already used or is intended to be used for other purposes than forestry currently represent a total area of approximately 79 million hectares (Exhibit 5).
Carbon has until now only to a very limited extent taken into account for land use planning. As a result land in Indonesia is not managed to preserve high-carbon stock areas from being converted into land use systems other than forest. For example, of the total 15 million ha peat area, 5.9 million hectares lie within APL and HPK areas and are thus at risk of being converted into non-forestry activities resulting in significant emissions from peatland degradation. These peat areas are distributed within three of Indonesia’s main islands: Sumatera, Kalimantan, and Papua.
Moreover, forest cover statistics published by Ministry of Forestry 8 reveal that there is approximately 39 million hectares non-forested area within the Kawasan Hutan, and approximately 8 million hectares of forest within APL.9

14 Updating Indonesia’s Greenhouse Gas Abatement Cost Curve
SpatialplanninginIndonesiaIndonesia’s land use system is designed to serve two purposes: A designated forest area, which is known as Kawasan Hutan, and an area for other purposes, which is known as Area Penggunaan Lain (APL). Kawasan Hutan represents about 70% of Indonesia’s land, and the remaining 30% is designated as APL.
The Ministry of Forestry divides Kawasan Hutan into four different sub-section: Convertible production forest, which is known as Hutan Produksi Konversi (HPK); Production forest, which is known as Hutan Produksi (HP); Limited production forest, which is known as Hutan Produksi Terbatas (HPT), and protected or conservation forest.
HPK is forest area reserved for non-forest development activities, thus can be converted into APL. Together with APL, the areas represent 78 million hectares and is theoretically available for agriculture and estate crops expansion, as well as infrastructure and other non-forestry economic activities.
On the other hand, HP (production forest) and HPT (limited production forest) areas are available for forestry-related development activities. These areas can be used for selective natural forest logging activities (Hak Pengusahaan Hutan (HPH)) to supply the wood products industry or industrial timber plantations, (Hutan Tanaman Industri (HTI)) to supply the wood products industry and more importantly the pulp and paper industry.
There has been a broad recognition of the importance of both LULUCF and peatland emissions since the DNPI’s published Indonesia’s GHG Abatement Cost Curve report in August 2009. Many studies have been initiated, both to establish a more bottom-up GHG emission baseline and also to develop a better understanding on peat and its degradation related emissions. Furthermore, a few initiatives have been started by the Government of Indonesia to tackle climate change issues.
In October 2009, President Susilo Bambang Yudhyono committed to reduce Indonesia’s CO2e emissions by 26% against the business-as-usual trajectory in 2020, and a further reduction of 41% with international financial support, while maintaining 7% annual economic growth. This is the largest voluntary emission reduction commitment made by any developing country to date..
In 2009 Indonesia submitted the Second National Communication (SNC) to the UNFCCC, which documented emissions for the period 2000 to 2005 across multiple sectors as well as Indonesia’s efforts in dealing with climate change through mitigation and adaptation measures. Following the SNC, in 2011 the President Yudhono signed

15Updating Indonesia’s Greenhouse Gas Abatement Cost Curve
a presidential regulation defining the National Action Plan on GHG Reduction (RAN-GRK). The regulation mandates the implementation of GHG reduction efforts to different line ministries as well as local governments.
In 2010, the Governments of Indonesia and Norway signed the Letter of Intent (LoI) for a Climate Partnership focusing on Reducing Emissions from Deforestation and Forest Degradation (REDD+). As result of this partnership, a REDD+ agency was established in late 2013 and of equal importance a forest moratorium was implemented in 2011 and extend in 2013. The moratorium is meant to to give time for forestry and land-use related management reforms and the establishment of a cross-sector and a cross-agency indicative land use and concession map.
Indonesia’s Forest MoratoriumThe Government of Indonesia has committed to the protection of vast forest and peat areas through a moratorium for new land use related business licenses. Exceptions to the moratorium apply for licenses that have been approved by Ministry of Forestry (persetujuan prinsip), development of strategic importance for the country i.e. geothermal, oil and gas and power plant, and extensions of current existing forest use permits (izin pemanfaatan kawasan hutan). Currently the moratorium covers approximately 65 million ha of primary forest and peatlands. It is estimated that approximately 6 million ha would be under risk of planned deforestation and forest degradation without the protection through the Moratorium (Exhibit 6,7) .10
10 The moratorium was regulated under Presidential Instruction No 10 Year 2011 (Instruksi Presiden No 10 Tahun 2011). The 2-year extension of the moratorium is regulated under Presidential Instruction No 6 Year 2013 Instruksi Presiden No 6 Tahun 2013). See Moratorium description for further details.

16 Updating Indonesia’s Greenhouse Gas Abatement Cost Curve
Exhibit 6
Exhibit 7

17Updating Indonesia’s Greenhouse Gas Abatement Cost Curve
The moratorium instruction also mandates related ministries to improve forest and land use governance and establish a consolidated indicative moratorium map. Indonesia’s Presidential Delivery Unit (UKP4), and later the new REDD+ agency, have been appointed to monitor the implementation of the decree.
In May 2013, President Yudhoyono signed another Presidential Instruction extending the moratorium to 2015. In the same year, the President also signed a regulation establishing the REDD+ agency. The agency plays an important role in monitoring the moratorium and ensuring improvement in forest governance, as it is mandated to facilitate coordination and resolve conflicts related to REDD+ related activities.
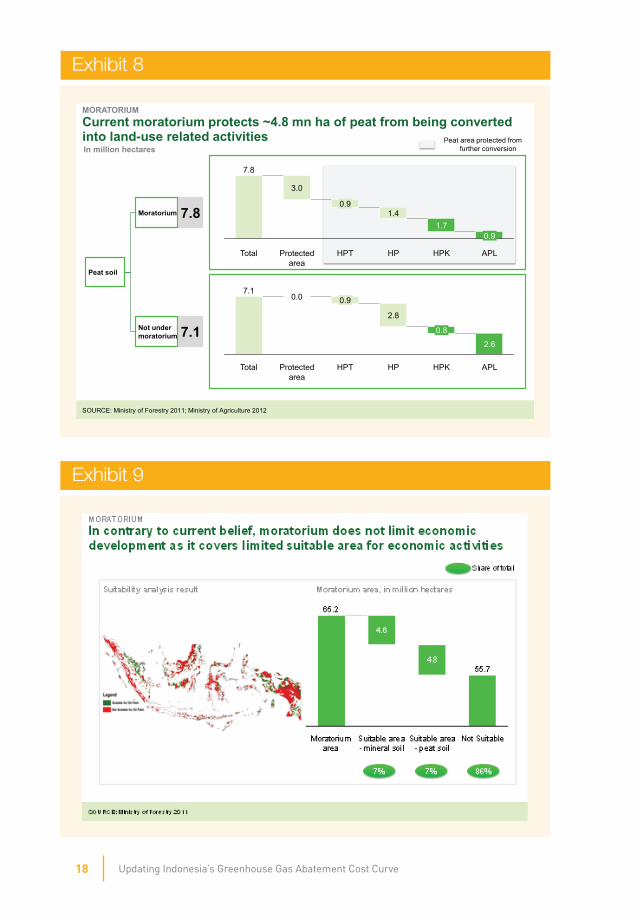
The moratorium includes approximately 7.8 million hectares peatland, representing more than 50% of total peatland area in Indonesia. 4.8 million hectares of peat are under immediate risk of decomposition due to deforestation or forest degradation activities should there be no moratorium as the locations are economically attractive for oil palm or timber plantations.
The current moratorium excludes 7.1 million hectares peatland. Almost 40% of this peatland area lies within APL, which is legally set aside non-forestry activities. Thus the peatland within this area is at immediate risk of being converted to other land uses and as a result will slowly decompose.
The moratorium received strong reactions from both, Non-Governmental Organizations (NGOs) and the private sector. One of the common beliefs of the private sector is that the moratorium limits the country’s economic development opportunity because it prohibits the expansion of plantation and agricultural activities. In contrary to this belief, our analysis shows that only a very limited area of the moratorium is actually suitable and economically interesting for palm oil or other estate crops and timber plantations. Of 65 million hectares moratorium area, only 4.5 million hectares of forest growing on mineral soil is suitable for palm oil activities, or less than 7% of the total area. If peat soil is also taken into account, the total suitable area for oil palm development is 9.4 million hectares or less than 15% of the moratorium area (Exhibit 9).
18 Updating Indonesia’s Greenhouse Gas Abatement Cost Curve
Exhibit 8
Exhibit 9
Current moratorium protects ~4.8 mn ha of peat from being converted into land-use related activities
Peat soil
Moratorium 7.8
Not under moratorium 7.1
0.9
1.40.9
7.8
3.0
1.7
Total Protected area
HPT HP APLHPK
APL
2.6
HPK
0.8
HP
2.8
HPT
0.9
Protected area
0.0
Total
7.1
Peat area protected from further conversion
SOURCE: Ministry of Forestry 2011; Ministry of Agriculture 2012
MORATORIUM
In million hectares

19Updating Indonesia’s Greenhouse Gas Abatement Cost Curve
Publications from the Round Table of Sustainable Palm Oil (RSPO) on best practice management of oil palm11 on peat suggests that palm oil production on peat presents many challenges and could result in yields as low as 10 Mt FFB/ha/annum or less than half of what could be on mineral soils as palms tend to fall over in the soft peat soil and are exposed to periodic flooding and draught. Furthermore subsidence eventually leads to a loss of the plantable area.
Current emissions and GHG emission outlook
Peatemissions
Peatlands store a massive amount of carbon in the form of organic matter accumulated in waterlogged soils over thousands of years.
Emissions from peatland today represent 44 percent of Indonesia’s total emissions and will continue to remain a dominant portion in 2030 (at 31percent) if no major action is taken. Under our updated emissions projection, emissions from peatland are expected to increase by 5 percent from 702MtCO2e in 2010 to 737MtCO2e in 2030. Current emissions and the emission outlook from peat is shown in Exhibit 10.
Exhibit 10
Emissions from peat fire and peat decomposition are expected to increase by 35 MtCO2e under BAU scenario
453
2010
702 720
267
2020
Peatdecom
position
Fire
249
2030
737
284
453 453
Current and future GHG emissions from the peat sectorMtCO2e/year
Peat decomposition will be increased as deforestation in peat continues to happen
SOURCE: Ministry of Forestry 2011; Ministry of Agriculture 2012; RAN GRK 2011
2030 BAU SCENARIOPRELIMINARYEmissions from peat fire and peat decomposition are
expected to increase by 35 MtCO2e under BAU scenario
453
2010
702 720
267
2020
Peatdecom
position
Fire
249
2030
737
284
453 453
Current and future GHG emissions from the peat sectorMtCO2e/year
Peat decomposition will be increased as deforestation in peat continues to happen
SOURCE: Ministry of Forestry 2011; Ministry of Agriculture 2012; RAN GRK 2011
2030 BAU SCENARIOPRELIMINARY
11 RSPO Manual on Best Management Practices (BMPs) for Management and Rehabilitation of Natural Vegetation Associated with Oil Palm Cultivation on Peat, October 2012

20 Updating Indonesia’s Greenhouse Gas Abatement Cost Curve
Fires are the main sources of peat-related emissions. In 2010, fires accounted for 453 MtCO2e, more than 60% of all peatland related emissions. Peatland decomposition as a consequence of drainage is the second largest source of peat-related emissions, accounting for another 249 MtCO2e.
As peatland forests are converted to another land use, the removal of the above ground biomass during land clearing and timber extraction during logging of production forests (HPH) results in further CO2e emissions; to avoid double counting, these emissions are accounted for in the LULUCF sector.
Peatfires
Emissions related to peat fires are estimated to have reached 453 MtCO2e per year in average12. By the time this report is in writing, there is still only limited information available related to peat fires, neither from government agencies nor from academic publications. Widely recognized estimates for 2000-2006 emissions from peat fires were provided by Van der Werf et.al (2008). This study has been widely accepted and has been used for both, the previous DNPI cost curve report and the Second National Communication (SNC) to the UNFCCC as the main data source.
In our updated calculation the estimated emissions from peatland fires are based on average number of hotspots from 2007 to 2013 provided by MODIS satellite imagery, and emission figures provided by Van der Werf et.al. Despite the hotspot reduction target published by BAPPENAS in the RAN-GRK in 2011, we believe that average number of hotspots from the past 5 years should be used to describe current and future emissions as no specific actions have been taken by the Indonesian Government until now to increase to readiness to detect and fight fires e.g. through the installation of additional fire crews or watch towers.
In December 2013, DNPI and JICA published a report titled “Greenhouse Gasses Assessment from Forest Fires: Indonesia Case Study”. The report’s estimate of the annual peat hotspot of 16,570 is aligned with our estimate. The report also reveals that 64% of the forest and land fires occurred outside concessions, mostly caused by local communities in preparing land for cultivation or regaining their rights over land. Of the remaining 36%, fire is deliberately set for land preparation by companies or communities. CIFOR observation showed that many of the June 2013 fires, when the haze from Indonesia was significant, were part of plantation establishment processes.
12 It needs to be acknowledged that peat fires and the related emissions depend highly on the climatic conditions within a specific year and therefore differ widely from year to year.

21Updating Indonesia’s Greenhouse Gas Abatement Cost Curve
13 RAN-GRK figure uses Hoojier et.al’s emission factor per meter of peat drainage level and applies 30% root respiration correction factor.
PeatDecomposition
Emissions from peat decomposition are expected to continue to grow by 14 percent from 249 MtCO2e in 2010 to approximately 284 MtCO2e in 2030, due to the combination of continued emissions from already drained peatland and due to the fresh conversion and drainage of forested peatland to other land use activities. Drainage accelerates the rate of peat soil decomposition, as significantly larger surface areas of peat soil are exposed to oxygen and hence the carbon is made susceptible to oxidation and is released as CO2e.
It is only in recent years, as more peatlands have been cleared, that land managers and scientist have come to understand how peat soils behave if they are drained and partially dry out for temporary periods of time. Peat soils subside significantly due to compaction, shrinkage and decomposition when drained. Over time, this results in the loss of the peat layer. At the same time, the drying out of the surface layers result in a growing vulnerability to hard-to-manage peat fires.
Our updated estimates of carbon emissions from peat decomposition are based on an analysis of historically drained peat areas and the expected future conversion of remaining peat forests into different land uses. Emissions from peat soil decomposition are assumed to depend on drainage depth. Estimates are derived from measures of decomposition for different levels of drainage (for different land uses) combined with the area of degraded land and the number of years of decomposition after the initial drainage. While there are several different publications with estimates of different drainage levels and different emission factors per decimeter of drainage level, we believe that the RAN-GRK data that we are using is at the low end of the emission factors, thus the emission figure from peat decomposition is considered conservative.
The wide range of drainage levels and emission factors per decimeter of drainage level leads to a significant uncertainty of emission from peat decomposition. For example, Hoojier et.al (2006) reported that the emission factor per meter of peat drainage level is 91 t C/ha or equal to 336.7 tCO2e/ha. This emission factor is 40% higher than the one applied by BAPPENAS in RAN-GRK. Moreover, Hoojier published relatively high drainage levels for different land uses, leading to an even higher emission figure if applied.13

22 Updating Indonesia’s Greenhouse Gas Abatement Cost Curve
LULUCF emissionsDeforestation peaked in Indonesia in the late 1990s, at a rate of more than 3.5 million ha annually, and has significantly decreased since then, averaging roughly 830 thousand ha annually between 2006 and 2009 (Exhibit 11). Based on the latest data from the Ministry of Forestry the deforestation rate has slowed further in the most recent years and reached a record low of 450 thousand ha annually between 2009 and 2011. Going forward we believe that the increasing global demand for pulp and paper products and palm oil derived products from Indonesia together with a growing domestic demand for food crops will result in the conversion of an additional 11.5 to 13 million ha forested land by 2030 if current land use practices continue unchanged.
Exhibit 11
In 2014, Belinda, et.al published a journal titled “Primary Forest Cover Loss in Indonesia Over 2000-2012”, which estimates that Indonesia has lost 6.02 million hectares of forest cover between 2000 and 2012. The publication also estimates that highest deforestation happened in 2012 with 0.84 million hectares forest cover lost, almost doubled than that in Brazil. On the other hand, the Ministry of Forestry has claimed that the deforestation rate has been reduced to only 0.45 million hectares in 2012. The discrepancies between the two deforestation rate figures can be explained as follows:

23Updating Indonesia’s Greenhouse Gas Abatement Cost Curve
Exhibit 12
• The journal classifies land cover based on digital classification which is easily influenced by cloud. In tropical countries like Indonesia, cloud-free imagery could be difficult to obtain, thus the area classification could be different from Ministry of Forestry. On the other hand, the Ministry of Forestry uses visual interpretation to classify the land. This has resulted in discrepancies on the forest area.
• The journal uses different definition of primary and degraded forest from Ministry of Forestry. An example of this is provided in Exhibit 12, where the area in East Kalimantan is defined as secondary forest by Ministry of Forestry, but defined as non-forest by the journal.
While we are not able to provide deforestation rate for a single year, our spatial analysis shows that Indonesia has reduced its annual deforestation rate to 0.6 million hectares between 2009 and 2013, a figure closer to the Ministry of Forestry’s published figure.

24 Updating Indonesia’s Greenhouse Gas Abatement Cost Curve
Despite the current moratorium which limits land conversion and deforestation in certain areas, we estimate that 11.5 to 13 million ha of forested land are at immediate risk from planned deforestation and forest degradation (Exhibit 13). Indonesia has a total area of 78.3 million hectares which lay outside concessions and outside the moratorium.14 Out of these, 5.5 million ha are within steep slopes, which are unlikely to be economically attractive for investors.15 58 million ha are in plain-slope areas and do not have any forest cover anymore.
Out of the remaining 14.8 million hectares which are forested and located within plain slope, 1.6 million hectares are located more than 200 km away from the next coast line, which is not attractive for economic activities due to high transportation cost. The remaining 13 million hectares are considered attractive - thus they are thought to be at risk of planned deforestation and forest degradation. If we limit the criteria to only areas within 100 km from the coast line, it is estimated that still 11.5 million hectares are highly attractive for economic activities. The spatial map of the area at risk is provided in Exhibit 14.
14 By the time this draft report is written, concession area does not include mining concessions and HGU except palm oil. These concessions are excluded due to data unavailability.
15 Based on several case studies in HTI and Palm oil plantation, areas with slope >30% is not economically attractive as the land clearing, preparation, and maintenance costs are significantly higher than in lowland flat areas.
Exhibit 13

25Updating Indonesia’s Greenhouse Gas Abatement Cost Curve
Exhibit 14
Net emissions from LULUCF account for 18 percent of total carbon emissions in 2010 reaching 284 MtCO2e and are expected to remain significant even if LULUCF related net emissions are expected to decrease to 258MtCO2e in 2030; its relative share will shrink to 11 percent in 2030 (Exhibit 15). However, gross emissions are likely to remain at a high level of more than 500MtCO2e/year due to the ongoing large scale deforestation of 650 thousand ha per year.
The decrease in emissions is based on the assumption that the HPH (logging concession) area will be reduced by approximately 1 million hectare in 2030 (due to expiration of their license), thus reducing emission from forest degradation. In the past 30 years, the Indonesian HPH area has been reduced significantly from 61.7 million hectares in 1992 to 23.4 million hectares in 2011. Similarly, the number of active license were reduced from 575 in 1992 to 292 in 2011.Under the updated emission forecast, emissions from forest degradation are expected to decrease by 7 percent from 174 MtCO2e in 2010 to 161 MtCO2e in 2030.

26 Updating Indonesia’s Greenhouse Gas Abatement Cost Curve
Exhibit 15
Deforestation is expected to remain constant at the current rate of 650 thousand hectares annually and could result in 383 MtCO2e of emissions. Analysis on forest cover change shows that of a total 6.5 million hectares deforested between 2000 and 2009, more than 50% ended up as shrub and bush land, which is not associated with any continued economic activities and thus does not provide lasting value to economic development (Exhibit 16). While the outcome of the deforestation is bush- and shrub land the driver of the deforestation is unclear. In general 2 reasons are identified:
1. A private sector company is running out of funds or is facing license and other legal issues and stops the project. In such a case the result is normally large scale deforestation and conversion into bush and shrub land or in a better case (from a emission and biodiversity perspective) degraded forest.
2. Smallholders clear land to undertake some temporary agricultural activities or to claim ownership of the land. While the size of a particular land plot might be small the sheer amount of smallholders involved into land clearing results in large scale deforestation.

27Updating Indonesia’s Greenhouse Gas Abatement Cost Curve
Exhibit 16
Comparison of 2009 BAU and updated 2014 emission outlook
In the 2009 Indonesia GHG Abatement Cost Curve report we published an emission baseline for Indonesia’s LULUCF and peat sector reflecting a business-as-usual scenario (BAU). In the BAU (Exhibit 17) we estimate that land use related emissions will increase from 1 610 MtCO2e in 2010 to reach 1 640 MtCO2e in 2030. The cause for the relatively constant net emissions was the increasing absorption capacity of reforested and afforested areas under the GERHAN program. The increasing absorption capacity from afforestation was estimated to counterweight the increasing emissions from peatland degradation and peat fires.
Comparing the 2009 BAU with our newly developed 2010 to 2030 GHG emission outlook (Exhibit 18) the estimated levels of Indonesia’s land use related GHG emissions have changed significantly.

28 Updating Indonesia’s Greenhouse Gas Abatement Cost Curve
Exhibit 17
Exhibit 18

29Updating Indonesia’s Greenhouse Gas Abatement Cost Curve
Since 2009 much research has been conducted to better understand the drivers of deforestation and its related emissions. Great attention was also given to emissions related to peatland degradation through decomposition and peat fires. Research results were published through academics but also by the Government of Indonesia16 and suggest the use of new emission (see Appendix for details) factors for deforestation, forest degradation, peat decomposition but also absorption capacity of secondary natural forests and plantations. Applying new emission factors in the 2009 BAU results in a moderate reduction of annual net emissions of 80 MtCO2e by 2030 (Exhibit 19).
As it is shown in Exhibit 19, changing emission factors result in only a minor change. A much larger difference is caused by a change of the areas which is affected by some key emission drivers.
• Deforestation: New publications from the Ministry of Forestry but also our own analysis shows that the average deforestation in Indonesia between 2006 and 2009 has reached 0.7 million ha per year while in the 2009 BAU an average deforestation rate of 1.1 million ha was applied. The change of deforestation rate results in an emission reduction of 261 MtCO2e per year by 2030.
• Forest degradation: In the 2009 BAU forest degradation was assumed to be constant at approximately 0.8 million ha per year. In the updated emissions outlook we now assume that expiring HPH licenses will not extended anymore and therefore the area of selected logging in Indonesia’s natural forests will decrease significantly to approximately 0.45 million ha. As a result the annual emission from forest degradation by 2030 are expected to decrease by 119 MtCO2e compared to the BAU.
• Peat degradation: Emissions from peatland degradation depend on 1) the area of degraded peatland and 2) the average water table height compared to the peat surface. Since the publication of the 2009 Indonesia GHG Abatement Cost Curve a major revision of Indonesia’s peatland area has taken place. As a result of this revision Indonesia peatland area has shrunk from 21 million ha17 to 15 million ha18 and so has the area which was previously thought to be degraded peatland. As a result of reduction of degraded peatland emissions from this source has been reduced by 177 MtCO2e compared to the 2009 BAU.
• Afforestation: The area deemed for afforestation has been reduced significantly to the 2009 BAU based on the rationale that for lasting carbon sequestration the afforested area has to be protected from conversion into other land us. As a result, the area for afforestation has been reduced from 13 million ha to 2 million ha. However as sequestration will be infinite in time the lost absorption potential is only 116 MtCO2e per year compared to the 2009 BAU.
16 Indonesia 2nd National Communication, Rencana Aksi Nasional Penurunan Gas Rumah Kaca (RAN-GRK), Strategi Nasional REDD+
17 Wetlands International18 Ministry of Agriculture, Peta Indikatif Penundaan Ijin Baru (PIPIB)

30 Updating Indonesia’s Greenhouse Gas Abatement Cost Curve
Exhibit 19
Abatement potential and costThe Indonesian government has already started to address LULUCF and peat emission through a presidential decree that prohibits land conversion of primary forest and peat with peat thickness of more than three meters depth19. In addition to this, several opportunities exist for reducing emissions at a relatively modest cost. We estimate a total of 593 MtCO2e can be abated within the LULUCF and peat sector across several levers, including improving spatial planning, a permanent extension of the moratorium, implementation of carbon focused peat management, reduced impact logging, improving livelihood of forest depending communities and last but not least afforestation and reforestation (Exhibit 20). In contrast to other sectors in this GHG abatement cost curve in the LULUCF sector a combination of technical interventions, improved governance and most importantly policy changes acting as enablers are required to reach the full abatement potential. One interesting
19 Presidential Decree No 32 Year 1990 (Keputusan Presiden No 32 Tahun 1990) regulates the management of the protection area (Kawasan Lindung). The decree defines Kawasan Bergambut as areas with peat thickness of more than three meters depth, and this area is categorized as Kawasan Lindung.

31Updating Indonesia’s Greenhouse Gas Abatement Cost Curve
Exhibit 20
example is the case of using degraded land20. While it is technically no problem to use degraded land21 and often does not even result in higher cost for the investor, policy interventions will be required to unlock the degraded land within the Kawasan Hutan for non-forestry activities.
Forestandpeatmoratorium
The Government of Indonesia has committed to the protection of primary forests and peat areas through a moratorium which limits the issue of new business licenses resulting in forest and peatland conversion.
However, only 7.8 million ha out of 15 million hectares of peatland has been included in the moratorium. The remaining 7.2 million hectares are not covered through the moratorium and therefore might face land cover changes and degradation. The legal land status of peat differs widely and APL represents 37% of this area.
Extending the moratorium period to indefinite time for peatland is estimated to have an abatement potential of 91 MtCO2e/year in 2030. Moreover, an additional potential reduction of 135 Mt CO2e/year could be achieved if the moratorium area is extended to include all peatlands. This option provides the cheapest abatement cost of 0 to 3 USD/ton CO2e.
20 Degraded land as defined as land with a low carbon value 21 Degraded in respect of carbon but not soil quality

32 Updating Indonesia’s Greenhouse Gas Abatement Cost Curve
Societal costs of the forest moratorium are difficult to estimate. In theory they could be significant if the moratorium would result in a slower GDP growth. However, given that the majority of the area covered through the moratorium will attract only very little interest from investors, we believe that the impact on GDP and therefore societal cost are close to zero.
Reducedimpactlogging
Our estimates indicate that reducing emissions from stopping or at least reducing the degradation of production forest (HPH and HPK) through a combination of better planning, reduced impact logging, and improved post-harvest management could deliver an emission reduction of 48 MtCO2e at a cost between 2 and 5 USD per tCO2e. Current policies on timber extraction and cutting cycles in production forests are already based on sustainability but do not consider nor calculate total biomass removed, which is typically many multiples of the merchantable timber volumes. In addition, further loss of carbon stock can occur for several years after logging if conditions are not conducive for quick forest regeneration. The higher cost of reduced impact logging compared to conventional logging are a result of higher training requirements and better (and also more expensive equipment) for operators and more stringent and time consuming harvesting planning efforts.
Afforestationandreforestation
Afforestation and reforestation represent a carbon sequestration opportunity of 54 MtCO2e at a cost of 2 to 5 USD per avoided tCO2e. The technical opportunity comes from afforestation of non-forested land for long term carbon sequestration. This land should be located in areas with low economic attractiveness, thus having minimal risk of conversion into other land use. Ideally these reforestation/afforestation programs should be in places where the forest can also support watershed protection and reduce soil erosion. Our analysis suggests that there is approximately 4.6 million hectares potential area for afforestation and reforestation purposes. It should be noted that timber plantations are not counted as afforestation as timber plantations are carbon neutral with rapid built up of carbon over a short time followed by their immediate permanent removal.
The cost of establishing new forests ranges from 400 USD to 1500 USD per hectare, with majority of the cost comes from maintenance after planting period.
Improvecommunitypractices
Improving community practices presents a unique challenge to Indonesia as hundreds of thousands of households live within the designated forest area. These communities live for many years in the area without having legal land ownership certificates, mainly because they have limited access to resources to register their land. Land encroachment becomes an alternative in claiming the land and this method does unfortunately result in unnecessary deforestation.
A single land titling system which provides clear and undisputable land ownership to

33Updating Indonesia’s Greenhouse Gas Abatement Cost Curve
smallholders could avoid these land encroachment practices, along with awareness programs and livelihood training for local communities. These present an abatement opportunity of 76 MtCO2e/year in 2030 at cost below 5 USD per tCO2e abated.
Peatlandmanagement
The rehabilitation of Indonesia’s degraded peatland, e.g., areas within the Ex-Mega Rice Project in Central Kalimantan, could give 141 MtCO2e/year emission reductions in 2030.
The main principle of peat rehabilitation is combining re-wetting and reforestation. The aim is to achieve permanent water saturation of the entire peat body by raising the water table to close to or above the peat surface. The hydrology of natural peat swap forest, however, is maintained only by the forest’s above-ground root system and the related differences in surface elevation.
Peatland rehabilitation is a good way to reduce the CO2e emissions from drained peatlands, but it always remains the second best approach after conservation of primary peatland. Restoration of a peatland site can only reduce GHG emissions to zero if the entire area can be adequately rewetted and reforested. The experiences in Indonesia have shown that complete rewetting is often very difficult or even impossible to achieve because drainage has induced irreversible changes in the peatland topography and hydrology. Stronger than average soil subsidence immediately adjacent to drainage channels results in the formation of ‘mini-domes’ in between strongly subsided areas, which prohibits full rewetting over large areas. The areas that are not sufficiently rewetted will continue to emit GHGs until a new hydrological equilibrium is reached. Achieving full rewetting will often take several decades and large investments. This implies that restoring degraded peatlands cannot compensate for peat swamp conversion on a hectare-by-hectare basis. To compensate for emissions of newly drained peatlands, much larger areas of degraded peatland landscapes will have to be subject to long-term rewetting and reforestation.
Installing a dam based water management system in agricultural areas, timber and estate crops plantations located on peatland is another potential tool to reduce emissions. Water management not only can help to reduce the risk of flooding in the wet season but also prevent the risk of drought in the dry season.
A study conducted by Hoojier, et.al on water management in Central Kalimantan and Riau suggests that water table depths between 0.5 and 0.8 meters are optimum for tree crops that are common on peatlands such as oil palm and Acacia crassicarpa (for pulp wood), and that up to a few weeks of flooding can be tolerated by these crops every year. Current actual average water table depths in many plantations and degraded peatlands are well below one meter and water depths around 2 meters are common in the dry season.
RSPO publications also suggests that oil palm plantation in peat tends to have low productivity whenever poor water management applies. RSPO suggests maintaining water levels at 40 – 60 cm from the peat surface, or 50 – 70 cm in the main channels.

34 Updating Indonesia’s Greenhouse Gas Abatement Cost Curve
In addition, natural vegetation around plantation needs to be maintained, as it provides buffer zone and helps prevent fire and controls flooding for the plantation.22
However, the assumptions for average water levels applied in the RAN-GRK don’t leave much room for water management as it is already close to the acceptable level for oil palms and Acacia. Therefore the potential for emission reduction potential through water management in intensive plantation is limited in in our current calculation not taken into account at all.
Fireprevention
Fire prevention could prevent 45 MtCO2e/year in 2030. The abatement opportunity is relatively small compared to the total emission in 2030, mainly because 90% of the hotspots in peat are located more than 5 km away from the next major road, and thus the difficulty to access these areas may result in low chance of preventing the fires and more importantly distinguish the fires in a reasonable time. Very recent examples in Riau show that the impact of fire fighters on peat fires is very limited and only large amounts of rainfall can stop the fires completely. The abatement opportunity is even capped at 17 Mt CO2e/year, a significantly lower number, if we assume that the capacity of the fire brigades extends only up to 2.5 km from the road.
Besides the reduction of emissions, fire prevention will have additional positive effects on the health of the local population as well as on the overall economy of Indonesia through, e.g., the avoidance of airport closures and haze related transportation delays.
Fire prevention can be done as discrete activities; however it will be more successful and sustainable if the main source of fires, the degraded peatlands, is rehabilitated in parallel.
Cost for fire prevention is ranging from 2 to 5 USD per tCO2e if the implemented actions focus primarily on the historical fire hotspots and if the fire caused economic losses are not taken into account. These economic losses can be significant. The World Resource Institute estimated the direct economic loss of the 1997/98 fires at more than 5 billion USD.
22 RSPO published a best-practice manual on oil palm cultivation on peat in August 2012. Primary problem identified was oil palm tree leaning due to subsidence in peat soil. Subsidence is estimated at 35 cm within the first 2 years. Cumulative subsidence is estimated to reach ~1 meter in 17 years.
35Updating Indonesia’s Greenhouse Gas Abatement Cost Curve
23 In 2008 Ministry of Forestry published Rekalkulasi Penutupan Lahan Indonesia 2008, which reported forest cover in Indonesia. As many as 39 million hectares Kawasan Hutan does not have forest cover, and as many as 8 million hectares APL still has forest cover.
Spatialplanningandlanduseoptimization
Currently there is approximately 39 million hectares non-forested area within Kawasan Hutan, and approximately 8 million hectares forested area within APL.23 This provides opportunity to swap forested APL area with non-forested Kawasan Hutan. However, the actual size of the opportunity remains unclear as the APL areas might have been under concessions, or have been reserved for certain economic activities by the local government
In addition, opportunity in swapping forested land within concession with no-forested land outside concession is worth pursuing. This scheme, however, has proven difficult to implement at the province level, because the district government is not compensated for the forgone economic development and as a result a highly deforested district would be rewarded while a district which maintained its forest cover would be disadvantaged.
Spatial planning and land use optimization is estimated to have an abatement opportunity of 134 MtCO2e/year in 2030. Spatial planning is expected to have no incremental societal cost, as all the associated cost comes from government transaction activities and thus not included in the cost curve. Land swap and concession buyouts are estimated to cost between 10 to 15 USD per tCO2e abated emission.

36 Updating Indonesia’s Greenhouse Gas Abatement Cost Curve
Power2030 – emissions: 1010 MtCO2e, abatement potential: 330 MtCO2e
Demand for power is expected to rise by approximately 4.5 times from 2010 to 2030 – driven by rapid economic development, increased electrification of rural areas, fast growth of manufacturing and services, and the expected realization of latent and suppressed demand for power.
Exhibit 21
Sectoralemissions
Indonesia’s emissions from the power sector are expected to grow 4.5-fold from 227 MtCO2e in 2010 to 1,011 MtCO2e in 2030 due to strong demand growth and an increasing dependence on coal. Emissions from the power sector in 2030 are expected to exceed those of the LULUCF sector today.
Total power supply is expected to grow from 200 TWh in 2010 to 921 TWh in 2030. While several projections exist for Indonesia, estimates developed by PLN, the state electricity utility company, appear to be the most consistent with our general approach, using projections based on those of a comparable economy. While PLN’s official projection (the RUPTL) does not extend beyond 2021, PLN’s strategic planning

37Updating Indonesia’s Greenhouse Gas Abatement Cost Curve
department has developed a set of scenarios for the Java grid – the largest part of the Indonesian power production structure, through 2040. We have used their 0 carbon price scenario projections for installed capacity for Jawa-Bali grid by fuel type. Jawa-Bali constitutes 72% of total Indonesian power capacity, so we have scaled up the 2021 – 2030 power capacity by fuel type estimate from this scenario to the full grid through 2030 – this brings us to an electricity generation estimate of 921 TWh.
The PLN “0 carbon price” estimate contains a high-level view of the specific technologies in the mix. While the PLN scenarios do include a break-down of technologies, we have then had to make some further assumptions on the mix of specific technologies to complete the estimate. For example, we have included PLN’s stated intention that all new coal capacity installed on the Java Bali grid post-2020 will have supercritical technology. We have assumed no supercritical technology outside of Java Bali in the business as usual trajectory. As well, we have maintained the split between large and small hydro from the 2009 cost curve.
While Indonesia’s fuel usage and power emissions factors are not public, we understand from experts that fuel efficiency continues to lag global averages, so we use IEA emissions factors for each technology type adjusted upward by 20%.
On the supply side, Indonesia continues its plans to capture significant shares of the country’s deep endowment of geothermal and hydropower reserves. Hydro power production, however, suffers from a loss of effectiveness overtime due to issues with upstream water management and sedimentation, decreasing generating capacity of plants by as much as 40% over 20 years.24 This loss in capacity is incorporated into the power projection and abatement lever costs.
Despite this significant development in renewables, Indonesia’s continued policy emphasis remains on increasing the share of coal in the energy mix. Despite the increased coal usage, Indonesia’s electricity emission factor, i.e., emission per unit of electricity will decrease slightly from 2005 to 2030 from .94 MWh / tCO2e to .91 MWh / tCO2e, aided by PLN’s stated commitment to move all new coal generation in Java-Bali post 2020 to supercritical boilers, a lower emissions technology.
24 Interview with Head of Indonesia JCM Secretariat, Dicky Edwin Hindarto

38 Updating Indonesia’s Greenhouse Gas Abatement Cost Curve
Exhibit 22
Abatementpotentialandcosts
There are several opportunities to abate as much as 350 MtCO2e in 2030 through increased penetration of clean and renewable energy sources, along with staying the course on clean coal technologies. An additional reduction in emissions from the power sector can be attributed to reduced demand for electricity from other sectors. In particular, demand-side management levers (e.g., switch from incandescent to LED light bulbs) in the buildings, transportation, and cement sectors could see a net effect of reducing emissions by ~75 MtCO2e in 2030 (Exhibit 23). The net demand reduction potential from these other sectors was estimated in the first Indonesia greenhouse gas abatement cost curve from 2009; as we have not updated the buildings or cementer sectors in this effort, so have held the emissions reductions from lowered energy use in those sectors constant since 2009. We should also note that this is the net figure, which includes a small increase in electricity demand due to the vehicle electrification figures from the road transport sector.
Coal continues to greatly increase share of total mix, leading to a ~4.5-fold increase in GHGs
Note: Projections from PLN are until 2020, hence proportion of technologies is assumed to remain constant after 2020
162
+360%
Coal
GasOilOther
2030
1,011
2020
389
2010
227
2005
MtCO2e
Other clean tech
Coal
+361%
Other fossil fuel
921
153
Geothermal
2030
745(81%)
2020
382
55(36%)
2010
200
106(53%)
2005
236(62%)
Associated GHG emissions
SOURCE: Indonesia GHGA batement Cost Curve, PLN, IEA, Expert interviews with DNPI team
TWh
Electricity generation
Production projection is lesser in 2030 compared to last update by ~50 TWhEmission intensity is higher due to higher coal shareCoal growth has continued steadily, locking-in CO2 intensive power generation for 30+ years

39Updating Indonesia’s Greenhouse Gas Abatement Cost Curve
Exhibit 23
Power sector could provide ~330 MtCO2e1 of abatement potential in 2030 at an average cost of 4 USD/tCO2e
1 Inclusive of demand side reductions in other sectors; currently estimated at 60 TWh
Demand sidemanagement
SOURCE: Indonesia GHG Abatement Cost Curve
40
30
35
20
25
40
360 3802401008060 400200 220200180160140120 260 280 300 320 340
15
10
5
0
-5
-10
420
-15
Abatement costUSD per tCO2e
Smal
l hyd
ro
Dem
and
redu
ctio
n
Larg
e hy
dro
Coa
l su
perc
ritic
al
On
shor
ew
ind
Geo
ther
mal
Nuc
lear
Biom
ass
dedi
cate
d
Sola
r PV
Ø 4
Coa
l CC
S ne
wbu
ilt w
ith E
OR
Abatement potentialMtCO2e per year
As relatively clean technology, hydro-electricity plants offer the largest abatement opportunity. Hydro in Indonesia remains mostly underdeveloped, with roughly 9% of Indonesia’s total 76 GW of exploitable potential currently developed. Increasing that share to a total of 24% of the exploitable potential by 2030, and developing 2% of small hydro potential, could result in ~125 MtCO2e of abatement at a negative cost of -14 USD to -10 USD per tCO2e.
Indonesia is home to a significant share of the world’s known conventional geothermal resources. Additional use of geothermal sources, beyond what is already planned, could provide abatement of some 74 MtCO2e at an abatement cost of 7 USD per tCO2e.

40 Updating Indonesia’s Greenhouse Gas Abatement Cost Curve
Road Transport2030 – emissions: 232 MtCO2e, abatement potential: 75 MtCO2e
Sectoralemissions
We project emissions from the road transport sector to increase 2.5-fold between 2010 and 2030 (from 82 to 232 MtCO2e), driven by strong growth in passenger cars and motorcycles (Exhibit 24). As personal income levels triple over the next two decades, this will lead to a tripling in penetration of personal vehicles from 115 vehicles per 1,000 inhabitants today to ~300 in 2030. More dramatically, growth in motorcycle ownership will climb to more than 500 vehicles per 1,000 inhabitants.
Exhibit 24
The total number of Motor vehicle projections are based on historical sales data for each class of automobiles in Indonesia sourced from GAIKINDO.25 We then assume an annual vehicle retirement based on a 17 year lifetime for 4 wheel vehicles, and 12 years for 2 wheelers. Forward projections for 4 wheelers are based on vehicle sales
25 This data does not include purchases of army vehicles, so these are omitted from the sector analysis.
> 2.5 fold increase in emissions4 from road transport sector, down from estimate of 7 fold increase in 2009
26
29
1717
15
Motorcycles
Passenger cars
LCVs1
MCVs2
HCVs3
Buses
2030
232
68
6
6
2020
145
46
872
8 3
2010
20
8
42
2005
60
11
9
42
+223%
1820
53
109
SOURCE: GAIKINDO, IHSG lobal Insight, Expert Interviews, Indonesia GHG Abatement Cost Curve
Projected emissions, Mt CO2e
1 LCV: Light commercial vehicles weighing under 3.5 tons2M CV: Medium commercial vehicles weighing between 3.5 – 16 tons3H CV: Heavy commercial vehicles weighing over 16 tons4 Includes Indirect Emissions
Emissions projection for 2030has reduced 60% relative to the 2009 cost curve

41Updating Indonesia’s Greenhouse Gas Abatement Cost Curve
projections from IHS Global Insights, whose model relies on correlations between vehicles sales by brand and class, and projections of related macro-economic and consumption factors. Lastly, building from the one year of sales figures GAIKINDO now has the “low cost green car,” we project these forward to 2030 and assume a small but growing share of highly efficient passenger cars in the business as usual mix.
The 2030 projection for the total number of motorcycle is based on comparison of Indonesia’s motorcycle penetration at various GPD/capita levels in other countries. Comparing multiple Asian countries and their evolution of GDP/capita and motorcycle ownership, Taiwan is the closest fit to Indonesia’s evolution to date; Taiwan had roughly 125 vehicles per 1000 residents at Indonesia’s current GDP/capita. Taiwan’s penetration now exceeds 500 motorcycles per 1000 people and GDP/capita well exceeds USD 13,000. We have therefore assumed that Indonesia will have similar levels of motorcycle penetration in 2030 when it is projected to reach GDP/capita of ~USD 13,000. Indonesia’s population forecast of 290 M people in 2030 then indicates nearly 150 M motorcycles.
We should note that current and future estimates of Indonesia’s total number of motor vehicles vary widely between sources. As described above, we have used actual vehicle sales, with some assumptions and adjustments for vehicle retirements, to calculate the total size of the vehicle fleet today, and have used an independent third party forecast of vehicle sales into the future for our new projection to 2030. These numbers differ from official government figures issued by the State Police, and used by the Ministry of Transportation and Statistics Indonesia, as we understand they better represent vehicle registrations than actual vehicles in use, and are therefore much higher in 2010.
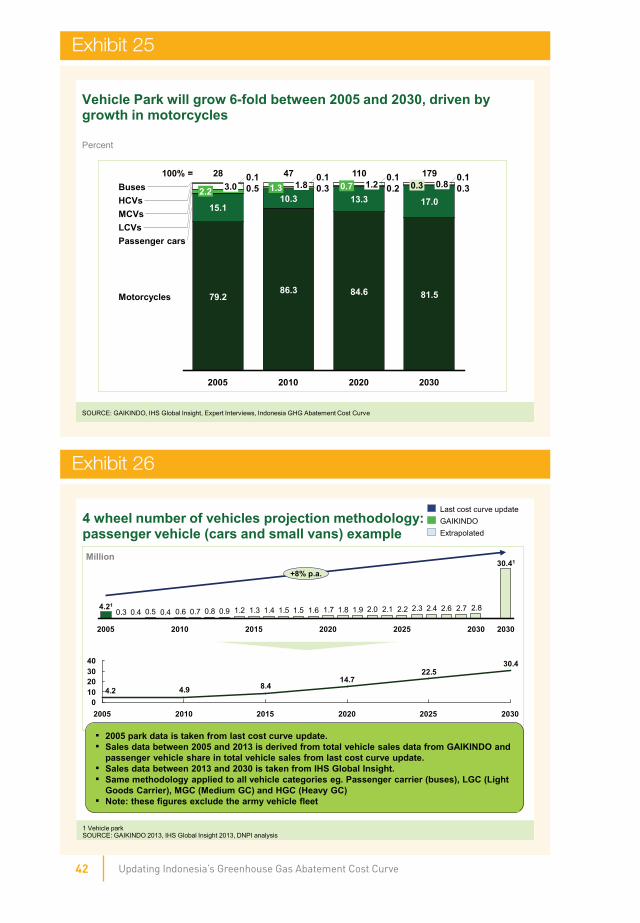
42 Updating Indonesia’s Greenhouse Gas Abatement Cost Curve
Exhibit 25
Exhibit 26
Vehicle Park will grow 6-fold between 2005 and 2030, driven by growth in motorcycles
Percent
0.30.20.30.50.10.10.10.1
81.5
17.013.30.3 0.8
2020
84.6
100% =
Motorcycles
Passenger carsLCVsMCVs
110
HCVsBuses
2030
0.7 1.217947
86.3
10.31.3 1.8
2010
28
79.2
15.1
2.2 3.0
2005
SOURCE: GAIKINDO, IHS Global Insight, Expert Interviews, Indonesia GHG Abatement Cost Curve
4 wheel number of vehicles projection methodology:passenger vehicle (cars and small vans) example
SOURCE: GAIKINDO 2013, IHS Global Insight 2013, DNPI analysis
2.82.72.62.42.32.22.12.01.91.81.71.61.51.51.41.31.20.90.80.70.60.40.50.40.3
+8% p.a.
2030
30.41
203020252020201520102005
4.21
Million
Last cost curve updateGAIKINDOExtrapolated
▪ 2005 park data is taken from last cost curve update.▪ Sales data between 2005 and 2013 is derived from total vehicle sales data from GAIKINDO and
passenger vehicle share in total vehicle sales from last cost curve update.▪ Sales data between 2013 and 2030 is taken from IHS Global Insight.▪ Same methodology applied to all vehicle categories eg. Passenger carrier (buses), LGC (Light
Goods Carrier), MGC (Medium GC) and HGC (Heavy GC)▪ Note: these figures exclude the army vehicle fleet
30.422.5
14.78.44.94.2
010203040
2005 2010 2015 2020 2025 2030
1 Vehicle park

43Updating Indonesia’s Greenhouse Gas Abatement Cost Curve
Exhibit 27
Abatementpotentialandassociatedcosts
There exists the potential to reduce road transport sector emissions by 20 percent (approximately 75 Mt) by 2030 across three principal mitigation levers: improvements to internal combustion engines, moving from gasoline powered vehicles to hybrid and electric vehicles, and the adoption of biodiesel fuel made from palm oil.
SOURCE: Indonesia GHG Abatement Cost Curve
Transport sector could provide ~75 MtCO2e potential at a negative cost to society1
Abatement cost$ per tCO2e200100
0-100-200-300-400-500
Abatement potential
MtCO2e per year
8070605040302010
Ø -209
▪ Abatement potential has dropped by ~35% compared to 2009 estimate due to lower projected vehicle park▪ Average cost of abatement is much lower due to much higher oil price projections
1 Assuming a societal discount rate of 4%2 Current potential based on global cost assumptions for palm oil at USD 0.52 / liter3 Internal combustion engine (ICE)
Cars electric
MCV ICE
2 wheeler electric
Car dieselization
HCV ICE
LCV ICE
Biodiesel palm oil
Cars ICE gasoline
Cars hybrid
Modal shift to buses
Modal shiftto subway
Buses ICE
Cars ICE Diesel
Biofuels –2nd Gen
Modal shift freight transport
60% of the total emission reduction potential (or 34 MtCO2e) lies in improvements to conventional internal combustion engines (ICE) across all vehicle classes and adoption of electric vehicles (4 wheelers, 2 wheelers, and hybrid vehicles).
While a significant portion of the opportunity is available at a negative abatement cost, implementing most of these levers will require significant upfront investments in vehicles and infrastructure in related sectors.
Many ICE improvements are dependent on the availability of the appropriate fuel types, which could imply changes or additions to current refining practices in Indonesia. As well, the abatement we note here is for new vehicle purchases – not wholesale changes / retrofits to all motor vehicles; it will take several years of purchases for high efficiency ICE vehicles to gain wide market share once adoption begins in new sales.

44 Updating Indonesia’s Greenhouse Gas Abatement Cost Curve
For these road transport levers, it is particularly worth noting that the above analysis only takes into account the technical costs of abatement relative to the baseline scenario, at the national level. In some cases, a sub-national / provincial analysis might show a much different picture – palm oil biodiesel, and second generation biofuels, for example, might appear much more economical in regions near to primary production where costs of importing gasoline and diesel are high.
As well, social and societal benefits likely exist beyond the relative technical costs for many of these levers. The biofuels, for example, could likely create a long-term base of sustainable jobs in economically disadvantaged regions. Similarly, the modal shift levers for public road transport in urban settings may also offer benefits from reduced time lost in congestion, traffic deaths, and better quality urban air.
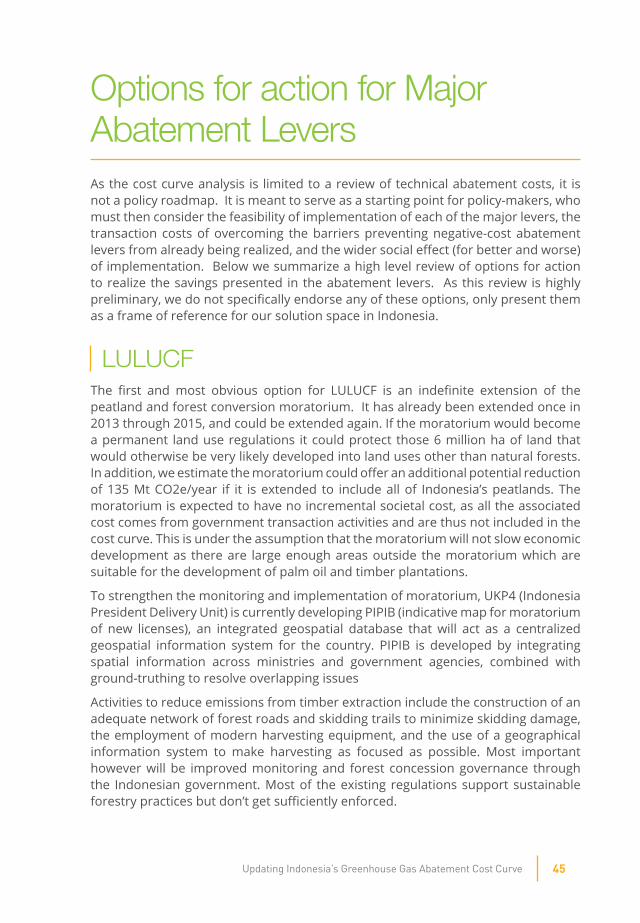
45Updating Indonesia’s Greenhouse Gas Abatement Cost Curve
Options for action for Major Abatement LeversAs the cost curve analysis is limited to a review of technical abatement costs, it is not a policy roadmap. It is meant to serve as a starting point for policy-makers, who must then consider the feasibility of implementation of each of the major levers, the transaction costs of overcoming the barriers preventing negative-cost abatement levers from already being realized, and the wider social effect (for better and worse) of implementation. Below we summarize a high level review of options for action to realize the savings presented in the abatement levers. As this review is highly preliminary, we do not specifically endorse any of these options, only present them as a frame of reference for our solution space in Indonesia.
LULUCFThe first and most obvious option for LULUCF is an indefinite extension of the peatland and forest conversion moratorium. It has already been extended once in 2013 through 2015, and could be extended again. If the moratorium would become a permanent land use regulations it could protect those 6 million ha of land that would otherwise be very likely developed into land uses other than natural forests. In addition, we estimate the moratorium could offer an additional potential reduction of 135 Mt CO2e/year if it is extended to include all of Indonesia’s peatlands. The moratorium is expected to have no incremental societal cost, as all the associated cost comes from government transaction activities and are thus not included in the cost curve. This is under the assumption that the moratorium will not slow economic development as there are large enough areas outside the moratorium which are suitable for the development of palm oil and timber plantations.
To strengthen the monitoring and implementation of moratorium, UKP4 (Indonesia President Delivery Unit) is currently developing PIPIB (indicative map for moratorium of new licenses), an integrated geospatial database that will act as a centralized geospatial information system for the country. PIPIB is developed by integrating spatial information across ministries and government agencies, combined with ground-truthing to resolve overlapping issues
Activities to reduce emissions from timber extraction include the construction of an adequate network of forest roads and skidding trails to minimize skidding damage, the employment of modern harvesting equipment, and the use of a geographical information system to make harvesting as focused as possible. Most important however will be improved monitoring and forest concession governance through the Indonesian government. Most of the existing regulations support sustainable forestry practices but don’t get sufficiently enforced.

46 Updating Indonesia’s Greenhouse Gas Abatement Cost Curve
Improved spatial planning is a major abatement lever. Implementation of a single land titling system is an option worth deep exploration as current situation is a problem for both concession owners and local communities. Experience in many countries emphasizes that land titling and spatial planning mixes complex, historical, social, economic and political issues, and it is therefore important to build close community support for this initiative. This option would need to be closely tied to a community engagement approach that undertakes community-based land mapping and ensures the process is done in a fair and transparent manner.
Necessary actions to reduce emissions from fires include prohibiting fire as a tool for land preparation, providing appropriate and practical technologies for manual land clearing, developing appropriate early-warning systems based on fire risk status and field-based fire detection, strengthening fire brigades, ensuring strong enforcement and large penalties for rule violations, and building public awareness of the local economic and social costs of forest fires.
Swapping high-carbon stock lands with low-carbon stock ones is an alternative solution to reduce emissions from deforestation or peat degradation. PIPIB, the indicative map developed by UKP4, can be leveraged to facilitate land swaps. In cases where concessions are located in high carbon stock areas (i.e. deep peatlands) and there are no other options to relocate the palm oil plantation, concession buyouts can be an abatement alternative. The idea behind concession buyouts is that local communities and concession holders would be paid for not starting or continuing economic activities that result in deforestation, forest degradation, or peat decomposition. This option should however be the last choice as it might result in slowing economic development and is causing high costs.
POWERThe two major sets low cost abatement levers for the Indonesian power sector are hydro power development, and geothermal development, both over and above the current PLN power development plans. Options here could focus on accelerating development of these resources, and overcoming barriers currently standing in the way of implementation.
On the supply promotion front, Indonesia could explore more active promotion of small hydro through specialized feed-in-tariffs for very small developments; while the current FIT for hydro begins under 10 MW, the UK has instituted specialized small hydro FITs in tiers of ascending price support going down to 100 KW.
To promote demand, particularly on the geothermal side, Indonesia could consider U.S.-style renewable portfolio standards that incent PLN to increase the share of renewables in provinces with high potential.
While both technologies are attractive purely on technological costs, their slow development pace has been due to a number of barriers. These include, but are in no way limited to, regulatory fragmentation, conflicting land claims, and protected forest areas. Government effort could focus on removing these first to allow private investment.
47Updating Indonesia’s Greenhouse Gas Abatement Cost Curve
One means to work through multiple barriers simultaneously would be concerted, place-based programs on regulatory and incentive harmonization to accelerate development. Targeting specific energy intensive infrastructure and development corridors, and simultaneously harmonizing indigenous and local land-claims, forest conservation and biodiversity (at both large and small scales) and other economic development plans could allow for large-scale hydro and geothermal development.
Canada completed a long and intensive land-claims process with indigenous peoples, particularly in Northern Quebec, to allow for large scale hydro development, and could serve as an example.
Regulatory de-bottlenecking could also play a role here: addressing permitting barriers and fragmentation at the local levels, and getting wider acceptance for standardized Power Purchase Agreements could reduce transaction costs.
By way of example, Indonesia could complete the process, already underway, of “Greening the MP3EI” – the integrated planning and infrastructure development process across sectors. Mapping the known hydropower and geothermal potential, and the current PLN plans to exploit this, onto the three energy-intensive MP3EI development corridors, reveals significant potential not currently in development plans. Given the amount of attention and infrastructure investment currently directed towards these corridors, now may be an opportune time to better integrate hydro and geothermal development into those plans. Such an effort, however, must take into account the many barriers to developing these resources and propose location-specific resolutions; for example, a number of the hydro projects that are already in development plans, e.g., Sulawesi, have not yet materialized.

48 Updating Indonesia’s Greenhouse Gas Abatement Cost Curve
Exhibit 28
Policy harmonization example
Sumatra Economic Corridor“Centre for Production and Processing of Natural Resources and As Nation’s Energy Reserves”
Java Economic Corridor“Driver for National Industry and Service Provision”
Kalimantan Economic Corridor“Centre for Production and Processing of National Mining and Energy Reserves”
Key MP3EI economic corridors aligned with hydro and geothermal power potential≤100
100-200
200-400
>400
Capacity (MW)
Hydropower sites
Geothermal sites
Mega Economic Center
Economic Center
PRELIMINARY
SOURCE: Indonesia MP3EI, RUPTL 2012 – 2021, MEMR / DNPI
PLN plans to develop 9371 MW of hydro power opportunity out of which 76% aligns with these economic corridors
MEMR identifies 2531 MW geothermal opportunity out of which 75% aligns well with the three MP3EI economic development corridors focused on energy development
13
For both hydro power and geothermal, Indonesia could gain from additional research and development to chart the lowest impact, highest potential energy reservoirs; identify low impact techniques for collecting the energy, e.g., horizontal drilling for geothermal; and lower the costs of development. Good examples to investigate further would be China and Iceland for small hydro and geothermal, respectively. Each country has promoted R&D through the formation of public-private-academic research consortia – with limited government funding required.
We should note that we have taken as given PLN’s stated policy that all new coal developed post 2020 in the Java-Bali grid will use super-critical, high efficiency, low emissions boiler technology, which we estimate would bring total supercritical generation to approximately39.9 GW by 2030. Given this, the further abatement potential projected from additional roll-out of supercritical technology incremental to the PLN plans - either in new-build coal plants outside the Java Bali grid, or as replacement to existing infrastructure – would be roughly another 25%, or 10 GW (assuming a 2030 cap on supercritical technology at 40% of its potential, the low end of PLN’s 40-60% estimate. Should PLN’s plans change, however, government could consider a separate mandate to maintain that switch to supercritical in Java Bali as this is a low cost, high impact move.
49Updating Indonesia’s Greenhouse Gas Abatement Cost Curve
ROAD TRANSPORTRoad transport presents the most appealing set of abatement levers because virtually all are strongly cost-negative in 2030. Of these levers, the lowest cost options can be divided into two major groups: • Electrifying the vehicle fleet through electric cars, hybrids, and electric motorcycles• Improving fuel efficiency of internal combustion engines vehicles of all types
As all of these levers are strongly cost-negative, it would be most appropriate for to focus on removing barriers and fixing market failures preventing the private sector from capitalizing on the opportunities itself.
For electric vehicles, the widest opportunity is in electric motorcycles; to create a functional market there, Indonesia could consider:
• Increasing ease of access to motorcycles by easing import restrictions on electric motorcycles, particularly from China (South Korea has done this with some success to import from the U.S.) – this might serve as well as a transitional support measure for domestic auto manufacturers as they re-tool to produce electric vehicles themselves
• Incentivizing motorcycle buyers to take full lifecycle costs of their purchases into account by restricting the number of registrations available for ICE motorcycles in major cities, e.g., Jakarta – China has been highly successful with this approach and rapidly scaled up electric two-wheeler sales to nearly 50% of the national total
While electric motorcycles have the virtue of needing no special charging infrastructure, electric cars and plug-in hybrids will require this for widespread adoption. Here, Indonesia might consider Japan’s example in leveraging small public funding to generate large private investment from automakers in a nation-wide charging infrastructure. As well, a charging infrastructure might be configured with net metering to allow electric vehicle batteries to serve as grid-scale storage and grid balancing as generation from sporadic renewables increases.
For non-electric vehicles, Indonesia is already steadily improving its vehicle standards with measures like requiring all new cars to adopt Euro 4 by 2016, and promoting the low cost green car. Ensuring that Euro 4 adoption is not delayed is a major initial consideration, as is promoting the supply of the enhanced quality fuel oil required for this engine standard. On the incentives side, Indonesia can likely capture much of the social value of lower gasoline use by removing the remaining gasoline subsidies; Iran has recently completely eliminated its subsidies and believes it has generated nearly USD 6 billion annually in social savings on lower fuel use and more efficient engines. Lastly, Indonesia could consider mandating specific vehicle technologies as California has experimented with in its requirements that retailers sell 60,000 plug-in hybrids in the state in some years.

50 Updating Indonesia’s Greenhouse Gas Abatement Cost Curve
AppendixGeneral Methodology And Scope
This study focuses on technical abatement opportunities costing less than 80 USD per ton of CO2 equivalent (tCO2e), as shown on Indonesia's greenhouse gas abatement cost curve (Exhibit 3). We have defined technical abatement opportunities as those that do not have a material effect on people’s way of life. Our approach and results are both consistent with the national imperative of continued development and sustainable growth.
The cost curve model analyzes a total of eight economic sectors. We look at six sectors in detail from the bottom up: LULUCF, peat, power, road transport, cement, and petroleum and refining, and at two using top-down estimates: agriculture and buildings. For this analysis, we have updated the inputs to the LULUCF and peat sectors (now collectively called LULUCF), the power sector, and the road transport sector. Our overall emissions projection and cost curve combine this new analysis with our 2009 analysis for cement, petroleum, agriculture, and building.
Generally, the report follows IPCC emissions calculations guidelines.
Developmentoftheabatementcostcurve
The global greenhouse gas abatement “cost curve” summarizes the technical potential to reduce emissions of greenhouse gases at a cost of up to 80 USD per ton CO2e26 of avoided emissions. The cost curve shows the range of emission reduction actions that are possible with technologies that either are available today or are highly likely to be available by 2030.
The combined axes of an abatement cost curve depict the full range of available technical opportunities27(or levers), their relative impact in terms of carbon abatement (emission reduction potential by volume), and their estimated cost for a specific year. Each opportunity is examined independently to quantify both the abatement and cost dimensions.
The basic logic of the cost curve is that it displays the abatement potential and the corresponding cost for each opportunity relative to a business-as-usual scenario in any given year, for a given price of fossil energy. In other words, the cost curve is a tool for assessing the emissions reduction potential of different abatement measures and for comparing their respective incremental costs. It is not designed to predict the actual price of carbon.
26 Following IPCC definitions, the abatement cost curve shows technical measures with economic potential under USD 80 per tCO2e
27 See “How to read the greenhouse gas abatement cost curve”
51Updating Indonesia’s Greenhouse Gas Abatement Cost Curve
To ensure comparability across sectors and sources, all emission sources and sinks (points of carbon emission absorption) have been measured in a consistent way, using CO2 equivalents measured in metric tons (tCO2e). The merit order of abatement levers is based on the lowest cost measures (in USD per tCO2e) as of 2030.
Viewed as a whole, the abatement cost curve illustrates the “supply” of abatement opportunities independently from the possible “demand” that may or may not currently exist for any particular abatement opportunity.
By definition, any abatement potential is attributed to the sector in which a particular lever is implemented. For example, if an abatement lever in a consuming sector (e.g., LEDs in buildings) reduces electricity consumption, the resulting emission reduction in the power sector is attributed to the consuming sector (in this case, buildings). Therefore, the business-as-usual emission calculations for all consuming sectors include indirect emissions from the power, road transport and petroleum and gas sectors.
Uncertainty can be significant for both abatement volumes and cost estimates. There are two key sources of this uncertainty: the feasibility of implementing abatement measures (for example in the LULUCF and agriculture sectors) and the cost of development for key technologies.
As noted above, uncertainty also exists on several of the estimates available at the time of conducting this study, especially in the peat sector. There are still gaps in today’s understanding of climate change related sciences, particularly as regards to natural emission sources. This report tries to bring transparency and openness to the dialogue on the scientific evidence incorporated into this study.
Calculatinganabatementpotential
Abatement potential is defined as the difference between the emissions volume of a particular source under a business-as-usual scenario and the emissions volume after the abatement lever has been applied.
The emissions baseline is calculated from several driver values, such as the carbon intensity of a specific fossil fuel, the production volume of a basic material, or the fuel consumption of a vehicle. Each abatement lever changes (usually reduces) specific driver values, for which the quantification is determined by literature reviews and expert discussions. For example, fuel consumption can be reduced by 70 percent through improvements to passenger vehicles. This leads to an abatement potential of 30 percent of initial fuel combustion emissions for this specific lever.
Using merit order logic for the levers, adhering to the principle of lowest cost first, the lever with the next higher cost is applied on a new baseline after reductions from all previous levers have been applied.

52 Updating Indonesia’s Greenhouse Gas Abatement Cost Curve
Calculatingabatementcosts
Most abatement costs are defined as the incremental cost of implementing a low-emission technology compared to the business-as-usual case, measured in USD per ton of CO2e abated emissions. Abatement costs include annualized repayments for capital expenditure and operating expenditure. The cost does therefore represent the pure “project cost” to install and operate the low-emission technology. Capital availability is not considered a constraint.
The full cost of most abatement levers incorporates investment costs (calculated as the annual repayment of a loan over the lifetime of the asset), operating costs (including personnel and materials costs), and possible cost savings generated by use of the alternative (especially energy savings).
The full abatement costs (either technological or opportunity) estimated here do not include transaction costs, communication or information costs, subsidies or explicit carbon costs, taxes, or the consequential impact on the economy (for example, advantages from technology leadership). These costs all depend on policy choices and dependencies, and so do not form part of this exercise, which is to form a fact-base for policy-making.
Operating expenditure is assessed as a real amount to be expensed in each year and capital expenditure is accounted as annualized repayments. Repayment periods are calculated as the functional life of the respective piece of equipment. The interest rate used is the actual long-term bond rate of 4 percent, based on historical global averages.
All costs in the model are based on current cost and estimated projections. Estimates are based on the best available projection methods, such as models (if available), expert views, and educated extrapolation. Given the long horizon of approximately 25 years, a certain estimation error is inherent in the approach. Macroeconomic variables such as lifetime of assets, interest rates, oil prices, and exchange rates have the highest impact on results and error margins. Individual cost estimates per lever are of lower significance and will not substantially distort overall results for each lever.
Transaction costs – costs incurred in making an economic exchange above and beyond the technical project costs (e.g., education, policing, and enforcement costs) – are not included in the cost curve. Implementation cost for abatement levers are considered part of the transaction costs, involving such aspects as information campaigns and training programs.
Pure behavioral changes by individuals are also excluded from the cost curve, although they do present additional abatement potential. Behavioral changes are driven by various price and non-price factors, such as public education, awareness campaigns, social trends, or policy changes. For this reason, behavioral shifts are analyzed separately from the primary cost curve as “further potential” with no abatement cost attached.
Rather than taking the perspective of any specific decision-maker, the cost curve

53Updating Indonesia’s Greenhouse Gas Abatement Cost Curve
analysis takes a societal perspective, illustrating cost requirements to the society as a whole. At a global scale, this societal perspective enables the usage of the abatement cost curve as a fact base for discussions about what levers exist to reduce greenhouse gas emissions, how to compare reduction opportunities and costs between countries and sectors, and how to discuss what incentives (e.g., subsidies, taxes, and carbon pricing) to put in place.
For example, with this analysis, the question can be asked and answered, “If a government wanted to make different abatement measures happen, how much would different measures reduce emissions and what is the minimum cost (to achieve this emission reduction from a societal perspective)?”
COMPARISON TO 2009 GHG ABATEMENT COST CURVE REPORT
Overview
Our overall emissions estimate for 2030 decreased roughly 20% from 3.3 GtCO2e to 2.6 GtCO2e. This results from a variety of methodological changes in the emissions projections and from new data and projections on the underlying drivers of emissions, e.g., the number of passenger cars on Indonesia’s roads. The projection for power is the most modest change, increasing from 810 to 1,011 MtCO2e, roughly 25% due mainly to the use of new, higher emissions factors for power generation. Transportation has the most dramatic change in relative terms, with the estimate declining by more than 50% to 207 MtCO2e from 440 MtCO2e – largely due to a much lower projection for future passenger and commercial vehicle sales based on a much more granular, sales-driven dataset. Lastly, the largest absolute change comes from LULUCF, where the emissions projection declines by roughly 40% from 1,650 MtCO2e to 995 MtCO2e – again, largely due to methodological changes and the use of new government data on the carbon content of standing forests and peat soils.

54 Updating Indonesia’s Greenhouse Gas Abatement Cost Curve
Exhibit 29
Emissions estimates for 2030 are now lower than 2009 analysis, driven by LULUCF & transportation projections
1,6401,6201,690
995990986
2013 analysis2009 analysis
LULUCF& Peat
44022060 20715382
2030202020102005
Transport
810370
110
1,011
389227Power
PRELIMINARY
2SOURCE: Indonesia GHG Abatement Cost Curve 2009 and 2014
LULUCF sectorBusinessasusualscenario
Compared with the 2009 GHG abatement cost curve report (2009 report) the new BAU emission scenario for the LULUCF sector is significantly lower. Multiple factors are causing the lower emission scenario, however they are not caused by specific policy actions from the Indonesian Government but are more a result of new emission factors and assumptions applied.
The average deforestation rate used as the baseline in the 2009 was 1.1 M ha (average 2000 to 2005 period) while in the 2014 report the deforestation rate applied is 0.76 million ha. The cause of the slowed deforestation is however only speculative. Most likely is that 1) the global economic crisis during that period has lowered investments into land use related economic activities and 2) the remaining forests are pushed further inland which makes the overall investment case less attractive.
In the 2009 report a top down analysis was applied using emission factors published in the IFCA (2007) Consolidation Report “Reducing Emissions from Deforestation and Forest Degradation in Indonesia”. For this report we used a bottom up approach based on spatial analysis of land cover change which provides a more granular analysis. Carbon stocks for different land cover types have been taken from RAN-GRK.

55Updating Indonesia’s Greenhouse Gas Abatement Cost Curve
Emissions from peatland degradation have changed significantly from the 2009 report, driven by 2 major factors:
• Change in peatland area: In the 2009 report the Indonesian peatland area was based on Indonesia’s peatland Atlas published by Wetlands International. The size of Indonesia’s peatland given in those publications is approximately 22 million ha. For the 2014 report, the peatland area (15 million ha) published by the Ministry of Agriculture (as applied in the forest moratorium presidential regulation) was used. This represents a drop of peatland area of more than 30% compared to the 2009 report.
• Emission factors for drainage related peat decomposition: In the 2009 report, emission factors have been taken from different scientific publications with the main source being Hooijer et al (2006) Peat CO2: Assessment of CO2 Emissions from Drained Peatlands in SE Asia. For the 2014 report emission factors published in RAN-GRK were applied. These are significantly lower than the previous applied assumptions
Abatementpotential
The abatement potential in the 2014 report for the LULUCF sector is significantly lower than in the 2009 report. Factors driving the differences are:
• Avoided deforestation: the 2009 report assumed deforestation could be reduced by 80%. In the 2014 report we are more conservative and assume that deforestation rate could only be reduced to roughly 50% through spatial planning, improved community practices and concession buyouts.
• Afforestation/Reforestation: To sequester carbon in the long term afforestation/reforestation efforts need to be assigned for conservation purposes and not for wood/fibre production. In the 2009 report we assumed that more than 10 million ha of lahan kritis would be available for conservation afforestation/reforestation. In the 2014 report we focus on areas which are unlikely to attract interest from investors. The area we believe is available for reforestation and afforestation purposes has therefore been reduced to 4.6 million ha.
• Fire prevention: The majorities of fires takes place in very inaccessible areas and are difficult to extinguish as large amounts of water will be required. We therefore believe that the abatement potential from fire prevention is significantly smaller than in the 2009 report.
• Water management in peatland: in the 2009 report we identified a significant abatement potential through water management. As we now use the Indonesian Government emission factors and drainage levels for different land uses this abatement lever does not provide any abatement anymore. The drainage levels used in the RAN-GRK are close to what is described as feasible to allow growth of oil palm and Acacia crassicarpa trees.
By using official data from the Government of Indonesia we feel that most of these assumptions are conservative and might underestimate the real extend of Indonesia’s emissions from Land Use, Land Use Change and Forestry.

56 Updating Indonesia’s Greenhouse Gas Abatement Cost Curve
Powersector
Business as usual scenario
A combination of changes to the power sector have resulted in higher overall emissions in 2030. Two factors on the total and mix of underlying technologies first have the effect of lowering the BAU projection. In both 2009 and 2014, we have used the RUPTL as our guiding projection through 2020. The new RUPTL projects a slightly lower emissions trajectory now than in 2009, largely due to a lower total capacity expansion. Rather than simply projecting forward from the RUPTL now, however, we have used the technology-based scenario for the Java Bali grid provided by PLN, and scaled up to all of Indonesia, to project forward to 2030. That projection grows at a faster pace than the 2009 RUPTL, bringing the total power consumption back above the 2009 estimate in 2014.
The technology mix within this consumption is, on the whole, a slightly less emissions intensive one due to new PLN plans to add only supercritical coal in Java Bali after 2020. However, we are using 20% higher emissions factors than for Indonesian technologies than in 2009 due to the fact that Indonesia fuel efficiency is generally lower than other similar countries.
Abatement potential
Overall abatement potential in the power sector increases by nearly 50% from 225 MtCO2e in 2009 to 330 MtCO2e in the new estimate. This is driven by a few factors. First, and most simply, the expansion in BAU emissions by roughly 20% increases the available abatement opportunity. In addition, however, PLN sees an expanded scope for several technologies, most notably supercritical coal which they believe can be rolled out almost 40% faster by 2030 than we had previously assumed (going from 25% of total potential captured by 2030 to 40% of potential application captured by 2030).
The potential in small and large hydro further expand as well, and new estimate indicate the levers will be on the whole cheaper than before. New, lower estimates for the price of geothermal development now make this a more appealing lever than nuclear power – together, these changes bring the average price for power sector carbon abatement down to USD 4 per ton from USD 20 per ton in 2009.
The price of other renewable technologies also drops, with solar falling enough to be included on the cost curve by 2030 (meaning less than USD 60 per ton of abatement) but all are expected to remain more expensive than hydro, geothermal, and supercritical coal.

57Updating Indonesia’s Greenhouse Gas Abatement Cost Curve
Roadtransportsector
Business as usual scenario
As noted above, road transport has the single largest decline in projected 2030 emissions from 2009 to 2014, due largely to improved data availability in our projection of total vehicles in use in Indonesia through 2030. In 2009, due to lack of robust forward projections, we worked with GAIKINDO to estimate simple rates of growth for each vehicle class out through 2030. For example, passenger cars were expected to grow at 10% per year, buses at 5%, etc. In this report, we have still relied on GAIKINDO sales data through the present, but now use estimates of vehicle sales per year, as opposed to changes to the total number of vehicles on the road, combined with an estimate about vehicle retirement rates over time. This gives us a dynamic balance of the number of automobiles added and subtracted from the total vehicles on the road each year. For four-wheeled passenger and commercial vehicles, and buses, this means fewer total vehicles as the sales projections we are using from IHS Global Insights show a much slower increase in the total sales of cars through 2030. For motorcycles, this means a much faster increase.
Abatement potential
While we estimate 2030 emissions from road transport to be roughly 50% lower, we estimate the abatement potential to be only 25% lower (roughly 75 MtCO2e versus 100 MtCO2e in 2009). As before, the road transport levers come at a significantly negative cost to society, -200 USD / tonne. This is both because the emissions potential has improved from a number of levers present before, and because we have added new levers.
Given the major increase in the number of motorcycles in our business as usual projection, the electric two wheelers lever now has significantly more abatement potential. With the decline in the number of passenger vehicles estimated, however, along with commercial vehicles, the high efficiency internal combustion engine levers for each of those is now lower potential.
We have also added additional transportation levers: a modal shift from cars to buses, which also has negative social cost, and second generation biofuels and a modal shift of heavy freight from trucks to rail, which both come at positive social cost.
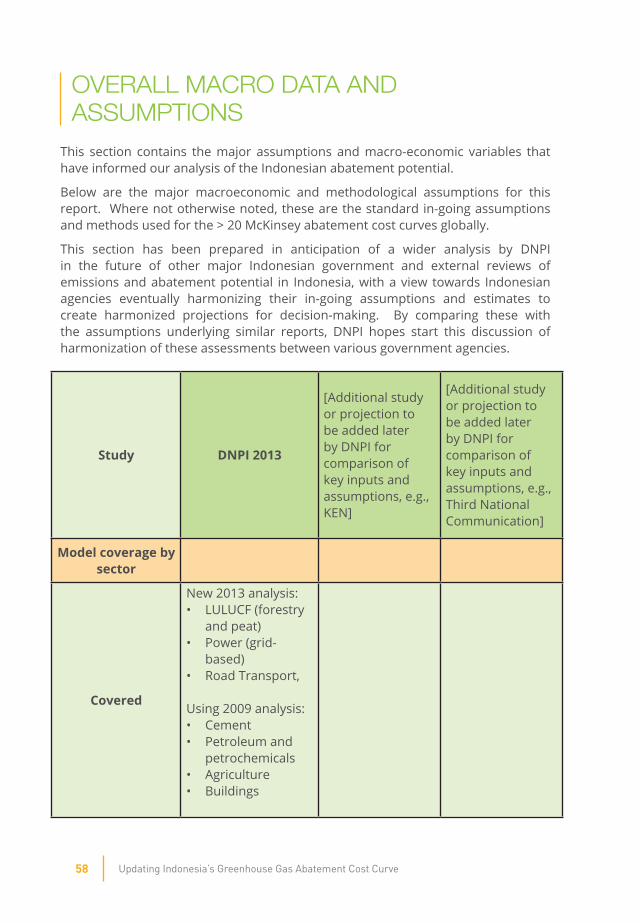
58 Updating Indonesia’s Greenhouse Gas Abatement Cost Curve
OVERALL MACRO DATA AND ASSUMPTIONS
This section contains the major assumptions and macro-economic variables that have informed our analysis of the Indonesian abatement potential.
Below are the major macroeconomic and methodological assumptions for this report. Where not otherwise noted, these are the standard in-going assumptions and methods used for the > 20 McKinsey abatement cost curves globally.
This section has been prepared in anticipation of a wider analysis by DNPI in the future of other major Indonesian government and external reviews of emissions and abatement potential in Indonesia, with a view towards Indonesian agencies eventually harmonizing their in-going assumptions and estimates to create harmonized projections for decision-making. By comparing these with the assumptions underlying similar reports, DNPI hopes start this discussion of harmonization of these assessments between various government agencies.
Study DNPI2013
[Additional study or projection to be added later by DNPI for comparison of key inputs and assumptions, e.g., KEN]
[Additional study or projection to be added later by DNPI for comparison of key inputs and assumptions, e.g., Third National Communication]
Modelcoveragebysector
Covered
New 2013 analysis: • LULUCF (forestry
and peat)• Power (grid-
based)• Road Transport,
Using 2009 analysis: • Cement • Petroleum and
petrochemicals • Agriculture• Buildings

59Updating Indonesia’s Greenhouse Gas Abatement Cost Curve
Omitted
• Air transport• Sea transport• Power (captive /
off-grid)• Manufacturing /
basic materials (including smelting)
• WasteMacro-economic
variablesPopulation,2030 293 MGDP,2030(USD,
2005 real PPP) 2.896 T
Discountrate
4% (The cost curve is a measure of social value from various interventions, so the discount rate used is from a societal perspective – this is the long term, global average capital cost for governments (long term public sector bond rate)
Emissionsfactorssource
IEA, with a 20% upward adjustment for each technology factor
Fuelprices (2030, in real 2005 dollars28)
Oil 109 USD / bblCoal 82 USD / tonGas 14.7 USD / mmbtu
Electricityprice(2030, in real 2005
dollars)0.11 USD / kWh
25 Meaning adjusted backward through time for inflation
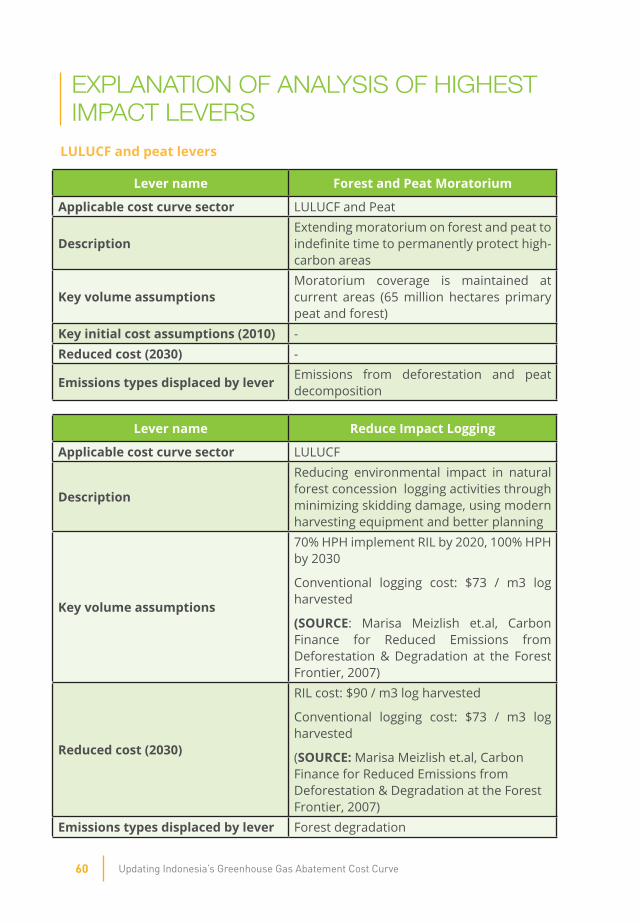
60 Updating Indonesia’s Greenhouse Gas Abatement Cost Curve
EXPLANATION OF ANALYSIS OF HIGHEST IMPACT LEVERS
LULUCFandpeatlevers
Levername ForestandPeatMoratorium
Applicablecostcurvesector LULUCF and Peat
DescriptionExtending moratorium on forest and peat to indefinite time to permanently protect high-carbon areas
KeyvolumeassumptionsMoratorium coverage is maintained at current areas (65 million hectares primary peat and forest)
Keyinitialcostassumptions(2010) - Reducedcost(2030) -
Emissionstypesdisplacedbylever Emissions from deforestation and peat decomposition
Levername ReduceImpactLogging
Applicablecostcurvesector LULUCF
Description
Reducing environmental impact in natural forest concession logging activities through minimizing skidding damage, using modern harvesting equipment and better planning
Keyvolumeassumptions
70% HPH implement RIL by 2020, 100% HPH by 2030
Conventional logging cost: $73 / m3 log harvested
(SOURCE: Marisa Meizlish et.al, Carbon Finance for Reduced Emissions from Deforestation & Degradation at the Forest Frontier, 2007)
Reducedcost(2030)
RIL cost: $90 / m3 log harvested
Conventional logging cost: $73 / m3 log harvested
(SOURCE:Marisa Meizlish et.al, Carbon Finance for Reduced Emissions from Deforestation & Degradation at the Forest Frontier, 2007)
Emissionstypesdisplacedbylever Forest degradation

61Updating Indonesia’s Greenhouse Gas Abatement Cost Curve
Levername AfforestationandReforestation
Applicablecostcurvesector LULUCF
DescriptionAfforestation/reforestation of non-forested or degraded land for long term carbon sequestration
Keyvolumeassumptions
4.6 million hectares non-forested land in steep slope can be afforested
(SOURCE:Ministry of Forestry land cover map 2000-2009, WRI concessions map 2010, Land use map 2010, Poyry analysis)
Keyinitialcostassumptions(2010)$ 900 / ha land afforested in average
(SOURCE: Pöyry Internal Database)
Reducedcost(2030)$ 900 / ha land afforested in average
(SOURCE: Pöyry Internal Database)Emissionstypesdisplacedbylever
Levername Improvecommunitypractices
Applicablecostcurvesector LULUCF
DescriptionReducing slash & burn by local communities through land titling, livelihood training and awareness program
Keyvolumeassumptions 40% of land titling completed by 2030Keyinitialcostassumptions(2010) Not included in the initial cost curveReducedcost(2030) -Emissionstypesdisplacedbylever Avoided emissions through deforestation

62 Updating Indonesia’s Greenhouse Gas Abatement Cost Curve
Levername Fireprevention
Applicablecostcurvesector LULUCF and Peat
Description
Prevent fire in forests and peatlands by strengthening the fire brigades, developing early-warning system and prohibiting the use of fire as tool for land preparation.
Keyvolumeassumptions10% of hotspots are located within 5 km distance from major roads and therefore are accessible by the fire brigades.
Keyinitialcostassumptions(2010)
$ 600 / ha mechanical land clearing cost
$ 50 / ha fire brigades recruitment and training
$ 100 / ha early warning system cost
(SOURCE:Pöyry Internal Database)
Reducedcost(2030)
$ 600 / ha mechanical land clearing cost
$ 50 / ha fire brigades recruitment and training
$ 100 / ha early warning system cost
(SOURCE: Pöyry Internal Database)Emissionstypesdisplacedbylever Deforestation and Peat Fire

63Updating Indonesia’s Greenhouse Gas Abatement Cost Curve
Levername Peatlandmanagement
Applicablecostcurvesector Peat
Description
Rehabilitate degraded peat through re-wetting and reforestation; implement water management in peat soil used for agriculture and plantation purposes
Keyvolumeassumptions5 million hectares non-forested peatlands outside concession areas are rehabilitated by 2030
Keyinitialcostassumptions(2010)
Operating cost: $25 / ha every year, $49 / ha every 5 year
Capex: $59 / ha infrastructure, $1000 / ha land ownership and economic loss compensation
(SOURCE: JP Morgan CDM project, CDM-PDD July 2006)
Reducedcost(2030)
Operating cost: $25 / ha every year, $49 / ha every 5 year
Capex: $59 / ha infrastructure, $1000 / ha land ownership and economic loss compensation
(SOURCE: JP Morgan CDM project, CDM-PDD July 2006)
Emissionstypesdisplacedbylever Peat decomposition
Levername Spatialplanningandlanduseoptimization
Applicablecostcurvesector LULUCF
Description
Swapping forested APL area with non-forested Kawasan Hutan; swapping forested land within concessions with degraded land outside concessions, or concession buyouts in case where no degraded land available
Keyvolumeassumptions
Planned deforestation (35% of total deforestation) can be prevented by 2030
(SOURCE: Ministry of Forestry land cover map 2000-2009, Poyry analysis)

64 Updating Indonesia’s Greenhouse Gas Abatement Cost Curve
Keyinitialcostassumptions(2010)
Opportunity cost from using degraded land: IDR 1.1 mn / m3 log sold
Yield 25 m3/ha/yr; $58 / m3 acacia sold
Yield in degraded land 5-10% lower than forested land
(SOURCE: Poyry Internal Database)
Reducedcost(2030)
Opportunity cost from using degraded land: IDR 1.1 mn / m3 log sold
Yield 25 m3/ha/yr; $58 / m3 acacia sold
Yield in degraded land 5-10% lower than forested land
(SOURCE:Poyry Internal Database)Emissionstypesdisplacedbylever Deforestation
Powerlevers
Levername Largehydro
Applicablecostcurvesector Power
Description Hydroelectric power generation of the order of few hundred MW to 10 GW capacity
Keyvolumeassumptions 15% of total generation capacity by 2030Keyinitialcostassumptions(2010) $2500 / KW (SOURCE: PLN)29
Reducedcost(2030) $2000 / KW (SOURCE: PLN)
Emissionstypesdisplacedbylever All reference fossil fuel production e.g., coal, oil, gas
Levername Smallhydro
Applicablecostcurvesector Power
Description Hydroelectric power generation of the order of 10-30 MW capacity
Keyvolumeassumptions 2% of total generation capacity by 2030Keyinitialcostassumptions(2010) $3000 / KW (SOURCE:PLN)Reducedcost(2030) $2400 / KW (SOURCE:PLN)
Emissionstypesdisplacedbylever All reference fossil fuel production e.g., coal, oil, gas
29 Expert interviews revealed a range of estimates for this point; PLN suggested 2500 which we have taken as the controlling, but experts in DNPI believe this can sometimes rise as high as 3000 / KW due to water management issues as a follow-on. Alternatively, JICA’s Final Report for the Master Plan Study of Hydropower Development in Indonesia estimates – 2100-2600 USD / KW initial cost assumption, in line with the PLN estimate.

65Updating Indonesia’s Greenhouse Gas Abatement Cost Curve
Levername Coalsupercritical
Applicablecostcurvesector Power
Description Coal power generation using efficient boiler operating in steam supercritical range
Keyvolumeassumptions 40% of total generation capacity by 2030
Keyinitialcostassumptions(2010)
• $1500 / KW (SOURCE: PLN Expert Interview at January 22 Inter-Agency Workshop)
• Fuel Cost for Coal SC is $17.70/MWh. For Coal it is $14.95/MWh (SOURCE: McKinsey Greenhouse Gas Abatement Cost Curve v3.0, 2013)
Reducedcost(2030)
• $1500 / KW (SOURCE: PLN Expert Interview at January 22 Inter-Agency Workshop) (already quite mature technology)
Emissionstypesdisplacedbylever Coal
Levername CoalCCSnewbuildwithEOR
Applicablecostcurvesector PowerDescription Coal CCS with Enhanced Oil RecoveryKeyvolumeassumptions 0.1% of total generation capacity by 2030
Keyinitialcostassumptions(2010)$5400 / KW (SOURCE: McKinsey Greenhouse Gas Abatement Cost Curve v3.0, 2013)
Reducedcost(2030)$2400 / KW (SOURCE: McKinsey Greenhouse Gas Abatement Cost Curve v3.0, 2013)
Emissionstypesdisplacedbylever All reference fossil fuel production e.g., coal, oil, gas

66 Updating Indonesia’s Greenhouse Gas Abatement Cost Curve
Levername Geothermal
Applicablecostcurvesector Power
Description Power generation using underground heat from deep inside earth
Keyvolumeassumptions 13% of total generation capacity by 2030Keyinitialcostassumptions(2010) $2,600 / KW (SOURCE: PLN) Reducedcost(2030) $2,000 / KW (SOURCE: PLN)Emissionstypesdisplacedbylever Coal
Levername SolarPV
Applicablecostcurvesector Power
Description Power generation using solar photo-voltaic cells
Keyvolumeassumptions 12% of total generation capacity by 2030
Keyinitialcostassumptions(2010) $3192/kW (SOURCE: McKinsey Greenhouse Gas Abatement Cost Curve v3.0, 2013)
Reducedcost(2030) $743/kW (SOURCE: McKinsey Greenhouse Gas Abatement Cost Curve v3.0, 2013)
Emissionstypesdisplacedbylever All reference fossil fuel production e.g., coal, oil, gas
30 There is also a wide range of estimates for these values. The JICA Master Plan Study for Geothermal Power Development in the Republic of Indonesia – Final Report, 2007 puts them at $1,800 in 2010 and $1,835 in 2030.

67Updating Indonesia’s Greenhouse Gas Abatement Cost Curve
Levername Onshorewind
Applicablecostcurvesector Power
Description Using On-Shore wind turbines to generate electricity
Keyvolumeassumptions 3% of total generation capacity by 2030
Keyinitialcostassumptions(2010) $1391/kW (SOURCE: McKinsey Greenhouse Gas Abatement Cost Curve v3.0, 2013)
Reducedcost(2030) $1217/kW (SOURCE: McKinsey Greenhouse Gas Abatement Cost Curve v3.0, 2013)
Emissionstypesdisplacedbylever All reference fossil fuel production e.g., coal, oil, gas
Levername Biomassdedicated
Applicablecostcurvesector Power
Description Biomass ,form of stored solar energy used to produce electricity
Keyvolumeassumptions 8% of total generation capacity by 2030
Keyinitialcostassumptions(2010) $2963/kW (SOURCE: McKinsey Greenhouse Gas Abatement Cost Curve v3.0, 2013)
Reducedcost(2030) $2048/kW (SOURCE: McKinsey Greenhouse Gas Abatement Cost Curve v3.0, 2013)
Emissionstypesdisplacedbylever All reference fossil fuel production e.g., coal, oil, gas
Levername Nuclear
Applicablecostcurvesector Power
DescriptionThermal power plant used to generate electricity in which the heat source is a nuclear reactor
Keyvolumeassumptions 3% of total generation capacity by 2030
Keyinitialcostassumptions(2010) $4536/KW (SOURCE: McKinsey Greenhouse Gas Abatement Cost Curve v3.0, 2013)
Reducedcost(2030) $4560/KW (SOURCE: McKinsey Greenhouse Gas Abatement Cost Curve v3.0, 2013)
Emissionstypesdisplacedbylever All reference fossil fuel production e.g., coal, oil, gas

68 Updating Indonesia’s Greenhouse Gas Abatement Cost Curve
Transportlevers
Levername Electriccars
Applicablecostcurvesector Transport roadDescription Cars running 100% on electric powerKeyvolumeassumptions 5% of total car sales by 2030
Keyinitialcostassumptions(2010)$13900 / vehicle over the base inefficient vehicle (SOURCE: McKinsey Greenhouse Gas Abatement Cost Curve v3.0, 2013)
Reducedcost(2030)$5800 / vehicle over the base inefficient vehicle (SOURCE: McKinsey Greenhouse Gas Abatement Cost Curve v3.0, 2013)
Emissionstypesdisplacedbylever Gasoline
Levername Electric2-wheelers
Applicablecostcurvesector Transport roadDescription 2-wheeler running 100% on electric powerKeyvolumeassumptions 50% of total 2-wheeler sales by 2030
Keyinitialcostassumptions(2010)$275 / vehicle (SOURCE: McKinsey Greenhouse Gas Abatement Cost Curve v3.0, 2013)
Reducedcost(2030)$275 / vehicle (SOURCE: McKinsey Greenhouse Gas Abatement Cost Curve v3.0, 2013)
Emissionstypesdisplacedbylever Gasoline
Levername HCVICE
Applicablecostcurvesector Transport road
Description Heavy Goods Carrier with efficient Internal Combustion Engine
Keyvolumeassumptions 35% of total HCV sales by 2030
Keyinitialcostassumptions(2010)$14000 / vehicle over the base inefficient vehicle (SOURCE: McKinsey Greenhouse Gas Abatement Cost Curve v3.0, 2013)
Reducedcost(2030)$10600 / vehicle over the base inefficient vehicle (SOURCE: McKinsey Greenhouse Gas Abatement Cost Curve v3.0, 2013)
Emissionstypesdisplacedbylever Diesel

69Updating Indonesia’s Greenhouse Gas Abatement Cost Curve
Levername LCVICE
Applicablecostcurvesector Transport road
Description Light Goods Carrier with efficient Internal Combustion Engine
Keyvolumeassumptions 100% of total HCV sales by 2030
Keyinitialcostassumptions(2010)$5000 / vehicle over the base inefficient vehicle (SOURCE: McKinsey Greenhouse Gas Abatement Cost Curve v3.0, 2013)
Reducedcost(2030)$2900 / vehicle over the base inefficient vehicle (SOURCE: McKinsey Greenhouse Gas Abatement Cost Curve v3.0, 2013)
Emissionstypesdisplacedbylever Diesel
Levername CarsICEgasoline
Applicablecostcurvesector Transport road
Description Gasoline cars with efficient Internal Combustion Engine
Keyvolumeassumptions 85% of total car sales by 2030
Keyinitialcostassumptions(2010)$2750 / vehicle over the base inefficient vehicle (SOURCE: McKinsey Greenhouse Gas Abatement Cost Curve v3.0, 2013)
Reducedcost(2030)$1350 / vehicle over the base inefficient vehicle (SOURCE: McKinsey Greenhouse Gas Abatement Cost Curve v3.0, 2013)
Emissionstypesdisplacedbylever Gasoline and Diesel
Levername BusICE
Applicablecostcurvesector Transport road
Description Buses with efficient Internal Combustion Engine
Keyvolumeassumptions 85% of total bus sales by 2030
Keyinitialcostassumptions(2010)$14000 / vehicle over the base inefficient vehicle (SOURCE: McKinsey Greenhouse Gas Abatement Cost Curve v3.0, 2013)
Reducedcost(2030)$10600 / vehicle over the base inefficient vehicle (SOURCE: McKinsey Greenhouse Gas Abatement Cost Curve v3.0, 2013)
Emissionstypesdisplacedbylever Diesel
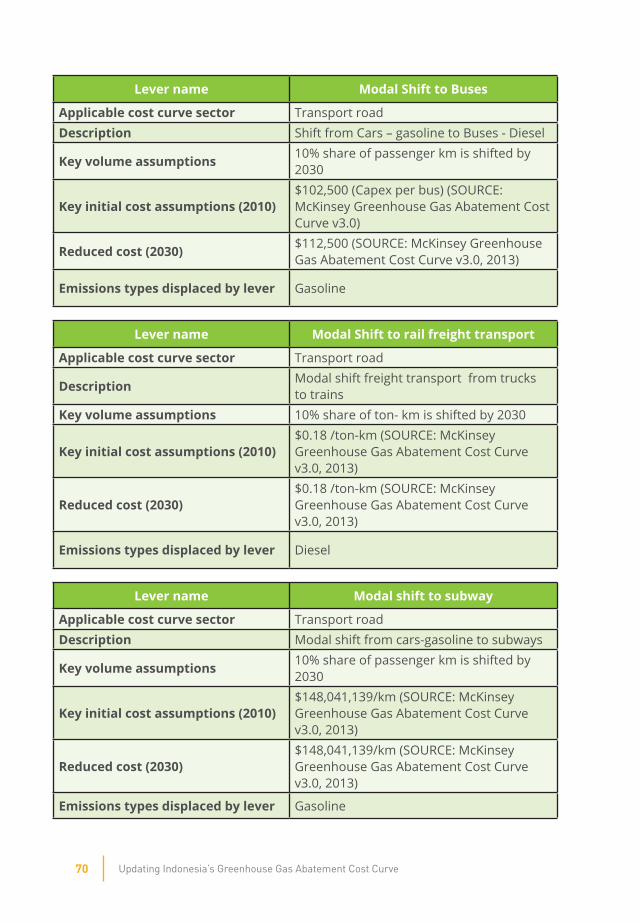
70 Updating Indonesia’s Greenhouse Gas Abatement Cost Curve
Levername ModalShifttoBuses
Applicablecostcurvesector Transport roadDescription Shift from Cars – gasoline to Buses - Diesel
Keyvolumeassumptions 10% share of passenger km is shifted by 2030
Keyinitialcostassumptions(2010)$102,500 (Capex per bus) (SOURCE: McKinsey Greenhouse Gas Abatement Cost Curve v3.0)
Reducedcost(2030) $112,500 (SOURCE: McKinsey Greenhouse Gas Abatement Cost Curve v3.0, 2013)
Emissionstypesdisplacedbylever Gasoline
Levername ModalShifttorailfreighttransport
Applicablecostcurvesector Transport road
Description Modal shift freight transport from trucks to trains
Keyvolumeassumptions 10% share of ton- km is shifted by 2030
Keyinitialcostassumptions(2010)$0.18 /ton-km (SOURCE: McKinsey Greenhouse Gas Abatement Cost Curve v3.0, 2013)
Reducedcost(2030)$0.18 /ton-km (SOURCE: McKinsey Greenhouse Gas Abatement Cost Curve v3.0, 2013)
Emissionstypesdisplacedbylever Diesel
Levername Modalshifttosubway
Applicablecostcurvesector Transport roadDescription Modal shift from cars-gasoline to subways
Keyvolumeassumptions 10% share of passenger km is shifted by 2030
Keyinitialcostassumptions(2010)$148,041,139/km (SOURCE: McKinsey Greenhouse Gas Abatement Cost Curve v3.0, 2013)
Reducedcost(2030)$148,041,139/km (SOURCE: McKinsey Greenhouse Gas Abatement Cost Curve v3.0, 2013)
Emissionstypesdisplacedbylever Gasoline

71Updating Indonesia’s Greenhouse Gas Abatement Cost Curve
Levername 2ndGenerationBiofuel-Lignocellulosic
Applicablecostcurvesector Transport roadDescription Shift from cars – gasoline to biofuel
Keyvolumeassumptions 5% share of gasoline cars are shifted to biofuel by 2030
Keyinitialcostassumptions(2010)
$1.08/lge – Price of Biofuel (SOURCE: Technology Roadmap, Biofuels for Transport, International Energy Agency, 2011)
Reducedcost(2030)
$0.88/lge – Price of Biofuel (SOURCE: Technology Roadmap, Biofuels for Transport, International Energy Agency, 2011)
Emissionstypesdisplacedbylever Gasoline

72 Updating Indonesia’s Greenhouse Gas Abatement Cost Curve
BibliographyLULUCF
• Annual Statistics, Ministry of Forestry Indonesia, 2011
• Assessment of CO2 emissions from drained peatlands in SE Asia: A Technical Report – Wetlands International, Hoojier et.al, 2006
• Climate regulation of fire emissions and deforestation in equatorial Asia, van der Werf et al, 2008
• Greenhouse Gasses Assessment from Forest Fires: Indonesia Case Study – Preliminary Assessment Report, DNPI-JICA, 2013
• PEAT-CO2: Assessment of CO emissions from drained peatlands in SE Asia, Hoojier, et al., 2006
• Rekalkulasi Penutupan Lahan Indonesia 2008, Ministry of Forestry, 2008
• RAN-GRK, BAPPENAS, 2011
• RSPO Manual on Best Management Practices for Existing Palm Oil Cultivation on Peat, Roundtable on Sustainable Palm Oil, 2013
• Water Management Implications for Peatlands: Hydrology of the Rehabilitation and Revitalisation of the Ex-Mega Rice Project Area in Central Kalimantan, Hoojier, et al., 2008
• Climate Regulation of Fire Emission and Deforestation in Equatorial Asia, G.R. Van der Werf, J. Dempewolf, PNAS Vol.51, December 2008
• Current and Future CO2 Emissions from Drained Peatlands in Southeast Asia, Hooijer et al., Delft Hydraulics, 2010
• Greenhouse Gasses Assessment From Forest Fires: Indonesia Case Study, National Climate Change Council, November 2013
• Indonesian Palm Oil in Numbers 2012, Directorate General of Processing and Marketing of Agriculture Products, Ministry of Agriculture Republic of Indonesia, 2012
• Indonesia’s Greenhouse Gas Abatement Cost Curve, National Climate Change Council, August 2010
• Indonesia Second National Communication Under The United Nations Framework Convention on Climate Change, Ministry of Environment Republic of Indonesia, November 2010
• Instruksi Presiden Nomor 10 Tahun 2011 tentang Penundaan Pemberian Izin Baru dan Penyempurnaan Tata Kelola Hutan Alam Primer dan Lahan Gambut, Government of Indonesia, May 2011
• Instruksi Presiden Nomor 6 Tahun 2013 tentang Penundaan Pemberian Izin Baru dan Penyempurnaan Tata Kelola Hutan Alam Primer dan Lahan Gambut, Government of Indonesia, May 2013

73Updating Indonesia’s Greenhouse Gas Abatement Cost Curve
• Instruksi Presiden Nomor 8 Tahun 2013 tentang Penyelesaian Penyusunan Rencana Tata Ruang Wilayah Provinsi dan Kabupaten/Kota, Government of Indonesia, September 2013
• Manual for the Control of Fire in Peatlands and Peatlands Forest. Climate Change, Forests and Peatlands in Indonesia Project, Adinugroho W.C., I Nyoman N. Suryadiputra, Bambang H. Saharjo, and Labueni Siboro, Wetlands International – Indonesia Programme and Wildlife Habitat Canada, 2005
• Methodology for Monitoring and Setting Baseline for Deforestation and Forest Degradation, IPCC
• Peat-CO2 Assessment of CO2 Emissions from Drained Peatlands in Southeast Asia, Hoojier et.al, Delft Hydraulics, December 2006
• Peraturan Presiden RI Nomor 61 Tahun 2011 tentang Rencana Aksi Nasional Penurunan Emisi Gas Rumah Kaca, Government of Indonesia, September 2011
• Peraturan Presiden RI Nomor 62 Tahun 2013 tentang Badan Pengelola Penurunan Emisi Gas Rumah Kaca dari Deforestasi, Degradasi Hutan dan Lahan Gambut, Government of Indonesia, September 2013
• Recent Forest and Peat Fire Trends in Indonesia The Latest Decade by MODIS Hotspot Data, Yulianti et.al, April 2012
• Rekalkulasi Penutupan Lahan Indonesia Tahun 2008, Ministry of Forestry, 2008
• RSPO Manual on Best Management Practices for Management and Rehabilitation of Natural Vegetation Associated With Oil Palm Cultivation on Peat, Roundtable on Sustainable Palm Oil
• Statistik Kehutanan Indonesia 2011, Ministry of Forestry, 2012
• Tropical Peat Carbon Pools and Water Management: Discussion of Current Investigations and Important Considerations to Achieve Reduction of CO2 Emissions Through Mitigative Water Management, Aljosja Hooijer, Marcel Silvius, Henk Wosten, Deflt Hydraulics – Wetlands International
• Undang-Undang Republik Indonesia Nomor 26 Tahun 2007 tentang Penataan Ruang, Government of Indonesia, April 2007
Power
• China, the United States and the Climate Change Challenge, WRI Policy Brief, 2009
• Geothermal Development and Research in Iceland, National Energy Authority and Ministries of Industry and Commerce, 2006

74 Updating Indonesia’s Greenhouse Gas Abatement Cost Curve
• Geothermal in Indonesia Low Carbon Development: Profile, Status and Role of Market Mechanism, Ministry of Energy and Mineral Resources and National Council on Climate Change – Indonesia; 2013
• Handbook of Energy and Economic Statistics of Indonesia 2012, ESDM, 2012
• Igniting the Ring of Fire, WWF, 2012
• Implementing Indonesia’s Economic Master Plan (MP3EI): Challenges, Limitations and Corridor Specific Differences, Foreign and Commonwealth Office, 2012
• Indonesia Geothermal Power Development Program, Global Environment Facility, 2008
• Indonesia Sumatera SNG Project Economic Study of CO2 / EOR, Mitsubishi Heavy Industries and Mitsubishi UFJ Morgan Stanley, 2012
• Indonesia Sumatera SNG Project Follow-up Feasibility Study in 2012, Mitsubishi Heavy Industries and Mitsubishi UFJ Morgan Stanley, 2013
• JICA’s Contribution to New, Renewable Energy Development and Energy Conservation in Indonesia, JICA 2013
• Master Plan Study for Geothermal Power Development in the Republic of Indonesia – Final Report, JICA, 2007
• Master Plan Study for Hydropower Development in the Indonesia – Final Report, JICA, 2011
• Outlook Energi Indonesia 2013, BPPT 2013
• Pre-Feasibility Study for Identification of Replacement of Existing Power Plants under the JCM scheme, Japan Coal Energy Center (JCOAL) and Mizuho Corporate Bank, Ltd., 2013
• Recana Umum Ketenagalistrikan Nasional (RUKN), ESDM, 2012-2031
• Rencana Usaha Penyediaan Tenaga Listrik (RUPTL), PT PLN 2012-2021
• Renewables Country Profile: Indonesia, Renewable Energy Policy Network for the 21st Century, 2013
• Renewables Energy Auctions in Developing Countries, International Renewable Energy Agency, 2012
• Small Scale Hydropower Projects, Consultative Meeting on Reports of Joint Crediting Mechanism Feasibility Studies 2012 in Indonesia, IDI infrastructures, 2013
• Statistik Ketenagalistrikan Tahun 2011, ESDM. 2012
Roadtransport
• Outlook Energi Indonesia 2013, Badan Pengkajian Dan Penerapan Teknologi (BPPT), 2013
• Motor vehicle sales record of Indonesia 2000-2013, Gabungan Industri Kendaraan Bermotor Indonesia (GAIKINDO), 2014

75Updating Indonesia’s Greenhouse Gas Abatement Cost Curve
• Comparative analysis of motorcycle utilization and forecasting model of motorcycle ownership of Eastern Asian Countries – Taiwan, Malaysia, and Vietnam, The Eastern Asia Society for Transportation Studies (EASTS) 2005
• Indonesia motor vehicle sales growth – historical and forecast, IHS Global Insight, 2013
• Road vehicles in Indonesia 2005 and 2010 (website), Central Statistics Bureau of Indonesia, 2013
• Indonesia population and GDP projections through 2030, World Market Monitor Global Insight, 2013
• The Role of Electric Two-Wheelers in Sustainable Urban Transport in China: Market analysis, trends, issues, policy options, Fu Aia, United Nations, 2010
• Increasing U.S. Auto Exports and Growing U.S. Auto Jobs through the U.S.-South Korea Trade Agreement, The White House, 2011
• Technology Roadmap: Biofuels for transport, International Energy Agency, 2011.

76 Updating Indonesia’s Greenhouse Gas Abatement Cost Curve
Updating Indonesia’sGreenhouse GasAbatement Cost Curve
Technical Cooperation Project for Capacity Development for the National Focal Point on Climate Change to Enhance
the Coordination and Evaluation on Climate Change Policies in Indonesia
BPPT Building 1,16th Floor, Jl. MH. Thamrin No. 8. Jakarta 10340 - Indonesia
Phone +62 21 3190 4635,Fax + 62 21 3983 8702
September 2014