updating new ventures exploration databases using arcgis data … · 2006-07-18 · regional...
TRANSCRIPT

1
DOC ID© Chevron 2005
Updating New Ventures exploration databases using ArcGIS data analysis techniques
Donald W. DowneyEarth Scientist
CA RG #7487 TX RG #1539 AAPG CPG #5838 GISP #51955Chevron Exploration & Production Technology Company (EPTC) Earth Science Technology Department (ESD)Exploration and New Ventures Team 6001 Bollinger Canyon Road, C-1188 San Ramon, CA 94583-0946 Tel 925 842 3448 Fax 925 842 3030 mailto:[email protected]
Twenty-Sixth Annual ESRI International User ConferenceAugust 8, 2006
When we are looking for new oil & gas deals (like lease sales, bid rounds, farm-ins), we need to rapidly assimilate and evaluate geological datasets or “data packages”. Obviously, ArcGIS has a quick GIS display engine, but the real power and benefits lies in the ability to standardize and quality-check the data. We want to standardize and normalize the data so we can quickly create an unbiased geological interpretation of the data.
2
2ESRI_2006© Chevron 2006
Introduction to exploration
New Ventures exploration requires the rapid building of geological interpretation databases.
Data analysis techniques using ArcGIS during the data acquisition and preparation phases of a project greatly improve the data-quality of the interpretation databases and reduce cycle time.
Use ArcGIS to not just display your data, but to
ANALYZE your data!
Before forming a process to manage the interpretation databases,we should examine the needs of the specific projects.
What is our data management philosophy?/Internal drilling and production data?/Regional exploration interpretation team?Lease bid rounds, Other business drivers?
Data warehouses: stores of “clean” data with consistent quality, some data is missing
Interpretation database: all data is filled in with best-available or best-guess
Interaction between these two types of databases is becoming more critical to the future success of regional hydrocarbon exploration.
Interpretation databases will eventually go back into the data warehouse database.
Need to facilitate this handoff by developing corporate data management standards.
Organization is essential if we expect to quickly evaluate the upstream business opportunities presented to the corporation.
New Ventures exploration requires the rapid building of geological interpretation databases. Data analysis techniques using ArcGIS during the data acquisition and preparation phases of a project greatly improve the data-quality of the interpretation databases and reduce cycle time. So what we want to do is to use ArcGIS to not just display your data, but to ANALYZE your data!

3
3ESRI_2006© Chevron 2006
Examples to be presented
“Data room” assimilation(seismic line selection)
Well location analysis(precision, geodetic datum)
Well header updates(country, elevation, status, field, basin)
Spatial analysis of stratigraphic picks(time-equivalent facies distribution)
Some examples to be presented are:
Digitization/digestion/assimilation of large amounts of paper records. Seismic line selection by cross-referencing vendor and in-house navigation databases and overlays of prospect areas
Well location precision analysis to separate out wells that can not be used for geodetic analysis
Well location geodetic analysis of vendor and in-house databases to add datum metadata
Using the ArcToolbox Intersection tool to update Well header country/elevation/water depth/basin name/field name/ updates
Spatial analysis of stratigraphic pick distribution to identify time-equivalent facies

4
4ESRI_2006© Chevron 2006
Seismic Interpretation
2D Seismic
3D Seismic
Grid
Contour
Cross sections
Regional
Prospect
Merged
50 300 600 900 1250 1650 2050 2450 2850 3250 3650 4050 4450 4850 5250 5650 605007
8652
0786
58
0786
62
0789
17
0789
31
1289
22
1289
35
0786
38
0786
55
0786
60
0789
22
ct-10
2a
078626mig080001
33005m
SW NE
0 0
500 500
1000 1000
1500 1500
2000 2000
2500 2500
3000 3000
3500 3500
4000 4000
4500 4500
Offshore Pechora Sea - Line 078626
Top Triassic
Upper Trias
Middle Trias
Permo-Carb Carbonate
Intra-Devonian
Top Ordovician
00 10 Kilometers
10 Miles1:100,000
Vertical scale: 10cm/sec (1:30,000)Horizontal scale: 1000m/cm (1:100,000)
Velocity conversion: 3000m/sec
V.E.=3.33
Dolginskiy High Thrust Belt
NE
Structural Cross Section 3Offshore Pechora Sea
SWPomorskiy High
x
2D Seismic interpretation3D Seismic interpretationContoursDigitizeGridsSemi-structured data!
Regional-scale mapsProspect-scale (small scale) mapsMerged regional and detail (prospect) maps
These teams need to interpret seismic data These teams need to interpret seismic data for structural geology.for structural geology.Optimistic project timelines of earth science Optimistic project timelines of earth science teams operating under tight project teams operating under tight project schedules oftenschedules often……
underestimateunderestimatedata management time!data management time!

5
5ESRI_2006© Chevron 2006
What is the importance of quality data?
Geological interpretation is one of the most
important tasks in our corporation.
Quality data input to the interpretation computer programs
is essential...
•• These programs are very These programs are very sensitive to outlier data points.sensitive to outlier data points.
•• Bad data slows the interpretation Bad data slows the interpretation process due to the time required process due to the time required to make corrections and the to make corrections and the mental distraction from the mental distraction from the interpretation process.interpretation process.
Geological interpretation is one of the most important tasks in our corporation. Quality data input to the interpretation computer programs is essential. These programs are very sensitive to outlier data points. Bad data slows the interpretation process due to the time required to make corrections and the mental distraction from the interpretation process.
Database quality management can be difficult in cases of ambiguous data. When problems with poor-quality data are compounded by the amount of data needed to evaluate regional areas for hydrocarbons, computer programming is the only method to increase the quality of the data.
The number of fields in the typical New Ventures project database that we need to quality-check is actually quite low. This talk will discuss short scripts, extensions and macros for ArcGIS to further increase our productivity. The programming needed to evaluate the database is quite simple; most of the calculations involve only arithmetic and logic.

6
6ESRI_2006© Chevron 2006
New projects seismic line selection
Need to quickly evaluate new opportunities
How quickly can we “digest” the geologic information provided by the seller?
Seismic line selection by cross-referencing vendor and in-house navigation databases
Fortunately, most New Ventures exploration projects do not required the topological rigor (precision) that development projects require!
New projects seismic line selection
We need to quickly evaluate new opportunities and ordering seismic data is one of the most important early tasks. We need to quickly “digest” the existing “data package” of geologic information provided by the seller. The first job is to select new seismic lines by cross-referencing vendor/data package and our in-house seismic navigation databases.
I digitize or photograph the paper basemaps, georeference the raster images and digitize the seismic line shapefiles. Fortunately, for my digitizing, most New Ventures exploration projects do not required the topological rigor (precision) that development projects require!

7
7ESRI_2006© Chevron 2006
“Data Room” Deliverables
Detailed GGIS listings & basemap AOI polygons
Georeferenced raster images of basemaps
Seismic line navigation digitized (highlighted)
Cross section lines digitized
Other info: seismic navigation, technical reports, well log database listings by well
dBase tables/Shapefiles /Raster images
New ventures projects often require the rapid incorporation of paper records in a data room into the interpretation database.
Typically, we have only a day or two to examine the farm-in project records in the data room. How can we quickly “digest”this information and bring it back to our office and use it to evaluate the new project?
We need three sets of information to quickly import the paper records into ArcGIS: (1) a raster image of the item, (2) a table of the locations of the wells and corner reference points of the AOI polygons of the map images and (3) a tabular listing of descriptions of the data.
Detailed GGIS listings & basemap AOI polygons
Georeferenced raster images of basemaps
Seismic line navigation digitized (highlighted)
Cross section lines digitized
Other info: seismic navigation, technical reports, well log database listings by well
dBase tables/Shapefiles /Raster images

8
8ESRI_2006© Chevron 2006
Photos of typical “data room” maps
The quickest way to create image files from the paper records isto photograph the maps and cross sections on the wall. Although not nearly as accurate as large-format scanning, the text labels on the maps are legible. The photographs are much smaller images than large format scans and can be quickly georeferenced to regional interpretation standards. We can also use Layout View to line up the latitude and longitude corner points of the maps.
The main problem is renaming the raster image files. It is better to take the photo and immediately rename and copy to your ArcGIS project folder. Build pyramids, georeference and move to the project personal geodatabase.
After loading existing digital seismic nav data, remaining linesare digitized on-screen and linenames entered.
Join or relate any data tables to the seismic nav data so selections of data can be made.

9
9ESRI_2006© Chevron 2006
Georeferencing raster images
Raster image outline polygons
Making a raster fit data from a known coordinate system.
ArcGIS may put georeference in AUX file
Gif image
Xml created by metadata
Rrd reduced pyramids
Aux georef stats coor sys
Gfw world file
1.Add control and raster layers
2.Adjust raster display Georeferencing => Fit to display
3.Add links
4.Evaluate link errors and delete bad links - reduce RMS to one output cell size or less (For 10 meter cells, try for an RMS of 10)
5.Apply georeferencing, rectify image

10
10ESRI_2006© Chevron 2006
Seismic basemap
The quality of the photographed rasters is quite good. Create and edit a line shapefile and add use ArcToolbox to Add a “Linename” Field to the shapefile. Digitize the seismic line navigation and save. Now seismic lines in the data package can now be quickly located.

11
11ESRI_2006© Chevron 2006
Seismic basemap example
!
!
!
!!!!!!!!
!
!
!!!
!!
!
!
! !
! !
!!!!!
!
!!
!
!!
!!
!
!! !
! !
!
!
!
!
!
!
!
!
!
!
!!
!
!
!!
!
!
!
!!
!!!!!!
!!!!
!
! !
!!
!
!
!!!!!
!!!!
! !!!
!
!
!!
!
!!
!
!
!
!
!!
!
!
!
!
!
!
!!
!
! !!!!!!
!!!!!!!
!
!!
!
!
!!
!!
! !
!
!!!
!
!
!
!
!!
!
!
!
!
!
!
!
!!
!!!
!
!
!
!
!
!
!!
!!!!!!!
!
!
!!
!
!
!!!!
!
!
!!
!
!
!!
!
!
!
!
!
!
!
!!
!
!!!!
!!!!!!!!
!!!!!!!
!
!!!
!!
!
!
!!!!!!
!!!!!!!!!!!!!!!!! !!!!!!
!!
!!!!!!!!!
!!
!!
!
!!
!
! !!!!!!!!!!!!!!!!!
!
!!!!
!!!!
!
!!!!!!!!!!!
!
!
!
!!
! !!!!
!
!
!!!
!
!!
!!!!!
!
!
!!
!
!!!!!!
!!!!
!!
!
!
!
!!
!
!
!!!!
!
! !!
!
!!
!
!!!!! !!
!
!!
!!!!!!!!!!!!!!!!
!
!
!!!
!
!!!!
!
!
! !
!!!!!!!
!
!
!!
!!!
!!
!!!
!!
!!!!!!
!
!
!!
!
!
!!
!!
!
! !
!
!!
!
!
!
!
!!!!!
!!!!!!!!!!!
!
!!
!!!
!!!
!!!!
!
!
!
!
!
!
! !
!!!!
!
!!!!
!
!!
! !!
!
!!!
!!!!!
!!!!
!
!
!!
!!
!
!
! !!
!
!
!
!
!
!
!
SL AA
KG D4
KG 17KG 08
KD AC
IPS 1
IDA 1SRPL 1RZAB 8
Modi 1
MB-1 2
Kaza 3
Kaza 2 KG-6 2KG-6 1
KG A-1
KD-4 1
KD-3 1
KD-2 1KD-1 2KD-1 1
Godi 1
GM-0 1
GD-6 1GD-5 1
GD-4 1 GD-3 1
GD-2 1
GD-1 1G-13 1
G-05 1
G-04 4G-04 3
G-04 2
G-04 1
G-03 1G-02 4
G-02 2G-02 1 D6-T 1D6-M 1
D6-H 1
D6-C 1D6-B 2
D6-B 1
19-A 1
Yanam 2Yanam 1
Mori AJMori 14
Mori 12Mori 11Mori 10
Mori 09
KKAH 19GS-KW 3GS-KW 2
GS-49 2
GS-46 1GS-43 1
GS-41 1
GS-39 1
GS-37 1
GS-29 2GS-29 1
GS-23 4GS-23 1
GS-22 1 GS-20 1
GS-19 1
GS-18 1
GS-17 1
GS-14 1
GS-12 2
GS-12 1
GS-10 1GS-08 1
GS-05 1
GS-03 2GS-03 1
GS-02 1
GD-1 AC
G-01 DBG-01 DAG-01 11
G-01 10G-01 08
DWN-Q 1
DWN-N 1Vadali 2
Vadali 1
Tanuku 1
Razole 7Razole 6
Ravva BERavva 36
Ravva 35
Ravva 33Ravva 27
Ravva 24
Ravva 12
Poduru 1
Kuduru 1
Kadali 1
KD-1 2RE
Guraza 1
GS-49 AD
GS-29 AB
GS-22B 1GS-22A 1
GS-21B 1
GS-21A A
Velpuru 1
Penduru 2
Lingala CLingala A
Kavitam 2Kavitam 1
Akividu 1
Achanta 1
Ravva 25ST
Penduru 1A
Mukkollu 1
Medapadu 2Medapadu 1Lelapudi 1
Kavitam AB
KG-DWN-W-1
KG-DWN-U-1
KG-DWN-A-1
Godavari 1
Dosapadu 1
Angaluru 1
Vashistha 3
Vashistha 2
Vadaparru 1
Saripalle 2
Ravipadam 1
Perupalem 1
Penumadam 3
Parimella 1
Nimmakuru 1
Narasapur 7
Narasapur 6
Nandigama B
Kanukollu 1
Vetlapalem 1
Vaddipalem 1
Turputallu 1
Rangapuram 1
Kottalanka 1
Gajulapadu 1
Dhirubhai 25
Bantumilli 4Bantumilli 3Bantumilli 1
Viravasaram 1
Polavaram 1-D
Mantripalem 1
Suryaraopeta 4Suryaraopeta 1
Penkillapadu 1
Mummidivaram 1
Gokarnapuram 2Gokarnapuram 1
Bobbor Lanka 1
Bhimanapalli 1
Suryaraopeta 2-D
Mandapeta West 6Mandapeta West 1
Chinnapandrika 1
Kesanakurupalem 1
KGOSN20012 well 1
Bhavadevarapalli 1
DWN-R (Annapurna) 2DWN-R (Annapurna) 1
724722728732
718
711
734736740742
744
AD-22
AD-14
AD-109
AD-12
AD-47
AD-34
AD-45
AD-43
AD-51
AD-55
AD-39
AD-81
AD-93
AD-91
AD-67
AD-09
AD-61
AD-87
AD-83
AD-85
AD-89
AD-95
AD-05
AD-03
AD-97
prospect
Overlaying additional layers aids in selecting additional seismic lines for purchase. An Access project seismic navigation database can manage the ordering of the seismic data. Symbology of the lines can be color-coded by those that are available, ordered, received and loaded. This prevents the purchase of duplicate lines.

12
12ESRI_2006© Chevron 2006
Matching wellnamesDuplicates flag
False precision
1. Match the Chevron and IHS wellnames.
2. Create a table of Chevron UWI versus IHS WellID.
3. Edit IHS wellnames to match CVX wellnames.
4. Merge Chevron UWI and IHS WellID key fields.
5. Merge IHS data to CVX Project as needed.
Matched
Probable
Unknown
IHS Well Matches
67% matched

13
13ESRI_2006© Chevron 2006
Well location precision analysis
Data-entry, reformatting and data storage conversion into a standard dataset
Calculate distance and bearing between datasets
typographical errors
geodetic datum-shift errors
within tolerance “close-enough”
duplicates & exact matches (overposting)
Data precision analysis
Generate Comments/Remarks; generate Actions to perform on dataset to create load file
A study of 700+ well locations from Iraq show that datarounding and truncation, not geodetic datum shifts are the most likely source of well location errors.
Select “best” well location from several well location datasets
Eliminate duplicate well locations and resulting overposting ofwell picks
Quantify area of uncertainty around well location for well correlation ties
Data-entry, reformatting and data storage conversion into a standard dataset
Calculate distance and bearing between datasets
typographical errors
geodetic datum-shift errors
within tolerance “close-enough”
duplicates & exact matches (overposting)
Data precision analysis
Generate Comments/Remarks; generate Actions to perform on dataset to create load file
14
14ESRI_2006© Chevron 2006
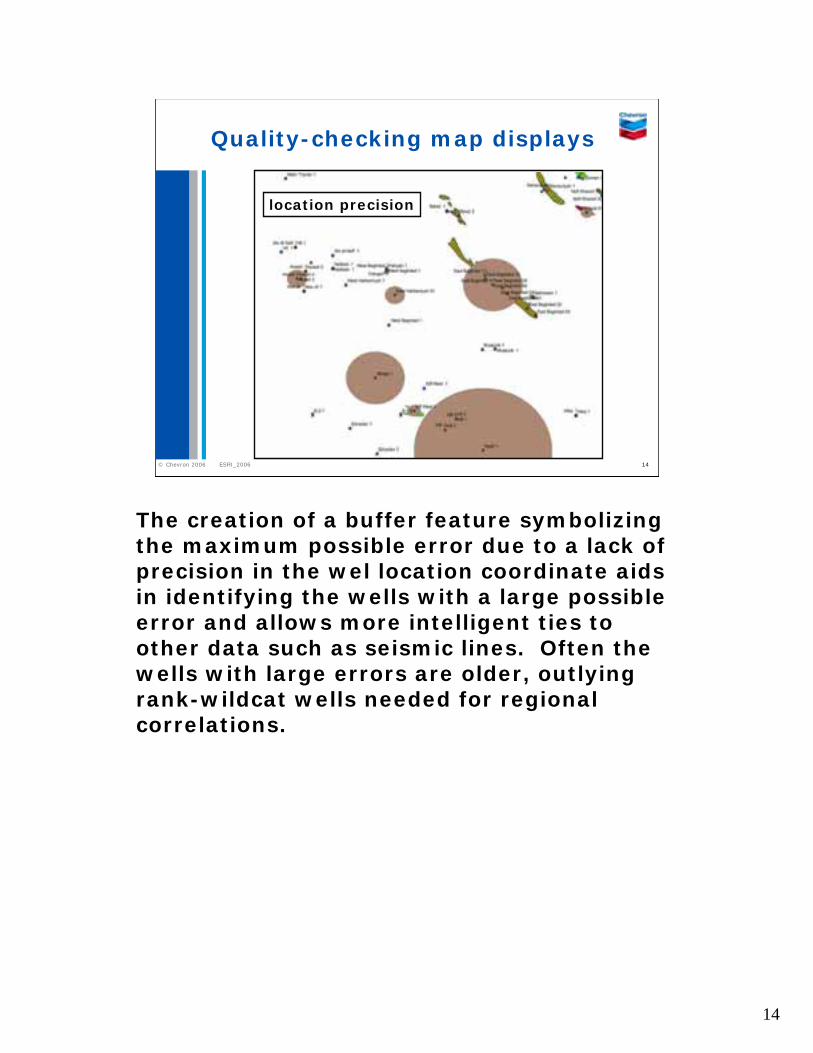
Quality-checking map displays
location precision
The creation of a buffer feature symbolizing the maximum possible error due to a lack of precision in the wel location coordinate aids in identifying the wells with a large possible error and allows more intelligent ties to other data such as seismic lines. Often the wells with large errors are older, outlying rank-wildcat wells needed for regional correlations.

15
15ESRI_2006© Chevron 2006
Datum shift example – Brazil Offshore
Calculate distance and bearing between locations…Look for consistent (known) values of datum shifts.
Distance and bearing
Geodetic datum
Calculate distance and bearing between locations…sort the table and look for consistent (known) values of datum shifts.
Drawing lines between locations for the same wellbore obtained from different vendor sources allows much easier viewing of the well location descrepancies.

16
16ESRI_2006© Chevron 2006
Duplicate well locationsREFNO Wellname Lat Lon Notes
VB6361 Well-1 35.9 43.1375 LON SAME
VB6365 Well-5 35.90416667 43.12083333 LON SAME
VB6366 Well-7 35.88333333 43.1375 LON SAME
VB6367 Well-8 35.89166667 43.125 LON SAME
VB6368 Well-10 35.91944444 43.125 LON SAME
VB6370 Well-12 35.90416667 43.15277778 LON SAME
VB6371 Well-14 35.89583333 43.15833333 LON SAME
VB6372 Well-18 35.87916667 43.1625 LON SAME
VB6373 Well-20 35.875 43.15277778 LON SAME
VB6374 Well-21 35.9 43.15833333 LON SAME
VB6375 Well-22 35.88333333 43.14722222 LAT SAME
VB6377 Well-24 35.90416667 43.1625 LON SAME
VB6378 Well-25 35.89583333 43.10833333 LAT SAME
VB6380 Well-27 35.89166667 43.17083333 LAT SAME
VB6381 Well-28 35.88333333 43.125 LON SAME
1.Sort the well location spreadsheet by latitude
2.Subtract one cell by the next cell to identify duplicates
3.Repeat process for longitude
4.Create a sub-table of duplicate well locations for a field
5.Display the map view and add annotation and lines tying each duplicate well location

17
17ESRI_2006© Chevron 2006
Well header basin & fieldname updates
Intersect wells with fieldsand extract fieldnames
Well header basin & field name updates using the ArcToolbox Intersection tool
Toolbox => Analysis Tools => Overlay => Intersect
Extract field name values from polygon layer and append to well location table
Overlays to use
Fieldname
Basin name
Bathymetry
Ground elevation
Concession
Country
Raster cell values

18
18ESRI_2006© Chevron 2006
QC data – Select by Attributes
Short expressions select null & outlier data points
Expression
Well header basic QC
•• blank common well namesblank common well names
•• duplicate well namesduplicate well names
•• zero or null XY locationszero or null XY locations
•• zero, null or too large latitude/longitudezero, null or too large latitude/longitude
•• null geodetic or elevation datumnull geodetic or elevation datum
•• zero or null total depthzero or null total depth
•• unknown status or status symbolunknown status or status symbol
•• picks greater than total depthpicks greater than total depth
•• picks with duplicate namespicks with duplicate names

19
19ESRI_2006© Chevron 2006
Lookup Table - Corrections
Create a “look-up” table with a list of common corrections to the database.
Apply this list of standardize naming conventions to your data by joining or relating the look-up table to your database.
Use for country, field, well status, log curve names, pick names…
Country Look-up
Burma => Myanmar
Ceylon => Sri Lanka
Dahomey => Benin
Ellice Islands => Tuvalu
Gold Coast => Ghana
Kazakstan => Kazakhstan
KAZAKSTAN => Kazakhstan
Liechtenstien => Liechtenstein
Luxemburg => Luxembourg
Rhodesia => Zimbabwe
Siam = > Thailand
South-West Africa => Namibia
Spanish Guinea => Equatorial Guinea
Create a “look-up” table with a list of common corrections to the database.
Apply this list of standardize naming conventions to your data by joining or relating the look-up table to your database.
Use for country, field, well status, log curve names, pick names…
•Create look-up tables with lists of wells that you are working on.
• Use these Well lists to SELECT only the subset of well data you need to access.
100000368332Ahmedabad 095100000368331Gandhar 470100000368330Mewad 12100000368273Santhal 175100000368267Lakwa 507100000368266Geleki BA100000368255Geleki 286100000368100Dahanu B-12-2
Well IdWell Name

20
20ESRI_2006© Chevron 2006
Well log issues
•Run, version numbers of field logs
•Create log templates(need list of log names & types)
•FE Analysis done? (computed logs)
•log depth > well total depth
•decimal/percent issues
•possible duplication of logs
•suspicious min/max values
•unknown/null/mismatched units
Items to QC for well logs
•Run, version numbers of field logs (Composite or processed logs get a different designation)
•Create log templates(We will need a list of log names, types and a count of the number of curves of each type)
•FE Analysis done? (computed or processed logs)
•Is the log depth greater than the well total depth?
•Are there decimal/percent issues especially with posrosity logs
•Are there possible duplicate copies of logs?
•Are there suspicious min/max values for the curves?
•Are there unknown/null/ or mismatched units?

21
21ESRI_2006© Chevron 2006
Well pick issues
•Stratigraphic column
•Reverse faults(need to handle multiple z-values)
•Owner/Interpreter
•pick > well total depth
•Time/Age scale
•possible duplication of picks
•suspicious names
•Unknown units
Common QC issues with stratigraphic well picks
•Need to make a Stratigraphic column from list of unique pick names
•Need to identify and handle multiple z-values for Reverse faults
•Who is the Owner/Interpreter of the data, is the data going to be copied to the corporate strat database?
•Is the pick depth greater than the well total depth?
•What is the Time or Age of the pick for the time scale?
•Are there possible duplication of picks? Picks with different names meaning the same horizon?
•Are there suspicious names?
•Are there Unknown units of depth/porosity/perm?

22
22ESRI_2006© Chevron 2006
Stratigraphic nomenclature
Making decisions early about stratigraphy “front-end” loads the process. This avoids changing pick names once the dataset has been loaded to OpenWorks.
OpenWorks database naming for surfaces is consistent, so computer applications run much better.
This technique can be used for both new and existing pick datasets regardless of the size of the datasets.
A set of unique surface names is generated that can be transformed into a stratigraphic column.
•Making decisions early about stratigraphy “front-end” loads the process. This avoids changing pick names once the dataset has been loaded to OpenWorks.•This technique can be used for both new and existing pick datasets regardless of the size of the datasets.•OpenWorks database naming for surfaces is consistent, so computer applications run much better.•Using Microsoft Excel’s PivotTable feature, you can quickly transform a column of data into a list of unique name or numbers with a count of the number of occurrences of each pickname.•Display of OpenWorks picks in StratWorks is controlled by the surfaces in the Stratigraphic Column, the surface names are the key to pick data management.•Use the pickname count to look for “one-off” picks that will create confusion in the database.•A set of unique surface names is generated that can be transformed into a stratigraphic column.•Use the pickname list to generate an StratWorks Stratigraphic Column “.sce” ASCII file.

23
23ESRI_2006© Chevron 2006
Spatial analysis of stratigraphic picks
When concatenating stratigraphic picks from several different interpreters, there are differences in stratigraphic terminology that need to be standardized
Some picks have different names, but represent the same stratigraphic surface
Check spatial distribution of picks for facies-equivalent picks
rename
When concatenting stratigraphic picks from several different interpreters, there are differences in stratigraphic terminology that need to be standardized
Some picks have different names, but represent the same stratigraphic surface
Check spatial distribution of picks for facies-equivalent picks
This example from Iraq shows a shoreface facies in blue, a shallow-water faciesin green and a deep-water facies in yellow. Note the 1 shallow-water pick name in the deep-water facies area.
24
24ESRI_2006© Chevron 2006
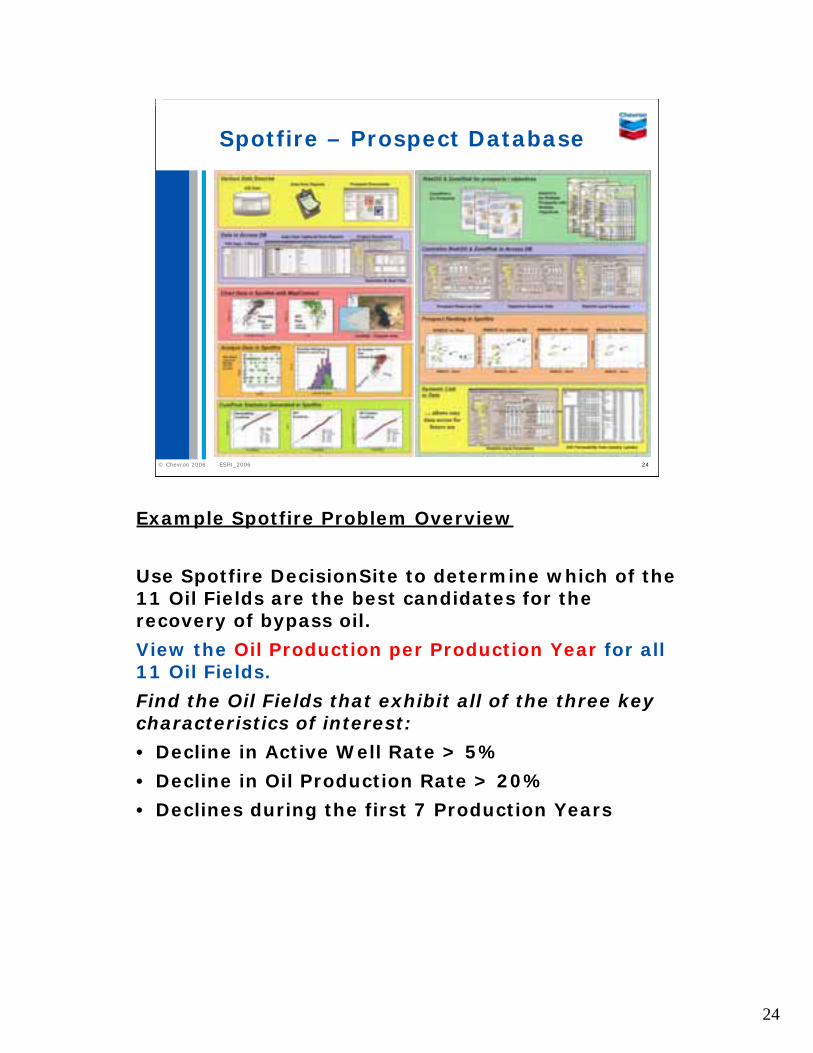
Spotfire – Prospect Database
Example Spotfire Problem Overview
Use Spotfire DecisionSite to determine which of the 11 Oil Fields are the best candidates for the recovery of bypass oil.
View the Oil Production per Production Year for all 11 Oil Fields.
Find the Oil Fields that exhibit all of the three key characteristics of interest:
• Decline in Active Well Rate > 5%
• Decline in Oil Production Rate > 20%
• Declines during the first 7 Production Years

25
25ESRI_2006© Chevron 2006
Metadata ImportImport Metadata Button
•Standard metadata template for your project. Fill in the basic information your company needs for these files.
•Metadata “template” as a html file and import into each project file
•.xml metadata files
•Thumbnail image of the file.
•Catalog files of the Windows/Adobe/Raster Image File Properties

26
26ESRI_2006© Chevron 2006
Conclusions
Analyzing the datasets using basic math and logic algorithms grades the quality of the data, allowing adjustment of difficult interpretation problems to fit the real nature of the dataset.
Using ArcGIS to analyze the various geological datasets before loading the final update files to the exploration interpretation database results in a significant cost-savings compared to correcting duplicate or lower-quality data.
Examples presented
Seismic line selection by cross-referencing vendor and in-house navigation databases
Well location precision analysis
Well location geodetic analysis of vendor and in-house databases
Well header basin and fieldname updates using the ArcToolbox Intersection tool
Spatial analysis of stratigraphic pick distribution
Analyzing the datasets using basic math and logic algorithms grades the quality of the data, allowing adjustment of difficultinterpretation problems to fit the real nature of the dataset.
Using ArcGIS to analyze the various geological datasets beforeloading the final update files to the exploration interpretationdatabase results in a significant cost-savings compared to correcting duplicate or lower-quality data.

27
27ESRI_2006© Chevron 2006
Contact Info
Donald W. DowneyChevron Exploration & Production Technology Company (EPTC)Earth ScientistCA RG #7487 TX RG #1539 AAPG CPG #5838 GISP #51955Earth Science Technology Department (ESD)Exploration and New Ventures Team 6001 Bollinger Canyon Road, C-1188 San Ramon, CA 94583 Tel 925 842 3448 Fax 925 842 3030
mailto:[email protected]
Thanks!