upgrading strategies in global furniture value chains
TRANSCRIPT
Upgrading Strategies in
Global Furniture Value Chains
UNITED NATIONS INDUSTRIAL DEVELOPMENT ORGANIZATION
R e s e a r c h a n d Sta t i s t i c s B r a n c h
w o r k i n g p a p e r 9 / 2 0 0 8

UNITED NATIONS INDUSTRIAL DEVELOPMENT ORGANIZATIONVienna, 2009
RESEARCH AND STATISTICS BRANCHWORKING PAPER 09/2008
Upgrading Strategies in Global Furniture Value Chains
Raphael KaplinskyDPP-Technology
The Open University
Jeff ReadmanCentre for Research in Innovation Management
University of Brighton
Olga MemedovicUNIDO
Acknowledgements�This working paper has been prepared under the guidance of Olga Memedovic, UNIDO project manager in the context of the UNIDO project “Global Value Chains and Production Networks: Prospects for Upgrading by Developing Countries”. Contributors to the paper are Raphael Kaplinsky, DPP-Technology, The Open University, Jeff Readman, Centre for Research in Innovation Management University of Brighton, and Olga Memedovic, UNIDO staff member. Special thanks are due to UNIDO staff members Juergen Martin Hierold and Antonio Levissianos for providing technical inputs in the initial stage of the preparation of this paper, and to Penelope Plowden and Georgina Wilde for their style editing contribution. Iguaraya Saavedra provided administrative support.
The designations employed, descriptions and classifications of countries, and the presentation of the material in this document do not imply the expression of any opinion whatsoever on the part of the Secretariat of the United Nations Industrial Development Organization (UNIDO) concerning the legal status of any country, territory, city or area or of its authorities, or concerning the delimitation of its frontiers or boundaries, or its economic system or degree of development. The responsibility for opinions expressed rests solely with the authors, and publication does not constitute an endorsement by UNIDO of the opinions expressed. Although great care has been taken to maintain the accuracy of information herein, neither UNIDO nor its Member States assume any responsibility for consequences which may arise from the use of the material. This document may be freely quoted or reprinted but acknowledgement is requested. This document has been produced without formal United Nations editing. The views expressed in this document do not necessarily reflect the views of the Secretariat of the United Nations Industrial Development Organization. Terms such as “developed, “industrialized” and “developing” are intended for statistical convenience and do not necessarily express a judgment. Any indication of, or reference to, a country, institution or other legal entity does not constitute an endorsement. This document represents work in process and is intended to generate comment and discussion.�
iii
Contents
1. Introduction.............................................................................................................................1
2. The wood furniture value chain ..............................................................................................3
3. Upgrading in the wood furniture value chain .......................................................................15
4. Buyers in the wood furniture value chain .............................................................................25
5. Case Study: Evaluating upgrading in the UK garden furniture market ................................32
6. UNIDO's role in the wood sector..........................................................................................41
7. Implications for industrial policy..........................................................................................45
8. Conclusion ............................................................................................................................50

1
1. Introduction
Globalization has given producers an opportunity to participate in the global economy. In both
high- and low-income countries, a growing number of firms are targeting external markets to
gain economies of scale and scope as well as further technological expertise. This has increased
competition, in both domestic markets (from imports) and external markets. Thus, for companies
and national economies, globalization offers opportunity and threat.
In order to take advantage of the opportunities presented by globalization and to minimize the
dangers of competition, firms need to innovate.1 The pressures of competition have become so
intense that merely improving the rate of innovation is not enough. If sustainable income growth
is to be achieved, firms need to ensure that their innovative rate is faster than that of their
competitors. They face a moving frontier of “best practice”.
How can it be known if firms have upgraded their activities? Two complementary schools of
thought have addressed this issue in recent years. The first focused on core competences (Hamel
and Prahalad, 1994). Firms need to identify which of their attributes provide value to the final
customer, are relatively rare in the sense that few competitors possess them and are difficult to
copy, that is, where there are barriers to entry. In this framework, the capacity to innovate comes
from concentration in these competences and outsourcing those functions that do not meet the
three criteria. A useful supplement to this line of thought is that in a dynamic world, core
competences can easily become core rigidities and part of the task of upgrading is to relinquish
areas of past expertise (Leonard-Barton, 1995).
Closely related to this is the analysis of dynamic capabilities (Teece, Pisano and Shuen, 1997a).
It argues that corporate profitability cannot be sustained by control over the market, by using
quasi-monopolistic practices for example, but rather by the development of dynamic capabilities.
These are the result of a firm’s internal processes, which facilitate learning, including: the
capacity to reconfigure what it has done in the past; its position, that is, its access to specific
competences either within its own activities, or those which are drawn from the regional or
national system of innovation; and its path, that is, its trajectory, because change is always path-
dependent.
1 In this chapter the terms “innovate” and “upgrade” are used interchangeably. While they overlap in meaning, “upgrade” goes beyond “innovate” in suggesting relative performance that is faster innovation than a defined competitor or group of competitors.
2
Both of these concepts provide an important backdrop for understanding the phenomenon of
upgrading. They are especially helpful in identifying those factors that arise from the activities of
a firm itself and drive or facilitate product and process improvements. But where they are
relatively weak is that they look at the firm only, and fail to capture upgrading processes which
are systemic in nature and which involve groups of firms linked together.
Value chain analysis has two important elements that aid the understanding of this systemic
upgrading challenge. First, it helps to show how competitiveness is defined not only by the
actions of an individual firm, but also by the suppliers and buyers who ultimately deliver the
product to the final customer. As such, it provides taxonomy for upgrading which incorporates
not just the efforts of many linked firms but also their functional positions in the chain. And,
second, it brings in agency, and in particular it identifies the critical role played by lead firms that
take responsibility for enhancing systemic chain competitiveness.
It is possible to identify four trajectories that firms can adopt when upgrading. These are process
upgrading, product upgrading, functional upgrading and chain upgrading. The first two are
readily understood in the light of the core competences and dynamic capabilities literature and
innovation studies. What the value chain perspective offers is an insight into the second two.
Functional upgrading involves firms engaging in a different mix of activities, both within their
individual link (or function) and by moving to other links in the value chain. In some cases,
barriers to entry in a particular chain may be so low that there are few prospects of upgrading. In
this case, upgrading may imply the ability to move to a new chain.
Underpinning this upgrading framework is a classification methodology. We introduce a method
that interrogates trade data to measure different types of upgrading for a significant number of
countries. This analyse, while still time consuming, is made possible because countries are
moving towards a universally accepted norm of collecting and classifying imports and exports.
Furthermore, this classification is disaggregated to levels which allow us to interpret flows of
trade for specific product and service markets. This paper is the first attempt of applying a
theoretical framework using empirical data and, as with any quantitative exercise, the method
and the findings should be considered equally. The framework and proposed measures of
upgrading can be used not only to update trends in the furniture value chain with future trade
data but the method can also be applied to other product and service markets. The findings from
this application nevertheless reveal upgrading trends of country producers in furniture product
markets during a specific period.
3
This paper looks at the challenges facing the wood furniture value chain and how it can rise to
them. The second section describes the value chain of this traditional industry and shows how its
size makes it a suitable model for many low-income economies. The third section identifies
successful paths of upgrading in the furniture value chain, and analyses the winners and losers in
its globalization. The fourth section provides insights into the roles played by buyers in
determining upgrading paths. We illustrate the role of buyers with a case study which depicts the
interplay between a furniture buyer in the UK and producers in Asia and Africa. The sixth and
seventh sections give an assessment of the implications this analysis holds for industrial policy
and for UNIDO and other international organizations.
2. The wood furniture value chain
The wood furniture value chain gives important insights into the upgrading challenge facing
producers in low-income economies. Wood furniture is a large and rapidly globalizing sector. It
provides for a range of technical choices in production and this, together with increasingly varied
products, allows for competitive production by high-, medium- and low-income economies. In
other words, there is scope for the widening of capabilities over time. The introduction of new
technology and the fact that it is a discrete-products industry assembling products from
components also allow for an extended inter-firm division of labour, with producers able to
specialize in numerous links in the value chain. Finally, it is resource-intensive, which provides
opportunities for many tropical countries where timber grows rapidly and cheaply.
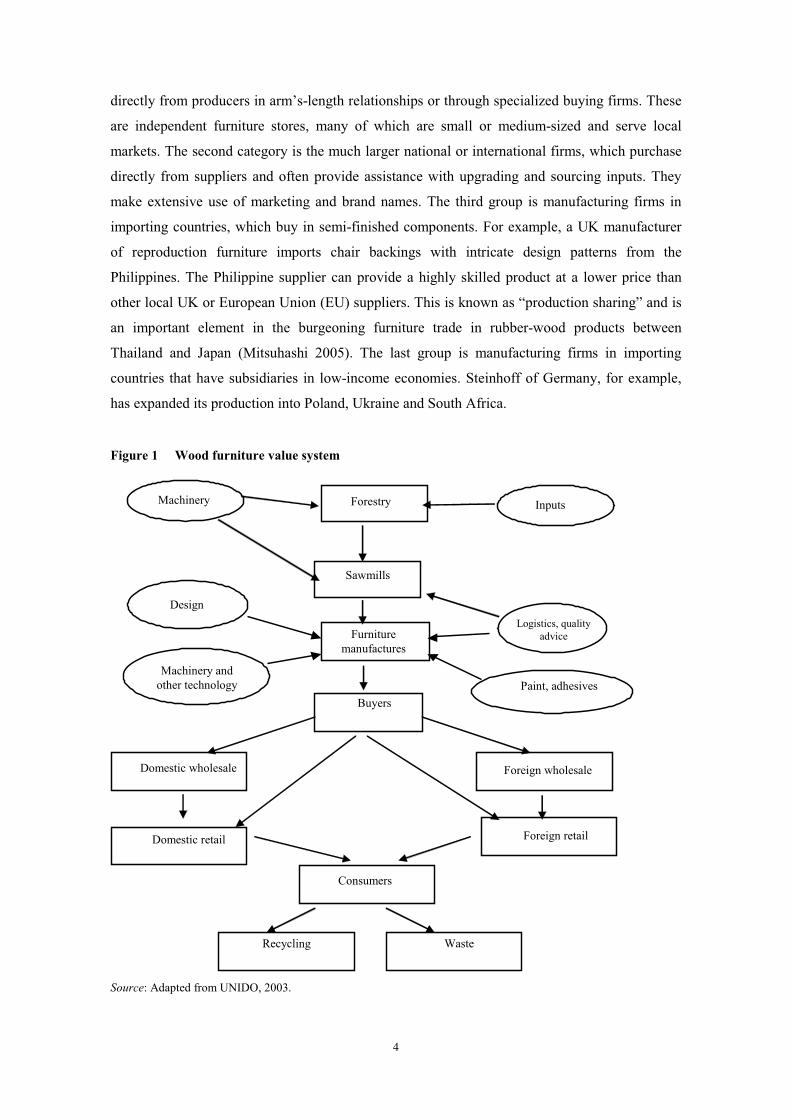
Figure 1 gives a broad outline of the wood furniture value chain. Raw materials such as seed
inputs, chemicals, equipment and water feed into the forestry sector. Wood flows to the
sawmills, and sawn timber and intermediate wood products move to the furniture manufacturers
that, in turn, obtain inputs from the machinery, textiles, plastics, adhesives and paint industries.
The furniture industry also draws on design and branding skills from the service sector.
Depending on which market is served, the furniture passes through various intermediary buying
stages until it reaches the final customer. The buying function is represented by a dotted box in
order to emphasize that several organization types including wholesalers, retailers and
independent buyers can manage this function. And, finally, customers either recycle or dispose
of the furniture.
Factors contributing to the globalization of the wood furniture value chains
The wood furniture value chain is increasingly global. Seen from the buyer end, there are four
distinct globalizing categories. The first involves firms that have little or no part in production or
in the organization and coordination of global production networks. They buy furniture either
4
directly from producers in arm’s-length relationships or through specialized buying firms. These
are independent furniture stores, many of which are small or medium-sized and serve local
markets. The second category is the much larger national or international firms, which purchase
directly from suppliers and often provide assistance with upgrading and sourcing inputs. They
make extensive use of marketing and brand names. The third group is manufacturing firms in
importing countries, which buy in semi-finished components. For example, a UK manufacturer
of reproduction furniture imports chair backings with intricate design patterns from the
Philippines. The Philippine supplier can provide a highly skilled product at a lower price than
other local UK or European Union (EU) suppliers. This is known as “production sharing” and is
an important element in the burgeoning furniture trade in rubber-wood products between
Thailand and Japan (Mitsuhashi 2005). The last group is manufacturing firms in importing
countries that have subsidiaries in low-income economies. Steinhoff of Germany, for example,
has expanded its production into Poland, Ukraine and South Africa.
Figure 1 Wood furniture value system
Source: Adapted from UNIDO, 2003.
ForestryMachinery
Furniture manufactures
DesignLogistics, quality
advice
Machinery and other technology Paint, adhesives
Buyers
Domestic wholesale Foreign wholesale
Domestic retail Foreign retail
Consumers
Recycling
Inputs
Waste
Sawmills
5
Underlying the growing global division of labour has been a series of changes in technology and
organization. These advances reflect the transfer of practices from other industries and include
the following:2
• Computer-numerically-controlled (CNC) woodworking machinery enhances
productivity, reduces waste, improves time-to-market and facilitates modular production
of non-standardized items.
• Computer-aided design and manufacturing (CAD and CAM) allow designs to be fed to
manufacturing firms anywhere in the world, giving significant improvements in quality
and productivity.
• The introduction of flat-pack or RTA (ready-to-assemble) furniture led to an important
change in furniture production methods. RTA-designed furniture, with standard shapes
and sizes and high volume demand, allowed factories to take advantage of design-for-
manufacturing processes. It also dramatically cut the cost of shipping bulky products.
• The development of flat-pack furniture was critically dependent on advances in material
technology, such as MDF (multi-density fibreboard), which, in addition to using offcuts
and waste, allows the optimal use of forestry products.
• Flexible manufacturing systems (FMS) and cellular plant layout improve the flow of
furniture parts through the plant, enhancing flexibility and quality, and reducing
inventories and costs.
• Made-to-order and just-in-time distribution systems reduce inventory levels of raw
material inputs and finished items.
These technological and organizational innovations encouraged the growing globalization of the
furniture sector. It enabled producers in high-wage economies to reduce their costs significantly.
The share of wages in company sales in European manufacturing firms fell from around 50 per
cent in the 1960s to 28 per cent in the mid 1990s (European Commission 1997). But,
simultaneously, it enabled low-income and resource-intensive economies to become increasingly
active participants in the global chain.
Another factor facilitating globalization has been the growth of concentrated buying power in
final markets. This is part of a much larger phenomenon, spanning many areas of final
consumption (Feenstra and Hamilton 2005; Kaplinsky 2005). For example, in Germany there are
more than 15,000 furniture stores employing over 110,000 people, but the buying groups
(Einkaufsverbände) and their affiliates control 60 per cent of the market. The majority of retailers
2 Company interviews and industry reports. See European Commission, 1997.
6
and manufacturers are connected with these groups. Similar buyer concentration occurs in other
countries, including the UK where retail multiples control 40 per cent of the furniture market.
Intensification of global trade in furniture
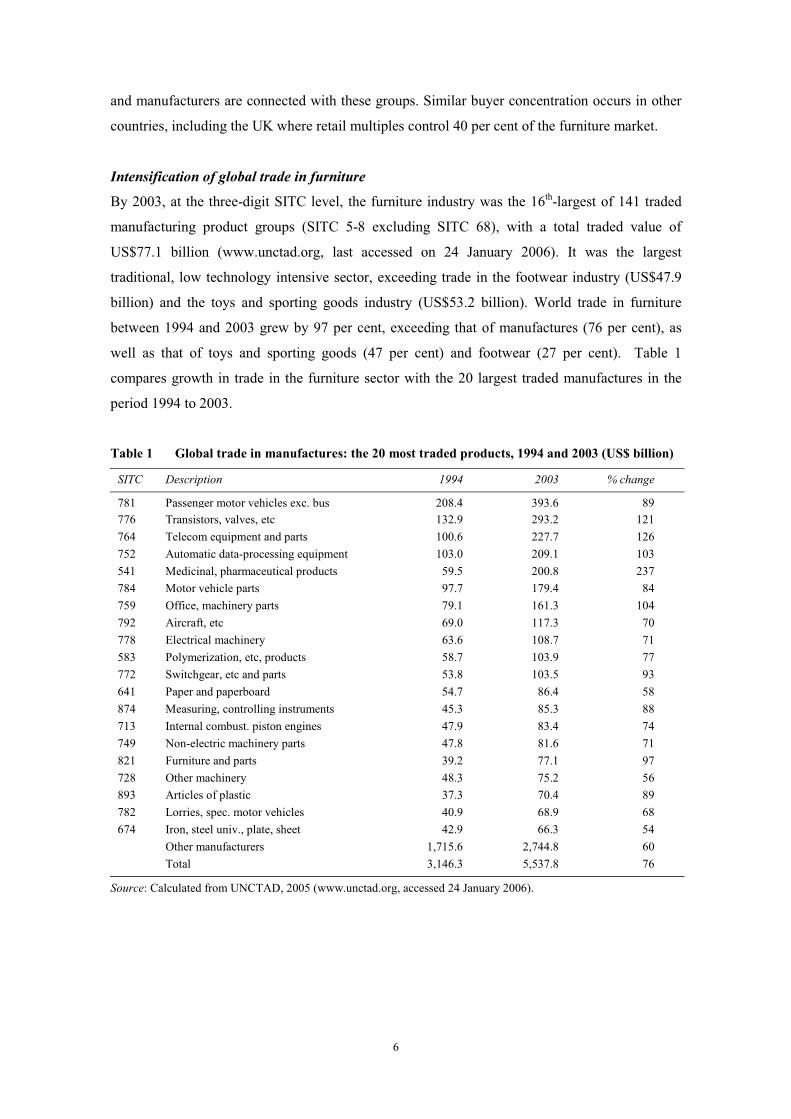
By 2003, at the three-digit SITC level, the furniture industry was the 16th-largest of 141 traded
manufacturing product groups (SITC 5-8 excluding SITC 68), with a total traded value of
US$77.1 billion (www.unctad.org, last accessed on 24 January 2006). It was the largest
traditional, low technology intensive sector, exceeding trade in the footwear industry (US$47.9
billion) and the toys and sporting goods industry (US$53.2 billion). World trade in furniture
between 1994 and 2003 grew by 97 per cent, exceeding that of manufactures (76 per cent), as
well as that of toys and sporting goods (47 per cent) and footwear (27 per cent). Table 1
compares growth in trade in the furniture sector with the 20 largest traded manufactures in the
period 1994 to 2003.
Table 1 Global trade in manufactures: the 20 most traded products, 1994 and 2003 (US$ billion)
SITC Description 1994 2003 % change
781 Passenger motor vehicles exc. bus 208.4 393.6 89776 Transistors, valves, etc 132.9 293.2 121 764 Telecom equipment and parts 100.6 227.7 126 752 Automatic data-processing equipment 103.0 209.1 103 541 Medicinal, pharmaceutical products 59.5 200.8 237 784 Motor vehicle parts 97.7 179.4 84 759 Office, machinery parts 79.1 161.3 104 792 Aircraft, etc 69.0 117.3 70 778 Electrical machinery 63.6 108.7 71 583 Polymerization, etc, products 58.7 103.9 77 772 Switchgear, etc and parts 53.8 103.5 93 641 Paper and paperboard 54.7 86.4 58 874 Measuring, controlling instruments 45.3 85.3 88713 Internal combust. piston engines 47.9 83.4 74 749 Non-electric machinery parts 47.8 81.6 71 821 Furniture and parts 39.2 77.1 97 728 Other machinery 48.3 75.2 56 893 Articles of plastic 37.3 70.4 89 782 Lorries, spec. motor vehicles 40.9 68.9 68 674 Iron, steel univ., plate, sheet 42.9 66.3 54 Other manufacturers 1,715.6 2,744.8 60 Total 3,146.3 5,537.8 76
Source: Calculated from UNCTAD, 2005 (www.unctad.org, accessed 24 January 2006).
7
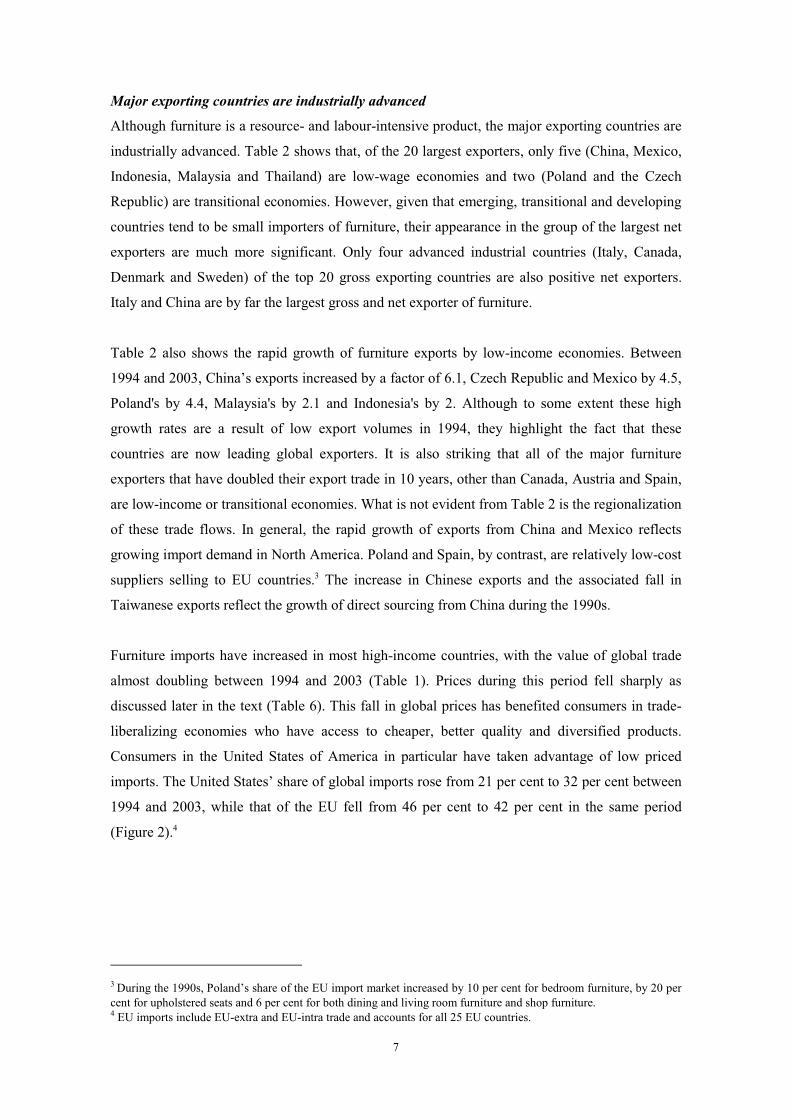
Major exporting countries are industrially advanced
Although furniture is a resource- and labour-intensive product, the major exporting countries are
industrially advanced. Table 2 shows that, of the 20 largest exporters, only five (China, Mexico,
Indonesia, Malaysia and Thailand) are low-wage economies and two (Poland and the Czech
Republic) are transitional economies. However, given that emerging, transitional and developing
countries tend to be small importers of furniture, their appearance in the group of the largest net
exporters are much more significant. Only four advanced industrial countries (Italy, Canada,
Denmark and Sweden) of the top 20 gross exporting countries are also positive net exporters.
Italy and China are by far the largest gross and net exporter of furniture.
Table 2 also shows the rapid growth of furniture exports by low-income economies. Between
1994 and 2003, China’s exports increased by a factor of 6.1, Czech Republic and Mexico by 4.5,
Poland's by 4.4, Malaysia's by 2.1 and Indonesia's by 2. Although to some extent these high
growth rates are a result of low export volumes in 1994, they highlight the fact that these
countries are now leading global exporters. It is also striking that all of the major furniture
exporters that have doubled their export trade in 10 years, other than Canada, Austria and Spain,
are low-income or transitional economies. What is not evident from Table 2 is the regionalization
of these trade flows. In general, the rapid growth of exports from China and Mexico reflects
growing import demand in North America. Poland and Spain, by contrast, are relatively low-cost
suppliers selling to EU countries.3 The increase in Chinese exports and the associated fall in
Taiwanese exports reflect the growth of direct sourcing from China during the 1990s.
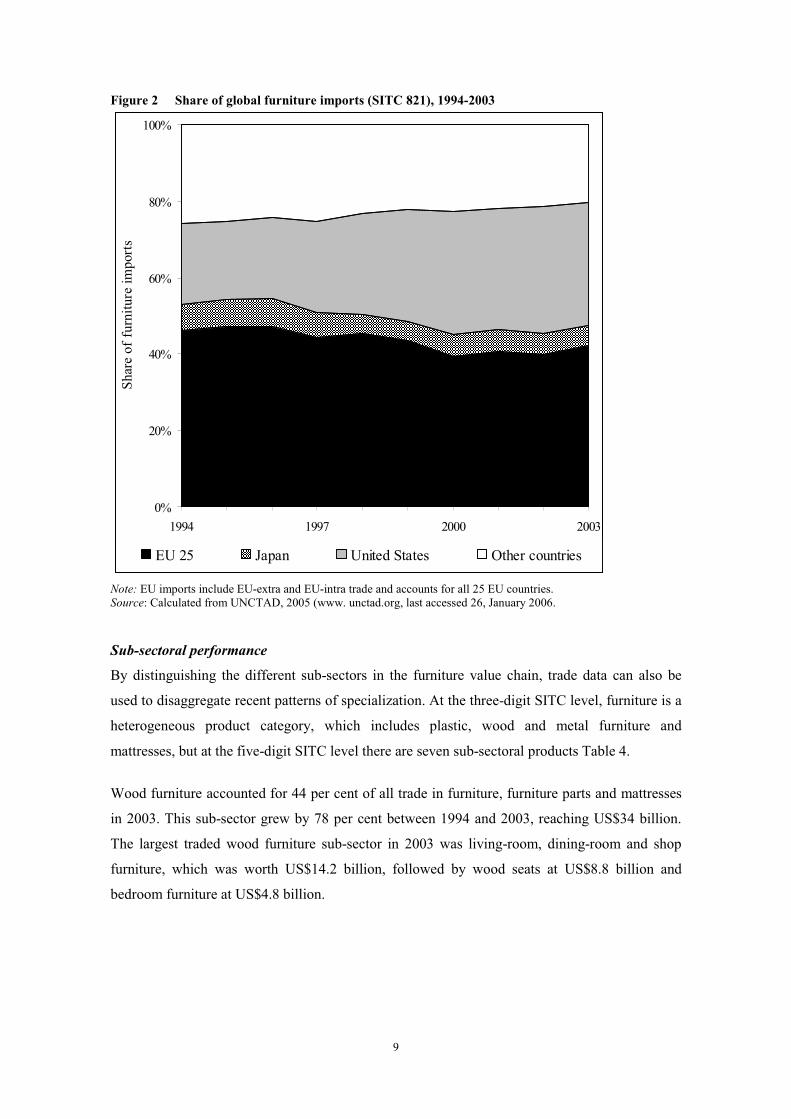
Furniture imports have increased in most high-income countries, with the value of global trade
almost doubling between 1994 and 2003 (Table 1). Prices during this period fell sharply as
discussed later in the text (Table 6). This fall in global prices has benefited consumers in trade-
liberalizing economies who have access to cheaper, better quality and diversified products.
Consumers in the United States of America in particular have taken advantage of low priced
imports. The United States’ share of global imports rose from 21 per cent to 32 per cent between
1994 and 2003, while that of the EU fell from 46 per cent to 42 per cent in the same period
(Figure 2).4
3 During the 1990s, Poland’s share of the EU import market increased by 10 per cent for bedroom furniture, by 20 per cent for upholstered seats and 6 per cent for both dining and living room furniture and shop furniture. 4 EU imports include EU-extra and EU-intra trade and accounts for all 25 EU countries.
8
Table 2 Value of global furniture trade (SITC 821): the leading 20 exporting countries, 1994 and 2003 (US$ million)
Gross exports
1994 Gross exports
2003 % change Net exports
2003
Italy 6,669.3 9,980.7 50 8,615.8
China 1,494.1 9,062.2 507 8,501.8
Germany 3,994.5 6,504.5 63 -1,887.9
Canada 2,158.3 4,963.6 130 1,585.0
United States 3,449.6 4,614.9 34 -22,392.0
Poland 893.7 3,896.7 336 3,269.5
Mexico 840.9 3,747.4 346 2,612.5
France 1,760.9 2,688.4 53 -2,314.2
Denmark 1,777.6 2,455.7 38 1,517.6
Belgium and Luxembourg 1,497.3 2,049.1 37 -535.8
Spain 721.1 1,751.0 143 -25.4
Malaysia 767.7 1,617.1 111 1,414.4
Austria 670.0 1,591.3 137 -103.3
Indonesia 783.4 1,577.8 101 1,547.8
United Kingdom 1,096.8 1,529.0 39 -4,327.5
Sweden 984.6 1,495.4 52 94.3
Czech Republic 288.5 1,295.4 349 759.3
China, Taiwan Province of 1,798.2 1,198.2 -33 937.3
Netherlands 864.5 1,075.6 24 -1,112.9
Thailand 707.8 1,043.6 47 951.8
Other countries 5,953.9 12,843.5 116
World 39,189.9 77,072.8 97
Source: Calculated from UNCTAD, 2005 (www.unctad.org last accessed 25 January 2006).
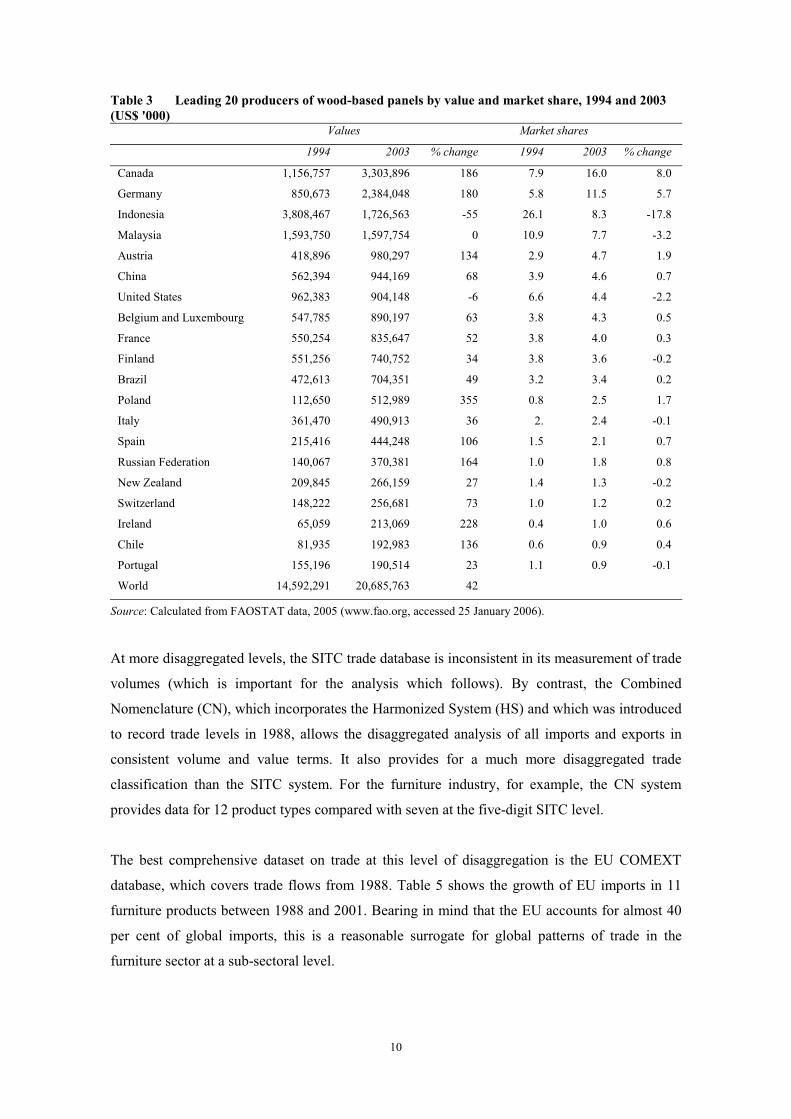
Intermediate products such as wood-based panels consisting of veneer sheets, plywood, particle
board, hardboard, MDF, compressed fibreboard and insulating board also showed rapid growth
between 1994 and 2003. Global exports of wood-based panels were US$20.6 billion in 2004, a
rise of 42 per cent since 1994 (Table 3). Although some initially low-income economies, notably
Poland, Chile, and Russian Federation saw good export growth, the stellar performers tended to
be high-income economies (Canada, Germany, Austria and Ireland). Some low-income
economies experienced a fall or stagnation in the value of their exports; for example, Indonesia
and Malaysia’s market share declined by 18 per cent and 3 per cent respectively, while Brazil’s
share remained relatively unchanged.
9
Figure 2 Share of global furniture imports (SITC 821), 1994-2003
0%
20%
40%
60%
80%
100%
1994 1997 2000 2003
Shar
e of
furn
iture
impo
rts
EU 25 Japan United States Other countries
Note: EU imports include EU-extra and EU-intra trade and accounts for all 25 EU countries. Source: Calculated from UNCTAD, 2005 (www. unctad.org, last accessed 26, January 2006.
Sub-sectoral performance
By distinguishing the different sub-sectors in the furniture value chain, trade data can also be
used to disaggregate recent patterns of specialization. At the three-digit SITC level, furniture is a
heterogeneous product category, which includes plastic, wood and metal furniture and
mattresses, but at the five-digit SITC level there are seven sub-sectoral products Table 4.
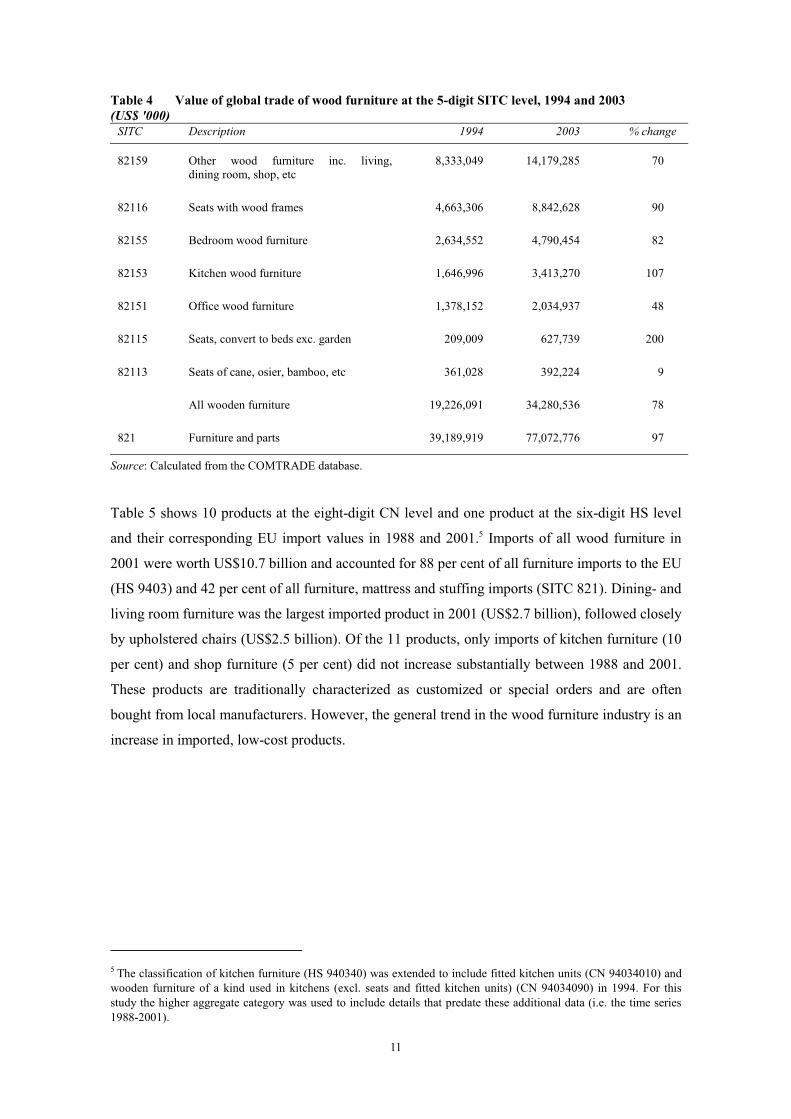
Wood furniture accounted for 44 per cent of all trade in furniture, furniture parts and mattresses
in 2003. This sub-sector grew by 78 per cent between 1994 and 2003, reaching US$34 billion.
The largest traded wood furniture sub-sector in 2003 was living-room, dining-room and shop
furniture, which was worth US$14.2 billion, followed by wood seats at US$8.8 billion and
bedroom furniture at US$4.8 billion.
10
Table 3 Leading 20 producers of wood-based panels by value and market share, 1994 and 2003 (US$ '000)
Values Market shares
1994 2003 % change 1994 2003 % change
Canada 1,156,757 3,303,896 186 7.9 16.0 8.0
Germany 850,673 2,384,048 180 5.8 11.5 5.7
Indonesia 3,808,467 1,726,563 -55 26.1 8.3 -17.8
Malaysia 1,593,750 1,597,754 0 10.9 7.7 -3.2
Austria 418,896 980,297 134 2.9 4.7 1.9
China 562,394 944,169 68 3.9 4.6 0.7
United States 962,383 904,148 -6 6.6 4.4 -2.2
Belgium and Luxembourg 547,785 890,197 63 3.8 4.3 0.5
France 550,254 835,647 52 3.8 4.0 0.3
Finland 551,256 740,752 34 3.8 3.6 -0.2
Brazil 472,613 704,351 49 3.2 3.4 0.2
Poland 112,650 512,989 355 0.8 2.5 1.7
Italy 361,470 490,913 36 2. 2.4 -0.1
Spain 215,416 444,248 106 1.5 2.1 0.7
Russian Federation 140,067 370,381 164 1.0 1.8 0.8
New Zealand 209,845 266,159 27 1.4 1.3 -0.2
Switzerland 148,222 256,681 73 1.0 1.2 0.2
Ireland 65,059 213,069 228 0.4 1.0 0.6
Chile 81,935 192,983 136 0.6 0.9 0.4
Portugal 155,196 190,514 23 1.1 0.9 -0.1
World 14,592,291 20,685,763 42
Source: Calculated from FAOSTAT data, 2005 (www.fao.org, accessed 25 January 2006).
At more disaggregated levels, the SITC trade database is inconsistent in its measurement of trade
volumes (which is important for the analysis which follows). By contrast, the Combined
Nomenclature (CN), which incorporates the Harmonized System (HS) and which was introduced
to record trade levels in 1988, allows the disaggregated analysis of all imports and exports in
consistent volume and value terms. It also provides for a much more disaggregated trade
classification than the SITC system. For the furniture industry, for example, the CN system
provides data for 12 product types compared with seven at the five-digit SITC level.
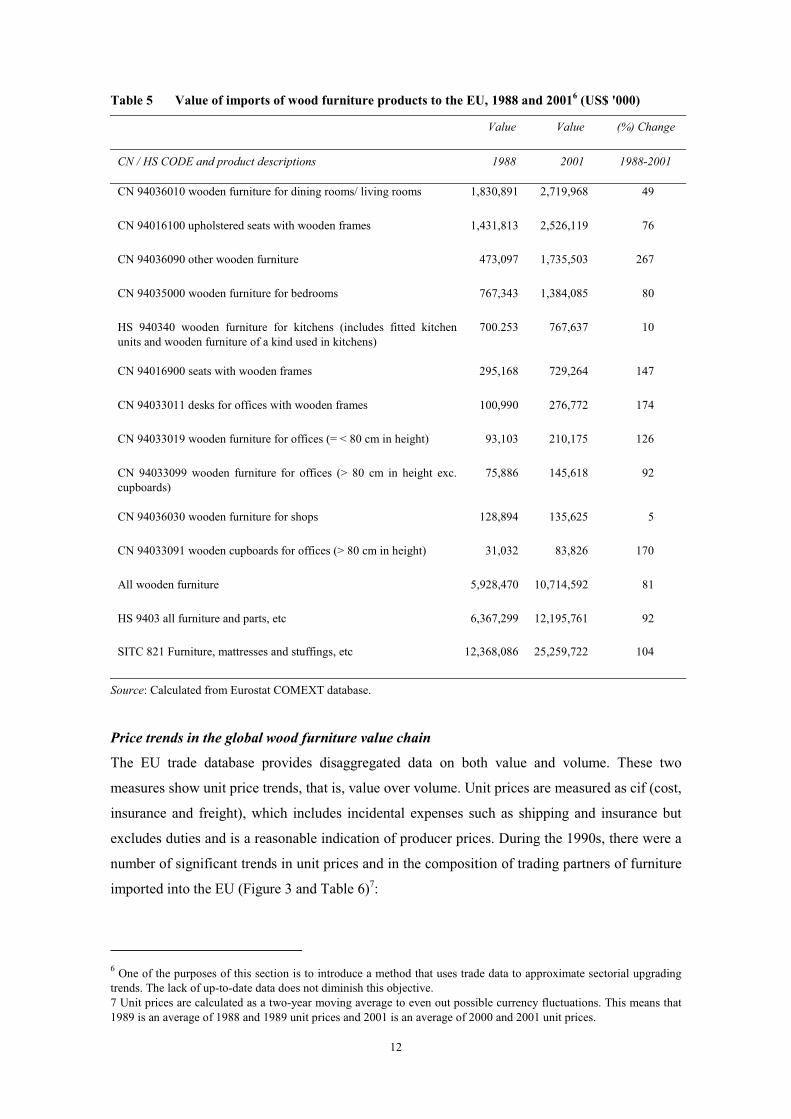
The best comprehensive dataset on trade at this level of disaggregation is the EU COMEXT
database, which covers trade flows from 1988. Table 5 shows the growth of EU imports in 11
furniture products between 1988 and 2001. Bearing in mind that the EU accounts for almost 40
per cent of global imports, this is a reasonable surrogate for global patterns of trade in the
furniture sector at a sub-sectoral level.
11
Table 4 Value of global trade of wood furniture at the 5-digit SITC level, 1994 and 2003 (US$ '000)
SITC Description 1994 2003 % change
82159 Other wood furniture inc. living, dining room, shop, etc
8,333,049 14,179,285 70
82116 Seats with wood frames 4,663,306 8,842,628 90
82155 Bedroom wood furniture 2,634,552 4,790,454 82
82153 Kitchen wood furniture 1,646,996 3,413,270 107
82151 Office wood furniture 1,378,152 2,034,937 48
82115 Seats, convert to beds exc. garden 209,009 627,739 200
82113 Seats of cane, osier, bamboo, etc 361,028 392,224 9
All wooden furniture 19,226,091 34,280,536 78
821 Furniture and parts 39,189,919 77,072,776 97
Source: Calculated from the COMTRADE database.
Table 5 shows 10 products at the eight-digit CN level and one product at the six-digit HS level
and their corresponding EU import values in 1988 and 2001.5 Imports of all wood furniture in
2001 were worth US$10.7 billion and accounted for 88 per cent of all furniture imports to the EU
(HS 9403) and 42 per cent of all furniture, mattress and stuffing imports (SITC 821). Dining- and
living room furniture was the largest imported product in 2001 (US$2.7 billion), followed closely
by upholstered chairs (US$2.5 billion). Of the 11 products, only imports of kitchen furniture (10
per cent) and shop furniture (5 per cent) did not increase substantially between 1988 and 2001.
These products are traditionally characterized as customized or special orders and are often
bought from local manufacturers. However, the general trend in the wood furniture industry is an
increase in imported, low-cost products.
5 The classification of kitchen furniture (HS 940340) was extended to include fitted kitchen units (CN 94034010) and wooden furniture of a kind used in kitchens (excl. seats and fitted kitchen units) (CN 94034090) in 1994. For this study the higher aggregate category was used to include details that predate these additional data (i.e. the time series 1988-2001).
12
Table 5 Value of imports of wood furniture products to the EU, 1988 and 20016 (US$ '000)
Value Value (%) Change
CN / HS CODE and product descriptions 1988 2001 1988-2001
CN 94036010 wooden furniture for dining rooms/ living rooms 1,830,891 2,719,968 49
CN 94016100 upholstered seats with wooden frames 1,431,813 2,526,119 76
CN 94036090 other wooden furniture 473,097 1,735,503 267
CN 94035000 wooden furniture for bedrooms 767,343 1,384,085 80
HS 940340 wooden furniture for kitchens (includes fitted kitchen units and wooden furniture of a kind used in kitchens)
700.253 767,637 10
CN 94016900 seats with wooden frames 295,168 729,264 147
CN 94033011 desks for offices with wooden frames 100,990 276,772 174
CN 94033019 wooden furniture for offices (= < 80 cm in height) 93,103 210,175 126
CN 94033099 wooden furniture for offices (> 80 cm in height exc. cupboards)
75,886 145,618 92
CN 94036030 wooden furniture for shops 128,894 135,625 5
CN 94033091 wooden cupboards for offices (> 80 cm in height) 31,032 83,826 170
All wooden furniture 5,928,470 10,714,592 81
HS 9403 all furniture and parts, etc 6,367,299 12,195,761 92
SITC 821 Furniture, mattresses and stuffings, etc 12,368,086 25,259,722 104
Source: Calculated from Eurostat COMEXT database.
Price trends in the global wood furniture value chain
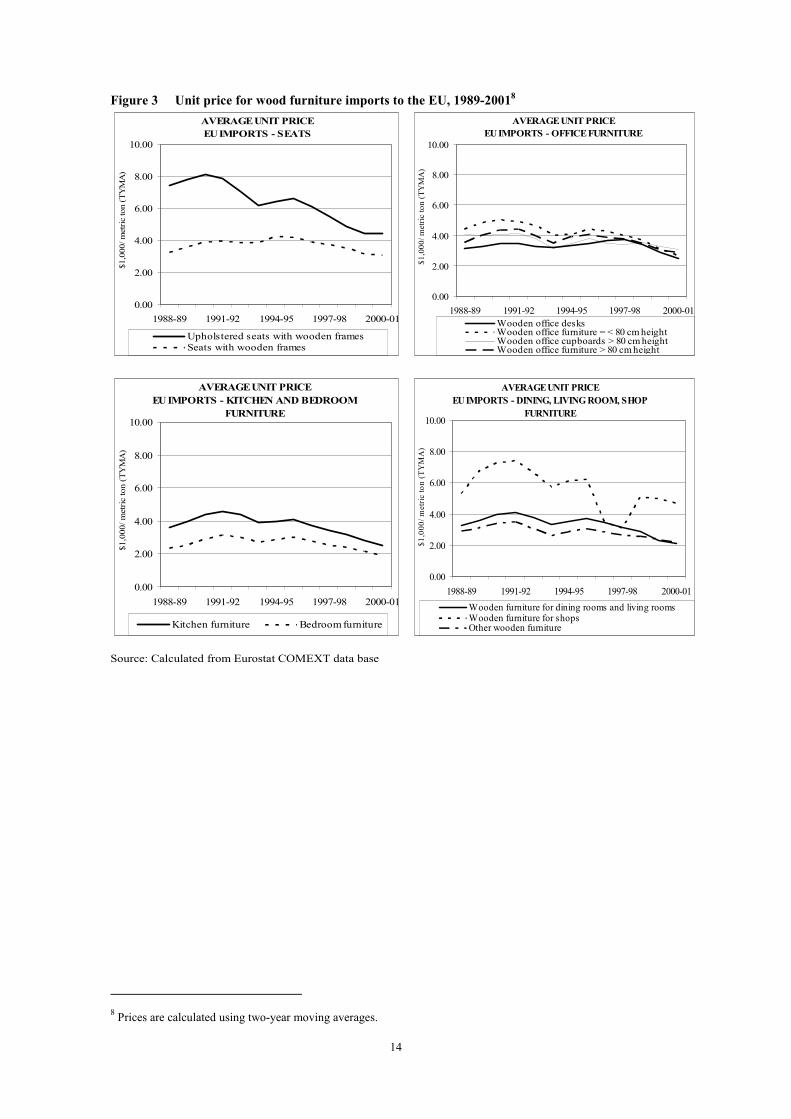
The EU trade database provides disaggregated data on both value and volume. These two
measures show unit price trends, that is, value over volume. Unit prices are measured as cif (cost,
insurance and freight), which includes incidental expenses such as shipping and insurance but
excludes duties and is a reasonable indication of producer prices. During the 1990s, there were a
number of significant trends in unit prices and in the composition of trading partners of furniture
imported into the EU (Figure 3 and Table 6)7:
6 One of the purposes of this section is to introduce a method that uses trade data to approximate sectorial upgrading trends. The lack of up-to-date data does not diminish this objective. 7 Unit prices are calculated as a two-year moving average to even out possible currency fluctuations. This means that 1989 is an average of 1988 and 1989 unit prices and 2001 is an average of 2000 and 2001 unit prices.
13
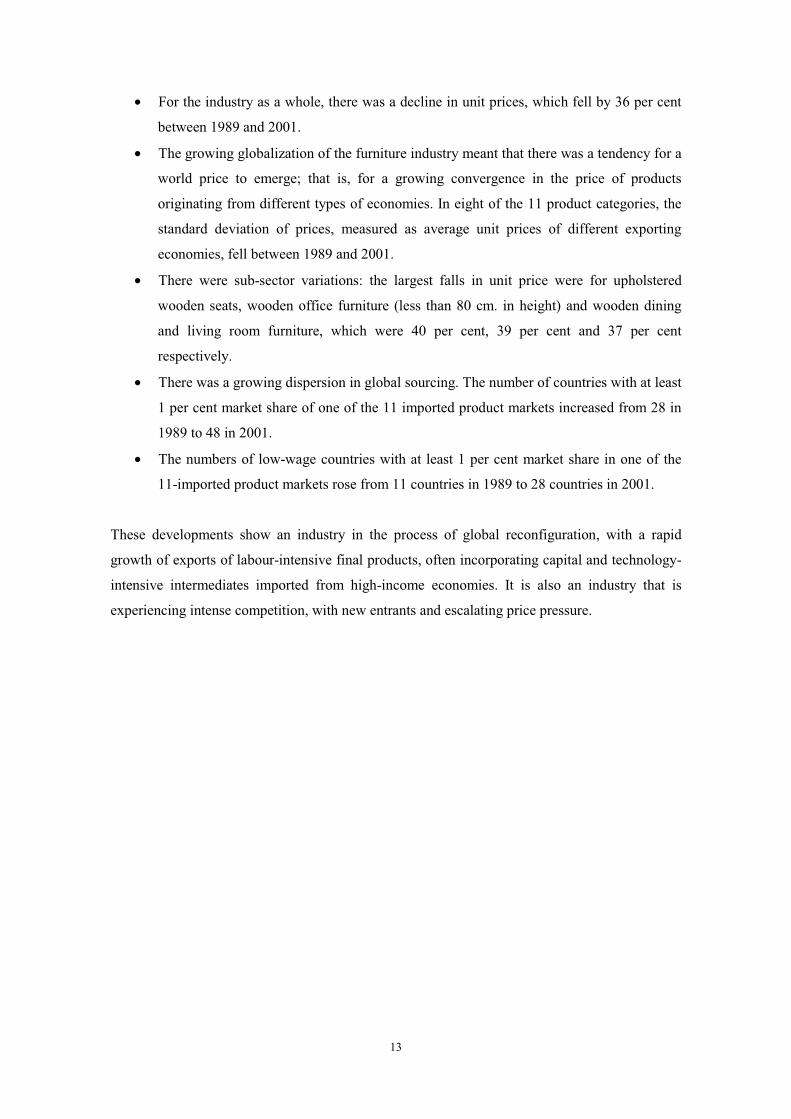
• For the industry as a whole, there was a decline in unit prices, which fell by 36 per cent
between 1989 and 2001.
• The growing globalization of the furniture industry meant that there was a tendency for a
world price to emerge; that is, for a growing convergence in the price of products
originating from different types of economies. In eight of the 11 product categories, the
standard deviation of prices, measured as average unit prices of different exporting
economies, fell between 1989 and 2001.
• There were sub-sector variations: the largest falls in unit price were for upholstered
wooden seats, wooden office furniture (less than 80 cm. in height) and wooden dining
and living room furniture, which were 40 per cent, 39 per cent and 37 per cent
respectively.
• There was a growing dispersion in global sourcing. The number of countries with at least
1 per cent market share of one of the 11 imported product markets increased from 28 in
1989 to 48 in 2001.
• The numbers of low-wage countries with at least 1 per cent market share in one of the
11-imported product markets rose from 11 countries in 1989 to 28 countries in 2001.
These developments show an industry in the process of global reconfiguration, with a rapid
growth of exports of labour-intensive final products, often incorporating capital and technology-
intensive intermediates imported from high-income economies. It is also an industry that is
experiencing intense competition, with new entrants and escalating price pressure.
14
AVERAGE UNIT PRICEEU IMPORTS - SEATS
0.00
2.00
4.00
6.00
8.00
10.00
1988-89 1991-92 1994-95 1997-98 2000-01
$1,0
00/ m
etric
ton
(TY
MA
)
Upholstered seats with wooden frames Seats with wooden frames
AVERAGE UNIT PRICEEU IMPORTS - OFFICE FURNITURE
0.00
2.00
4.00
6.00
8.00
10.00
1988-89 1991-92 1994-95 1997-98 2000-01
$1,0
00/ m
etric
ton
(TY
MA
)
Wooden office desksWooden office furniture = < 80 cm heightWooden office cupboards > 80 cm heightWooden office furniture > 80 cm height
AVERAGE UNIT PRICEEU IMPORTS - KITCHEN AND BEDROOM
FURNITURE
0.00
2.00
4.00
6.00
8.00
10.00
1988-89 1991-92 1994-95 1997-98 2000-01
$1,0
00/ m
etric
ton
(TY
MA
)
Kitchen furniture Bedroom furniture
AVERAGE UNIT PRICEEU IMPORTS - DINING, LIVING ROOM, SHOP
FURNITURE
0.00
2.00
4.00
6.00
8.00
10.00
1988-89 1991-92 1994-95 1997-98 2000-01
$1,0
00/ m
etric
ton
(TY
MA
)
Wooden furniture for dining rooms and living rooms Wooden furniture for shops Other wooden furniture
Source: Calculated from Eurostat COMEXT data base
Figure 3 Unit price for wood furniture imports to the EU, 1989-20018
8 Prices are calculated using two-year moving averages.
15
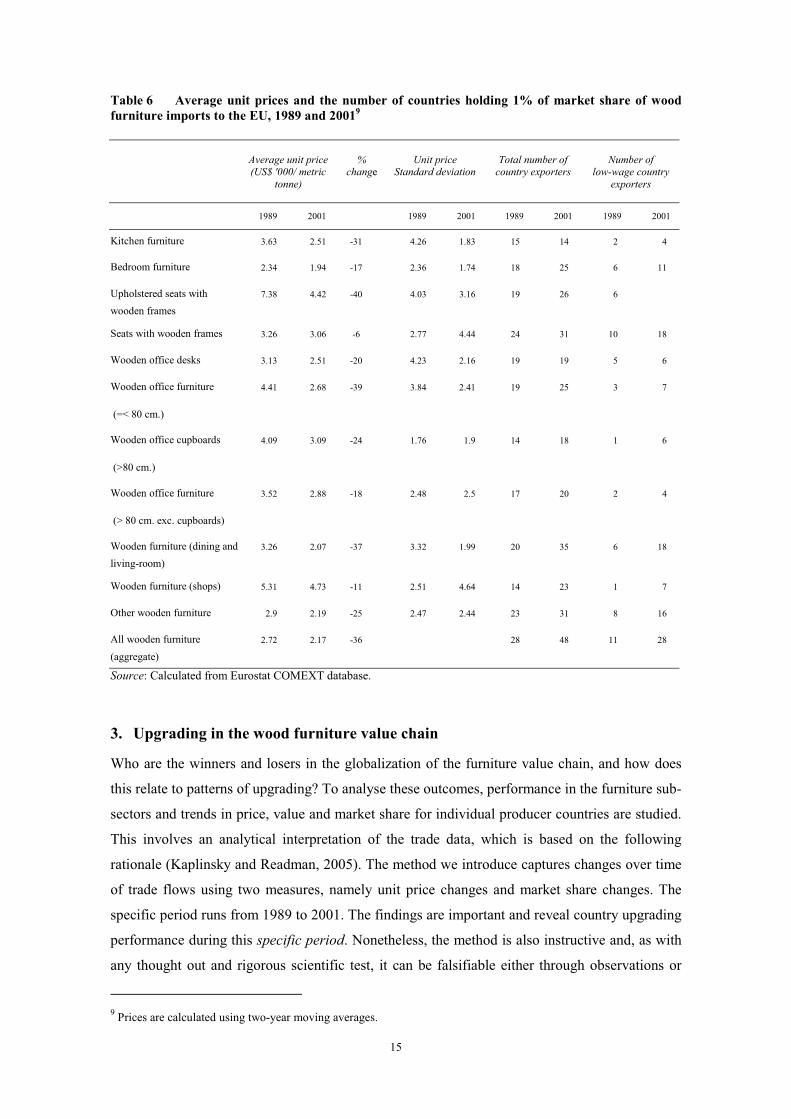
Table 6 Average unit prices and the number of countries holding 1% of market share of wood furniture imports to the EU, 1989 and 20019
Average unit price (US$ '000/ metric
tonne)
% change
Unit price Standard deviation
Total number of country exporters
Number of low-wage country
exporters
1989 2001 1989 2001 1989 2001 1989 2001
Kitchen furniture 3.63 2.51 -31 4.26 1.83 15 14 2 4
Bedroom furniture 2.34 1.94 -17 2.36 1.74 18 25 6 11
Upholstered seats with wooden frames
7.38 4.42 -40 4.03 3.16 19 26 6
Seats with wooden frames 3.26 3.06 -6 2.77 4.44 24 31 10 18
Wooden office desks 3.13 2.51 -20 4.23 2.16 19 19 5 6
Wooden office furniture
(=< 80 cm.)
4.41 2.68 -39 3.84 2.41 19 25 3 7
Wooden office cupboards
(>80 cm.)
4.09 3.09 -24 1.76 1.9 14 18 1 6
Wooden office furniture
(> 80 cm. exc. cupboards)
3.52 2.88 -18 2.48 2.5 17 20 2 4
Wooden furniture (dining and living-room)
3.26 2.07 -37 3.32 1.99 20 35 6 18
Wooden furniture (shops) 5.31 4.73 -11 2.51 4.64 14 23 1 7
Other wooden furniture 2.9 2.19 -25 2.47 2.44 23 31 8 16
All wooden furniture (aggregate)
2.72 2.17 -36 28 48 11 28
Source: Calculated from Eurostat COMEXT database.
3. Upgrading in the wood furniture value chain
Who are the winners and losers in the globalization of the furniture value chain, and how does
this relate to patterns of upgrading? To analyse these outcomes, performance in the furniture sub-
sectors and trends in price, value and market share for individual producer countries are studied.
This involves an analytical interpretation of the trade data, which is based on the following
rationale (Kaplinsky and Readman, 2005). The method we introduce captures changes over time
of trade flows using two measures, namely unit price changes and market share changes. The
specific period runs from 1989 to 2001. The findings are important and reveal country upgrading
performance during this specific period. Nonetheless, the method is also instructive and, as with
any thought out and rigorous scientific test, it can be falsifiable either through observations or
9 Prices are calculated using two-year moving averages.
16
other methods, repeated to verify the results and, even more importantly, improved upon. We
believe that this section contributes to the theoretical and methodological discourse on upgrading
and value chains.
Measuring upgrading by using trade data: an explanation
The study of innovation has wrestled continuously with the construction of meaningful
measurements of innovating activity, and different metrics have been used. These include input
measures (e.g. various related R&D indicators such as number of personnel and facilities,
expenditures, etc) and output measures (e.g. patents, biblio-metrics). None of these is perfect.
Each throws light on one particular element of the innovation process, but obscures others. For
example, R&D data where available provide an estimate of innovation inputs, but offer little
insight into their effectiveness and productivity. Similarly, output statistics such as patents, again
where available, provide some data on productivity and effectiveness, but take no account of
intrinsic differences in the appropriateness of technology across sectors, or the efficiency of the
innovation process. The usefulness of individual indicators also depends on the level of detail of
available data sets and the non-correspondence between data categories (for example, between
trade, production, skill and occupational categories), all of which use sub-sectoral nomenclatures
that do not overlap.
In the following analysis, unit prices and market shares are combined as an indicator of relative
upgrading performance. The logic for this is as follows. Firms engaging in successful product
innovation, whether minor alterations or more substantial changes in product design and
performance, can expect to receive relatively higher prices for their output. (The word
“relatively” can also cover a world in which prices fall, but at a lower rate than those of
competitors.) But higher prices may also reflect inefficiencies in production, suggesting a decline
in innovative performance, in this case with regard to process innovation. Therefore, an indicator
of cost competitiveness is needed, and for this reason market shares are used. Producers that are
not cost-competitive are likely to experience declining market shares.
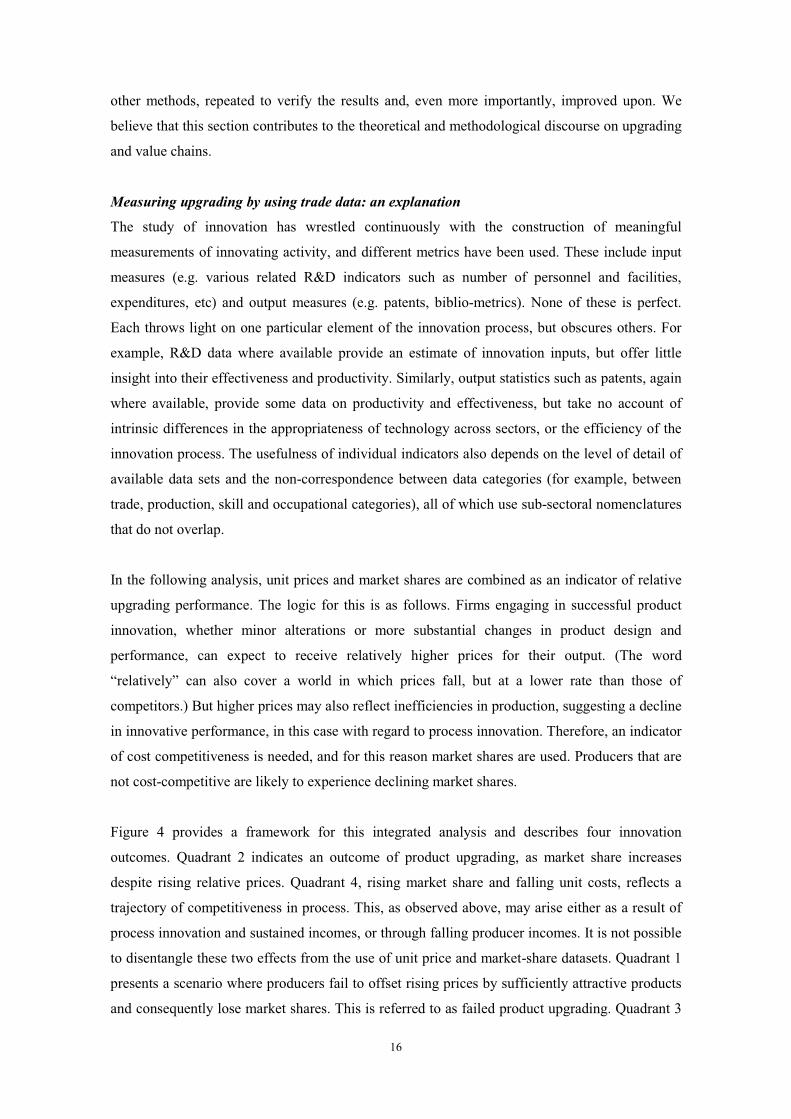
Figure 4 provides a framework for this integrated analysis and describes four innovation
outcomes. Quadrant 2 indicates an outcome of product upgrading, as market share increases
despite rising relative prices. Quadrant 4, rising market share and falling unit costs, reflects a
trajectory of competitiveness in process. This, as observed above, may arise either as a result of
process innovation and sustained incomes, or through falling producer incomes. It is not possible
to disentangle these two effects from the use of unit price and market-share datasets. Quadrant 1
presents a scenario where producers fail to offset rising prices by sufficiently attractive products
and consequently lose market shares. This is referred to as failed product upgrading. Quadrant 3
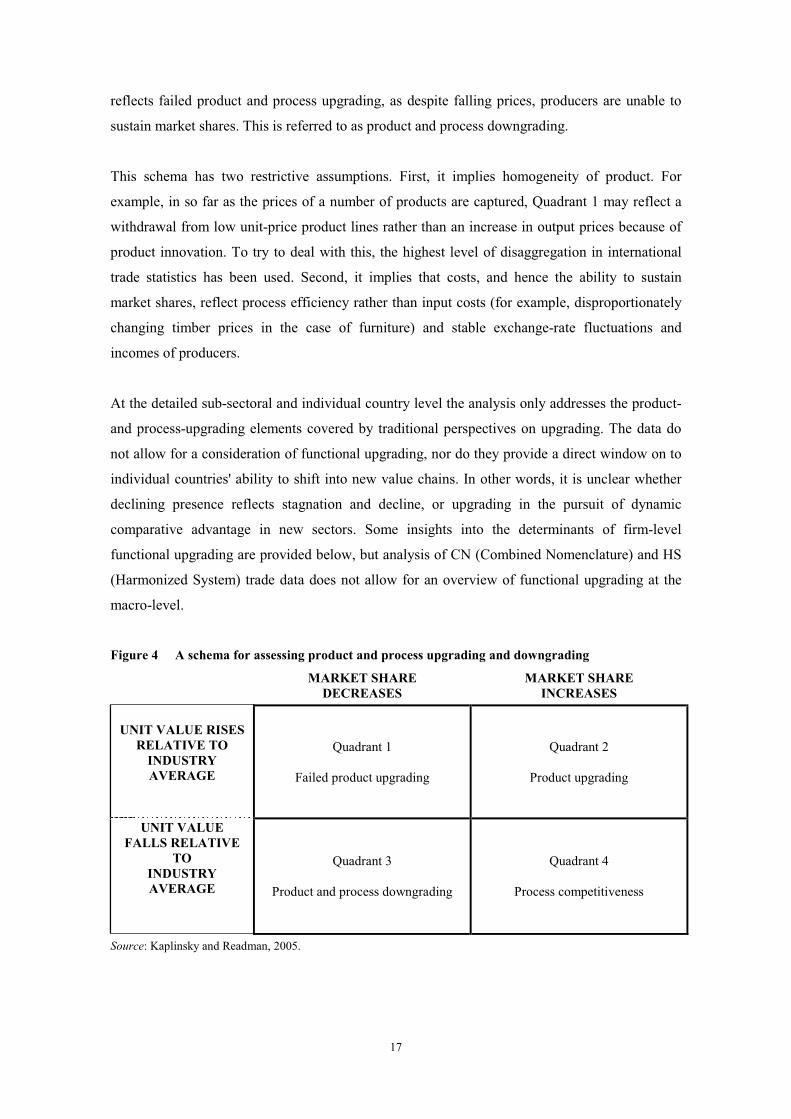
17
reflects failed product and process upgrading, as despite falling prices, producers are unable to
sustain market shares. This is referred to as product and process downgrading.
This schema has two restrictive assumptions. First, it implies homogeneity of product. For
example, in so far as the prices of a number of products are captured, Quadrant 1 may reflect a
withdrawal from low unit-price product lines rather than an increase in output prices because of
product innovation. To try to deal with this, the highest level of disaggregation in international
trade statistics has been used. Second, it implies that costs, and hence the ability to sustain
market shares, reflect process efficiency rather than input costs (for example, disproportionately
changing timber prices in the case of furniture) and stable exchange-rate fluctuations and
incomes of producers.
At the detailed sub-sectoral and individual country level the analysis only addresses the product-
and process-upgrading elements covered by traditional perspectives on upgrading. The data do
not allow for a consideration of functional upgrading, nor do they provide a direct window on to
individual countries' ability to shift into new value chains. In other words, it is unclear whether
declining presence reflects stagnation and decline, or upgrading in the pursuit of dynamic
comparative advantage in new sectors. Some insights into the determinants of firm-level
functional upgrading are provided below, but analysis of CN (Combined Nomenclature) and HS
(Harmonized System) trade data does not allow for an overview of functional upgrading at the
macro-level.
Figure 4 A schema for assessing product and process upgrading and downgrading
MARKET SHARE DECREASES
MARKET SHARE INCREASES
UNIT VALUE RISES RELATIVE TO
INDUSTRY AVERAGE
Quadrant 1
Failed product upgrading
Quadrant 2
Product upgrading
UNIT VALUE FALLS RELATIVE
TO INDUSTRY AVERAGE
Quadrant 3
Product and process downgrading
Quadrant 4
Process competitiveness
Source: Kaplinsky and Readman, 2005.
18
In the next section this 2X2 upgrading taxonomy is applied to countries with at least 1 per cent
shares in one of 11 sub-sectors furniture export markets, as defined by the eight-digit Combined
Nomenclature. Differentiating the furniture industry at this level provides the framework for a
more accurate analysis of sub-sectoral trends than more aggregate data sets. The 1 per cent
market share cut-off is necessary to avoid swamping the analysis in country-specific detail, and
takes account only of those countries with non-marginal exports to the EU. The analysis allows
upgrading to be addressed from three perspectives:
• The population by countries in each of the four quadrants of the matrix.
• The performance of key exporting economies.
• The upgrading trajectories in each of the 11 industry sub-sectors.
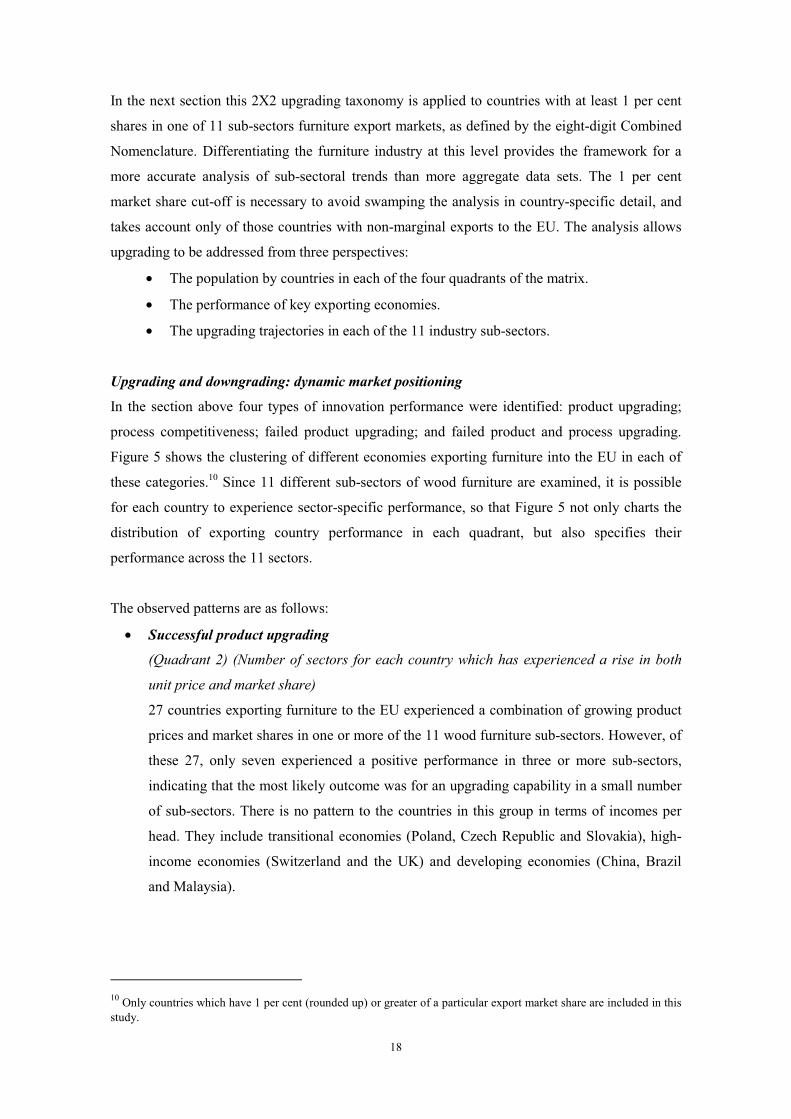
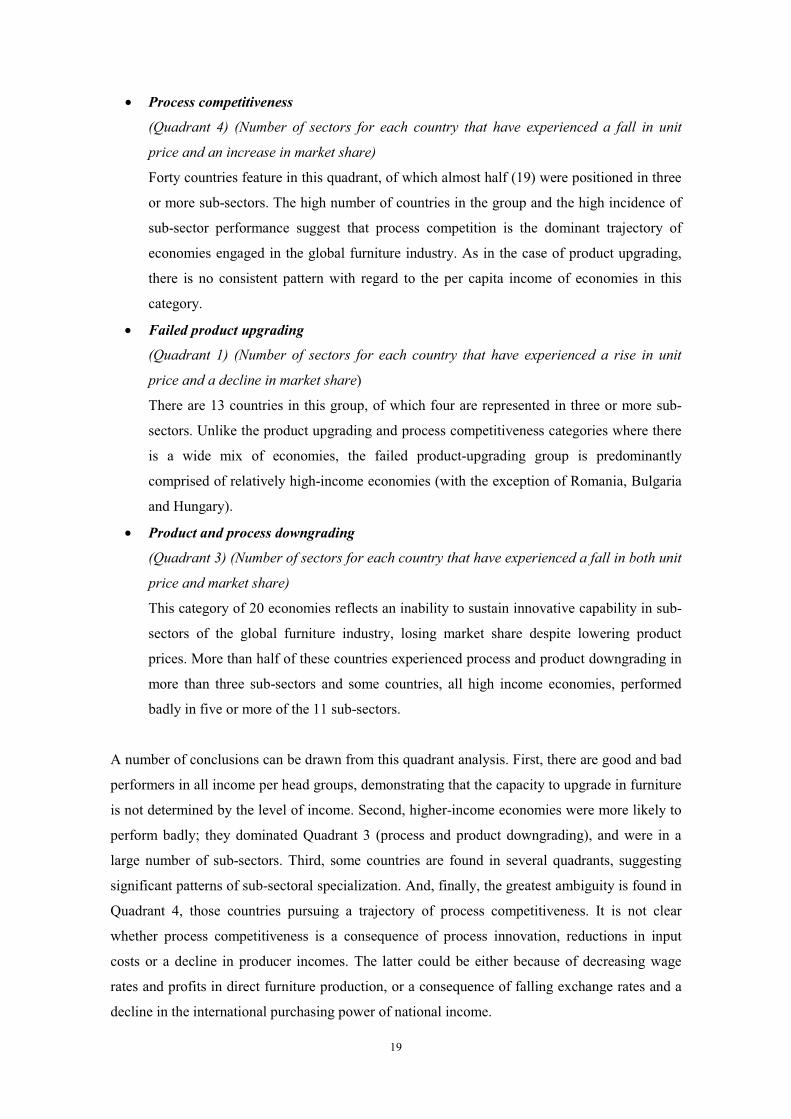
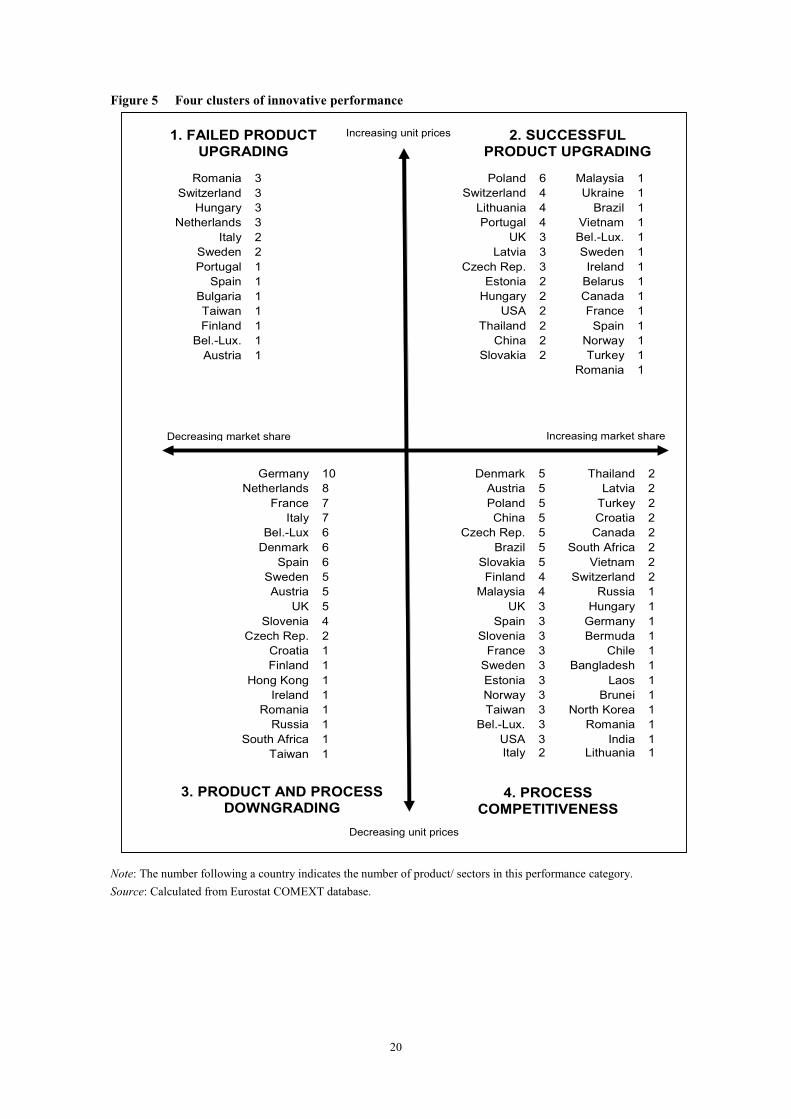
Upgrading and downgrading: dynamic market positioning
In the section above four types of innovation performance were identified: product upgrading;
process competitiveness; failed product upgrading; and failed product and process upgrading.
Figure 5 shows the clustering of different economies exporting furniture into the EU in each of
these categories.10 Since 11 different sub-sectors of wood furniture are examined, it is possible
for each country to experience sector-specific performance, so that Figure 5 not only charts the
distribution of exporting country performance in each quadrant, but also specifies their
performance across the 11 sectors.
The observed patterns are as follows:
• Successful product upgrading
(Quadrant 2) (Number of sectors for each country which has experienced a rise in both
unit price and market share)
27 countries exporting furniture to the EU experienced a combination of growing product
prices and market shares in one or more of the 11 wood furniture sub-sectors. However, of
these 27, only seven experienced a positive performance in three or more sub-sectors,
indicating that the most likely outcome was for an upgrading capability in a small number
of sub-sectors. There is no pattern to the countries in this group in terms of incomes per
head. They include transitional economies (Poland, Czech Republic and Slovakia), high-
income economies (Switzerland and the UK) and developing economies (China, Brazil
and Malaysia).
10 Only countries which have 1 per cent (rounded up) or greater of a particular export market share are included in this study.
19
• Process competitiveness
(Quadrant 4) (Number of sectors for each country that have experienced a fall in unit
price and an increase in market share)
Forty countries feature in this quadrant, of which almost half (19) were positioned in three
or more sub-sectors. The high number of countries in the group and the high incidence of
sub-sector performance suggest that process competition is the dominant trajectory of
economies engaged in the global furniture industry. As in the case of product upgrading,
there is no consistent pattern with regard to the per capita income of economies in this
category.
• Failed product upgrading
(Quadrant 1) (Number of sectors for each country that have experienced a rise in unit
price and a decline in market share)
There are 13 countries in this group, of which four are represented in three or more sub-
sectors. Unlike the product upgrading and process competitiveness categories where there
is a wide mix of economies, the failed product-upgrading group is predominantly
comprised of relatively high-income economies (with the exception of Romania, Bulgaria
and Hungary).
• Product and process downgrading
(Quadrant 3) (Number of sectors for each country that have experienced a fall in both unit
price and market share)
This category of 20 economies reflects an inability to sustain innovative capability in sub-
sectors of the global furniture industry, losing market share despite lowering product
prices. More than half of these countries experienced process and product downgrading in
more than three sub-sectors and some countries, all high income economies, performed
badly in five or more of the 11 sub-sectors.
A number of conclusions can be drawn from this quadrant analysis. First, there are good and bad
performers in all income per head groups, demonstrating that the capacity to upgrade in furniture
is not determined by the level of income. Second, higher-income economies were more likely to
perform badly; they dominated Quadrant 3 (process and product downgrading), and were in a
large number of sub-sectors. Third, some countries are found in several quadrants, suggesting
significant patterns of sub-sectoral specialization. And, finally, the greatest ambiguity is found in
Quadrant 4, those countries pursuing a trajectory of process competitiveness. It is not clear
whether process competitiveness is a consequence of process innovation, reductions in input
costs or a decline in producer incomes. The latter could be either because of decreasing wage
rates and profits in direct furniture production, or a consequence of falling exchange rates and a
decline in the international purchasing power of national income.
20
Figure 5 Four clusters of innovative performance
Increasing unit prices
Poland 6 Malaysia 1 Switzerland 4 Ukraine 1
Lithuania 4 Brazil 1 Portugal 4 Vietnam 1
UK 3 Bel.-Lux. 1 Latvia 3 Sweden 1
Czech Rep. 3 Ireland 1 Estonia 2 Belarus 1
Hungary 2 Canada 1 USA 2 France 1
Thailand 2 Spain 1 China 2 Norway 1
Slovakia 2 Turkey 1 Romania 1
Romania 3 Switzerland 3
Hungary 3 Netherlands 3
Italy 2 Sweden 2 Portugal 1
Spain 1 Bulgaria 1 Taiwan 1 Finland 1
Bel.-Lux. 1 Austria 1
Denmark 5 Thailand 2 Austria 5 Latvia 2 Poland 5 Turkey 2 China 5 Croatia 2
Czech Rep. 5 Canada 2 Brazil 5 South Africa 2
Slovakia 5 Vietnam 2 Finland 4 Switzerland 2
Malaysia 4 Russia 1 UK 3 Hungary 1
Spain 3 Germany 1 Slovenia 3 Bermuda 1
France 3 Chile 1 Sweden 3 Bangladesh 1 Estonia 3 Laos 1 Norway 3 Brunei 1
Taiwan 3 North Korea 1 Bel.-Lux. 3 Romania 1
USA 3 India 1 Italy 2 Lithuania 1
Germany 10 Netherlands 8
France 7 Italy 7
Bel.-Lux 6 Denmark 6
Spain 6 Sweden 5 Austria 5
UK 5 Slovenia 4
Czech Rep. 2 Croatia 1 Finland 1
Hong Kong 1 Ireland 1
Romania 1 Russia 1
South Africa 1 Taiwan 1
Increasing market shareDecreasing market share
1. FAILED PRODUCT UPGRADING
2. SUCCESSFUL PRODUCT UPGRADING
Decreasing unit prices
3. PRODUCT AND PROCESSDOWNGRADING
4. PROCESS COMPETITIVENESS
Note: The number following a country indicates the number of product/ sectors in this performance category. Source: Calculated from Eurostat COMEXT database.
21
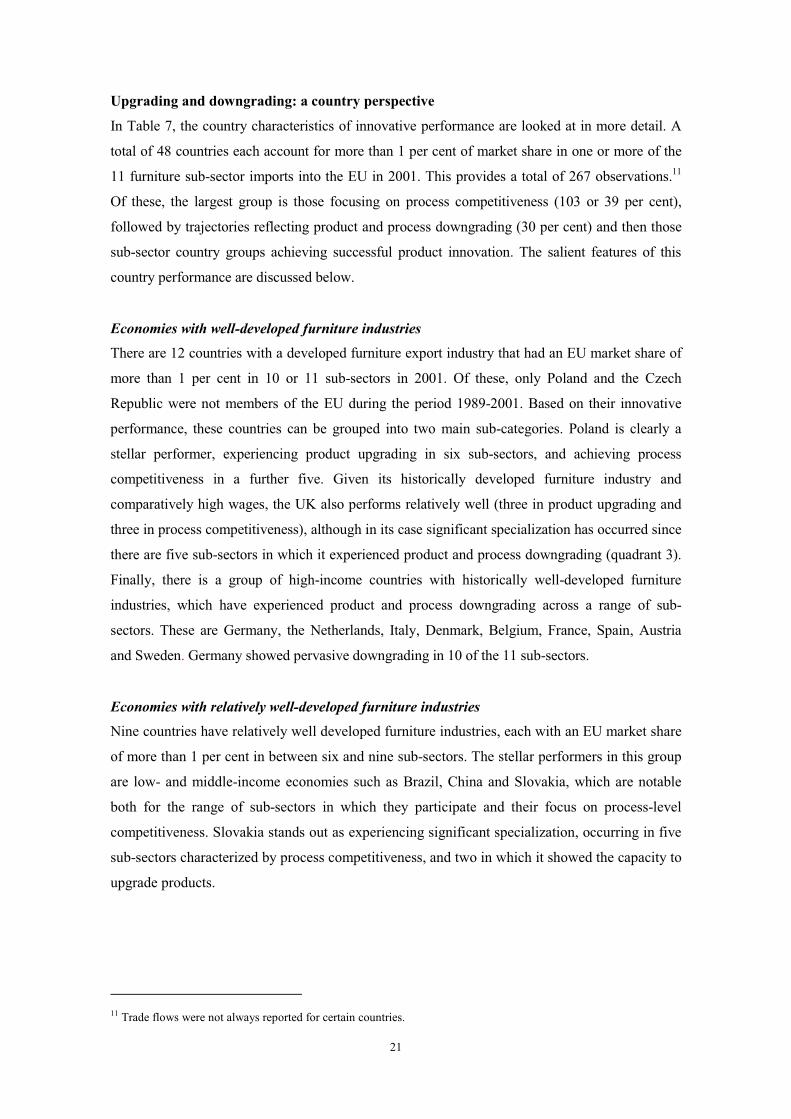
Upgrading and downgrading: a country perspective
In Table 7, the country characteristics of innovative performance are looked at in more detail. A
total of 48 countries each account for more than 1 per cent of market share in one or more of the
11 furniture sub-sector imports into the EU in 2001. This provides a total of 267 observations.11
Of these, the largest group is those focusing on process competitiveness (103 or 39 per cent),
followed by trajectories reflecting product and process downgrading (30 per cent) and then those
sub-sector country groups achieving successful product innovation. The salient features of this
country performance are discussed below.
Economies with well-developed furniture industries
There are 12 countries with a developed furniture export industry that had an EU market share of
more than 1 per cent in 10 or 11 sub-sectors in 2001. Of these, only Poland and the Czech
Republic were not members of the EU during the period 1989-2001. Based on their innovative
performance, these countries can be grouped into two main sub-categories. Poland is clearly a
stellar performer, experiencing product upgrading in six sub-sectors, and achieving process
competitiveness in a further five. Given its historically developed furniture industry and
comparatively high wages, the UK also performs relatively well (three in product upgrading and
three in process competitiveness), although in its case significant specialization has occurred since
there are five sub-sectors in which it experienced product and process downgrading (quadrant 3).
Finally, there is a group of high-income countries with historically well-developed furniture
industries, which have experienced product and process downgrading across a range of sub-
sectors. These are Germany, the Netherlands, Italy, Denmark, Belgium, France, Spain, Austria
and Sweden. Germany showed pervasive downgrading in 10 of the 11 sub-sectors.
Economies with relatively well-developed furniture industries
Nine countries have relatively well developed furniture industries, each with an EU market share
of more than 1 per cent in between six and nine sub-sectors. The stellar performers in this group
are low- and middle-income economies such as Brazil, China and Slovakia, which are notable
both for the range of sub-sectors in which they participate and their focus on process-level
competitiveness. Slovakia stands out as experiencing significant specialization, occurring in five
sub-sectors characterized by process competitiveness, and two in which it showed the capacity to
upgrade products.
11 Trade flows were not always reported for certain countries.
22
Economies with relatively weakly developed furniture industries
There are 14 countries with relatively weakly developed furniture industries, with an EU market
share of more than 1 per cent in between three and five sub-sectors only. This category tends to
be dominated by middle-income and transitional economies, and to focus on process
competitiveness.
Economies with poorly developed furniture industries The final group has 13 countries with poorly developed furniture industries, participating in only
one or two of the 11 furniture sub-sectors. In each case this reflects a specialization in a
particular style; in almost all of these cases the basis of their competitive positioning lies in
process upgrading. The group is predominantly made up of transitional and low-income
economies.
Upgrading and downgrading: a sub-sector perspective
The combined use of unit-price and market-share data also throws light on the dynamics of
particular sub-sectors, as shown in Table 8. All the 11 sub-sectors show multi-country
participation in EU import markets. The criterion for country representation is more than 1 per
cent of EU imports, and even in the most concentrated sector (office cupboards), 18 countries
exceed this threshold. In two sub-sectors, dining- and living room and wooden seats, there are
over 30 countries with an import market share of over 1 per cent. As noted earlier, the dominant
competitive trajectory is one of process competitiveness, followed by failed product and process
upgrading, successful product upgrading and failed product upgrading.
In Table 8 the 11 sub-sectors are grouped in two categories. In the first category are those that
broadly represent an upgrading trajectory. A distinction is made between product upgrading
(quadrant 2 of Figure 5), which is relatively unambiguous, and process competitiveness
(quadrant 4), which might arise either from growing process competitiveness or extraneous
factors such as exchange rate variations, falling input costs and falling producer incomes. The
second category represents clear occurrences of failing innovative capabilities, either because of
an inability to upgrade products (quadrant 1) or product and process downgrading (quadrant 3).
The sub sectors are ranked by the shares of countries demonstrating product upgrading and
process competitiveness in the period 1989-2001.
23
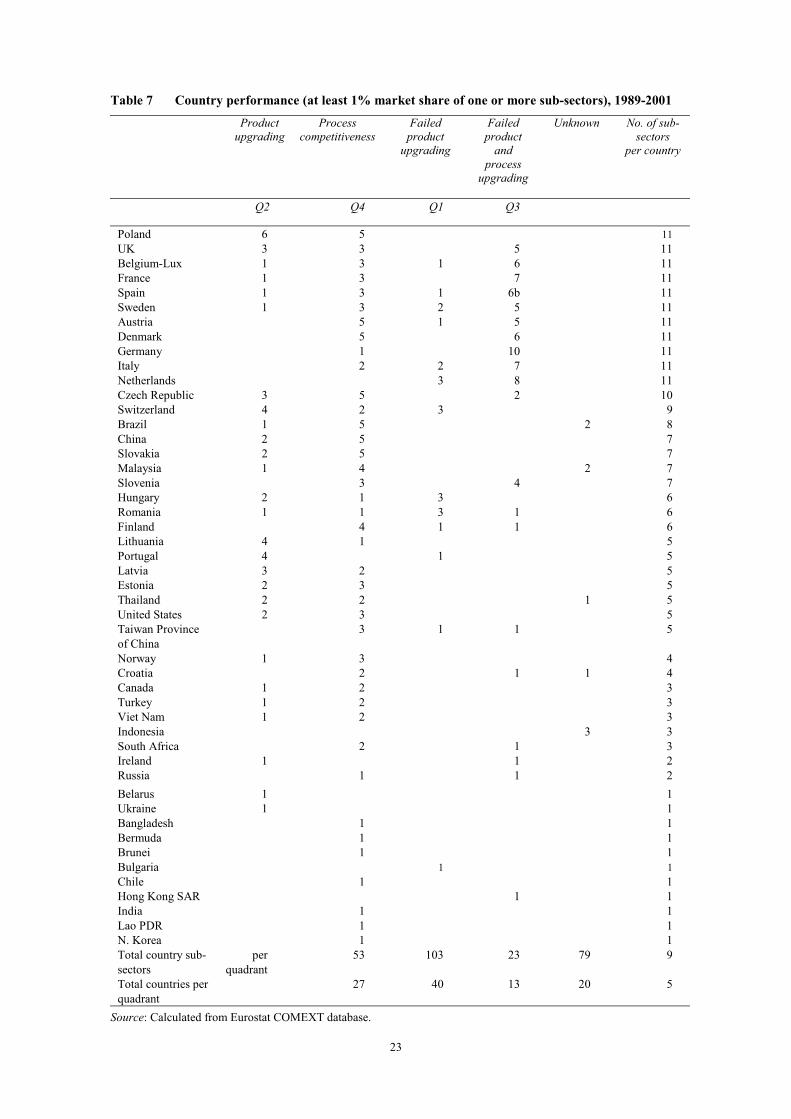
Table 7 Country performance (at least 1% market share of one or more sub-sectors), 1989-2001
Productupgrading
Process competitiveness
Failed product
upgrading
Failed product
and process
upgrading
Unknown No. of sub-sectors
per country
Q2 Q4 Q1 Q3
Poland 6 5 11 UK 3 3 5 11 Belgium-Lux 1 3 1 6 11 France 1 3 7 11 Spain 1 3 1 6b 11 Sweden 1 3 2 5 11 Austria 5 1 5 11 Denmark 5 6 11 Germany 1 10 11 Italy 2 2 7 11 Netherlands 3 8 11 Czech Republic 3 5 2 10 Switzerland 4 2 3 9 Brazil 1 5 2 8 China 2 5 7 Slovakia 2 5 7 Malaysia 1 4 2 7 Slovenia 3 4 7 Hungary 2 1 3 6 Romania 1 1 3 1 6 Finland 4 1 1 6 Lithuania 4 1 5 Portugal 4 1 5 Latvia 3 2 5 Estonia 2 3 5 Thailand 2 2 1 5 United States 2 3 5 Taiwan Province of China
3 1 1 5
Norway 1 3 4 Croatia 2 1 1 4 Canada 1 2 3 Turkey 1 2 3 Viet Nam 1 2 3 Indonesia 3 3 South Africa 2 1 3 Ireland 1 1 2 Russia 1 1 2 Belarus 1 1 Ukraine 1 1 Bangladesh 1 1 Bermuda 1 1 Brunei 1 1 Bulgaria 1 1 Chile 1 1 Hong Kong SAR 1 1 India 1 1 Lao PDR 1 1 N. Korea 1 1 Total country sub-sectors
per quadrant
53 103 23 79 9
Total countries per quadrant
27 40 13 20 5
Source: Calculated from Eurostat COMEXT database.
24
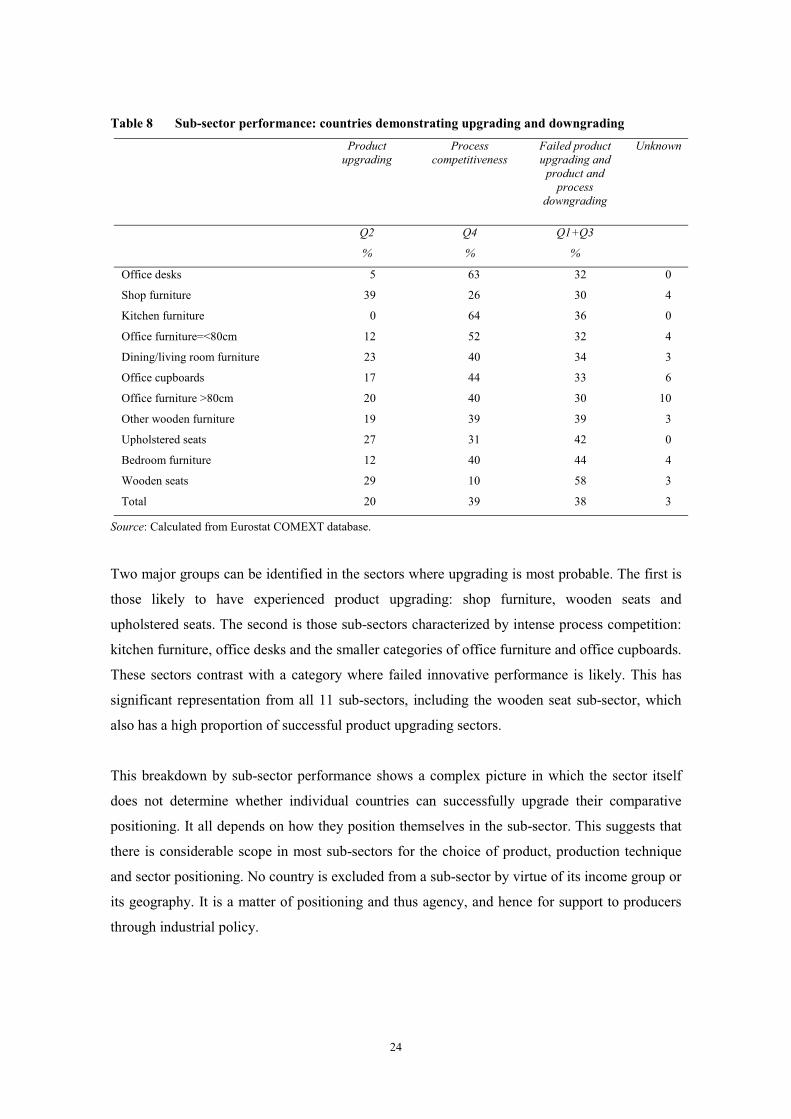
Table 8 Sub-sector performance: countries demonstrating upgrading and downgrading
Product upgrading
Process competitiveness
Failed product upgrading and
product and process
downgrading
Unknown
Q2
%
Q4
%
Q1+Q3
%
Office desks 5 63 32 0
Shop furniture 39 26 30 4
Kitchen furniture 0 64 36 0
Office furniture=<80cm 12 52 32 4
Dining/living room furniture 23 40 34 3
Office cupboards 17 44 33 6
Office furniture >80cm 20 40 30 10
Other wooden furniture 19 39 39 3
Upholstered seats 27 31 42 0
Bedroom furniture 12 40 44 4
Wooden seats 29 10 58 3
Total 20 39 38 3
Source: Calculated from Eurostat COMEXT database.
Two major groups can be identified in the sectors where upgrading is most probable. The first is
those likely to have experienced product upgrading: shop furniture, wooden seats and
upholstered seats. The second is those sub-sectors characterized by intense process competition:
kitchen furniture, office desks and the smaller categories of office furniture and office cupboards.
These sectors contrast with a category where failed innovative performance is likely. This has
significant representation from all 11 sub-sectors, including the wooden seat sub-sector, which
also has a high proportion of successful product upgrading sectors.
This breakdown by sub-sector performance shows a complex picture in which the sector itself
does not determine whether individual countries can successfully upgrade their comparative
positioning. It all depends on how they position themselves in the sub-sector. This suggests that
there is considerable scope in most sub-sectors for the choice of product, production technique
and sector positioning. No country is excluded from a sub-sector by virtue of its income group or
its geography. It is a matter of positioning and thus agency, and hence for support to producers
through industrial policy.
25
Before considering these policy implications, the role of buyers in assisting upgrading in the
wood furniture value chain is considered. Buyers play a key role not only in purchasing and
distributing but also in the scope of upgrading activity of producers.
4. Buyers in the wood furniture value chain
As seen above, in the context of globalization, competitive pressures eat away at the returns
arising from historic core competences. The key to sustainable incomes lies in the ability of firms
to reposition themselves within their value chains. In general, this requires a move out of the
materials-transforming links in the chain into, or to complement these operations with, more
knowledge-intensive activities in design, branding, marketing and the control of logistics.
Wood furniture is a classic buyer-driven chain with few scale- or technology-entry barriers in
production. Hence, lead or governing firms that set prices, delivery schedules and quality
standards are to be found at the apex of the chain, among the buyers. To the extent that any firms
in the chain are able systematically to situate themselves in the rent-intensive links, it is the
buyers who largely control these entry-barriers. Since buyers need to protect their own sources of
rent, the assistance given to producers in their upgrading is unlikely to give them the capability to
encroach on the buyers’ own rents.
In the discussion of generic trends in global value chains, five major types of buyers were
identified. These were multi-store retailers selling largely unbranded products, independent
specialized buyers in the consuming country, independent specialized buyers in the producing
country, trans-national firms with global brands and intermediary firms organizing triangular
production networks in third countries. In the global wood furniture industry, three key sets of
buyers are the large multi-store retailers, specialized buyers in the importing country and small
independent family-owned stores.12 The biggest and most dynamic of these is the multi-store
retailers, which generally purchase on a large scale and, except for a few minor items, tend to
source directly from the producers. For these buyers, cost and volume are the key critical success
factors determining their purchasing decisions. The second major type of buyer is the specialized
import agent. This, too, tends to deal directly with the furniture producers, but buy in smaller
volumes and sell to less price-sensitive and more design-conscious retailers. Finally, and of less
importance, are retailers with single or limited retail outlets. These buyers tend to purchase in
small quantities, generally from import agents or from wholesalers in producing countries, and
sell into design-conscious markets.
26
Assisting in function upgrading
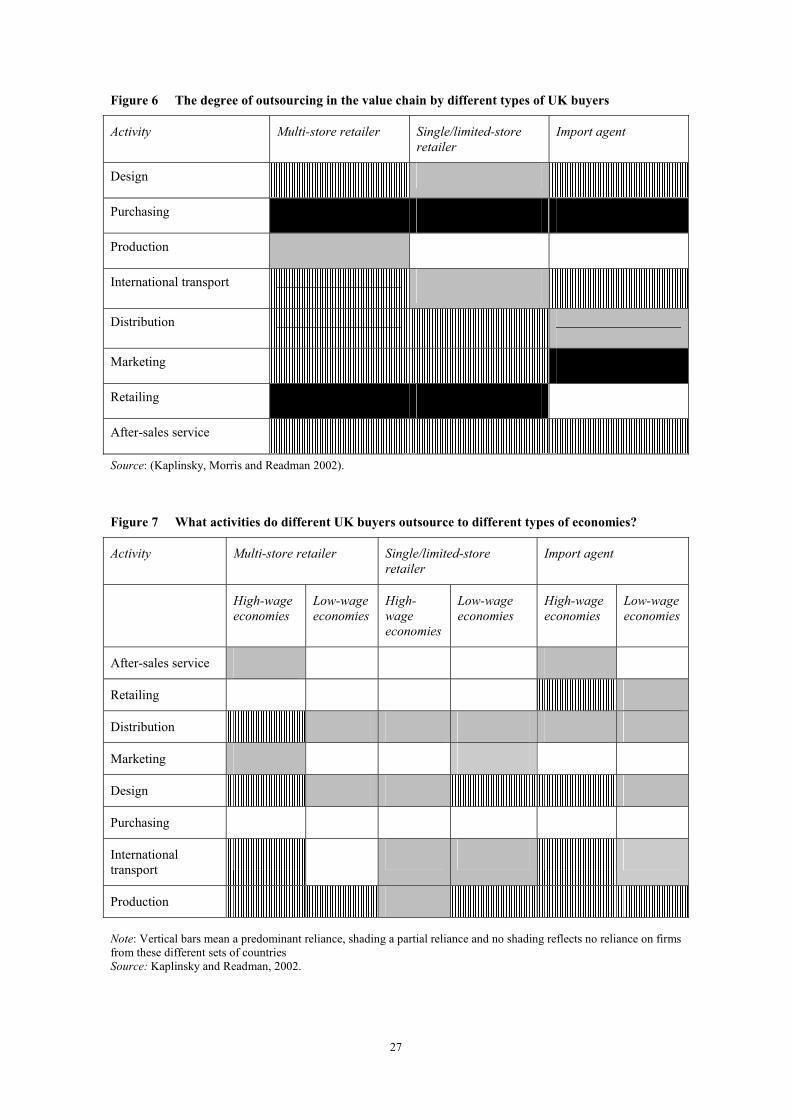
What sorts of activities do these different buyers outsource, and what do they keep for
themselves? Figure 6 shows the sourcing decisions of the three types based in the UK: dark areas
represent complete internalization, the vertical bars mean predominant internalization, light
shading reflects predominant outsourcing and no shading represents 100 per cent outsourcing. It
is clear from the picture that the key activities that buyers try to keep are purchasing and, where a
buyer has its own stores, retailing; these define their core competences. Perhaps surprisingly,
buyers are prepared to allow producers a limited amount of independent activity in design and
international transport, and are willing to buy in domestic logistics, marketing and after-sales
servicing. Significantly, these buyers do not regard the manufacture of furniture as being within
their competence, although there is one striking exception. Some multi-store retailers (for
example, IKEA) maintain a limited number of their own factories, since they feel that they
cannot be intelligent buyers unless they fully understand the problems posed in production. A
distinctive feature of the furniture industry is that it involves production by low- and high-
income economies. So, given that buyers are increasingly prepared to outsource some of their
activities, the question is which of those activities are outsourced to low-income and which to
high-income economies?
In general, all three types of buyers are willing to outsource production to low-income economies
(Figure 7). Only the very small retailers are prepared to completely allow the design activities to
occur in low-wage economies. These buyers are often “design-takers” rather than “design-
makers”. And, in general, it is the single and limited store retailers that are prepared to let more
of their activities go to low-income economies. Some of these activities tend to support higher-
income economies, such as design or the control of chain logistics. However, the growing
consolidation of retailing in all of the major importing countries means that small retailers and
smaller import agents are being squeezed out of the market.
There are thus only limited prospects for low-income country producers to engage in functional
repositioning and to move into knowledge-intensive and disembodied links in the chain,
particularly as the buyer market continues to consolidate. Producers in low-income economies
are allowed, or indeed often encouraged, to take on new tasks. But these tend to be activities with
low barriers to entry, in particular production itself.
12 In Japan, outsourcing manufactures engaging in production-sharing arrangements play a particularly prominent role Keiju, 2005.
27
Figure 6 The degree of outsourcing in the value chain by different types of UK buyers
Activity Multi-store retailer Single/limited-store retailer
Import agent
Design
Purchasing
Production
International transport
Distribution
Marketing
Retailing
After-sales service
Source: (Kaplinsky, Morris and Readman 2002).
Figure 7 What activities do different UK buyers outsource to different types of economies?
Activity Multi-store retailer Single/limited-store retailer
Import agent
High-wage economies
Low-wage economies
High-wage economies
Low-wage economies
High-wage economies
Low-wage economies
After-sales service
Retailing
Distribution
Marketing
Design
Purchasing
International transport
Production
Note: Vertical bars mean a predominant reliance, shading a partial reliance and no shading reflects no reliance on firms from these different sets of countries Source: Kaplinsky and Readman, 2002.
28
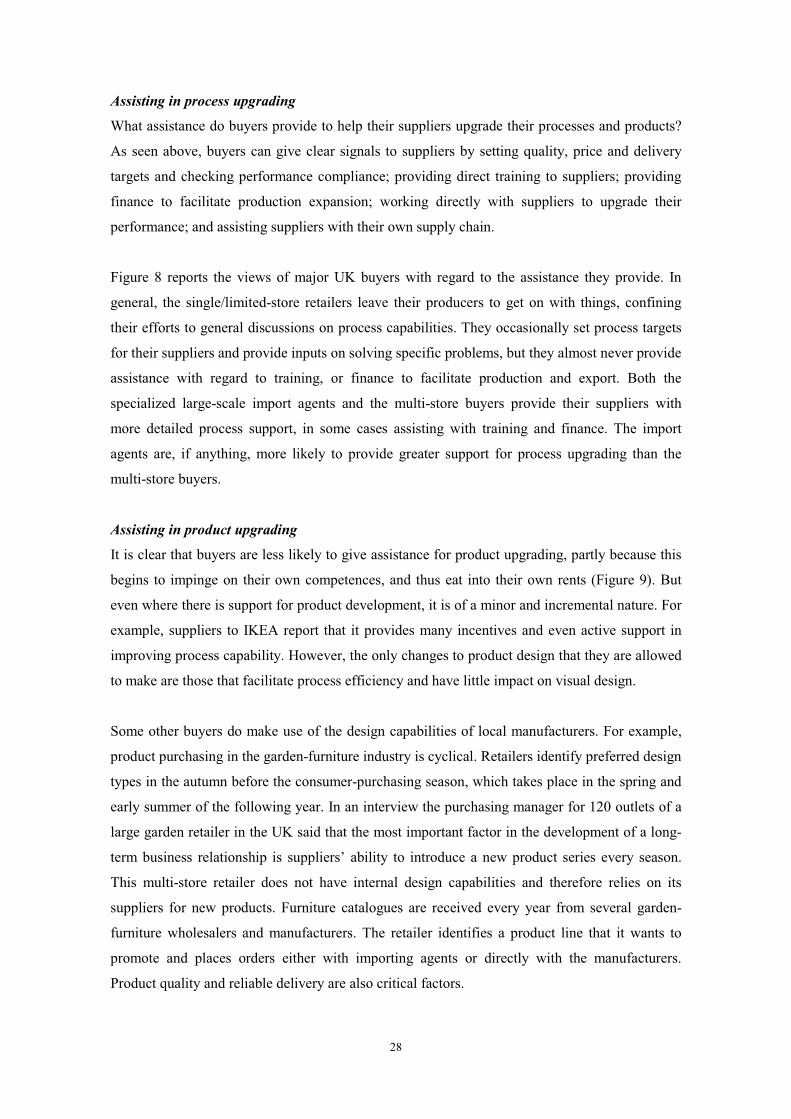
Assisting in process upgrading
What assistance do buyers provide to help their suppliers upgrade their processes and products?
As seen above, buyers can give clear signals to suppliers by setting quality, price and delivery
targets and checking performance compliance; providing direct training to suppliers; providing
finance to facilitate production expansion; working directly with suppliers to upgrade their
performance; and assisting suppliers with their own supply chain.
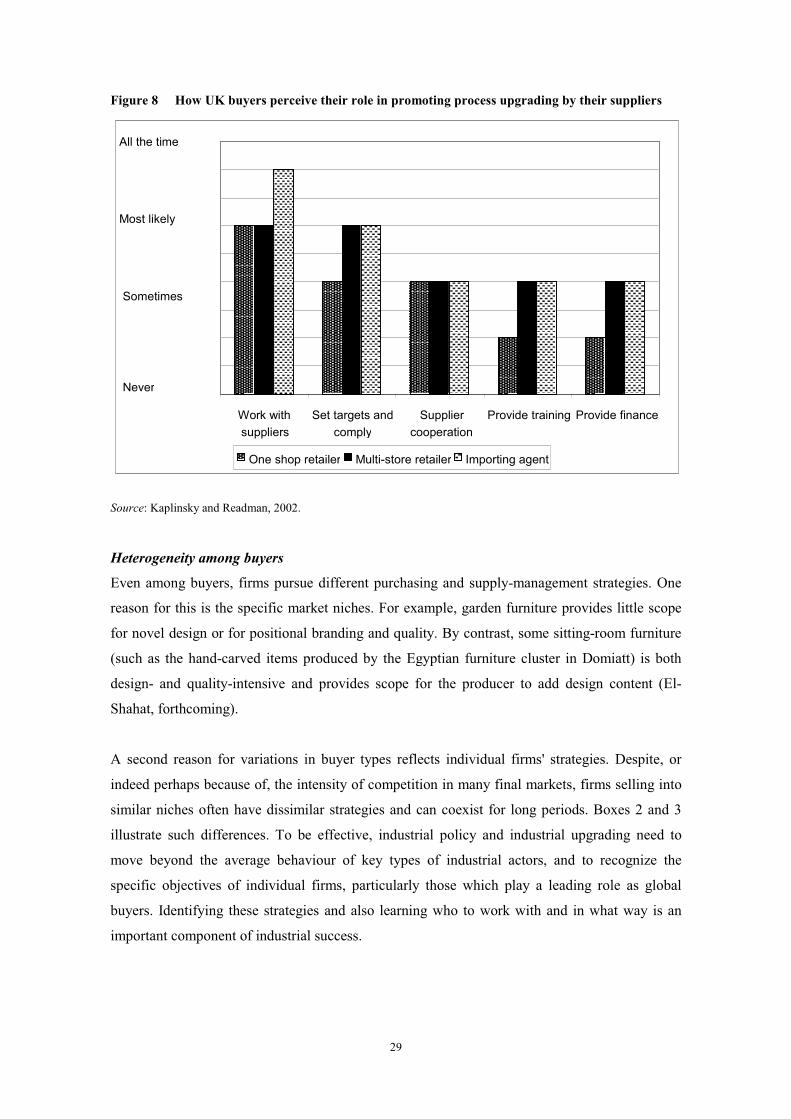
Figure 8 reports the views of major UK buyers with regard to the assistance they provide. In
general, the single/limited-store retailers leave their producers to get on with things, confining
their efforts to general discussions on process capabilities. They occasionally set process targets
for their suppliers and provide inputs on solving specific problems, but they almost never provide
assistance with regard to training, or finance to facilitate production and export. Both the
specialized large-scale import agents and the multi-store buyers provide their suppliers with
more detailed process support, in some cases assisting with training and finance. The import
agents are, if anything, more likely to provide greater support for process upgrading than the
multi-store buyers.
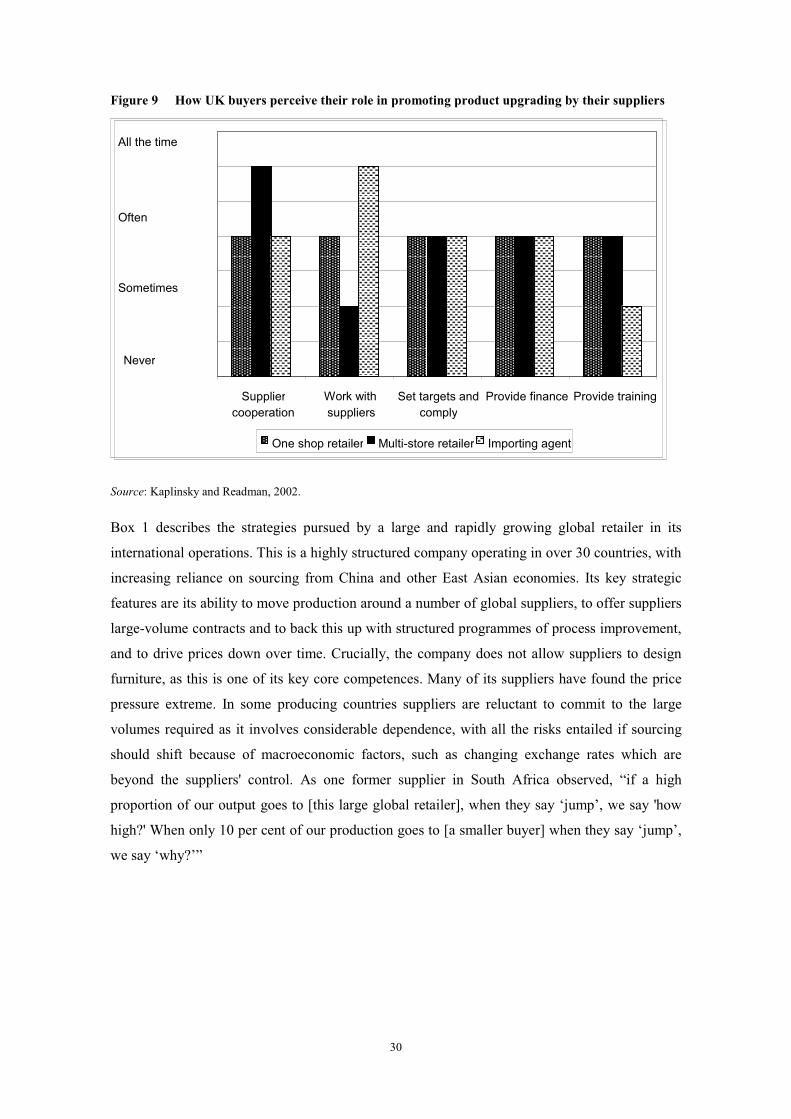
Assisting in product upgrading
It is clear that buyers are less likely to give assistance for product upgrading, partly because this
begins to impinge on their own competences, and thus eat into their own rents (Figure 9). But
even where there is support for product development, it is of a minor and incremental nature. For
example, suppliers to IKEA report that it provides many incentives and even active support in
improving process capability. However, the only changes to product design that they are allowed
to make are those that facilitate process efficiency and have little impact on visual design.
Some other buyers do make use of the design capabilities of local manufacturers. For example,
product purchasing in the garden-furniture industry is cyclical. Retailers identify preferred design
types in the autumn before the consumer-purchasing season, which takes place in the spring and
early summer of the following year. In an interview the purchasing manager for 120 outlets of a
large garden retailer in the UK said that the most important factor in the development of a long-
term business relationship is suppliers’ ability to introduce a new product series every season.
This multi-store retailer does not have internal design capabilities and therefore relies on its
suppliers for new products. Furniture catalogues are received every year from several garden-
furniture wholesalers and manufacturers. The retailer identifies a product line that it wants to
promote and places orders either with importing agents or directly with the manufacturers.
Product quality and reliable delivery are also critical factors.
29
Figure 8 How UK buyers perceive their role in promoting process upgrading by their suppliers
Source: Kaplinsky and Readman, 2002.
Heterogeneity among buyers
Even among buyers, firms pursue different purchasing and supply-management strategies. One
reason for this is the specific market niches. For example, garden furniture provides little scope
for novel design or for positional branding and quality. By contrast, some sitting-room furniture
(such as the hand-carved items produced by the Egyptian furniture cluster in Domiatt) is both
design- and quality-intensive and provides scope for the producer to add design content (El-
Shahat, forthcoming).
A second reason for variations in buyer types reflects individual firms' strategies. Despite, or
indeed perhaps because of, the intensity of competition in many final markets, firms selling into
similar niches often have dissimilar strategies and can coexist for long periods. Boxes 2 and 3
illustrate such differences. To be effective, industrial policy and industrial upgrading need to
move beyond the average behaviour of key types of industrial actors, and to recognize the
specific objectives of individual firms, particularly those which play a leading role as global
buyers. Identifying these strategies and also learning who to work with and in what way is an
important component of industrial success.
Work withsuppliers
Set targets andcomply
Suppliercooperation
Provide training Provide finance
One shop retailer Multi-store retailer Importing agent
All the time
Most likely
Sometimes
Never
30
Figure 9 How UK buyers perceive their role in promoting product upgrading by their suppliers
Source: Kaplinsky and Readman, 2002.
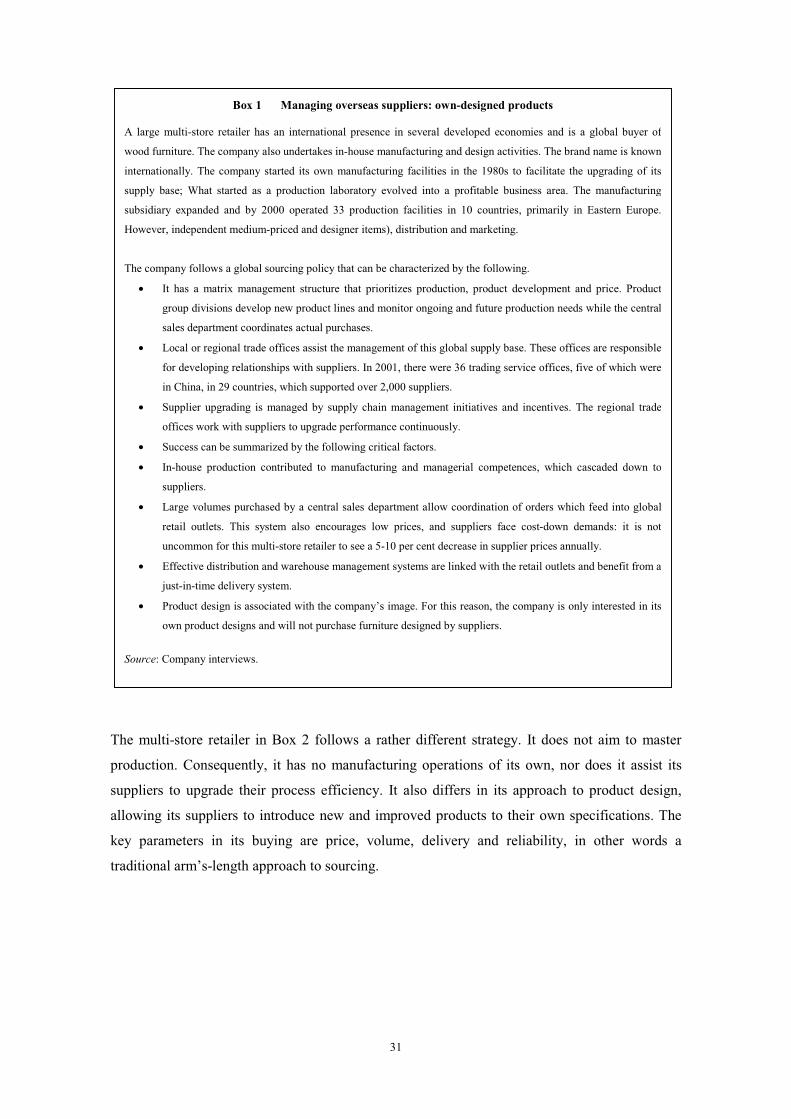
Box 1 describes the strategies pursued by a large and rapidly growing global retailer in its
international operations. This is a highly structured company operating in over 30 countries, with
increasing reliance on sourcing from China and other East Asian economies. Its key strategic
features are its ability to move production around a number of global suppliers, to offer suppliers
large-volume contracts and to back this up with structured programmes of process improvement,
and to drive prices down over time. Crucially, the company does not allow suppliers to design
furniture, as this is one of its key core competences. Many of its suppliers have found the price
pressure extreme. In some producing countries suppliers are reluctant to commit to the large
volumes required as it involves considerable dependence, with all the risks entailed if sourcing
should shift because of macroeconomic factors, such as changing exchange rates which are
beyond the suppliers' control. As one former supplier in South Africa observed, “if a high
proportion of our output goes to [this large global retailer], when they say ‘jump’, we say 'how
high?' When only 10 per cent of our production goes to [a smaller buyer] when they say ‘jump’,
we say ‘why?’”
Suppliercooperation
Work withsuppliers
Set targets andcomply
Provide finance Provide training
One shop retailer Multi-store retailer Importing agent
All the time
Often
Sometimes
Never
31
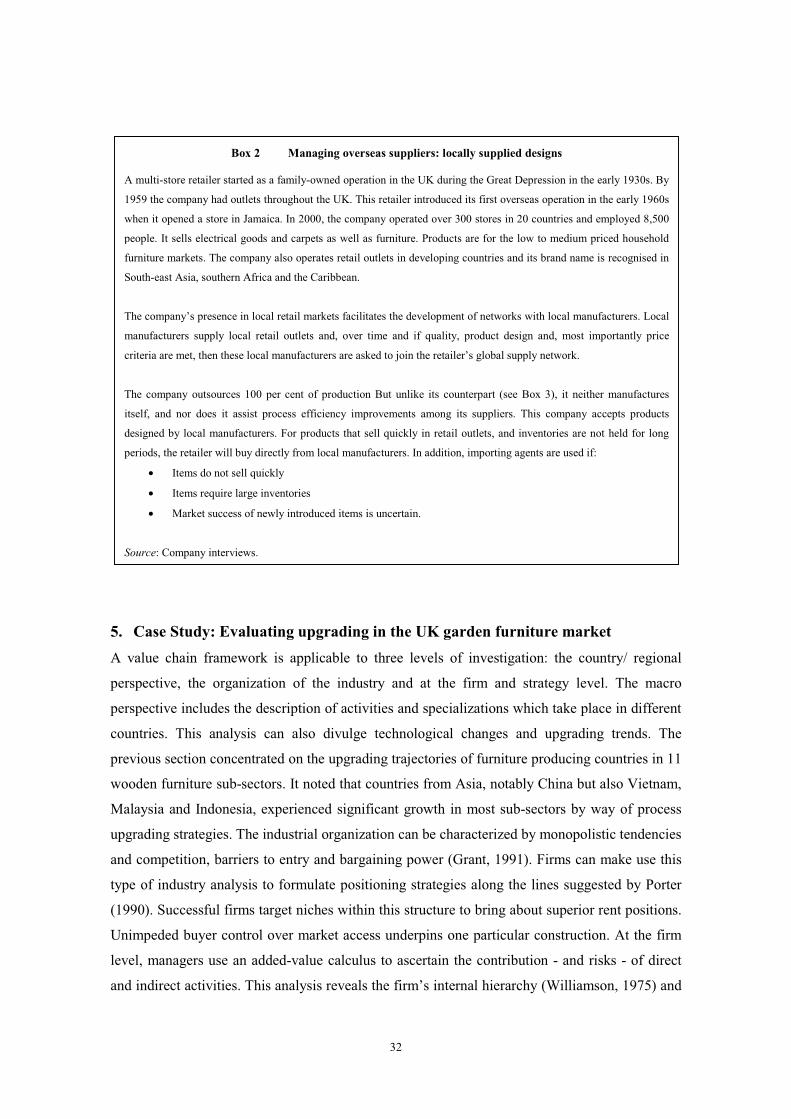
The multi-store retailer in Box 2 follows a rather different strategy. It does not aim to master
production. Consequently, it has no manufacturing operations of its own, nor does it assist its
suppliers to upgrade their process efficiency. It also differs in its approach to product design,
allowing its suppliers to introduce new and improved products to their own specifications. The
key parameters in its buying are price, volume, delivery and reliability, in other words a
traditional arm’s-length approach to sourcing.
Box 1 Managing overseas suppliers: own-designed products
A large multi-store retailer has an international presence in several developed economies and is a global buyer of
wood furniture. The company also undertakes in-house manufacturing and design activities. The brand name is known
internationally. The company started its own manufacturing facilities in the 1980s to facilitate the upgrading of its
supply base; What started as a production laboratory evolved into a profitable business area. The manufacturing
subsidiary expanded and by 2000 operated 33 production facilities in 10 countries, primarily in Eastern Europe.
However, independent medium-priced and designer items), distribution and marketing.
The company follows a global sourcing policy that can be characterized by the following.
• It has a matrix management structure that prioritizes production, product development and price. Product
group divisions develop new product lines and monitor ongoing and future production needs while the central
sales department coordinates actual purchases.
• Local or regional trade offices assist the management of this global supply base. These offices are responsible
for developing relationships with suppliers. In 2001, there were 36 trading service offices, five of which were
in China, in 29 countries, which supported over 2,000 suppliers.
• Supplier upgrading is managed by supply chain management initiatives and incentives. The regional trade
offices work with suppliers to upgrade performance continuously.
• Success can be summarized by the following critical factors.
• In-house production contributed to manufacturing and managerial competences, which cascaded down to
suppliers.
• Large volumes purchased by a central sales department allow coordination of orders which feed into global
retail outlets. This system also encourages low prices, and suppliers face cost-down demands: it is not
uncommon for this multi-store retailer to see a 5-10 per cent decrease in supplier prices annually.
• Effective distribution and warehouse management systems are linked with the retail outlets and benefit from a
just-in-time delivery system.
• Product design is associated with the company’s image. For this reason, the company is only interested in its
own product designs and will not purchase furniture designed by suppliers.
Source: Company interviews.
32
5. Case Study: Evaluating upgrading in the UK garden furniture market A value chain framework is applicable to three levels of investigation: the country/ regional
perspective, the organization of the industry and at the firm and strategy level. The macro
perspective includes the description of activities and specializations which take place in different
countries. This analysis can also divulge technological changes and upgrading trends. The
previous section concentrated on the upgrading trajectories of furniture producing countries in 11
wooden furniture sub-sectors. It noted that countries from Asia, notably China but also Vietnam,
Malaysia and Indonesia, experienced significant growth in most sub-sectors by way of process
upgrading strategies. The industrial organization can be characterized by monopolistic tendencies
and competition, barriers to entry and bargaining power (Grant, 1991). Firms can make use this
type of industry analysis to formulate positioning strategies along the lines suggested by Porter
(1990). Successful firms target niches within this structure to bring about superior rent positions.
Unimpeded buyer control over market access underpins one particular construction. At the firm
level, managers use an added-value calculus to ascertain the contribution - and risks - of direct
and indirect activities. This analysis reveals the firm’s internal hierarchy (Williamson, 1975) and
Box 2 Managing overseas suppliers: locally supplied designs
A multi-store retailer started as a family-owned operation in the UK during the Great Depression in the early 1930s. By
1959 the company had outlets throughout the UK. This retailer introduced its first overseas operation in the early 1960s
when it opened a store in Jamaica. In 2000, the company operated over 300 stores in 20 countries and employed 8,500
people. It sells electrical goods and carpets as well as furniture. Products are for the low to medium priced household
furniture markets. The company also operates retail outlets in developing countries and its brand name is recognised in
South-east Asia, southern Africa and the Caribbean.
The company’s presence in local retail markets facilitates the development of networks with local manufacturers. Local
manufacturers supply local retail outlets and, over time and if quality, product design and, most importantly price
criteria are met, then these local manufacturers are asked to join the retailer’s global supply network.
The company outsources 100 per cent of production But unlike its counterpart (see Box 3), it neither manufactures
itself, and nor does it assist process efficiency improvements among its suppliers. This company accepts products
designed by local manufacturers. For products that sell quickly in retail outlets, and inventories are not held for long
periods, the retailer will buy directly from local manufacturers. In addition, importing agents are used if:
• Items do not sell quickly
• Items require large inventories
• Market success of newly introduced items is uncertain.
Source: Company interviews.
33
strategic competence base (Prahalad and Hamel, 1990; Teece, Pisano and Shuen, 1997b). Such a
calculation can also prioritize upgrading efforts.
The buyer/producer relationship in the furniture value chain is paramount to any upgrading
trajectory. Buyers are the catalysts in this chain and their central role is two fold: first, buyers
source and purchase items from producers and, second, buyers sell these items to retailers or
directly to final end users. Buyers will, on occasion, assist producers with upgrading initiatives.
Large multi store retailers tend to provide technical and organizational upgrading than smaller
size buyers for example (Kaplinsky, Morris and Readman, 2002). But buyers, no matter what
their size, will evaluate producer upgrading. Below, the UK wooden garden furniture market is
introduced to illustrate how producer upgrading is measured and evaluated by one important
buyer.
Garden furniture market in the UK
The UK domestic market for outdoor leisure goods is big business. In 2003, UK consumers
purchased US$3.5 billon worth of outdoor furniture, barbecues, maintenance inputs, and other
outdoor products, a 24 per cent increase on 2000 (Key Note 2005). A robust economy, with
higher levels of disposable income and a booming housing market (and the associated
expectation that home improvements can maintain or increase values), has contributed to
increased expenditure on outdoor furniture.
This growing demand for outdoor furniture has been satisfied primarily by imports. Imports to
the UK of “other” wooden furniture (of which garden furniture is a significant component)
increased by 452% from 1996 to 2003 and was worth US$557 million in 2003.13 The 10 leading
exporters of other wooden furniture to the UK in 2003 are presented in Table 9. China and
Poland are by far the largest, exporting US$76.8 million and US$74.2 million of furniture
respectively to the UK.
Upgrading performance of garden furniture
Figure 10 demonstrates that imports of garden furniture to the UK have increased, particularly
from outside the EU. Between 1996 and 2003, exporting countries jockeyed for market share
with clear winners and losers emerging. The aggregate market share of four non-EU countries
grew from 17 per cent in 1996 to 37 per cent in 2003.14 Poland led the way, increasing its market
share from 3.3 per cent to 13.3 per cent, followed by China (up from 7 per cent to 13.8 per cent).
13 “Other” wooden furniture (HS 94036090) includes all wooden furniture except office, shops, kitchens, dining rooms, living rooms and bedrooms furniture, and seats. 14 The data for Indonesia is inconclusive and has not been included in this analysis.
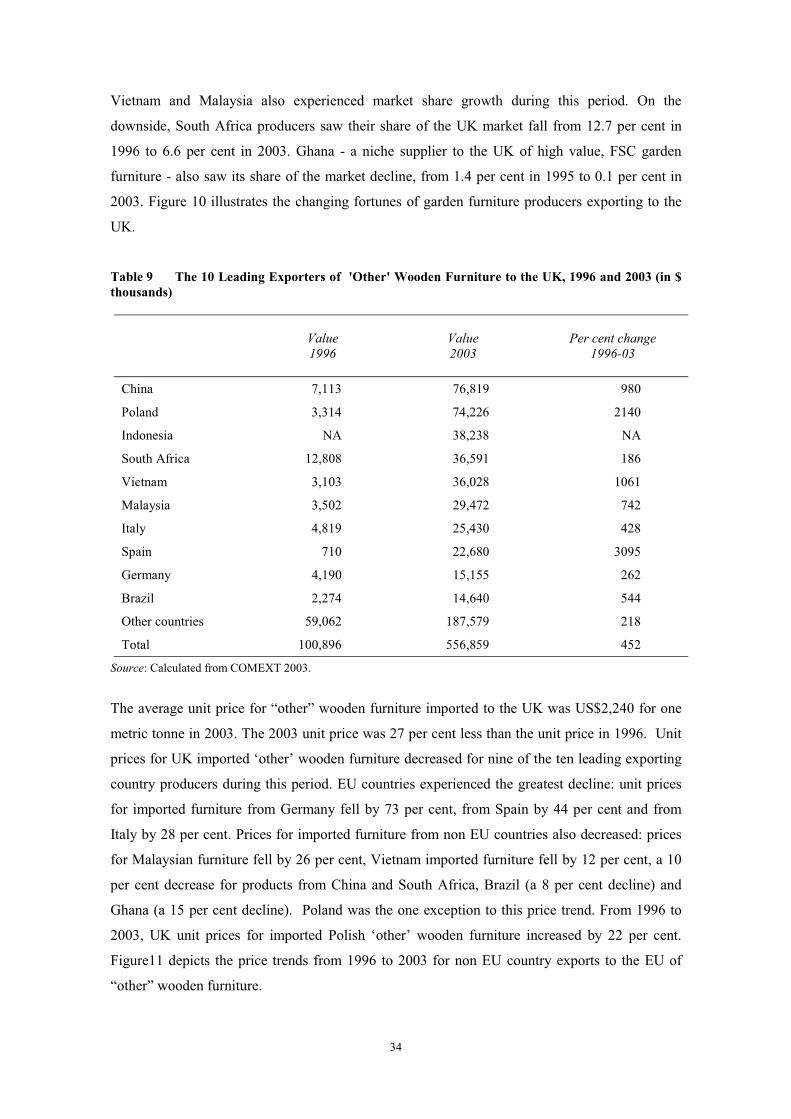
34
Vietnam and Malaysia also experienced market share growth during this period. On the
downside, South Africa producers saw their share of the UK market fall from 12.7 per cent in
1996 to 6.6 per cent in 2003. Ghana - a niche supplier to the UK of high value, FSC garden
furniture - also saw its share of the market decline, from 1.4 per cent in 1995 to 0.1 per cent in
2003. Figure 10 illustrates the changing fortunes of garden furniture producers exporting to the
UK.
Table 9 The 10 Leading Exporters of 'Other' Wooden Furniture to the UK, 1996 and 2003 (in $ thousands)
Value 1996
Value 2003
Per cent change 1996-03
China 7,113 76,819 980
Poland 3,314 74,226 2140
Indonesia NA 38,238 NA
South Africa 12,808 36,591 186
Vietnam 3,103 36,028 1061
Malaysia 3,502 29,472 742
Italy 4,819 25,430 428
Spain 710 22,680 3095
Germany 4,190 15,155 262
Brazil 2,274 14,640 544
Other countries 59,062 187,579 218
Total 100,896 556,859 452
Source: Calculated from COMEXT 2003.
The average unit price for “other” wooden furniture imported to the UK was US$2,240 for one
metric tonne in 2003. The 2003 unit price was 27 per cent less than the unit price in 1996. Unit
prices for UK imported ‘other’ wooden furniture decreased for nine of the ten leading exporting
country producers during this period. EU countries experienced the greatest decline: unit prices
for imported furniture from Germany fell by 73 per cent, from Spain by 44 per cent and from
Italy by 28 per cent. Prices for imported furniture from non EU countries also decreased: prices
for Malaysian furniture fell by 26 per cent, Vietnam imported furniture fell by 12 per cent, a 10
per cent decrease for products from China and South Africa, Brazil (a 8 per cent decline) and
Ghana (a 15 per cent decline). Poland was the one exception to this price trend. From 1996 to
2003, UK unit prices for imported Polish ‘other’ wooden furniture increased by 22 per cent.
Figure11 depicts the price trends from 1996 to 2003 for non EU country exports to the EU of
“other” wooden furniture.
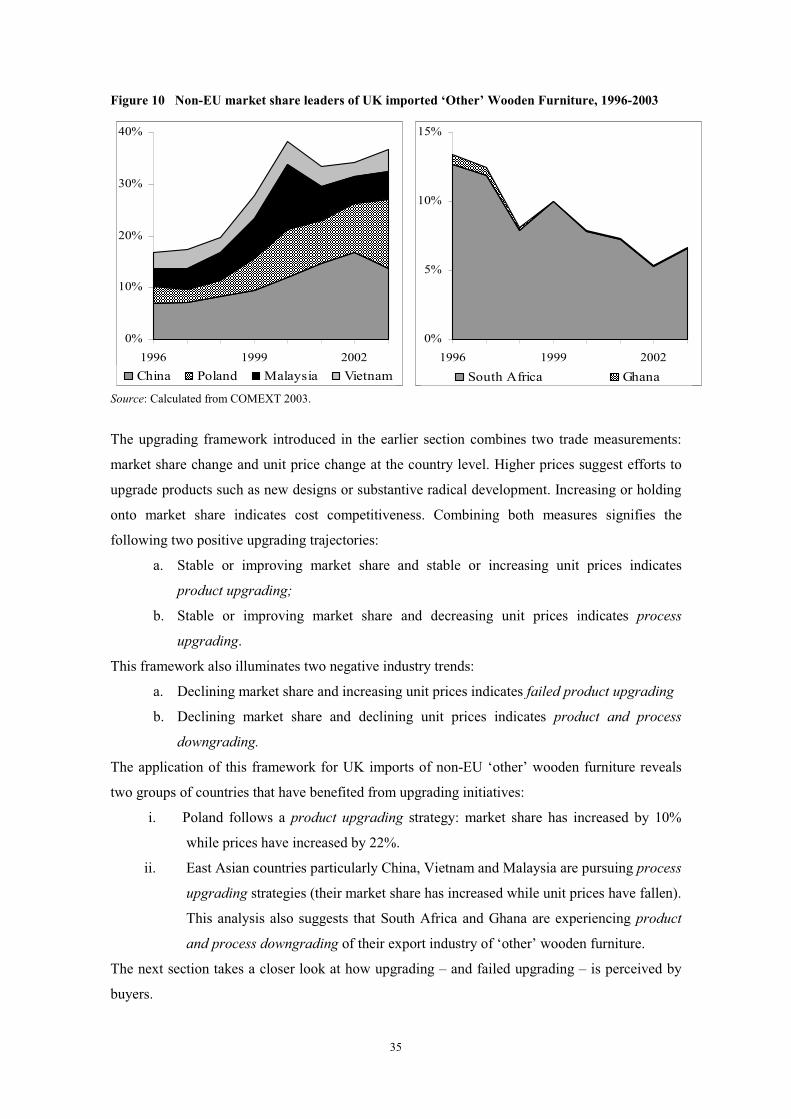
35
0%
10%
20%
30%
40%
1996 1999 2002China Poland Malaysia Vietnam
0%
5%
10%
15%
1996 1999 2002
South Africa Ghana
Figure 10 Non-EU market share leaders of UK imported ‘Other’ Wooden Furniture, 1996-2003
Source: Calculated from COMEXT 2003.
The upgrading framework introduced in the earlier section combines two trade measurements:
market share change and unit price change at the country level. Higher prices suggest efforts to
upgrade products such as new designs or substantive radical development. Increasing or holding
onto market share indicates cost competitiveness. Combining both measures signifies the
following two positive upgrading trajectories:
a. Stable or improving market share and stable or increasing unit prices indicates
product upgrading;
b. Stable or improving market share and decreasing unit prices indicates process
upgrading.
This framework also illuminates two negative industry trends:
a. Declining market share and increasing unit prices indicates failed product upgrading
b. Declining market share and declining unit prices indicates product and process
downgrading.
The application of this framework for UK imports of non-EU ‘other’ wooden furniture reveals
two groups of countries that have benefited from upgrading initiatives:
i. Poland follows a product upgrading strategy: market share has increased by 10%
while prices have increased by 22%.
ii. East Asian countries particularly China, Vietnam and Malaysia are pursuing process
upgrading strategies (their market share has increased while unit prices have fallen).
This analysis also suggests that South Africa and Ghana are experiencing product
and process downgrading of their export industry of ‘other’ wooden furniture.
The next section takes a closer look at how upgrading – and failed upgrading – is perceived by
buyers.
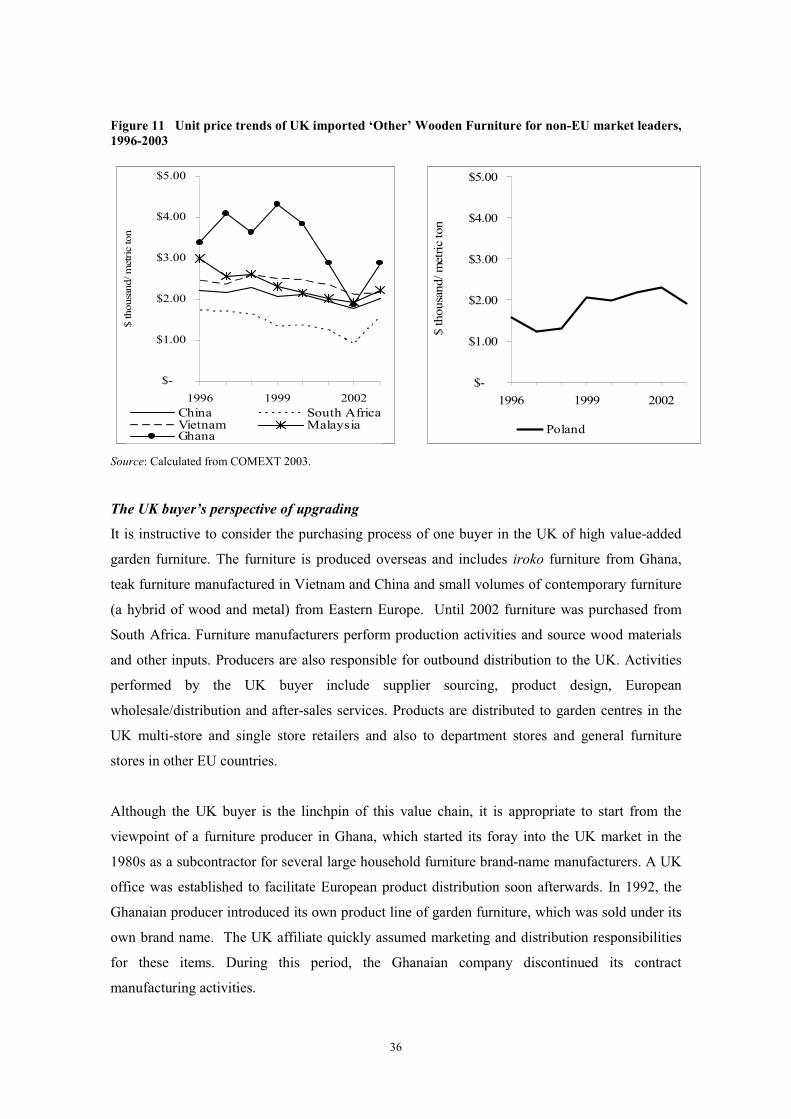
36
$-
$1.00
$2.00
$3.00
$4.00
$5.00
1996 1999 2002
$ th
ousa
nd/ m
etric
ton
China South AfricaVietnam MalaysiaGhana
$-
$1.00
$2.00
$3.00
$4.00
$5.00
1996 1999 2002
$ th
ousa
nd/ m
etric
ton
Poland
Figure 11 Unit price trends of UK imported ‘Other’ Wooden Furniture for non-EU market leaders, 1996-2003
Source: Calculated from COMEXT 2003.
The UK buyer’s perspective of upgrading
It is instructive to consider the purchasing process of one buyer in the UK of high value-added
garden furniture. The furniture is produced overseas and includes iroko furniture from Ghana,
teak furniture manufactured in Vietnam and China and small volumes of contemporary furniture
(a hybrid of wood and metal) from Eastern Europe. Until 2002 furniture was purchased from
South Africa. Furniture manufacturers perform production activities and source wood materials
and other inputs. Producers are also responsible for outbound distribution to the UK. Activities
performed by the UK buyer include supplier sourcing, product design, European
wholesale/distribution and after-sales services. Products are distributed to garden centres in the
UK multi-store and single store retailers and also to department stores and general furniture
stores in other EU countries.
Although the UK buyer is the linchpin of this value chain, it is appropriate to start from the
viewpoint of a furniture producer in Ghana, which started its foray into the UK market in the
1980s as a subcontractor for several large household furniture brand-name manufacturers. A UK
office was established to facilitate European product distribution soon afterwards. In 1992, the
Ghanaian producer introduced its own product line of garden furniture, which was sold under its
own brand name. The UK affiliate quickly assumed marketing and distribution responsibilities
for these items. During this period, the Ghanaian company discontinued its contract
manufacturing activities.
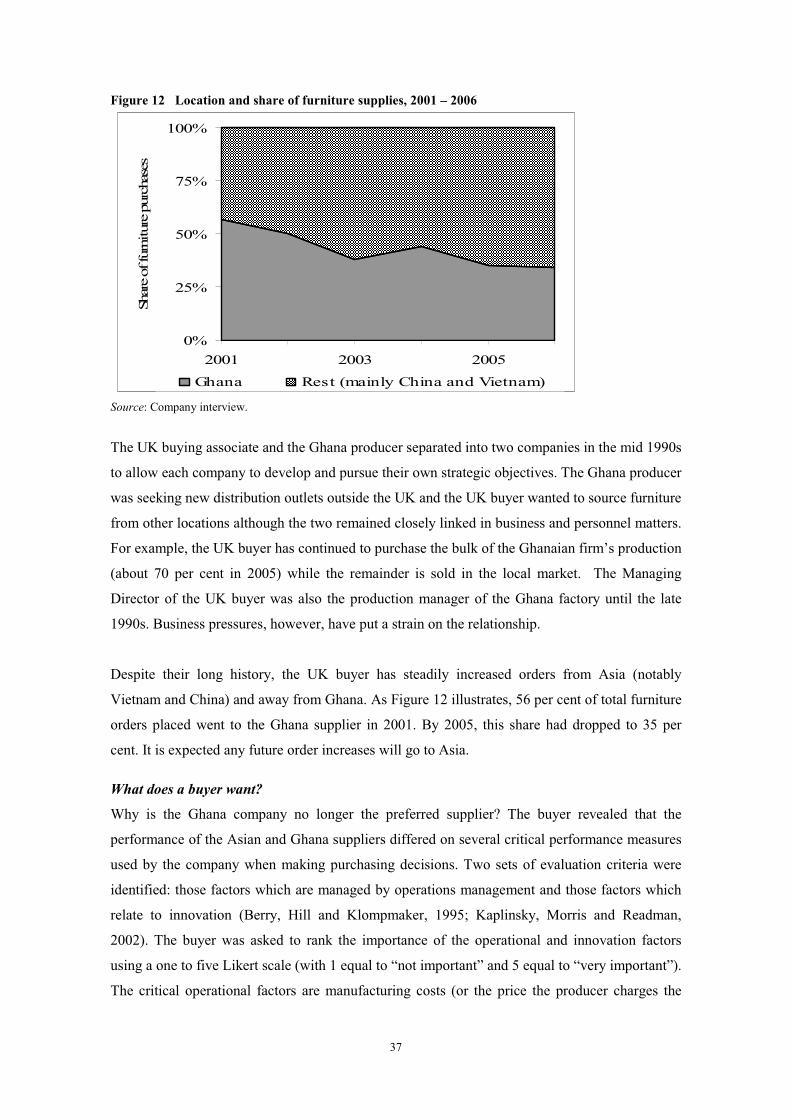
37
Figure 12 Location and share of furniture supplies, 2001 – 2006
0%
25%
50%
75%
100%
2001 2003 2005
Shar
e of
furn
iture
pur
chas
es
Ghana Rest (mainly China and Vietnam)
Source: Company interview.
The UK buying associate and the Ghana producer separated into two companies in the mid 1990s
to allow each company to develop and pursue their own strategic objectives. The Ghana producer
was seeking new distribution outlets outside the UK and the UK buyer wanted to source furniture
from other locations although the two remained closely linked in business and personnel matters.
For example, the UK buyer has continued to purchase the bulk of the Ghanaian firm’s production
(about 70 per cent in 2005) while the remainder is sold in the local market. The Managing
Director of the UK buyer was also the production manager of the Ghana factory until the late
1990s. Business pressures, however, have put a strain on the relationship.
Despite their long history, the UK buyer has steadily increased orders from Asia (notably
Vietnam and China) and away from Ghana. As Figure 12 illustrates, 56 per cent of total furniture
orders placed went to the Ghana supplier in 2001. By 2005, this share had dropped to 35 per
cent. It is expected any future order increases will go to Asia.
What does a buyer want?
Why is the Ghana company no longer the preferred supplier? The buyer revealed that the
performance of the Asian and Ghana suppliers differed on several critical performance measures
used by the company when making purchasing decisions. Two sets of evaluation criteria were
identified: those factors which are managed by operations management and those factors which
relate to innovation (Berry, Hill and Klompmaker, 1995; Kaplinsky, Morris and Readman,
2002). The buyer was asked to rank the importance of the operational and innovation factors
using a one to five Likert scale (with 1 equal to “not important” and 5 equal to “very important”).
The critical operational factors are manufacturing costs (or the price the producer charges the
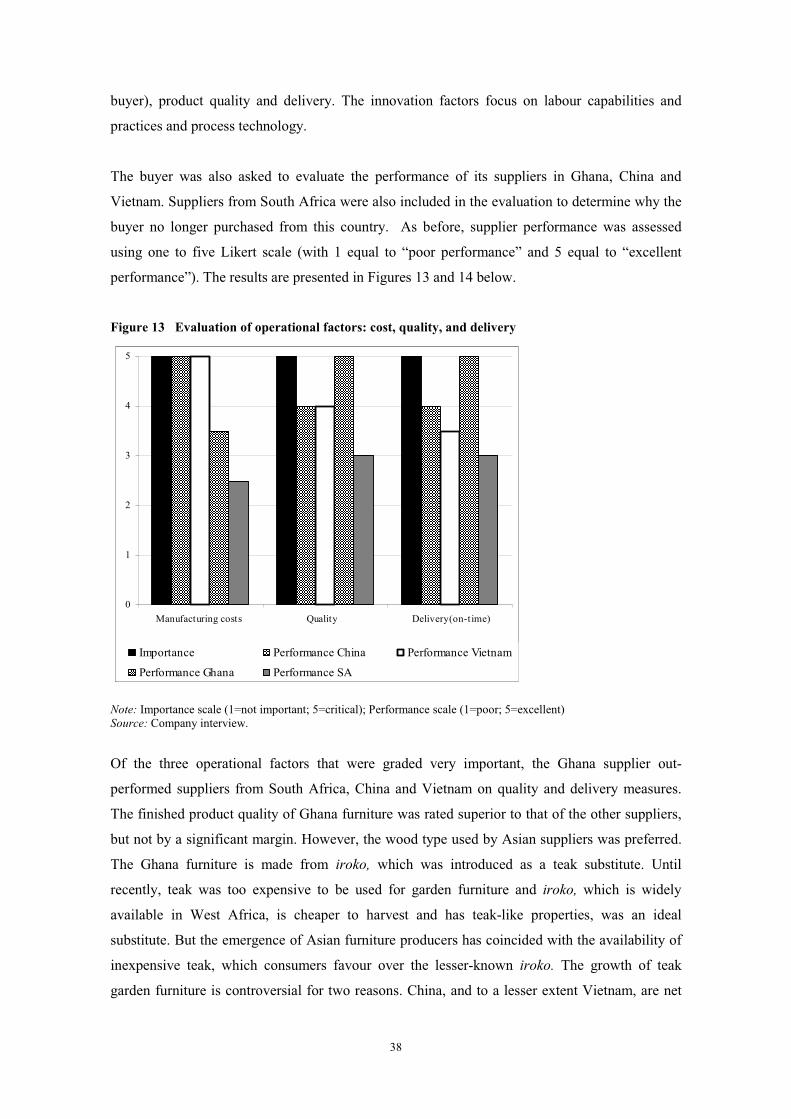
38
buyer), product quality and delivery. The innovation factors focus on labour capabilities and
practices and process technology.
The buyer was also asked to evaluate the performance of its suppliers in Ghana, China and
Vietnam. Suppliers from South Africa were also included in the evaluation to determine why the
buyer no longer purchased from this country. As before, supplier performance was assessed
using one to five Likert scale (with 1 equal to “poor performance” and 5 equal to “excellent
performance”). The results are presented in Figures 13 and 14 below.
Figure 13 Evaluation of operational factors: cost, quality, and delivery
0
1
2
3
4
5
Manufacturing costs Quality Delivery(on-time)
Importance Performance China Performance Vietnam
Performance Ghana Performance SA
Note: Importance scale (1=not important; 5=critical); Performance scale (1=poor; 5=excellent) Source: Company interview.
Of the three operational factors that were graded very important, the Ghana supplier out-
performed suppliers from South Africa, China and Vietnam on quality and delivery measures.
The finished product quality of Ghana furniture was rated superior to that of the other suppliers,
but not by a significant margin. However, the wood type used by Asian suppliers was preferred.
The Ghana furniture is made from iroko, which was introduced as a teak substitute. Until
recently, teak was too expensive to be used for garden furniture and iroko, which is widely
available in West Africa, is cheaper to harvest and has teak-like properties, was an ideal
substitute. But the emergence of Asian furniture producers has coincided with the availability of
inexpensive teak, which consumers favour over the lesser-known iroko. The growth of teak
garden furniture is controversial for two reasons. China, and to a lesser extent Vietnam, are net
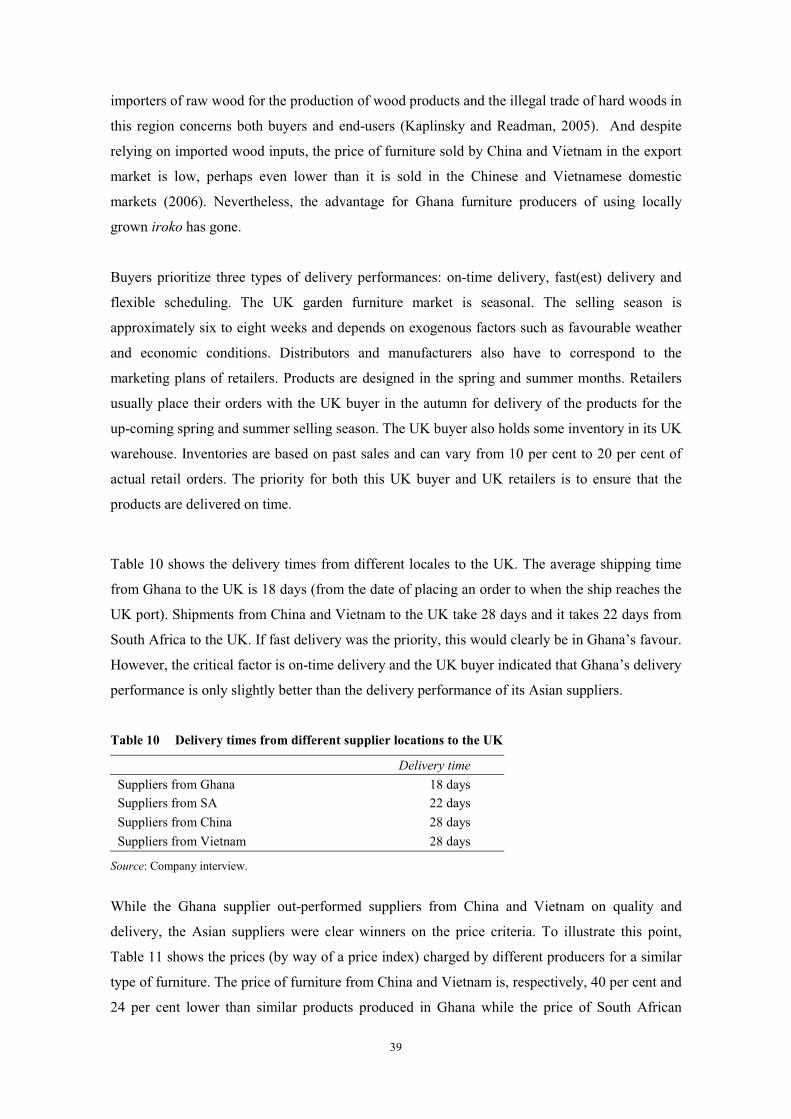
39
importers of raw wood for the production of wood products and the illegal trade of hard woods in
this region concerns both buyers and end-users (Kaplinsky and Readman, 2005). And despite
relying on imported wood inputs, the price of furniture sold by China and Vietnam in the export
market is low, perhaps even lower than it is sold in the Chinese and Vietnamese domestic
markets (2006). Nevertheless, the advantage for Ghana furniture producers of using locally
grown iroko has gone.
Buyers prioritize three types of delivery performances: on-time delivery, fast(est) delivery and
flexible scheduling. The UK garden furniture market is seasonal. The selling season is
approximately six to eight weeks and depends on exogenous factors such as favourable weather
and economic conditions. Distributors and manufacturers also have to correspond to the
marketing plans of retailers. Products are designed in the spring and summer months. Retailers
usually place their orders with the UK buyer in the autumn for delivery of the products for the
up-coming spring and summer selling season. The UK buyer also holds some inventory in its UK
warehouse. Inventories are based on past sales and can vary from 10 per cent to 20 per cent of
actual retail orders. The priority for both this UK buyer and UK retailers is to ensure that the
products are delivered on time.
Table 10 shows the delivery times from different locales to the UK. The average shipping time
from Ghana to the UK is 18 days (from the date of placing an order to when the ship reaches the
UK port). Shipments from China and Vietnam to the UK take 28 days and it takes 22 days from
South Africa to the UK. If fast delivery was the priority, this would clearly be in Ghana’s favour.
However, the critical factor is on-time delivery and the UK buyer indicated that Ghana’s delivery
performance is only slightly better than the delivery performance of its Asian suppliers.
Table 10 Delivery times from different supplier locations to the UK
Delivery time Suppliers from Ghana 18 days Suppliers from SA 22 days Suppliers from China 28 days Suppliers from Vietnam 28 days
Source: Company interview.
While the Ghana supplier out-performed suppliers from China and Vietnam on quality and
delivery, the Asian suppliers were clear winners on the price criteria. To illustrate this point,
Table 11 shows the prices (by way of a price index) charged by different producers for a similar
type of furniture. The price of furniture from China and Vietnam is, respectively, 40 per cent and
24 per cent lower than similar products produced in Ghana while the price of South African
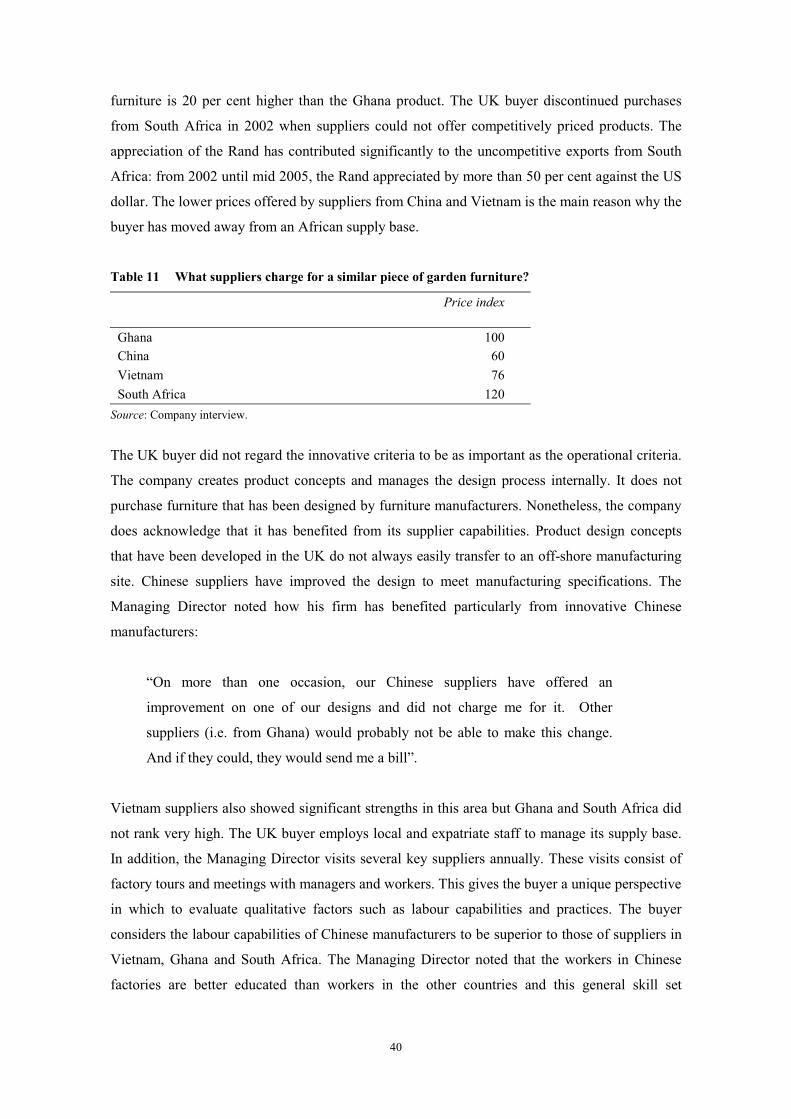
40
furniture is 20 per cent higher than the Ghana product. The UK buyer discontinued purchases
from South Africa in 2002 when suppliers could not offer competitively priced products. The
appreciation of the Rand has contributed significantly to the uncompetitive exports from South
Africa: from 2002 until mid 2005, the Rand appreciated by more than 50 per cent against the US
dollar. The lower prices offered by suppliers from China and Vietnam is the main reason why the
buyer has moved away from an African supply base.
Table 11 What suppliers charge for a similar piece of garden furniture?
Price index
Ghana 100 China 60 Vietnam 76 South Africa 120
Source: Company interview.
The UK buyer did not regard the innovative criteria to be as important as the operational criteria.
The company creates product concepts and manages the design process internally. It does not
purchase furniture that has been designed by furniture manufacturers. Nonetheless, the company
does acknowledge that it has benefited from its supplier capabilities. Product design concepts
that have been developed in the UK do not always easily transfer to an off-shore manufacturing
site. Chinese suppliers have improved the design to meet manufacturing specifications. The
Managing Director noted how his firm has benefited particularly from innovative Chinese
manufacturers:
“On more than one occasion, our Chinese suppliers have offered an
improvement on one of our designs and did not charge me for it. Other
suppliers (i.e. from Ghana) would probably not be able to make this change.
And if they could, they would send me a bill”.
Vietnam suppliers also showed significant strengths in this area but Ghana and South Africa did
not rank very high. The UK buyer employs local and expatriate staff to manage its supply base.
In addition, the Managing Director visits several key suppliers annually. These visits consist of
factory tours and meetings with managers and workers. This gives the buyer a unique perspective
in which to evaluate qualitative factors such as labour capabilities and practices. The buyer
considers the labour capabilities of Chinese manufacturers to be superior to those of suppliers in
Vietnam, Ghana and South Africa. The Managing Director noted that the workers in Chinese
factories are better educated than workers in the other countries and this general skill set
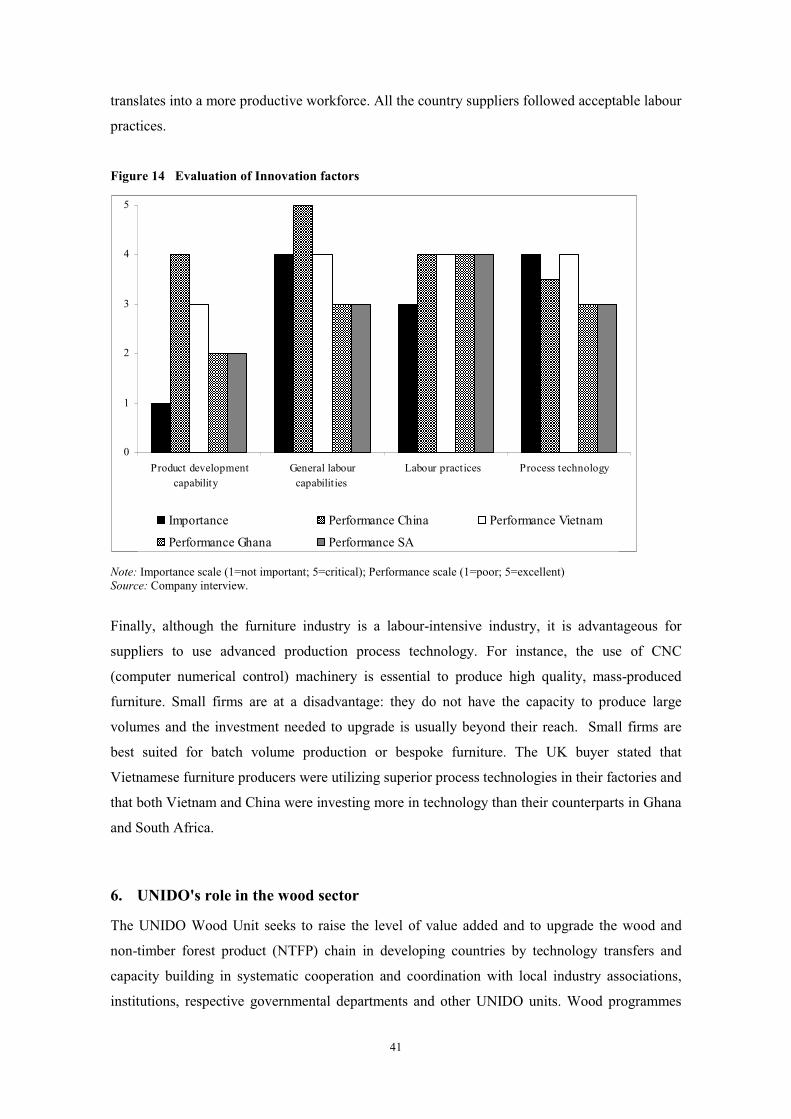
41
0
1
2
3
4
5
Product developmentcapability
General labourcapabilities
Labour practices Process technology
Importance Performance China Performance Vietnam
Performance Ghana Performance SA
translates into a more productive workforce. All the country suppliers followed acceptable labour
practices.
Figure 14 Evaluation of Innovation factors
Note: Importance scale (1=not important; 5=critical); Performance scale (1=poor; 5=excellent)Source: Company interview.
Finally, although the furniture industry is a labour-intensive industry, it is advantageous for
suppliers to use advanced production process technology. For instance, the use of CNC
(computer numerical control) machinery is essential to produce high quality, mass-produced
furniture. Small firms are at a disadvantage: they do not have the capacity to produce large
volumes and the investment needed to upgrade is usually beyond their reach. Small firms are
best suited for batch volume production or bespoke furniture. The UK buyer stated that
Vietnamese furniture producers were utilizing superior process technologies in their factories and
that both Vietnam and China were investing more in technology than their counterparts in Ghana
and South Africa.
6. UNIDO's role in the wood sector
The UNIDO Wood Unit seeks to raise the level of value added and to upgrade the wood and
non-timber forest product (NTFP) chain in developing countries by technology transfers and
capacity building in systematic cooperation and coordination with local industry associations,
institutions, respective governmental departments and other UNIDO units. Wood programmes
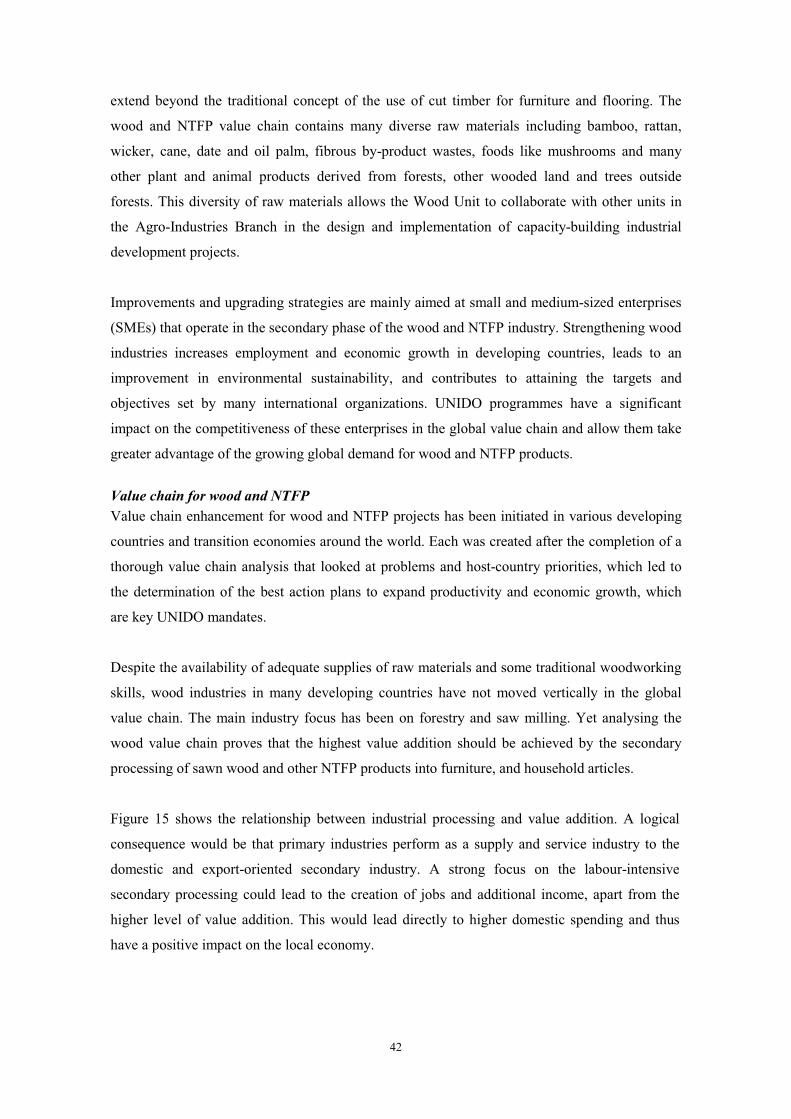
42
extend beyond the traditional concept of the use of cut timber for furniture and flooring. The
wood and NTFP value chain contains many diverse raw materials including bamboo, rattan,
wicker, cane, date and oil palm, fibrous by-product wastes, foods like mushrooms and many
other plant and animal products derived from forests, other wooded land and trees outside
forests. This diversity of raw materials allows the Wood Unit to collaborate with other units in
the Agro-Industries Branch in the design and implementation of capacity-building industrial
development projects.
Improvements and upgrading strategies are mainly aimed at small and medium-sized enterprises
(SMEs) that operate in the secondary phase of the wood and NTFP industry. Strengthening wood
industries increases employment and economic growth in developing countries, leads to an
improvement in environmental sustainability, and contributes to attaining the targets and
objectives set by many international organizations. UNIDO programmes have a significant
impact on the competitiveness of these enterprises in the global value chain and allow them take
greater advantage of the growing global demand for wood and NTFP products.
Value chain for wood and NTFP Value chain enhancement for wood and NTFP projects has been initiated in various developing
countries and transition economies around the world. Each was created after the completion of a
thorough value chain analysis that looked at problems and host-country priorities, which led to
the determination of the best action plans to expand productivity and economic growth, which
are key UNIDO mandates.
Despite the availability of adequate supplies of raw materials and some traditional woodworking
skills, wood industries in many developing countries have not moved vertically in the global
value chain. The main industry focus has been on forestry and saw milling. Yet analysing the
wood value chain proves that the highest value addition should be achieved by the secondary
processing of sawn wood and other NTFP products into furniture, and household articles.
Figure 15 shows the relationship between industrial processing and value addition. A logical
consequence would be that primary industries perform as a supply and service industry to the
domestic and export-oriented secondary industry. A strong focus on the labour-intensive
secondary processing could lead to the creation of jobs and additional income, apart from the
higher level of value addition. This would lead directly to higher domestic spending and thus
have a positive impact on the local economy.
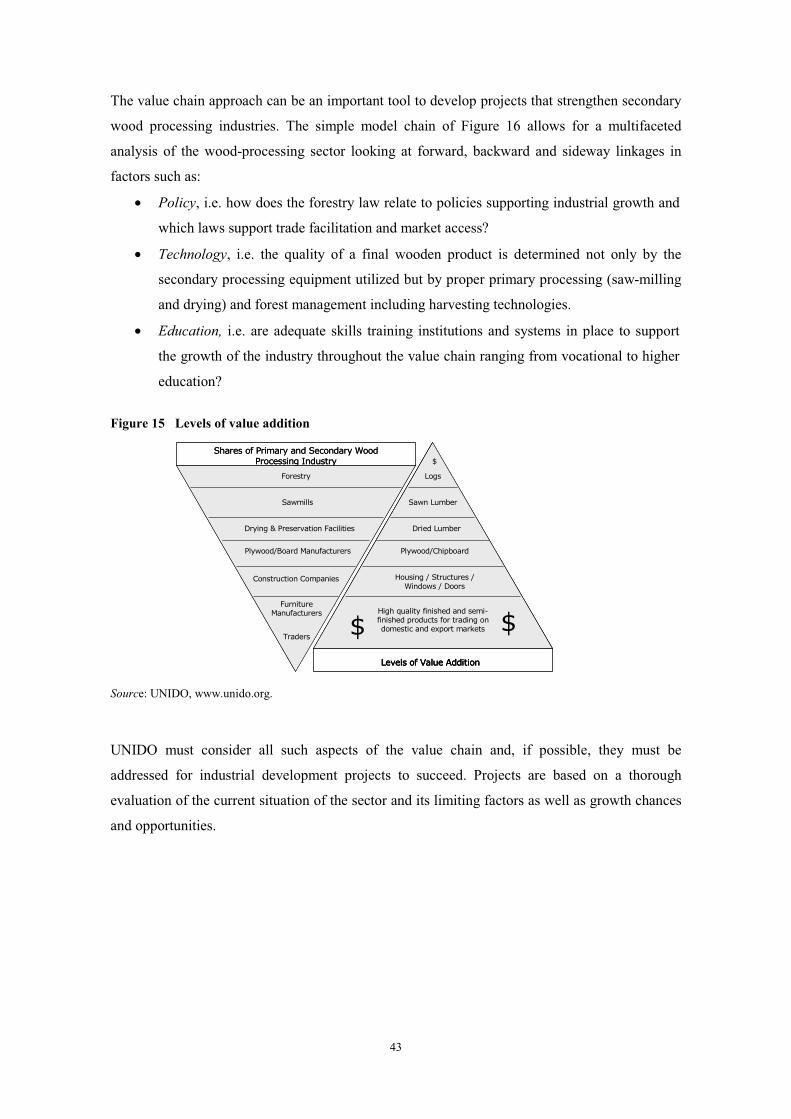
43
��������
�� ���
���� ����������������
������������������������
��������� �������� ���
��� ������������� ����� � � ��
���������� ��������������� ����������� ���!�������
"���������#����$�� � ��
���"��%��
& ���'�� ���� � ����������� (� � ��������������������� ������������ ������)�������*���
���������� �%���
&��� ����������������� �������������
�� ���"��%��
+
+ +
"���
,�����
��������
�� ���
���� ����������������
������������������������
��������� �������� ���
��� ������������� ����� � � ��
���������� ��������������� ����������� ���!�������
"���������#����$�� � ��
���"��%��
& ���'�� ���� � ����������� (� � ��������������������� ������������ ������)�������*���
���������� �%���
&��� ����������������� �������������
�� ���"��%��
+
+ +
"���
"���������#����$�� � ��
���"��%��
& ���'�� ���� � ����������� (� � ��������������������� ������������ ������)�������*���
���������� �%���
&��� ����������������� �������������
�� ���"��%��
+
+ +
"���
,�����
The value chain approach can be an important tool to develop projects that strengthen secondary
wood processing industries. The simple model chain of Figure 16 allows for a multifaceted
analysis of the wood-processing sector looking at forward, backward and sideway linkages in
factors such as:
• Policy, i.e. how does the forestry law relate to policies supporting industrial growth and
which laws support trade facilitation and market access?
• Technology, i.e. the quality of a final wooden product is determined not only by the
secondary processing equipment utilized but by proper primary processing (saw-milling
and drying) and forest management including harvesting technologies.
• Education, i.e. are adequate skills training institutions and systems in place to support
the growth of the industry throughout the value chain ranging from vocational to higher
education?
Figure 15 Levels of value addition
Source: UNIDO, www.unido.org.
UNIDO must consider all such aspects of the value chain and, if possible, they must be
addressed for industrial development projects to succeed. Projects are based on a thorough
evaluation of the current situation of the sector and its limiting factors as well as growth chances
and opportunities.
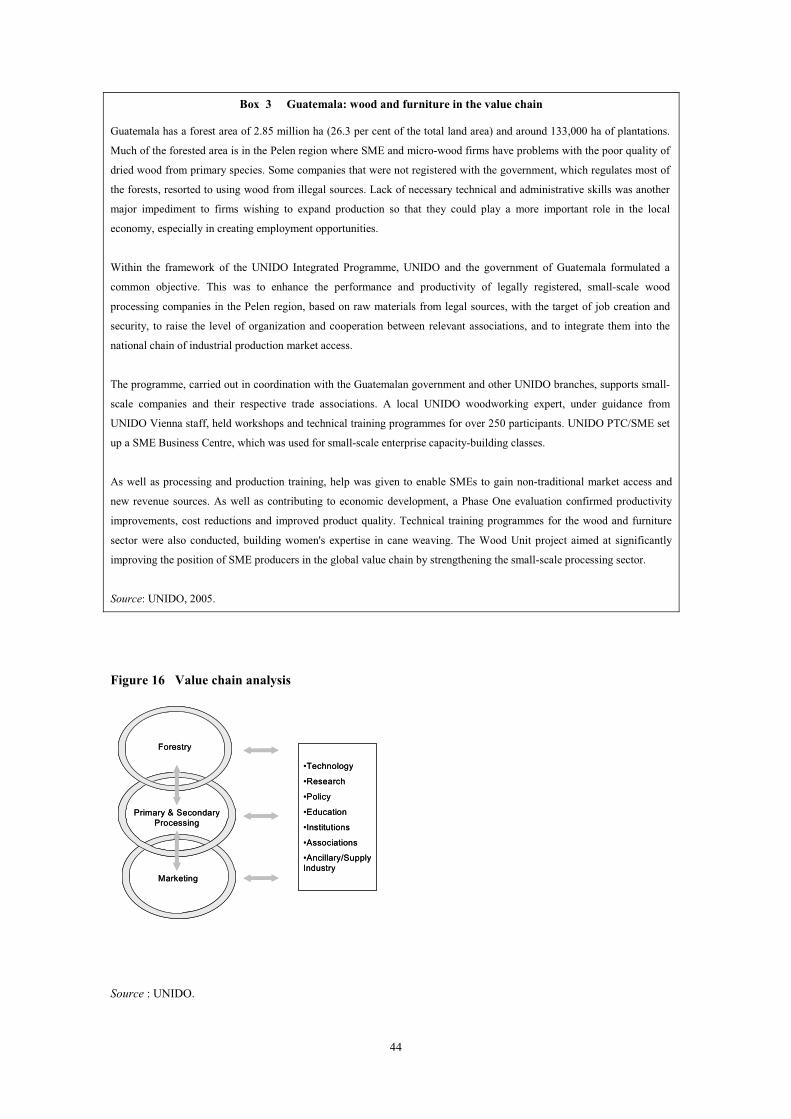
44
��������
����� � ���������
��������
��������
�����������
���������
�����
���������
�����������
�����������
������������ ��
��������
��������
����� � ���������
��������
��������
�����������
���������
�����
���������
�����������
�����������
������������ ��
��������
Box 3 Guatemala: wood and furniture in the value chain
Guatemala has a forest area of 2.85 million ha (26.3 per cent of the total land area) and around 133,000 ha of plantations.
Much of the forested area is in the Pelen region where SME and micro-wood firms have problems with the poor quality of
dried wood from primary species. Some companies that were not registered with the government, which regulates most of
the forests, resorted to using wood from illegal sources. Lack of necessary technical and administrative skills was another
major impediment to firms wishing to expand production so that they could play a more important role in the local
economy, especially in creating employment opportunities.
Within the framework of the UNIDO Integrated Programme, UNIDO and the government of Guatemala formulated a
common objective. This was to enhance the performance and productivity of legally registered, small-scale wood
processing companies in the Pelen region, based on raw materials from legal sources, with the target of job creation and
security, to raise the level of organization and cooperation between relevant associations, and to integrate them into the
national chain of industrial production market access.
The programme, carried out in coordination with the Guatemalan government and other UNIDO branches, supports small-
scale companies and their respective trade associations. A local UNIDO woodworking expert, under guidance from
UNIDO Vienna staff, held workshops and technical training programmes for over 250 participants. UNIDO PTC/SME set
up a SME Business Centre, which was used for small-scale enterprise capacity-building classes.
As well as processing and production training, help was given to enable SMEs to gain non-traditional market access and
new revenue sources. As well as contributing to economic development, a Phase One evaluation confirmed productivity
improvements, cost reductions and improved product quality. Technical training programmes for the wood and furniture
sector were also conducted, building women's expertise in cane weaving. The Wood Unit project aimed at significantly
improving the position of SME producers in the global value chain by strengthening the small-scale processing sector.
Source: UNIDO, 2005.
Figure 16 Value chain analysis
Source : UNIDO.
45
7. Implications for industrial policy
What conclusions can be drawn from this analysis of changing global production and export
shares in the wooden furniture sector and what are the implications for industrial policy? One
outcome is the seemingly contradictory importance of both historic industry trajectories and the
advantages of being a latecomer. The striking feature of this sector, unlike, for example, the
clothing industry, is that it allows for production and export dynamism by two very different
types of economies. On the one hand, there are industries with a long history and path-
dependency such as Italy and Denmark, where the furniture sector supports relatively high
incomes. On the other hand, there are new dynamic entrants such as China and Poland, which
have risen rapidly to prominent positions, but whose industries provide for lower earnings.
This shows that it is therefore possible for many types of producers to coexist, often in
production-sharing symbiosis, or through close links between northern buyers and southern
producers. But, equally, what the data also show is that in the context of rapidly intensifying
global competition, industries cannot continue to thrive without constant innovation as well as
the ability to upgrade more rapidly than competitors. In some cases, there may be a path-
dependent dynamism in a cluster, which means that upgrading occurs independently of
government support. But more often this upgrading reflects support provided by government,
central or regional, and a variety of supportive agencies in the national and regional system of
innovation. What might this system of policy support look like?
Three levels of policy
Three levels of industrial policy can be identified (Lall and Teubal 1998; Barnes, Kaplinsky and
Morris 2004). These policy instruments can be implemented by national governments, support
agencies such as UNIDO and private-public partnership organizations. The first is a series of
functional policies to improve market performance. For example, policies may be introduced
which are designed to enhance competitive pressures. These include competitions policy to
promote domestic competition as well as trade policy to foster competition from external
sources. Market-enhancing competition policies also include reforming the financial sector to
make financial intermediation less costly, more transparent and equally available to all strata of
the economy. Another type of functional policy is that designed to promote a stable economic
environment, for example a stable exchange rate and low inflation. Policies affecting the
exchange rate also need to provide for competitive insertion into the global economy.
The second category comprises horizontal policies. These work across sectors, and are targeted
at generic market failures. They include policies designed to promote greater R&D, encourage
training and provide efficient infrastructure. Even critics of the role played by governments in the
46
success of the Asian Tiger economies during the 1960s, 1970s and 1980s acknowledge the role
played by these horizontal policies in targeting generic market failures (World-Bank 1993).
The third and final level is selective policies designed to promote the advance of particular
sectors (for example, preferential access to capital or sector-specific subsidies) or particular firms
(for example, the promotion of “national champions”). These will characteristically offer specific
incentives as long as they are compatible with WTO procedures, support for sectorally focused
research and technology organizations (RTOs) and the encouragement of a specialized producer-
services sector.
It is important that a comprehensive approach is taken to the three policies, so that they are
mutually supportive. For example, a selective policy to promote the wood furniture sector would
require a stable macroeconomic environment, a competitive exchange rate and an effective
financial sector. Horizontal policies operating in the economy at large would provide for a labour
force with adequate general skills, and support for investments in product and process
development and local clusters of innovation through regional policy support. Finally, a range of
specific sectoral support mechanisms might be introduced, to develop wood-furniture specific
skills, for example to promote furniture design centres and support furniture exporters attending
international exhibitions.
It is also important that the degree of refinement of industrial policy reflects the competences and
integrity of government. A highly nuanced sectoral policy in a corrupt society is more likely to
promote rent-seeking behaviour than to deliver sectoral success. UNIDO has an important role
here, not only in providing governments with the support required for integrated and self-
reinforcing sets of industrial policies, but also in assisting governments to gauge the degree of
refinement appropriate to their administrative capabilities.
Targeting value chains and systemic competitiveness
As has been seen, a dominant characteristic of contemporary economic success is a clear division
of labour, in which firms concentrate on core competences and outsource other activities to
suppliers or customers. A necessary accompaniment to this is that these extended production
chains achieve systemic efficiency—a chain is only as strong as its weakest link. Increasingly,
furniture firms participating in global trade find themselves inserted into governed global value
chains.
How do local manufacturers fit into these value chains? The furniture industry is an example of a
buyer-driven value chain, which means that manufacturers are subordinate to buyers (Gereffi and
47
Korzeniewicz 1994). The future of the local furniture manufacturer, therefore, will generally be
tied closely to that of its customers. Bearing in mind that a value chain is only as competitive as
its weakest link, more and more governors are putting resources into supply chain management,
and then into supply chain learning. The major issues of an effective value chain policy include
the following stages:
1. Wake-up call. The key governing party in the chain has to recognize that it has a problem
in its own operations, requiring it to restructure in order to meet competitive pressures.
This restructuring may either be proactive, in which case the chain is a first-mover, or
reactive.
2. Internal change. Having recognized the need to upgrade, the governor has first to
improve its internal operations.
3. Targeting value chain efficiency. Having recognized the need to change its internal
operations, and having taken action to do so, since this is a necessary precursor to supply
chain management, the governor must recognize the need for its own value chain to
become more effective.
4. Rationalization of the vendor/customer base. Usually the first step the governor needs to
take will be the rationalization of its supply or customer base.
5. Communication of new requirements to vendors. Having rationalized the supply base,
the governor then needs to communicate its needs, generally with regard to quality, cost
and delivery, to its supply base.
6. Monitoring and sanctioning new performance by suppliers. Supplier performance then
has to be measured. Deficient suppliers need to be negatively sanctioned, and this may or
may not be complemented by positive rewards to those suppliers that perform well.
7. Supply chain learning. So far, all of the above steps are relatively easy, and are only the
basis for a process of actively assisting suppliers to upgrade their operations. The really
sophisticated value-chain governors will then go on to recognize that not only can they
assist their suppliers to upgrade, but can also learn from them as well.
The state and supportive agencies such as UNIDO have an important role to play in chain
coordination, even if they are not the active chain coordinator. This is particularly the case in
economies which are developing an industry as opposed to those which already have mature
industries inserted into global value chains. As Rodrik has observed, while it is true that
government-failure is endemic, so too are market failure and firm failure, and the private sector
on its own often makes inappropriate or inefficient investments. Therefore, what is needed is an
effective coalition which brings together parties which will usually be private-sector firms, but
may include state and quasi-state agencies from the national and regional system of innovation
(Rodrik 2004).
48
Here, much can be gleaned from the experience of successful learning networks. These have a
number of features, which illustrate how governments can support the development of
systemically oriented networks. State-funded network brokers have been important in a number
of developing (Humphrey and Schmitz, 1996) and developed countries (Bessant and Tsekouras,
2001). Some may be locally specific such as regional cluster-crossing industries, while others
may be sectorally specific. The UK’s “UKfirst", for example, is an industry programme for
helping furniture manufacturers to upgrade production and supply chain processes (Box 4) .
Firms work across vertical and horizontal boundaries to determine learning outcomes that are
relevant to all participants.
Working with individual firms
Many local furniture manufacturers sell into global markets on an arm’s-length basis and have
limited potential to upgrade on their own. Governments, with the aid of UNIDO, can assist these
local firms by facilitating the development and implementation of upgrading strategies. But what
avenues should this policy support take? Seven possible areas have been identified.
• Understanding the market. Firms are often poorly placed to understand the nature and
complexity of the markets they serve. This is a particular problem when the markets are
remote and serve consumers with different tastes. Do firms sell to high-niche or
inexpensive markets?
• Identifying core competences. It is not uncommon for local manufacturers to lack a grasp
of their distinctive core competences. Without these, it is difficult for them to participate
Box 4 Sector initiatives: UK government-industry initiative in the furniture value chain
This sector learning network was established in 2004 to assist UK furniture manufacturers improve operations and
management practices and to enhance customer satisfaction. Specific actions include:
• Improving production performance.
• Implementing supply chain strategies.
• Adopting best practice by learning from other manufacturers.
• Learning about modern manufacturing techniques.
• Engendering cultural change throughout the workforce.
The Furniture Research Institute Association (FIRA, a not-for-profit research and technology organization) set up
the programme with financial help from the Department of Trade and Industry.
Source: DTI (www.dti.gov.uk, accessed 1 September 2005).

49
effectively in global product markets. If the required core competences do not exist, does
the enterprise have the capacity to develop them?
• Defining an appropriate business strategy. An effective business strategy comes from the
alignment of market opportunities and core competences. If the two do not match, there
is little scope for sustained penetration of external markets.
• Defining a product strategy. The dynamic nature of most final furniture markets requires
a capability to upgrade product offerings.
• Defining a manufacturing strategy. Even if a local furniture manufacturer is aware of
what it needs to produce, does it have the capability to manufacture it with appropriate
flexibility and quality, and at the required price? This may involve a change in internal
quality and logistics procedures, new forms of layout, and/or the acquisition of new
equipment.
• Improving value chain links. However efficient an individual company may be, if it
operates in an inefficient value chain its effectiveness will be limited.
• Implementing change. The business world is awash with intelligent strategies, whether
these are business, product or manufacturing strategies. But implementation is a different
story. It is a challenge that requires investment in people, the development of trust
relations, processes of continuous improvement and changes in organizational structures.
Working with buyers As has been shown in earlier analysis, buyers play a key, and often unrecognised, role in
upgrading in producing countries. This is particularly true in the case of buyer-driven networks.
One credible explanation of the rise of the Korean and Taiwanese economies as export platforms
in the 1960s and 1970s is that they were the result of the consolidation of the retail sector in the
United States. This in turn resulted in large-scale sourcing from low-cost East Asian suppliers
(Feenstra and Hamilton 2005). It was also shown that different types of buyer have different
strategies in relation to their supply base. Potentially they offer a number of enabling services to
producers, for example, advice on process upgrading, access to cheap inputs and knowledge of
buyers' preferences. At the same time, they have the potential to block producers' attempts to
reposition themselves in the chain, particularly in relation to moving into more knowledge-
intensive and rent-intensive chain-activities.
Hence, it is important that industrial policies clearly identify the role played by global buyers.
Producers need to be made aware of the different roles played by different categories of buyers,
as do the suppliers in the chain. Governments need to provide a framework that induces global
buyers in general, and specific types of buyers in particular, to visit the producing economy and
to interact with the domestic value chain to ensure that the appropriate lessons are absorbed
50
systemically. Agencies such as UNIDO have a particularly fruitful role to play here, given their
knowledge of global markets and their ability to draw on a network of global policy advisers and
researchers.
8. Conclusion The authority of the buyer in global value chains is a theme that runs throughout this section and
this case study elaborates on this power dimension by emphasising the link between upgrading
and purchasing. Buyers reward producer upgrading by increasing orders. They can also penalise
underperformance by taking orders away. This study reveals that even if purchasing is the only
business transaction that exists between a buyer and producer, upgrading remains pivotal. Buyers
want better quality products, improved delivery (faster, meeting schedules, etc.) and, of course,
lower prices. Improving production processes and product designs is only part of the upgrading
effort though. The producer has to transform this upgrading effort into something tangible and
measurable which can be recognised by buyers.
But this is not the only quandary facing producers in developing countries. The example of the
UK garden furniture buyer illustrates a new phenomenon. In the past, buyers were shifting orders
from high cost producers located in advanced industrial countries to low cost producers in
developing countries. In 2005, firms from developing countries are now competing with one
another. The importance of buyer-supplier relations and trust can no longer guarantee business
continuing in the long run. Even if a buyer has a long-standing business relation with a low-cost
country supplier, a buyer will take its business away if a lower-cost producer is found. This
places new burdens on low-cost producer in their quest to access markets and upgrade
51
References
The Financial Times, 2006, "China furniture makers face EU dumping case", (March 8, 2006)
Barnes, J., R. Kaplinsky and M. Morris, 2004, "Industrial Policy in Developing Economies: Developing Dynamic Comparative Advantage in the South African Automobile Sector." Competition and Change 8 (2): pp. 153-172.
Berry, W. L., Terry J. Hill and Jay E Klompmaker, 1995, "Customer-driven manufacturing " International Journal of Operations & Production Management 15 (3): pp. 4-15
Bessant, J. and G. Tsekouras, 2001,"Developing learning networks." AI & Society 15: 82-98.
European Commission, 1997, "Panorama of EU Industries, 1997: Furniture".
Feenstra, R. C. and G. G. Hamilton, 2005, Emergent Economies, Divergent Paths: Economic Organization and International Trade in South Korea and Taiwan. New York, Cambridge University Press.
Gereffi, G.A. and M. Korzeniewicz, Eds, 1994, Commodity chains and global capitalism. Westport, CT, Praeger.
Grant, R. M., 1991, "The Resource-Based Theory of Competitive Advantage: Implications for Strategy Formulation." California Management Review 33 (3).
Hamel, G. and C.K. Prahalad, 1994, Competing for the future. Boston, MA, Harvard Business School Press.
Humphrey, J. and H. Schmitz, 1996, "The Triple C Approach to Local Industrial Policy." World Development 24(12): 1859-1877.
Kaplinsky, R., 2005, Globalization, Poverty and Inequality. Cambridge, MA, Polity Press.
Kaplinsky, R., M. Morris and J. Readman, 2002, "The Globalization of Product Markets and Immiserising Growth: Lessons from the South African Furniture Industry." World Development 30(7): 1159–1177.
Kaplinsky, R. and J. Readman, 2005, "Globalization and upgrading: what can (and cannot) be learnt from international trade statistics in the wood furniture sector?" Industrial and Corporate Change 14(4): 679-703.
Key Note, 2005, "Leisure & Recreation Market". Market Review 2005 Key Note Ltd
Lall, S, and M. Teubal, 1998, "Market-stimulating" technology policies in developing countries: a framework with examples from East Asia." World Development 26(8).
Leonard-Barton, D., 1995, Wellsprings of knowledge: building and sustaining the sources of innovation. Boston, Mass, Harvard Business School.
Mitsuhashi, Keiju, 2005, The furniture value chain from Thailand to Japan: upgrading and the roles of buyers. Institute of Development Studies. Brighton, University of Sussex.
Porter, M.E, 1990, The Competitive Advantage of Nations. New York, Free Press.
52
Prahalad, C.K. and G. Hamel, 1990, "The Core Competence of the Corporation." Harvard Business Review, May/ June 1990: 79-91.
Rodrik, D., 2004, Industrial Policy for the Twenty-First century. mimeo. Cambridge, MA, John F. Kennedy School of Government.
Teece, D, J., G. Pisano and A. Shuen, 1997a, "Dynamic capabilities and strategic management." Pisano and Amy Shuen (1997b). "Dynamic capabilities and strategic management." Strategic Management Journal 18(7): 509 - 533.
UNIDO, 2003, “The Global Wood Furniture Value Chain: What Prospects for Upgrading by Developing Countries”
Williamson, Oliver E., 1975, Markets and hierarchies analysis and antitrust implications: a study in the economics of internal organization. London Free Press.
World-Bank, 1993, The East Asian Economic Miracle: Economic Growth and Public Policy. New York, Oxford University Press.
Websites:
DTI (www.dti.gov.uk)
FAO (www.fao.org)
UNCTAD (www. unctad.org)
UNIDO ( www.unido.org)

UNITED NATIONS INDUSTRIAL DEVELOPMENT ORGANIZATION
Vienna International Centre, P.O. Box 300, 1400 Vienna, AustriaTelephone: (+43-1) 26026-0, Fax: (+43-1) 26926-69E-mail: [email protected], Internet: http://www.unido.org
Printed in AustriaV.09-80795—February 2009—200