upper deschutes river basin study technical memorandum water resources tech mem… · irrigation...
TRANSCRIPT

Upper Deschutes River Basin Study Technical Memorandum
Analysis of Regulated River Flow in the Upper Deschutes Basin using Varying Instream and Out-of-Stream Conditions
U.S. Department of the Interior Bureau of Reclamation Pacific Northwest Region December 2018

Mission Statements
U.S. Department of the Interior
PROTECTING AMERICA’S GREAT OUTDOORS AND POWERING OUR FUTURE
The U.S. Department of the Interior protects America’s natural resources and heritage, honors our cultures and tribal communities, and supplies the energy to power our future.
Bureau of Reclamation
The mission of the Bureau of Reclamation is to manage, develop, and protect water and related resources in an environmentally and economically sound manner in the interest of
the American public.

CONTENTS
December 2018 – Upper Deschutes River Basin Study, Water Resources Technical Memorandum i
1. Introduction ....................................................................................................................... 1
1.1. Goals of Study ............................................................................................................. 1
1.2. Water Resources Modeling Process ............................................................................ 1
2. Reference RiverWare Model ............................................................................................. 3
2.1. Irrigation Demand Pattern ............................................................................................ 8
2.2. Upper Deschutes River Operation ..............................................................................10
2.2.1. Crane Prairie ..................................................................................................11
2.2.2. Wickiup ...........................................................................................................11
2.2.3. Crescent .........................................................................................................12
2.3. Crooked River Operation ............................................................................................12
3. Informational Flow Scenarios .........................................................................................13
3.1. Flow Scenario Definition .............................................................................................13
3.2. Model Results .............................................................................................................14
3.2.1. Informational Flow Scenario 1 Model Results .................................................15
3.2.2. Informational Flow Scenarios 2a, 2b, and 3 Model Results .............................26
4. Water Management Scenarios ........................................................................................37
4.1. Water Management Scenario Model Results ..............................................................43
5. Stream Temperature Analysis .........................................................................................54
6. Redband Trout Suitable Habitat Analysis ......................................................................59
7. Summary ..........................................................................................................................61
8. Literature Cited ................................................................................................................62
Appendix A: Graphics Describing Flow Scenarios 2a, 2b, and 3
List of Figures
Figure 1: Schematic of modeling process for the Basin Study. FS1, FS2a, FS2b, and FS3 represent different Informational Flow Scenarios. WM1, WM2, WM3, and WM4 represent different Water Management Scenarios. WICO is Wickiup outflow and DEBO is Deschutes River below Bend. ..................... 2
Figure 2. Deschutes River and Crooked River Basins. ........................................................... 4
Figure 3. Schematic of RiverWare representation of Upper Deschutes River. ........................ 6
Figure 4. Schematic of RiverWare representation of Crooked River. ...................................... 7
Figure 5. Daily diversion pattern that is repeated for every year in the model simulations. ............................................................................................................10
Figure 6. Summary hydrographs of simulated storage (top) and outflow (bottom) from Crane Prairie Reservoir where the dark blue line represents the

CONTENTS (CONTINUED)
ii December 2018 – Upper Deschutes River Basin Study, Water Resources Technical Memorandum
median and the shaded blue area represents the 20 to 80 percent exceedance. ...........................................................................................................16
Figure 7. Summary hydrographs of simulated storage (top) and outflow (bottom) from Wickiup Reservoir where the dark blue line represents the median and the shaded blue area represents the 20 to 80 percent exceedance. ................17
Figure 8. Summary hydrographs of simulated storage (top) and outflow (bottom) from Crescent Lake where the dark blue line represents the median and the shaded blue area represents the 20 to 80 percent exceedance. .......................18
Figure 9. Summary hydrographs of simulated storage (top) and outflow (bottom) from Prineville Reservoir where the dark blue line represents the median and the shaded blue area represents the 20 to 80 percent exceedance. ................19
Figure 10. Summary hydrographs of simulated storage (top) and outflow (bottom) from Ochoco Reservoir where the dark blue line represents the median and the shaded blue area represents the 20 to 80 percent exceedance. ................20
Figure 11. Summary hydrograph of simulated flow at Deschutes River at Benham Falls where the dark blue line represents the median and the shaded blue area represents the 20 to 80 percent exceedance. .........................................21
Figure 12. Summary hydrograph of simulated flow at Deschutes River below Bend where the dark blue line represents the median and the shaded blue area represents the 20 to 80 percent exceedance. .................................................22
Figure 13. Summary hydrograph of simulated flow at Tumalo Creek below the TID diversion where the dark blue line represents the median and the shaded blue area represents the 20 to 80 percent exceedance. .............................23
Figure 14. Summary hydrograph of simulated flow in Whychus Creek at Sisters where the dark blue line represents the median and the shaded blue area represents the 20 to 80 percent exceedance. .................................................24
Figure 15. Summary hydrograph of simulated flow in Crooked River at Highway 126 where the dark blue line represents the median and the shaded blue area represents the 20 to 80 percent exceedance. .........................................25
Figure 16. Irrigation district shortages for Flow Scenario 1 under historical hydrologic conditions. .............................................................................................26
Figure 17. Each quadrant shows summary hydrographs of simulated storage (top) and outflow (bottom) from Crane Prairie Reservoir, where the dark line represents the median and the shaded area represents the 20 to 80 percent exceedance. ..............................................................................................27
Figure 18. Each quadrant shows summary hydrographs of simulated storage (top) and outflow (bottom) from Wickiup Reservoir, where the dark line represents the median and the shaded area represents the 20 to 80 percent exceedance. ..............................................................................................28
Figure 19. Each quadrant shows summary hydrographs of simulated storage (top) and outflow (bottom) from Crescent Reservoir, where the dark line represents the median and the shaded area represents the 20 to 80 percent exceedance. ..............................................................................................29

CONTENTS (CONTINUED)
December 2018 – Upper Deschutes River Basin Study, Water Resources Technical Memorandum iii
Figure 20. Each quadrant shows summary hydrographs of simulated storage (top) and outflow (bottom) from Prineville Reservoir, where the dark line represents the median and the shaded area represents the 20 to 80 percent exceedance. ..............................................................................................30
Figure 21. Each quadrant shows summary hydrographs of simulated storage (top) and outflow (bottom) from Ochoco Reservoir, where the dark line represents the median and the shaded area represents the 20 to 80 percent exceedance. ..............................................................................................31
Figure 22. Each quadrant shows a summary hydrograph of simulated flow in the Deschutes River at Benham Falls, where the dark line represents the median and the shaded area represents the 20 to 80 percent exceedance. ...........................................................................................................32
Figure 23. Each quadrant shows a summary hydrograph of simulated flow in Deschutes River below Bend, where the dark line represents the median and the shaded area represents the 20 to 80 percent exceedance. ...........................................................................................................33
Figure 24. Each quadrant shows a summary hydrograph of simulated flow in Tumalo Creek below TID, where the dark line represents the median and the shaded area represents the 20 to 80 percent exceedance. ........................34
Figure 25. Each quadrant shows a summary hydrograph of simulated flow in Whychus Creek at Sisters, where the dark line represents the median and the shaded area represents the 20 to 80 percent exceedance. ........................35
Figure 26. Each quadrant shows a summary hydrograph of simulated flow in the Crooked River at Highway 126 Bridge, where the dark line represents the median and the shaded area represents the 20 to 80 percent exceedance. ...........................................................................................................36
Figure 27. Irrigation district shortages for each Flow Scenario using current district demand at the point of diversion from the source stream. .......................................37
Figure 28. Demand reduction options defined for Water Management Scenario 1. The dry year reduction is added to the median year reduction. ...............................39
Figure 29. Demand reduction options defined for Water Management Scenario 2. The dry year reduction is added to the median year reduction. ...............................40
Figure 30. Demand reduction options defined for Water Management Scenario 3. The dry year reduction is added to the median year reduction. ...............................41
Figure 31. Demand reduction options defined for Water Management Scenario 4. The dry year reduction is added to the median year reduction. ...............................42
Figure 32. Each quadrant shows summary hydrographs of simulated storage (top) and outflow (bottom) from Crane Prairie Reservoir for the four water management scenarios with historical inflows, where the dark line represents the median and the shaded area represents the 20 to 80 percent exceedance. ..............................................................................................44
Figure 33. Each quadrant shows summary hydrographs of simulated storage (top) and outflow (bottom) from Wickiup Reservoir for the four water

CONTENTS (CONTINUED)
iv December 2018 – Upper Deschutes River Basin Study, Water Resources Technical Memorandum
management scenarios with historical inflow hydrology, where the dark line represents the median and the shaded area represents the 20 to 80 percent exceedance. ..............................................................................................45
Figure 34. Each quadrant shows summary hydrographs of simulated storage (top) and outflow (bottom) from Crescent Reservoir for the four water management scenarios, where the dark line represents the median and the shaded area represents the 20 to 80 percent exceedance................................46
Figure 35. Each quadrant shows summary hydrographs of simulated storage (top) and outflow (bottom) from Prineville Reservoir for the four water management scenarios, where the dark line represents the median and the shaded area represents the 20 to 80 percent exceedance................................47
Figure 36. Each quadrant shows summary hydrographs of simulated storage (top) and outflow (bottom) from Ochoco Reservoir for the four water management scenarios, where the dark line represents the median and the shaded area represents the 20 to 80 percent exceedance................................48
Figure 37. Each quadrant shows a summary hydrograph of simulated flow in the Deschutes River at Benham Falls for the Water Management Scenarios, where the dark line represents the median and the shaded area represents the 20 to 80 percent exceedance. .........................................................49
Figure 38. Each quadrant shows a summary hydrograph of simulated flow in the Deschutes River below Bend for the Water Management Scenarios, where the dark line represents the median and the shaded area represents the 20 to 80 percent exceedance. .........................................................50
Figure 39. Each quadrant shows a summary hydrograph of simulated flow in Tumalo Creek below TID for the Water Management Scenarios, where the dark line represents the median and the shaded area represents the 20 to 80 percent exceedance..................................................................................51
Figure 40. Each quadrant shows a summary hydrograph of simulated flow in Whychus Creek at Sisters for the Water Management Scenarios, where the dark line represents the median and the shaded area represents the 20 to 80 percent exceedance..................................................................................52
Figure 41. Each quadrant shows a summary hydrograph of simulated flow in the Crooked River at Highway 126 for the Water Management Scenarios, where the dark line represents the median and the shaded area represents the 20 to 80 percent exceedance. .........................................................53
Figure 42. Each quadrant shows a summary hydrograph of simulated flow in the Deschutes River at Madras for the Water Management Scenarios, where the dark line represents the median and the shaded area represents the 20 to 80 percent exceedance. .........................................................54
Figure 43. Calculated April stream temperature for Whychus Creek at Sisters. .......................56
Figure 44. Calculated May stream temperature for Whychus Creek at Sisters. .......................57
Figure 45. Calculated June stream temperature for Tumalo Creek below TID and Whychus Creek at Sisters. .....................................................................................58

CONTENTS (CONTINUED)
December 2018 – Upper Deschutes River Basin Study, Water Resources Technical Memorandum v
Figure 46. Calculated July stream temperature for Tumalo Creek below TID and Whychus Creek at Sisters. .....................................................................................59
Figure 47: Exceedance curves showing the amount of suitable habitat at the Bull Bend site calculated using flows from the current scenario and the four water management scenarios. Blue shows the results for the winter season and red shows the results for the summer season. ....................................60
Figure 48: Exceedance curves showing the amount of suitable habitat at the Dead Slough site calculated using flows from the current scenario and the four water management scenarios. Blue shows the results for the winter season and red shows the results for the summer season. ....................................61
Figure 49. Graphical representation of the model flow objectives for Informational Flow Scenario 1. .....................................................................................................63
Figure 50. Graphical representation of the model flow objectives for Informational Flow Scenario 2a. ...................................................................................................64
Figure 51. Graphical representation of the model flow objectives for Informational Flow Scenario 2b. ...................................................................................................65
Figure 52. Graphical representation of the model flow objectives for Informational Flow Scenario 3. .....................................................................................................66
List of Tables
Table 1. Table of baseline annual diversion volumes for the model simulations. ................... 9
Table 2. Prineville storage rights from Prineville legislation. .................................................12
Table 3. Key features of flow scenarios. ...............................................................................14
Table 4. Instream flow model objectives for the Water Management Scenarios ...................43
Table 5. R-squared values calculated by UDWC relating stream temperature to air temperature and flow. ........................................................................................55

vi December 2018 – Upper Deschutes River Basin Study, Water Resources Technical Memorandum
Acronyms and Abbreviations Acronym or Abbreviation
Definition
AID Arnold Irrigation District
Basin Study Upper Deschutes River Basin Study
BSWG Basin Study Work Group
cfs Cubic feet per second
COID Central Oregon Irrigation District
LPID Lone Pine Irrigation District
NUID North Unit Irrigation District
OID Ochoco Irrigation District
RDG River Design Group, Inc.
Reclamation Bureau of Reclamation
SID Swalley Irrigation District
TID Tumalo Irrigation District
TSID Three Sisters Irrigation District
UDWC Upper Deschutes Watershed Council
WUA Weighted Usable Area

December 2018 – Upper Deschutes River Basin Study, Water Resources Technical Memorandum 1
1. Introduction The Upper Deschutes River Basin Study (Basin Study) has been completed by the Bureau of Reclamation (Reclamation) and the Basin Study Work Group (BSWG). The $1.5 million, 3-year study was funded on a 50/50 cost-share basis by Reclamation’s WaterSMART Program and the Oregon Water Resources Department.
1.1. Goals of Study The Basin Study was designed to consider long-standing water management issues in the Upper Deschutes River Basin. The following three goals were considered when designing the scenarios that were modeled:
• Improved streamflow and water quality for the benefit of fish, wildlife, and people • A reliable and affordable water supply to sustain agriculture • A safe, affordable, and high quality water supply for urban communities
Technical memoranda were developed to document various aspects of the Basin Study. This technical memorandum describes the water resources modeling that was completed for the Basin Study.
1.2. Water Resources Modeling Process Water resources modeling is used to determine the effects of changing reservoir operations, irrigation demand, and minimum stream flow requirements on a regulated river system. For the Basin Study, the water resources modeling was completed in two steps. Figure 1 shows the modeling process at a very high level with simplified descriptors of the scenarios. The study began with an attempt to understand the magnitude of instream and irrigation shortages by simulating water distribution given instream flow targets at key locations in the basin. These were called the Informational Flow Scenarios; the detailed scenario definitions and results can be found in Section 3. Output from the Informational Flow Scenarios, along with additional information described in other technical memoranda (such as conservation options), were combined into four Water Management Scenarios by members of BSWG. The detailed Water Management Scenario information and results can be found in Section 4.

2 December 2018 – Upper Deschutes River Basin Study, Water Resources Technical Memorandum
Figure 1: Schematic of modeling process for the Basin Study. FS1, FS2a, FS2b, and FS3 represent different Informational Flow Scenarios. WM1, WM2, WM3, and WM4 represent different Water Management Scenarios. WICO is Wickiup outflow and DEBO is Deschutes River below Bend.
Informational Flow Scenarios
Instream and irrigation shortages
FS1: Current Conditions
FS2a: Prioritize instream rights;
WICO min outflow to 300
cfs
FS2b: Prioritize
instream rights with 250 cfs at DEBO gage; WICO min
outflow to 300 cfs
FS3: Prioritize instream rights
WICO min outflow to 600 cfs, min CAPO
140 cfs
Information from other technical studies and BSWG
Water Management Scenarios
WM1: Cost effective, moderate irrigation demand
reduction, WICO min 300
cfs
WM2: More costly, more
irrigation demand
reduction, WICO min 300
cfs
WM3: Most costly, most
irrigation demand
reduction, WICO min 600
cfs
WM4: WM3 with new off-
channel storage reservoir

December 2018 – Upper Deschutes River Basin Study, Water Resources Technical Memorandum 3
2. Reference RiverWare Model The water resources modeling for the Basin Study was conducted using a daily time-step RiverWare (Zagona et al. 2001) model of the Deschutes Basin above the Pelton Round Butte reservoir complex. A short summary of the model is presented here. A complete description of the model development is described in depth in Reclamation 2017a.
Unregulated hydrology is input to the model and represents river flows without reservoir operations or diversions. The model then applies rules to operate the system with different configurations of logic and instream and consumptive demands. The unregulated hydrology is daily average flows from 1980 to 2009; Reclamation (2017c) documents how these data were developed.
The RiverWare model represents the Upper Deschutes River, Crescent Creek, Little Deschutes, Tumalo Creek, Whychus Creek, Crooked River, and Ochoco Creek. Figure 2 shows a map of the Basin and the included tributaries.

4 December 2018 – Upper Deschutes River Basin Study, Water Resources Technical Memorandum
Figure 2. Deschutes River and Crooked River Basins.

December 2018 – Upper Deschutes River Basin Study, Water Resources Technical Memorandum 5
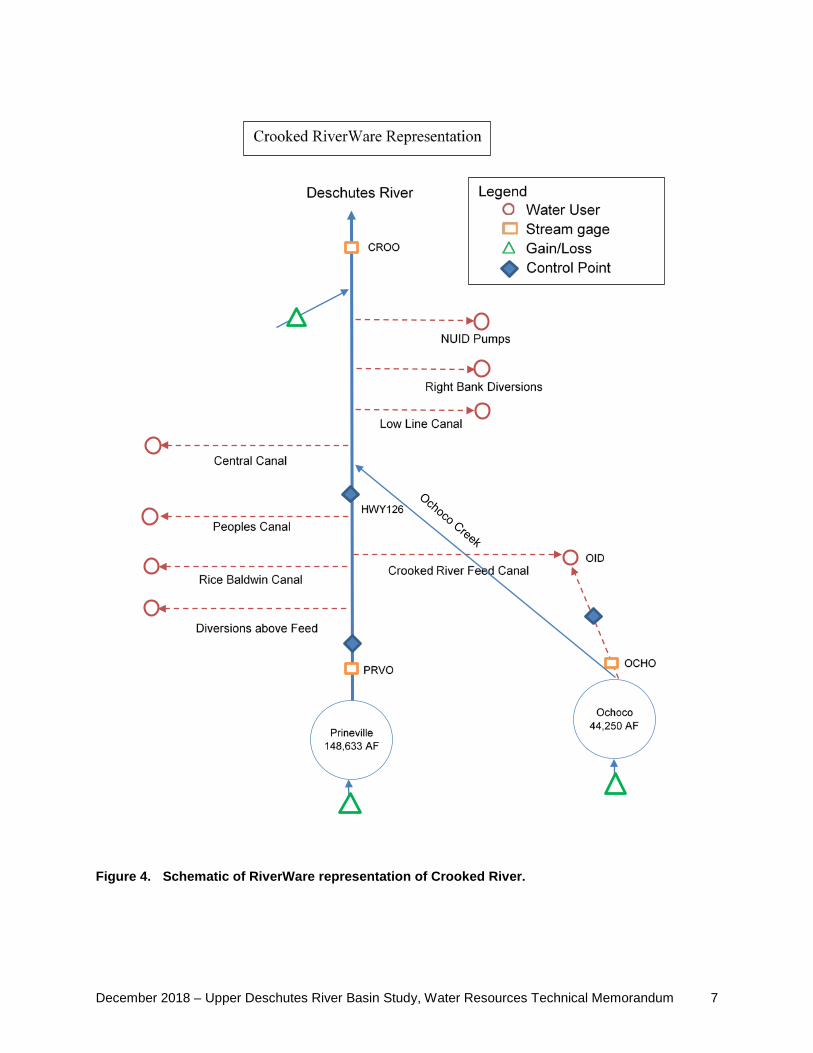
RiverWare is a general rules-based modeling platform that requires full definition of the physical layout of a river system and logic to define operation of the system. The model is constructed using RiverWare objects that define reservoirs, diversions, river reaches, control points (which monitor instream flow locations), and river gages. Figure 3 and Figure 4 show the layout of the RiverWare model for the Upper Deschutes and the Crooked River subbasins, respectively. The red circles indicate water users (representing diversions) and are labeled with the irrigation district or other water user acronym that they serve. The yellow boxes indicate stream gages and are named with their four-letter acronym from the Hydromet program (https://www.usbr.gov/pn/hydromet/), with the exception of the Highway 126 gage on the Crooked River. The green triangles represent locations where gains and losses are input into the model; the blue diamonds represent control points.

6 December 2018 – Upper Deschutes River Basin Study, Water Resources Technical Memorandum
Figure 3. Schematic of RiverWare representation of Upper Deschutes River.
December 2018 – Upper Deschutes River Basin Study, Water Resources Technical Memorandum 7
Figure 4. Schematic of RiverWare representation of Crooked River.

8 December 2018 – Upper Deschutes River Basin Study, Water Resources Technical Memorandum
Operating rule logic was first developed to simulate historical operations from 1984 through 2009, the years in which measured data could be compared to model output to ensure proper operation. The model used water rights, diversion patterns, and inflow hydrology representative of the time period. Detailed information about the inputs and calibration quality is described in Reclamation 2017a. The operating logic was updated to incorporate recent changes in the basin including the Oregon Spotted Frog Biological Assessment (Reclamation 2017b) and the Crooked River Collaborative Water Security and Jobs Act of 2014. The details of those operations are described in section 2.2 and 2.3.
It is important to recognize that there are many assumptions and simplifications that are required when developing a model. The data and operating logic attempt to simulate realistic conditions and water management as closely as possible, but it is likely there will be some operations that are handled differently in real time. The operations described in this report are relatively new and are still undergoing changes.
2.1. Irrigation Demand Pattern For scenario-based studies, it is common to develop a version of the model that simulates current conditions. This model is meant to indicate the response of a system, using the current operation definition, to historical inflow hydrology. Diversions were changed from the historical daily time series that varies from year-to-year to a single daily pattern that repeats annually and is scaled to an average volume1 (Table 1). In addition, operating logic was updated to reflect the recent changes in the Upper Deschutes and Crooked River systems.
1 This is a simplification that is typically used in modeling studies so that shortages can be comparable across year types with differing inflow hydrology.

December 2018 – Upper Deschutes River Basin Study, Water Resources Technical Memorandum 9
Table 1. Table of baseline annual diversion volumes for the model simulations.
Model Water User Name
Entity Stream Baseline Annual Diversion
Request2 (acre-feet)
Walker Walker Irrigation District Little Deschutes River
8,400
ARNO Arnold Irrigation District (AID) Deschutes River
32,800
CENO Central Oregon Irrigation District (COID) Deschutes River
158,400
TumaloProject Tumalo Irrigation District (TID) Deschutes River
50,0003
NorthUnitMainCanal North Unit Irrigation District (NUID) Deschutes River
182,000
LonePine Lone Pine Irrigation District (LPID) Deschutes River
12,200
NCAO Central Oregon Irrigation District (COID) Deschutes River
143,000
Swalley Swalley Irrigation District (SID) Deschutes River
26,200
TumaloFeedCanal Tumalo Irrigation District (TID) Tumalo Creek 50,0003 CityOfBend City of Bend Bridge Creek 6,520 Plainview Plainview Ditch Whychus
Creek 1,200
Edgington Edgington Diversion Whychus Creek
540
ThreeSisters Three Sisters Irrigation District (TSID) Whychus Creek
29,500
Sokol Pine Creek Meadows Ranch Whychus Creek
580
CrookedAboveFeed Small private diversions above the Crooked River Feed Canal
Crooked River 1,270
CrookedRiverFeed Ochoco Irrigation District (OID) Crooked River 82,0004 RiceB Rice Baldwin Canal Crooked River 3,970 Peoples Peoples Canal Crooked River 11,100 OID Ochoco Irrigation District (OID) Ochoco Creek 82,0004 Central Crooked River Central Canal Crooked River 3,300 LowLine Low Line Canal Crooked River 2,800 RBCrooked Small private diversions on the right
bank of the Crooked River Crooked River 4,100
NUIDCrooked North Unit Pumps (NUID) Crooked River 19,300
2 The Baseline Annual Diversion request was defined by the districts as an annual volume that was a reasonable baseline for the Basin Study modeling work. 3 Tumalo Irrigation District has a total request of 50,000 acre-feet that is split between Tumalo Creek, the Upper Deschutes (9 cfs water right), and Crescent Lake. The split changes depending on the conditions in each year so 50,000 acre-feet is listed for both diversion points. 4 Ochoco Irrigation District has a total request of 82,000 acre-feet that is split between Crooked River, Prineville Reservoir, and Ochoco Reservoir. The split changes depending on the conditions in each year so 82,000 acre-feet is listed for both diversion points.

10 December 2018 – Upper Deschutes River Basin Study, Water Resources Technical Memorandum
The daily shape of the annual diversion was a scaled version of the shape in 2009, as 2009 was considered to be a representative average water year by the Oregon Department of Water Resources (La Marche 2017). Figure 5 shows the daily diversion pattern that is repeated every year for the model simulation period for selected irrigation districts on the Upper Deschutes River.
Figure 5. Daily diversion pattern that is repeated for every year in the model simulations.
2.2. Upper Deschutes River Operation Operating rules were updated on the Upper Deschutes River to reflect the Oregon Spotted Frog operation proposal from the Districts. Generally, the operation is intended to minimize elevation fluctuations in Crane Prairie Reservoir and outflow fluctuations from Wickiup reservoir. In addition, outflows from Crane Prairie, Wickiup, and Crescent were all increased to enhance habitat conditions in the downgradient stream network. The operation described below is from the hydrologic evaluation conducted for the Oregon spotted frog Biological Assessment (Reclamation 2017b).

December 2018 – Upper Deschutes River Basin Study, Water Resources Technical Memorandum 11
2.2.1. Crane Prairie A storage account was added to Crane Prairie Reservoir for water that is dedicated to the Oregon spotted frog (OSF). The account is 35,000 acre-feet and has a priority date of August 30, 1899, which is one day earlier than the Swalley Irrigation District live flow right. The account is kept full unless there is not enough inflow or other stored water to maintain a minimum 30 cubic feet per second (cfs) outflow from the reservoir. Seepage losses from the reservoir can also decrease the storage volume below 35,000 acre-feet.
Between January 1 and March 15, Crane Prairie is allowed to store water in the three irrigation district accounts and the OSF account until the reservoir reaches 45,000 acre-feet of storage. Between March 15 and May 1, the reservoir passes inflow above seepage to maintain the elevation reached on March 15. Between May 1 and May 15, the reservoir can store water up to 1.1 feet above the elevation that was reached on March 15 to a maximum storage volume of 50,000 acre-feet. Between May 15 and July 15, the reservoir passes inflow above seepage to maintain the elevation reached on May 15. Storage above 35,000 is divided equally among the three irrigation district accounts (Arnold, Central Oregon, and Lone Pine) up to 5,000 acre-feet each. Any storage above the district and Oregon Spotted Frog accounts will be placed in a flood account; this account will only be used if it is necessary to store water above 50,000 acre-feet. Between July 15 and December 31, storage above 35,000 acre-feet is released from Crane Prairie.
Outflows from Crane Prairie are generally managed to release a maximum of 400 cfs throughout the year. The minimum release varied depending on the time of the year with 100 cfs released from December 1 through August 30 and 75 cfs released the remainder of the year. These flow criteria are considered less important than reaching and maintaining the elevations in Crane Prairie, and therefore there are times when the minimum outflow is allowed to decrease down to a minimum of 30 cfs in support of the higher priority criteria. Outflows are allowed to increase above 400 cfs when there is an elevation restriction and inflows exceed 400 cfs minus seepage.
2.2.2. Wickiup Outflows from Wickiup are managed to maintain a minimum of 100 cfs between September 16 and March 30 and a minimum of 600 cfs between March 30 and September 15, when possible. However, outflows must be increased to at least 600 cfs between March 31 and the beginning of the irrigation deliveries. Once irrigation releases begin, outflows from Wickiup often exceed 600 cfs to meet downstream irrigation demand. If required releases exceed 600 cfs prior to April 30, the outflows are required to be at or above the previous day’s outflows. Maximum non-irrigation season outflows are kept below 800 cfs until April 15, unless the reservoir needs to make flood releases.

12 December 2018 – Upper Deschutes River Basin Study, Water Resources Technical Memorandum
2.2.3. Crescent Outflows from Crescent are managed to maintain a minimum flow of 30 cfs from March 15 through November 30 and 20 cfs from December 1 through March 14, as long as there is enough inflow and stored water. If the reservoir storage drops below 7,000 acre-feet, outflows are reduced to 6 cfs.
2.3. Crooked River Operation Operating rules on the Crooked River, particularly at Prineville Reservoir, reflect changes that were made in the Crooked River Collaborative Water Security and Jobs Act of 2014 (also called Prineville Legislation). Changes are still being made to the operations as real time implications are observed and discussed. As additional experience is gained, the model logic will continue to be refined, but for the purpose of this study, the logic described below is used.
Prineville has seven storage accounts that fill in priority by the dates shown in Table 2. The City of Prineville account fills first because it is used for mitigation that “shall be delivered every year;” the uncontracted space fills last and is used to augment flows seasonally for fishery purposes as coordinated by the U.S. Fish and Wildlife Service and Reclamation.
Table 2. Prineville storage rights from Prineville legislation.
Model Water Right Name Priority Date Maximum Storage Volume (acre-feet)
CityOfPrineville 4/7/1914 5,100
LowLine 4/8/1914 330
Ochoco 4/8/1914 60,640
Others 4/8/1914 6,527
Peoples 4/8/1914 3,497
RentalNUID 4/8/1914 10,000
Uncontracted 4/9/1914 65,520
Prineville bypasses 10 cfs each day of the simulation period and releases 7 cfs from the City of Prineville account. The storage accounts fill in priority with other live flow accounts on the Crooked River. The accounts that are storing water for an irrigation demand (all but City of Prineville and Uncontracted) release water as needed for downstream demands. The uncontracted account releases water to ensure a minimum flow is always flowing past the Highway 126 gage on the Crooked River.

December 2018 – Upper Deschutes River Basin Study, Water Resources Technical Memorandum 13
To determine the minimum flow that will be met at the Highway 126 gage, the model determines the amount of water in the uncontracted account on the day of allocation, the day when the system is considered full. With historical inflows, the system and the uncontracted account fill in most years, so the minimum flow is set to 80 cfs. In the years where the system does not fill, the model calculates the day of allocation as the day when inflows to Prineville over the previous five days are less than 3 cfs. The storage volume in the uncontracted account is divided over the remaining days to the next assumed day of allocation (May 1), and water is released from the uncontracted account to meet that value at Highway 126. It is important to note that this is model logic that was designed to understand how this operation may work and that real time operations may differ from this logic.
3. Informational Flow Scenarios Based on input from BSWG, Reclamation began modeling for the Basin Study with four scenarios called Informational Flow Scenarios. The purpose of the Informational Flow Scenarios was to generate information on potential water supply availability and impacts under a broad range of flow scenarios proposed by members of BSWG. The flows defined in these scenarios may not be feasible under existing water supplies, system configurations, or legal constraints; nor do these scenarios necessarily satisfy water demands for in and/or out of stream uses. Consequently, the results of the modeling exercise should not be construed as confirmation, approval, or endorsement of physical, technical, or legal feasibility of any of the Informational Flow Scenarios.
3.1. Flow Scenario Definition The Informational Flow Scenarios are based on the baseline model with changes to water right priority and minimum flow objectives. Table 3 shows the key features of each scenario. Appendix A includes graphical representations of the model flow objectives that were defined for the flow scenarios.
Informational Flow Scenario 1: Informational Flow Scenario 1 was designed to represent 2016 operating conditions and includes the operations described in Section 2. It is considered to be the scenario that is most representative of current conditions in the basin.
For this scenario, all live flow water rights including both instream and out-of-stream rights were solved to be met in priority if water was available as they are currently defined.
Informational Flow Scenario 2a: Informational Flow Scenario 2a changed some of the model flow objectives and some of the water right priorities. The scenario had two objectives on the Upper Deschutes River: (1) to determine how often minimum instream flow rights might be met in the system if they were made senior, and (2) to determine the shortage to other water demands on the system if existing minimum instream flow rights were made senior. In addition, minimum outflow from Wickiup was set to 300 cfs, if possible.

14 December 2018 – Upper Deschutes River Basin Study, Water Resources Technical Memorandum
On the Crooked, instead of a constant release out of the uncontracted account after the day of allocation, the release attempted to meet 80 cfs at the Highway 126 gage as long as possible. If the uncontracted account was empty, the flows would reduce to those necessary to meet irrigation demands and the minimum outflow requirements from Prineville (10 cfs) and from the City of Prineville account (7 cfs). The minimum flow on Whychus Creek is also increased.
Informational Flow Scenario 2b: Informational Flow Scenario 2b is similar to 2a with one difference. In addition to minimum instream water rights at Bend modeled in 2a, a protested right of 250 cfs was made senior to determine how frequently this flow could be met and the resulting impacts to other demands on the system.
Informational Flow Scenario 3: Informational Flow Scenario 3 is similar to Flow Scenario 2a, but it increases some of the model flow objectives. The minimum outflow from Wickiup is increased to 600 cfs, if possible. The minimum flow on Whychus Creek is also increased. On the Crooked, the minimum instream flow at the Highway 126 gage is increased to 140 cfs during the non-irrigation season.
Table 3. Key features of flow scenarios.
Feature of One or More Informational Flow Scenario Fl
ow S
cena
rio 1
Flow
Sce
nario
2a
Flow
Sce
nario
2b
Flow
Sce
nario
3
Water Rights in Priority X Instream rights senior X X X Bend protested water right application X 100 cfs minimum outflow from Wickiup X 300 cfs minimum outflow from Wickiup X X 600 cfs minimum outflow from Wickiup X Minimum instream requirement increased on Whychus Creek X X X 80 cfs minimum flow at Highway 126 gage during non-irrigation season
X X X
140 cfs minimum flow at Highway 126 gage during non-irrigation season
X
3.2. Model Results The RiverWare model produces many different types of output that can be used to interpret the implications of the Informational Flow Scenarios, including reservoir storage, flow at gages, and water delivered to water users. The reservoir storage and flow at gages were primarily used to determine if the model was performing as expected under the defined scenario. Shortages were calculated by subtracting the amount of water delivered to water users from the amount of water

December 2018 – Upper Deschutes River Basin Study, Water Resources Technical Memorandum 15
that was requested. The shortages were used to determine the potential impacts of the various scenarios and to determine the volume of water that would be required to satisfy all of the objectives in the scenario.
Output is displayed in a number of formats. Summary hydrographs are used to show the potential range of reservoir storage, reservoir outflow, and flow at gages. The summary hydrographs show the median value (the daily flow or storage value achieved in 50 percent of the years) in a darker line, and a shaded area showing the daily range of 20 to 80 percent exceedance.5 Reservoir storage and outflow are shown together so that the relationship between storage and outflow can be observed. Irrigation deliveries are shown as annual exceedance graphs where total annual irrigation volumes are sorted in order of largest to smallest to indicate the frequency of delivering a particular volume. The ability to meet instream and out-of-stream model flow objectives is shown using shortage graphs, where the shortage represents the difference between a model objective and the modeled output. Shortages are summed annually and shown in exceedance graphs similar to irrigation deliveries.
3.2.1. Informational Flow Scenario 1 Model Results Informational Flow Scenario 1 showed the implications of a “current” type of operation, where the system is operated using current water right priorities and operating rules that reflect recent agreements in the basin. Because the output from Flow Scenario 1 is compared to all of the other model output and is representative of the current operating regime, it is labeled “Current” in all of the graphics.
Figure 6 shows a summary hydrograph of the simulated storage (top) and outflow (bottom) from Crane Prairie for Flow Scenario 1 (“Current”). The storage graph shows the summary of the changes in storage with the dark blue line indicating the median and the shaded area indicating the 20 to 80 percent range of storage for the scenario. Recall that the intended operation at Crane Prairie was (1) to be at or above 35,000 acre-feet for the entire year and increase from 35,000 acre-feet to 45,000 acre-feet by March 15, (2) maintain 45,000 acre-feet from March 15 through May 1, (3) increase from 45,000 to 50,000 acre-feet from May 1 to May 15, (4) maintain the storage achieved on May 15 through July 15, and (5) release storage down to 35,000 acre-feet by November 1.
The relationship between changes in storage and outflow can also be seen in these graphs. For example, on January 1, outflows decrease to fill Crane Prairie to 45,000 acre-feet by February 15. The model shows abrupt changes in outflows because storage objectives are prioritized in the model. Real time operations may be different than the model output because the model logic
5 The 20 percent exceedance value shows the value where only 20 percent of the values are larger; the 80 percent exceedance value shows the value where 80 percent of the values are larger. For example, the 20 percent exceedance storage in Crane Prairie on June 1 is 50,000 acre-feet and the 80 percent is 46,500 acre-feet.

16 December 2018 – Upper Deschutes River Basin Study, Water Resources Technical Memorandum
is based on rules that may turn on and off suddenly as conditions change, whereas real time operations may be able to smooth out the operational changes.
Figure 6. Summary hydrographs of simulated storage (top) and outflow (bottom) from Crane Prairie Reservoir where the dark blue line represents the median and the shaded blue area represents the 20 to 80 percent exceedance.
Figure 7 shows a summary hydrograph of the simulated storage and outflow from Wickiup Reservoir for Flow Scenario 1 (“Current”) under historical hydrologic conditions. Recall that the intended operation at Wickiup was to maintain a minimum of 100 cfs outflow year-round and to meet downstream irrigation requests. From this graph, it can be seen that the model objectives were met. In addition, the storage in Wickiup that results from the upstream operation at Crane Prairie and the outflow requirements is shown. The summertime outflow pattern reflects Wickiup releases to meet downstream irrigation demands, particularly for North Unit Irrigation District (NUID). The peak in late April is due to the NUID demand pattern that also peaked in late April, decreased in early May, and increased again through the summer months.

December 2018 – Upper Deschutes River Basin Study, Water Resources Technical Memorandum 17
Figure 7. Summary hydrographs of simulated storage (top) and outflow (bottom) from Wickiup Reservoir where the dark blue line represents the median and the shaded blue area represents the 20 to 80 percent exceedance.
Figure 8 shows a summary hydrograph for the storage and outflow from Crescent Lake for Flow Scenario 1 (“Current”) under historical hydrologic conditions. Recall that the intended operation for Crescent Lake was to maintain a minimum outflow of 30 cfs from March 15 to November 30 and 20 cfs from December 1 to March 14. The outflow graph shows that this operation is achievable in all years above the 80 percent flow exceedance, and the storage graph shows the statistical range of storage on any given day during the year for the simulation period. While most summary hydrographs generally show the annual pattern of storage or flow, that is not the case on Crescent Lake. This is because the reservoir can store water for many irrigation seasons and therefore the annual storage pattern can be very different from year to year.

18 December 2018 – Upper Deschutes River Basin Study, Water Resources Technical Memorandum
Figure 8. Summary hydrographs of simulated storage (top) and outflow (bottom) from Crescent Lake where the dark blue line represents the median and the shaded blue area represents the 20 to 80 percent exceedance.
Figure 9 shows the summary hydrograph for simulated storage and outflow from Prineville Reservoir for Flow Scenario 1 (“Current”) under historical hydrologic conditions. Prineville Reservoir typically reaches its peak storage volume between April and June and releases water through the irrigation season to meet downstream demand. During the spring, it releases water to make space in the reservoir to catch the spring runoff and prevent flooding downstream of the dam.

December 2018 – Upper Deschutes River Basin Study, Water Resources Technical Memorandum 19
Figure 9. Summary hydrographs of simulated storage (top) and outflow (bottom) from Prineville Reservoir where the dark blue line represents the median and the shaded blue area represents the 20 to 80 percent exceedance.
Figure 10 shows the summary hydrograph for simulated storage and outflow from Ochoco Reservoir for Flow Scenario 1 (“Current”) under historical hydrologic conditions. Like Prineville, Ochoco typically reaches its peak storage volume between April and June and then releases water for irrigation demand through the summer. The outflow range collapses to the median in May because there is only one downstream demand, Ochoco Irrigation District (OID), that is requesting water from this reservoir and is the only driver of summertime outflows. Since this pattern is the same each year, the summer outflow pattern is as well.

20 December 2018 – Upper Deschutes River Basin Study, Water Resources Technical Memorandum
Figure 10. Summary hydrographs of simulated storage (top) and outflow (bottom) from Ochoco Reservoir where the dark blue line represents the median and the shaded blue area represents the 20 to 80 percent exceedance.
Figure 11 shows a summary hydrograph of the simulated flow in Deschutes River at Benham Falls for Flow Scenario 1 (“Current”) under historical hydrologic conditions. The flow through the summer is reflective of downstream irrigation demand. This river gage is upstream of the major diversions but downstream of the reservoirs.

December 2018 – Upper Deschutes River Basin Study, Water Resources Technical Memorandum 21
Figure 11. Summary hydrograph of simulated flow at Deschutes River at Benham Falls where the dark blue line represents the median and the shaded blue area represents the 20 to 80 percent exceedance.
Figure 12 shows the summary hydrograph of the simulated flow in the Deschutes River below Bend for Flow Scenario 1 (“Current”) under historical hydrologic conditions. The gage is located below all of the major irrigation diversions, and therefore is representative of the potential lowest flow on the river6.
6 The instream water rights simulated in this scenario are the result of conservation efforts and instream transfers/leases which have an equivalent priority to the underlying districts priority. They do not reflect the protested instream water right which has a much junior priority (La Marche 2017).

22 December 2018 – Upper Deschutes River Basin Study, Water Resources Technical Memorandum
Figure 12. Summary hydrograph of simulated flow at Deschutes River below Bend where the dark blue line represents the median and the shaded blue area represents the 20 to 80 percent exceedance.
Figure 13 shows the summary hydrograph of simulated flow in Tumalo Creek below the Tumalo Irrigation District (TID) diversion for Flow Scenario 1 (“Current”) under historical hydrologic conditions. Because the target instream flow is below the major diversions, the summer time flow is typically much lower than winter time flow. The instream flow rights below the diversions share priority with the diversions for TID and the City of Bend, so if there is limited water, they all receive an amount proportional to their request.

December 2018 – Upper Deschutes River Basin Study, Water Resources Technical Memorandum 23
Figure 13. Summary hydrograph of simulated flow at Tumalo Creek below the TID diversion where the dark blue line represents the median and the shaded blue area represents the 20 to 80 percent exceedance.
Figure 14 shows the summary hydrograph of simulated flow in Whychus Creek at Sisters for Flow Scenario 1 (“Current”) under historical hydrologic conditions. This gage is located below Three Sisters Irrigation District (TSID) and three other small diversions, Plainview, Edgington, and Sokol, and therefore is representative of the lowest potential flow on the stream. The flow in the late summer months shows the potential low flow conditions when the irrigation districts are operating.

24 December 2018 – Upper Deschutes River Basin Study, Water Resources Technical Memorandum
Figure 14. Summary hydrograph of simulated flow in Whychus Creek at Sisters where the dark blue line represents the median and the shaded blue area represents the 20 to 80 percent exceedance.
Figure 15 shows the summary hydrograph of simulated flow in the Crooked River at the Highway 126 Bridge for Flow Scenario 1 (“Current”) under historical hydrologic conditions. This location is a key management point for the Crooked River system.

December 2018 – Upper Deschutes River Basin Study, Water Resources Technical Memorandum 25
Figure 15. Summary hydrograph of simulated flow in Crooked River at Highway 126 where the dark blue line represents the median and the shaded blue area represents the 20 to 80 percent exceedance.
Figure 16 shows a summary of irrigation district shortages for Flow Scenario 1 (“Current”) under historical hydrologic conditions. The shortage is the annual amount of water delivered subtracted from the annual amount of water requested. The shortages are ordered from largest to smallest, not in order of the year in which they occur. Recall that the total annual irrigation diversion request is about 720,000 acre-feet, representing the present day irrigation demand. Each district is shown with a different color and the results are ordered largest to smallest regardless of the year in which they occurred. The graph indicates that in roughly 12 years out of the 30-year simulation period, some or all of the irrigation districts experience shortages with NUID experiencing the largest shortage. This is partly due to the size of the NUID demand relative to the other districts, but also because NUID is the junior water right holder on the system.

26 December 2018 – Upper Deschutes River Basin Study, Water Resources Technical Memorandum
Figure 16. Irrigation district shortages for Flow Scenario 1 under historical hydrologic conditions.
3.2.2. Informational Flow Scenarios 2a, 2b, and 3 Model Results
Output from Informational Flow Scenarios 2a, 2b, and 3 is shown in this section. Informational Flow Scenario 2a showed the implications of a scenario where minimum instream flow rights were made senior and minimum flows below Wickiup were set to 300 cfs. Informational Flow Scenario 2b was similar to 2a except that the minimum flow requirement at Deschutes River below Bend was increased to 250 cfs to represent river conditions if the Bend protested water right were prioritized. Informational Flow Scenario 3 also prioritized minimum instream flow requirements, but also increased minimum outflow below Wickiup to 600 cfs and the flow on the Crooked River at the Highway 126 Bridge to 140 cfs. Results from each flow scenario are shown with the results from Informational Flow Scenario 1 (“Current”) for reference. More detail about the inputs to each of the flow scenarios can be found in section 3.1. Results for all four flow scenarios are shown together in the figures. Results for Informational Flow Scenario 1 (“Current”) are shown in blue in the top left, Informational Flow Scenario 2a in orange in the top right, Informational Flow Scenario 2b in green in the bottom left, and Informational Flow Scenario 3 in red in the bottom right.
Figure 17 shows the summary hydrographs of the simulated storage (top) and outflow (bottom) from Crane Prairie for Informational Flow Scenario 1 (blue), Informational Flow Scenario 2a (orange), Informational Flow Scenario 2b, (green), and Informational Flow Scenario 3 (red).

December 2018 – Upper Deschutes River Basin Study, Water Resources Technical Memorandum 27
The Crane Prairie model objectives did not change from Informational Flow Scenario 1 for any of the other scenarios, so the results are very similar for all scenarios. The only differences are a result of other operations such as increased outflow from Wickiup and prioritizing minimum instream flow rights.
Figure 17. Each quadrant shows summary hydrographs of simulated storage (top) and outflow (bottom) from Crane Prairie Reservoir, where the dark line represents the median and the shaded area represents the 20 to 80 percent exceedance.
Figure 18 shows the summary hydrographs of the simulated storage and outflow from Wickiup Reservoir for Informational Flow Scenarios 2a, 2b and 3 with historical hydrology conditions. For Informational Flow Scenarios 2a and 2b, the minimum outflow from Wickiup was set to 300 cfs; this value was set to 600 cfs for Informational Flow Scenario 3. For Informational Flow Scenarios 2a and 2b, the minimum outflow of 300 cfs could be met in all years. However, for Informational Flow Scenario 3, the minimum outflow of 600 cfs could only be met in the wetter

28 December 2018 – Upper Deschutes River Basin Study, Water Resources Technical Memorandum
years. In all three scenarios, the increased winter outflows of 300 and 600 cfs caused decreased storage in the reservoir, which leads to decreased water available for irrigation requests in the summer.
Figure 18. Each quadrant shows summary hydrographs of simulated storage (top) and outflow (bottom) from Wickiup Reservoir, where the dark line represents the median and the shaded area represents the 20 to 80 percent exceedance.
Figure 19 shows the summary hydrographs for the storage and outflow from Crescent Lake for Informational Flow Scenarios 2a, 2b, and 3. The intended operation at Crescent Lake did not change from Informational Flow Scenario 1 to the other three scenarios. The differences in the outflow from Crescent are a result of the minimum instream flow rights downstream having a higher priority than the storage rights in Crescent Lake. This results in decreased storage overall, sometimes to the point of reducing the amount of water available for Tumalo irrigation in dry years.

December 2018 – Upper Deschutes River Basin Study, Water Resources Technical Memorandum 29
Figure 19. Each quadrant shows summary hydrographs of simulated storage (top) and outflow (bottom) from Crescent Reservoir, where the dark line represents the median and the shaded area represents the 20 to 80 percent exceedance.
Figure 20 shows the summary hydrographs for simulated storage and outflow from Prineville Reservoir. In Informational Flow Scenarios 2a and 2b, there was a slight change to the way the minimum flow requirement downstream at Highway 126 was met. Instead of dividing the storage in the uncontracted account equally among the days in the season, as was done in Informational Flow Scenario 1, water was released to meet 80 cfs at Highway 126 until the account was empty each year. This had the result of changing the timing of releases and somewhat changing the storage in the reservoir. In Informational Flow Scenario 3, the minimum flow requirement was increased to 140 cfs. Because the minimum flow requirement is satisfied only by releasing water from the uncontracted account, increasing the requirement has a limited effect on the reservoir.

30 December 2018 – Upper Deschutes River Basin Study, Water Resources Technical Memorandum
Figure 20. Each quadrant shows summary hydrographs of simulated storage (top) and outflow (bottom) from Prineville Reservoir, where the dark line represents the median and the shaded area represents the 20 to 80 percent exceedance.
Figure 21 shows the summary hydrographs for simulated storage and outflow from Ochoco Reservoir for Informational Flow Scenarios 2a, 2b, and 3. All four scenarios had the same operation rules of Ochoco reservoir, so the results are all the same.

December 2018 – Upper Deschutes River Basin Study, Water Resources Technical Memorandum 31
Figure 21. Each quadrant shows summary hydrographs of simulated storage (top) and outflow (bottom) from Ochoco Reservoir, where the dark line represents the median and the shaded area represents the 20 to 80 percent exceedance.
Figure 22 shows the summary hydrographs of the simulated flow in the Deschutes River at Benham Falls for Informational Flow Scenarios 2a, 2b, and 3. The increased outflow from Wickiup in the winter months can be seen in this plot along with the decreased summer time releases due to decreased storage.

32 December 2018 – Upper Deschutes River Basin Study, Water Resources Technical Memorandum
Figure 22. Each quadrant shows a summary hydrograph of simulated flow in the Deschutes River at Benham Falls, where the dark line represents the median and the shaded area represents the 20 to 80 percent exceedance.
Figure 23 shows the summary hydrographs of the simulated flow in the Deschutes River below Bend. In Informational Flow Scenarios 2a and 2b, the effect of the 300 cfs increased outflow from Wickiup appears as an increase in winter flow at this location. Similarly, the 600 cfs increased outflow from Wickiup can be seen in Informational Flow Scenario 3. In Informational Flow Scenarios 2a and 3, the minimum instream flow rights were made senior, which is reflected in an increased summer flow. The minimum flow right can be satisfied in all years in Informational Flow Scenario 2a, but not in Informational Flow Scenario 3 because the increased winter flows reduce storage and outflow potential in Wickiup. In Scenario 2b, the minimum instream flow right was increased to 250 cfs and made senior. However, there are some years in which this minimum flow right cannot be satisfied.

December 2018 – Upper Deschutes River Basin Study, Water Resources Technical Memorandum 33
Figure 23. Each quadrant shows a summary hydrograph of simulated flow in Deschutes River below Bend, where the dark line represents the median and the shaded area represents the 20 to 80 percent exceedance.
Figure 24 shows the summary hydrographs of the simulated flow in Tumalo Creek below the TID diversion. The minimum flow right below TID was made senior for Informational Flow Scenarios 2a, 2b, and 3, and since this was the only change on Tumalo Creek, the results are the same for all three scenarios. The winter flow increases slightly because less water is being diverted for the City of Bend water right. The spring and summer flows increase to the minimum flow request.

34 December 2018 – Upper Deschutes River Basin Study, Water Resources Technical Memorandum
Figure 24. Each quadrant shows a summary hydrograph of simulated flow in Tumalo Creek below TID, where the dark line represents the median and the shaded area represents the 20 to 80 percent exceedance.
Figure 25 shows the summary hydrographs of flow in Whychus Creek at Sisters. This gage is located below TSID and three other small diversions, Plainview, Edgington, and Sokol, and therefore is representative of the lowest potential flow on the stream. In Informational Flow Scenarios 2a and 2b, the existing minimum instream flow rights are made senior and are satisfied. In Informational Flow Scenario 3, the minimum flow request is increased and made senior. The instream flow target is for the minimum flow pas the TSID diversion. There is approximately 10 cfs of channel losses between the TSID diversion and the gage at Sisters. Hence, the simulated flow at the Sisters gage is below the target, even when it is made senior to all other users.

December 2018 – Upper Deschutes River Basin Study, Water Resources Technical Memorandum 35
Figure 25. Each quadrant shows a summary hydrograph of simulated flow in Whychus Creek at Sisters, where the dark line represents the median and the shaded area represents the 20 to 80 percent exceedance.
Figure 26 shows the summary hydrographs of the simulated flow in the Crooked River at the Highway 126 Bridge. Informational Flow Scenarios 2a and 2b show the result of releasing enough water from Prineville to meet 80 cfs at this location until the uncontracted account is empty. Flow Scenario 3 shows the result of releasing enough water to meet 140 cfs at this location from the Prineville until the account was empty.

36 December 2018 – Upper Deschutes River Basin Study, Water Resources Technical Memorandum
Figure 26. Each quadrant shows a summary hydrograph of simulated flow in the Crooked River at Highway 126 Bridge, where the dark line represents the median and the shaded area represents the 20 to 80 percent exceedance.
Figure 27 shows a summary of irrigation district shortages for each Informational Flow Scenario under historical hydrologic conditions. The shortage is the annual amount of water delivered subtracted from the annual amount of water requested; recall that the total annual diversion request is around 720,000 acre-feet. Each district is shown with a different color and the results are ordered from largest to smallest regardless of the year in which they occurred. Because minimum instream flow rights were prioritized for Informational Flow Scenarios 2a, 2b, and 3, the shortages are larger than Informational Flow Scenario 1 (“Current”). This provides information that can be used to understand how much water is needed to meet different levels of demand in the basin.

December 2018 – Upper Deschutes River Basin Study, Water Resources Technical Memorandum 37
Figure 27. Irrigation district shortages for each Flow Scenario using current district demand at the point of diversion from the source stream.
4. Water Management Scenarios Using output from the Informational Flow Scenarios and information gathered about potential conservation or new storage efforts, four Water Management Scenarios were developed for modeling purposes. The scenarios were specifically defined by combining demand reductions defined in the plots shown in Figure 28 through Figure 31 with instream flow objectives shown in Table 4 (BSWG 2017). Water Management Scenarios 1, 2, and 3 were designed to analyze meeting varying levels of both instream (ecological) and out-of-stream (irrigation) demand using a combination of water supply options such as piping canals or private laterals, on-farm

38 December 2018 – Upper Deschutes River Basin Study, Water Resources Technical Memorandum
conservation, water rights leasing, duty reduction, and water right transfers. Water Management Scenario 4 combined the maximum level of measures with a new potential off-channel storage reservoir.
It should be noted that the Water Management Scenarios are hypothetical combinations of water supply options. The scenarios are intended to provide information about potential outcomes of combining water supply options with higher instream flow requests. They are not prescriptive or intended to be used as plans for future implementation.
The plots in Figure 28 through Figure 31 show the assumptions used in the four Water Management Scenarios to reduce the irrigation demand for each district, including conservation by piping district canals or private laterals, water rights leasing, duty transfers, and water rights transfers (note that these assumptions were developed using data from multiple technical memoranda and consultation with BSWG). Two levels of reduction are shown, one to address the shortage in a median year and one to address additional shortage in the 90 percent exceedance year or dry year (the additional dry year reductions are added to the median year reductions). The model determines median and dry year types based on inflow volume and adjusts the demand accordingly. For each district, total modeled demand is reduced by the amount shown in these figures.
Water Management Scenario 1 (WM1) was designed to be the most cost-effective scenario with options focusing primarily on water rights leasing, duty transfers, and water right transfers (Figure 28). These options have a relatively lower amount of conservation actions when compared to the other scenarios. The scenario has an estimated total cost of 97 million dollars for all of the investments. It reduces irrigation demand by about 110,000 acre-feet per year in average years and up to 240,000 acre-feet per year in dry years.

December 2018 – Upper Deschutes River Basin Study, Water Resources Technical Memorandum 39
Figure 28. Demand reduction options defined for Water Management Scenario 1. The dry year reduction is added to the median year reduction.
Water Management Scenario 2 (WM2) was designed by blending the cost effective actions of WM1 with additional water conservation (Figure 29). This scenario has an estimated cost of 365 million dollars for all of the investments, which could take many years to fully implement. It reduces irrigation demand by about 190,000 acre-feet per year in all years and up to 290,000 acre-feet per year in dry years throughout the basin.

40 December 2018 – Upper Deschutes River Basin Study, Water Resources Technical Memorandum
Figure 29. Demand reduction options defined for Water Management Scenario 2. The dry year reduction is added to the median year reduction.
Water Management Scenario 3 (WM3) is defined as maximizing water conservation and water rights options (Figure 30). This scenario has an estimated cost of 847 million dollars for all of the investments and could take many years to implement. The scenario reduces irrigation demand by about 250,000 acre-feet per year in all years and up to 360,000 acre-feet in dry years throughout the basin.

December 2018 – Upper Deschutes River Basin Study, Water Resources Technical Memorandum 41
Figure 30. Demand reduction options defined for Water Management Scenario 3. The dry year reduction is added to the median year reduction.
Water Management Scenario 4 (WM4) is defined as having the same conservation and water right options as WM3 (Figure 31). However, this scenario adds 40,000 acre-feet of additional off-channel storage that could be supplied to NUID and 4,500 acre-feet of new storage in Prineville that could be used for instream flows. This scenario has an estimated cost of one billion dollars and reduces irrigation demand by about 400,000 acre-feet.

42 December 2018 – Upper Deschutes River Basin Study, Water Resources Technical Memorandum
Figure 31. Demand reduction options defined for Water Management Scenario 4. The dry year reduction is added to the median year reduction.
The management supply options for each scenario are combined with model objectives for instream flow (shown in Table 4). The instream flow objectives were defined by BSWG. Some of the objectives are defined in the RiverWare rules to be met whenever water is available; the outflows from Wickiup Reservoir and Crescent Lake are examples of this type of objective (called rule-based objectives). Other objectives are not defined in the rules but are used for comparison of model output to determine the performance of the scenario; the flow at the Deschutes River below Bend is an example of this type of objective (called comparison objectives).

December 2018 – Upper Deschutes River Basin Study, Water Resources Technical Memorandum 43
Table 4. Instream flow model objectives for the Water Management Scenarios
Model Objectives Objective Type
WM1 WM2 WM3 WM4
Winter Flow below Wickiup Rule-based 300 cfs 300 cfs 600 cfs 600 cfs
Summer Flow below Wickiup Comparison less than 1,800 cfs
less than 1,800 cfs
less than 1,800 cfs
less than 1,800 cfs
Winter Flow below Crescent Rule-based 20/30 cfs (30 cfs from March 15 to November 30; 20 cfs from December 1 to March 14)
20/30 cfs 20/30 cfs 20/30 cfs
Summer Flow on Deschutes below Bend
Comparison up to 250 cfs up to 250 cfs
up to 250 cfs
up to 250 cfs
Summer Flow on Tumalo below TID
Comparison up to 33 cfs up to 33 cfs
up to 33 cfs
up to 33 cfs
Summer Flow on Whychus at Sisters
Comparison up to 33 cfs up to 33 cfs
up to 45 cfs
up to 45 cfs
Winter Flow on Crooked at Highway 126
Rule-based 80 cfs 80 cfs 140 cfs 140 cfs
4.1. Water Management Scenario Model Results Output from the Water Management Scenarios is shown in this section. Results from the Water Management Scenarios with historical inflow hydrology are shown with the results from Flow Scenario 1 (“Current”) for reference. Results for all four flow scenarios are shown together in the figures. Results for WM1 are shown in green in the top left, WM2 in yellow in the top right, WM3 in red in the bottom left, and WM4 in purple in the bottom right.
Model rules for Crane Prairie Reservoir operations were not changed from Flow Scenario 1 (“Current”), so the changes observed for the Water Management Scenarios are a result of changes to downstream operations. The downstream operations have a relatively small impact on storage in Crane Prairie (Figure 32).

44 December 2018 – Upper Deschutes River Basin Study, Water Resources Technical Memorandum
Figure 32. Each quadrant shows summary hydrographs of simulated storage (top) and outflow (bottom) from Crane Prairie Reservoir for the four water management scenarios with historical inflows, where the dark line represents the median and the shaded area represents the 20 to 80 percent exceedance.
Figure 33 shows summary hydrographs of the simulated flow and storage in Wickiup Reservoir for the four Water Management Scenarios. In WM1 and WM2, the minimum winter outflow model objective from Wickiup was 300 cfs. Combined with the reductions in irrigation demand, WM1 and WM2 show that 300 cfs can be delivered in all years. In addition, the summer outflow from Wickiup is less than the “Current” simulation because the irrigation demand is less in these scenarios.
In WM3 and WM4, the minimum winter outflow model objective was 600 cfs and irrigation demand was even less than in WM1 and WM2. The results show that 600 cfs can be met in some years; however, there are years where there is not enough storage in Wickiup to continue to

December 2018 – Upper Deschutes River Basin Study, Water Resources Technical Memorandum 45
release 600 cfs in March, April, and May. The reduced outflows that occur in this situation are essentially the inflows to Wickiup, which are affected by the upstream operation at Crane Prairie.
Figure 33. Each quadrant shows summary hydrographs of simulated storage (top) and outflow (bottom) from Wickiup Reservoir for the four water management scenarios with historical inflow hydrology, where the dark line represents the median and the shaded area represents the 20 to 80 percent exceedance.
Figure 34 shows the summary hydrographs of simulated storage and outflow from Crescent Lake for the Water Management Scenarios. All four scenarios reduce downstream irrigation demand in higher priority water rights than the right to store water in Crescent Lake. This allows Crescent to store more water than it did in the “Current” scenario, which results in higher storage contents overall. The minimum winter outflow model objective was set to 20 cfs from December 1 to March 14 and to 30 cfs from March 15 to November 30. The results show that this objective could be met in all years. All four scenarios reduce irrigation demand from TID with WM1 having a smaller reduction than WM2, WM3, and WM4, which all have the same

46 December 2018 – Upper Deschutes River Basin Study, Water Resources Technical Memorandum
reduction. Since TID diverts water from Tumalo Creek and Crescent Lake, the reduction was applied 60 percent to Tumalo Creek and 40 percent to Crescent Lake.
Figure 34. Each quadrant shows summary hydrographs of simulated storage (top) and outflow (bottom) from Crescent Reservoir for the four water management scenarios, where the dark line represents the median and the shaded area represents the 20 to 80 percent exceedance.
Figure 35 shows the summary hydrographs of the simulated storage and outflow from Prineville Reservoir in the Water Management Scenarios. In WM1 and WM2, Prineville releases water from the uncontracted account to meet 80 cfs at Highway 126 and has a reduction in irrigation demand from OID. Since the releases from the uncontracted account are similar to the “Current” operation and the reductions to OID are small, this results in a slight increase in storage in Prineville and little change to the outflows.
In WM3 and WM4, Prineville releases water to meet 140 cfs at Highway 126 until the uncontracted account is empty. This results in less storage in Prineville than in the “Current”

December 2018 – Upper Deschutes River Basin Study, Water Resources Technical Memorandum 47
simulation, even though the irrigation request from OID are further reduced in these scenarios. In WM4, 4,500 acre-feet of storage was added to the uncontracted account to support releases to meet these flows, which results in slightly increased storage than WM3.
Figure 35. Each quadrant shows summary hydrographs of simulated storage (top) and outflow (bottom) from Prineville Reservoir for the four water management scenarios, where the dark line represents the median and the shaded area represents the 20 to 80 percent exceedance.
Figure 36 shows summary hydrographs of simulated storage and outflows from Ochoco Reservoir for the Water Management Scenarios. Ochoco Reservoir supplies stored water to OID. In each scenario, OID’s irrigation request is reduced, which results in higher storage in Ochoco Reservoir and reduced summer outflows. Winter outflows increase in some years as a result of more stored water being released for flood control operations.

48 December 2018 – Upper Deschutes River Basin Study, Water Resources Technical Memorandum
Figure 36. Each quadrant shows summary hydrographs of simulated storage (top) and outflow (bottom) from Ochoco Reservoir for the four water management scenarios, where the dark line represents the median and the shaded area represents the 20 to 80 percent exceedance.
Figure 37 shows summary hydrographs of simulated flow on the Deschutes River at Benham Falls for the Water Management Scenarios. Flow at this location is affected largely by outflows from Wickiup, and from Crescent Lake to a lesser extent. The shape of the hydrograph is similar to the outflow from Wickiup where the increased winter outflows and the reduced summer flows can be seen.

December 2018 – Upper Deschutes River Basin Study, Water Resources Technical Memorandum 49
Figure 37. Each quadrant shows a summary hydrograph of simulated flow in the Deschutes River at Benham Falls for the Water Management Scenarios, where the dark line represents the median and the shaded area represents the 20 to 80 percent exceedance.
Figure 38 shows summary hydrographs of simulated flow on the Deschutes River below Bend. This location is below the major diversion points on the Deschutes River. Therefore, the hydrograph is almost opposite of the Benham Falls hydrograph with lower flows occurring in the summer and higher flows occurring in the winter due to groundwater gains and tributary inflows to the river downstream of the reservoirs. For all four scenarios, 10 percent of the irrigation reductions on the Deschutes River were left in stream during the irrigation season. This resulted in higher summer flows in the scenarios than the “Current” scenario. Like Benham Falls, the increased winter releases from Wickiup can also be seen in each scenario.

50 December 2018 – Upper Deschutes River Basin Study, Water Resources Technical Memorandum
Figure 38. Each quadrant shows a summary hydrograph of simulated flow in the Deschutes River below Bend for the Water Management Scenarios, where the dark line represents the median and the shaded area represents the 20 to 80 percent exceedance.
Figure 39 shows summary hydrographs of the simulated flow on Tumalo Creek below TID. All four scenarios reduced the irrigation demand from TID, although WM2, WM3, and WM4 are reduced by the same amount. The increased irrigation season flow in Tumalo Creek is a result of 60 percent of the reduced demand being left in stream, while the other 40 percent is credited to the reservoir.

December 2018 – Upper Deschutes River Basin Study, Water Resources Technical Memorandum 51
Figure 39. Each quadrant shows a summary hydrograph of simulated flow in Tumalo Creek below TID for the Water Management Scenarios, where the dark line represents the median and the shaded area represents the 20 to 80 percent exceedance.
Figure 40 shows summary hydrographs of the simulated flow on Whychus Creek at Sisters for the Water Management Scenarios. All four scenarios reduced irrigation demand from Three Sisters Irrigation district, which resulted in increased flow in the creek during the irrigation season.

52 December 2018 – Upper Deschutes River Basin Study, Water Resources Technical Memorandum
Figure 40. Each quadrant shows a summary hydrograph of simulated flow in Whychus Creek at Sisters for the Water Management Scenarios, where the dark line represents the median and the shaded area represents the 20 to 80 percent exceedance.
Figure 41 shows summary hydrographs of the simulated flow on the Crooked River at Highway 126. In WM1 and WM2, water is released from Prineville to meet 80 cfs at Highway 126; this is increased to 140 cfs in WM3 and WM4. The water is released from the uncontracted account until the account is empty, which occurs more frequently in WM3 and WM4.

December 2018 – Upper Deschutes River Basin Study, Water Resources Technical Memorandum 53
Figure 41. Each quadrant shows a summary hydrograph of simulated flow in the Crooked River at Highway 126 for the Water Management Scenarios, where the dark line represents the median and the shaded area represents the 20 to 80 percent exceedance.
Figure 42 shows summary hydrographs of simulated flow on the Deschutes River at Madras for the Water Management Scenarios. In all four scenarios, winter flow is increased due to the higher releases from Wickiup and summer flow is decreased due to decreases in return flows. Return flows decrease because overall irrigation diversions are decreased and delivery losses are decreased due to increased irrigation efficiency.

54 December 2018 – Upper Deschutes River Basin Study, Water Resources Technical Memorandum
Figure 42. Each quadrant shows a summary hydrograph of simulated flow in the Deschutes River at Madras for the Water Management Scenarios, where the dark line represents the median and the shaded area represents the 20 to 80 percent exceedance.
5. Stream Temperature Analysis Stream temperature was estimated for the Current and Water Management scenarios using multiple linear regression equations that were developed by the Upper Deschutes Watershed Council (UDWC 2016). UDWC developed stream temperature regression models for Whychus Creek, the Middle Deschutes, and Tumalo Creek using varying combinations of historical stream flow, air temperature, and stream temperature for each month in the year; this process is described in the Whychus Creek and Middle Deschutes River Temperature Assessments (UDWC 2016).
UDWC evaluated eight different equations relating historical stream flow and air temperature to stream temperature. The equation that best captured the relationship between the parameters was

December 2018 – Upper Deschutes River Basin Study, Water Resources Technical Memorandum 55
7𝐷𝐷𝐴𝐴𝐷𝐷𝐴𝐴 ~𝐿𝐿𝐿𝐿𝐿𝐿𝐿𝐿𝐿𝐿𝐿𝐿 + 3𝐷𝐷𝐴𝐴𝐷𝐷𝐷𝐷
where 7DADM is the seven-day moving average stream temperature, LnFlow is the natural log of the current stream flow, and 3DAir is the three-day moving average of air temperature. The relationship varied in performance by month, and it was decided by BSWG that only the relationships that had an R-squared value higher than 0.7 would be used to analyze stream temperature with modeled stream flows. Table 5 shows the locations, months, and R-squared values generated by UDWC with those used in this analysis underlined (relationships were not generated for months not shown).
Table 5. R-squared values calculated by UDWC relating stream temperature to air temperature and flow.
Month Middle Deschutes Tumalo Creek Whychus Creek
April 0.66 - 0.74
May 0.65 0.69 0.74
June 0.75 0.75 0.83
July 0.75 0.89 0.87
August 0.43 0.50 0.67
September 0.39 0.47 0.54
October 0.55 - 0.48
The plots in Figure 43 through Figure 46 show the range of stream temperature at each location by month along with the desired temperature of 13 degrees Celsius. Figure 43 shows the range of temperatures for the month of April at Whychus Creek at Sisters. Whychus was the only location that had an R-squared value higher than 0.7, so only Whychus is shown. Results for the Middle Deschutes are also not shown because the past operations used to develop the regressions are not representative of the conditions represented in the water management scenarios. Stream temperatures were calculated using modeled streamflow for each water management scenario and are compared to stream temperature calculated using modeled streamflows for the current scenario (Flow Scenario 1). Streamflow increased slightly from modeled current stream flows in each water management scenario, so the calculated stream temperatures decreased slightly.

56 December 2018 – Upper Deschutes River Basin Study, Water Resources Technical Memorandum
Figure 43. Calculated April stream temperature for Whychus Creek at Sisters.
Figure 44 shows the calculated May stream temperature at Whychus Creek at Sisters. Like April, the relationship for Whychus Creek was the only location with an R-squared above 0.7 for the month of May, so it is the only location shown. The flows in May increased slightly from the current scenario, so stream temperatures decreased slightly. However, they did not decrease below the desired temperature of 13 degrees Celsius.

December 2018 – Upper Deschutes River Basin Study, Water Resources Technical Memorandum 57
Figure 44. Calculated May stream temperature for Whychus Creek at Sisters.
Figure 45 shows the calculated stream temperature for June for Tumalo Creek below TID and Whychus Creek at Sisters. The R-squared values for the relationships at all three locations were above 0.7 for June. The stream temperature at all three locations decreased because flows at all three locations increased.

58 December 2018 – Upper Deschutes River Basin Study, Water Resources Technical Memorandum
Figure 45. Calculated June stream temperature for Tumalo Creek below TID and Whychus Creek at Sisters.
Figure 46 shows the calculated stream temperature for July for Tumalo Creek below TID and Whychus Creek at Sisters. The R-squared values for the relationships at all three locations were above 0.7 for July. The stream temperature at all three locations decreased because flows at all three locations increased.

December 2018 – Upper Deschutes River Basin Study, Water Resources Technical Memorandum 59
Figure 46. Calculated July stream temperature for Tumalo Creek below TID and Whychus Creek at Sisters.
6. Redband Trout Suitable Habitat Analysis Estimates of suitable habitat for the redband trout under the different water management scenarios were calculated using weighted usable area (WUA) curves developed by River Design Group, Inc. (RDG 2017). WUA curves indicate an amount of suitable habitat for a species at incremental flow rates. For the Basin Study, WUA curves were developed for two locations, Bull Bend and Dead Slough; both locations are between Wickiup Dam and the confluence with the Little Deschutes.
The WUA curves and modeled flows below Wickiup were used to estimate the amount of suitable habitat for the current scenario and the four water management scenarios (Figure 47 and Figure 48). Both winter and summer seasons were evaluated. Figure 47 shows exceedance plots for suitable habitat at the Bull Bend site. Note that for all four water management scenarios, the amount of suitable habitat increases for the winter time and decreases for the summer. The impact of more flow in the winter is more notable with the amount of usable habitat increasing with each water management scenario that increases winter flow. The addition of more flow in

60 December 2018 – Upper Deschutes River Basin Study, Water Resources Technical Memorandum
the summer has less of an impact on the amount of usable habitat because there is already suitable flow in the summer.
Figure 47: Exceedance curves showing the amount of suitable habitat at the Bull Bend site calculated using flows from the current scenario and the four water management scenarios. Blue shows the results for the winter season and red shows the results for the summer season.
Figure 48 shows the amount of suitable habitat calculated at the Dead Slough site. For each water management scenario, the amount of suitable habitat increases during the winter from the current scenario. The summer suitable habitat remains about the same for all the scenarios. This indicates that the change in summer flow at the Dead Slough site does not cause a change in suitable habitat from the current scenario.

December 2018 – Upper Deschutes River Basin Study, Water Resources Technical Memorandum 61
Figure 48: Exceedance curves showing the amount of suitable habitat at the Dead Slough site calculated using flows from the current scenario and the four water management scenarios. Blue shows the results for the winter season and red shows the results for the summer season.
7. Summary The Deschutes Basin Study used RiverWare to evaluate several scenarios to inform the stakeholders about implications of possible changes to streamflow in the Basin. The first round of modeling, the Informational Flow Scenarios, was designed to define the extent of irrigation and instream shortages that could exist if irrigation demand remained the same and if instream flow targets were prioritized. These results were used to quantify the amount of water that may be required to meet the various needs in the basin.
The second round of modeling, the Water Management Scenarios, combined a range of instream flow objectives with options that could reduce the amount of irrigation demand. These results should not be viewed as recommended, achievable, or prescriptive for water management in the basin. Rather, they should be used to help understand potential implications of various actions that could be taken in the basin including the impact to reservoirs, flows in the river, and irrigation shortages.

62 December 2018 – Upper Deschutes River Basin Study, Water Resources Technical Memorandum
8. Literature Cited
Parenthetical Reference Bibliographic Citation
BSWG 2017 Basin Study Work Group. 2017. Deschutes Basin Study Water Management Scenarios. Summary of Steering Committee and Planning Team input on scenario assumptions. October 18, 2017.
La Marche 2017 La Marche, J. 2017, personal communication. Conversations between Jonathan La Marche, Hydrologist (Oregon Water Resources Department) and Jennifer Johnson, Hydrologic Engineer (Bureau of Reclamation, Pacific Northwest Regional Office). Subject: representative hydrologic conditions and related water rights factors. Multiple conversations throughout RiverWare model development, 2017.
Reclamation 2017a Bureau of Reclamation. 2017a. Development of a Daily Water Management Model of the Deschutes River, Oregon, using RiverWare. March 2017. Pacific Northwest Region, Boise, Idaho.
Reclamation 2017b Bureau of Reclamation. 2017b. Hydrologic Evaluation of Baseline and Proposed Management of the Deschutes Project for Oregon Spotted Frog (OSF Proposal). January 2017. Pacific Northwest Region, Boise, Idaho.
Reclamation 2017 c Bureau of Reclamation. 2017c. Unregulated Flows in the Upper Deschutes Basin, Oregon. October 2017. Pacific Northwest Region, Boise, Idaho.
RDG 2017 River Design Group, Inc. (RDG). 2017. Oregon Spotted Frog and Deschutes Redband Trout Habitat Modeling and Riparian Analysis at Two Sites on the Upper Deschutes River. Prepared for the Deschutes Basin Board of Control on behalf of the Basin Study Work Group. July 2017. Corvallis, Oregon.
UDWC 2016 Upper Deschutes Watershed Council (UDWC). 2016. Whychus Creek and Middle Deschutes River Temperature Assessments. Prepared for the Basin Study Work Group. April 2016. Bend, Oregon.
Zagona et al. 2001 Zagona, E.A., T.J. Fulp, R. Shane, T.M. Magee, H.M. Goranflo. 2001. “RiverWare: A Generalized Tool for Complex Reservoir System Modeling.” Journal of the American Water Resources Association, 37(4), 913-929.
(Note: The content of this document was finalized December 2018; formatting for accessibility compliance with Section 508 of the Rehabilitation Act was applied in 2019.)

December 2018 – Upper Deschutes River Basin Study, Water Resources Technical Memorandum 63
Appendix A: Graphics Describing Flow Scenarios 2a, 2b, and 3
Figure 49. Graphical representation of the model flow objectives for Informational Flow Scenario 1.

64 December 2018 – Upper Deschutes River Basin Study, Water Resources Technical Memorandum
Figure 50. Graphical representation of the model flow objectives for Informational Flow Scenario 2a.

December 2018 – Upper Deschutes River Basin Study, Water Resources Technical Memorandum 65
Figure 51. Graphical representation of the model flow objectives for Informational Flow Scenario 2b.
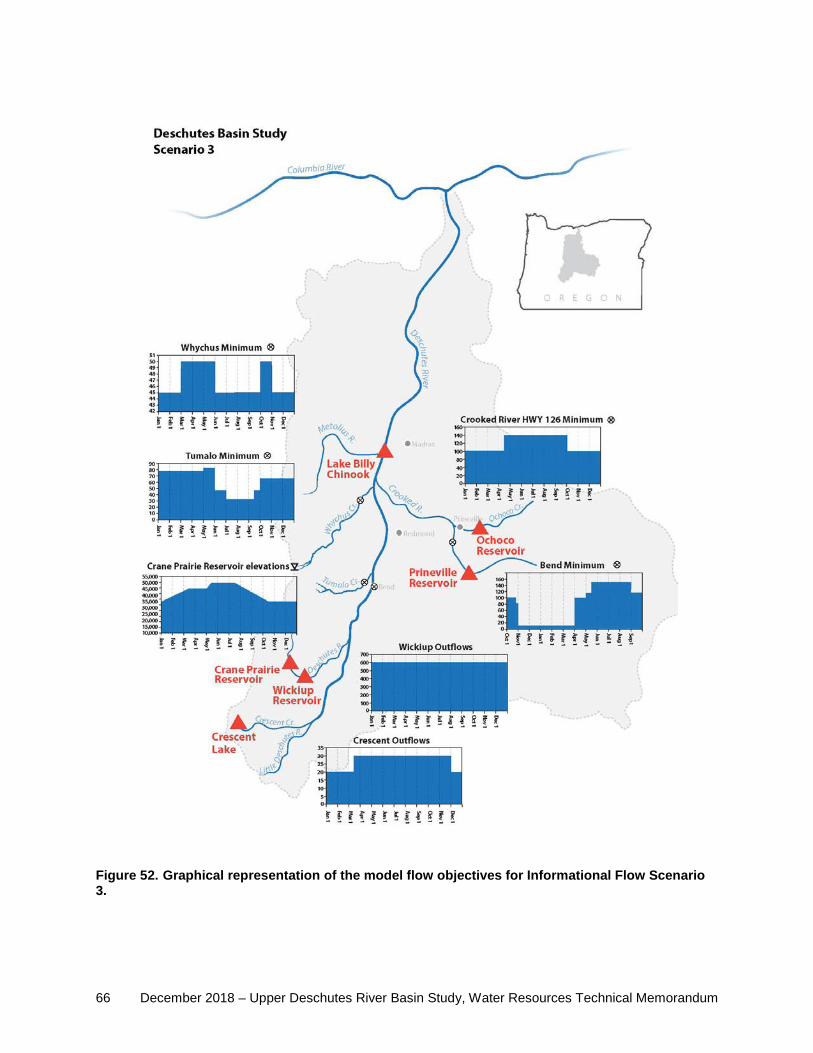
66 December 2018 – Upper Deschutes River Basin Study, Water Resources Technical Memorandum
Figure 52. Graphical representation of the model flow objectives for Informational Flow Scenario 3.