upper ocean and their applications
TRANSCRIPT

THE EMERGENCE OF CONCURRENT HIGH-RESOLUTION
PHYSICAL AND BIO-OPTICAL MEASUREMENTS IN THE
UPPER OCEAN AND THEIR APPLICATIONS
Tommy D. Dickey Ocean Physics Group Department of Geological Sciences University of Southern California, Los Angeles
Abstract. Time and space scales of processes relevant to the upper ocean ecosystem span more than 9 orders of magnitude, consequently adequate sampling of the oceanic environment is a major challenge. However, new capabili- ties for studying upper ocean physical and bio-optical processes have developed rapidly within the past decade with the advancement of sensor technology and data acquisition and storage capabilities. Several oceanic measurement systems have been designed recently to enable the collection of physical and bio-optical data concurrenfiy. Problems concerning variability in primary production by phytoplankton, upper ocean heating, small-scale physical mixing and advection, the dispersion
of oceanic discharges, and global scale climate change related to the carbon cycle can now benefit from in situ concurrent physical and bio-optical data sets. The ocean sampling platforms utilized for deployment of these systems have included ships, the stable platform Research Pla•'orm FLIP, moorings and drifters. Examples of recent data sets obtained from these platforms are presented, and the merits of each of these sampling modes are described. In addition, the needs for complementary in situ and remotely sensed (for example, from satellites) data sets for both analytical and modeling efforts are summarized. Several research applications of the new technology are highlighted.
1. INTRODUCTION
The present review emphasizes new methods and techniques which can be used to treat problems relevant to the upper ocean's ecosystem, particularly involving primary production and carbon cycling, optical variability as affected by physical processes, and the utilization of these techniques for the solution of problems involving upper ocean physics, including heating rates. A glossary of terms, definitions, and acronyms is presented for those who are not familiar with the terminology commonly used by bio-optical and physical oceanographers. The present review focuses on some of the more recent results. Other
pertinent reviews are available [e.g., Yentsch and Yentsch, 1984; Dickey, 1988, 1990].
There is considerable interest in interdisciplinary oceanographic measurements. This interest is driven in large part by the recognition that many important oceanographic problems cannot be solved without truly interdisciplinary data sets and modeling approaches. Some
of these problems concern the upper ocean's ecology, particularly primary production by phytoplankton through photosynthetic processes and secondary production by zooplankton. For example, it has been suggested by many that marine biogenic processes and their cycles may be especially important in controlling atmospheric carbon dioxide concentrations. One of the central problems being addressed by the Joint Global Ocean Flux Study (JGOFS) concerns the regional and global estimation of time- varying biogeochemical fluxes of materials including carbon across the air-sea interface, within the interior of the ocean, and at the sea floor [Brewer et al., 1986]. The recent review of Jahnke [1990] emphasizes the importance of proper sampling (in space and time) for the studies of the marine carbon flux problem. It is evident that physical, biological, chemical, and optical processes interact in complex ways and that appropriate sampling of all these processes over a broad range of scales (Figure 1) is necessary in order to model carbon dioxide variability, particularly in the context of climatic change.
Copyright 1991 by the American Geophysical Union.
8755-1209/91/91 RG-00578 $15.00 383 ß
Reviews of Geophysics, 29, 3 / August 1991 pages 383-413
Paper number 91 RG00578

384 ø Dickey: HIGH-RESOLUTION PHYSICAL AND BIO-OPTICAL MEASUREMENTS 29, 3 /REVIEWS OF GEOPHYSICS
I sec.
Ihour
I doy
I week
I monlh
lyeor
I0 yeor
Imm Icm Idm Im lorn lOOm Ikm IOkm IOOkm IOOOkm I • I i I • I I I I
ped
- _ P•l•cles
Figure 1. A schematic diagram illustrating the relevant time and space scales of several physical and biological processes important to the physics and ecosystem of the upper ocean [after Dickey, 1990]. Definitions of terms are given in the glossary.
The term bio-optics has various connotations but generally refers to the study of the optical processes of the upper ocean as affected by biological processes and vice versa. For many upper ocean problems the two subdis- ciplines are intertwined. Biological oceanographers have long recognized the need for optical and physical informa- tion; however, the utilization of bio-optics for the study of physical problems is very recent. Some of the synergistic relationships between the physics and biology of the upper ocean will be described in the context of new observational
capabilities. A simple conceptual model illustrating how models of
physical, optical, and biological processes may be coupled is described in Figure 2. Physical models utilize conserva- tion laws for heat, momentum, and mass and appropriate boundary conditions including the fluxes of heat, light, and
momentum at the air-sea interface. The products of the physical model include: currents, the mixed layer depth, temperature, and mixing time scales. These variables are needed as input for a biological model of phytoplankton concentrations as the production of phytoplankton depends on the phytoplankton's time spent in the well-lighted portion of the upper ocean, advection, etc. In addition, the availability of nutrients (for example, nitrate, silicate, and ammonium) to the phytoplankton depends on physical mixing and advection. The phytoplankton concentrations also depend on grazing by zooplankton and the photosyn- thetically available radiation (PAR). The bio-optical model of the optical properties is driven by the incident light flux. The light available at depth is dependent on the absorption and scattering of light, primarily by pure seawater and varying concentrations of particulate and dissolved
Figure 2. A conceptual model illustrating coupling of physical and biological processes through optical processes. PENET. RAD. & K indicate the penetra- tive component of solar radiation and the diffuse attenuation coefficient of solar
radiation.
PHYSICAL
MODEL OF
MIXED LAYER ,,,
BIO-OPTICA L
MODEL
- BIOLOGICAL .I MODEL OF
-.,K-! PHYTOPL AN KTON [ CONCENTRATIONS
' CURRENTS, MIXING TIME SCALES, • TEMPERATURE, MIXED LAYER DEPTH
29, 3 / REVIEWS OF GEOPHYSICS Dickey: HIGH-RESOLUTION PHYSICAL AND BIO-OPTICAL MEASUREMENTS ß 385
materials generally associated with phytoplankton and their products. Importantly, the light is attenuated with depth with a spectral dependence (blue light penetrating more deeply than red light in open ocean waters) as represented by a spectral diffuse attenuation coefficient K or K a. There are many potentially important aspects (for example, particle size structure, aggregation, aeolian input of trace metals, etc.) which have not been explicitly included in this highly simplistic model.
A final feedback in the system involves upper ocean heating rates which are dependent in part on the penetra- tive component of solar radiation as modulated by the spectral diffuse attenuation coefficient of light [e.g., Lewis et al., 1983; Siegel and Dickey, 1987a]. A series of studies [e.g., Dickey and Simpson, 1983; Martin, 1985; Price et al., 1986] have shown that variations in phytoplankton concentrations can affect upper ocean physical structure on time scales ranging from a day to the annual cycle. One of the more dramatic illustrations of this effect was reported by Ackleson et al. [1988], who used remotely sensed thermal imagery of the Gulf of Maine and measurements of coccolithophore (a phytoplankton that produces external calcium carbonate plates) concentration. They reported that heating rates in a region of a coccolithophore bloom heated at a rate of 0.32øC d 4, while the heating rate in a compara- ble hydrographic area, but with no coccolithophore bloom, was only 0.06øC d 4. Most recently, Lewis et al. [1990] have shown the importance of including observations of optical transparency for the heat budget of the equatorial Pacific Ocean. Recent satellite observations of ocean color
(used to determine optical transparency) along with climatological surface heat fluxes and density profiles were utilized. They concluded that consistent overestimates of sea surface temperature (by ~3øK) in the western equatorial Pacific by coupled ocean-atmosphere models (which do not account for penetrative solar radiation) may be explained by the fact that the solar radiation is penetrat- ing to depths below the mixed layer. This work illustrates the importance of coupled bio-optical and physical processes.
The increased sampling resolution of bio-optical sensors has made it feasible for physical oceanographers to complement standard temperature and salinity data with bio-optical data such as PAR (for the determination of the diffuse attenuation coefficient of PAR or Kp^•), beam attenuation coefficient (a measure of water clarity), which is related to particle concentrations, and stimulated and natural chlorophyll fluorescence, which are related to concentrations of phytoplankton. These types of data can be used to address problems concerning small-scale physical mixing and advection and the dispersion of oceanic discharges. There are many other processes and interactions which are relevant as well.
Abundance, variability, and diversity of marine populations are affected by biological, chemical, optical, and physical processes and their interactions. The deter- mination of the temporal and spatial scales of variability of
these processes is vital to our understanding of marine populations. Oceanographers have commonly studied phenomena by utilizing time series and spatial data sets and have used spectral analysis techniques to ascertain variance distributions of properties in time and space. Information on time and space scale variability can also be used to design field experiments and to identify and quantify relationships between the forcing and response of the ecosystem. Several in-depth reviews of ecologically relevant time and space scales have been written [e.g., Denman and Gargett, 1983; Haury and Pieper, 1987; Dickey, 1990].
Oceanic organisms are generally affected by processes characterized by scales of more than 9 orders of magnitude in time and space. Representations of some of the more important physical, optical, and biological time and space scales are shown in Figure 1. Physical processes of relevance include: molecular and turbulent diffusion, fides, storm-mixing events, Langmuir cells, inertial motions, coastally trapped waves, internal waves, diurnal and seasonal incident irradiance and heating cycles, and interannual phenomena (for example, E1 Ni[o). Phytoplankton distributions are related in time to the physical forcing through light and nutrient availability and motion, particularly on storm event, tidal, internal gravity wave, diurnal, and seasonal scales.
It is well known that small time scale processes correlate well with small spatial scale processes (Figure 1) and that vertical scales are smaller than horizontal scales.
Horizontal plankton patches have been studied extensively, most recently using satellite color imagery [e.g., Denman and Abbott, 1988]. Further, coastal regions with jets, fronts, coastally trapped waves, and eddies tend to have richer spatial structure than open ocean regions. Time scales of the zooplankton are dependent in part upon phytoplankton time scales and vice versa. Biological processes such as growth, phytoplankton photoadaptation, behavioral effects including food perception and feeding selectivity, and diel vertical migration of zooplankton populations are also relevant. In addition, the doubling times of organisms and their ambits are important aspects. The relationships between doubling time and equivalent diameters of phytoplankton and zooplankton are indicated in the glossary.
There are at least some general relationships between physical time and space scales and trophic scales as demonstrated by Steele [1978], who noted that an empiri- cal relation presented by Okubo [1971] between the standard deviation of dye concentration, or a characteristic mixing scale and time, •-t •'2, generally conforms with biological trophic scales. Denman and Powell [1984] asserted that specific physical processes with time and space scales comparable to those of biological processes should have dominant ecological importance because plankton are roughly passive. One of the perplexing aspects of the ecology of the upper ocean is that the system is highly complex and generally nonlinear in nature. In

386 ø Dickey: HIGH-RESOLUTION PHYSICAL AND BIO-OPTICAL MEASUREMENTS 29, 3 / REVIEWS OF GEOPHYSICS
terms of observations we are challenged with the goal of providing continuity over scales exceeding 9 orders of magnitude. In the following development, various measurement systems and their deployment modes are described. These may be considered as elements of a grand observing system which can be used to synthesize data spanning the relevant time and space ranges. Clearly, the matching and synthesizing of information between scale ranges will be a major challenge for the future.
2. GLOSSARY
The following terms are commonly used by bio-optical and physical oceanographers. More information may be found in survey works by several authors including: Denman and Gargett [1983], Denman and Powell [1984], Harris [1986], Kirk [1986], and Pond and Pickard [1983]. In addition, several acronyms are defined. A general reference for oceanographic remote sensing by satellites is the work by Stewart [1985].
2.1. Bio-optical
Beam attenuation coefficient (beam c). The percentage of energy in a beam of light transmitted per unit distance (Az) is given by
T = 100 exp(-cAz)
where the beam attenuation coefficient c is in m -• and Az
is in meters. Beam c is the fraction of energy removed by both absorption and scattering per unit distance traversed by the beam and is equal to the sum of the absorption and scattering coefficients of the light beam. A theoretical calibration curve [Spinrad, 1986] may be used to relate c to suspended particle volume. It should be noted that c is related to the refractive indices of particles as well as particle size and shape distributions [Kitchen and Zaneveld, 1990]. The measurements described here were done with either a 25-cm or 1-m path length transmis- someter using a collimated beam of light centered at 660 nm. Particles with diameters of generally less than approximately 30 I. tm are sampled.
Carbon flux. The vertical flux of carbon in the ocean.
The flux from the euphotic zone results principally from new primary production by phytoplankton.
Coccolithophore. A group of phytoplankton that produces external calcium carbonate plates.
Euphotic zone. The upper portion of the water column where there is sufficient light for photosynthesis. The depth of this region is usually taken to be where PAR has a value of 1% of the surface value.
Flow cytometry. A technique which is used to rapidly measure light scatter and fluorescence from particles and is applied to the optical properties of phytoplankton [e.g., Yentsch, 1990].
Grazing rate. The rate at which phytoplankton concentrations are reduced by consuming zooplankton.
Natural fluorescence. Solar induced chlorophyll fluorescence produced by phytoplankton. The fluorescent emission of phytoplankton chlorophyll a is centered at a wavelength of 683 nm with a half width of about 25 nm [e.g., Chamberlin et al., 1990].
Nutrients. The major inorganic plant nutrients used by phytoplankton including nitrate, ammonium, phosphate, and silicate.
Particle production rate. The specific rate of change of particle concentrations as affected by the growth of phytoplankton or the grazing of phytoplankton by zooplankton.
Photosynthetically available radiation (PAR). The photon flux (quanta m -2 s -•) characterized by light coming from all directions in the wave band of 400-700 nm. The
term PAR is often used synonymously with the term scalar irradiance.
Phytoplankton. The group of planktonic (freely floating) plants which live predominantly in the upper layer of the ocean [e.g., Harris, 1986]. Phytoplankton typically range in size from a few micrometers to ~100 I.tm, and their doubling times range from a fraction of a day to a few days, depending on species and environmental conditions.
Pigments. Complex molecules such as chlorophyll a contained in phytoplankton and their products that are usually associated with light capture and photosynthesis [e.g.,Bidigare et al., 1989].
Chlorophyll a: One of the predominant pigments found in living phytoplankton and a major component of the phytoplankton photosystem.
Phaeopigments: A group of pigments resulting from the breakdown of chlorophyll often found in the nonliving products of phytoplankton.
Primary productivity. The rate of production of carbon by phytoplankton (for example, in mg C m -3 hr-•). Production is the weight of new organic material formed plus losses for a given time interval. Losses are due to respiration, death, sinking, and grazing [Harris, 1986].
Gross primary productivity: The gross rate at which photosynthesis converts dissolved inorganic carbon and nutrients into organic matter and releases dissolved oxygen.
Net primary productivity: The rate at which organic material becomes available (after plants have used some of the organic matter for their own respiration) for food for heterotrophs (animals, bacteria, etc.) either before or after death of plants.
New production: The production of phytoplankton that is supported by the vertical flux of nitrogen into the euphotic zone and is not dependent upon the recycling (or regeneration) of nitrogen [Dugdale and Goering, 1967]. New production determines the rate at which primary productivity can be exported from the system, such as through sedimentation [Eppley and Peterson, 1979].

29, 3 / REVIEWS OF GEOPHYSICS Dickey: HIGH-RESOLUTION PHYSICAL AND BIO-OPTICAL MEASUREMENTS ß 387
Relative transmission. The percentage of light received at a detector of a beam transmissometer (for example, 660 nm). For example, 100% for clear air and 0% for blocked beam.
Respiration. The process by which organic matter is oxidized biologically and converted to inorganic carbon (CO2) with release of chemical energy.
Secchi disc. A white disc approximately 20 cm in diameter which is lowered into the water. The depth at which the disc disappears from view is defined to be the Secchi depth Zst >. This depth may be related to a broad wave band diffuse attenuation coefficient (with spectral sensitivity of the human eye) as K• = 1.44/Zst > [Kirk, 1986].
Spectral diffuse attenuation coefficient. Depth derivative of the natural logarithm of spectral downwelling irradiance, E• (z, 3•), or
K(3•)-/}{ln[E•t(z,•)]}
Units are in m -1, where 3• is the wavelength of light and K (or K a) here refers to the diffuse attenuation coefficient of the downwelling component of irradiance.
Spectral downwelling irradiance. The radiant energy flux per unit wavelength measured by a horizontally oriented cosine collector (collector with a cosine geometri- cal response) facing upward to measure downwelling light. Units are gW cm -2 nm -•.
Stimulated fluorescence. Fluorescent light is emitted from chlorophyll a pigments after excitation by blue light. This effect is utilized to estimate concentrations of
chlorophyll a associated with phytoplankton using strobe- or light-stimulated fluorometers.
Upwelling spectral radiance. The energy per unit time, area, solid angle, and wave band incident on a downward facing sensor at some depth. Units are gW cm -2 sr-• nm-•.
Zooplankton. The group of planktonic animals living primarily in the upper ocean. Typical sizes range from ~100 grn to a few millimeters, and their doubling times range from a few days to a few weeks.
2.2. Physical
Advection. Changes in physical or biological properties caused by motion of a fluid in presence of spatial gradients in the properties.
Coastal jets and filaments. Narrow current flows characterized by high transport, often directed offshore in upwelling regions such as coastal California.
Coastally trapped waves. Poleward propagating waves (speed of a few meters per second) occurring along coasts in eastern boundary currents (for example, Califor- nia Curten0. The waves are supported by stratification and shelf topography. Typical length scales are around 30 km,
and associated current variability has time scales of days to weeks.
Decibar (db). A unit of pressure (0.1 bar or 10 5 Pa) used for oceanic depths and roughly equivalent to 1 m.
Fronts. Regions characterized by high values of horizontal gradients in temperature and currents and often biological properties.
Gyre circulation. The general current pattern of a major ocean basin.
Heat budget. The heat budget of the upper ocean is the equation describing the fluxes into and out of a control volume in the upper ocean.
Inertial currents (waves). Currents generated by the passage of traveling weather systems including storms. The inertial period of motion is given by 12hr/sin (latitude).
Internal gravity waves. Subsurface waves which are supported by stratification in the ocean.
Isopycnal. Surfaces of constant density. Subsurface ocean flows are often directed along these surfaces.
Langmuir cells. Near-surface circulation patterns generally aligned parallel to the prevailing wind direction and scaled roughly with the depth of the mixed layer.
Mesoscale rings and eddies. Nearly circular patterns which are often found in the vicinity of high-flow regimes such as the Gulf Stream but also observed in lower flow regimes.
Microconductivity probe. A special sensor for measuring changes in water conductivity (temperature if salinity is relatively uniform) to scales as small as a centimeter.
Mixed layer depth (MI.D). The upper portion of the water column which is nearly uniform in temperature and density. The definition used for the mixed layer depth here is the depth at which the temperature is 0.1 ø cooler than the near-surface value.
Mixing time scale. The characteristic time scale a parcel of water takes to make an excursion from the surface to the bottom of the mixed layer.
Penetrative component of solar radiation. The portion of light which is received beneath the water's surface. The attenuation of this light is modulated by light wavelength and the absorption and scattering of light by pure seawater, dissolved materials, and pigmented biomass (for example, phytoplankton).
Sigma theta ({J0). The value of •0 is equal to (potential density- 1000) in inks units where the potential density is the density of water computed using potential temperature, the temperature of a water mass brought to the surface of the ocean adiabatically.
Salinity. The amount of dissolved solid material (in grams) in 1 kg of seawater after all carbonate has been converted to oxide, the bromine and iodine replaced by chlorine, and all organic material oxidized. Units are in practical salinity units (psu), formerly parts per thousand.
1ow-yo. To tow a sensor package behind a ship with the depth of the package being varied either by winch or by control wings.

388 ß Dickey: HIGH-RESOLUTION PHYSICAL AND BIO-OPTICAL MEASUREMENTS 29, 3 / REVIEWS OF GEOPHYSICS
Turbulent mixing. Small-scale mixing typically caused by current shears or gravi•tional instabilities.
2.3. Acronyms and Abbreviations
ADCP. The acoustic doppler current profiler uses the principle of the Doppler effect and the scattering of acoustic energy to measure currents.
AEDB. The Arctic environmental drifting buoy was developed to obtain physical and bio-optical data collected from sensors placed below a drifting buoy with data being transmitted via satellite to land stations [Honjo et al., 1990].
AVHRR. The satellite-borne advanced very high resolution radiometer is used to determine sea surface
temperature over the world oceans [e.g., Stewart, 1985]. The horizontal resolution is about 1-4 km.
Batfish. A towed system used to measure horizontal and vertical variability in various physical and biological parameters [e.g., Herman, 1985].
Biowatt. An interdisciplinary study concerning the observation and modeling of temporal and spatial variability of optical properties and bioluminescence as forced by physical processes. The field experiments were conducted in the Sargasso Sea in 1985 (Biowatt I) and 1987 (Biowatt II) [see Marra and Hartwig, 1984; Dickey et al., 1986b].
BIMS. The bioluminescence moored system was designed to obtain passive and stimulated bioluminescence data from moorings [Swift et al., 1988].
BOMS. The bio-optical moored system is used to collect bio-optical and temperature data from moorings [Sr•'th et al., 1991].
BOPS. The bio-optical profiling system is used to obtain vertical profiles of physical and bio-optical variables [Smith et al., 1984].
CTD. Conductivity/temperature/depth measuring system is used for the determination of temperature, conductivity (for salinity), and depth (using pressure) and often other auxiliary variables (CTD+). Water collecting bottles are sometimes used in conjunction with the CTD or CTD+o
CTZ. The Coastal Transition Zone (CTZ) Experiment was conducted off the coast of northern California in 1987
[Abbott et al., 1990]. CZCS. The satellite-borne coastal zone color scanner
(CZCS) collected ocean color data (reflected sunlight at 443, 520, 550, 670, and 750 nm and infrared emissions at 11.5 !.tm) from late 1978 through mid-1986. The spatial resolution was about 0.8 km 2. These data have been used to estimate phytoplankton biomass [e.g., McClain et al., 1990]. Future color-imaging satellite instruments are described by Yoder [1988].
Cyclesonde. An autonomous profiling current meter [Van Leer, 1980].
Geosat. The Geodetic satellite used a radar altimeter for
measuring the elevation of the sea surface of the world
oceans. Data are typically used to produce horizontal maps with each grid cell of about 18 km on a side. Typical mid-latitude time resolution (after averaging) is about 10 days. Using these data, currents were determined during the approximate period of 1985 through 1990 [e.g., Fu et al., 1988].
HPI. C. High-performance liquid chromatography is a method which can be used to identify different organic compounds, in this case plant pigments, which are associated with various groups of phytoplankton [e.g., Bidigare et al., 1989].
JGOFS. The Joint Global Ocean Flux Study is an international interdisciplinary program which concerns the regional and global estimation of time-varying biogeochemical fluxes of materials including carbon across the air-sea interface, within the interior of the ocean, and at the sea floor and consequent climate change [Brewer et al., 1986].
MII. DEX. The Mixed Layer Dynamics Experiment was conducted in the California Current in 1983 [Weller et al., 1985].
MLML. The marine light in the mixed layer program is a study devoted to the understanding and prediction of temporal and spatial variability of bio-optical ,and bioluminescent properties of the upper ocean as driven by physical processes of the upper ocean. The site of the field studies (MLML I in 1989 and MLML II in 1991) is south of Iceland (59øN 21øW) [Marra, 1989].
MVMS. The multivariable moored system is used to collect time series physical and bio-optical data from moorings [Dickey et al., 1990, 1991].
MVP. The multivariable profiler is an autonomous device based on a cyclesonde which is used to collect vertical profile physical and bio-optical data [Dickey, 1988].
ODEX. The Optical Dynamics Experiment was conducted in the central North Pacific Ocean in 1982 using R/P FLIP and other conventional research vessels [Dickey et al., 1986a].
OPTOMA. The Ocean Prediction Through Observa- tions, Modeling, and Analysis study was conducted off the northern California coast in 1986 [Rienecker et al., 1988].
?MI. The physical measurement instrument uses four dual axis electromagnetic speed sensors, a compass, and a tilt sensor for measuring vertical water velocity [Kirkpatrick et al., 1990].
ROV. Remotely operated vehicle. R/P FLIP. The Research PlaOCorm FLIP (floating
instrument platform) is a specially designed platform which is exceptionally stable even in extremely high sea states. During normal operations, over 80% of its hull (length of 108 m and less than 7 m in diameter) is sub- merged with vertical motion of less than about 20 cm and deviation from the vertical plane of less than 5 ø .
Seasat. An ocean monitoring satellite used to measure parameters including sea surface temperature and eleva- tion, surface wave height and wavelength, and wind speed

29, 3 / REVIEWS OF GEOPHYSICS Dickey: HIGH-RESOLUTION PHYSICAL AND BIO-OPTICAL MEASUREMENTS ß 3.89
and direction [e.g., Stewart, 1985]. The satellite operated for 106 days in 1979.
SUPA. The self-contained photosynthesis apparatus is used to determine photosynthetic rates and employs irradiance, temperature, pH, and dissolved oxygen sensors [Kirkpatrick et al., 1990].
UOR. The undulating oceanographic recorder is used to measure horizontal and vertical variability in physical and bio-optical variables [e.g., Aiken and Bellan, 1986].
XBK. The expendable bathyoptical (for example, K, diffuse attenuation coefficient) probe is a hypothetical device which could provide vertical profile optical data as does the analogous XBT for temperature.
XBI. The expendable bathythermograph is used to obtain vertical profiles of temperature and is depIoyed from a moving ship. The airborne XBT (AXBT) is similar but deployed from an airplane.
3. MEASUREMENT SYSTEMS AND OBSERVATIONS
The collection of concurrent and colocated interdiscipli- nary data with common resolution and range is imperative as indicated by the time and space diagram shown in Figure 1. This section provides an overview of recent progress toward achieving that goal. The optimization of sampling remains a dominant consideration for observa- tional oceanographers. Thus the need to minimize aliasing and to maximize the periods of time series observations as well as to optimize spatial resolution and synopticity is implicit.
In the following development, selected recent in situ oceanographic measurement systems for concurrent observations of physical and bio-optical variables are described. These are classified according to platform: (1) ships on station, (2) ships underway, (3) drifters, and (4) moorings. A conceptual sampling plan utilizing these
observational platforms is illustrated in Figure 3. These platforms (along with airplanes and satellites) and their approximate temporal and spatial sampling domains, with relevance to the physics and bio-optics of the upper ocean, are summarized in Table 1. This table can be used in
conjunction with Figure 1 to match the time and space scales of processes with platform capabilities. Examples of measurements taken from various platforms are presented here to illustrate applications to several oceanographic problems. Some of the measurement programs were conducted in coastal waters and others in open ocean waters.
3.1. Ships on Station One of the important in situ physical oceanographic
measurement systems is the CTD or conductivity (for salinity), temperature, and depth measuring system which is deployed from a ship at a specific site providing vertical profile data with typical vertical resolution on sc•es of less than ~1 m. The standard CTD is often complemented with water collection bottles (rosette sampler) for discrete sampling of chemical variables (dissolved oxygen, nutrients, etc.) and biological variables (for example, chlorophyll a and other plant pigments). In the early 1970's, integrated CTD/optics/rosette systems were developed and utilized by a group at Oregon State University [e.g., Zaneveld et al., 1973]. As additional bio-optical sensors have been developed, they too have been interfaced with CTD's. In particular, Smith et al. [1984] developed the bio-optical profiling system (BOPS) which includes: a CTD with rosette, a PAR sensor, spectroradiometers which measure downwelling irradiance and upwelling radiance at 12 wavelengths in the visible radiation spectrum, a beam transmissometer, and a stimulated fluorometer. The BOPS has been used during several major interdisciplinary measurement programs [e.g., Smith et al., 1991].
NESTED BIO-PHYSICAL SAMPLING PLAN
Acol
Acoust _...• Drifter Acoust.
I Stoa,I- Scale I J ß I Packages I I •J T, U, Light, I I • Particles, I I
ROV ,
Submersible ,.
Acoust.
,ust.
Acoust.
Figure 3. A conceptual illustration of a "nested" in sire bio-physical sampling configuration designed to sample processes with a broad range of temporal and spatial scales.

390 ß Dickey: HIGH-RESOLUTION PHYSICAL AND BIO-OPTICAL MEASUREMENTS 29, 3 / REVIEWS OF GEOPHYSICS
Table 1. Various Platforms and Their Approximate Temporal and Spatial Sampling Domains with Relevance to the Physics and Bio-Optics of the Upper Ocean
Sampling Domains Platform Time Horizontal Vertical
Moorings 1 min to years
Ships on station <1 hour to 4 weeks
centimeters at fixed depths: surface to hundreds of meters
on station: centimeters surface to hundreds of interstation: kilo- meters meters
Ship mapping at fixed 1.5 days to 4 weeks <1 m to hundreds of at fixed depth: upper depth kilometers few hundred meters
Ship tow-yo's 1.5 days to 4 weeks 0.5 km to hundreds <1 m to hundreds of of kilometers meters
Drifters (Drogues) 1 min to 6 months <1 m to thousands at fixed depth: upper of kilometers tens of meters
Planes 1 day to 1 week tens of meters to upper few meters thousands of (optical attenuation kilometers depth)
Satellites 1 day to years 1 km, global upper few meters (optical attenuation depth)
This table may be used with Figure 1 to match time and space scales of processes with platform sampling capabilities.
An example of the type of data that can be obtained using profiling systems in the open ocean follows. The RIP FLIP (Figure 4) was used to deploy three separate profiling •systems to a nominal depth of 250 rn in the open ocean waters of the central North Pacific Ocean (~32øN 142øW) [Dickey et al., 1986a] during the Optical Dynamics Experiment (ODEX) (October 20 through November 12, 1982). An extensive set of meteorological data was also taken concurrenfiy. The CTD+ package included a CTD with rosette water sampler, a beam transissometer, a stimulated fluorometer, and a dissolved oxygen sensor. Profiles were made at intervals ranging from -15 min to -4 hours. Using water samples from the rosette, discrete determinations of salinity along with dissolved oxygen, nutrient, and pigment concentrations were made. An autonomous profiling package (modified cyclesonde) [Van Leer, 1980] was used to determine the vertical shear of
horizontal currents, temperature, and depth on an hourly cycle. An optics system consisting of a spectroradiometer for downwelling spectral irradiance, a thermistor, a pressure sensor, and a beam transmissometer were used to obtain vertical profile data every few hours during daylight. The vertical scales of sampling resolution (after averaging) were less than a few meters (note that 1 rn of vertical displacement is approximately equal to a pressure change of 1 decibar, dbar).
The R/P FLIP drifted during the experiment, and thus the data set must be interpreted as being mixed in time and space. During the early portion of the experiment the advective effects were minimal; however, toward the end of the observations the RIP FLIP drifted through major frontal features [Dickey et al., 1986a; Washburn et al., 1989]. The evolutions of the vertical structure of some of the primary physical and bio-optical variables for a period of about 5 hours during the latter portion of the experiment
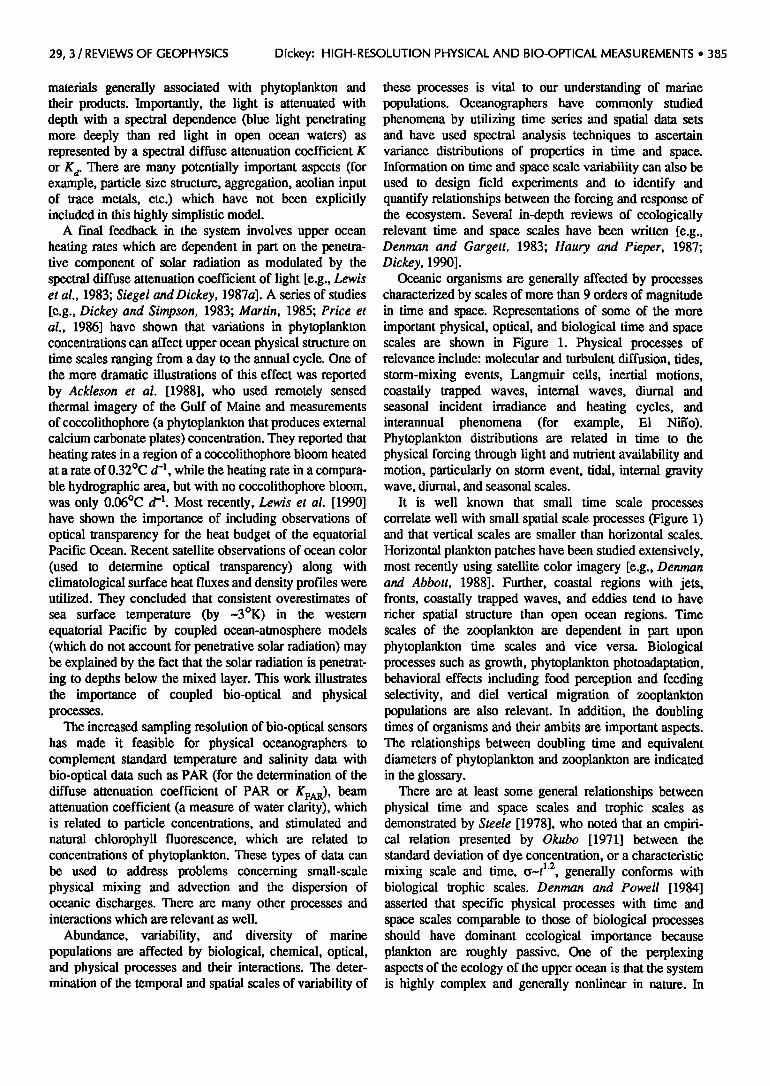
are shown in Figures 5a-5e. The individual profiles are shifted proportionately in time with a nominal time interval between profiles of about 15 min. These profiles indicate a thermohaline (temperature-salinity) feature between about 165 and 190 m. Interestingly, the feature is also evident in the lower relative transmission (higher beam attenuation coefficient) and higher chlorophyll fluorescence values, suggesting that the relatively warm and saline water intrusion was high in biomass. Some of the' other general results of the entire time series include: a
METS Radiation etc. I
CTD+:
Pressure R Temperature J• P Salinity LLLJJ Transmissivity J[] Fluorescence ,J.L J. Nutrients Chlorophyll Phaeophytin C TD+
PACKAGE
OPTICS PACKAGE
Downwelled Spect. Irrad.
Transmissivity Temperature Pressure
CYC' _ESONDE
Pressure
Horiz. Velocity Temperature
Figure 4. The sampling configuration of the RIP FLIP during the Optical Dynamics Experiment (ODEX) conducted in the North Pacific subtropical gyre in 1982 [after Dickey et al., 1986a].
29, 3 / REVIEWS OF GEOPHYSICS Dickey: HIGH-RESOLUTION PHYSICAL AND BIO-OPTICAL MEASUREMENTS ß 391
a
8 0 I-
• ioo-
• •5o--
2-oo-
2.6.0 0
50 %
• • ioo I.d I00
(./3 • 150 I.d 150 •
2O0 2OO
• I • I I I I I I • • • • I I I • I
2-50 312.75 312.80 312.85 312.90 "' rV 10•3•
b S(psu)
TEMPERATURE (øC) 34.0 34.5 35.0
I 200• • I • • •
250 F , I , , i I I i I I •BI I I I I I I i ! i I Bi2.75 •i2.80 2.85 BI2.90 DAY I982
182 d RELATIVE TRANSMISSION
½e (kg m -5) ooo o.zs o.so o.,s •.•o 24.0 25.0
e
o
200
FLUORESCENCE (v) 4 6 8 I0
-
_
-, 1751 i , , , , , I I , , , , •),. i , , i DAY 1982
high correlation between the depth of the particle maxi- mum and the depth of the mixed layer and strong correla- tions between vertical profiles of the spectral diffuse attenuation coefficient in the blue-green region and other bio-optical variables such as stimulated fluorescence and chlorophyll a and phaeopigment concentrations as indicated in Figure 6 [Siegel and Dickey, 1987b]. The diurnal variations of the beam attenuation coefficient have
] I I I I I I i i , I I I i i i I I i , i 250 312.75 312.80 312.85 312.90
DAY 198 2
Figure 5. Physical and bio-optical data obtained in the North Pacific Subtropical gyre from R/P FLIP during ODEX on November 8, 1982. These observations, taken at approximately 15-min intervals, show the temporal evolution of vertical profiles of (a) temperature, (b) salinity, (c) potential density (c•0), (d) relative transmission (x100 for percent transmission), and (e) chlorophyll fluorescence [after Dickey et al., 1986a]. Note that a depth unit of lm is approximately equal to a pressure difference of 1 db.
been used to determine particulate abundance and particle productivity variations [Siegel et al., 1989]. Using these data, the daily mean specific growth and grazing rates along with water column community production have been estimated (Figure 7; see section 3.4). J. J. Cullen et al. (Photosynthetic characteristics and estimated growth rates of phytoplankton in the equatorial Pacific, submitted to Journal of Geophysical Research, 1991) most recently have applied this same methodology to estimate primary production at the equator. During ODEX, vertical profile physical and bio-optical data were collected from the R/V Acania both near the RIP FHP and over broader oceanic regions giving important data conceming horizontal as well as vertical and temporal scales [e.g., Pak, 1984]. The RIP FLIP was also used to do physical and biological measurements as part of the Mixed Layer Dynamics Experiment (MILDEX) in

392 ß Dickey: HIGH-RESOLUTION PHYSICAL AND BIO-OPTICAL MEASUREMENTS 29, 3 / REVIEWS OF GEOPHYSICS
cre (kg/m 3) 240 245 250 255 260 265
C(66Onm) (m -I)
o.,, o,•, o? ø4, i . . ,
FI (Volts)
! ' I
Chl-o (mg/m 3) 0 0.1 012 0 3 i . . ß ß i . ß ß . •'". ß ß i
Phoeo (mg/m 3)
Figure 6. At left, vertical profiles of potential density ((•0), beam attenuation coefficient (c), chlorophyll fluorescence (F1), chlorophyll a concentration (Chl-a), and phaeopigment concentra- tion (Phaeo). At right, a total of 32 superimposed vertical profiles of the spectral diffuse attenuation coefficient (K,•) for four wavelengths of light [after Siegel and Dickey, 1987b]. All data were taken from R/P FLIP during ODEX in the fall of 1982.
0.44
0.43
0.005 T
E ----- 0
<3 -0.005
0.60
'(a) '- ' ' ' ' ' ' ,
--- i i i i i i i (b) '
c)
no o_
::'o •'
I
0 n)
I
I I I ! I I I _ 0'60305 306 307 508 309 310 311 312 313 314 LOCAL DAY 1982
Figure 7. Determination of specific production rates determined from data collected from RIP FLIP during ODEX in the fall of 1982 [after Siegel et al., 1989]. (a) Temporal variations of beam attenuation coefficient at 20 m (solid) and the running daily mean beam attenuation coefficient at 20 m (dashed). The days are in local time. (b) Time series of the deviation of beam attenuation coefficient (20 m) from the running daily mean beam attenuation coefficient (Ac) is shown as the solid curve. Time series of PAR (20 m) is shown as a dashed curve and is in units of 1029 quanta m -2 s-1. (c) Time series of sampled (solid) and modeled (dashed) specific particle production rates (r0) for 20 m.
the California Current [Weller et al., 1985]. Shipboard physical-bio-optical profiles also provide
valuable insights into the coastal region. For example, these types of profiles were made as part of the Coastal Transition Zone Experiment (CTZ) in coastal waters
offshore of northern California (Figure 8a; between Point Reyes and Point Arena) in July 1988 (L. Washburn et al., Water mass subduction and the transport of phytoplankton in a coastal upwelling system, unpublished manuscript, 1991) (hereinafter referred to as Washburn et al., un-
29, 3 / REVIEWS OF GEOPHYSICS Dickey: HIGH-RESOLUTION PHYSICAL AND BIO-OPTICAL MEASUREMENTS ß 393
b O' e {kg m -3) 23 24 25 26 27
ß 1 ! lell i I * ' ' ' I ' ' ' ' I ' ' ' ' I • ' ' ' I 46 , 03 BEAM c(m -•) 08 •.3
;" ø' f .... ' '-' --, .... . • , •?.• ...... •,o.• %, ' '- ß ' . •.,Z 8 50 ....... '
, ..... , , , , , , , ..... , ..... , ..... ,=,- ,=•- ,•' ,=•- '='- '•' •oo
0 2 4 6 8 I0
FLUORESCENCE (v) or CHLOROPHYLL
c e (kg m '•) • •4 •5 •6 2• d c e(kgm -•) i • , • , i , • • • i • • ' ' i , • • ' i 23 24 •5 •6 27
O.3 BEAM c(•) o.e •.3 , .................... 0 O.3 BEAM c(•) o.8
. ...... --, , 50
e •' 50
•e:25.8• = 25.8• I00 _• - • I00
150
e= Chlo • 150 2000 2 4 6 8 I0 .-'• • • , I • I • 200
FLUORESCENCE (v) or CHLOROPHYLL (•g/2) 0 • 4 6 8 •0 FLUORESCENCE (v) or CHLOROPHYLL (•g/2)
i , , , , i , • .' , i . . . ' i . , , ' i i , . . ' i , , , , i . , • ' i . . . • ß
0.3 BEAM c(•) o.e •.3 0.3 BEAM c(•) 0.8 •.3
. • • , i , 0 • 0 • , ,
50 • 50 [ '
• ,oo ,oo •.,• • .
• .
150 ': Chla • 150 ......... STATION 67 . •F STATION 33 200 • I • I , I t • 200 I , I • ! • ,
0 2 4 6 8 I0 0 2 4 6 8 I0
FLUORESCENCE (v) or CHLOROPHYLL (4 g/2) FL UORE SCENCE
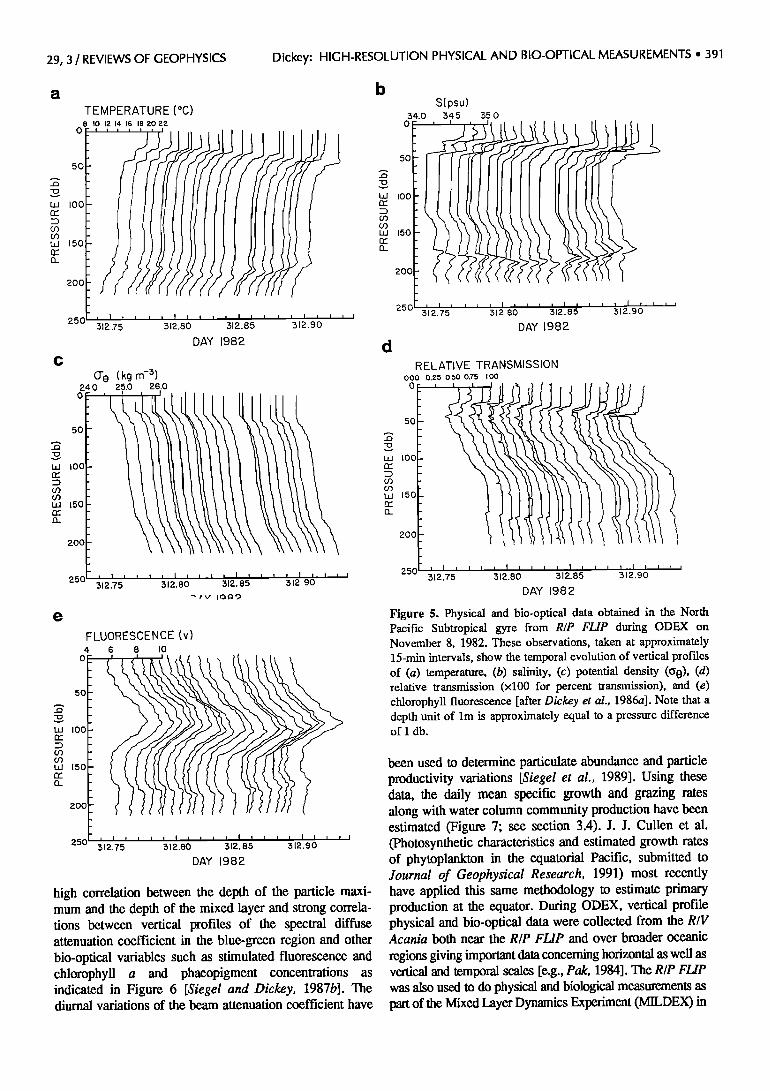
Figure 8. Physical and bio-optical observations taken in a region of strong coastal jets off central California in 1988 (after L. Washburn et al., unpublished manuscript, 1991). (a) Contours of geopotential anomaly [e.g., Pond and Pickard, 1983] indicative of the streamlines of the flow field and locations of CTD stations
(circles) and (b)-(f) particular profile stadons (triangles). Profiles of potential density and chlorophyll fluorescence along with chlorophyll concentrations at the five stations (stations 46, 64, 17A, 67, and 33) along the jet axis proceeding from nearshore (Figure 8b) to offshore (Figure 8f).

394 ø Dickey: HIGH-RESOLUTION PHYSICAL AND BIO-OPTICAL MEASUREMENTS 29, 3 / REVIEWS OF GEOPHYSICS
published manuscript, 1991). The contours of the geopotential anomaly (0/500 dbar) indicate a narrow and strong jet of upwelled water extending offshore from Point Arena. Vertical profile data were obtained offshore (including stations 46, 64, 17A, 67, and 33 shown in
Figures 8b-8f). The density (proportional to (•0), beam attenuation coefficient (beam c), and stimulated fluores- cence data indicate that there was a gradual sinking of phytoplankton in layers along isopycnal (constant density) surfaces along the jet axis. The sequence of profile data suggests that the vertical distribution of phytoplankton is primarily related to the vertical position of the isopycnal surfaces implying a physical control versus a biological control in this circumstance as the phytoplankton are well below the euphotic layer. Interestingly, on the time and space scales of these measurements the bio-optical variables (beam c and stimulated fluorescence) tended to act as tracers of an isopycnal flow.
3.2. Ships Underway Generally, spatial variations of the ocean are greater
with respect to depth than with respect to the horizontal.
However, in coastal regions, near boundary currents, and even in the open ocean, horizontal gradients in physical and bio-optical variables are often intense and supported by strong current shears. Thus it is often advantageous to utilize underway shipboard sampling to observe a particu- lar region as rapidly as possible to obtain a synoptic data set for bio-optical as well as physical variables. Several special towed systems have been designed to sample vertical and horizontal scales of variability of physical and biological parameters. The Baffish system is one of the better known towed systems [e.g., Herman, 1985] and the undulating oceanographic recorder (UOR) was developed at approximately the same time as the Batfish [Aiken and Bellan, 1986]. Both are used to measure a suite of physical and bio-optical parameters comparable to the CTD+ described above along with zooplankton. The UOR differs from the Batfish in that an extensive set of optical sensors is included. It undulates from near the surface to depths of -200 m with successive horizontal scales of-800-4000 m.
A tow-yo system (Figure 9a) was utilized off the coast of northern California (Figure 9b) as part of the Ocean
Fin Current Meter • Pressure Sensor 1D / j Microconductivity
•""'"-........••""' % -•)- / -• / Electronics • [• •, L_ ' •/ Temperature and
................ M••4•4•• •) I •-'• '-• • /Conductivily Sensors
.... /, - -' II
/ / Tmn•mis•l•r Fluoromelet •icroconducli•ily Prob•
Figure 9. (a) A schematic of a to w-yo system used for concur- rent horizontal-vertical mapping of physical and bio-optical vail ......... ables (provided by Libe Wash- bum). (b) A sea surface tem- perature AVHRR satellite image (white indicates cool waters)
...
taken on July 16, 1986, off "'" northern California and cruise :.' .......
ß
track lines. Data taken with the
tow-yo system shown in Figure 9a along line C (north to south) through a cool filament or jet are .'•:• shown in Figure 10 (satellite im- age is from B. H. Jones et al., unpublished manuscript, 1991).
.....
ß

29, 3 /REVIEWS OF GEOPHYSICS Dickey: HIGH-RESOLUTION PHYSICAL AND BIO-OPTICAL MEASUREMENTS ß 395
Prediction Through Observations, Modeling, and Analysis a TEMPERATURE (øC) (OPTOMA) study in July of 1986 in nearly the same NORTH SOUH
region used for the CTZ experiment (B. H. Jones et al., Chemical and biological structure of a cool filament
observed off northern California in July 1986 (OPTOMA 21), unpublished manuscript, 1991) (hereinafter referred to
as Jones et al., unpublished manuscript, 1991). The system measures physical (CTD) variables along with microcon- ductivity (for small-scale mixing), beam attenuation coefficient, stimulated fluorescence, and package velocity. For this study, satellite-derived advanced very high resolution radiometer (AVHRR) data were used to guide the shipboard observations. In particular, a cold filament of
freshly upwelled, nutrient rich coastal water was identified and tow-yo sampling (along line C in Figure 9b) was done nearly perpendicular to the axis of the filament which was o directed offshore. The tow-yo system profiled between 5 and 120 rn depths while being towed at about 4 rn s -• to _ enable resolution of vertical scales of-0.25 rn and
horizontal scales of-800 m. Alongshore tow-yo sections • OR of temperature, beam attenuation coefficient, and chlorophyll fluorescence are shown in Figure 10. Intense horizontal gradients in these variables are evident at a relative distance of about 50 km along the track. On the •-- north side of the front of the filament, high values of beam attenuation and chlorophyll fluorescence are evident to depths of 100 m, which are greater than the depth of the euphotic zone (-30 m). These high values indicate that the biomass was not locally derived, but rather subducted through advection associated with the flow of the filament, estimated to reach velocities of about 50 cm s -•. This data set illustrates the value of concurrent physical and
I I I I I ! I !
bio-optical data for interpreting complex coastal processes. Another interesting and practical application of tow-yo
sampling (system shown in Figure 9a) has been reported by Washburn et al. [1991] and B. H. Jones and L. Wash- bum (personal communication, 1990) who examined the dispersion of wastewater outfall in a coastal environment. Treated wastewaters are discharged through diffusers located at a depth of •50 m off Palos Verdes, California (Figure 11a) at a rate of about 1.4 x 10⁶ m 3 d -1. The temperature and salinity of the discharge waters are about 30øC and 2 practical salinity units (psu), respectively, resulting in a density anomaly of about 2.6 kg m -3, thus creating a positively buoyant plume of relatively warm, fresh, and turbid water which rises in the water column until the density anomaly is reduced to zero. The alongshore sampling track of the tow-yo package (March 1989) and the locations of the ouffall diffusers are indicated in Figure 1 lb. The track is offset somewhat from
Figure 10. North-south sections along tow-yo track C (indicated in figure 9b) of (a) temperature in degrees Celsius, (b) beam attenuation coefficient in rn -•, and (c) chlorophyll fluorescence in volts (1 V ~1 I.tg chl-a l-•). The horizontal midpoint separation between contiguous profiles was -500-1000 rn (figures after B. H. Jones, et al., unpublished manuscript, 1991).
DISTANCE (km)
o
20
v
60
8o
ioo
12o o
CHLOROPHYLL FLUORESCENCE (./J.g U N()RTH SOUTH
_ •l I ' i 20 40 60 80 !00
DISTANCE (km)

396 ß Dickey: HIGH-RESOLUTION PHYSICAL AND BIO-OPTICAL MEASUREMENTS 29, 3 / REVIEWS OF GEOPHYSICS
a I CALIFORNIA x• 25' 118'20' -.•--•--..• ,o, /
I / OCEAN •,- -- 0 • Km 3•"L • I I 12• 114•
/30--.-
33"40 '
b TEMPERATURE (øC)
o _"ll--If-l', t t' !l !1 i1•1 - ' , 12.4 "'
•.• 30 -r' o F- n 40 •e '
5O
\ ! ' - ,o ?08 7 6 5 4 3 2 I 0
RANGE (kin)
Figure 11. Physical and bio-optical measurements taken in the vicinity of a nearshore outfall plume near Los Angeles in March 1989 (after B. H. Jones and L. Washburn, unpublished data, 1991). (a) The geograp•c region of the observations. Isobaths are in feet. The circle indicates the site of a current meter
mooring. Vertical contour Section (alongshore on approximate isobath of outfall diffusers) of (b) temperature (with tow-yo path as solid lines), (c) salinity, (d) beam attenuation coefficient, and (e) chlorophyll fluorescence. The shaded region in Figure lid indicates the regions of intense turbulent mixing where the
temperature variance dissipation rate •, exceeds 1.6 X 10 -? (Cø) 2 s -1. The chlorophyll fluorescence versus beam attenuation coefficient scatter diagram (/) indicates waters primarily associated with the ouffall (no variation of fluorescence with beam c), the upper water column phytoplankton (increase of fluorescence with beam c), and an intermediate mixing region composed of both water types. The positions of the outfall diffusers located on the ocean bottom are indicated with brackets labeled A and B.

29, 3 / REVIEWS OF GEOPHYSICS Dickey: HIGH-RESOLUTION PHYSICAL AND BIO-OPTiCAL MEASUREMENTS ß 397
C
2O
32 30
40
5O
6O
SALINITY (psu)
.650 •
8 7 6 5 4 3 2 I O
RANGE (kin)
e
20
•_ 30
40
50
60
FI_UORESCENCE (v)
6 5 4 3
RANGE (km)
d BEAM c(m -I)
o
608 7 6 5 4 3 2 I 0
2O
q- 30 I-- 13. I,!
RANGE (km)
> 10
7 8
r'r' 0
J J
o
o
a, 0
Phytoplonklon
ß
ß
ß ß
ß ß Mixing ß ß ß % ß ß Region ß • ß I
ß ß ß
I
0.7 0.9 I. I
BEAM c(m -I)
0.5
the diffusers; however, doming of isotherms and depres- sions of isohalines are evident above the diffusers (Figures l lb and 11c). The most dramatic manifestation of the plumes is in the beam attenuation coefficient observations (Figure 11d). There is intense mixing associated with the rise of the outfall waters as indicated by the temperature variance dissipation rate Z, estimated using the microcon- ductivity data. The shaded regions of Figure 1 ld represent portions of the water where Z exceeAs 1.6 x 10 -7 (Cø) 2 s -•.
The distribution of chlorophyll is indicated by the chlorophyll fluorescence contours of Figure 11e and indicates a subsurface maximum in chlorophyll at about 10-m depth with greatest values above the diffusers. The regimes of outfall waters and upper water column waters have been distinguished using a scauer diagram of chlorophyll fluorescence versus beam attenuation coeffi- cient as indicated in Figure 1 lf. The points lying near the bottom of the diagram which are nearly invariant with respect to chlorophyll fluorescence are associated with outfall waters, while the points marked by increasing
chlorophyll fluorescence with respect to beam attenuation coefficient are associated with the phytoplankton. Points lying between these domains are indicative of the mixing region. Recently, we have utilized simultaneous tow-yo (L. Washburn and B. H. Jones) and moored (MVMS to be described in section 3.4) physical and bio-optical observa- tions at this location and south of Iceland as part of the marine light in the mixed layer 0VILML; see glossary) program.
3.3 Drifters
For several years, surface drifters and drogues have been utilized by physical oceanographers for current measure- ments. The motivation for such measurements is to track
water parcels as they move with prevailing currents and to determine Lagrangian currents by evaluating horizontal displacements. Because currents vary with depth (vertical shear of horizontal currents) drogueS are sometimes designed to follow currents at a specific depth using a drag element (Figure 12a). Ideally, there is no slippage between

398 ß Dickey: HIGH-RESOLUTION PHYSICAL AND BIO-OPTICAL MEASUREMENTS 29, 3 / REVIEWS OF GEOPHYSICS
8 SURFACE PACKAGE
SYNTACTIC FO 8.5m
OPTICAL PACKAGE
DROGUE
WATER SAMPLER
THERMISTOR CHAIN
9m
the drifter or drogue and the water, so that in principle a given water parcel is followed [e.g., Niiler et al., 1988]. This is a .desirable situation for biological and optical studies which are concerned with changes occurring in a specific water mass.
The use of drifters and drogues for biological studies is relatively recent [e.g., Wilkerson and Dugdale, 1987], and the utilization of bio-optical measurements from drifters has been attempted by only a few investigators. One example is a profiling device (multi-variable profiler or MVP) which was attached to a surface drifter described by Dickey [1988] and used for measurements in the Sargasso Sea in 1985 as part of the Biowatt study [Marra et al., 1990]. In order to achieve some of the physical objectives for Biowatt I the vertical profiling current meter (cyclesonde) used for ODEX (Figure 4) was reconfigured to include an additional electromagnetic vector measuring current meter, an additional temperature sensor, a conduc- tivity sensor, a PAR sensor, and a fluorometer. The MVP was tethered to a surface buoy and operated independently of the attending ship. Data were recorded internally on magnetic tape and simultaneously transmitted via radio transmissions to the R/V Knorr for real-time data acquisi- tion. One of the desirable aspects of the MVP is that it
Figure 12. (a) Schematic of Tri-Star 11 drifter with optical package, drogue, water samp- ler, and thermistor chain used for measurements of physical and bio-optical properties in a cold filament off northern California in the summer of
1987. (b) A sea surface tem- perature AVHRR satellite im- age (white indicates cool waters) taken on June 22, 1987. The drifter track follow-
ing a cold filament is in- dicated with circles and Julian
day [after Abbott et al., 1990].

29, 3 / REVIEWS OF GEOPHYSICS Dickey: HIGH-RESOLUTION PHYSICAL AND BIO-OPTICAL MEASUREMENTS ß 399
frees ship time for concurrent biological and optical observations while providing real-time physical and bio-opfical data which may be used for guiding sampling strategies.
The Arctic environmental drifting buoy (AEDB) was designed to obtain physical and bio-optical data in remote regions of the Arctic [Honjo et al., 1990]. The buoy was equipped with thermistors, conductivity sensors, an acoustic Doppler current profiler, an electromagnetic current meter, two stimulated fluorometers, a beam transmissometer, and a time series sediment trap. The data obtained from these instruments and the position of the buoy were logged internally and transmitted via satellite using transmitters during a drift of 3900 km in 255 days.
As part of the Coastal Transition Zone (CTZ) Experi- ment, Abbott et al. [1990] deployed a Lagrangian drifter (TriStar-II; see Figure 12a) with a tethered instrument package consisting of a spectroradiometer, a stimulated fluorometer, and a beam transmissometer. In addition, an automated water sampler was located below the drogue at
17.5 m, and water was collected at 6-hour intervals for phytoplankton and nutrient analysis. Finally, a thermistor chain was placed beneath the water sampler for tempera- ture measurements at depth. The trajectory of the drifter off the coast of northern California is shown in Figure 12b which is an AVHRR satellite image of sea surface temperature (June 22, 1987). The drifter appears to have followed a cold filament directed generally offshore. The drifter record is 8 days long, and several interesting physical and bio-optical observations resulted.
The time series of temperature (Figure 13a) indicates that the water tracked by the drifter generally warmed (probably as a result of a combination of surface heating, mixing, and advection), had a modest diurnal heating cycle, and occasionally changed in temperature abruptly (seen as steps) apparently because of encounters with frontal or water interleaving regions. The time series of downwelling irradiance at 520 nm (Figure 13b) shows an expected diurnal cycle, with some modulation by clouds. Both the beam attenuation coefficient and stimulated
fluorescence time series (Figures 13c and 13d) show diel
15
z
IO
2.0
la.!
,,--,, • 1.5 + I.•Z
:::) • IoC) •_.o
•,,• J 0.5
I
I I I I
120 -
IOO
80
60
40
20
0.8
0.7
0.6
0.5 168
b o• 3.5- e -• 3.o
• I.,5 •
k, , ,• , • 0.5 ' n,' 0 ..... C 168 170 172 174 176
JULIAN DAY
I i
JULIAN DAY
Figure 13. Time series of variables obtained from the Tri-Star drifter (Figure 12) including (a) temperature (plus indicates measurements made with thermistor mounted in surface
transmitter package), (b) downwelling spectral irradiance at 520 nm in [xW cm -2 nm -1, (c) beam attenuation coefficient in m -1, (d) strobe stimulated fluorescence, and (e) upwelling spectral radiance at 683 m in [xW cm -2 m -1 sr -1 [after Abbott et al., 1990].

400 ß Dickey: HIGH-RESOLUTION PHYSICAL AND BIO-OPTICAL MEASUREMENTS 29, 3 / REVIEWS OF GEOPHYSICS
MULTI- VARIABLE MOORED SYSTEM MVMS
BIO-OPTICAL MOORED SYSTEM
BOMS
ORTHOGONAL
CURRENT
ROTORS
BEAM TRANS-
MISSOMETER
LEFT VIEW FRONT
HERMISTOR
FLUOROMETER
PRESSURE
•ING FOR
ELECTRONICS, BATTERIES
TAPE DRIVE, ETC.
CONDUCTIVITY
SENSOR
•_..•,,• PAR SENSOR
•AM BE
TRANSMISSOMETER
DISSOLVED
SENSOR
/IRRADIANCE • COLLECTOR
5 WAVELENGTHS DOWNWELLING
IRRADIANCE (E d) 410,441,488,520, 560 nm
5 WAVELENGTHS UPWELLING
RADIANCE (Lu) 410,441, 488,52.0, 683 nm
TEMPERATURE, DEPTH AND TILT
RADIANCE
COLLECTOR
Figure 14. Schematics of the multivariable moored system (MVMS) and the bio-optical moored system (BOMS) used for moored physical and bio-optical time series measurements [after Dickey et al., 1990, 1991; Smith et al., 1991].
--- 8O 7
rn 60
F- 40 Z
D
(3 2O
• 8.4 I--
• 8.2
-- ----r ....... T I I _
I'' ! T ...... I I I ' I
I
109.2 109.4 109.6 109.8 I10 1102 110.4 110.6 110.8 I I II .2
JULIAN DAY
29, 3 /REVIEWS OF GEOPHYSICS Dickey: HIGH-RESOLUTION PHYSICAL AND BIO-OPTICAL MEASUREMENTS ß 401
o I I , I , I i10 I i I I I , I , 109.2 109.4 109.6 109.8 I 110.2 110.4 110.6 110.8 III 111.2
JULIAN DAY
T 200 E
E
>_ IOO
• o o
d
109.2
,
i i i - i ' i i ' i ' i i i i
I I I I I I i I I I I 109.4 109.6 109.8 I10 110.2 110.4 110.6 110.8 I I 111.2
JULIAN DAY
z o=-- 0.60
z
•- • 55 •---0.
0.50
0.8
• 0.6
-.J• 0.4
•D 0.2
o
-e
I - I I I
f
, 109.2.. 109.4 109.6 109.8 I10 110.2 II .4. 110.6 110.8 I I 111.2
JULIAN DAY
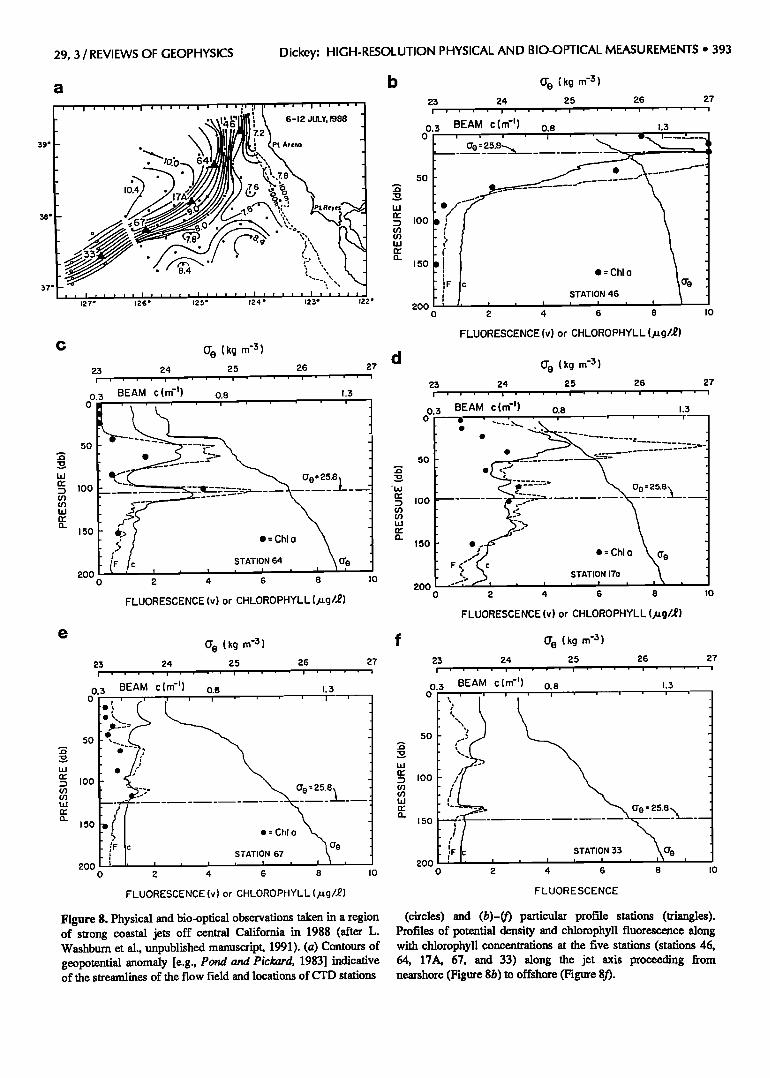
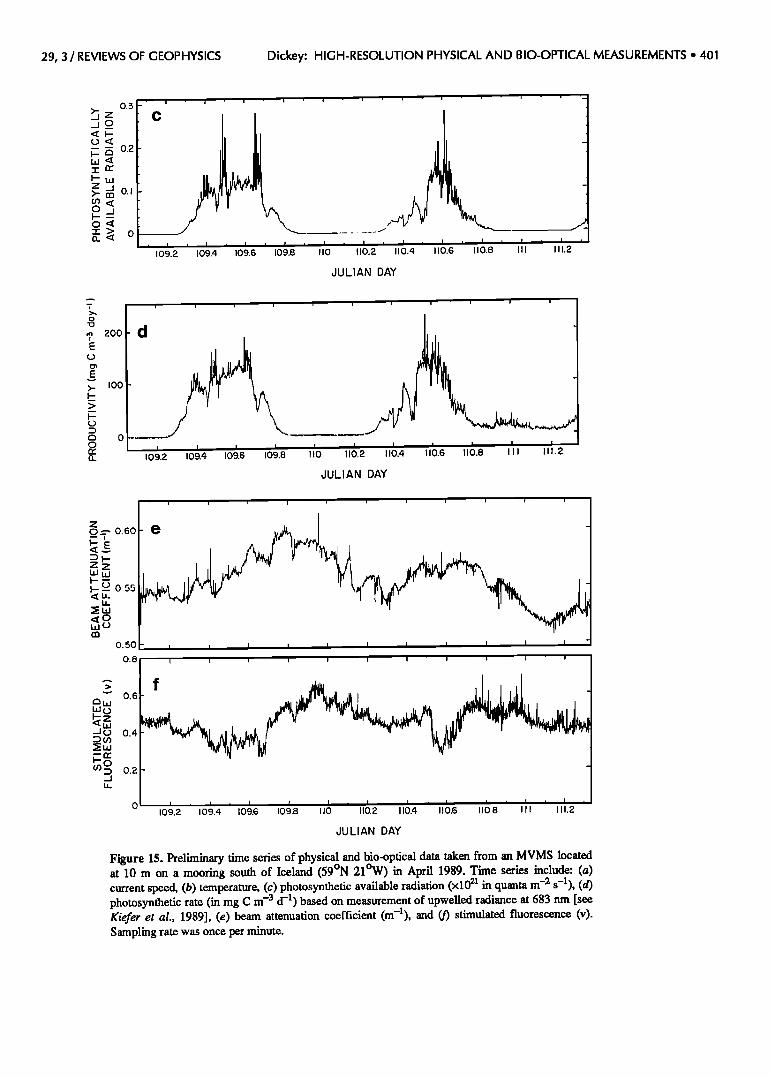
Figure 15. Preliminary time series of physical and bio-optical data taken from an MVMS located at 10 m on a mooring south of Iceland (59øN 21øW) in April 1989. Time series include: (a) current speed, (b) temperature, (c) photosynthetic available radiation (x1021 in quanta rn -2 s -1), (d) photosynthetic rate (in mg C m -3 d -1) based on measurement of upwelled radiance at 683 nm [see Kiefer et al., 1989], (e) beam attenuation coefficient (m-l), and (f) stimulated fluorescence (v). Sampling rate was once per minute.

402 ß Dickey: HIGH-RESOLUTION PHYSICAL AND BIO-OPTICAL MEASUREMENTS 29, 3 / REVIEWS OF GEOPHYSICS
rhythms and generally decrease in time. It is likely that the beam attenuation diel rhythm is related to daytime particle (phytoplankton) production and nighttime grazing by zooplankton [Siegel et al., 1989]; however, effects of variations in cell refractive index and size may be impor- tant as well [e.g., Ackleson et al., 1990]. The diel rhythm in fluorescence is probably related to these same effects but is also modified by physiological modification of the phytoplankton which may either photoadapt to optimize growth, be photoinhibited resulting in lower productivity, or have intrinsic physiological diel rhythms [e.g., Kiefer, 1973].
Another drifting device, an isopycnal (density follow- ing) float, with sensors including a fluorometer, pressure transducer, and a thermistor, was developed by Hitchcock et al. [1989] to measure subsurface water parcel motions (for example, including upwelling and downwelling velocities) and simultaneous changes in chlorophyll a fluorescence in three dimensions. Data were stored and
then transmitted via an acoustic link to a ship every 15 min. A new system which can be used for long-term studies (up to weeks) using a data link to a communication satellite is being developed by ttitchcock et al. [1989].
One of the principal attractions of drifters and drogues, which are equipped with physical and bio-optical sensors, is that broad geographical regions can be sampled. The statistical interpretation of such data are complicated by natural biases. For example, drifters may converge into limited regions because of currents related to fronts or mesoscale rings or eddies. In order for the drifter approach to be viable for general usage, satellite telemetry of data and production of sensors of moderate cost will be required.
3.4. Moored Measurements
The systems described above were primarily designed to resolve spatial scales of variability. Coarse time series interdisciplinary sampling has been done by repeated profiling using ships [e.g., Brandt et al., 1986], in combi- nation with a ship and a current meter mooring [e.g., Haury et al., 1979], and from R/P FLIP [Dickey et al., 1986a; Weller et al., 1985]. The duration of the sampling for these studies, which is limited by the availability of a ship or platform, is typically a few days to a few weeks at most. Phenomena with longer time scales (for example, synoptic, seasonal, and intemnnual variability) cannot be studied in this manner. In addition, short time scale variability (for example, high-frequency internal gravity waves and diurnal scale) is difficult to sample because of necessary time intervals between profiles. To increase the time domain of bio-optical sampling, moored instrumenta- tion systems have been developed. The selection of appropriate sensors and inherent constraints such as power consumption, data storage, and biofouling are of special concern for this method of deployment.
The potential of obtaining moored bio-optical data has only begun to be realized. Time series observations of light
transmission within the bottom boundary layer have been made from moorings [e.g., Pak and Zaneveld, 1983; Gardner, 1989]. Also, moored observations of chlorophyll a fluorescence have been made in coastal waters [e.g., Falkowski et al., 1988], and a developmental subsurface spectroradiometer-based monitoring system was deployed at Scripps Canyon, California [Booth et al., 1987]. These mooring programs were conducted primarily in nearshore coastal environments and with a limited number of
instrument packages for determination of vertical structure. The importance of longer (seasonal and interannual) time series open ocean data for biological productivity studies was recognized by Menzel and Ryther [1960, 1961], who conducted biweekly experiments at Hydrostation S near Bermuda for approximately 3 years. Many modeling studies have been based on these relatively low resolution and aliased data.
Three separate types of in situ instrument packages were developed for moorings, which were located in open ocean waters of the eastern Noah Atlantic Ocean (34øN 70øW) in 1987 (Biowatt II) and south of Iceland (59øN 21øW) in 1989 (marine light in the mixed layer, MLML). The multivariable moored system (MVMS) [Dickey et al., 1990, 1991] utilizes a vector measuring current meter (VMCM) for data acquisition and system control as well as horizontal current and temperature sensors (Figure 14). The availability of auxiliary channels enabled the interfac- ing of other sensors to the system. In addition to the current and temperature sensors, the MVMS system includes a stimulated fluorometer (also a natural fluorometer for MLML), a PAR sensor, a beam transmis- someter, a dissolved oxygen sensor, and a conductivity sensor. The bio-optical moored system (BOMS), [Smith et al., 1991] consists of a microprocessor and a data acquisi- tion system with spectral downwelling irradiance sensors (410, 441, 488, 520, and 560 nm), spectral upwelling radiance sensors for the same wavelengths along with 683 nm for passive (natural) chlorophyll a fluorescence, a thermistor, a pressure sensor, and sensors for two axes of orientation (Figure 14). The final in situ package is the bioluminescence moored system (BLMS) [Swift et al., 1988]. This package also utilizes a microprocessor and data acquisition system. Two photomultiplier tubes are used to sample unstimulated bioluminescent light during nighttime. Stimulated bioluminescence for the determina- tion of bioluminescent potential is measured with a silicon photodiode after the organisms are pumped through an impeller into a viewing chamber. These measurements were also done during the nighttime at two depths.
Preliminary time series obtained from an MVMS located at 10-m depth south of Iceland (April 19-21, 1989) as part of the MLML I experiment are shown in Figure 15. These data were collected each minute and illustrate
high-frequency variability in physical and bio-optical parameters. Advection associated with mesoscale current features and semidiurnal tides are observed. Diurnal
signals are seen in PAR, primary production based on

29, 3 / REVIEWS OF GEOPHYSICS Dickey: HIGH-RESOLUTION PHYSICAL AND BIO-OPTICAL MEASUREMENTS ß 403
upwelled radiance at 683 nm [Kiefer et al., 1989; Cham- berlin, 1990], beam attenuation coefficient, and stimulated fluorescence. The phases of these signals suggest that photoinhibition of the phytoplankton may be occurring (indicated by depressed fluorescence during midday) as was conjectured for the drifter data of Abbott et al. [1990] earlier. Short time scale fluctuations associated with clouds
are also apparent in PAR and natural fluorescence. MVMS data were also collected at seven other depths within the upper 250 m during the 70-day springtime measurement period. A similar experiment (MLML II) began at the Iceland site in the spring of 1991 and includes moored BOMS, bioluminescence, an acoustic doppler current profiler (ADCP), and temperature measurements along with tow-yo and ship station observations.
During the Biowatt II experiment, MVMS, BOMS, and BLMS systems recorded data in the upper 160 m of the Sargasso Sea (34øN 70øW) for a 9-month period begin- ning in April 1987 [Dickey et al., 1990, 1991; Smith et al., 1991]. Sensors were sampled every 4 min during three 3-month deployment periods. In addition, a full suite of meteorological measurements were made [see Dickey et
al., 1990, 1991]. Time series (2 hour filtered) of tempera- ture obtained from MVMS units for a 70-day period in the springtime are shown in Figure 16a. The most dramatic phenomenon is the onset of seasonal stratification occurring on Julian day 86 (note we define the beginning of a Julian day as midnight opposed to noon). Mesoscale advective features a•e superimposed on this temperature evolution. The abrupt shoaling of the mixed layer depth coincident with the stratification is apparent in Figure 16b. In addition, the depth of the 1% light level shoals at nearly the same time as the mixed layer in apparent accord with increasing biomass in the upper layer. Time series of currents (daily mean), PAR, beam attenuation coefficient, and chlorophyll fluorescence obtained from the 20 m MVMS are shown in Figure 16c. The effects of clouds are manifest in PAR and significant diurnal rhythms in beam attenuation coefficient and chlorophyll fluorescence are apparent. In addition, episodic plankton blooms and cessations are evident, particularly after the onset of stratification and the shoaling of the mixed layer. Sub- sampled data indicated by circles and connecting straight lines are shown to illustrate the time series data which
a 24
• zo
18
JULIAN DAY 1987
Figure 16. (a) Time series of temperature for seven depths in the upper 160 m during the spring of 1987 obtained from MVMS units located in the Sargasso Sea (34øN 70øW) during Biowatt. (b) Time series of the mixed layer depth and the depth of the 1% light (PAR) level. The mixed layer depth is defined here as the depth at which the temperature is 0.1 øC cooler than the near-surface temperature. At times the mixed layer depth and the 1% light level exceeded 160 m, the greatest depth of our observations. (c) Time series (daily average for currents and 2 hour filtered for other variables) at 23-m depth of daily averaged vector currents (in cm s-l), PAR (in units of x102• quanta m -2 s-l), beam attenuation coefficient (in m-l), and chlorophyll fluorescence (in lxg Chl-a l -1). The lower panel is a time series of the spectral diffuse attenuation coefficient (at 441 nm in units of m -1) based on BOMS data collected at 32 and 52 m. MVMS data are from Dickey et al. [1990, 1991], and BOMS data are from Smith et al. [1991].

404 ß Dickey: HIGH-RESOLUTION PHYSICAL AND BIO-OPTICAL MEASUREMENTS 29, 3 / REVIEWS OF GEOPHYSICS
b
2 [ , i , , , i I
50
I00
150
. Mixed 10yer depth
--- I% Light level
60 70 80 90 I00 I10 120 Mar. I April I May I
JULIAN DAY 1987
130
c
I-IO0 "' 0 -//' ,xx-• ,.'-- ••• \ ,'•/I I • -IO0
0.18
•0 12 • ß
• 0.06 0
g o.65
• o
u 1.2 z • 0.9
• ß
0
• '0
52- 52 meter
0.08
0.04 I
6O 70 8O 90 I00
dULIAN DAY 1987'
I10 120 130
29, 3 / REVIEWS OF GEOPHYSICS Dickey: HIGH-RESOLUTION PHYSICAL AND BIO-OPTICAL MEASUREMENTS ß 405
would have resulted from biweekly ship observations (for example, such as those by Menzel and Ryther [1960, 1961]). It is evident that determinations of biomass, primary production, and carbon export would be in considerable error (significantly underestimated for most of the period) if the subsampled (aliased) data were used opposed to the high-frequency data. Spectral diffuse attenuation coefficient data (at 441 nm) derived from the BOMS data set (using downwelling irradiance measure- ments at 32 and 52 m) [Smith et al., 1991] are shown in Figure 16c. There is apparent correlation of this parameter with stimulated fluorescence as expected because of the absorption properties of chlorophyll and phaeopigments at 441 nm [e.g., Siegel and Dickey, 1987b]. Quantification of the correlation has not been completed at this point.
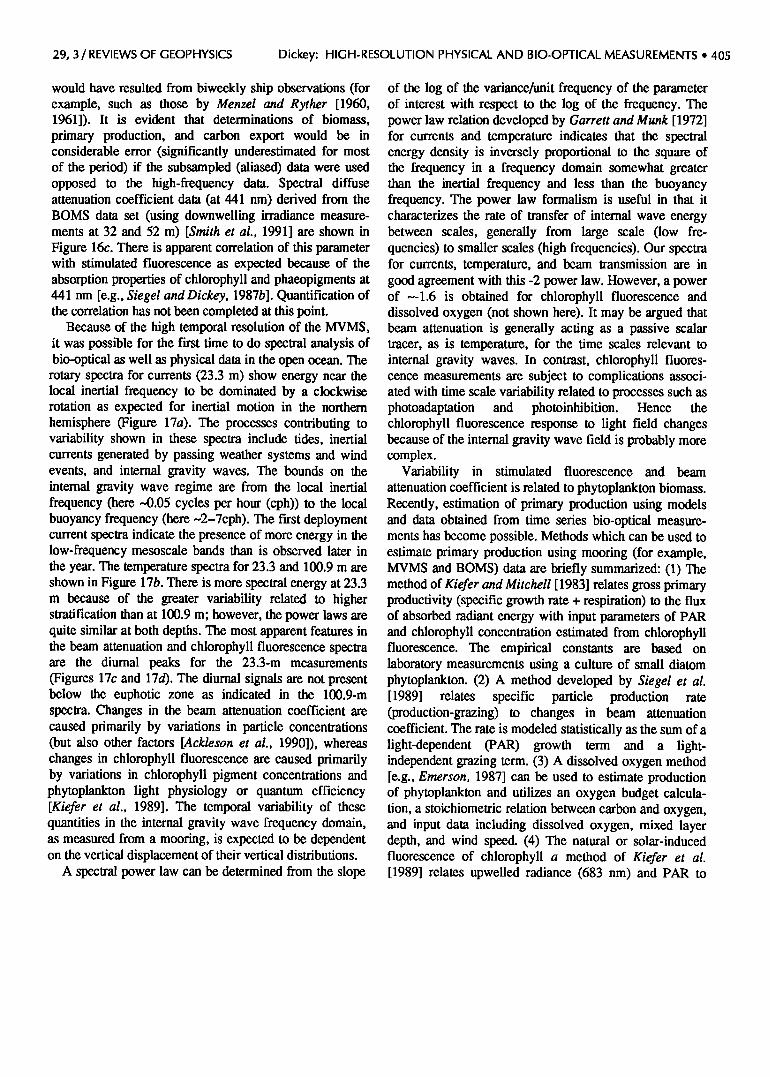
Because of the high temporal resolution of the MVMS, it was possible for the first time to do spectral analysis of bio-optical as well as physical data in the open ocean. The rotary spectra for currents (23.3 m) show energy near the local inertial frequency to be dominated by a clockwise rotation as expected for inertial motion in the northern hemisphere (Figure 17a). The processes contributing to variability shown in these spectra include fides, inertial currents generated by passing weather systems and wind events, and internal gravity waves. The bounds on the internal gravity wave regime are from the local inertial frequency (here 4).05 cycles per hour (cph)) to the local buoyancy frequency (here ~2-7cph). The first deployment current spectra indicate the presence of more energy in the low-frequency mesoscale bands than is observed later in the year. The temperature spectra for 23.3 and 100.9 m are shown in Figure 17b. There is more spectral energy at 23.3 m because of the greater variability related to higher stratification than at 100.9 m; however, the power laws are quite similar at both depths. The most apparent features in the beam attenuation and chlorophyll fluorescence spectra are the diurnal peaks for the 23.3-m measurements (Figures 17c and 17d). The diurnal signals are not present below the euphotic zone as indicated in the 100.9-m spectra. Changes in the beam attenuation coefficient are caused primarily by variations in particle concentrations (but also other factors [Ackleson et al., 1990]), whereas changes in chlorophyll fluorescence are caused primarily by variations in chlorophyll pigment concentrations and phytoplankton light physiology or quantum efficiency [Kiefer et al., 1989]. The temporal variability of these quantities in the internal gravity wave frequency domain, as measured from a mooring, is expected to be dependent on the vertical displacement of their vertical distributions.
A spectral power law can be determined from the slope
of the log of the variance/unit frequency of the parameter of interest with respect to the log of the frequency. The power law relation developed by Garrett and Munk [1972] for currents and temperature indicates that the spectral energy density is inversely proportional to the square of the frequency in a frequency domain somewhat greater than the inertial frequency and less than the buoyancy frequency. The power law formalism is useful in that it characterizes the rate of transfer of internal wave energy between scales, generally from large scale (low fre- quencies) to smaller scales (high frequencies). Our spectra for currents, temperature, and beam transmission are in good agreement with this -2 power law. However, a power of--1.6 is obtained for chlorophyll fluorescence and dissolved oxygen (not shown here). It may be argued that beam attenuation is generally acting as a passive scalar tracer, as is temperature, for the time scales relevant to internal gravity waves. In contrast, chlorophyll fluores- cence measurements are subject to complications associ- ated with time scale variability related to processes such as photoadaptation and photoinhibition. Hence the chlorophyll fluorescence response to light field changes because of the internal gravity wave field is probably more complex.
Variability in stimulated fluorescence and beam attenuation coefficient is related to phytoplankton biomass. Recently, estimation of primary production using models and data obtained from time series bio-optical measure- ments has become possible. Methods which can be used to estimate primary production using mooring (for example, MVMS and BOMS) data are briefly summarized: (1) The method of Kiefer and Mitchell [1983] relates gross primary productivity (specific growth rate + respiration) to the flux of absorbed radiant energy with input parameters of PAR and chlorophyll concentration estimated from chlorophyll fluorescence. The empirical constants are based on laboratory measurements using a culture of small diatom phytoplankton. (2) A method developed by Siegel et al. [1989] relates specific particle production rate (production-grazing) to changes in beam attenuation coefficient. The rate is modeled statistically as the sum of a light-dependent (PAR) growth term and a light- independent grazing term. (3) A dissolved oxygen method [e.g., Emerson, 1987] can be used to estimate production of phytoplankton and utilizes an oxygen budget calcula- tion, a stoichiometric relation between carbon and oxygen, and input data including dissolved oxygen, mixed layer depth, and wind speed. (4) The natural or solar-induced fluorescence of chlorophyll a method of Kiefer et al. [1989] relates upwelled radiance (683 nm) and PAR to
406 ß Dickey: HIGH-RESOLUTION PHYSICAL AND BIO-OPTICAL MEASUREMENTS 29, 3 / REVIEWS OF GEOPHYSICS
a io4
IOOO
IOO
u IO
o.I.
C o.I
O. Ol o.I I
cph
: -.....•, , BEAM ATTENUATION • •, ,•, COEFFICIENT
: •,,, • I01 m /'•
ß D I SD
_
95% Level
, , , , ,,,I , , ...... I , , , , , ,,I ,
0.01
10-3
10'4
E --.. 10-5
10-6
i0-7
10-8 0.01 O. I I cph
Figure 17. Spectra obtained for the MVMS deployment in the Sargasso Sea during Biowatt in the spring of 1987 [Dickey et al., 1990, 1991]. (a) Rotary spectra of currents at 23 m. Spectra of (b) temperature at 23 and 101 m, (c) beam attenuation coefficient at 23 and 101 m, and (d) chlorophyll fluorescence at 23 and 101 m. CW and CCW indicate clockwise and coumerclockwise
b I
o o.01
10 -:5
10 -4
10'
i TEMPERATURE
''',,, D SD 23m --- loire -- _
',,
]r -
• "I'll 11 -
t 95% ve• I ....... ! , , , • ,, ,I ..... I ! ....
0.01 0.1 I
cph
d I00 .,
CHLOROPHYLL FLUORESCENCE
D I SD 23m ---
- loire
• i I !
i i I I•'• I .
II
- 'l
-
: :
95• L vel .
i i I i i i II i i ..... I i , i ..... I ......
IO
I
0.01
10-3
10-4
0.01 0.1 I
cph
components of the rotary spectra and D, SD, and I indicate diurnal, semidiurnal, and inertial frequencies, respectively. The local inertial period is 21.5 hours. Confidence limits (at 95% level) are also represented. The-2 slope represents the power law for internal gravity wave spectra [Garrett and Munk, 1972].

29, 3 / REVIEWS OF GEOPHYSICS Dickey: HIGH-RESOLUTION PHYSICAL AND BIO-OPTICAL MEASUREMENTS ß 407
both concentration of chlorophyll a and the gross rate of photosynthesis of a phytoplankton crop. It should be noted that the first and fourth methods describe only photosyn- thetic production, whereas the second and third include loss due to respiration and grazing. The time series of production based on the first three of these methods for a portion of the Biowatt data set is shown in Figure 18. Each of these time series is representative of different processes related to differing aspects of primary production. An example of production based on the fourth method is given in Figure 15d. The important time integrative production (for example, for net growth, net respiration, etc.) remains to be completed, but it is strongly suggested that short- lived episodic bloom events must be sampled for proper determinations of upper ocean carbon flux.
The estimation of carbon export from the euphotic layer using bio-optically determined total production presently requires values of the f ratio. The f ratio is defined as the ratio of "new" production to total production [e.g., Eppley and Peterson, 1979]. Much of the organic matter produced
,/., ....... j ....... j
production [Dugdale and Goering, 1967] can be defined as growth on exogenous nutrients. The f ratio can also be
i I t i I i I i i I I i i , i i i ! , i , ! ! , i 1•
3OO
u -300
200
0
60 65 70 75 80 85
-I00
JULIAN DAY 1987
Figure 18. Time series of primary productivity using MVMS measurements at 23 m in the Sargasso Sea during the spring of 1987: (a) gross photosynthesis following formulation by Kiefer and Mitchell [1983], (b) net production (photosynthesis respiration) using dissolved oxygen and physical data [following Emerson, 1987], and (c) particle production (production- grazing) using beam attenuation coefficient data [following Siegel et al., 1989]. Computations provided by Michael Hamilton.
defined as the probability that a nitrogen atom is assimi- lated by phytoplankton through new production or operationally as the ratio of nitrate uptake to the sum of nitrate, ammonium, and organic nitrogen uptakes. Under steady state conditions it has been suggested that the amount of "new" production is proportional to the flux of particulate organic carbon (POC) out of the euphotic zone [e.g., Eppley and Peterson, 1979]. Thus the f ratio may b• defined as
f= POC flux/primary production
Then, if thef ratio is known (for example, from •SN uptake or other appropriate measurements) for a region, then determinations of POC flux can be estimated using primary production measurements such as the ones described above. It should be noted that the f ratio varies regionally and in time to extents not well known at present. It is known that the f ratio is dependent in part on the availability of new nitrogen NO 3 in the euphotic zone and that relatively small time and space scale processes can be important. The steady state assumption for the f ratio and the applicability of a specific value to broad regions need be evaluated. Nonetheless, time-varying carbon export can in principle be estimated using high temporal resolution bio-optical measurements from moorings as described earlier.
It is apparent that physical and bio-optical processes are often highly coupled, but not necessarily linearly nor simply. Part of the complexity in the interpretation of time series data originates with the partitioning of local versus advective effects. Determinations of time scales of relevant
processes and their phases are crucial. It is absolutely critical to obtain physical data concurrently with bio- optical data in order to interpret (for example, partition local versus advective changes, establish physical time scales, etc.) and model the pertinent processes.
The results presented by Smith et al. [ 1991] and Dickey et al. [1990, 1991] provide new and unique information concerning the springtime evolution of bio-optical and physical properties of the upper ocean in the Sargasso Sea. The high temporal resolution observations obtained using the MVMS and the BOMS will enable much higher levels of analysis and model testing than were possible for our predecessors. These results indicate that undersampling and aliasing should be of considerable concern to research- ers who desire to understand the dynamical changes of bio-optical properties, primary productivity, and carbon fluxes of the upper ocean on several time scales ranging from days to seasons to decades. Fortunately, technical advances have made it possible to sample several of the key variables virtually continuously and for several months per deployment. The use of real-time telemetry of moored and drifter data (for example, via communication satellite) will further enhance the utility of measurements from these platforms. It will be important to compare estimates of primary production and the flux of carbon from the upper

408 ß Dickey: HIGH-RESOLUTION PHYSICAL AND BIO-OPTICAL MEASUREMENTS 29, 3 / REVIEWS OF GEOPHYSICS
ocean made by various commonly used methods involving satellite ocean color, sediment traps, the •4C incubation technique, and the bio-optical methods described here [e.g., Jahnke, 1990].
4. DISCUSSION
4.1. Future Development of In Situ Instrumentation Systems
Technological advances during the past decade have enabled the rapid expansion of the sampling domain of many of the important bio-optical and physical variables. In particular, new optical and acoustical sensors, along with microprocessors, have enabled biological and optical oceanographers to begin to study phenomena on scales comparable to those studied by physical oceanographers. The integration of these sensors into profiling systems (CTD's), tow-yo systems, drifters, and moored systems has made it possible to investigate bio-optical and physical interactions through co-located and concurrent observa- tions. Many of the future advances will depend on continued progress in the development of fundamental instrumentation and in situ sampling systems which utilize this instrumentation. In the following discussion, some of the more promising directions in sensor technology and systems will be explored.
The further advancement of bio-optical instrumentation will require a variety of sensors which measure a more comprehensive set of optical variables so that inherent (those independent of a natural light source) and apparent (those dependent on a natural light source) optical properties may be related. Devices which are needed to better characterize the inherent optical properties are spectral absorption and scattering meters [e.g., Carder et al., 1988]. It is also likely that special instruments can be used to measure concentrations of specific types of organisms (for example, cyanobacteria) as well [Iturriaga et al., 1990]. In addition to measurement systems for inherent optical properties, inverse methods have been proposed by Preisendorfer and Mobley [1984] to calculate inherent optical properties from irradiance data.
The use of fiber optics to bring light signals from depth to the surface for shipboard (or surface buoy) signal processing and data analysis appears to be a viable option for several physical and bio-optical applications. Cowles et al. [1990] have developed a laser/fiber optic fluorometer which is used in parallel with a physical microstructure profiling instrument which can provide vertical resolution of fluorescence on the centimeter scale. Another possibility is the development of an "expendable bathyoptical (XBK)" probe (K indicates a parameter such as the spectral diffuse attenuation coefficient K a, or scattering (J. R. V. Zaneveld, personal communication, 1990)) which could be dropped from research ships or ships of opportunity in the same manner that expendable bathythermographs (XBT's) are presently used for temperature profile data collection.
Expendable probes such as these enable broad geographic coverage and are especially useful for intensive regional studies. Remotely operated vehicles (ROV's) or other specially designed free-fall instruments [e.g., Waters et al., 1990] can be used effectively for optical measurements and can minimize effects of ship shadow and ship motion.
In terms of the smallest scales of bio-optical relevance, information concerning the optical characteristics of individual particles are also needed to relate inherent with apparent optical properties and to improve our interpreta- tion of bulk property measurements. The interpretation of beam attenuation signals has been the subject of several studies [e.g., Spinrad, 1986; Ackleson et al., 1990]. The utilization of the fluorescence spectral signatures for identifying particular phytoplankton has been examined [e.g., Yentsch and Phinney, 1985], and high-precision liquid chromatography has been used similarly [e.g., Bidigare et al., 1989]. One important technique is flow cytometry [e.g., Spinrad, 1984; Perry and Porter, 1989; Sosik et al., 1989; Yentsch, 1990]. Using this methodology, several optical properties of particles ranging in size from -1 to 150 gm may be measured quite rapidly (several thousand particles per second) [Spinrad, 1984]). Some of the properties include: particle index of refraction, forward scattering for particle sizing, and spectral fluorescence for determination of physiological states. Recently, the optical properties of single cells have been studied using microphotometry techniques with a computer-controlled microscope [Iturriaga and Siegel, 1989]. The microbial (for example, bacteria) loop [e.g., Goldman, 1984] is probably extremely important for not only the marine ecosystem, but also the optical properties of the open ocean [e.g., Stramski and Kiefer, 1990]. Finally, Spinrad et al. [1989] used phytoplankton cultures with equivalent cell diameters of a few micrometers and showed that the beam attenuation coefficient measurement can be used as a
sensitive indicator of changes in the microbial community. This type of work is important for the coupling of proc- esses between scales.
The development of fast response chemical sensors for deployment from CTD and moored types of packages has begun with dissolved oxygen sensors; however, comparable sensors for pH, total carbon dioxide, and other specific ions (for example, nutrients) need to be developed. In principle, continuous in situ nutrient autoanalyzers can be developed as well [e.g., Dickey, 1988]. One interesting development effort involves the measurement of vertical water velocity with the physical measurement instrument (PMI) and the determination of photosynthesis with the self-contained photosynthesis apparatus (SUPA) which measures ir- radiance, pH, and dissolved oxygen [Kirkpatrick et al., 1990]. Acoustical systems are useful for current measure- ments and for determining distributions of organisms (for example, zooplankton) larger in scale than phytoplankton [e.g., Haury and Pieper, 1987; Pieper et al., 1990] and can be used to provide important complementary spatial and time series data sets for ecological studies.
29, 3 / REVIEWS OF GEOPHYSICS Dickey: HIGH-RESOLUTION PHYSICAL AND BIO-OPTICAL MEASUREMENTS ß 409
4.2. Complementary Remote Observations The two primary methods which will be available to
ocean scientists for studying the upper ocean's ecosystem within the foreseeable future are in situ sampling using sensors placed in the ocean and remote sensing from satellites and aircraft. These are complementary with satellites and aircraft providing near-surface data over great expanses of the oceans and in situ systems providing subsurface and high temporal and spatial resolution information for long periods of time.
Global climatological information concerning upper ocean transparency has been obtained since the early 1900s using shipboard observations made with Secchi discs [e.g., Lewis et al., 1988]. More recenfiy, ocean color data were collected from the coastal zone color scanner (CZCS), which orbited on the Nimbus 7 satellite, from late 1978 through mid-1986. These data have been used to estimate phytoplankton biomass over particular regions and recently the world oceans [Feldman et al., 1989]. Excellent examples of the utilization of these data are presented by McClain et al. [1990], who have examined the coupling of physical and biological processes in the North Atlantic Ocean in both open ocean and shelf regions, and by Lewis et al. [1990], who have focused on the equatorial Pacific. The use of satellite altimetry to determine basin scale surface general circulation is planned for the near future. Similar data obtained from the oceanographic satellites Seasat and Geosat have been used to observe features such
as the Gulf Stream and its tings. Satellite-derived currents can provide important contextual information which greatly enhances our ability to ascertain advective versus local processes measured with in situ physical and bio-opfical instrumentation.
Moored observations, in conjunction with shipboard and drifter measurements and remotely sensed data, can provide the basis for process-oriented, survey, and longer time series studies. Simultaneous in situ and remote
measurements will be essential to statistically determine and understand the correlations between the various
observations. A blend of in situ and remote measurements
of key physical and bio-optical variables will be needed to provide data required for studying and modeling global climate change.
Moored observations can be used to "ground truth" as well as complement remote sensing observations of ocean color, temperature, and other properties. For example, moored bio-optical and physical measurements can be used to (1) provide near-surface and subsurface (for example, depths greater than an optical attenuation depth) data for the development of algorithms for satellite sensing of ocean color and the inference of pigment biomass and primary productivity, (2) complement satellite data sets which are lower in sampling frequency, subject to sampling biases (for example, cloud conditions), and limited to near-surface integrated measurements (thus undersampling chlorophyll maxima regions), (3) provide data between satellite missions, and (4) facilitate the
development of coupled physical and bio-optical models (also see Smith et al., [1991]). Ultimately, the long-term monitoring and model prediction of changes in biosoptical properties and particulate carbon fluxes will benefit from the synthesis of data derived from a suite of comple- mentary observational platforms. A schematic diagram (Figure 19) illustrates how the spectral diffuse attenuation coefficient can in principle be determined as a function of space and time using complementary mooring, shipboard, and satellite sensing. An important aspect for such an operational program is the communication of in situ and remotely sensed data via communications satellites and possibly ocean floor telephone cables (for example, for moored instrumentation).
4.3. The Roles of Theory and Models The development of concurrent physical and bio-optical
observing systems has been based not only on technologi- cal advances, but also on fundamental theoretical, model- ing, and laboratory studies. Signals derived from optical instruments are often quite difficult to interpret because of the complex nature of radiative transfer and the utilization of light by phytoplankton. For example, biomass estimates using satellite-derived color imagery are presently based on total pigments, thus the partitioning of living versus nonliving and pigmented versus nonpigmented biomass must be established. The fundamental principles concern- ing the spectral absorption, scattering, and propagation of light can provide the basis for both laboratory and field measurements (for example, a photon budget in the ocean) [Smith et al., 1989]).
One important recent development concerns the utilization of natural (or solar induced) fluorescence for estimating biomass and primary production. Morel and Prieur [1977] reported the occurrence of natural fluores- cence from phytoplankton using in situ measurements of upwelling spectral reflectance, and Neville and Gower [1977] made similar observations above the sea surface. Several investigators have examined various aspects of the process, and it appears that natural fluorescence along with PAR can be utilized in an empirical formulation to estimate both phytoplankton biomass and primary production [e.g., Kiefer et al., 1989; Chainberlin et al., 1990].
Interdisciplinary models can be used for a variety of purposes including data assimilation to extrapolate bio-optical information, for diagnostics to examine particular processes, and for prognostication [e.g., Wroblewski and Hofmann, 1989; Dickey, 1990]. Several bio-optical production models have been developed within the past few years [e.g., Bidigare et al., 1987]. Some of these models are based on phytoplankton cell physiology and the ability of photosynthetic pigments to harvest light. Much of the modeling work has been stimulated by the desire to estimate primary production from satellite color images [e.g., Sathyendranath et al., 1989] and new production from temperature and color data [e.g., Dugdale

410 ß Dickey: HIGH-RESOLUTION PHYSICAL AND BIO-OPTICAL MEASUREMENTS 29, 3 / REVIEWS OF GEOPHYSICS
DETERMINING K (X, x,y,z,t)
tellile Color Scanner
Functions(x,y,t) Me•,s Products
Lu(3,) K(490) K(A.) Pig. conc. Prim. Prod.
Communications Satellite
•- J Model J
Moored Physical- XBK's ? • I Profiling Physical- •;• Bio-Optical Instruments
• K(A., x,y,z,t ) •
Bio-Optical Instruments
Functions(z,t) Meas. Products
Mets. K(490)
Sfc. E d (•) K Temp. Pig. Conc. Cond. Part. Conc. Currents Prim. Prod.
Beam c Salinity Fluor. MLD
Lu OL) Heat Flux E d (A.) Wind Stress PAR Tm Diss. 0;, Shear Nutrients (?) Strat. Optics(?)
Functions(z) Meas Products
Temp. K (490) Cond. K(•) Beam c Pig. Conc. Fluor. Part. Conc.
Ed (A.) MLD Lu (A.) Prim. Prod. PAR Strat.
Diss. 0 z Pigments (bottles) Nutrients
(bottles) XBK's (7)
Figure 19. A schematic illustrating a methodology for determining the variability of the spectral diffuse attenuation coefficient of light in space and time on a global basis using satellite as well as in situ data sets along with appropriate models. Applications could include determinations of primary productivity, particulate carbon flux, and the penetrative component of solar radiation (see Figure 3).
et al., 1989]. Data obtained from many of the in situ systems described above can be used as input for these models. In particular, such models may be used for the estimation of primary production from bio-optical mooring and profile data sets. The utilization of data sets derived from satellites, moorings, and ships for models of a bio-optical variable such as the spectral diffuse attenuation coefficient or primary production is illustrated in Figure 19. As higher-resolution spectral data sets are obtained, it may be possible to partition phytoplankton by species or groups.
Finally, it is important to note that models of the upper ocean ecological system [e.g., Kiefer and Kremer, 1981; Altabet, 1989; Fasham et al., 1990] and global carbon fluxes [e.g., Sarmiento et al., 1988] are advancing because of improved physical, optical, and biological models of the oceans. Future developments will likely include the incorporation of nonlinear dynamics in bio-optical models. One of the major challenges for both the atmospheric and
ocean sciences is to merge and integrate in situ and remotely sensed interdisciplinary data sets which have differing spatial and temporal resolution and encompass differing scale ranges (as illustrated in Figures 1, 2, 3, and 19). Interdisciplinary data assimilation models, which require subgrid scale parameterizations based on higher- resolution data, will need to utilize these data sets for
applications such as predicting trends in the global climate.
ACKNOWLEDGMENTS. Special thanks are extended to Butt Jones, Libe Washburn, Ray Smith, Michelle Rienecker, Mark Abbott, and their colleagues who contributed recent results and figures. Useful comments and suggestions for this review were provided by Mary-Elena Cart, Curt Davis, Tim Granata, Michael Hamilton, David Hurd, Rick Jahnke, Burt Jones, Pat Kremer, Marlon Lewis, Tony Michaels, Mary Jane Perry, Rick Pieper, Rick Spintad, Margaret Stramska, Dariusz Stramski, Libe Washburn, Jerry Wiggert, Ron Zaneveld, and five anonymous reviewers. This work is the result of several years of support by

29, 3 / REVIEWS OF GEOPHYSICS Dickey: HIGH-RESOLUTION PHYSICAL AND BIO-OPTICAL MEASUREMENTS ß 411
the Office of Naval Research (ONR) and current ONR contract N00014-87-K0084.
Ann Henderson-Sellers was the editor in charge of this paper. She thanks E. Buchwald, S. Walker, S. Godfrey, I. Kuhnel and J. Sojka for their careful reviews.
REFERENCES
Abbott, M. R., K. H. Brinlc, C. R. Booth, D. Blasco, L. A. Codispoti, P. P. Niiler, and S. R. Ramp, Observations of phytoplankton and nutrients from a Lagrangian drifter off northern California, J. Geophys. Res., 95, 9393-9409, 1990.
Ackleson, S., W. M. Balch, and P.M. Holligan, White waters of the Gulf of Maine, Oceanography, 1, 18-22, 1988.
Ackleson, S. G., J. J. Cullen, J. Brown, and M.P. Lesser, Some changes in the optical properties of marine phytoplankton in response to high light intensity, Proc. SPIE-Int. Soc. Opt. Eng., 1302, 238-249, 1990.
Aiken, J., and I. Bellan, Synoptic optical oceanography with the undulating oceanographic recorder, Proc. SPIE-Int. Soc. Opt. Eng., 637, 221-230, 1986.
Altabet, M. A., Particulate new nitrogen fluxes in the Sargasso Sea, J. Geophys. Res., 94, 12,771-12,779, 1989.
Bidigare, R. R., R. C. Smith, K. S. Baker, and J. Marta, Ocean primary production estimates from measurements of spectral irradiance and pigment concentrations, Global Biogeochern. Cycles, 1, 171-186, 1987.
Bidigare, R. R., J. H. Morrow, and D. A. Kiefer, Derivative analysis of spectral absorption by photosynthetic pigments in the western Sargasso Sea, J. Mar. Res., 47, 323-341, 1989.
Booth, C. R., B. G. Mitchell, and O. Holm-Hansen, Development of moored oceanographic spectroradiometer, Biospherical Tech. Ref. 87-1, B iospherical Instrum. Inc., 69 pp., San Diego, Califi, 1987.
Brandt, A., C. C. Sarabun, H. H. Seliger, and M. A. Tyler, The effects of the broad spectrum of physical activity on the biological processes in the Chesapeake Bay, in Marine Interfaces Ecohydrodynamics, edited by J. C. J. Nihoul, pp. 361-384, Elsevier, New York, 1986.
Brewer, P. G., K. W. Bruland, R. W. Eppley, and J. J. McCarthy, The Global Ocean Flux Study (GOFS): Status of the U.S. GOFS Program, Eos Trans. AGU, 67, 827-832, 835-837, 1986.
Carder, K. L., R. G. Steward, and T. G. Peacock, Spectral transmissometer and radiometer: Design and initial results, Proc. SPIE-Int. Soc. Opt. Eng., 925, 189-195, 1988.
Chamberlin, W. S., C. R. Booth, D. A. Kiefer, J. H. Morrow, and R. C. Murphy, Evidence for a simple relationship between natural fluorescence, photosynthesis, and chlorophyll in the sea, Deep Sea Res., 37, 951-973, 1990.
Cowles, T. J., R. A. Desiderio, J. N. Mourn, M. L. Myrick, and S. M. Angel, Fluorescence microstincture using a laser/fiber optic profiler, Proc. SPIE-Int. Soc. Opt. Eng., 1302, 336-345, 1990.
Denman, K. L., and M. R. Abbott, Time evolution of surface chlorophyll patterns from cross-spectrum analysis of satellite color images, J. Geophys. Res., 93, 6789-6798, 1988.
Denman, K. L., and A. E. Gargett, Time and space scales of vertical mixing and advection of phytoplankton in the upper ocean, Limnol. Oceanogr., 28, 801-815, 1983.
Denman, K. L., and T. M. Powell, Effects of physical processes on planktonic ecosystems in the coastal ocean, Ocean Mar. Biol. Ann. Rev., 22, 125-168, 1984.
Dickey, T., Recent advances and future directions in multi- disciplinary in situ oceanographic measurement systems, in Toward a Theory on Biological-Physical Interactions in the Worm Ocean, edited by B. J. Rothschild, pp. 555-598, Kluwer Academic, Dordrecht, Netherlands, 1988.
Dickey, T. D., Physical-optical-biological scales relevant to recruitment in large marine ecosystems, in Large Marine Ecosystems: Patterns, Processes, and Yields, edited by K. Sherman, L. M. Alexander, and B. D. Gold, pp. 82-98, American Association for the Advancement of Science, Washington, D.C., 1990.
Dickey, T. D., and J. J. Simpson, The influence of optical water type on the diurnal response of the upper ocean, Tellus Ser. B, 35, 142-154, 1983.
Dickey, T. D., D. A. Siegel, A. Bratkovich, and L. Washbum, Optical features associated with thermohaline structures, Proc. SPIE-Int. Soc. Opt. Eng., 637, 308-313, 1986a.
Dickey, T., E. Hartwig, and J. Marta, The Biowatt bio-optical and physical moored measurement program, Eos Trans. AGU, 67, 650, 1986b.
Dickey, T., J. Marta, T. Granata, C. Langdon, M. Hamilton, J. Wiggert, D. Siegel, and A. Bratkovich, Concurrent high- resolution bio-optical and physical time series observations in the Sargasso Sea during the spring of 1987, J. Geophys. Res., 96, 8643-8664, 1991.
Dickey, T., T. Granata, M. Hamilton, J. Wiggert, J. Marta, C. Langdon, and D. Siegel, Time series observations of bio-optical properties in the upper layer of the Sargasso Sea, Proc. SPIE-Int. Soc. Opt. Eng., 1302, 202-213, 1990.
Dugdale, R. C., and J. J. Goering, Uptake of new and regenerated forms of nitrogen in primary productivity, Lirnnol. Oceanogr., 12, 196-206, 1967.
Dugdale, R. C., A. Morel, A. Bricaud, and F. Wilkerson, Modeling new production in upwelling centers: A case study of modeling new production from remotely sensed tempera- ture and color, J. Geophys. Res., 94, 18,119-18,132, 1989.
Emerson, S. R., Seasonal oxygen cycles and biological new production in surface waters of the subarctic Pacific Ocean, J. Geophys. Res., 92, 6535-6544, 1987.
Eppley, R. W., and B. J. Peterson, Particulate organic matter flux and planktonic new production in the deep ocean, Nature, 282, 677-680, 1979.
Falkowski, P. G., C. N. Flagg, G. T. Rowe, S. L. Smith, T. E. Whiffedge, and C. D. Wirick, The fate of the spring phytoplankton bloom: Export or oxidation?, Cont. She•rRes., 8, 457-484, 1988.
Fasham, M. J. R., H. W. Ducklow, and S. M. McKelvie, A nitrogen based model of plankton dynamics in the oceanic mixed layer, J. Mar. Res., 48, 591-639, 1990.
Feldman, G. C., N. Kuring, C. Ng, W. Esaias, C. McClain, J. Ekod, N. Maynard, D. Endres, R. Evans, J. Brown, S. Walsh, M. Carle, and G. Podesta, Ocean color: Availability of the global data set, Eos Trans. AGU, 70 634-641, 1989.
Fu, L.-L., D. B. Chelton, and V. Zlotnicki, Satellite altimetry: Observing ocean variability from space, Oceanography, 1, 4-11, 1988.
Gardner, W. D., Periodic resuspension in Baltimore Canyon by focusing of internal waves, J. Geophys. Res., 91, 18,185-18,194, 1989.
Garrett, C., and W. Munk, Space-time scales of internal waves, Geophys. Fluid Dyn., 2, 225-264, 1972.
Goldman, J. C., Oceanic nutrient cycles, in Flows of Energy and Materials in Marine Ecosystems: Theory and Practice, pp. 137-170, Plenum, New York, 1984.
Harris, G. P., Phytoplankton Ecology, Chapman and Hall, London, 384 pp., 1986.
Haury, L. R., and R. E. Pieper, Zooplankton: Scales of biological and physical events, in Marine Organisms as Indicators, edited by D. F. Soule and G. S. Kleppel, pp. 35-72, Springer- Verlag, New York, 1987.
Haury, L. R., M. G. Briscoe, and M. H. Orr, Tidally generated internal wave packets in Massachusetts Bay, Nature, 278, 312-317, 1979.
Herman, A. W., Biological profiling in the upper oceanic layers with a Batfish vehicle: A review of applications, In Mapping
412 ß Dickey: HIGH-RESOLUTION PHYSICAL AND BIO-OPTICAL MEASUREMENTS 29, 3 /REVIEWS OF GEOPHYSICS
Strategies in Chemical Oceanography, edited by A. Zirino, pp. 293-314, American Chemical Society, Washington, D. C., 1985.
Hitchcock, G. L., E. J. Lessard, D. Dotson, J. Fontaine, and T. Rossby, The IFF: The isopycnal float fluorometer, J. Atmos. Oceanic Tech., 6, 19-25, 1989.
Honjo, S., R. Krishfield, and A. Plueddemann, The Arctic Environmental Drifting Buoy (AEDB), Report of field operations and results: August, 1987-April, 1988, Tech. Rep. WHOI 90-02, 128 pp., Woods Hole Oceanogr. Inst., Woods Hole, Mass., 1990.
Iturriaga, R., and D. A. Siegel, Microphotometric characteriza- tion of phytoplankton and detrital absorption properties in the Sargasso Sea, Lirnnol. Oceanogr., 34, 1706-1726, 1989.
Iturriaga, R., R. Bartz, and J. R. V. Zaneveld, An in situ active fluorometer to measure coccoid cyanobacteria fluorescence, Proc. SPIE-Int. Soc. Opt. Eng., 1302, 346-354, 1990.
Jatmke, R. A., Ocean flux studies: A status report, Rev. Geophys., 28, 381-398, 1990.
Kiefer, D. A., Fluorescence properties of natural phytoplankton populations, Mar. Biol., 22, 263-269, 1973.
Kiefer, D. A., and J. N. Kremer, Origins of vertical patterns of phytoplankton and nutrients in the temperate, open ocean: A stratigraphic hypothesis, Deep Sea Res., Part A, 28, 1087-1105, 1981.
Kiefer, D. A. and B. G. Mitchell, A simple, steady-state description of phytoplankton growth based on absorption cross section and quantum efficiency, Lirnnol. Oceanogr., 28, 770-776, 1983.
Kiefer, D. A., W. S. Chamberlin, and C. R. Booth, Natural fluorescence of chlorophyll a: Relationship to photosynthesis and chlorophyll concentration in the western South Pacific gyre, Lirnnol. Oceanogr., 34, 868-881, 1989.
Kirk, J. T. O., Light and Photosynthesis in Aquatic Ecosystems, 401 pp., Cambridge University Press, New York, 1986.
Kirkpatrick, G. J., T. B. Curtin, D. Kamykowski, M.D. Freezor, M.D. Sartin, and R. E. Reed, Measurement of photosynthetic response to euphotic zone physical forcing, Oceanography, 3, 18-22, 1990.
Kitchen, J. C., and J. R. V. Zaneveld, On the noncorrelation of the vertical structure of light scattering and chlorophyll a in case I waters, J. Geophys. Res., 95, 20,237-20,246, 1990.
Lewis, M. R., M.-E. Carr, G. Feldman, W. Esaias, and C. McClain, Influence of penetrating solar radiation on the heat budget of the equatorial Pacific Ocean, Nature, 347, 543-545, 1990.
Lewis, M. R., J. J. Cullen, and T. Platt, Phytoplankton and thermal structure in the upper ocean: Consequences of nonuniformity in chlorophyll profiles, J. Geophys. Res., 88, 2565-2570, 1983.
Lewis, M. R., N. Kuring, and C. Yentsch, Global patterns of ocean transparency: Implications for the new production of the open ocean, J. Geophys. Res., 93, 6847-6856, 1988.
Marta, J., Marine bioluminescence and upper ocean physics: Seasonal changes in the northeast Atlantic, Oceanography, 2, 36-38, 1989.
Marta, J. and E. O. Hartwig, Biowatt: A study of biolumines- cence and optical variability in the sea, Eos Trans. AGU, 65, 732, 1984.
Marta, J., R. R. Bidigare, and T. D. Dickey, Nutrients and mixing, chlorophyll, and phytoplankton growth, Deep Sea Res.,37, 127-143, 1990.
Martin, P., Simulation of the mixed layer at OWS November and Papa with several models, J. Geophys. Res., 90, 903-916, 1985.
McClain, C. R., W. E. Esaias, G. C. Feldman, J. Elrod, D. Endres, J. Firestone, M. Darzi, R. Evans, and J. Brown. Physical and biological processes in the North Atlantic during the first GARP Global Experiment, J. Geophys. Res., 95, 18,027-18,048, 1990.
Menzel, D. W., and J. H. Ryther, The annual cycle of primary production in the Sargasso Sea off Bermuda, Deep Sea Res., 6, 351-367, 1960.
Menzel, D. W., and J. H. Ryther, Annual variations in primary production of the Sargasso Sea off Bermuda, Deep Sea Res., 7, 282-288, 1961.
Morel, A., and L. Prieur, Analysis of variations in ocean color, Limnol. Oceanogr., 22, 708-722, 1977.
Neville, R. A., and J. F. R. Gower, Passive remote sensing of phytoplankton via chlorophyll a fluorescence, J. Geophys. Res., 82, 3487-3493, 1977.
Niiler, P. P., R. E. Davis, and H. J. White, Water-following characteristics of a mixed layer drifter, Deep Sea Res., 34, 1867-1881, 1988.
Okubo, A., Oceanic diffusion diagrams, Deep Sea Res., 18, 789-802, 1971.
Pak, H., Characteristic vertical patterns of particles, oxygen, and chlorophyll pigments in the North Pacific gyre, Proc. SPIE-Int. Soc. Opt. Eng., 489, 107-112, 1984.
Pak, H., and J. R. V. Zaneveld, Temporal variations of vertical beam attenuation coefficient on the continental rise off Nova
Scotia, J. Geophys. Res., 88, 4427-4432, 1983. Perry, M. J., and S. M. Porter, Determination of the cross-section
absorption coefficient of individual phytoplankton cells by analytical flow cytometry, Limnol. O ceanogr., 34, 1727-1738, 1989.
Pieper, R. E., D. V. Holliday, and G. S. Kleppel, Quantitative zooplankton distributions from multifrequency acoustics, J. Plankton Res., 12, 433-441, 1990.
Pond, S., and G. L. Pickard, Introductory Dynamical Oceanog- raphy, 329 pp., Pergamon, New York, 1983.
Preisendorfer, R. W., and C. D. Mobley, Direct and inverse irradiance models in hydrologic optics, Limnol. Oceanogr., 29, 903-929, 1984.
Price, J. F., R. A. Weller, and R. Pinkel, Diurnal cycling: Observations and models of upper ocean response to diurnal heating, cooling, and wind-mixing, J. Geophys. Res., 91, 8411-8427, 1986.
Rienecker, M. M., C. N. K. Mooers, and R. L. Smith, Mesoscale variability in current meter measurements in the California Current system off northem California, J. Geophys. Res., 93, 6711-6734, 1988.
Sarrniento, J. L., J. R. Toggweiler, and R. Najjar, Ocean carbon cycle dynamics and atmospheric pCO 2, Philos. Trans. R. Soc. London, Ser. A, 325, 3-21, 1988.
Sathyendranath, S., T. Platt, C. M. Caverhill, R. E. Warnock, and M. R. Lewis, Remote sensing of ocean primary production: Computations using a spectral model, Deep Sea Res., 36, 431-453, 1989.
Siegel, D. A., and T. D. Dickey, On the parameterization of irradiance for open ocean photoprocesses, J. Geophys. Res., 92, 14,648-14,662, 1987a.
Siegel, D. A., and T. D. Dickey, Observations of the vertical structure of the diffuse attenuation coefficient spectrum, Deep Sea Res., 34, 547-563, 1987b.
Siegel, D. A., T. D. Dickey, L. Washbum, M. K. Hamilton, and B. G. Mitchell, Optical determination of particulate abundance and production variations in the oligotrophic ocean, Deep Sea Res., 36, 211-222, 1989.
Smith, R. C., C. R. Booth, and J. L. Star, Oceanographic bio-optical profiling system, Appl. Opt., 23, 2791-2797, 1984.
Smith, R. C., J. Marta, M. J. Perry, K. S. Baker, E. Swift, E. Buskey, and D. A. Kiefer, Estimation of a photon budget for the upper ocean in the Sargasso Sea, Limnol. Oceanogr., 34, 1673-1693, 1989.
Smith, R. C., K. J. Waters, and K. S. Baker, Optical variability and pigment biomass in the Sargasso Sea as determined using deep sea optical mooring data, J. Geophys. Res., 96, 8665-8686, 1991.

29, 3 / REVIEWS OF GEOPHYSICS Dickey: HIGH-RESOLUTION PHYSICAL AND BIO-,OPTICAL MEASUREMENTS ß 413
Sosik, H. M., S. W. Chisholm, and R. J. OlSon, ChlOrophyll fluorescence from single cells: Interpretation of flow cytometric signals, Limnol. Oceanogr., 34, i749-1761, 1989.
Spintad, R. W., Flow cytometric analysis of the optical charac- teristics of marine particulates, Proc. SPIE-Int. Soc. Opt. Eng., 489, 335-342, 1984.
Spintad, R. W., A calibration diagram of specific beam attenuation, J. Geophys. Res., 91, 7761-7764, 1986.
Spintad, R. W., C. M. Yentsch, J. Brown, Q. Dortch, E. Haugen, N. Revelante, and L. Shapiro, The response of beam attenuation to heterotrophic growth in a natural population of plankton, Lirnnol. Oceanogr., 34, 1601-1605, 1989.
Steele, J. H., Spatial Patterns in Plankton Communities, 470 pp., Plenum, New York, 1978.
Stewart, R. H., Methods of Satellite Oceanography, 360 pp., University of California PresS, Berkeley, 1985.
Stramski, D., and D. A. Kiefer, Optical properties of marine bacteria, Proc. SPIE-Int. Soc. Opt. Eng., 1302, 250-268, 1990.
Swift, E., J. Van Keuren, H. P. Batchelder, C. R. Booth, and C. P. Li, Moored instrument to measure stimulated and natural oceanic bioluminescence, Proc. SPIE-Int. Soc. Opt. Eng., 925, 76-86, 1988.
Van Leer, J. C., Profiling devices, in Air-Sea Interaction: Instruments and Methods, edited by F. Dobson, L. Hasse, and R. Davis, pp. 701-724, Plenum, New York, 1980.
Washburn, L., D. A. Siegel, T. D. Dickey, and M. K. Hamilton, Isopycnal mixing and the distribution of particles across the North Pacific subtropical front, Deep Sea Res., 36, 1607-1620, 1989.
Washburn, L. B. H. Jones, A. Bratkovich, T. D. Dickey, and M.-S. Chen, Mixing, dispersion, and resuspension in the vicinity of an ocean wastewater plume, J. Hydraulic Eng., in press, 1991.
Waters, K. J., R. C. Smith, and M. R. Lewis, Avoiding ship- induced light-field perturbation in the determination of oceanic optical properties, Oceanography, 3, 18-21, 1990.
Weller, R. A., J.P. Dean, J. Marta, I. F. Price, E. A. Francis, and D. Boardman, Three-dimensional flow in the upper ocean, Science, 227, 1552-1556, 1985.
Wilkerson, F. P., and R. C. Dugdale, The use of large shipboard barrels and drifters to study the effects of coastal upwelling on phytoplankton dynamics, Lirnnol. Oceanogr., 32, 368-382, 1987.
Wroblewski, J. S., and E. E. Hofmarm, U.S. interdisciplinary modeling studies of coastal-offshore exchange prOCesses: Past and future, Prog. Oceanogr., 23, 6:5-89, 1989.
Yentsch, 'C. M., Flow cytometry: Near real-time information about ocean biology, Oceanography, 3, 47-50, 1990.
Yentsch, C. M., and C. S. Yentsch, Emergence of optical instrumentation for measuring biological properties, Oceanogr, Mar. Biol. Ann. Rev., 22, 55-98, 1984.
Yentsch, C. S., and D. A. Phinney, FluOrescence spectral signatures for studies of marine phytoplankton, in Mapping Strategies in Chemical Oceanography, edited by A. Zirino, pp. 259-274, American Chemical Society, Washington, D.C., 1985.
Yoder, J. A., W. E. Esaias, G. C. Feldman, and C. R. McClain, Satellite ocean color-status report, Oceanography, I, 18-20, 1988.
Zaneveld, J. R. V., H. pak, and W. S. Plank, Optical and hyd_rographic observations of the Cromwell Current between 92ø00'W and the Galapagos Islands, J. Geophys. Res., 78, 2708-2713, 1973.
T. D. Dickey, Ocean Physics Group, Department of Ceoloõical Sciences, University of Southern California, Los ^nõeles, CA 90089.