upstream oil and gas mergers and acquisitions: domestic
TRANSCRIPT

Upstream Oil and Gas Mergers and Acquisitions: Domestic Transactions in the U.S
Sevkat Özgür Speitmann1
Abstract
The oil and gas (O&G) industry, particularly, upstream industry has experienced rapid developments
over the last decades. For instance, due to the discovery of new resources in unconventional oil and gas
parallel to the horizontal drilling and fracking technology, the U.S oil and gas market shows changing
patterns which is also reflected in investments in the oil and gas industry. Mergers and acquisitions
(M&A) in the upstream industry in the U.S has experienced increasing patterns both in cross-border and
domestic levels. In this paper, we investigate the drivers of mergers and acquisitions in upstream industry
by applying an empirical approach based on domestic transactions in the U.S during the last two decades.
Our study recognizes that M&A investments in the oil and gas industry can vary from the M&A of other
industries and the underlying driving facts can be different than traditional economic explanations. Our
empirical results suggests that industry-specific variables have a stronger influence on the M&A flows
in the U.S. In addition, motivating facts can be different based on various transaction forms and deal
levels. The findings provide a comprehensive view, support various aspects of theories in M&A and
direct to sector-specific stylized facts from a well-functioning O&G M&A market.
Keywords: Mergers and acquisitions; upstream transactions; oil and gas investments, energy
Preliminary and incomplete
Please do not cite or circulate without permission
1. Introduction The oil and gas (O&G) industry is one of the largest, exclusive, and complex industries due to its
dynamic nature (Inkpen and Moffett, 2011). Attempts to explain patterns of this industry and of its
drivers of investments are challenging because of complex and rapid changes. This complexity is a result
of the interaction of elements such as resource availability, geographical characteristics, institutional and
political factors, technological advancements and innovations, sluggish supply and demand, financial
markets, uncertainty, international competition, and other external factors. Above all, the industry
continuously struggles to deal with a turbulent environment caused by commodity and energy prices,
especially oil price volatility and rapid changes driven by industry-specific developments and industry
instabilities. For example, significant external shocks, e.g., unexpected forces of nature such as
hurricanes (Hurricane Katharina and Rita in 2005, Hurricane Harvey in 2017), discovery of new oil and
gas fields and resources or cartel activities such as the Organization of the Petroleum Exporting
Countries, (OPEC) (Weston et al., 1999; Asa, 2016). There is a link between all these factors and the
development of the oil and gas industry, investment strategies, particularly, oil and gas mergers and
acquisitions (M&A) (Mohn and Misund, 2009; Hsu et al., 2017; Berntsen et al., 2018). Thus, all these
factors lead to new perspectives both on the cross-border and domestic investment landscape over time.
M&A investments, restructuring of a firm or any takeover activity is one of the characteristics
of the oil and gas industry for many decades (Weston et al., 1999). O&G M&A investments are not only
crucial for the O&G industry but also for the world economy, monetary policies, wealth, economic
growth of countries and inflation (Cox and Ng, 2016). For instance, upstream investments of O&G
industry in recent decades have their unique role since they directly impact the future energy supply,
1 Faculty of Business, Economics and Statistics, University of Vienna, Oskar-Morgenstern-Platz 1, 1090 Vienna,
Austria, [email protected]

2
further petroleum exploration, extraction, and production activities and discovery of new alternative
resources. It is also crucial for having an advantageous position in O&G geopolitical competition.
Countries must have certain strengths, and some of the essential objectives are the power of having rich
natural resources, resource base, strategic assessment, and investment to transfer energy factors into real
capacity, development, and control rights over energy resources (Mengchen and Limao, 2015; Jahangir
and Dural, 2018). M&A, particularly upstream M&A can help and support a country to enhance security
of its energy supply (Ding and Fu, 2011). Despite the increasing progress towards a transition to a low
carbon economy, oil and gas will remain in the energy mix for foreseeable future which will keep
exploration and production (E&P) activity and investments in a crucial position for global O&G
industry. Moreover, the role of O&G industry, particularly natural gas is important for the energy
transition (International Energy Agency (IEA), 2020).
The U.S. is the most active player in the oil and gas industry and O&G M&A market over
decades. In recent years, particularly in upstream and not only in terms of cross-border deals but also in
domestic investments and O&G production levels. The U.S O&G industry has undergone remarkable
changes such as growing domestic E&P activities and a recent shift from an oil importer to an exporter
nation. All these changes are partially led by a transformation towards new technologies in drilling and
new arising oil and gas resources, i.e., shale/tight oil and gas revolution, unconventional O&G
production and changing trends in natural gas production growth and liquified natural gas (LNG)
production and distribution (Cox and Ng, 2016; Hsu et al., 2017). All these recent changes provide a
unique opportunity to analyze their impact and the dynamics of investments in the U.S.
In this study, we investigate the U.S O&G market for M&A investments and its motivating facts
in the upstream industry. Although M&A have been a topic of considerable interest in various disciplines
providing a well-established literature, research focused on petroleum and oil and gas M&A is still
growing and empirical evidence is rather mixed and not conclusive yet (Ng and Donker, 2013; Hsu et
al., 2017). Thus, the motivating factors of O&G M&A transactions can show similarities with common
inferences but also vary from the usual economic explanations (Özgür and Wirl, 2020; Weston et al.,
1999; Ng and Donker, 2013). We offer a comprehensive explanation to the drivers of O&G M&A from
a specific industry view. Our study fills this void in the literature and yields a rich story of a specific
industry and domestic M&A levels. In other words, we offer a closer look to the U.S upstream oil and
gas industry development, which experiences its unique expansion in terms of production, domestic
investments in the oil and gas industry longer than a decade now (Cox and Ng, 2016; Hsu et al., 2017).
Hsu et al., (2017) study upstream M&A transactions based on total domestic M&A deal counts
over the period of 2004-2013. Their findings show there is a positive association between oil price
changes, oil and gas production growth and M&A deal counts but no significant relationship between
the changes of macroeconomic and financial market indicators (e.g., capital market liquidity, stock
market performance) and development of M&A flows. Cox and Ng (2016) also take a similar view on
the U.S oil and gas industry based on a firm-level analysis and investigate the impact of energy reserves
and oil and gas prices on takeover value and activity between 1990 and 2018. Their findings suggest
that U.S firms experience negative returns on announcements of takeovers in the oil and gas industry
and a positive relationship between M&A values and quantity of energy reserves, particularly significant
for oil reserves. At the same time, oil prices have a positive impact on M&A activity but there is no
impact of natural gas prices. Similarly, Ng and Donker (2013) present influencing factors on Canadian
oil and gas takeovers and show that equity valuation, synergy, equity and debt market conditions,
economic cycles and free cash flows are some of the traditional factors explaining M&A activity.
However, industry-specific variables, i.e., changes of oil and gas prices, i.e., energy prices and quantity
of reserves have a crucial impact on O&G takeovers.
Overall, these recent reviews and discussions suggest that oil and gas M&A transactions can be
influenced by a complex series of other factors, and industry-specific factors might have a stronger
influence than traditional ones on O&G investments. Given these above arguments, one can imagine
other factors such as the impact of certain events, geopolitical conflicts, competitive landscape,

3
increasing key assets on the market parallel to the increasing need for specialist companies to conduct
exploration and production activity. In this respect, further investigations, and extensions of the study
of Hsu et al., (2017), Cox and Ng (2016) and other scholars contribute to the growing literature in this
field and enhance the understanding of this industry and its investments. One can explore further
underlying motivating facts of the U.S upstream transactions as well as extend the time frame to capture
the association between the predicted indicators and M&A transactions over time. There could be a
change of the relationship between variables and the association can differ due to underlying form of
transaction method (Hsu et al., 2017).
The goal of this paper is to shed further light on what factors explain upstream M&A activity.
We analyze upstream transactions, using rich data of transactions over the last two decades in the U.S,
and its drivers based on economic, financial, political, and sectoral levels, and explore whether there are
unique factors explaining upstream M&A activity. We estimate the impact of the following determinants
on M&A activity: oil and gas production growth, oil and gas prices, S&P 500 index, interest rate spreads,
Shale Revolution, and the Trump administration. This study answers a call for further research on the
question what motivates upstream oil and gas transactions, what are the determinants of the U.S
upstream M&A transactions and what are the differences on the underlying drivers of upstream O&G
M&A based on various M&A transaction forms and types (Hsu et al., 2017).
This research is distinctive from prior studies in several ways. First, we extend the analysis
period of M&A transactions from 2000 to 2019 in comparison to the study of Hsu et al., (2017). We
expect to observe different patterns and associations between variables, particularly, caused by the
changes in the U.S oil and gas industry, economy, and financial markets over time. For example, growth
of oil and gas production in the U.S differs over time and the shale oil and gas production and
unconventional oil and gas investments mostly take place for the period after 2009. Our analysis extends
the period of prior studies and captures almost a 10-year time span for post shale oil and gas revolution
of the U.S. At the same time, it covers the period before, where the U.S oil and gas production growth
is rather negative. Second, our research focus goes beyond the traditional mergers and acquisitions forms
by including other transactions forms as it is defined in oil and gas industry terminology. It also includes
acquisitions/farm-in and acquisitions/joint ventures transactions (IHS Markit, 2019). We also perform
our analyses at different aggregate M&A deal levels, i.e., we distinguish corporate and asset deal levels,
conventional versus unconventional oil and gas deals exploiting detailed and granular data. By doing
so, we focus to explore variations on results based on differences in deal styles and deal levels. For
instance, our data set largely covers asset deal level transactions in the U.S. We expect that these all
might dictate changes and differences on underlying determining variables, which might differ from the
study of (Hsu et al., 2017). We offer potential explanations for these contrasting results and present our
findings based on empirical evidence. Third, we add further indicators which can measure the impact of
certain industry-specific events, e.g., Shale revolution in the U.S, and political changes, i.e., Trump’s
election and its administration, which is a proxy for the changes on political/institutional environment
after his election (Harford, 2005). Lastly, we model two types of regression analyses where we first look
for the association between explanatory variables and M&A deals, and second, we apply the lagged
explanatory variables (1-year lagged), which accounts for the time adjustment process, and follows a
similar method of Hsu et al., (2017) and presents the power of changes in environment and its effect on
M&A flows for the following year.
The result of the first part of empirical analysis largely supports the appointed view that industry-
specific indicators have a significant impact on upstream M&A transactions but also the financial market
proxy and capital market liquidity show statistically significant associations. Although one might expect
to observe a strong association between political and industrial changes and upstream M&A transactions,
however the results in most cases show no significant relationship or not a large influence of those
indicators. Still, there is also supportive evidence that O&G investments may not react to such
unexpected changes in immediate terms but in longer-period (Dayanandan and Donker, 2011). The other
focus is to test whether same variables have similar impact on various types of transaction patterns. It is
likely that asset acquisitions and unconventional transactions might be more sensitive to certain

4
variables, e.g., the relationship between shale oil and gas revolution and the number of unconventional
transactions (Sabet et al., 2018). The empirical evidence shows that the U.S unconventional and
conventional transactions have a significant relationship with both industry-specific variables and
economic, financial, and specific events, e.g., a positive impact of Trump’s administration on
unconventional transactions, which is parallel to the administration’s supports of shale oil and gas
production and investments in the U.S. However, based on the overall results of our regression models,
patterns or the impact of variables are not homogenous. This is challenging for having a unified
framework to explain drivers of upstream O&G M&A transactions. However, it is complementary to
the argument that upstream oil and gas and transactions has some special characteristics and can be only
viewed from a broader perspective (Isser, 1996). Moreover, the markets and oil and gas specific
indicators develop in various directions over time.
The study empirically validates upstream O&G M&A transactions in the U.S, shows some
distinctions from prior literature and discusses the underlying reasons of those. The findings are relevant
to scholars, investors, and policymakers, explaining the motivations and drivers of upstream oil and gas
transactions from a well-functioning O&G M&A market. Although the study period does not cover the
covid-19 pandemic yet, but during booms and busts alike, it is expected that oil and gas M&A markets,
as well as the U.S oil and gas M&A transactions will be affected. For instance, some of the economic
consequences of this pandemic crisis are yet to be seen. Based on volatile oil prices during this time,
shock with unpredicted future demand and supply, increasing concerns for prioritization of climate and
environment protection, financial uncertainties, we will likely see changing patterns of M&A
transactions and maybe a new age of opportunities and transformative future in the oil and gas industry.
Besides that, Joe Biden’s election as the president of the U.S and the new administration and the
Democratic Party’s politics through oil and gas industry might impact the directions of energy industry,
future oil and gas investments not only in the U.S but also in global landscape.2 With this regard, there
is still much more work to be done in this field. Our research adds to the growing literature, useful for
scholars, policy makers, regulators, investors, and contributes to the oil and gas industry and M&A
studies.
The remainder of this paper is organized as follows: Section 2 briefly reviews the literature on
M&A and oil and gas M&A and introduces motivations based on theory and builds the hypotheses.
Section 3 turns to trends in upstream M&A and the oil and gas industry in the U.S. Section 4 presents
the data description and methodology. Section 5 presents and discusses the results, and the final section
6 concludes the paper.
2. Literature review and hypotheses In this section, we develop testable predictions about the motivating facts of M&A transactions in the
light of prior literature. M&A is a multifaceted investment strategy and viewed in interdisciplinary
theoretical approaches in the literature. According to the study of Reddy (2014) on internalization, M&A
and other takeover forms of the firms, the most common key motives of M&A are listed in prior literature
as follows: market motive, financial reasons, strategic motive, economic motives, asset-seeking motives,
regulation, and political reforms, personal motives, e.g., managers, CEOs empire building. These
motives of M&A investments can be different among various industries based on industry-specific
dynamics, the rate of change of economy and other boundaries (Choi et al., 2020; Reddy, 2014; Kang
and Johansson, 2000). For instance, Weston et al. (1999) argues that there is a strong link between
technological changes, globalization and international free trade, privatization, instabilities, and sectoral
events/changes, rising stock prices, low interest rates and strong economic growth and O&G M&A
investments. Moreover, a distribution of the geographical risks, the command of several skills, costs for
operation units make M&A strategy essential for oil and gas companies (Corlay and Hubby, 2012).
Particularly, advancements in technology and the developments of fracking techniques lead increasing
2 For example, the new U.S. government announced to rejoin the Paris Agreement and a review of the U.S. fossil-
fuel strategy (based on the announcement of the U.S Department of State, 2021).

5
supply of oil, production of natural gas in the U.S, increasing investments and increased investment
value in the oil and gas industry (Sabet et al., 2018; Joskow, 2013).
According to the neoclassical theory, technological change is one of the key factors which leads
to any restructuring events of the firm, such as M&A transactions (Coase, 1937; Harford, 2005). Coase
(1937) points out that the firm reacts and responds to factors that affect the cost of market pricing and
management decisions over time. Following Coase’s framework, Williamson (1975) and Klein et al.,
(1978) argue that there is a relationship between transaction costs and organizational events of the firm.
Especially, transaction costs related to specific assets creates motivating facts for restructuring of the
firm and corporate investments such as vertical integration, acquisition, joint ventures, or mergers. Klein
et al., (1978) also discusses that any integration activity such as acquisition or merger is an alternative
to a long-term contractual relationship which are very costly solutions. Companies therefore look at
opportunities to reduce risk of incompleteness of contracts and secure their control over business by
gaining ownership. In a similar framework, Hart’s (1995) work is an exemplar of strategic management
of a firm, boundaries of firm, contracts, and financial structuring of a firm. Relatively, the importance
of ownership from the perspective of modern property rights theory. Hart (1995) points that there are
positive transaction costs and contracts are not complete in a business context. Moreover, contracts will
always have gaps and missing provisions due to the occurrence of any unexpected event. In that line,
boundaries of the firm matter for economic efficiency. For instance, ownership is a source of control
rights, especially for the physical asset-based investments and business. Integration of companies,
merger and acquisition is a way to allocate and gain control rights (Mahoney, 2005). For some industries,
such as manufacturing, or oil and gas which has a volatile market, and heavily dependent on physical
assets, resources, there is a certain economic benefit of integrations. Therefore, it is expected that
advantages of property rights in resources and asset-based environment generates M&A activity.
Furthermore, Jensen (1993) proposes that the changes of regulation, input prices and technological
innovations and advancements motivate the restructuring of the firm and any other corporate strategy
activities. At the same time, Bonaime et al. (2018) point out that political uncertainty, any regulatory
uncertainty, or changes of politics and institutions might impact the investments negatively. We
complement prior research and have interest to investigate that is there an impact of the introduction of
new oil and gas resources, policy, regulation, and institutional changes on the U.S M&A transactions in
the upstream industry. We posit that factors such as the U.S shale revolution and administrative changes
such as Trump’s election affect the upstream transactions.
M&A studies also analyze the association between M&A activity and market valuation, in other
words, stock market valuation, capital market liquidity based on behavioral theory and overvalued
shared theory approach (Gugler et al., 2012). The empirical evidence confirms that there is a relationship
between stock market and M&A activity. Moreover, there is a positive association with the degree of
optimism in the stock market (Verter, 2002; Schleifer and Vishny, 2003; Gugler et al., 2012). For
instance, stock prices and M&A activity show a tight positive correlation in the U.S market (Bureau Van
Dijk, 2018). A closer look at sector level of M&A and deeper view into oil and gas industry may provide
additional insights. We expect to observe a positive relationship between stock market prices and M&A
activity. Higher stock prices would give confident and purchasing power to oil and gas firms that it will
trigger M&A activity and increase the value of the assets on the market and value of the deal (Weston
et al., 1999).
Some papers also indicate the impact of monetary policy on M&A activities. For instance,
monetary variables such as interest rates, exchange rate and money supply and their relation to
investments. Razmi et al. (2020) analyze the U.S oil and gas market and the results show that the long-
term uncertainty of monetary variables impacts the oil and gas market. It impacts future commodity
prices, future and forward contracts of oil and gas, contractual agreements, and financial transactions
such as M&A investments. In that line, a performing market, stable environment, and low interest rate
credit will support M&A activities. Particularly for upstream industry and transactions, it is expected
that there is a strong link between capital market liquidity measures and M&A. Since exploration and
production activities hold high risk with uncertain returns, oil and gas companies might struggle to find
6
credit to finance their M&A activities. Simply, if the interest rates increase, financing M&A activity will
be difficult due to tightened credit market, which might relatively cause less transactions and lead that
companies focus to expand their exploration and production activities internally (Hsu et al., 2017). This
leads us to that stock and capital market performance affect upstream O&G M&A activity:
Different to the impact of markets and macroeconomic variables and M&A, Berntsen et al.
(2018) solely focus on oil and gas investment decision making and M&A activity and the impact of
industry and field specific variables and highlight the strong influence of industry-specific variables
(e.g., one of the most effective impact is the size of the reserves). Purchasing reserves motivation for
takeovers, mergers and acquisitions or any other form of transactions also analyzed by Ferguson and
Popkin (1982). Their study is one of the first to highlight reserve purchase as an underlying motivating
factor of M&A in the oil and gas industry. Their suggestion is that purchasing reserve and resources of
another firm is a risk-free profit strategy which exists even after decades. Since the natural resources are
not infinite and reducing reserves is a motivating fact for acquirers. Bos et al. (2018) propose a novel
view and highlight the predictive impact of oil and gas M&A market and transactions on the expectation
of future oil prices. M&A activity in the O&G industry carries fundamental information regarding future
expectations on oil price dynamics and should be considered in forecasting exercises. On the other hand,
energy prices, particularly oil price and partially natural gas prices are studied by many scholars as the
triggering factor of any restructuring activity in the oil and gas industry and investments (Boyer and
Fillion, 2007; Weston et al., 1999; Hsu et. al. 2017). We therefore propose that industry-specific
environment affect upstream O&G M&A activity and have a strong and significant impact.
In a nutshell, we expect upstream M&A activity to react primarily to industry-specific factors,
technological and political changes, and market environment in some ways. One could expect a positive
relationship between stock market performance and a negative relationship between interest rate spreads
and M&A activity. However, there could be different arguments in the oil and gas industry. For instance,
when we consider that oil and companies are tended to sell their assets and to finance their capital
spending, the impact of capital market liquidity can be expected to be low or not significant (Hsu et al.,
2017). We also expect that there will be a stronger association between M&A transactions per asset and
per unconventional deals and the changes of technology and industry-specific indicators. Hence the U.S
has experienced horizontal drilling; the shale oil and gas revolution and acquisitions of certain resource
field assets are trending in recent years. Likewise, there will be a stronger negative association between
M&A transactions per corporate deals and market liquidity measure because it is expected that corporate
transactions carry higher risk due to its nature, since all the known and unknown liabilities are
transferred to the acquirer and it is expected to have a higher sensitiveness to the capital market
measures, such as interest rates spreads which will impact the credits.
3. Recent trends in O&G and the U.S upstream M&A This industry’s development highly depends on new technologies, new extraction and drilling
techniques, and innovations and all these will go through tremendous changes every decade (Yang et
al., 2016; Lu et al., 2019). Together with these changes, the industry goes through its own
transformations, replacements and increased activities in exploration and production over time. Along
with that, the accessibility to oil and gas resources and reserves has been increased but also resources
became scarcer. This leads a continuous pressure for further exploration and production, discovery of
alternative resource types and concerns on reserve replacement by oil and gas companies and countries
for future supply (Solheim and Tveterås, 2017). Given the fact that, O&G resources are finite and
declining over years, finding new potentials is a crucial topic. This brings additional anxiety about
reserve quantity and production capacity. Consequently, O&G firms look for investment opportunities
to invest in new resources, reserves, and assets to be able to meet further growth, cash flow objectives,
and compete on the market (Boyer and Fillion, 2007; Ng and Donker, 2013).
Since the 1990s, M&A activity has been always high in the oil and gas industry primarily as an
inorganic growth strategy and continue to grow parallel to the above stated concerns and technological
advancements over time (Corlay and Hubby, 2012). The ambiguous aspect here is to investigate further

7
and explain which recent trends in the O&G industry, economy and politics seem strongly associated
with the movements of those transactions.
The oil and gas industry and oil and gas prices are characterized by ups and downs and the
market is sluggish and finding new equilibria over decades (Cox and Ng, 2016; Hsu et al., 2017; Mitchell
and Mitchell, 2014). According to the prices, the past sluggish oil prices are mostly credited to
unexpected political events, supply wars, and financial crises. M&A transactions are correlated with all
these unexpected changes. However, the strong influence of politics, conflicts between governments are
condoned for some periods in those recent decades, i.e., it is not accounted as the only driver of changes
(Wirl, 2008). Figure 1 presents the changes of oil prices over time based on past price wars, other shocks
to oil price and supply due to political conflicts, which are also shown the underlying facts for the
movements of O&G investments (Accenture, Energy M&A Review, 2020).
Figure 1: The prices of oil (WTI $/Bbl.) driven by price wars, other shocks to supply, price between
1985 and 2020.
Source: Accenture, report of energy M&A in the new abnormal, 2020.
Particularly during the first decade of the period of 2000-2019, together with the increase of
prices, the demand growth became faster than production which means that supply surplus has
disappeared towards the end of 2008. The high demand and price hikes expose a valid argument for
governments, countries to secure supply in long-term. The years 2003-2008 experienced a gap between
demand and non-OPEC supply and OPEC production has lacked enough supply growth and spared
capacity (Wirl, 2008; Fattouh, 2010; the US Energy Information Administration (EIA), 2020). All these
growing demand and collapse oil price environment together with market speculations, financial crises,
and uncertainties promote the attractiveness of alternative oil production attempts in other countries and
further alternative investments made and planned to meet future demand growth. Thus, uncertainty of
possible political interferences, regulations of all kinds at the energy industry and markets motivate
countries and companies to protect their domestic O&G market and supply. Although the OPEC share
of O&G industry remains, the OPEC member countries have no control over this expansion. All these
trends evoke considerations for further innovations and technological advancements, diversifications,
and extensions of portfolios to be able to cope with abnormalities (Mitchell and Mitchell, 2014).
For instance, the U.S with its new oil and gas resources exploration, shale and tight oil and gas
via applying new fracking techniques made a significant change in global trends in the last decade. This,
in turn, encourages transactions and investments to shale and tight oil and gas in the U.S domestic
market. Moreover, the U.S reduces dependence on foreign oil and imports and focus on its own domestic
energy revolution both in conventional and unconventional resources. A new play begins in the U.S with
the shale revolution and new E&P regions and fields are targeted on the market for further development,

8
new exploration, production, and investment opportunities (Hsu et al., 2017). In this context, despite the
power of having technological advantages and know-how, a natural question arises, how and why some
countries can adjust certain changes faster than others and whether ownership, property rights,
governments’ role are crucial for upstream investments. The fundamentals of ownership, property rights,
the domestic market structure and O&G extraction and production regulations are different among
countries. In most of the cases in world, the state is the owner of the resources and responsible for the
production and National Oil Companies (NOCs) are representative of the governments, i.e., created
monopoly to manage, develop, operate and sale (Mitchell and Mitchell, 2014).
The U.S, Canada and few other countries have the possibility of having the ownership of natural,
mineral resources individually, or the organizations are granted to have ownership of the land surface
and upstream industry is open to private companies (Omorogbe and Oniemola, 2010; Mitchell and
Mitchell, 2014; Rossiaud, 2014). For instance, ownership and property rights in the U.S oil and gas
industry are extremely unique compared to the rest of the world. The domestic oil and gas production
of the U.S mainly comes from privately-owned resources and advantages of property rights in the U.S
is one of the important motivating fact for the U.S O&G and M&A market. Regulations and laws in the
U.S promote the development of oil and gas industry and for instance, the development of
unconventional O&G. At the same time, the country provides a stable and predictable permitting
procedure for the investors. Moreover, the well-developed infrastructure network supports the rapid
expansion of O&G industry (Robert Strauss Center, 2021; Brown and Yücel, 2013). This characteristic
of the U.S O&G industry and market causally relates to high numbers of domestic acquisitions, and
other type of takeover investments within the national borders (LeFort et al., 2013).
Figure 2 shows the development of O&G production in the U.S. Although oil and gas production
levels do not change dramatically during the first decade, the last decade shows that O&G production
has significantly surged over time. For instance, the U.S has reached the production of 12.232 million
barrels per day of crude oil and 33,657 billion cubic feet of natural gas in 2019 (EIA, 2019). This is
more than twice the level from 2008 before the start of shale revolution.
Figure 2: The levels of oil and gas production of the U.S 2000 and 2019.
Source: EIA, 2019. (The natural gas production is converted to barrels of oil equivalent).
In 2019, almost over 60 % of domestic crude oil production in the U.S comes from shale or tight
oil production which occurred mostly in locations Texas (e.g., mainly Permian Basin in West Texas),
North Dakota, Colorado, Alaska, and offshore areas. Similarly, natural gas production from shale
resources increased and production mostly comes from the states, Texas, Pennsylvania, Louisiana,
Oklahoma, and Ohio (Thomson Reuters, Practical Law, 2021; EIA, 2019). At the same time, the U.S
continues with its production of conventional crude oil and natural gas to maximize domestic capacity
of production and increase net oil exports. This increased production levels, particularly in the last
decade is expected to be associated with investments, purchase of fields and assets by the U.S oil and
0
2E+12
4E+12
6E+12
8E+12
0
5.000.000
10.000.000
15.000.000
20
00
20
01
20
02
20
03
20
04
20
05
20
06
20
07
20
08
20
09
20
10
20
11
20
12
20
13
20
14
20
15
20
16
20
17
20
18
20
19
Gas
(in
th
e b
arr
els
of
oil
equ
ivale
nt)
Oil
(b
arr
els
per
day
)
The U.S O&G Production
US Crude Oil Production US Dry Natural Gas Production
9
gas companies in domestic market (Hsu et al., 2017). For instance, oil and gas production and production
growth might be a signal for increasing value of the assets on the market, encouraging fact for further
investments in the field. With record growths in last decades compared to other selected countries such
as Saudi Arabia and Russia, the U.S leads global oil and gas production in global O&G industry. Overall,
the U.S O&G play a changing role in the global O&G landscape: new balancing factor for OPEC,
leading position in becoming new supplier compared to traditional suppliers, politics of sanctions and
some other interesting changes for relevant future oil and gas market. All lead the movements of U.S
O&G M&A market together with the other country-level factors.
4. Data and empirical methodology Mergers and acquisitions announced between 2000 and 2019 is collected from IHS Markit (IHS
Connect) Transaction database. This database is also commonly applied in the energy and finance
literature since it covers all oil and gas transactions worldwide and contains detailed information on the
type of M&A deals (Sabet et al., 2018; Merton and Upton, 1985). IHS Markit data has an extensive
coverage of unique details of the oil and gas transactions based on sub-classifications, categories such
as upstream, downstream, midstream, and all sub-segments of O&G industry. For our purposes, it offers
various classifications opportunity of the deals. For instance, the transactions include all oil and gas
related asset and corporate M&A deals and extended deal styles to traditionally defined mergers and
acquisitions. M&A term in general refers to the consolidation of companies, or assets by various types
of financial transactions (Choi et al., 2020). Moreover, key information such as the resource segment of
the transaction is available in each deal.
In this study, M&A refers to all merger, acquisition, acquisition/farm-in and acquisition/joint
venture transactions3. By this unique selection based on IHS Markit’s deal styles, our analysis covers
broader level of M&A transactions forms. These differences in deal style category might also lead
differences in underlying driving factors (Hsu et al., 2017). Therefore, our findings are based on those
classified upstream oil and gas transactions in the U.S.
To constrain the analysis to U.S upstream M&A transactions, several filters are applied: i)
filtering and selecting only for upstream M&A transactions, ii) if there is no information on the key
indicators, particularly, information on the buyers’ headquarter and target (primary) country of the deal,
those deals are excluded from the sample, iii) if there any other missing key information or any mismatch
information, those deals are excluded from the sample iv) to examine the U.S transactions, domestic and
cross-border M&A transactions in the U.S are derived from the sample (See Table 1).
Table 1: Transactions from IHS Markit Transaction database, data selection.
Source: Composed by authors.
Deals Restrictions
25,468 Worldwide oil and gas M&A transactions between 2000 and 2019
21,285 After exclusion of transactions with no buyer headquarter and primary country
information
3 Merger: is when one company will become the majority owner. Acquisition; is purchase of assets,
reserves/resources, properties, entire company, business, and fields. Acquisition/farm-in; is when the buyer
acquires undeveloped acreage, projects, and fields without estimated reserves. Acquisition/joint venture deal; is
the partial ownership of the assets (IHS Markit, 2019).

10
13,546 After exclusion of transaction with no other key information
4,870 After selection of the U.S upstream transactions
4,132 After selection of domestic U.S upstream transactions (Final Sample)
The final data contains 4132 upstream M&A transactions, worth more than USD 1 trillion total
deal value. The distribution of deal levels in the final data is that 90% of total deal counts are in asset
deal level transactions which means that the corporate M&A represents a relatively small share of the
total upstream M&A transactions. Parallel to the recent trends in the U.S upstream O&G industry, the
increasing asset acquisitions, consolidations, are observed, particularly for the period after shale
revolution. In terms of share of conventional and unconventional transactions; Figure 3 shows the
development of the upstream O&G M&A flows based on these two dimensions. There is a significant
increasing unconventional transactions trend after 2009 and the peak is after 2015. Increasing
conventional transactions are part of the period 2000-2007 and at the second half of the period, they
show mostly downwards trends.
Figure 3: The upstream transactions per conventional and unconventional deals in the U.S.
Source: Based on domestic transactions of the U.S derived sample from IHS Markit transactions
database.
The total domestic upstream transactions are based on investments from 15 various regions of
the U.S. The list of regions based on IHS Markit’s region category are as follows: Appalachia, Mid-
Continent, Gulf of Mexico, Rocky Mountains, Gulf Coast Onshore, West Coast, Diversified (i.e., Multi-
regions), North Central, North Slope, Southeast, South Central. Sub-regions such as Arctic, Beaufort
Sea and Northeast is taken as part of North Slope. The region category, Globally Diversified is merged
with the region, Diversified. Due to the limitation of data collection on oil and gas fields, basins level
data and production levels, our analyses based on aggregated data levels from 11 regions transactions
per deal count and per year. Many of the transactions occur in Mid-Continent which includes states with
high oil and gas production and fields (e.g., Texas, Oklahamo, Louisiana). There are significant numbers
of investments to Gulf Cost Onshore and Gulf of Mexico, Rocky Mountains, Appalachia, which are also
listed as some of the most productive tight oil and gas regions and at the same time offering investment
opportunities by local private owners of acreages, lands in the U.S. For example, Cotton Valley Group
as one of the primary basins in Gulf Coast Onshore. Along the Gulf Coast and Gulf of Mexico, almost
51% of onshore and offshore oil and gas production of the U.S capacity comes. Furthermore, Appalachia
region is with its high record of tight gas and natural gas production in recent years. Rocky Mountains
particularly between 2010 and 2015, with its increased crude oil production and reserves in shale gas
was attractive in terms of investments (EIA, 2021). Furthermore, Mid-Continent and Gulf Coast
0
50
100
150
200
250
300
350
Dea
l C
ou
nts
M&A Deal Counts by Resources Segment
Conventional Unconventional

11
Onshore, together with Gulf of Mexico also have high numbers of transactions before shale revolution,
basically, the increase of transactions in the first decade of the analysis period (2000-2008) was driven
majorly by these three regions.
4.1 Data description and variables We conduct our analysis based on total deal count and deal value across aggregated regions per year and
per total deal counts and value. However, 36% of the transactions contain no deal value information due
to deal disclosure or lack of key information. To this end, we apply approximate checking algorithm,
checking a random deal with no deal value information and gathering additional information via
transaction deal summary field.4 This shows no specific pattern of these deals, and we therefore expect
no systematic bias of the results. However, the missing data limit us to conduct analysis on deal value
for the complete final sample. Hence, we use the deal count information for our analysis and all other
sub-analyses. Table 2 provides a breakdown of the deal counts and total deal value by year.
Table 2: M&A activity by years in the U.S
Source: Composed by the authors.
Year Deal Count Total Deal Value in MM
2000 129 67.107
2001 133 18.448
2002 170 8.322
2003 120 14.962
2004 200 30.735
2005 209 70.735
2006 339 78.962
2007 356 54.087
2008 229 43.350
2009 152 17.480
2010 239 60.639
2011 289 48.343
2012 256 79.042
2013 232 46.201
2014 236 73.800
2015 148 36.498
2016 203 73.255
2017 235 66.087
2018 144 50.991
2019 113 95.154
Total 4132 1.034.198
Median 206 52.539
Mean 207 51.710
The choice of data for macroeconomic, financial, and industry-specific independent variables,
is consistent with Hsu et al., (2017). The same variables used in the model which are spread between
4 We create random sub-samples from the data set to compare deals with no deal value information to understand
whether there are any common patterns between those deals, or it is more driven by the M&A deal disclosure of
companies. The deals with no given deal value information are random and creates no biased to our analysis.

12
commercial paper and annual federal funds rate (3-month commercial paper minus federal funds rate),
S&P 500 index price, U.S crude oil and natural gas production growth5, crude oil, and natural gas prices.
Two dummy variables are added into the model to measure the impact of industry transformation, i.e.,
technological changes, and political, institutional changes. The data for independent variables; interest
rate spreads is collected from Federal Reserve Bank of St. Louis, Economic Research, S&P 500 index
is from Wharton Research Data Services, oil and gas production and prices are obtained from the Federal
Reserve Economic Data, U.S Energy Information Administration (EIA) and Inflation Data. Table 3
shows the details of the data description. Table 4 shows the descriptive statistics of our final sample.
Table 3: Variable Description.
Notation Description
M&A Deal Value Total deal value of M&A deals per year and per region
M&A Deal Count
Total number of M&A deals per year and per region
Oil Price ($/Bbl.) West Texas Intermediate oil price index, annual average price per year
adjusted for inflation (industry-specific change measure)
Natural Gas Price ($/MMBtu) Henry Hub natural gas price, annual average price per year adjusted for
inflation (industry-specific change measure)
Oil Production Growth % (Bbl.
of equivalent)
Based on oil production amount across the country per year, absolute levels
(industry-specific change measure)
Natural Gas Production
Growth % (Bbl. of equivalent)
Based on natural gas production amount across the country per year,
absolute levels (industry-specific change measure)
S&P 500 Index Price Stock price index based on average monthly closings per year (financial
market measure)
Annual Fred CPFF Interest rate spread based on difference between commercial interest rate
and federal funds rate, annual average rate per year (capital market liquidity
measure)
Dummy: Trump’s election and
its administration
Dummy variable that has the value one for the period starting on 2017,
otherwise is zero (political change measure)
Dummy: Shale revolution Dummy variable that has the value one for the period starting on 2011,
otherwise is zero (technological advancements measure)
Table 4: Descriptive statistics of the final sample.
This table reports the summary statistics for the variables employed in this study.
Summary Statistics count mean sd min max p25 p50 p75
M&A Deal Count 189 21,86 26,28 1,00 124,00 3,00 11,00 32,00
M&A Deal Value (USD MM) 174 532,35 1352,93 0,06 9992,03 88,92 214,93 457,58
Annual FRED CPFF 190 0,13 0,16 -0,25 0,64 0,04 0,11 0,23
S&P 500 Index Price 190 1558,26 572,59 948,52 2937,96 1133,97 1318,31 1944,41
Crude Oil Price (WTI) 190 67,05 25,12 26,08 111,39 41,82 65,45 95,06
Natural Gas Price (H. Hub) 190 5,23 2,41 2,38 10,46 2,99 4,41 7,24
5 The U.S production of crude oil and natural gas data is obtained from the U.S Energy Information Administration
(EIA). We convert natural gas production in million cubic feet to its barrels of oil equivalent to have the same
measure with crude oil production. The data therefore contains measure for both oil and gas in barrels of equivalent.

13
Oil Production Growth 190 0,04 0,08 -0,06 0,18 -0,02 0,00 0,07
N. Gas Production Growth 190 0,03 0,04 -0,04 0,12 0,01 0,03 0,05
4.2 Empirical Models We follow a similar approach in the literature (Hsu et al., 2017; Dowling and Wanwallegem, 2018) and
use a simple count data model of Poisson regression. The distribution of counts is discrete, not
continuous, and is limited to non-negative values. The Poisson regression model seeks to maintain and
exploit the nonnegative and integer-valued aspect of the outcome which is commonly used in the
literature as an alternative to linear regression models (Gardner et. al., 1995 and Cameron and Trivedi,
2013). We model the natural log of the response variable, i.e., 𝐿𝑁(𝑌𝑖𝑡) which is M&A deal counts, as a
function of the coefficients.
I) Poisson Fixed Effects Regression for M&A Deal Count
𝐿𝑁(𝑌𝑖𝑡) = 𝛽0 + 𝛽1𝑋𝑖𝑡 + ⋯ + 𝛽𝑗𝑋𝑗𝑡 + 𝛾𝑖 + 𝜀𝑖𝑡
For each analysis, we regress the dependent variable, 𝑌𝑖𝑡 = the deal count in region i in year t,
on the independent variables , i.e. Annual FRED CPFF, S&P 500 Index Price, WTI Oil Price Adjusted
to Inflation, Henry Hub N. Gas Price Adjusted to Inflation, Oil and Gas Production Growth and dummies
for the shale revolution and the Trump administration. 𝛾𝑖 captures region fixed effects, e.g., culture,
history, response behavior, and formal institutions that are expected to be unchanged over time.
To corroborate our findings and to differentiate, we first add sub-regressions based on corporate
and asset deal levels, and conventional and unconventional deals. We test our hypotheses for the M&A
activity based on deal counts of specific deal types. Second, we are interested in how upstream M&A
activity reacts to the changes of independent variables over time. To accomplish this, we impose an
order on the timing and lag the independent determinants (interest rate spreads, S&P 500 index, O&G
prices, and O&G production growth) by one year. This may account for a delayed M&A reaction to the
deal’s drivers. We choose a 1-year lag and follow a similar approach applied by Hsu et al. (2017).
5. Results
5.1 Determinants of upstream M&A activity Table 5 shows the association of industry-specific variables, stock and capital market, and politics and
technological advancements on M&A flows at the aggregated deal level. Column [1] shows the result
of the analysis based on Equation (I) with M&A deal counts as the dependent variable. Column [2]
presents the estimated results of lagged-independent variables for the same model. These results clearly
show similar patterns since the presented associations between M&A deal counts and independent
variables are similar.
Table 5: Regression results of M&A activity and its determinants
Poisson Poisson 1y-lag
Full sample Full sample
Dependent variable: M&A deal count [1] [2]
Annual FRED CPFF -0.807*** -0.724***
(0.165) (0.239)
S&P 500 Index Price 0.000304 -0.000192
(0.000204) (0.000224)

14
Oil Production Growth -3.276*** -1.611***
(0.398) (0.573)
Natural Gas Production Growth -2.346*** -1.893***
(0.482) (0.665)
WTI Oil Price 0.0174*** 0.00632***
(0.00209) (0.00179)
Henry Hub N. Gas Price -0.0245 0.0651***
(0.0165) (0.0248)
Shale Revolution -0.130 0.368***
(0.136) (0.0885)
Trump Administration 0.130 0.192
(0.147) (0.124)
N Observations 189 189
Primary Regions Fixed Effects yes yes
Number of Primary Regions 11 11
*** p<0.01, ** p<0.05, * p<0.1
Table 5 presents the results for the sample of domestic transactions across 11 regions of the U.S (per year per
region per total deal counts). The dependent variable is the number of transactions, i.e., deal count data from the
announced M&A transactions between 2000 and 2019. The independent variables are: interest rate spreads, S&P
500 price index, oil, and gas production growth of the U.S, (WTI) crude oil and (Henry Hub) natural gas prices.
Additionally, dummy variables account for the shale revolution for the period of 2011-2019, and for Trump’s
election and administration 2017-2019. Robust standard errors are shown in parentheses. For the Poisson
regression model with 1y-lag independent variables, we adapt our independent variables as lagged determinants.
There is a statistically significant relationship between M&A activity and industry-specific
variables, as well as capital market liquidity performance, i.e., the interest rate spread, annual FRED
CPFF. However, technology, political environment and stock market have no significant association
with upstream M&A activity. Our results indicate that oil and gas price (with one exception, see in
column 1, natural gas price) and oil and gas production growth affect upstream M&A transactions. Thus,
our findings partially support hypothesis 2 and 3 and reject hypothesis 1. Surprisingly, one of the
industry-specific explanatory variables, O&G production growth is negatively associated with M&A
activity. This poses a contradictory finding to the study of Hsu et al., (2017). This difference can be
explained by the following reasons: first we apply a longer sample period than Hsu et al., (2017) and
extend the period from 2000 until 2019 where the development of variables changes over time. More
precisely, the trends in O&G production growth change over two decades. Figure 4 plots the
development of O&G production levels and M&A deal counts. As shown, the development of M&A
activity and O&G production growth is adverse for the first decade of the sample period and this negative
association impacts the overall outcome. Additionally, we test our hypotheses for the same period used
in Hsu et al., (2017) based on our M&A data set (please see the table 10). The results show that upstream
M&A activity has a positive association with O&G production growth between 2004 and 2013. It
confirms that our results are generally consistent with Hsu et al. (2017) and suggest that the differences
are caused by the development of industry-specific variables over time.
Even though O&G production was declining in the first half of the sample period, we observe
higher and increasing M&A activity. This could be also caused by investors anticipating technological
advancements to exploit shale oil and gas already at the time before shale boom in the U.S. For instance,
it has seen that some of the acquisitions of assets, or acquisition of privately owned-lands, resources,
and leases contracts or players merging to increase their effectiveness and operations scale to
unconventional oil and gas already happened earlier in 2008. In contrast to the first half of the sample
period, M&A activity is more sluggish in the second half of the sample period and not increasing parallel

15
to the surging O&G production in the U.S. This is in line with decreasing oil prices, for instance, between
2012 and 2016.
Figure 4: The U.S upstream O&G M&A development vs. O&G production growth %
Source: The deal count is a partial sample which is derived from IHS Markit transactions database,
O&G production growth is based on EIA, 2020.
Concerning the relationship between financial and macroeconomic market variables, higher
interest rate spreads have a negative impact on M&A activity because many are financed by debt. In
contrast, The S&P 500 index price, used as a proxy for stock market performance, shows no significant
effect. Although high stock market prices are expected to be positively associated with companies’ value
or value of the assets, it does not show a strong association with upstream O&G M&A deal counts in
the U.S. A possible explanation is that O&G M&A transactions react much more strongly to the
commodity-prices than to the developments of the overall stock-market which are negatively related to
oil prices. Not surprisingly, O&G M&A include more commodity price driven acquisitions (Ng and
Donker, 2012; Cox and Ng, 2016). Therefore, our findings partially support the hypothesis 2.
Surprisingly, the shale revolution has no significant impact, at least in Column [1]. However,
accounting for the time-lag by using a one period lag (Column [2]), the results show that the shale
revolution contributed to the M&A activity. Similarly, even though Trump administration’s support for
the domestic oil and gas industry, compared to the Obama administration, there is no significant impact
on M&A deal counts after 2017. On one hand, this could be explained by the fact that upstream O&G
is a highly asset-intensive industry and acquisitions of unconventional assets and corporate deals have
already taken place in advance instance, before Trump´s administration. On the other hand, the real
impact might be seen in some specific region-level data, for instance, where the certain fields and
investments were supported commercially, privately and by the government ‘initiative.
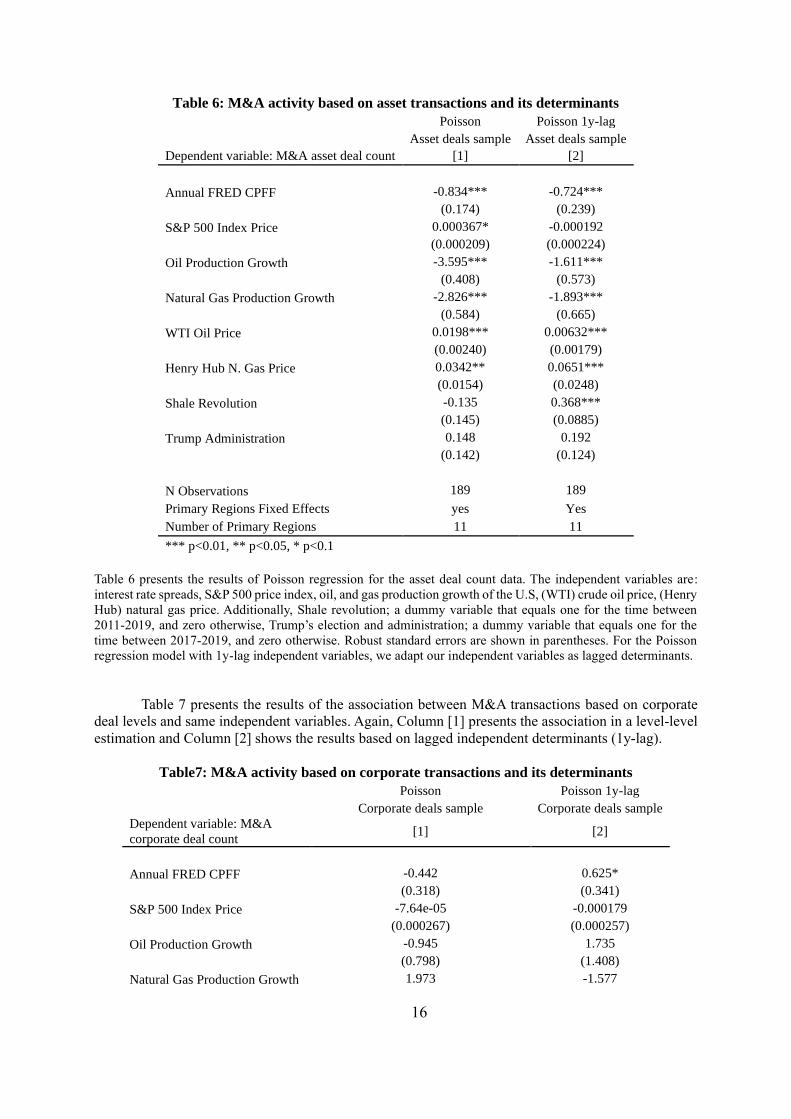
5.2 Upstream M&A activity – subsamples Next, we exploit our granular data set and take a deeper look at different types of M&A transactions.
Table 6 presents our findings. Column [1] shows the results again on a level-level specification. Column
[2] shows results based on lagged-independent (1y-lag) variables for the same model as the dependent
variable is asset transactions. The results show the similar findings as presented for the overall M&A
activity and its determinants as in the previous table 6.
-10%
-5%
0%
5%
10%
15%
20%
0
50
100
150
200
250
300
350
400
O&
G P
rod
uct
ion
Gro
wth
in
%
Dea
l C
ou
nts
The U.S Upstream M&A Deal Counts vs. O&G Production Growth %
M&A Deal Count (Yearly) Oil Production Growth Natural Gas Production Growth
16
Table 6: M&A activity based on asset transactions and its determinants
Poisson Poisson 1y-lag
Asset deals sample Asset deals sample
Dependent variable: M&A asset deal count [1] [2]
Annual FRED CPFF -0.834*** -0.724***
(0.174) (0.239)
S&P 500 Index Price 0.000367* -0.000192
(0.000209) (0.000224)
Oil Production Growth -3.595*** -1.611***
(0.408) (0.573)
Natural Gas Production Growth -2.826*** -1.893***
(0.584) (0.665)
WTI Oil Price 0.0198*** 0.00632***
(0.00240) (0.00179)
Henry Hub N. Gas Price 0.0342** 0.0651***
(0.0154) (0.0248)
Shale Revolution -0.135 0.368***
(0.145) (0.0885)
Trump Administration 0.148 0.192
(0.142) (0.124)
N Observations 189 189
Primary Regions Fixed Effects yes Yes
Number of Primary Regions 11 11
*** p<0.01, ** p<0.05, * p<0.1
Table 6 presents the results of Poisson regression for the asset deal count data. The independent variables are:
interest rate spreads, S&P 500 price index, oil, and gas production growth of the U.S, (WTI) crude oil price, (Henry
Hub) natural gas price. Additionally, Shale revolution; a dummy variable that equals one for the time between
2011-2019, and zero otherwise, Trump’s election and administration; a dummy variable that equals one for the
time between 2017-2019, and zero otherwise. Robust standard errors are shown in parentheses. For the Poisson
regression model with 1y-lag independent variables, we adapt our independent variables as lagged determinants.
Table 7 presents the results of the association between M&A transactions based on corporate
deal levels and same independent variables. Again, Column [1] presents the association in a level-level
estimation and Column [2] shows the results based on lagged independent determinants (1y-lag).
Table7: M&A activity based on corporate transactions and its determinants
Poisson Poisson 1y-lag
Corporate deals sample Corporate deals sample
Dependent variable: M&A
corporate deal count [1] [2]
Annual FRED CPFF -0.442 0.625*
(0.318) (0.341)
S&P 500 Index Price -7.64e-05 -0.000179
(0.000267) (0.000257)
Oil Production Growth -0.945 1.735
(0.798) (1.408)
Natural Gas Production Growth 1.973 -1.577

17
(1.651) (1.197)
WTI Oil Price -0.00157 -0.0112*
(0.00369) (0.00574)
Henry Hub N. Gas Price 0.0496 0.119**
(0.0329) (0.0508)
Shale Revolution -0.213 0.193
(0.164) (0.175)
Trump Administration -0.0811 -0.324*
(0.300) (0.197)
N Observations 189 189
Primary Regions Fixed Effects yes Yes
Number of Primary Regions 11 11
*** p<0.01, ** p<0.05, * p<0.1
This table presents the results of Poisson regression models estimated for the corporate deal level transactions. The
dependent variable is corporate deal count data. The independent variables are interest rate spreads, S&P 500 price
index, oil, and gas production growth of the U.S, (WTI) crude oil price, (Henry Hub) natural gas price.
Additionally, Shale revolution; a dummy variable that equals one for the time between 2011-2019, and zero
otherwise, Trump’s election and administration; a dummy variable that equals one for the time between 2017-
2019, and zero otherwise. Robust standard errors are shown in parentheses. For the Poisson regression model with
1y-lag independent variables, we adapt our independent variables as lagged determinants.
The results in Table 7 reject all three hypotheses. Unexpectedly, there is no almost significant
association between industry-specific variables (except the lagged-oil and gas prices), stock and capital
market performance, technology, and politics. Only exceptional observation is that the negative impact
of shale revolution on corporate transactions of the U.S. It can be explained by the increasing trends in
asset reallocations, acquisitions of assets parallel to the domestic revolution of the U.S O&G in the
direction of shale/tight oil and gas resources. Another critical comment here is corporate transactions in
the upstream O&G industry in the U.S slows down during the second half of the sample period. It could
be driven by overall sluggish market and uncertainties for the growing market of unconventional oil and
gas. In general, corporate transactions are riskier which carries the financial liabilities and debt of
acquired or merged companies.
As part of sub-analyses, Tables 8 and 9 present the results based on conventional and
unconventional M&A transactions sample. First, Table 8, Column [1] and Column [2] show the
relationship between variables for the time t and lagged determinants of variables in (1y-lag
determinants) in t-1. The data and results in Column [1] establish a statistically significant association
between conventional M&A transactions and industry-specific variables, for instance, oil and gas prices
and O&G production growth and capital market performance. Moreover, it shows a negative significant
impact of shale revolution which confirms that the introduction of unconventional resource by the shale
revolution reduce the attractiveness of conventional deals in the U.S. Column [2] presents the results of
lagged determinants and its impact on conventional M&A transactions flows. Different between two
analyses is that the stock market performance (S&P 500) in (t-1) has a negative significant impact on
conventional M&A deal flows, see Column [2]. According to Bureau Van Dijk (2018) report on total
M&A flows and its relation to stock market in the U.S; overall stock market performance and M&A
flows follow almost similar patterns and they tend to move together. However, this relationship changes
in the recent years, which also applies O&G M&A flows and stock market. For instance, stock market
S&P 500 index (based on average monthly closings per year) performs upwards and M&A deals in terms
of conventional transactions shows downwards trends which is divergence. (see Figure 5 which shows
the development of S&P 500 and M&A flows).
This turns into a positive association between M&A flows in unconventional transactions and
stock market performance (see below Table 10). In that case, for the O&G industry, we cannot account

18
a strong predictive power of stock market on M&A flows because it also highly depends on cycles and
other factors.
Table 8: M&A activity based on conventional transactions and its determinants
Poisson Poisson 1y-lag
Conventional deals sample Conventional deals sample
Dependent variable: M&A conventional
deal counts [1] [2]
Annual FRED CPFF -1.372*** -1.409***
(0.159) (0.239)
S&P 500 Index Price 0.000115 -0.000273*
(0.000199) (0.000147)
Oil Production Growth -2.923*** -3.144***
(0.748) (0.662)
Natural Gas Production Growth -0.767 -1.787**
(0.689) (0.696)
WTI Oil Price 0.0149*** 0.00884**
(0.00241) (0.00363)
Henry Hub N. Gas Price 0.0467*** 0.0839**
(0.0156) (0.0412)
Shale Revolution -0.395*** -0.0470
(0.114) (0.141)
Trump Administration -0.223 -0.0979
(0.226) (0.175)
N Observations 189 189
Primary Regions Fixed Effects Yes Yes
Number of Primary Regions 11 11
*** p<0.01, ** p<0.05, * p<0.1
This table presents the results of Poisson regression models estimated for the conventional M&A transactions. The
dependent variable is conventional deal count data. Robust standard errors are shown in parentheses. For the
Poisson regression model with 1y-lag independent variables, we adapt our independent variables as lagged
determinants.
0
500
1000
1500
2000
2500
3000
3500
0
50
100
150
200
250
300
350
S&
P 5
00
In
dex
Dea
l C
ou
nts
M&A Deal Counts vs. Stock Market Performance
Conventional M&A S&P 500 Index Price

19
Figure 5: The relationship between conventional M&A transactions and stock market performance in the U.S
Source: The deal count is a partial sample which is derived from final transactions sample, S&P 500 index price
is based on EIA, 2020.
The first Column [1] of Table 9 presents the links between unconventional M&A transactions
and independent variables. Column [2] shows the results based on lagged (1-y lag) determinants. The
results support our analysis that industry-specific environment, stock and capital market, and technology
and politics affect unconventional upstream transactions.
Table 9: M&A activity based on unconventional transactions and its determinants
Poisson Poisson 1y-lag
Unconventional deals sample Unconventional deals sample
Dependent variable: M&A unconventional
deal count [1] [2]
Annual FRED CPFF 0.908*** 1.688***
(0.189) (0.506)
S&P 500 Index Price 0.000799*** -7.52e-05
(0.000201) (0.000327)
Oil Production Growth -4.197*** -0.0797
(0.335) (0.425)
Natural Gas Production Growth -5.234*** -4.811***
(1.214) (1.199)
WTI Oil Price 0.0328*** 0.00686
(0.00504) (0.00497)
Henry Hub N. Gas Price -0.300*** -0.0806
(0.0835) (0.0721)
Shale Revolution -0.0259 1.251***
(0.340) (0.318)
Trump Administration 0.259** -0.0763
(0.120) (0.247)
N Observations 146 146
Primary Regions Fixed Effects Yes Yes
Number of Primary Regions 8 8
*** p<0.01, ** p<0.05, * p<0.1
This table presents the results of Poisson regression models estimated for the unconventional M&A transactions.
The dependent variable is unconventional deal count data. Robust standard errors are shown in parentheses. For
the Poisson regression model with 1y-lag independent variables, we adapt our independent variables as lagged
determinants.
5.3 Robustness As mentioned in previous chapters, our results show some common patterns, but also different
ones compared to Hsu et al., (2017). First, we examine the period of 2000-2019, which is an extension
of the covered period of the study of Hsu et al., (2017), i.e., different than the period of 2004-2013.
Second, our M&A transactions are based on various form of M&A investments which might lead to
different results on the underlying drivers and motivation of the flows. Therefore, we test for the same
period of 2004-2013 as in the paper of Hsu et al. (2017), apply the same regression method and observe
significant coefficients for the lagged (1y-lag) determinants.

20
Table 10 shows similar outcomes to the results of Hsu et al. (2017). The changes of oil and gas
production growth has a positive and significant impact on the M&A transactions in terms of deal counts.
Similarly, changes of oil price and even natural gas prices have a positive impact on M&A transactions.
This shows that the market movements over time creates different impact on the deals, e.g., O&G
production growth between 2000 and 2008 and O&G production growth between 2009-2019. Moreover,
different than Hsu et al., (2017), we find negative and significant impact of stock and capital market
performance on M&A transactions for the period of 2003-2014.
Our results on the motivations of industry-specific environment, stock, and capital market
(financial) environment affect upstream transactions hold true and the result of analysis are robust.
Table 10: Upstream M&A activity and its determinants between 2004 and 2013
Poisson 1y-lag
Full sample
Dependent variable: M&A asset deal count [1]
Annual FRED CPFF -3.781***
(0.628)
S&P 500 Index Price -0.00255***
(0.000452)
Oil Production Growth 3.587***
(1.212)
Natural Gas Production Growth 3.748**
(1.734)
WTI Oil Price 0.0110***
(0.00330)
Henry Hub N. Gas Price 0.258***
(0.0643)
N Observations 89
Primary Regions Fixed Effects yes
Number of Primary Regions 11
*** p<0.01, ** p<0.05, * p<0.1
This table 10 presents the results of Poisson regression models estimated for the M&A transactions in the U.S
between 2004 and 2013. The dependent variable is deal count data. Robust standard errors are shown in
parentheses. For the Poisson regression model with 1y-lag independent variables, we adapt our independent
variables as lagged determinants.
6. Conclusion We investigate potential drivers for mergers and acquisitions in the oil and gas industry, particularly for
upstream sector by adding different perspectives to the ones employed in traditional M&A literature. In
particular, and in the light of prior literature and findings, we find that industry-specific variables and
environment have a strong influence on M&A transactions. At the same time, we examine the impact of
stock and capital market performance. Our estimates are based on the domestic upstream transactions
of the U.S between 2000 and 2019 and its industry-specific, financial market specific indicators. We
also test the impact of recent technological and political changes on M&A transactions in the U.S. For
instance, the U.S has a specific case since the country goes through an enormous industry-level change
with its shale revolution in recent years. Moreover, different than the Obama administration, the Trump
administration offered strong support to the oil and gas industry, its domestic developments and
extensions in the industry, and further investments.

21
The results show that upstream O&G M&A transactions are influenced by commodity-prices,
mainly by oil prices and not a strong impact of natural gas prices. It appears that gas price over this
period has a weak effect on M&A deals. There might be several explanations. Furthermore, O&G
production growth and interest rate spreads have a negative association with M&A deal counts. Although
unconventional O&G production and investments in these resources are increased in the U.S, the
interdependence between production growth and M&A deal counts are not the same for the whole period
of 2000-2019. This corresponds to the strong significant relation between commodity-prices and M&A
transactions which means that the O&G prices cause, relate, and strongly drive the M&A flows in the
U.S. Different than traditional explanations on positive association between stock market valuation and
M&A investments, O&G M&A transactions seem not influenced by the stock market performance,
rather driven by energy market performance, i.e., prices. This line of investigation is like the framework
and results of Ng and Donker (2013) and Hsu et al., (2017). One critical remark is that natural gas prices
do not have a significant impact on the M&A deal counts for each underlying deal-level analysis. This
must be further investigated.
We add sub-analyses based on underlying characteristics of the mergers and acquisitions such
as deal level and deal resource-segment. Our results further suggest the effect of same variables on these
various patterns of upstream O&G M&A transactions. For example, we can distinguish that
unconventional and conventional deals are more sensitive to the stock and capital market environment.
Moreover, our explanatory variables have no significant impact on corporate deal counts. However, this
research and findings are subject to several limitations: First, the deal value information of transactions
is not comprehensively available for all deals and we do not observe the power of changes of our
explanatory variables and their association with M&A deal value. Second, M&A transactions data set
has a major focus to M&A asset deal levels. In other words, it includes mostly transactions that involve
acquisitions of assets, partial acquisitions of assets, acquisitions and mergers of resources, fields and
similar. The data sample could be extended on corporate deal levels. Third, although we can distinguish
various regions of the U.S, due to limitations of region level data collection on production levels, we
run our analyses at aggregate levels. As a further implication and improvement on analysis, O&G
production levels per region can be brought and region level analysis can be added as micro level
implications.
The key implications from this study are that O&G industry-level motivations provide a better
fit in explaining upstream O&G M&A transactions. This is also a valid argument for almost any sub-
analysis of the deal sample to conventional vs. unconventional or corporate vs. asset deals. Similarly,
capital market liquidity market constraints, i.e., increase of interest rate spreads would demotivate
upstream M&A transactions. Technological and political environment are not a strong fit to drive
upstream M&A flows for the years between 2000 and 2019 in the U.S. The findings hold for the
upstream O&G M&A transactions and these underlying motivating facts could differ in another industry.
In the case of U.S and similar countries with abundant natural resources and economies highly linked to
O&G industry, we might expect that our results can have valid inputs. Our study shows a unique example
of well-functioning O&G industry and M&A market. Further, the final point we would like to highlight
in our concluding remarks is that our approach offers practical evidence which could be used by the
investors and other researchers. For instance, we suggest further investigation for the oil and gas industry
and O&G M&A for the period of covid and post-covid pandemic. Together with the energy transition,
climate change, emergence of decarbonization and the Paris Agreement calling for urgent acts by
governments, it is expected to observe changing patterns in dealmaking in the O&G industry,
particularly, the spread of consolidations of upstream companies.

22
References
Achen, C., (2000). Why lagged dependent variables can suppress the explanatory power of other independent
variables. Department of Political Science and Institute for Social Research, University of Michigan. 1-42.
Alfaro, L., Ozcan, S., and Volosovych, V., (2003). Why doesn’t Capital flow from Rich to Poor Countries? An
Empirical Investigation. 1-51. www.jstor.org/stable/40043150.
Abdullayeva, N., V., (2015). Value creation through mergers and acquisitions in energy sector. The Journal of
Economic Sciences: Theory and Practice, 72(1), 61-94.
http://ecosciences.edu.az/view.php?lang=en&menu=journal.
Asa, F., (2016). Strategic implications of oil price volatility for oil and gas companies. 22-76. doi:
10.13140/RG.2.2.22044.72.
Baek, J., and Park, J., (2013-). The asymmertric response of mergers and acquisitions in the North American Oil
and Gas Industry to Oil Price Changes. Review of Economics and Finance, xx, 23-30.
Barkema, H., G., and Vermeulen, F., (1998). International expansion through start-up or acquisition: a learning
perspective. Academic Management Journal, 41, 7-26. www.jstor.org/stable/256894.
Barrare-Rey, F., (1995). The Effects of Vertical Integration on Oil Company Performance. Oxford Institute for
Energy Studies, 1-54. https://www.oxfordenergy.org/wpcms/wp-content/uploads/2010/11/WPM21.
Beer, S., and Loeprick, J., (2015). Profit-shifting: drivers of transfer (mis)pricing and the potential of
countermeasures. International Tax and Public Finance, 22, 426-451. https://doi.org/10.1007/s10797-014-9323-2.
Berntsen et al., (2018). Determinants of oil and gas investments on the Norwegian Continental Shelf. Energy, 148,
904-914. https://doi.org/10.1016/j.energy.2018.01.147.
Boe et al., (2018). Do political risks harm development of oil fields? Journal of Economic Behavirol Organization,
157, 338-358. https://doi.org/10.1016/j.jebo.2018.01.005.
Bonamie, A., Gulen, H., Ion, M., (2018). Does policy uncertainty affect mergers and acquisitions? Journal of
Financial Economics, 129, 531-558. https://doi.org/10.1016/j.jfineco.2018.05.007.
Bos et al., (2018). Oil returns and volatility: The role of mergers and acquisitions. Energy Economics, 71, 62-69,
https://doi.org/10.1016/j.eneco.2018.01.034.
BP Statistical Review of World Energy, (2018/2019). https://www.bp.com/content/dam/bp/business-
sites/en/global/corporate/pdfs/energy-economics/statistical-review/bp-stats-review-2019-full-report.pdf.
(accessed 30 March 2020).
Brug, H., and Sahib, R., P., (2018). Abandoned deals: the merger and acquisition process in the electricity and gas
industry. Energy Policy, 123, 230-239. https://doi.org/10.1016/j.enpol.2018.08.042.
Brown, S. and Yücel, M., (2013). The Shale Gas and Tight Oil Boom: U.S. States’ Economic Gains and
Vulnerabilities. Council on Foreign Relations, 12. https://www.cfr.org/report/shale-gas-and-tight-oil-boom
(accessed 19 August 2021).
Bureau Van Dijk (2018). Moody’s Analytics, Why has M&A activity decoupled from the stock market?
Caiazza, R., and Carbonara, G., (2009). Mergers and Acquisitions: Causes and Effects. Journal of the American
Academy of Business, Cambridge, 14, 188-194. http://www.scribd.com/doc/14358472/Cause-and-Effect-of-
Mergers-Acquisitions.
Cameron, A.C., and Trivedi, P.K., (2013). Regression Analysis of Count Data. Cambridge University Press,
Cambridge.

23
Choi, J., Shin, N., Lee, H., (2020). Exploring the dynamics between M&A activities and industry-level
performance. Sustainability, 12, 4399, 2-24. doi:10.3390/su12114399
Coase, R. (1937). The nature of the firm. Economica, New Series, 4(16), 386-405. doi:10.2307/2626876.
Coval, J., and Moskowitz T. J., (1999). Home Bias at Home: Local Equity Preferences in Domestic Portfolios.
Journal of Finance, 54, 2045–2073. https://doi.org/10.1111/0022-1082.00181.
Dayanadan, A., and Donker, H., (2011). Oil prices and accounting profits of oil and gas companies. International
Review of Financial Analysis, 20, 252-257. https://doi.org/10.1016/j.irfa.2011.05.004.
Deloitte (2019). Transfer pricing in the oil and gas industry,
https://www.internationaltaxreview.com/article/b1f7mxr44cxfg5/transfer-pricing-in-the-oil-and-gas-sector.
(accessed 30 March 2020).
Ding, S., and Fu, X., (2011). Transnational mergers and acquisitions and overseas energy investments. Journal of
PLA Nanjing Institute of Politics, Volume 27(3), 24-27.
Dowling, M., and Vanwalleghem D., (2018). Gulf Cooperation Council cross-border M&A: institutional
determinants of target nation selection. International Business and Finance, 46, 471-489.
https://doi.org/10.1016/j.ribaf.201.
Elheddad, M., (2016/2018). Natural resources and FDI in GCC. International Journal of Business and Social
Research, Volume 6, 1-12. https://EconPapers.repec.org/RePEc:ags:afjecr:274741.
E&Y (2019). EY Transaction Advisory Services. https:// assets.ey.com (accessed 10 December 2019).
Finkelstein, S., and Haleblian, J., (2002). Understanding acquisition performance: the role of transfer effects.
Organization of Science, 13, 36-47. https://doi.org/10.1287/orsc.13.1.36.539.
Gardner, W., Mulvey, E.P., and Shaw, E.C (1995). Regression Analyses of Counts and Rates: Poisson,
Overdispersed Poisson, and Negative Binomial Models, Psychological Bulletin, 118, 392-404.
Ghoddusi, H., and Wirl, F., (2018). Crude or Refined? Rationality of downstream investment for oil-rich
economies. SSRN Electronic Journal. 1-49. doi:10.2139/ssrn.3116172.
Gugler, K., Müller, D., Weichselbaumer, M. (2012). The determinants of merger waves: An international
perspective. International Journal of Industrial Organization, 30, 1-15. doi:10.1016/j.ijindorg.2011.04.006.
Harford, J., (2005) What drives mergers waves? Journal of Financial Economics, 77, 529-560.
https://doi.org/10.1016/j.jfineco.2004.05.004
Hart S., L., (1995). A natural-resources based view of the firm. Academy of Management Review, 20, No.4, 986-
1014. https://doi.org/10.5465/amr.1995.9512280033.
Hofstede, G., (1980). Culture's Consequences: International Differences in Work-Related Values. Sage, Beverly
Hills, CA.
House, R., Javidan, M., Hanges, P., and Dorfman, P., (2002). Understanding cultures and implicit leadership
theories across the globe: an introduction to project GLOBE. Journal of World Business, 37 (1). 3-10.
https://doi.org/10.1016/S1090-9516(01)00069-4.
Hsu, K., Wright, M., and Zhu, Z., (2017). What motivates merger and acquisition activities in the upstream oil and
gas sectors in the U.S? Energy Economics, 65, 240-250. https://doi.org/10.1016/j.eneco.2017.04.028.
Hsu, K., Wright, M., and Zhu, Z., (2014), Merger and Acquisition Activities in the U.S. Oil and Gas Industry.
International Association for Energy Economics, Energy Forum, Vol. 1, 11-15.

24
IHS Markit Connect (2019). https://connect.ihs.com/home (accessed 31 December 2019).
International Trade Center (2018). http://www.intracen.org/ (accessed 31 December 2018).
International Tax Review (2019). https://account.internationaltaxreview.com (accessed 20 December 2019).
Inkpen, A. and Moffett, M. (2011), The Global Oil and Gas Industry: Management, Strategy and Finance, Penn
Well, Corporatian, xx.
Isser, S., (1996). The Economics and Politics of the United States Oil Industry, 1920-1990: Profits, Populism and
Petroleum. New York, Garland Publishing. Book Reviews. https://www.jstor.org/stable/41322809.
Jahangir, R., and Dural, B., (2018). Crude oil, natural gas, and economic growth: impact and causality analysis in
Caspian Sea region. International Journal of Management and Economics, 54(3), 169–184.
https://doi.org/10.2478/ijme-2018-0019.
Jensen, M., (1993). The Modern Industrial Revolution, Exit, and the Failure of Internal Control Systems. THE
Journal of Finance, 48, (3), 831-880. https://doi.org/10.1111/j.1540-6261.1993.tb04022.x.
Jowkow, P.L., (2013). Natural gas: from shortages to abundance in the United States. American Economics Rev.,
103, 338-343.
Kaiser, M., J., and Pulsipher, A., G., (2007). A review of the oil and gas sector in Kazakhstan. Energy Policy, 35,
1300-1314. https://doi.org/10.1016/j.enpol.2006.03.020.
Kang, S. H., Mclver, R., and Yoon, S. M., (2016). Modeling time-varying correlations in volatility between BRICS
and commodity markets. Emerg. Mark. Financ. Trade, 52 (7). 1698-1723.
Kang, N., and Johansson, S., (2000). Cross Border Mergers and Acquisitions: Their role in Industrial Globalization,
OECD Science, Technology and Industry Working Papers. https://doi.org/10.1787/18151965.
Klein, B., Crawford, R., and Alchain, A. (1978). Vertical Integration, Appropriable Rents, and the Competitive
Contracting Process. The Journal of Law & Economics, 21 (2), 297-326. https://www.jstor.org/stable/725234.
Kissin W., D., and Herrera J., (1990). International Mergers and Acquisitions. Journal of Business Strategy, 51-
55. https://doi.org/10.1108/eb060076.
Kogut, B., and Singh, H., (1998). The effect of national culture on the choice of entry mode. Journal of International
Business Studies, 19, 411-432. doi: 10.1057/palgrave.jibs.8490394.
Lafontaine, F., and Slade, M., (2007). Vertical Integration and Firm boundaries: The Evidence. Journal of
Economic Literature, XLV, 629-685. doi: 10.1257/jel.45.3.629.
Lai H., O'Hara S., and Wysoczanska K., (2015). Rationale of internationalization of China's national oil companies:
seeking natural resources, strategic assets, or sectoral specialization. Asia Pacif Bus Rev, 21, 77–95.
LeFort, D., Mauel, G., J., Stiffler, J., (2013). Legal Characteristics of U.S. Oil and Gas Interests and the U.S. Oil
and Gas Lease. Journal Sekiyu Kaihatsu Jihou.
Lucas, R., (1990). Why doesn’t Capital flow from Rich to Poor Countries. American Economic Review 80, 92-
96. https://www.jstor.org/stable/2006549?origin=JSTOR-pdf&seq=1.
Manzon, G. B., Sharp, D. J., and Travlos, N. G., (1994). An empirical study of the consequences of U.S tax rules
for international acquisitions by U.S firms. Journal of Finance, 49, 1893-1904. https://doi.org/10.1111/j.1540-
6261.1994.tb04786.x. Martynova and Renneboog, (2008b). Spillovers of corporate governance standards in cross-border mergers and
acquisitions. Journal of Corporate Finance, 14, 200-223, https://doi.org/10.1016/j.jcorpfin.2008.03.004.

25
Mahoney, J., (2005). Economics foundations of strategy. SAGE Publication, Inc., 109-139,
http://dx.doi.org/10.4135/9781452229850
Megginson, W. L., and Netter, J., M., (2001). From state to market: A survey of empirical studies on privatization.
Journal of Economic Literature, 39(2), 321-389. doi: 10.1257/jel.39.2.321.
Mengchen, G., and Wang, L., (2015). Assessment of oil and gas geopolitical influence. Journal of Geographical
Sciences, 25(3), 369-384. doi: 10.1007/s11442-015-1174-y.
Merton, H., M., and Upton, C., W., (1985). A test of the hotelling valuation principle. Journal of Political
Economics, 93, 1-25.
Mohn, K., and Misund, B., (2009). Investment and uncertainty in the international oil and gas industry. The Journal
of Energy Economics, 30(2), 240-248. https://doi.org/10.1016/j.eneco.2008.10.001.
Murtazashvili, I., (2017). Institutions and the shale boom. Journal of Institutional Economics, 13:1, 189-210.
doi:10.1017/S1744137416000242.
Natural Resource Governance Institute (2015). https://resourcegovernance.org/ (accessed 31 December 2019).
Ng, A., and Donker, H., (2013). Purchasing reserves and commodity market timing as takeover motivates in the
oil and gas industry. Energy Economics, 37, 167-181. http://dx.doi.org/10.1016/j.eneco.2013.01.010.
Ng, A., and Cox, R., (2016). Corporate takeovers in the US oil and gas sector. Journal of Economics and
Financial Studies, 4(1), 23-34. https://doi.org/10.18533/jefs.v4i1.208.
Omorogbe, Y., and Oniemola, P., K., (2010). Property rights in oil and gas under dominal regimes. Property and
the Law in Energy and Naturla Resources. doi:10.1093/acprof:oso/9780199579853.003.0006.
Özgür, Ş.; Wirl, F., (2020). Cross-Border Mergers and Acquisitions in the Oil and Gas Industry: An Overview.
Energies, 13, 5580. https://doi.org/10.3390/en13215580
Perry, M., K., (1989). Vertical Integration: Scale distortions, partial integration, and the direction of price change,
Handbook of Industrial Organization, Amsterdam.
Portes, R., and Rey, H., (2002). The Determinants of Cross-Border Equity Transaction Flows, mimeo.
Reddy, K.S., (2014). Extant reviews on entry-mode/internationalization, mergers & acquisitions, and
diversification: Understanding theories and establishing interdisciplinary research. Pacific Science Review, Vol.
16 (4), 250-274. https://doi.org/10.1016/j.pscr.2015.04.003.
Reddy, K., S., and Xie, E. (2017). Cross-border mergers and acquisitions by oil and gas multinational enterprises:
Geography-based view of energy strategy. Renewable and Sustainable Energy Reviews, 72, 961-980. doi:
10.1016/j.rser.2017.01.016.
Renneboog, I., and Vansteenkiste, C., (2019). Failure and success in mergers and acquisitions. Journal of Corporate
Finance, 58, 650-699. https://doi.org/10.1016/j.jcorpfin.2019.07.010.
Robert Strauss Center (2021). Energy and Security, https://www.strausscenter.org/energy-and-security-project/the-
u-s-shale-revolution/ (accessed 19 August 2021).
Property Rights Alliance (2019). https://www.propertyrightsalliance.org/ (accessed 31 December 2019).
Sabet, A., H., Agda, M., Heaney, R., (2018). Value of investment: Evidence from the oil and gas industry. Energy
Economics, 70, 190-204. https://doi.org/10.1016/j.eneco.2018.01.006.
Shleifer, A., and Vishny, R., (2003). Stock market driven acquisitions, forthcoming, Journal of Financial
Economics.

26
Shimizu, K., Hitt, M., A., Vaidyanath, D., and Pisano V., (2004). Theoretical foundations of cross-border mergers
and acquisitions: A review of current research and recommendations for future. Journal of International
Management, 10, 307-353. https://doi.org/10.1016/j.intman.2004.05.005. Solheim, M., and Tveterås, R. (2017). Benefitting from co-location? Evidence from the upstream oil and gas
industry. The extractive industry and society, Vol. 4, 904-914. https://doi.org/10.1016/j.exis.2017.09.001.
Thomsons Reuters Eikon (2017/2018). https://www.thomsonreuters.com/en/login.html (accessed 20 August
2018).
Yarrow, G., K., (1988). "Privatization: an economic analysis". Mit Press, 18.
Verde, S., (2008). Everybody merges with somebody, the wave of M&A in the energy industry and the EU merger
policy. Energy Policy, 36, 1125-1133, https://doi.org/10.1016/j.enpol.2007.11.023.
Verter, G., (2002). Timing merger waves. Harvard University Mimeo.
Volpin, S., and Rossi, P., F., (2003). Cross-country determinants of mergers and acquisitions. Journal of Financial
Economics, 74, 277-304. doi:10.1016/j.jfineco.2003.10.001.
Weston, J., F., Johnson, B., A., Siu, J., A., (1999). Journal of Energy Finance and Development, 4, 149-183.
https://doi.org/10.1016/S1085-7443(99)00008-3.
Wilson, B., D. (1980). The propensity of Multional Companies to Expand through acquisitions. Journal of
International Business Studies, Vol. 11, 59-65. JSTOR, www.jstor.org/stable/154145.
Williamson, O., (1988). Transaction Cost Economics. How It Works; Where It Headed. Economists, 146, 23-58.
World Top Exports (2019). http://www.worldstopexports.com/worlds-top-export-countries/ (accessed 31
December 2019).
Xie, E., Reddy, K. S., and Jie, L., (2017). Country specific determinants of cross-border mergers and acquisitions:
A comprehensive review and future research directions. Journal of World Business, 52, 127-183.
https://doi.org/10.1016/j.jwb.2016.12.005.
Yang, J.H., Qiu, M.X., Hao, H.N., Zhao, X., Guo, X.X. (2016). Intelligence–Oil and gas industrial development
trend, Oil Forum, 35 (2016), pp. 36-42, 10.3969/j.issn.1002-302x.2016.06.008.