urban climate and climate change in hong...
TRANSCRIPT
ASI1_Opening Remarks 2_5/12/2011
1
Urban Climate and Climate Change in Hong Kong
Hilda LamHong Kong Observatory
5 December 2011
HKOHq
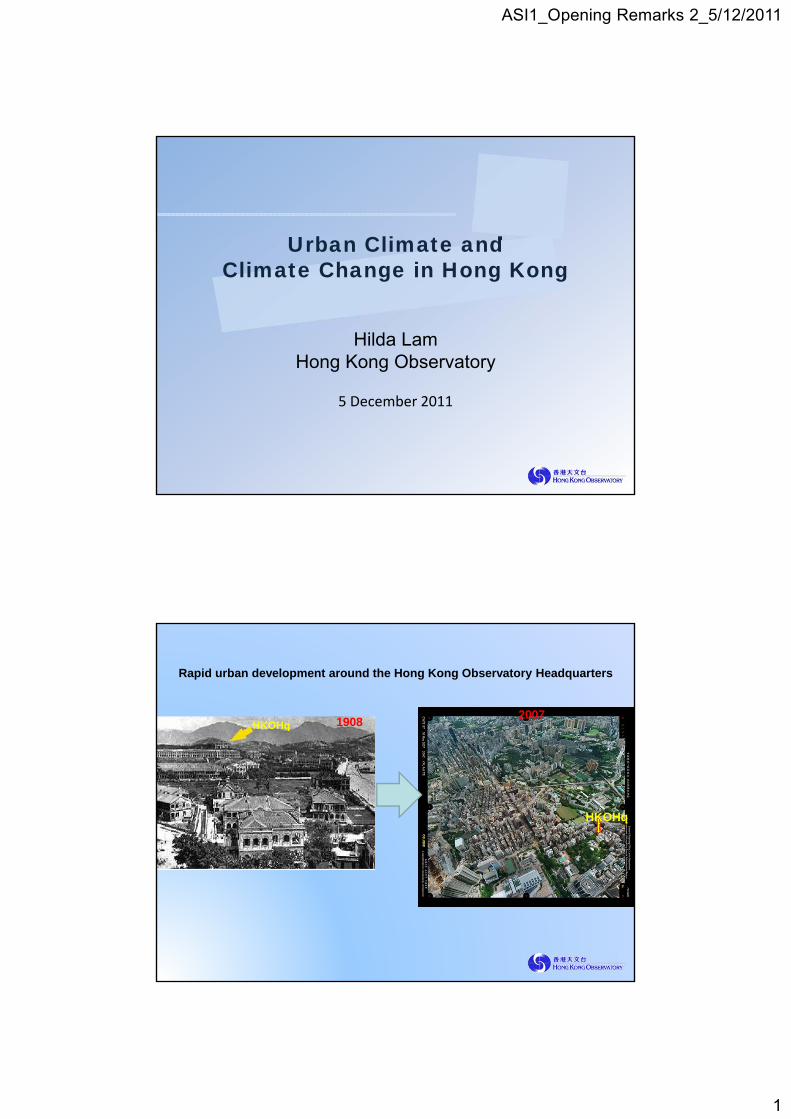
20071908HKOHq
Rapid urban development around the Hong Kong Observatory Headquarters
ASI1_Opening Remarks 2_5/12/2011
2
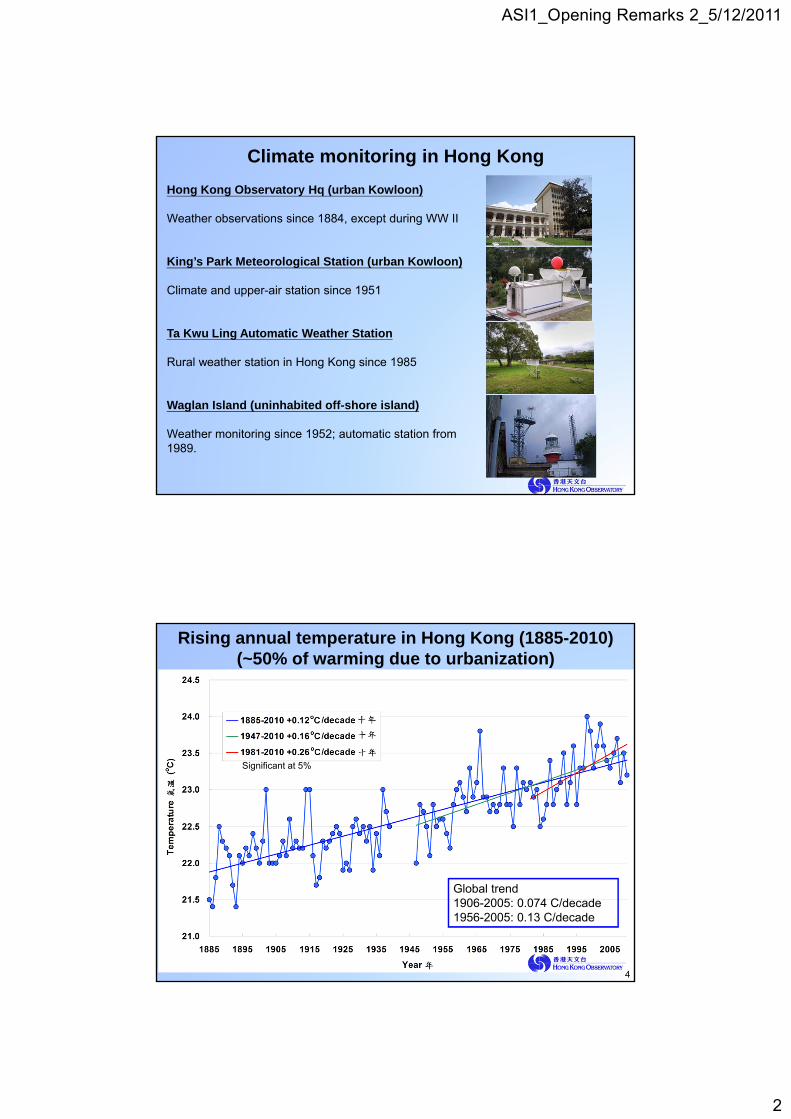
Climate monitoring in Hong Kong
Hong Kong Observatory Hq (urban Kowloon)
Weather observations since 1884, except during WW II
King’s Park Meteorological Station (urban Kowloon)
Climate and upper-air station since 1951
Ta Kwu Ling Automatic Weather Station
Rural weather station in Hong Kong since 1985
Waglan Island (uninhabited off-shore island)
Weather monitoring since 1952; automatic station from 1989.
Rising annual temperature in Hong Kong (1885-2010)(~50% of warming due to urbanization)
4
Significant at 5%
Global trend1906-2005: 0.074 C/decade1956-2005: 0.13 C/decade

ASI1_Opening Remarks 2_5/12/2011
3
Rising annual rainfall in Hong Kong (1885-2010)
5
Significant at 5%
Decreasing no. of rain days (daily rainfall >=1 mm)
6
Significant at 5%
ASI1_Opening Remarks 2_5/12/2011
4
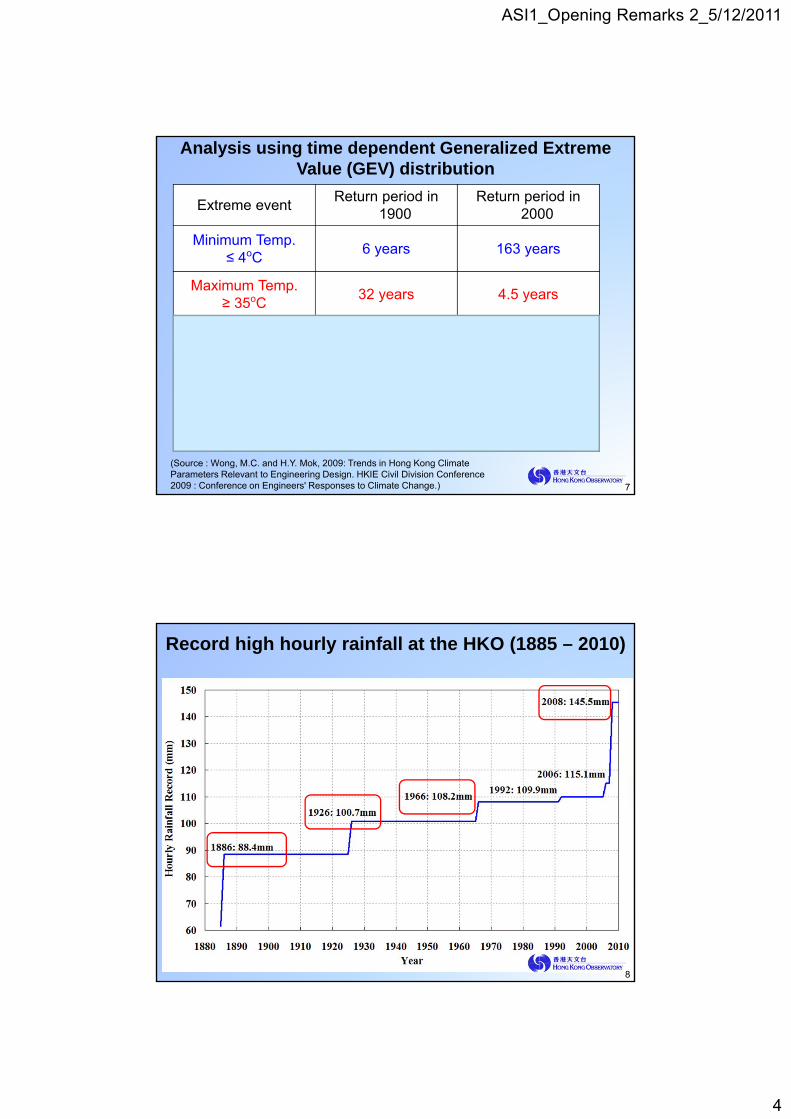
Extreme eventReturn period in
1900Return period in
2000
Minimum Temp.≤ 4oC
6 years 163 years
Maximum Temp. ≥ 35oC
32 years 4.5 years
Hourly rainfall ≥ 100mm
37 years 18 years
2-hourly rainfall ≥ 150mm
32 years 14 years
3-hourly rainfall ≥ 200mm
41 years 21 years
Analysis using time dependent Generalized Extreme Value (GEV) distribution
(Source : Wong, M.C. and H.Y. Mok, 2009: Trends in Hong Kong Climate Parameters Relevant to Engineering Design. HKIE Civil Division Conference 2009 : Conference on Engineers' Responses to Climate Change.) 7
Record high hourly rainfall at the HKO (1885 – 2010)
8
ASI1_Opening Remarks 2_5/12/2011
5
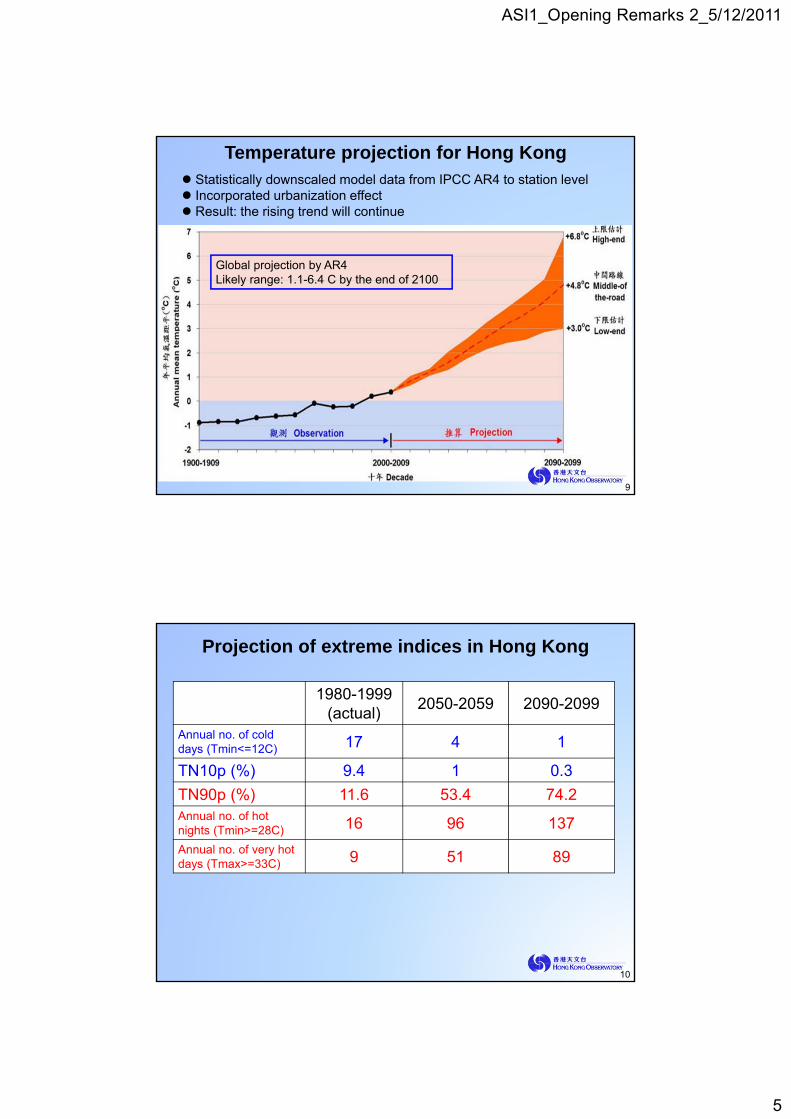
Temperature projection for Hong Kong Statistically downscaled model data from IPCC AR4 to station level Incorporated urbanization effect Result: the rising trend will continue
9
Global projection by AR4Likely range: 1.1-6.4 C by the end of 2100
Projection of extreme indices in Hong Kong
10
1980-1999(actual)
2050-2059 2090-2099
Annual no. of cold days (Tmin<=12C) 17 4 1
TN10p (%) 9.4 1 0.3
TN90p (%) 11.6 53.4 74.2Annual no. of hot nights (Tmin>=28C) 16 96 137
Annual no. of very hot days (Tmax>=33C) 9 51 89
ASI1_Opening Remarks 2_5/12/2011
6
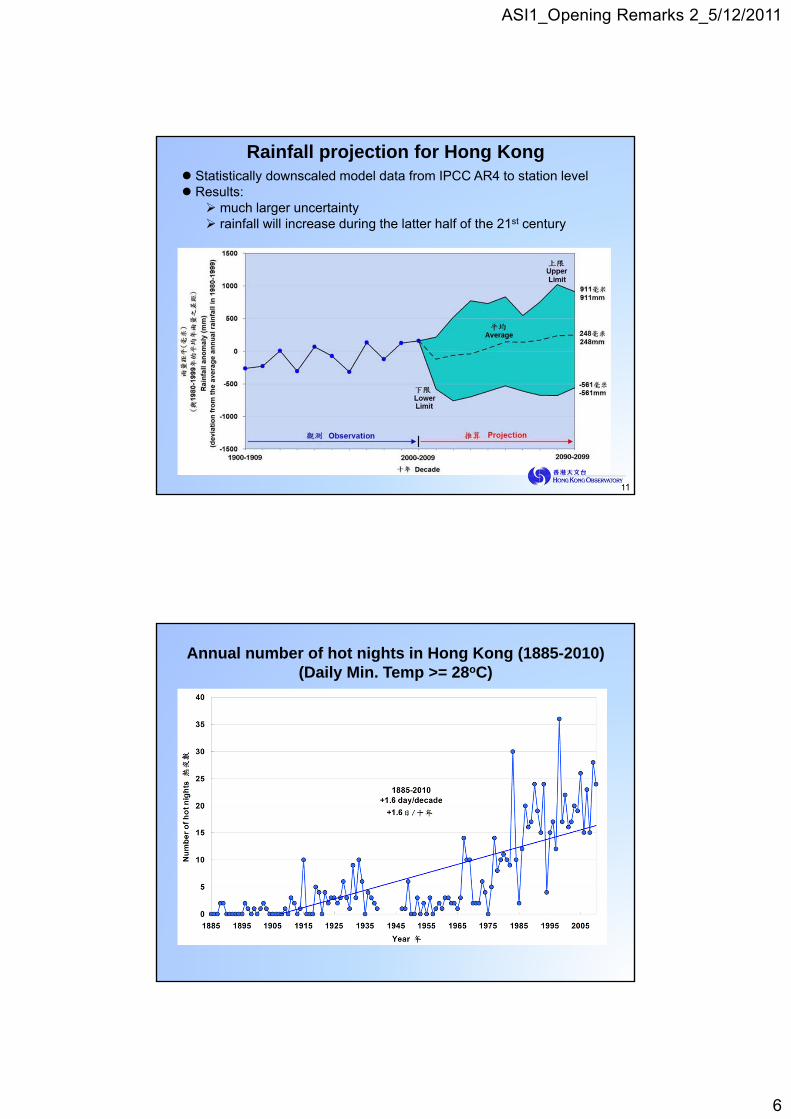
Rainfall projection for Hong Kong Statistically downscaled model data from IPCC AR4 to station level Results:
much larger uncertainty rainfall will increase during the latter half of the 21st century
11
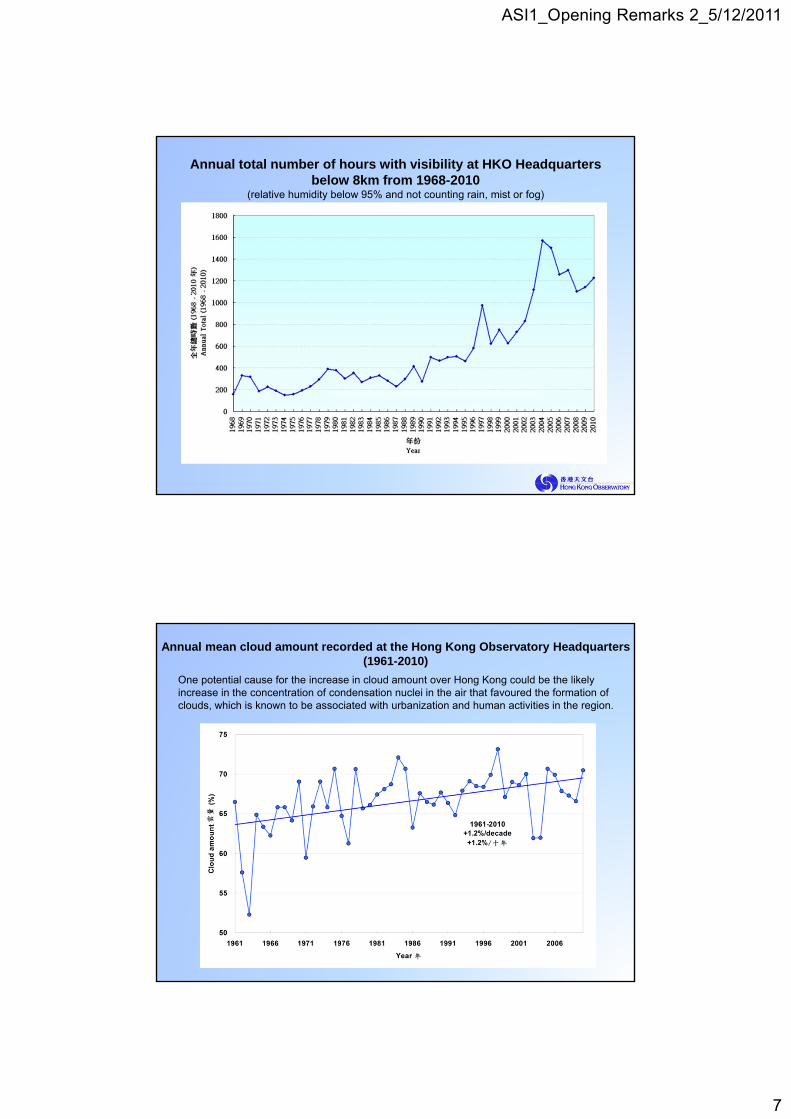
Annual number of hot nights in Hong Kong (1885-2010)(Daily Min. Temp >= 28oC)
ASI1_Opening Remarks 2_5/12/2011
7
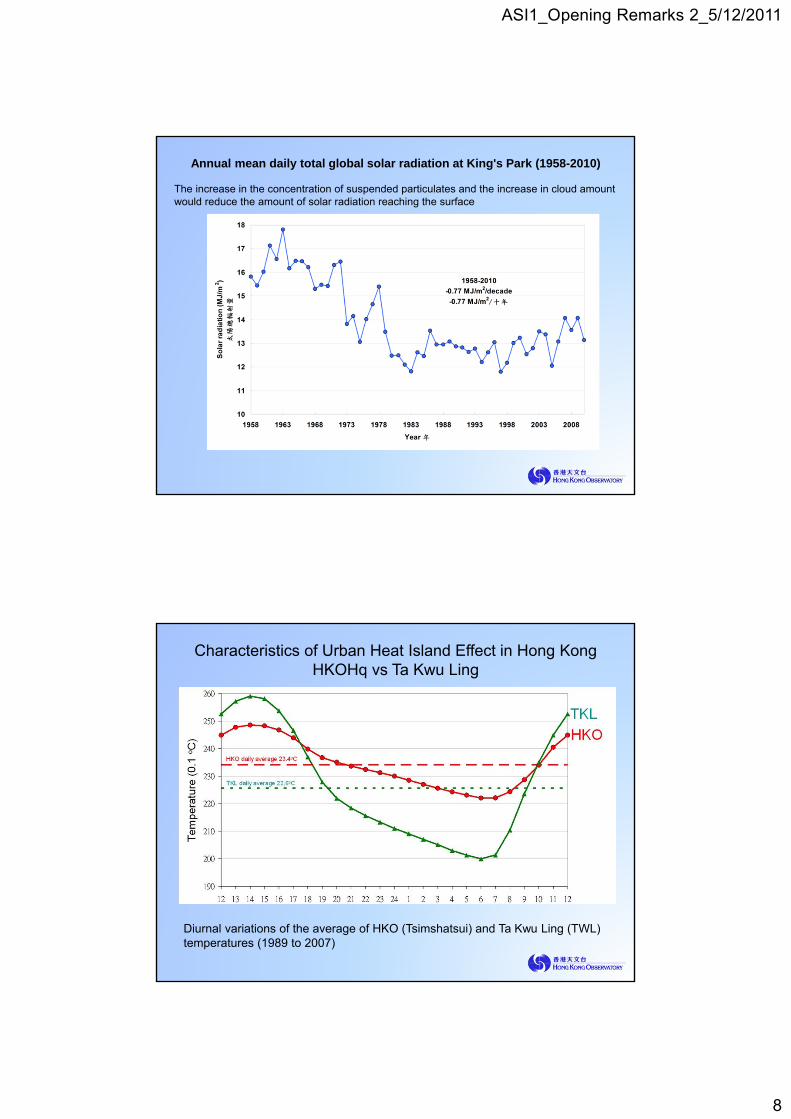
Annual total number of hours with visibility at HKO Headquarters below 8km from 1968-2010
(relative humidity below 95% and not counting rain, mist or fog)
Annual mean cloud amount recorded at the Hong Kong Observatory Headquarters (1961-2010)
One potential cause for the increase in cloud amount over Hong Kong could be the likely increase in the concentration of condensation nuclei in the air that favoured the formation of clouds, which is known to be associated with urbanization and human activities in the region.
ASI1_Opening Remarks 2_5/12/2011
8
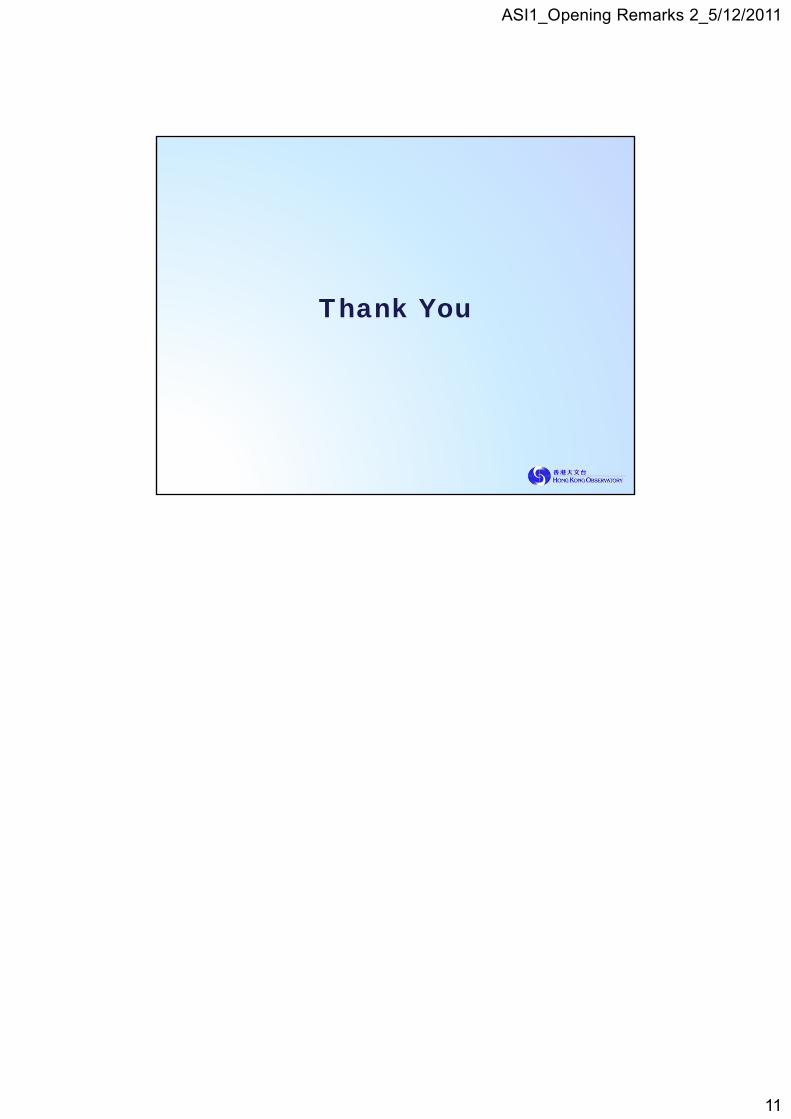
Annual mean daily total global solar radiation at King's Park (1958-2010)
The increase in the concentration of suspended particulates and the increase in cloud amount would reduce the amount of solar radiation reaching the surface
Diurnal variations of the average of HKO (Tsimshatsui) and Ta Kwu Ling (TWL) temperatures (1989 to 2007)
Characteristics of Urban Heat Island Effect in Hong KongHKOHq vs Ta Kwu Ling

ASI1_Opening Remarks 2_5/12/2011
9
Diurnal variations of average Tu-r of Hong Kong in different months (1989-2007)
Tu-r = Tu – Trwhere Tu and Tr are respectively the air temperature of HKO and TKL
Seasonal variations in the UHI intensity
The rainfall over different regions of Hong Kong was generally on a rising trend. The rate was higher over the urban areas than the New Territories, offshore islands and high grounds. Urbanization is one of the possible causes for the rainfall's increasing trend and the regional variation in Hong Kong.
Time series showing the annual rainfall difference between the Urban region and Offshore region (Urban minus Offshore). The solid line indicates the linear trend over the period between 1956 and 2005.
(Source : Regional Rainfall Characteristics of Hong Kong Over the Past 50 Years, H.Y. Mok, Y.K. Leung, T.C. Lee & M.C. Wu. Presented in Conference on "Changing Geography in a Diversified World", Hong Kong Baptist University, Hong Kong, China, 1-3 June 2006, HKO Reprint No. 646)

ASI1_Opening Remarks 2_5/12/2011
10
Annual average of 12-hr 10 minute mean wind speed at King’s Park and Waglan Island (1968-2010)
The wind speed over Hong Kong has a long term steady decreasing trend over urban areas. Dense developments in the urban area increase the roughness of the surface underlying the atmosphere and exert a drag on the low-level air flow.
Climate change in HK = Global climate change + Local urbanization effect
Observed climate change in Hong KongOver the last century
wind speeds decreasing in urban areas
+
ASI1_Opening Remarks 2_5/12/2011
11
Thank You