urban flood mapping by geospatial technique a … (part-3)/g0264351.pdfurban flood mapping by...
TRANSCRIPT

IOSR Journal of Engineering (IOSRJEN)
ISSN: 2250-3021 Volume 2, Issue 6 (June 2012), PP 43-51 www.iosrjen.org
ISSN: 2250-3021 www.iosrjen.org 43 | P a g e
Urban Flood Mapping by Geospatial Technique A Case Study of
Surat City
P. M. Joshi 1, DR. N.K. Sherasia
2, DR. D. P. Patel
3
1(P.G. Student, Civil Engineering Department, L. D. College of Engineering, Gujarat Technological University,
INDIA
2(Associate Professor, Civil Engineering Department, L.D. College of Engineering, Gujarat Technological
University, INDIA,
3(Principal, Dr. Jivraj Mehta Institute of Technology, Gujarat Technological University, INDIA,
ABSTRACT: - Nearly 40 million hectares of land in India is prone to floods. The flood of 2006 caused even
greater damage and also affected states like Gujarat falling in semi-arid and arid agro-climatic region. It is
estimated that a single flood event during 7-14 August 2006 in Surat and Hazira twin-city resulted in 300 people being killed and . 20,000 Crores property damage. The human life was paralyzed for almost 2-weeks and
health problems were reported from several localities in the city municipal limits. Today, new technologies,
such as GIS, GPS, and RS are helping the floodplain managers to create accurate and current floodplain maps
with improved efficiency and speed at a reasonable cost. GIS has excellent capabilities for storing and
manipulating a 3D surface as a DEM, DTM or TIN. The modeled water surface profiles (elevations) can be
imported in a GIS and overlay upon the terrain surface to create flood maps and determine which areas will be
inundated. The present study was undertaken to generate flood inundation map for West Zone area of Surat City
for different flood water level. The West Zone area of Surat City has been surveyed using Trimble Geo explorer
XT global positioning system. Global positioning system (GPS) having sub-meter accuracy was used for
carrying out field surveys. Digital Elevation Model for West Zone area of Surat City is generated by digitizing
contours at 1.0 m interval and GPS Points. Delineation of areas under various degrees of flood potential and
analysis of results is worked out. Above methodology is applied to prepare inundation maps for West Zone of Surat City, a study area. Topography level of TPS No-11, 11-S, 12, 13, 29, 31 and 32 are lower than other TPS
of West Zone. Certain preventive remedial measures are suggested for reducing the effects of flood in the study
area.
Key words: GPS, GIS, DEM, Surat , River Tapi, India
I. INTRODUCTION The Tapi River originates at Multai in Betul district of Madhya Pradesh and flowing through three
states Madhya Pradesh, Maharastra and Gujarat. The map of Tapi river basin is shown in Fig.1.The river has a
total length of 720 km, out of which 208 km lies in the Madhya Pradesh, 323 km in the Maharashtra and the last
lap of the 189 km is in Gujarat and ultimately meets the Arabian Sea in the Gulf of Cambay, which is
approximately 19.2 km west of Surat. It covers the approximately 51504 km2 (79%) in Maharashtra, 9804 km2
(15%) in Madhya Pradesh and 3837 km2 (6%) in the Gujarat state. Surat city is situated at the delta region of
river Tapi (Gujarat State, India). The Ukai dam is constructed at Ukai, Tal: Songadh, Dist: Surat and which is 100 kms away from Surat city as shown in Fig.2. Ukai dam controls the flow of water and water level in the
river Tapi. Ukai dam is constructed for irrigation purpose mainly and also served the purpose of flood control,
generation of hydropower and supply of industrial and drinking water. [6] The Salient features of Ukai
Reservoir as shown in Table No-1. [1] The average rainfall in the catchments area is about 785 mm and average
yearly run off is 17,226 MCM. The Indian Meteorology department predicts the probability of rainfall in the
catchment’s area during next 24 to 48 hours and same information is transferred to Central Water Commission
and media. The rain gauge stations in the catchments are available at different places and wireless stations are
linked with the dam site, which gives the information about rainfall to the Central Water Commission. Due to
sudden release of water from Ukai dam in river Tapi and flood occurs at Surat city frequently. At the time of
floods in river Tapi, Surat city and surrounding region are most affected. [6] The photograph of 2006 flood is
shown in Fig.3. The history of floods at Surat City is shown in Table 2 [1]. The present study was undertaken to generate flood map have been discussed in the paper.

“Urban Flood Mapping by Geospatial Technique A Case Study of Surat City”
ISSN: 2250-3021 www.iosrjen.org 44 | P a g e
Fig. 1.Tapi River Basin
Fig.2. Ukai Dam on Tapi River
Fig.3. Photograph of 2006 flood at Surat
Table 1 : Salient Features of Ukai Reservoir
Sr.
No.
Item Description
1 Location Songadh, (District
Surat)
2 River Tapi
3 Catchment Area 62 225 sq km
4 Design Flood
Discharge
49 490 cumecs
5 Year of
Completion
1972
6 Gross Storage
Capacity
7414.29 MCM
7 Live Storage
Capacity
6729.90 MCM
8 FRL 105.22 m (345 ft)
9 HFL 107 m (351 ft.)
10 MDDL 82.3 m (270 ft)
11 Riverbed level 47.87 m (157.05 ft)
12 Installed Power
Generation
Capacity
305 MW (4 X 75
MW + 2 X 2.5 MW
13 Hydraulic Head 34m to57 m
14 Maximum
Discharge
213 cumecs
Table 2 : Flood Event at Surat
Flood
Event
Discha-
rge (Lac
Cusecs)
Water
Level at
Hop
Bridge
(m)
Period/
Danger level
at Hope
bridge 9.5
1883 10.05 11.05 July
1884 8.46 10.05 September
1894 8.01 10.33 July
1942 8.60 10.56 August
1944 11.84 11.32 August
1945 10.24 11.09 August
1949 8.42 10.49 September
1959 12.94 11.55 September
1968 15.5 12.08 August
1994 5.25 10.10 Aug.-Sep.
1998 7.0 11.40 September
2002 3.25 8.2 September
2006 9.09 12.40 August

“Urban Flood Mapping by Geospatial Technique A Case Study of Surat City”
ISSN: 2250-3021 www.iosrjen.org 45 | P a g e
II. STUDY AREA Surat City is also known as Suryapur is situated on the bank of the Tapti River. The city has been
ranked 95th in the list of world's largest cities and is the 9th largest city of India after Pune with an area of 326.515 Sq.km. Floods are an increasing problems for Surat city, situated at latitude 21° 06’ to 21°15’ N and
longitude 72°45’ to 72°54’ E on the bank of river Tapi having coast line of the Arabian Sea is on its West as
shown in Fig.4. The Surat City is divided in to seven administrative zones by Surat Municipal Corporation as
shown in Fig.4. The city of Surat in Gujarat is known for its textile trade, diamond cutting and polishing
industries and, since 1994, for the Plague, is today known for its strength to convert adversity into advantage.
The outbreak of pneumonic plague in Surat during September 1994 created worldwide panic and severely
affected the city as well as the entire nation’s economy. About 60% of the population fled the city and the
industry suffered an estimated loss of Rs. 12 Billion.The 133-year-old Hope Bridge over river Tapi, the oldest
bridge in the diamond city. Hope Bridge constructed by district collector and magistrate Theodore Hope in 1877
was the only link between two parts of the city -- Chowk Bazaar and Rander. [8] Water level of Tapi River is
measured and recorded at Hope Bridge / Nehru Bridge during monsoon period as shown in Fig.5.
Fig.4. Location Map of Study Area
Fig.5. River Gauge Station at Nehru Bridge / Hope
Bridge, Surat
III. DATA COLLECTION For present work Geo-coded Indian Remote Sensing (IRS-1D) satellite image of April 2005 is used,
source Bhaskracharya Institute for Space Applications and Geoinformatics, Topo-Sheets at 1:50,000 scales
collected from office of Survey of India, High resolution Google-earth image down loaded through internet.
Physical measurements for river hydraulic parameters and Contour maps for various city zones at 1.00 meter interval were collected from Surat Municipal Corporation (SMC). The West Zone area of Surat City has been
surveyed using Trimble Geo explorer XT global positioning system. Differential Global positioning system
(DGPS) having sub-meter accuracy was used for carrying out field surveys. The field surveys were conducted in
T.P. roads of West Zone and on left and right embankments of River Tapi. The GPS point elevation data has
been combined with contour lines and mass points obtained from topo-maps to produce a digital elevation
model (DEM) in ArcGIS software. While applying differential correction process in WZ-1 file, 3961(69.8%)
out of 5677 selected positions were code corrected by post-processing. Print Screen of Sample ESRI Shapefile
Setup for WZ–1 file is shown in Fig.7. [9, 10]
“Urban Flood Mapping by Geospatial Technique A Case Study of Surat City”
ISSN: 2250-3021 www.iosrjen.org 46 | P a g e
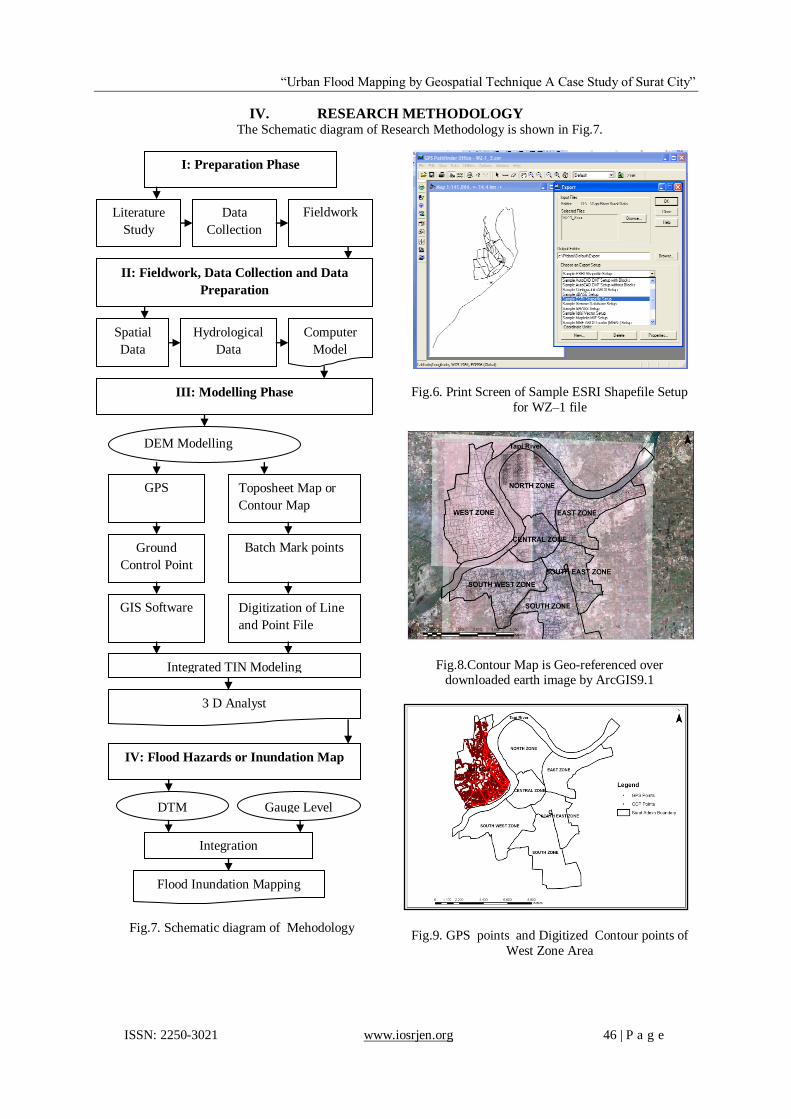
IV. RESEARCH METHODOLOGY The Schematic diagram of Research Methodology is shown in Fig.7.
Fig.7. Schematic diagram of Mehodology
Fig.6. Print Screen of Sample ESRI Shapefile Setup
for WZ–1 file
Fig.8.Contour Map is Geo-referenced over downloaded earth image by ArcGIS9.1
Fig.9. GPS points and Digitized Contour points of
West Zone Area
I: Preparation Phase
Literature
Study
Data
Collection
Fieldwork
II: Fieldwork, Data Collection and Data
Preparation
Spatial
Data
Hydrological
Data
Computer
Model
III: Modelling Phase
DEM Modelling
GPS
Ground
Control Point
GIS Software
Toposheet Map or
Contour Map
Batch Mark points
Digitization of Line
and Point File
Integrated TIN Modeling
3 D Analyst
Digital Terrain Model (DTM)
IV: Flood Hazards or Inundation Map
DTM Gauge Level
Integration
Flood Inundation Mapping

“Urban Flood Mapping by Geospatial Technique A Case Study of Surat City”
ISSN: 2250-3021 www.iosrjen.org 47 | P a g e
V. RESULT ANALYSIS 5.1 Analysis Step
(1) ArcGIS9.1 software is used which requires database in the form of maps. For that, toposheets having scale 1:50000 are collected from Survey of India (SOI) department, Gandhinagar.
(2) Top sheets are then scanned at 400 dpi resolution for Geo-referencing purpose.
(3) Earth images of the study area are downloaded using internet from site Google-Earth and after that availed
image pieces are combined with the help of ERDAS 9.1 which is Geo-referenced by ArcGIS9.1
(4) Required topographical features such as contours, gauge and discharge level data are collected from SMC.
(5) Then contour map is Geo-referenced over the downloaded earth image of the study area and a spatial
adjustment is applied for better accuracy as shown in Fig.8.
(6) Digitization of counters is carried out with the help of GIS software, refer Fig.9.
(7) Spatial and temporal data are there after interlinked using GIS software and customized Data Base
Management System (DBMS).
(8) 3D analyst tool is then used to convert digitized contours into TIN model of study area as shown in Fig.10. While to convert TIN model into DEM interpolation method is applied. Merge DEM of West Zone is
generated as shown in Fig.11.
Fig.10. TIN of West Zone, Surat.
Fig.11. Merge DEM of West Zone, Surat.
(9) In order to find submerge areas in different T.P. Scheme of West Zones at various levels, the surface
analysis is carried out using 3D analyst tool.
(10) The next step after step-9 is the generation of thematic maps and ArcScan is then applied for better
visualization of study area.
(11) Delineation of areas under various degrees of flood potential and analysis of results is worked out. Above
methodology is applied to prepare a flood inundation map for West Zone of Surat city, a study area.
5.2 Inundation Area of West Zone
By comparison of observed and calculated water levels of 2006 flood event at Hope (Nehru) Bridge
and at Kathor river gauging station, we found that maximum water surface level in the West Zone was 4.91 m.
This value comes by subtracting 7.59 m lowest bank reduced level near section RD26-LD26 from 12.50 m river
gauge level near this section. By making comparison graph of Submergence area versus reduced level /water
depth for West Zone is prepared and it is shown in Fig.12. In the graph moving from left to right vertical line
indicate lowest reduced level of right side river bank at junction of Nehru Bridge 7.55 m (threshold value) and
river gauge level of 12.5 m was recorded at Hope Bridge during last flood event of 2006. The area between
these two levels was submerged in the flood of 2006 and for future event; prediction for possible submergence

“Urban Flood Mapping by Geospatial Technique A Case Study of Surat City”
ISSN: 2250-3021 www.iosrjen.org 48 | P a g e
can be done with reference to river gauge level if the other conditions remain same. In this curve a steep slope
represent a high potential and gentle slope represent a low potential of hazards. The slope of curve represents
flood hazard potential in West Zone of Surat city. Rander, Adajan, Jahangirabad –Pisad and Jahngirpura are the
main area of this Zone. Due to the step up development of this Zone, these four well known area of Surat city
fall under different town planning scheme. Rander developed under TPS No.13, 14, 23, 29 and 30.Adajan covered under TPS No.11, 11S, 12, 13, 14, 31and 32 while Jahangirabad is in 42, 43, 44, 45 and 46. Adajan falls
under TPS No.12, 13, 31 having steep slope and it is low lying area of this Zone
Fig.12. Submerged area of West Zone in 2006 flood
5.3 Inundation Area Mapping
In West Zone Area, Inundation is starting after 4.00 meter level and according to that inundation area
of various T.P.S is calculated in square meters at different flood water levels starting from 4.00 meter and up to
13.00 meter at rising interval of 1.00 as shown in Table-3 and Table-4. Inundation maps of West Zone for flood
water level at 5.00 meter and 12.00 meter are shown in Fig.13 and Fig.14 respectively.

“Urban Flood Mapping by Geospatial Technique A Case Study of Surat City”
ISSN: 2250-3021 www.iosrjen.org 49 | P a g e
Fig.13. Inundation Map of West Zone for water level
up to 5.00 meter level
Fig.14. Inundation Map of West Zone for water level
up to 12.00 meter level
VI. VALIDATION FOR DEM Digital Elevation Model of West Zone area of Surat is generated and based on it possible submergence area of
West Zone is identified. Validation of the results obtained for this part is presented here. For validation of the
result, possible submergence depth of the Rander area which is a part of West Zone and falling under TPS
No.13, 14, 23, and 29 is taken as a case. As narrated in the result it starts affected from 4.00 meter water level
and would go in submergence as water level increases. The observed water level at LIC office Rander branch at
Dhanmora Complex was 3.65 m and is shown in Fig.15. Now our DEM shows that reduced level of Rander as
per contour is 8.5 m and as per GPS point is 8.313 as shown in Fig.16 and observed gauge height at Nehru

“Urban Flood Mapping by Geospatial Technique A Case Study of Surat City”
ISSN: 2250-3021 www.iosrjen.org 50 | P a g e
bridge was 12.50m.The difference between these heights as per contour point is 4.0 m and as per GPS point is
4.187m. For cross verification, the photographs of the LIC, Rander branch is shown in Fig.15. Watching it we
can predict that the height is about 3.65 m (12 Ft.). It implies that our prediction for possible submergence of
different TPS area of West Zones by digital elevation model is close to actual one. It is noted that river section
near Nehru Bridge is having reduced level of 7.59 m, and water may spilled from there. Similarly GPS survey carried out from West Zone area, the path is seen in the Fig.16. Comparing reduced level of the point as per
GPS point and digitized contour point at near Dhanmora Complex, Rander, We get difference of 0.187 meter.
Fig.15. Photograph of H.F.L Marking at LIC Building, Rander Branch
Fig.16. Reduced Level and Location for Validation
VII. CONCLUSION In West Zone area, initially the inundation will start at water level above 4.0 meter in the low lying area
of T.P.S. No-12, 13, 31 and inundation area in interval of 4.0 to 5.0 meter level are 13159, 669 and
17457 sq. meter, which is 1.032 %, 0.033 % and 1.72 % of total area of respective T.P.S. No and entire
area will be inundated at 9.0 meter water level.
When water level rise above 10.0 meter level, inundation will be started in the low lying area of T.P.S.
No-45, 46 and inundation area in interval of 10.0 to11.0 meter level are 769184 and 454783 sq. meter
which is 83.82 % and 51.10 % of total area of respective T.P.S. No and entire area of T.P.S. No-45 will
be inundated at 12.0 meter and entire area of T.P.S. No-46 will be inundated at 13.0 meter water level.
When water level will rise at 12.0 meter level, 95.38 % area will be inundated.
12.5 Meter H.F.L. Marking
(As per 2006-Flood)
Flood Inundation Mapping

“Urban Flood Mapping by Geospatial Technique A Case Study of Surat City”
ISSN: 2250-3021 www.iosrjen.org 51 | P a g e
Topography level of TPS No-11, 11-S, 12, 13, 29, 31 and 32 are lower than other TPS area of West
Zone.
The use of GPS, RS and GIS provide supplementary data in Hydrology for analysis and make easy to
interpret and to understand flood phenomena and its characteristics
VIII. ACKNOWLEDGEMENTS Authors are grateful to all staff members of Surat Municipal Corporation, State Data Center,
Government of Gujarat and Survey of India at Gandhinagar for providing helpful data. A special thanks to Mr.
Vasant A. Patel from Bittu Arch Engineers, Surat for providing me hand held GPS receiver (Trimble Geo
explorer XT) for GPS data collection in West Zone area of Surat City and also to provide me their Knowledge
about GPS and sparing his valuable time for me.
REFERENCES [1] Agnihotri, P. G. and Patel J. N,Preparation of flood reduction plan for Surat and surrounding region (India), 3rd IASME/WSEAS
International Conference on Water Resources, Hydraulics & Hydrology, (WHH’08),University of Cambridge, 2008, Vol.3,
Issue2,pg.116.
[2] Garnara,C. J., Patel V. M. and Patel D. P, Urban Flood Mapping by Geospatial technique - A case study of Vadodara city, National
Conference on Current challenges in Civil engineering-2009,Vellamal Engineering College, Chennai.
[3] Gupta, A. K. and Nair S. S, Urban floods in Bangalore and Chennai: risk management challenges and lessons for sustainable urban
ecology, Journal of Current Science, Vol.100, NO.11, 2011, pg.1638- 1645.
[4] Parmar, B.J. and Rao B. M, Flood Control Operation for Ukai Multipurpose Reservoir, Symposium on Reservoir Management in
Tropical and Sub-tropical Regions, Brazil, 2002 pp278-291.
[5] Patel, D. H. and Patel I A “Flood Control Operation of Ukai Multipurpose Reservoir Issues and Need”, Basin-Storming session on
Application of System Techniques for Water Resources Management in India- Current Trends & Future Directions, N.I.H,Roorkee-
247667, 2003, pp.13-31.
[6] Patel, D. P. and Dholakiya M. B, Feasible Structural and Non- Structural Measures to Minimize Effect of Flood in Lower Tapi Basin,
WSEAS Transactioons on Fluid Mechanics Vol. 5, Issue 3, 2010, and pg. 104-121.
[7] Sulebak, J.R.,Applications of Digital Elevation Models DYNAMAP White paper, SINTEF Institute of Applied Mathematics,
Department of Geographic Information Technology, Oslo, 2000.
[8] Surat Municipal Corporation, Surat City Development Plan (2006-2012), 2005.
[9] Trimble Navigation Ltd., Getting Started Guide for GPS Pathfinder office software,2005.
[10] Trimble Navigation Ltd., GPS Pathfinder Systems Receiver Manual, 2001.