urban forestry & urban greening - u.s. forest service · selmi et al. / urban forestry &...
TRANSCRIPT
Ac
WDa
b
c
a
ARRAA
KAEFiUU
1
bo
Aagdp“MoAmrmNv
rc
h1
Urban Forestry & Urban Greening 17 (2016) 192–201
Contents lists available at ScienceDirect
Urban Forestry & Urban Greening
journa l homepage: www.e lsev ier .com/ locate /u fug
ir pollution removal by trees in public green spaces in Strasbourgity, France�
issal Selmi a,∗, Christiane Weber a, Emmanuel Rivière b, Nadège Blond a, Lotfi Mehdi a,avid Nowak c
Laboratoire Image, Ville, Environnement LIVE UMR 7362 (CNRS/Université de Strasbourg), 3 rue de l’Argonne, 67000 Strasbourg, FranceAssociation pour la Surveillance et l’Etude de la Pollution Atmosphérique en Alsace (ASPA), 5 rue de Madrid, 67300 Strasbourg, FranceUSDA Forest Service, Northern Research Station, 5 Moon Library, SUNY-ESF, Syracuse, NY 13210 USA
r t i c l e i n f o
rticle history:eceived 19 March 2015eceived in revised form 22 April 2016ccepted 22 April 2016vailable online 28 April 2016
eywords:ir pollution
a b s t r a c t
This study integrates i-Tree Eco model in order to estimate air pollution removal by urban trees in Stras-bourg city, France. Applied for the first time in a French city, the model shows that public trees, i.e., treesmanaged by the city, removed about 88 t of pollutants during one year period (from July 2012 to June2013): about 1 ton for CO; 14 tons for NO2; 56 tons for O3; 12 tons for PM10coarse (particles with diameterranging from 2.5 to 10 �m); 5 tons for PM2.5 and 1 ton for SO2. Air pollution removal varied mainly withthe tree cover and the level of air pollutants concentrations. Comparison between simulated pollutionremoval rates and local emissions shows that public trees of Strasbourg reduce about 7% of the emit-
nvironmental assessmentrance-Tree Ecorban green spacesrban trees
ted PM10coarse in the city’s atmosphere; however, effect on other air pollutants is small. Thus, our studyreveals that urban trees are a significant element to reduce air pollution but are not the only solution tothis problem. It’s then recommended to associate planting and managing urban forest resources to otherstrategies that take into account the urban environment characteristics: built structures, street design,
etc.
location of local sources;. Introduction
Cities concentrate many problems that can affect human well-eing (Bolund and Hunhammar, 1999).They hold the majorityf human activities and the associated air pollution emissions
Abbreviations: ASPA, “Association pour la Surveillance et l’Etude de la Pollutiontmosphérique en Alsace” (Non-profit organization for monitoring and studyingtmospheric pollution in Alsace); CIGAL, “Coopération pour l’information géo-raphique en Alsace” (Cooperation for geographic information in Alsace); DBH,iameter at breast height; EEA, European Environment Agency; EMEP/EEA, Euro-ean Monitoring and Evaluation Program/European Environment Agency; EMS,Eurométropole de Strasbourg”(Eurometropolis of Strasbourg); LAI, Leaf Area Index;
EDDE, “Ministère de l’Écologie, du Développement Durable et de l’Énergie”(Ministryf ecologysustainable development and energy); NOAA, National Oceanic andtmospheric Administration; PADD, “Projet d’Aménagement et de Développe-ent Durable” (Project of Planning and Sustainable Development); SERTIT, “Service
égional de traitement d’image et de télédétection” (Regional Service of Image Treat-ent and Remote Sensing); UFORE, Urban Forest Effects Model; UNEP, “Unionational des Entreprises du Paysage”(national union of landscape companies); VOC,olatile organic compounds; WHO, World Health Organization.� This study is a first-time estimate in France that assesses the role of urban trees toeduce air pollution. Comparison of removal rates with emissions rates in Strasbourgity shows that trees modestly remove air pollution.∗ Corresponding author.
E-mail address: [email protected] (W. Selmi).
ttp://dx.doi.org/10.1016/j.ufug.2016.04.010618-8667/© 2016 Published by Elsevier GmbH.
© 2016 Published by Elsevier GmbH.
with consequent adverse health effects including pre-mature mor-tality and morbidity from cardiovascular and respiratory causes(Brunekreef and Holgate, 2002; Heinrich and Wichmann, 2004;WHO, 2006; Rückerl et al., 2011). Despite efforts conducted byEuropean countries (EU) to reduce air pollutant emissions andimprove air quality, urban population are still exposed to highlevels of pollutant concentrations that exceed the EU standardsto protect human health. For instance, the European Environ-ment Agency (EEA) shows that during 2010 and 2012 respectively21–30% and 64–83% of the European urban citizens were exposedto particulate matter concentrations above the EU daily limit val-ues (50 �g/m3) and the World Health Organization (WHO) annualreference level (20 �g/m3) (EEA, 2014a). In 2011, fine particulatematter (PM2.5) concentrations caused about 458 000 prematuredeaths in Europe (EEA, 2014a). France is no exception to air pol-lution issues; in 2012 about 5.4% of urban population in Franceis exposed to PM10 concentrations above the EU daily limit value(50 �g/m3) (EEA, 2014b). In addition, a recent study conductedin Paris between 2007 and 2011 analyzed the link between theincreased air pollution and hospital admission. An increase of NO2,
PM2.5 and PM10coarse caused a 1.8%, 2.1% and 3.2% increase, respec-tively, in hospital consultations associated to asthma attacks amongchildren between 2 and 14 years of age (Chatignoux and Host,2013).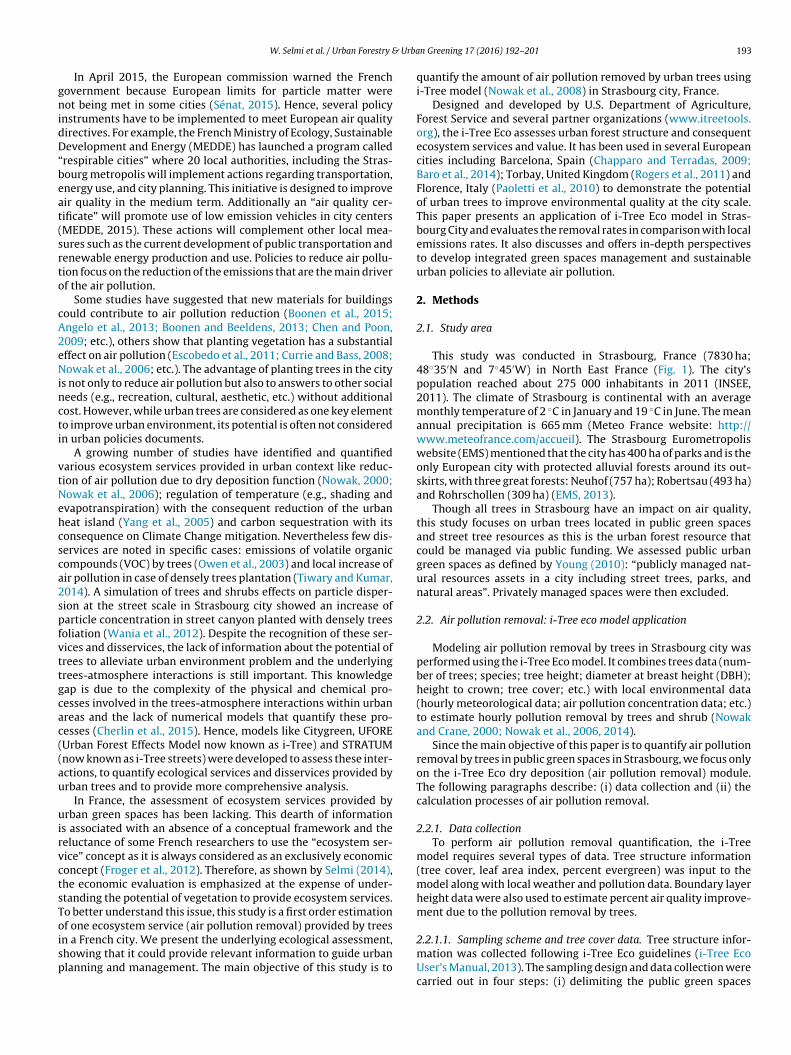
Urba
gnidD“beat(srto
cA2eNincti
vtNehcsca2spfvttgcac((au
uirvctsToisp
W. Selmi et al. / Urban Forestry &
In April 2015, the European commission warned the Frenchovernment because European limits for particle matter wereot being met in some cities (Sénat, 2015). Hence, several policy
nstruments have to be implemented to meet European air qualityirectives. For example, the French Ministry of Ecology, Sustainableevelopment and Energy (MEDDE) has launched a program called
respirable cities” where 20 local authorities, including the Stras-ourg metropolis will implement actions regarding transportation,nergy use, and city planning. This initiative is designed to improveir quality in the medium term. Additionally an “air quality cer-ificate” will promote use of low emission vehicles in city centersMEDDE, 2015). These actions will complement other local mea-ures such as the current development of public transportation andenewable energy production and use. Policies to reduce air pollu-ion focus on the reduction of the emissions that are the main driverf the air pollution.
Some studies have suggested that new materials for buildingsould contribute to air pollution reduction (Boonen et al., 2015;ngelo et al., 2013; Boonen and Beeldens, 2013; Chen and Poon,009; etc.), others show that planting vegetation has a substantialffect on air pollution (Escobedo et al., 2011; Currie and Bass, 2008;owak et al., 2006; etc.). The advantage of planting trees in the city
s not only to reduce air pollution but also to answers to other socialeeds (e.g., recreation, cultural, aesthetic, etc.) without additionalost. However, while urban trees are considered as one key elemento improve urban environment, its potential is often not consideredn urban policies documents.
A growing number of studies have identified and quantifiedarious ecosystem services provided in urban context like reduc-ion of air pollution due to dry deposition function (Nowak, 2000;owak et al., 2006); regulation of temperature (e.g., shading andvapotranspiration) with the consequent reduction of the urbaneat island (Yang et al., 2005) and carbon sequestration with itsonsequence on Climate Change mitigation. Nevertheless few dis-ervices are noted in specific cases: emissions of volatile organicompounds (VOC) by trees (Owen et al., 2003) and local increase ofir pollution in case of densely trees plantation (Tiwary and Kumar,014). A simulation of trees and shrubs effects on particle disper-ion at the street scale in Strasbourg city showed an increase ofarticle concentration in street canyon planted with densely trees
oliation (Wania et al., 2012). Despite the recognition of these ser-ices and disservices, the lack of information about the potential ofrees to alleviate urban environment problem and the underlyingrees-atmosphere interactions is still important. This knowledgeap is due to the complexity of the physical and chemical pro-esses involved in the trees-atmosphere interactions within urbanreas and the lack of numerical models that quantify these pro-esses (Cherlin et al., 2015). Hence, models like Citygreen, UFOREUrban Forest Effects Model now known as i-Tree) and STRATUMnow known as i-Tree streets) were developed to assess these inter-ctions, to quantify ecological services and disservices provided byrban trees and to provide more comprehensive analysis.
In France, the assessment of ecosystem services provided byrban green spaces has been lacking. This dearth of information
s associated with an absence of a conceptual framework and theeluctance of some French researchers to use the “ecosystem ser-ice” concept as it is always considered as an exclusively economiconcept (Froger et al., 2012). Therefore, as shown by Selmi (2014),he economic evaluation is emphasized at the expense of under-tanding the potential of vegetation to provide ecosystem services.o better understand this issue, this study is a first order estimationf one ecosystem service (air pollution removal) provided by trees
n a French city. We present the underlying ecological assessment,howing that it could provide relevant information to guide urbanlanning and management. The main objective of this study is to
n Greening 17 (2016) 192–201 193
quantify the amount of air pollution removed by urban trees usingi-Tree model (Nowak et al., 2008) in Strasbourg city, France.
Designed and developed by U.S. Department of Agriculture,Forest Service and several partner organizations (www.itreetools.org), the i-Tree Eco assesses urban forest structure and consequentecosystem services and value. It has been used in several Europeancities including Barcelona, Spain (Chapparo and Terradas, 2009;Baro et al., 2014); Torbay, United Kingdom (Rogers et al., 2011) andFlorence, Italy (Paoletti et al., 2010) to demonstrate the potentialof urban trees to improve environmental quality at the city scale.This paper presents an application of i-Tree Eco model in Stras-bourg City and evaluates the removal rates in comparison with localemissions rates. It also discusses and offers in-depth perspectivesto develop integrated green spaces management and sustainableurban policies to alleviate air pollution.
2. Methods
2.1. Study area
This study was conducted in Strasbourg, France (7830 ha;48◦35′N and 7◦45′W) in North East France (Fig. 1). The city’spopulation reached about 275 000 inhabitants in 2011 (INSEE,2011). The climate of Strasbourg is continental with an averagemonthly temperature of 2 ◦C in January and 19 ◦C in June. The meanannual precipitation is 665 mm (Meteo France website: http://www.meteofrance.com/accueil). The Strasbourg Eurometropoliswebsite (EMS) mentioned that the city has 400 ha of parks and is theonly European city with protected alluvial forests around its out-skirts, with three great forests: Neuhof (757 ha); Robertsau (493 ha)and Rohrschollen (309 ha) (EMS, 2013).
Though all trees in Strasbourg have an impact on air quality,this study focuses on urban trees located in public green spacesand street tree resources as this is the urban forest resource thatcould be managed via public funding. We assessed public urbangreen spaces as defined by Young (2010): “publicly managed nat-ural resources assets in a city including street trees, parks, andnatural areas”. Privately managed spaces were then excluded.
2.2. Air pollution removal: i-Tree eco model application
Modeling air pollution removal by trees in Strasbourg city wasperformed using the i-Tree Eco model. It combines trees data (num-ber of trees; species; tree height; diameter at breast height (DBH);height to crown; tree cover; etc.) with local environmental data(hourly meteorological data; air pollution concentration data; etc.)to estimate hourly pollution removal by trees and shrub (Nowakand Crane, 2000; Nowak et al., 2006, 2014).
Since the main objective of this paper is to quantify air pollutionremoval by trees in public green spaces in Strasbourg, we focus onlyon the i-Tree Eco dry deposition (air pollution removal) module.The following paragraphs describe: (i) data collection and (ii) thecalculation processes of air pollution removal.
2.2.1. Data collectionTo perform air pollution removal quantification, the i-Tree
model requires several types of data. Tree structure information(tree cover, leaf area index, percent evergreen) was input to themodel along with local weather and pollution data. Boundary layerheight data were also used to estimate percent air quality improve-ment due to the pollution removal by trees.
2.2.1.1. Sampling scheme and tree cover data. Tree structure infor-mation was collected following i-Tree Eco guidelines (i-Tree EcoUser’s Manual, 2013). The sampling design and data collection werecarried out in four steps: (i) delimiting the public green spaces
194 W. Selmi et al. / Urban Forestry & Urban Greening 17 (2016) 192–201
F city (AM referea
mpwc
wiAmocfITf
eocpswd
2rpt(lh(ml
ig. 1. Location of Strasbourg city, spatial distribution of green spaces within the
apmyindia, 2015; IGN, 2007; CIGAL, 2008; EMS, 2010). (For interpretation of the
rticle).
anaged by municipal services in Strasbourg city; (ii) stratifyingublic green spaces within land use classes, (iii) assessing tree coverithin public green spaces and (iv) generating field sample and
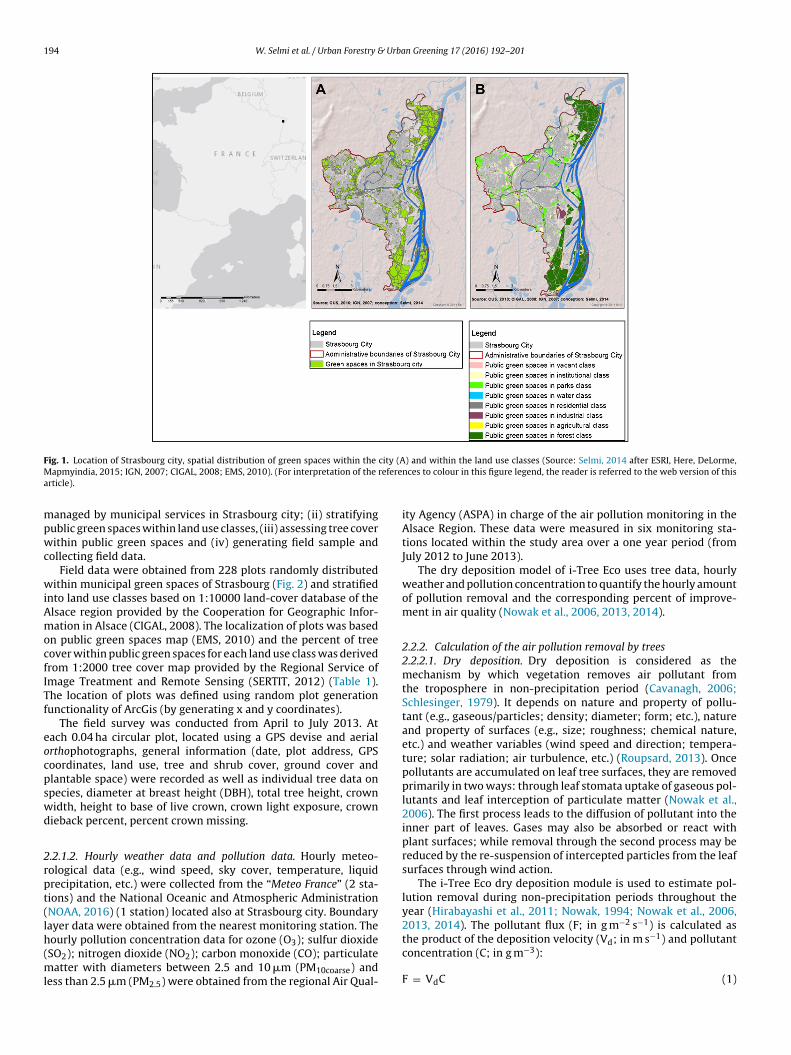
ollecting field data.Field data were obtained from 228 plots randomly distributed
ithin municipal green spaces of Strasbourg (Fig. 2) and stratifiednto land use classes based on 1:10000 land-cover database of thelsace region provided by the Cooperation for Geographic Infor-ation in Alsace (CIGAL, 2008). The localization of plots was based
n public green spaces map (EMS, 2010) and the percent of treeover within public green spaces for each land use class was derivedrom 1:2000 tree cover map provided by the Regional Service ofmage Treatment and Remote Sensing (SERTIT, 2012) (Table 1).he location of plots was defined using random plot generationunctionality of ArcGis (by generating x and y coordinates).
The field survey was conducted from April to July 2013. Atach 0.04 ha circular plot, located using a GPS devise and aerialrthophotographs, general information (date, plot address, GPSoordinates, land use, tree and shrub cover, ground cover andlantable space) were recorded as well as individual tree data onpecies, diameter at breast height (DBH), total tree height, crownidth, height to base of live crown, crown light exposure, crown
ieback percent, percent crown missing.
.2.1.2. Hourly weather data and pollution data. Hourly meteo-ological data (e.g., wind speed, sky cover, temperature, liquidrecipitation, etc.) were collected from the “Meteo France” (2 sta-ions) and the National Oceanic and Atmospheric AdministrationNOAA, 2016) (1 station) located also at Strasbourg city. Boundaryayer data were obtained from the nearest monitoring station. The
ourly pollution concentration data for ozone (O3); sulfur dioxideSO2); nitrogen dioxide (NO2); carbon monoxide (CO); particulateatter with diameters between 2.5 and 10 �m (PM10coarse) andess than 2.5 �m (PM2.5) were obtained from the regional Air Qual-
) and within the land use classes (Source: Selmi, 2014 after ESRI, Here, DeLorme,nces to colour in this figure legend, the reader is referred to the web version of this
ity Agency (ASPA) in charge of the air pollution monitoring in theAlsace Region. These data were measured in six monitoring sta-tions located within the study area over a one year period (fromJuly 2012 to June 2013).
The dry deposition model of i-Tree Eco uses tree data, hourlyweather and pollution concentration to quantify the hourly amountof pollution removal and the corresponding percent of improve-ment in air quality (Nowak et al., 2006, 2013, 2014).
2.2.2. Calculation of the air pollution removal by trees2.2.2.1. Dry deposition. Dry deposition is considered as themechanism by which vegetation removes air pollutant fromthe troposphere in non-precipitation period (Cavanagh, 2006;Schlesinger, 1979). It depends on nature and property of pollu-tant (e.g., gaseous/particles; density; diameter; form; etc.), natureand property of surfaces (e.g., size; roughness; chemical nature,etc.) and weather variables (wind speed and direction; tempera-ture; solar radiation; air turbulence, etc.) (Roupsard, 2013). Oncepollutants are accumulated on leaf tree surfaces, they are removedprimarily in two ways: through leaf stomata uptake of gaseous pol-lutants and leaf interception of particulate matter (Nowak et al.,2006). The first process leads to the diffusion of pollutant into theinner part of leaves. Gases may also be absorbed or react withplant surfaces; while removal through the second process may bereduced by the re-suspension of intercepted particles from the leafsurfaces through wind action.
The i-Tree Eco dry deposition module is used to estimate pol-lution removal during non-precipitation periods throughout theyear (Hirabayashi et al., 2011; Nowak, 1994; Nowak et al., 2006,2013, 2014). The pollutant flux (F; in g m−2 s−1) is calculated as
the product of the deposition velocity (Vd; in m s−1) and pollutantconcentration (C; in g m−3):F = VdC (1)
W. Selmi et al. / Urban Forestry & Urban Greening 17 (2016) 192–201 195
Fig. 2. Location of plots across Strasbourg city (Source: Selmi, 2014 after IGN, 2007).
Table 1Strasbourg City data and sample data.
Land use class Description Total area(ha) Municipal greenspaces area (ha)
Number of plots Sampled trees
Residential Family and mixed residence 1902 54 40 134Institutional Hospital, universities, education and cultural centers, cemeteries 612 197 16 70Industrial Industry, commercial centers, port area 1615 136 8 25Park Parks, squares, open spaces 745 490 40 211Vacant Open spaces available for future urbanization project. 71 10 14 54Agricultural Agricultural fields 668 89 16 44Forest Forest, woodland 1456 1175 91 1417Water Riverbank vegetation 747 20 3 16
(irc
V
tlpc
1
wr
2ar(arv1
Total
Deposition velocities are set to zero in the precipitation periodNowak et al., 2006). For CO, NO2, SO2 and O3 deposition veloc-ties were calculated as the inverse of the sum of aerodynamicesistance (Ra), quasi-laminar boundary layer resistance (Rb), andanopy resistance (Rc):
d = (Ra + Rb + Rc)−1 (2)
The aerodynamic resistance is independent of the air pollutantype. It is calculated using meteorological data while the quasi-aminar resistance and canopy resistance is calculated for each airollutant (Hirabayashi et al., 2015). Hourly canopy resistance wasalculated using the following equation:
/Rc = 1/(rs + rm) + 1/rsoil+1/rt (3)
here rs is the stomatal resistance; rm is the mesophyll resistance;soil is the soil resistance and rt is the cuticular resistance.
The soil resistance was set to 2941s m−1 in growing season and000 s m−1 otherwise (Hirabayashi et al., 2015). Stomatal resistancend cuticular resistance values were set from literature: for NO2,m = 100 s m−1(Hosker and Lindberg, 1982) and rt = 20,000 s m−1
Weseley, 1989); for O3, rm = 10 s m−1 (Hosker and Lindberg, 1982)
nd rt = 10,000 s m−1 (Taylor et al., 1988; Lovett, 1994); for SO2m = 0 (Wesely, 1989) and rt = 8000 s m−1. The canopy resistancealue for COwas set to 50,000 s m−1 in the in-leaf season and,000,000 s m−1 in the out-leaf season (Bidwell and Fraser, 1972).
7815 2171 228 1971
The removal of CO by trees is not related to photosynthesis andtranspiration. For PM10coarse, the deposition velocity was set to0.0064 m s−1 based on data from Lovett (1994) assuming a 50%resuspension rate. For PM2.5 hourly deposition and resuspensionrates are determined based on wind speed and leaf area as detailedin Nowak et al. (2013).
The base deposition velocity (Vd) is then adjusted according tolocal Leaf Area Index (LAI) based on local field data and local sea-son variation (i.e., local leaf-on and leaf-off dates). For deciduoustrees, the calculation of pollution deposition is limited to the in-leaf period. The leaf area index is the total leaf area (m2) divided bytotal canopy cover in city (m2).
Seasonal leaf area variation was estimated using a two-weekperiod around leaf-on and leaf-off dates where the deciduous treeschange from no leaves to full leaf and vice versa. Averages of thesetwo dates were set based on French Phenological CollaborativeDatabase (http://www.gdr2968.cnrs.fr/). In this study, mean leaf-on date was 28/04 and mean leaf-off date was 16/10.
The i-Tree model is a big-leaf multi-layer hybrid model(Baldocchi et al., 1987; Baldocchi, 1988); it does not differentiateeffects among species but rather models the canopy as a whole to
get its overall effect. That is, all canopies with the same leaf areaindex is treated equally and there is no differentiation of speciesin deposition velocities, though species will have differing effectsbased on the amount of leaf area within the study area.
1 Urba
2fi(s(aiA(tacwatoadmbs(
2at(oc(pa(mob
3
3
ouT5bstgi(dm3ctrt1t5rd
96 W. Selmi et al. / Urban Forestry &
.2.2.2. Removal/emission ratio. Annual removal rates obtainedrom i-Tree Eco model were compared to 2012 emission estimatesn Strasbourg city provided by the ASPA agency. Emission estimatesE) are considered as the pollutant flux emitted into the atmo-phere by different sources and activities over a one year periodJagielski and O’Brien, 1994). In Strasbourg city, assessed emissionsre calculated for seven main sectors based on the European Mon-toring and Evaluation Program and the European Environmentgency (EMEP/EEA) air pollutant emission inventory guidebook
EMEP/EEA, 2009): transformation of energy; residential; indus-rial; agricultural; services and commercial; road transportationnd other mode of transportation. Emission estimates are based onoupling “bottom up” and “top-down” approach. The first approach,hich is relevant at the local scale, is based on emission factors
nd local data provided by local sources (e.g., local factories, roadraffic, number of housing) (Citeair, 2011; ASPA, 2014b). The sec-nd approach adjusts results from the bottom-up approach bypplying statistical indicators (e.g., land use; population; etc.) toisaggregate regional, national or continental emissions assess-ents at local scale. In Strasbourg city, the ASPA agency combines
oth “bottom-up” and “top-down” approach to produce an emis-ion inventory and monitor energy consumption of several sectorsASPA, 2014b).
.2.2.3. Air quality improvement. The boundary layer is defineds the region of the atmosphere that is directly influenced byhe Earth’s surface. It could reach few kilometers during daytime1–3 km). The quantity of pollution within this boundary layerver the whole city (g) is calculated as the product of measuredoncentration (g m−3), boundary layer height (m) and city aream2). This extrapolation from ground-layer concentration to totalollution within the boundary layer assumes a well-mixed bound-ry layer, which is common in the daytime (unstable conditions)Colbeck and Harrison, 1985). Hourly percent air quality improve-
ent is estimated as the removed pollution (g) divided by the sumf removed pollution (g) and the quantity of pollution within theoundary layer (g) (Nowak et al., 2006).
. Results
.1. Structure of strasbourg’s public trees
Overall public green spaces occupy about 2171 ha (about 27.80%f the city area). Public green spaces are dominated in forest landses (54.11%) followed by park (22.59%) and institutional (9.08%).he urban forest within public green spaces has an estimated88,000 trees and the total amount of tree cover within Stras-ourg city is about 2750 ha with about 1487 ha in public greenpaces (about 54.07% of total tree cover in the city). Municipalrees cover about 19.02% of the city area and about 68.49% of publicreen spaces area. The highest percent of public tree cover occursn forests (74.97%) followed by parks (15.25%) and institutional3.27%). The low amount of public tree cover is on institutional landue to the domination of grass management. About 338.15 ha ofunicipal green spaces can support tree planting; approximately
7.90% and 33.90% of vacant land use class and parks in the city areonsidered as a plantable area. Urban forest manager could exploithese areas to plant trees (or other plants) to enhance air pollutionemoval and other ecosystem services. Trees with diameters lesshan 15.2 cm constitute 44 percent of the population and about5 percent of Strasbourg trees population has diameters greater
han 70 cm. The majority of large trees (with diameter greater than4 cm) are located in agricultural and vacant class (30.0% and 22.0%espectively), while 49.0% of tree population in forest area hasiameter less than 15.2 cm.n Greening 17 (2016) 192–201
The three most common species are European beech (Fagus syl-vatica) (12.0%), European filbert (Corylus avellena) (11.90%), andEuropean ash (Fraxinus excelsior) (10.0%). Other species consideredas top rated species for improving air quality were: Crimean linden(Tilia Euchlora) (11.0% of common species in institutional class),silver linden (Tilia tomentosa) (9.0% of common species in residen-tial class), London plane (Platanus x acerifolia) (12.0% of commonspecies in residential class) and Ginkgo (Ginkgo biloba) (3.0% ofcommon species in institutional class).
The results of i-Tree Eco model show that municipal greenspace’s leaf area is 90.76 km2 with 51.56 km2 in forest area,25.87 km2 in parks area, 5.22 km2 in institutional class, 3.29 km2
in industrial class, 1.0 km2 in residential class, 0.33 km2 in vacantplaces. The species with the greatest leaf area were European beech(Fagus sylvatica) (14.70%) followed by European ash (Fraxinus excel-sior) (10.10%) and sycamore maple (Acer pseudoplatanus) (10.0%).
3.2. Assessment of trees impact
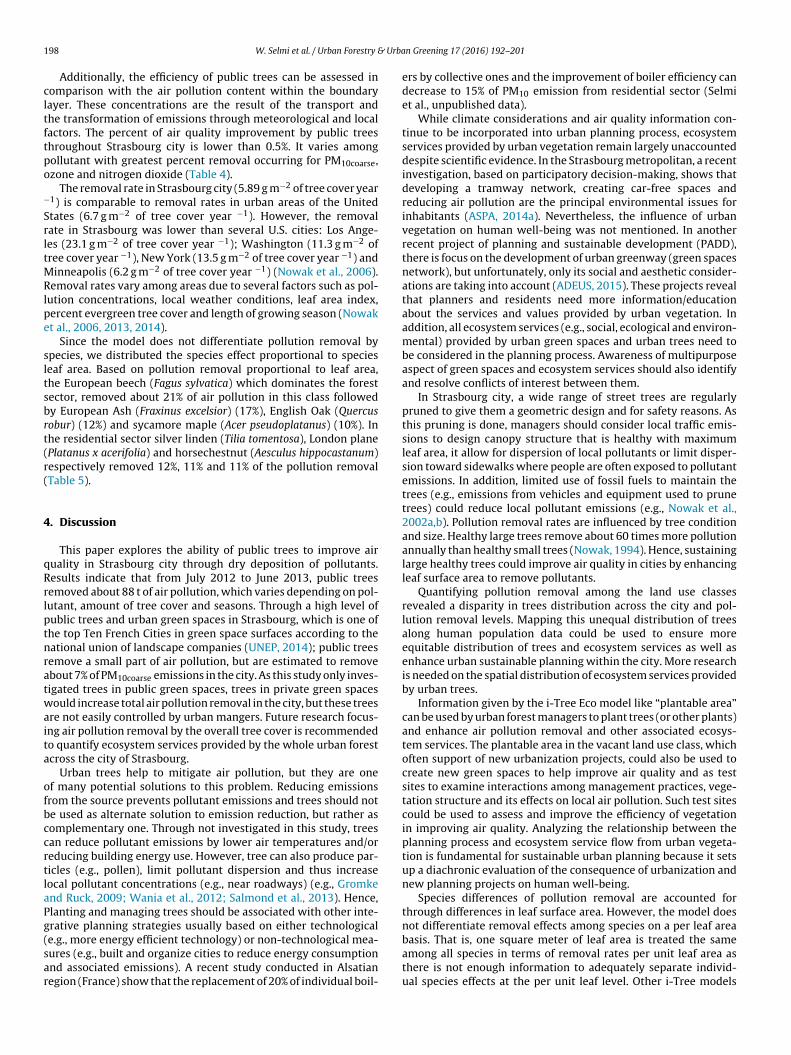
Trees in public green spaces in Strasbourg removed about 88.23 tper year (t year−1) of pollutants from July 2012 to June 2013: 1.20 tyear−1 for CO; 13.84 t year−1 for NO2; 55.88 t year−1for O3; 11.77 tyear−1 for PM10coarse; 4.51 t year−1 for PM2.5 and 1.04 t year−1 forSO2 (Table 3). Pollutant removal varies depending on seasons. Dur-ing the in-leaf season, total estimated pollutant removal was 71.82 tyear−1: 1.07 t year−1 for CO; 8.83 t year−1 for NO2; 48.68 t year−1
for O3, 8.46 t year−1 for PM10coarse, 4.08 t year−1 for PM2.5 and 0.70 tyear−1 for SO2 (Table 2). Therefore, 81% of yearly estimated air pol-lution removal was recorded in the leaf-on season due to the greaterleaf area and often higher pollutant concentrations (e.g., ozone).
The annual pollution removal is calculated by multiplying thetotal tree cover (m2) by the annual pollutant flux (g m−2). Min-imum and maximum estimates of removal of NO2, O3, PM10coarsePM2.5 and SO2 are computed with varying the in-leaf dry depositionvelocities depending on typical range of published values (Lovett,1994).
The amount of pollutant removal varies monthly with peakremoval in September 2012 for CO (0.26 t) and NO2 (1.69 t), in June2013 for O3 (10.66 t), SO2 (0.17 t) and PM10coarse (2.40 t) and in July2013 for PM2.5 (1.02 t) (Fig. 3). This variation is influenced by thein-leaf season, which extends in Strasbourg over six months fromApril to October. Other factors like warmer air temperature andreduced wind speed in the summer season contribute to increaseof air pollutant concentrations and therefore increase depositionvelocities for many pollutants.
In term of annual pollutant removal per square meter of treecover, total pollutant removal was 5.89 g m−2 of tree cover year−1: it was 0.08 g m−2 of tree cover year −1 for CO; 0.92 g m−2 oftree cover year −1 for NO2; 3.73 g m−2 of tree cover year −1 for O3;0.79 g m−2 of tree cover year −1for PM10coarse; 0.30 g m−2 of treecover year −1for PM2.5 and 0.07 g m−2 of tree cover year −1 for SO2.
Total pollution removal varies among land use classes. The forestland use removed the most pollution (50.13 t year−1); followed byparks (25.15 t year−1); institutional lands (5.08 t year−1); industriallands (3.20 t year−1) and agricultural areas (2.62 t year−1). Residen-tial area; water areas and vacant class had the lowest removal at0.98 t year−1; 0.76 t year−1; 0.32 t year−1respectively. This patternof removal is related to the amount of tree cover in each land useclass (Table 3).
A comparison between the amount of pollution removal and theamount of pollution emission in Strasbourg shows that trees withinmunicipal green spaces removed about 0.03% of the emitted CO;
6.60% of the emitted PM10coarse; 1.50% for the emitted PM2.5 and0.50% for the emitted SO2 (Table 4). It is important to note that notall pollution in Strasbourg is derived from local emissions and somepollutants, such as PM2.5, can be formed from chemical reactions.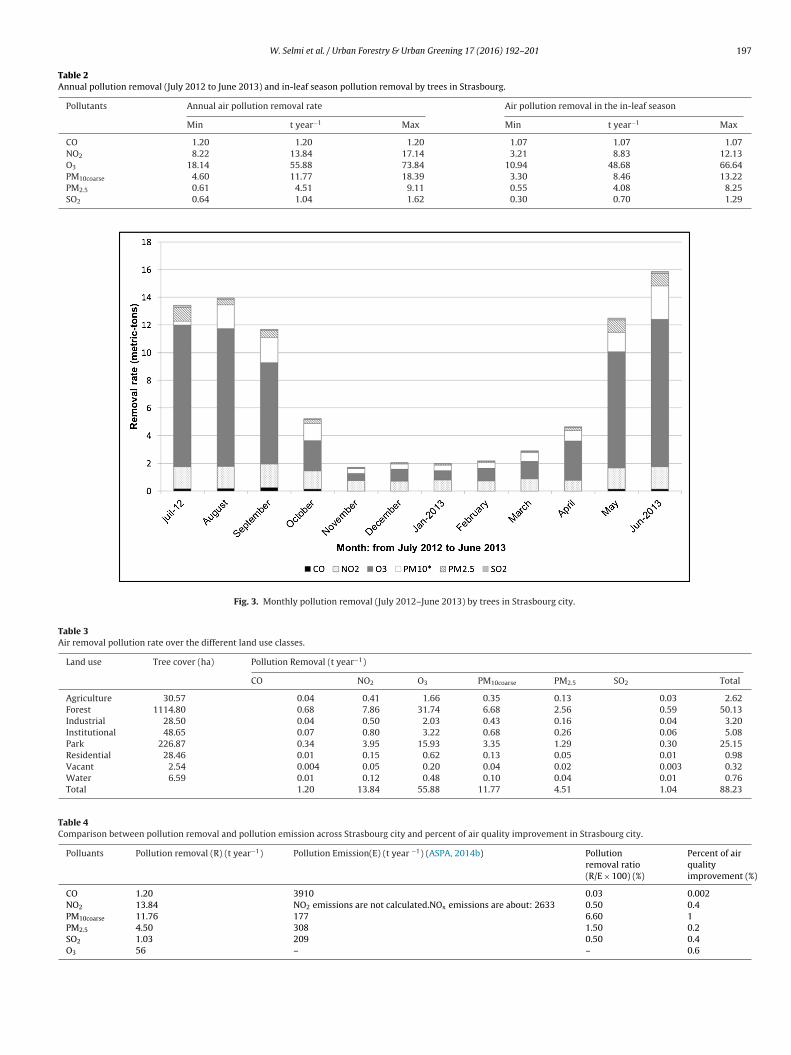
W. Selmi et al. / Urban Forestry & Urban Greening 17 (2016) 192–201 197
Table 2Annual pollution removal (July 2012 to June 2013) and in-leaf season pollution removal by trees in Strasbourg.
Pollutants Annual air pollution removal rate Air pollution removal in the in-leaf season
Min t year−1 Max Min t year−1 Max
CO 1.20 1.20 1.20 1.07 1.07 1.07NO2 8.22 13.84 17.14 3.21 8.83 12.13O3 18.14 55.88 73.84 10.94 48.68 66.64PM10coarse 4.60 11.77 18.39 3.30 8.46 13.22PM2.5 0.61 4.51 9.11 0.55 4.08 8.25SO2 0.64 1.04 1.62 0.30 0.70 1.29
Fig. 3. Monthly pollution removal (July 2012–June 2013) by trees in Strasbourg city.
Table 3Air removal pollution rate over the different land use classes.
Land use Tree cover (ha) Pollution Removal (t year−1)
CO NO2 O3 PM10coarse PM2.5 SO2 Total
Agriculture 30.57 0.04 0.41 1.66 0.35 0.13 0.03 2.62Forest 1114.80 0.68 7.86 31.74 6.68 2.56 0.59 50.13Industrial 28.50 0.04 0.50 2.03 0.43 0.16 0.04 3.20Institutional 48.65 0.07 0.80 3.22 0.68 0.26 0.06 5.08Park 226.87 0.34 3.95 15.93 3.35 1.29 0.30 25.15Residential 28.46 0.01 0.15 0.62 0.13 0.05 0.01 0.98Vacant 2.54 0.004 0.05 0.20 0.04 0.02 0.003 0.32Water 6.59 0.01 0.12 0.48 0.10 0.04 0.01 0.76Total 1.20 13.84 55.88 11.77 4.51 1.04 88.23
Table 4Comparison between pollution removal and pollution emission across Strasbourg city and percent of air quality improvement in Strasbourg city.
Polluants Pollution removal (R) (t year−1) Pollution Emission(E) (t year −1) (ASPA, 2014b) Pollutionremoval ratio(R/E × 100) (%)
Percent of airqualityimprovement (%)
CO 1.20 3910 0.03 0.002NO2 13.84 NO2 emissions are not calculated.NOx emissions are about: 2633 0.50 0.4PM10coarse 11.76 177 6.60 1PM2.5 4.50 308 1.50 0.2
SO2 1.03 209O3 56 –
0.50 0.4– 0.6
1 Urba
cltftpo
−
SrltMRlpe
sltsbrt(r(
4
qRrlptnratwaita
ofbccrtlaPg(sar
98 W. Selmi et al. / Urban Forestry &
Additionally, the efficiency of public trees can be assessed inomparison with the air pollution content within the boundaryayer. These concentrations are the result of the transport andhe transformation of emissions through meteorological and localactors. The percent of air quality improvement by public treeshroughout Strasbourg city is lower than 0.5%. It varies amongollutant with greatest percent removal occurring for PM10coarse,zone and nitrogen dioxide (Table 4).
The removal rate in Strasbourg city (5.89 g m−2 of tree cover year1) is comparable to removal rates in urban areas of the Unitedtates (6.7 g m−2 of tree cover year −1). However, the removalate in Strasbourg was lower than several U.S. cities: Los Ange-es (23.1 g m−2 of tree cover year −1); Washington (11.3 g m−2 ofree cover year −1), New York (13.5 g m−2 of tree cover year −1) and
inneapolis (6.2 g m−2 of tree cover year −1) (Nowak et al., 2006).emoval rates vary among areas due to several factors such as pol-
ution concentrations, local weather conditions, leaf area index,ercent evergreen tree cover and length of growing season (Nowakt al., 2006, 2013, 2014).
Since the model does not differentiate pollution removal bypecies, we distributed the species effect proportional to specieseaf area. Based on pollution removal proportional to leaf area,he European beech (Fagus sylvatica) which dominates the forestector, removed about 21% of air pollution in this class followedy European Ash (Fraxinus excelsior) (17%), English Oak (Quercusobur) (12%) and sycamore maple (Acer pseudoplatanus) (10%). Inhe residential sector silver linden (Tilia tomentosa), London planePlatanus x acerifolia) and horsechestnut (Aesculus hippocastanum)espectively removed 12%, 11% and 11% of the pollution removalTable 5).
. Discussion
This paper explores the ability of public trees to improve airuality in Strasbourg city through dry deposition of pollutants.esults indicate that from July 2012 to June 2013, public treesemoved about 88 t of air pollution, which varies depending on pol-utant, amount of tree cover and seasons. Through a high level ofublic trees and urban green spaces in Strasbourg, which is one ofhe top Ten French Cities in green space surfaces according to theational union of landscape companies (UNEP, 2014); public treesemove a small part of air pollution, but are estimated to removebout 7% of PM10coarse emissions in the city. As this study only inves-igated trees in public green spaces, trees in private green spacesould increase total air pollution removal in the city, but these trees
re not easily controlled by urban mangers. Future research focus-ng air pollution removal by the overall tree cover is recommendedo quantify ecosystem services provided by the whole urban forestcross the city of Strasbourg.
Urban trees help to mitigate air pollution, but they are onef many potential solutions to this problem. Reducing emissionsrom the source prevents pollutant emissions and trees should note used as alternate solution to emission reduction, but rather asomplementary one. Through not investigated in this study, treesan reduce pollutant emissions by lower air temperatures and/oreducing building energy use. However, tree can also produce par-icles (e.g., pollen), limit pollutant dispersion and thus increaseocal pollutant concentrations (e.g., near roadways) (e.g., Gromkend Ruck, 2009; Wania et al., 2012; Salmond et al., 2013). Hence,lanting and managing trees should be associated with other inte-rative planning strategies usually based on either technological
e.g., more energy efficient technology) or non-technological mea-ures (e.g., built and organize cities to reduce energy consumptionnd associated emissions). A recent study conducted in Alsatianegion (France) show that the replacement of 20% of individual boil-n Greening 17 (2016) 192–201
ers by collective ones and the improvement of boiler efficiency candecrease to 15% of PM10 emission from residential sector (Selmiet al., unpublished data).
While climate considerations and air quality information con-tinue to be incorporated into urban planning process, ecosystemservices provided by urban vegetation remain largely unaccounteddespite scientific evidence. In the Strasbourg metropolitan, a recentinvestigation, based on participatory decision-making, shows thatdeveloping a tramway network, creating car-free spaces andreducing air pollution are the principal environmental issues forinhabitants (ASPA, 2014a). Nevertheless, the influence of urbanvegetation on human well-being was not mentioned. In anotherrecent project of planning and sustainable development (PADD),there is focus on the development of urban greenway (green spacesnetwork), but unfortunately, only its social and aesthetic consider-ations are taking into account (ADEUS, 2015). These projects revealthat planners and residents need more information/educationabout the services and values provided by urban vegetation. Inaddition, all ecosystem services (e.g., social, ecological and environ-mental) provided by urban green spaces and urban trees need tobe considered in the planning process. Awareness of multipurposeaspect of green spaces and ecosystem services should also identifyand resolve conflicts of interest between them.
In Strasbourg city, a wide range of street trees are regularlypruned to give them a geometric design and for safety reasons. Asthis pruning is done, managers should consider local traffic emis-sions to design canopy structure that is healthy with maximumleaf area, it allow for dispersion of local pollutants or limit disper-sion toward sidewalks where people are often exposed to pollutantemissions. In addition, limited use of fossil fuels to maintain thetrees (e.g., emissions from vehicles and equipment used to prunetrees) could reduce local pollutant emissions (e.g., Nowak et al.,2002a,b). Pollution removal rates are influenced by tree conditionand size. Healthy large trees remove about 60 times more pollutionannually than healthy small trees (Nowak, 1994). Hence, sustaininglarge healthy trees could improve air quality in cities by enhancingleaf surface area to remove pollutants.
Quantifying pollution removal among the land use classesrevealed a disparity in trees distribution across the city and pol-lution removal levels. Mapping this unequal distribution of treesalong human population data could be used to ensure moreequitable distribution of trees and ecosystem services as well asenhance urban sustainable planning within the city. More researchis needed on the spatial distribution of ecosystem services providedby urban trees.
Information given by the i-Tree Eco model like “plantable area”can be used by urban forest managers to plant trees (or other plants)and enhance air pollution removal and other associated ecosys-tem services. The plantable area in the vacant land use class, whichoften support of new urbanization projects, could also be used tocreate new green spaces to help improve air quality and as testsites to examine interactions among management practices, vege-tation structure and its effects on local air pollution. Such test sitescould be used to assess and improve the efficiency of vegetationin improving air quality. Analyzing the relationship between theplanning process and ecosystem service flow from urban vegeta-tion is fundamental for sustainable urban planning because it setsup a diachronic evaluation of the consequence of urbanization andnew planning projects on human well-being.
Species differences of pollution removal are accounted forthrough differences in leaf surface area. However, the model doesnot differentiate removal effects among species on a per leaf area
basis. That is, one square meter of leaf area is treated the sameamong all species in terms of removal rates per unit leaf area asthere is not enough information to adequately separate individ-ual species effects at the per unit leaf level. Other i-Tree models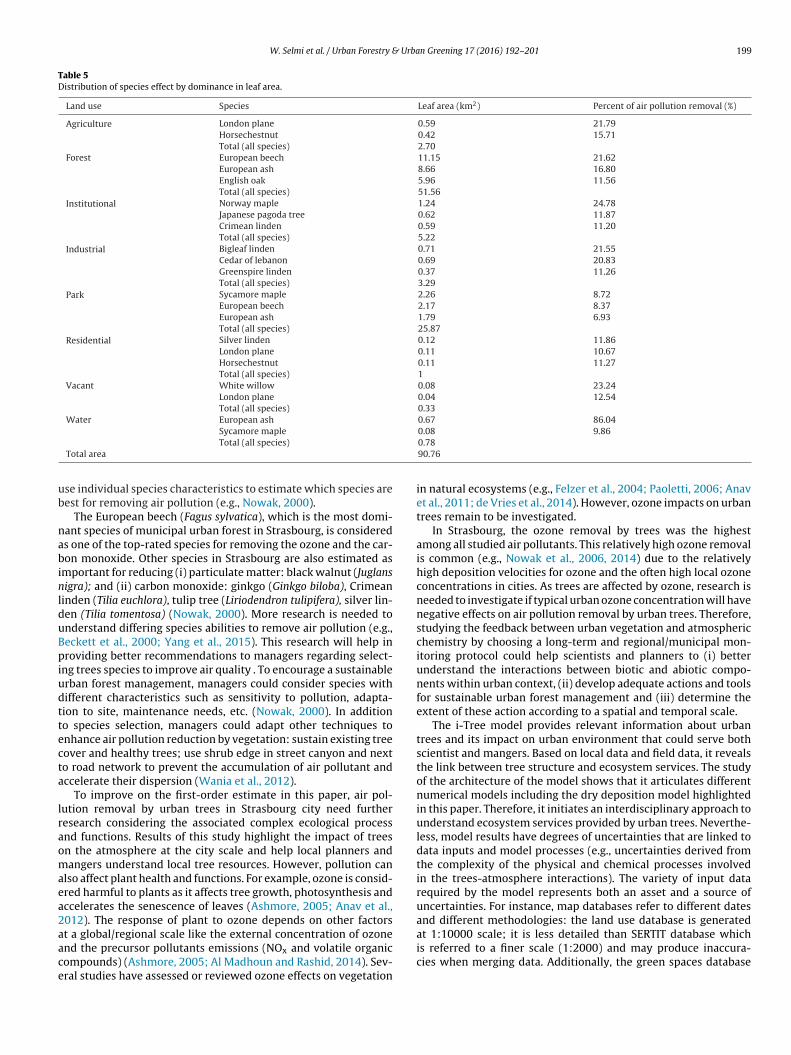
W. Selmi et al. / Urban Forestry & Urban Greening 17 (2016) 192–201 199
Table 5Distribution of species effect by dominance in leaf area.
Land use Species Leaf area (km2) Percent of air pollution removal (%)
Agriculture London plane 0.59 21.79Horsechestnut 0.42 15.71Total (all species) 2.70
Forest European beech 11.15 21.62European ash 8.66 16.80English oak 5.96 11.56Total (all species) 51.56
Institutional Norway maple 1.24 24.78Japanese pagoda tree 0.62 11.87Crimean linden 0.59 11.20Total (all species) 5.22
Industrial Bigleaf linden 0.71 21.55Cedar of lebanon 0.69 20.83Greenspire linden 0.37 11.26Total (all species) 3.29
Park Sycamore maple 2.26 8.72European beech 2.17 8.37European ash 1.79 6.93Total (all species) 25.87
Residential Silver linden 0.12 11.86London plane 0.11 10.67Horsechestnut 0.11 11.27Total (all species) 1
Vacant White willow 0.08 23.24London plane 0.04 12.54Total (all species) 0.33
Water European ash 0.67 86.04
ub
nabinlduBpiudttecta
lraomaea2aace
Sycamore maple
Total (all species)
Total area
se individual species characteristics to estimate which species areest for removing air pollution (e.g., Nowak, 2000).
The European beech (Fagus sylvatica), which is the most domi-ant species of municipal urban forest in Strasbourg, is considereds one of the top-rated species for removing the ozone and the car-on monoxide. Other species in Strasbourg are also estimated as
mportant for reducing (i) particulate matter: black walnut (Juglansigra); and (ii) carbon monoxide: ginkgo (Ginkgo biloba), Crimean
inden (Tilia euchlora), tulip tree (Liriodendron tulipifera), silver lin-en (Tilia tomentosa) (Nowak, 2000). More research is needed tonderstand differing species abilities to remove air pollution (e.g.,eckett et al., 2000; Yang et al., 2015). This research will help inroviding better recommendations to managers regarding select-
ng trees species to improve air quality . To encourage a sustainablerban forest management, managers could consider species withifferent characteristics such as sensitivity to pollution, adapta-ion to site, maintenance needs, etc. (Nowak, 2000). In additiono species selection, managers could adapt other techniques tonhance air pollution reduction by vegetation: sustain existing treeover and healthy trees; use shrub edge in street canyon and nexto road network to prevent the accumulation of air pollutant andccelerate their dispersion (Wania et al., 2012).
To improve on the first-order estimate in this paper, air pol-ution removal by urban trees in Strasbourg city need furtheresearch considering the associated complex ecological processnd functions. Results of this study highlight the impact of treesn the atmosphere at the city scale and help local planners andangers understand local tree resources. However, pollution can
lso affect plant health and functions. For example, ozone is consid-red harmful to plants as it affects tree growth, photosynthesis andccelerates the senescence of leaves (Ashmore, 2005; Anav et al.,012). The response of plant to ozone depends on other factors
t a global/regional scale like the external concentration of ozonend the precursor pollutants emissions (NOx and volatile organicompounds) (Ashmore, 2005; Al Madhoun and Rashid, 2014). Sev-ral studies have assessed or reviewed ozone effects on vegetation0.08 9.860.7890.76
in natural ecosystems (e.g., Felzer et al., 2004; Paoletti, 2006; Anavet al., 2011; de Vries et al., 2014). However, ozone impacts on urbantrees remain to be investigated.
In Strasbourg, the ozone removal by trees was the highestamong all studied air pollutants. This relatively high ozone removalis common (e.g., Nowak et al., 2006, 2014) due to the relativelyhigh deposition velocities for ozone and the often high local ozoneconcentrations in cities. As trees are affected by ozone, research isneeded to investigate if typical urban ozone concentration will havenegative effects on air pollution removal by urban trees. Therefore,studying the feedback between urban vegetation and atmosphericchemistry by choosing a long-term and regional/municipal mon-itoring protocol could help scientists and planners to (i) betterunderstand the interactions between biotic and abiotic compo-nents within urban context, (ii) develop adequate actions and toolsfor sustainable urban forest management and (iii) determine theextent of these action according to a spatial and temporal scale.
The i-Tree model provides relevant information about urbantrees and its impact on urban environment that could serve bothscientist and mangers. Based on local data and field data, it revealsthe link between tree structure and ecosystem services. The studyof the architecture of the model shows that it articulates differentnumerical models including the dry deposition model highlightedin this paper. Therefore, it initiates an interdisciplinary approach tounderstand ecosystem services provided by urban trees. Neverthe-less, model results have degrees of uncertainties that are linked todata inputs and model processes (e.g., uncertainties derived fromthe complexity of the physical and chemical processes involvedin the trees-atmosphere interactions). The variety of input datarequired by the model represents both an asset and a source ofuncertainties. For instance, map databases refer to different datesand different methodologies: the land use database is generated
at 1:10000 scale; it is less detailed than SERTIT database whichis referred to a finer scale (1:2000) and may produce inaccura-cies when merging data. Additionally, the green spaces database
2 Urba
du
cmMialpnE
iabetpmcatspldobcttaaodp
5
eiqpNpeeid2gp
A
dlStHvd
00 W. Selmi et al. / Urban Forestry &
oes not include the totality of street trees, which may lead to annderestimation of tree cover and thus air pollution removal.
Although the model was initially developed for US cities, i-Treean be used worldwide, but requires data collection, input and for-atting prior to use (e.g., Yang et al., 2005; Rogers et al., 2011;orani et al., 2014; Baro et al., 2014). i-Tree Eco is now set to work
n the U.S., Canada, Australia and the U.K. To apply i-Tree in otherreas, users need to provide additional information regarding studyocation, new species (if encountered), and local weather and airollution data. For required and desired data to use the model inon-American cities, along with model limitations, see the i-Treeco website (https://www.itreetools.org/eco/international.php).
While efforts are made to enhance the model functionalities,ts adoption in France or other countries can be enhanced withdditional research regarding tree species parameters (e.g., treeiomass, leaf area, growth rates). Baro et al. (2014) and Yangt al. (2005) suggest that uncertainties are also due to several fac-ors like particle re-suspension rate, the spatial distribution of airollutants, transpiration rates, meteorological conditions, etc. Theodel cannot estimate air pollution removal at small scale (street
anyon scale, neighborhood scale, etc.), because it cannot take intoccount spatial and temporal variability of air pollutant concen-ration due to limited data on pollution concentrations at thiscale (Hirabayashi et al., 2012). The model assesses average of airollution removal based on measured tree data and average air pol-
ution concentration across the city. Model parameters are adjustedepending on local collected tree data and locally measured mete-rological and air pollution data. All these Model limitations cane minimized with better and more local input data (e.g., pollutiononcentration and weather data) and further research to improveree species parameters and atmospheric exchanges with air pollu-ion. Model results represent an initial approximation rather than
completely accurate valuation of air pollution removal. Thesepproximations could help managers to understand the potentialf urban trees in reducing air pollution at the city scale and couldefine new management and planning strategies to sustain and toromote cleaner air in cities using urban vegetation.
. Conclusion
Modeling air pollution removal reveals the magnitude of treeffects on improving urban air quality. The effects of public treesn Strasbourg are relatively small with less than one percent airuality improvement, but depending upon the pollutant, this smallercent have substantial health impacts for local residents (e.g.,owak et al., 2014). The removal of 88 t of pollution per year byublic trees can improve air quality and offset local emissions. How-ver, the change in local air quality is not equally distributed andven though overall pollutant concentration is reduced, it can bencreased at the local scale depending on urban forest and streetesign and local roadside emissions (Wania et al., 2012; Vos et al.,013). Urban planners need to consider the impact of urban tree andreen spaces on local air quality to create better and more informedlans that ensure air purification and sustain human health in cities.
cknowledgements
This work was supported by “Institution de la Recherche ete l’Enseignement Supérieur Agricoles (IRESA-Tunisia), ‘Zone Ate-
ier Environnementale Strasbourg’ (ZAEU) and “Eurométropole detrasbourg” (EMS). We thank ASPA for air pollution concentra-
ion data; Dr. George Najjar for advice and Bob Hoehn, Satoshiirabayashi, Allison Bodine and all the staff of USDA Forest Ser-ice, Northern Research station in Syracuse, NY for assistance andata processing.n Greening 17 (2016) 192–201
References
ADEUS, 2015. Le Projet d’aménagement et de Développement durables, RetrievedApril 21st, 2016 from http://www.strasbourg.eu/developpement-rayonnement/urbanisme-logement-amenagement/planification-territoriale/plu/padd.
Al Madhoun, W.A., Rashid, M., 2014. An overview on the mutual relationshipbetween forests and air pollution – gain and loss. In: Proceeding of theNational Conference Royal Belum, Gerik Perak, Malaysia.
Anav, A., Menut, L., Khvorostyanov, D., Viovy, N., 2011. Impact of troposphericozone on the Euro-Mediterranean vegetation. Global Change Biol. 17,2342–2359.
Anav, A., Menut, L., Khvorostyanov, D., Viovy, N., 2012. A comparison of twocanopy conductance parameterizations to quantify the interactions betweensurface ozone and vegetation over Europe. J. Geophys. Res. 17, 1–20.
Angelo, J., Andrade, L., Madeira, L.M., Mendes, A., 2013. An overview ofphotocatalysis phenomena applied to NOx abatement. J. Environ. Manage. 129,522–539.
Ashmore, M.R., 2005. Assessing the future global impacts of ozone on vegetation.Plant Cell Environ. 28, 949–964.
ASPA, 2014a. Urbanisme et exposition à la pollution atmosphérique, RetrievedApril 21st, 2016 from http://www.atmo-alsace.net/medias/produits/Urbanisme et exposition.pdf.
ASPA, 2014b. Consommations d’énergie et émissions atmosphériques en Alsace,Retrieved April 21st, 2016 from http://www.atmo-alsace.net/medias/produits/Consommations denergie 1.pdf.
Baldocchi, D.D., Hicks, B.B., Camara, P., 1987. A canopy stomatal resistance modelfor gaseous deposition to vegetated surfaces. Atmos. Environ. 21, 91–101.
Baldocchi, D., 1988. A multi-layer model for estimating sulfur dioxide deposition toa deciduous oak forest canopy. Atmos. Environ. 22, 869–884.
Baro, F., Chaparro, L., Gomez-Baggethun, E., Langemeyer, J., Nowak, D.J., Terradas,J., 2014. Contribution of ecosystem services to air quality and climate changemitigation policies: the case of urban forests in Barcelona, Spain. AMBIO 43,466–479.
Beckett, K.P., Freer-Smith, P., Taylor, G., 2000. Effective tree species for local airquality management. J. Arboric. 26, 12–19.
Bolund, P., Hunhammar, S., 1999. Ecosystem services in urban areas. Ecol. Econ.,293–301.
Boonen, E., Beeldens, A., 2013. Recent photocatalytic applications for airpurification in Belgium. Coating 4, 553–573.
Boonen, E., Akylas, V., Barmpas, F., Boréave, A., Bottalico, L., Cazaunau, M., Chen, H.,Daële, V., De Marco, T., Doussin, J.F., Gaimoz, C., Gallus, M., George, C., Grand,N., Grosselin, B., Guerrini, G.L., Herrmann, H., Ifang, S., Kleffmann, J.,Kurtenbach, R., Maille, M., Manganelli, G., Mellouki, A., Miet, K., Mothes, F.,Moussiopoulos, N., Poulain, L., Rabe, R., Zapf, P., Beeldens, A., 2015.Construction of a photocatalytic De-polluting field site in the Leopold II tunnelin Brussels. J. Environ. Manage. 155, 136–144.
Brunekreef, B., Holgate, S.T., 2002. Air pollution and health. Lancet 360, 1233–1242.Cavanagh, J.E., 2006. Potential of Vegetation to Mitigate Road-generated Air
Pollution, Retrieved April 21st, 2016 from https://www.niwa.co.nz/sites/niwa.co.nz/files/import/attachments/co1x0405 p05.pdf.
Chapparo, L., Terradas, J., 2009. Ecological Services of Urban Forest in Barcelona,Retrieved April 21st, 2016 from http://www.itreetools.org/resources/reports/Barcelona%20Ecosystem%20Analysis.pdf.
Chatignoux, E., Host, S., 2013. Expositions à la pollution atmosphérique et recoursaux urgences pour pathologies respiratoires chez les enfants en Ile-de-France,Retrieved April 21st, 2016 from http://www.ors-idf.org/images%5Cabookfile%5C2013SyntheseErpurs2013.pdf.
Chen, J., Poon, C.S., 2009. Photocatalytic construction and building materials: fromfundamentals to applications. Build. Environ. 44, 1899–1906.
Cherlin, N., Roustan, Y., Mousson-Genon, L., Seigneur, C., 2015. Modellingatmospheric dry deposition in urban areas using an urban canopy approach.Geosci. Model Dev. 8, 893–910.
Citeair, 2011. Integrated Urban Emission Inventories, Retrieved April 21st, 2016from http://www.citeair.eu/fileadmin/Deliverables and documents/Guidebook Integrated Emission Inventories - final.pdf.
Colbeck, I., Harrison, R.M., 1985. Dry deposition of ozone: some measurements ofdeposition velocity and of vertical profiles to 100 m. Atmos. Environ. 19,1807–1818.
Currie, A.B., Bass, B., 2008. Estimates of air pollution mitigation with green plantsand green roofs using the UFORE model. Urban Ecosyst. 11, 409–422.
EMS, 2013. Les forêts rhénanes de Strasbourg, Retrieved April 21st, 2016 fromhttp://www.strasbourg.eu/environnement-qualite-de-vie/foret-reserves-naturelles/forets-rhenanes-strasbourgeoises.
de Vries, W., Dobbertin, M.H., Solberg, S., van Dobben, H.F., Schaub, M., 2014.Impacts of acid deposition, ozone exposure and weather conditions on forestecosystems in Europe: an overview. Plant Soil 380, 1–45.
EEA, 2009. The EMEP/EEA Air Pollutant Emission Inventory Guidebook, RetrievedApril 21st, 2016 from http://www.eea.europa.eu/publications/emep-eea-emission-inventory-guidebook-2009.
EEA, 2014a. Air Quality in Europe, Retrieved April 21st, 2016 from http://www.eea.
europa.eu/publications/air-quality-in-europe-2014.EEA, 2014b. France air pollution fact sheet, Retrieved May 1st, 2016 from http://www.eea.europa.eu/themes/air/air-pollution-country-fact-sheets-2014/france-air-pollutant-emissions-country-factsheet/view.
Urba
E
F
F
G
H
H
H
H
H
i
J
L
M
NN
N
N
N
N
N
N
air pollution reduction. Urban For. Urban Greening 3, 65–78.Yang, J., Chang, Y., Yan, P., 2015. Ranking the suitability of common urban tree
W. Selmi et al. / Urban Forestry &
scobedo, F., Kroeger, T., Wagner, J., 2011. Urban forests and pollution mitigation:analyzing ecosystem services and disservices. Environ. Pollut. 159, 2078–2087.
elzer, B., Kicklighter, D., Melillo, J., Wang, C., Zhuang, Q., Prinn, R., 2004. Effects ofozone on net primary production and carbon sequestration in theconterminous United States using a biogeochemistry model. Tellus 56,230–248.
roger, G., Méral Ph, Le Coq, J.F., Aznar, O., Boisvert, V., Caron, A., Antona, M., 2012.Regards croisés de l’économie sur les services écosystémiques etenvironnementaux. VertigO – la revue électronique en sciences del’environnement 12, Retrieved April 21st, 2016 from http://vertigo.revues.org/12900.
romke, C., Ruck, B., 2009. On the impact of trees on dispersion processes of trafficemissions in street canyons. Boundary Layer Meteorol. 131, 19–34.
einrich, J., Wichmann, H.E., 2004. Traffic related pollutants in Europe and theireffect on allergic disease. Curr. Opin. Allergy Clin. Immunol. 4, 341–348.
irabayashi, S., Kroll, C.N., Nowak, D.J., 2011. Component-based development andsensitivity analyses of an air pollutant dry deposition model. Environ. Modell.Software 26, 804–816.
irabayashi, S., Kroll, C.N., Nowak, D.J., 2012. Development of a distributed airpollutant dry deposition modeling framework. Environ. Pollut. 171, 9–17.
irabayashi, S., Kroll, C.N., Nowak, D.J., 2015. i-Tree Eco Dry Deposition ModelDescriptions, Retrieved April 21st, 2016 from https://www.itreetools.org/eco/resources/iTree Eco Dry Deposition Model Descriptions.pdf.
osker Jr., R.P., Lindberg, S.E., 1982. Review: atmospheric deposition and plantassimilation of gases and particles. Atmos. Environ. 16, 889–910.
-Tree Eco User’s Manual, 2013, Retrieved January 23rd, 2013 from https://www.itreetools.org/resources/manuals/Eco Manual v5.pdf: http://www.itreetools.org/resources/archives.
agielski, K.D., O’Brien, R.J., 1994. Calculation Methods for Criteria Air PollutantEmission Inventories, Retrieved April 21st, 2016 from http://oai.dtic.mil/oai/oai?verb=getRecord&metadataPrefix=html&identifier=ADA284675.
ovett, G.M., 1994. Atmospheric deposition of nutrients and pollutants in NorthAmerica: an ecological perspective. Ecol. Appl. 4, 629–650.
orani, A., Nowak, D.J., Hirabayashi, S., Guidolotti, G., Medori, M., Muzzini, V.,Fares, S., Scarascia Mugnozza, G., Calfapietra, C., 2014. Comparing i-Treemodeled ozone deposition with field measurements in a periurbanMediterranean forest. Environ. Pollut. 195, 202–209.
OAA, 2016, website: http://www.ncdc.noaa.gov/cdo-web/.owak, D.J., 1994. Air pollution removal by Chicago’s urban forest. In: McPherson,
E.G., Nowak, D.J., Rowntree, R.A. (Eds.), Chicago’s Urban Forest Ecosystem:Results of the Chicago Urban Forest Climate Project, Gen Tech. Rep. NE-186.USDA Forest Service, Radnor, PA, pp. 63–81.
owak, D.J., 2000. Tree species selection, design, and management to improve airquality. Construction Technology: Annual Meeting Proceedings of theAmerican Society of Landscape Architects.
owak D.J., Crane D.E., The Urban Forest Effects (UFORE) Model: quantifying urbanforest structure and functions. In: Hansen M., Burk T. (Eds.), Integrated toolsfor natural resources inventories in the 21st century: proceedings of the IUFROconference. Gen. Tech. Rep. NC-212, St. Paul, 714–720, 2000.
owak, D.J., Crane, D.E., Stevens, J.C., Ibarra, M., 2002a. Brooklyn’s Urban ForestGeneral Technical Report NE- 290. USDA Forest service, Newtown Square, PA.
owak, D.J., Stevens, J.C., Sisinni, S.M., Luley, C.J., 2002b. Effects of urban treemanagement and species selection on atmospheric carbon dioxide. J. Arboric.28, 113–122.
owak, D.J., Crane, D.E., Stevens, J.C., 2006. Air pollution removal by urban treesand shrubs in the United States. Urban For. Urban Greening 4, 115–123.
owak, D.J., Walton, J.T., Stevens, J.C., Crane, D.E., Hoehn, R.E., 2008. Effect of plotand sample size on timing and precision of urban forest assessments. Arboric.Urban For. 34, 386–390.
n Greening 17 (2016) 192–201 201
Nowak, D.J., Hirabayashi, S., Bodine, A., Hoehn, R., 2013. Modeled PM2.5 removal bytrees in ten U.S. cities and associated health effects. Environ. Pollut. 178,395–402.
Nowak, D.J., Hirabayashi, S., Bodine, A., Greenfield, E., 2014. Tree and forest effectson air quality and human health in the United States. Environ. Pollut. 193,119–129.
Owen, S.M., Mackenzie, A.R., Stewart, H., Donovan, R., Hewitt, C.N., 2003. Biogenicvolatile organic compound (VOC) emission estimates from an urban treecanopy. Ecol. Appl. 13, 927–938.
Paoletti, E., 2006. Impact of ozone on Mediterranean forests: a review. Environ.Pollut. 144, 463–474.
Paoletti, E., Bardelli, T., Giovannini, G., Pecchioli, L., 2010. Air quality impact of anurban park over time. Procedia Environ. Sci. 4, 10–16.
Rogers, K., Jarrat, T., Hansford, D., 2011. Torbay’s Urban Forest: Assessing UrbanForest Effects and Values, Retrieved April 21st, 2016 from http://www.itreetools.org/resources/reports/Torbay UF Report.pdf.
Roupsard, P., 2013. Etude Phénoménologique Du dépôt Sec d’aérosols En MilieuUrbain. Ph.D Thesis. University of Rouen.
Rückerl, R., Schneider, A., Breitner, S., Cyrys, J., Peters, A., 2011. Health effects ofparticulate air pollution – a review of epidemiological evidence. Inhal. Toxicol.23, 555–592.
Salmond, J.A., Williams, D.E., Laing, G., Kingham, S., Dirks, K., Longley, I., Henshaw,G.S., 2013. The influence of vegetation on the horizontal and verticaldistribution of pollutants in a street canyon. Sci. Total Environ. 443, 287–298.
Schlesinger, R.B., 1979. Natural removal mechanisms for chemical pollutants in theenvironment. Bioscience 29, 95–101.
Selmi, W., 2014. Évaluation Des Services écosystémiques Rendus Par La végétationUrbaine. Application d’approches d’évaluations à La Ville De Strasbourg. Ph.DThesis. University of Strasbourg.
Sénat, 2015. CoÛt économique et financier de la pollution de l’air, Retrieved April21st, 2016 from http://www.senat.fr/rap/r14-610-1/r14-610-11.pdf.
Taylor Jr., G.E., Hanson, P.J., Baldocchi, D.D., 1988. Pollutant deposition toindividual leaves and plant canopies: sites of regulation and relationship toinjury. In: Heck, W.W., Taylor, O.C., Tingey, D.T. (Eds.), Assessment of Crop Lossfrom Air Pollutants. Elsevier Applied Science London, England, pp. 227–258.
Tiwary, A., Kumar, P., 2014. Impact evaluation of green-grey infrastructureinteraction on built-space integrity: an emerging perspective to urbanecosystem services. Sci. Total Environ. 487, 350–360.
UNEP, 2014. Les villes les plus vertes de France, Palmares 2010, dossier de presse,Retrieved April 21st, 2016 from http://www.entreprisesdupaysage.org/espace-presse/dossiers-de-presse-unep/614-palmares-des-villes-les-plus-vertes-de-france-decouvrez-les-resultats-.
Vos, P., Maiheu, B., Vankerkom, J., Janssen, S., 2013. Improving local air quality incities: to tree or not to tree? Environ. Pollut. 18, 113–122.
Wania, A., Bruse, M., Blond, N., Weber, C., 2012. Analysing the influence of differentstreet vegetation on traffic-induced particle dispersion using microscalesimulations. J. Environ. Manage. 94, 91–101.
Wesely, M.L., 1989. Parameterization of surface resistances to gaseous drydeposition in regional-scale numerical models. Atmos. Environ. 23, 1293–1304.
WHO, 2006. Air Quality Guidelines for Particulate Matter, Ozone, Nitrogen Dioxideand Sulfur Dioxide. WHO, Denmark, pp. 484 p.
Yang, J., McBride, J., Zhou, J., Sun, Z., 2005. The urban forest in Beijing and its role in
species for controlling PM2.5 pollution. Atmos. Pollut. Res. 6, 267–277.Young, R.F., 2010. Managing municipal green space for ecosystem services. Urban
For. Urban Greening 9, 313–321.