urban forests and trees - proceedings n°2
TRANSCRIPT

Urban forests and trees
Proceedings No 2
Edited by
C. C. Konijnendijk, J. Schipperijn, K. Nilsson
COSTEuropean cooperation in the field of
scientific and technical research
2005 EUR 21524 EN
COST Action E12
Forests and forestry products
41BL17_Pages_lim 07-07-2005 10:20 Pagina 1

A great deal of additional information on the European Union is available on the Internet.
It can be accessed through the Europa server (http://europa.eu.int).
Cataloguing data can be found at the end of this publication.
Luxembourg: Office for Official Publications of the European Communities, 2005
ISBN 92-898-0009-7
© COST Office, 2005
No permission to reproduce or utilise the contents of this book by any means is necessary, other than in
the case of images, diagrams or other material from other copyright holders. In such cases, permission of
the copyright holders is required. This book may be cited as: COST Action E12 — Urban forests and trees
— Proceedings No 2.
Printed in Belgium
PRINTED ON WHITE CHLORINE-FREE PAPER
Legal notice by the COST Office
Neither the COST Office nor any person acting on its behalf is responsible for the use which might be made of the
information contained in this publication. The COST Office is not responsible for the external websites referred to in this
publication.
Europe Direct is a service to help you find answers
to your questions about the European Union
Freephone number (*):
00 800 6 7 8 9 10 11(*) Certain mobile telephone operators do not allow access to 00 800 numbers or these calls may be billed.
41BL17_Pages_lim 07-07-2005 10:20 Pagina 2

3
Preface
COST (European Cooperation in the field of Scientific and Technical Research) is a
framework for the co-ordination of national research at European Level. The COST
Action E12 ‘Urban Forests and Trees’ was started in June 1997 and ended in June
2002. The aim of the action was to coordinate and promote research on urban forests
and urban trees in Europe.
More than 100 experts in urban trees, parks and woodlands, representing 22 European
countries and 70 institutions, have evaluated the built-up areas of Europe and they also
have developed innovative approaches for maintaining and developing sustainable and
multi-functional benefits of urban forests and trees. The main results of the action
include the first comparative overviews of research and educational capacities in Euro-
pean urban forestry, and the development of a strong European network. The COST
support was crucial in the development of the network, which has already let to
various spin-offs, e.g. a new scientific journal (Urban Forestry & Urban Greening1), the
launch of the European Urban Forestry Research and Information Centre
(EUFORIC2) and various international projects.
These proceedings are the 2nd of two, the first were issued in 2002. In these
proceedings selected papers presented at the COST E12 seminars in Florence,
Ljubljana, Thessalonki and Bruges, as well as the research conference ‘The Changing
Role of Forestry in Europe, between Urbanization and rural Development’, are
included. This conference was organised jointly with the EU-FAIR Multifor.RD
project and Wageningen University and Research Centre. Detailed programmes of the
meetings can be found in the appendix.
The papers illustrate the broad range of topics within urban forestry that has been
covered throughout the existence of the Action. The first chapter deals with policy-
making, planning and design for urban forests and trees. Urban afforestation is one of
main challenges in forest-poor, highly urbanised north-western Europe, as studies in
Belgium and the Netherlands show. Chapter 2 focuses on functions and benefits of
urban forests. Multi-functionality seems to be crucial when managing limited urban
forest resources for a demanding urban society. It also seems crucial to have a better
1
2
http://www.elsevier.de/ufug/
http://www.sl.kvl.dk/euforic/

4
assessment of benefits and costs. Chapter 3 continues with some of the threats to ur-
ban forest sustainability. Pests and diseases are problematic across Europe, e.g. the wild
fires as primary challenge for Mediterranean urban foresters. Management of urban
forests to maintain a healthy and multifunctional resource is the topic of chapter 4.
And finally, chapter 5 describes urban forestry as a challenging field. Urban forest
resources in high-pressure urban environments require extensive partnerships to be
successful. Not only different professionals and political support, but also the
involvement of the private sector, interest groups and the public at large. Some
successful examples of how to generate partnerships for urban forestry are given.
The COST Action E12 succeeded in establishing a good basis for co-ordinated Euro-
pean research in the field of urban forests and trees. The challenge for the coming
years will be to continue along the set path and to further expand both the European
co-operation and the research within the field.
Cecil C. Konijnendijk, Jasper Schipperijn and Kjell Nilsson, Editors
Forest & Landscape Denmark
Finally we would like to thank all authors for their contributions, Nelli Leth and Jette
Alsing Larsen at Forest & Landscape Denmark for the layout and all national experts
that participated in COST E12 activities.

5
Contents
Preface 3
Linking together research on urban forests and trees in Europe 9
Kjell Nilsson and Cecil Konijnendijk
COST E12 Final Declaration 31
Werner Pillmann and other experts of COST Action E12
33
Urban forestry and open space in the urbanised context of western Europe: 35
a policy point of view
Presented at the COST E12 Plenary Session in Bruges, June 13th, 2002
Peter Janssens
Realising urban forests in Flanders: a policy perspective 47
Presented at the COST E12 Plenary Session in Bruges, June 13th, 2002
Jeroen Nachtergaele, Rik De Vreese, Raoul Vanhaeren & Jos Van Slycken
Planning new forests in The Netherlands 55
Presented at the COST E12 Plenary Session in Ljubljana, June 28th, 2001
Rien van den Berg
The design of urban woodlands in the Netherlands: development of a ‘polder forest’ 65
Presented at the Symposium ‘The changing role of forestry in Europe; between urbanization
and rural development’ in Wageningen, November 13th, 2001
Dominique Blom
A historical case of peri-urban forestry: the ‘Sotos Historicos’ of Aranjuez, Spain 89
Presented at the Symposium ‘The changing role of forestry in Europe; between urbanization
and rural development’ in Wageningen, November 13th, 2001
José Luis Garcia-Valdecantos & Maria-Luisa Tello
99
Multifunctionality in urban forestry 101
Presented at the COST E12 Plenary Session in Ljubljana, June 28th, 2001
Janes Pirnat
Chapter 1 — Cost Action E12 „Urban Forests and Trees“
Chapter 2 — Policy-making, planning and design for urban forests and trees
Chapter 3 — Functions and benefits of urban forests and trees

6
Results of changing social demands in Istanbul Bahcekoy Forest Enterprise: a case study 119
Presented at the Symposium ‘The changing role of forestry in Europe; between urbanization
and rural development’ in Wageningen, November 13th, 2001
Ömer Eker & Kenan Ok
Cost-benefit analysis of urban forests from a research point of view 133
Presented at the COST E12 Plenary Session in Bruges, June 13th, 2002
Ellen Moons
155
Analysis of the wildland-urban interface fire problem of Greece 157
Presented at the COST E12 Plenary Session in Thessaloniki, April 11th, 2002
Alexandros Dimitrakopoulos
Pests and diseases of urban forests in Greece 165
Presented at the COST E12 Plenary Session in Thessaloniki, April 11th, 2002
Helen Michalopoulos-Skarmoutsos
Threats to urban green areas - case study: Mexico City 177
Presented at the COST E12 Plenary Session in Thessaloniki, April 11th, 2002
Alicia Chacalo, Jaime Grabinsky, Hector Javier Vazquez & Alejandro Aldama
189
Weed control in the urban environment in Denmark 191
Presented at the Symposium ‘The changing role of forestry in Europe; between urbanization
and rural development’ in Wageningen, November 13th, 2001
Palle Kristoffersen & Camilla Lophaven
Urban forests of Thessaloniki: Post-fire (1997) restoration perspectives 205
Presented at the COST E12 Plenary Session in Thessaloniki, April 11th, 2002
Christos Tourlakidis
Arboricultural research of trees in City of Ljubljana and instructions for their care 217
Presented at the COST E12 Plenary Session in Ljubljana, June 28th, 2001
Primoz Oven
Managing forest fires near urban areas in Mediterranean countries 225
Presented at the COST E12 Plenary Session in Thessaloniki, April 11th, 2002
Ramon Vallejo, Susana Bautista, Jaime Baeza & J.Antonio Alloza
Chapter 4 — Threats to urban forests and trees
Chapter 5 — Management of urban forests and trees

7
235
The White Rose Forest - A catalyst for the regeneration of a region 237
Presented at the Symposium ‘The changing role of forestry in Europe; between urbanization
and rural development’ in Wageningen, November 13th, 2001
Alan Simson
Challenges of neighbourhood participation in city-scale urban green-space planning 249
Presented at the Symposium ‘The changing role of forestry in Europe; between urbanization
and rural development’ in Wageningen, November 13th, 2001
Ann Van Herzele
Urban forestry in India and Nepal 261
Presented at the COST E12 Plenary Session in Thessaloniki, April 11th, 2002
Klaus Seeland
Informing the public about the ecological impact of different methods for road
and pavement winter maintenance in Vienna 269
Presented at the Symposium ‘The changing role of forestry in Europe; between urbanization
and rural development’ in Wageningen, November 13th, 2001
Monika Sieghardt & Martin Wresowar
Appendix 281
Programmes of meetings in Florence, Ljubljana, Wageningen,
Thessaloniki & Bruges 283
List of participants in the 5 meetings 291
Chapter 6 — Partnerships for urban forestry


9
Chapter 1
Linking together research on urban forests andtrees in Europe together
COST Action E12 Urban Forests & Trees


11
Linking together research on urban forests andtrees in Europe
Introduction
COST was set up in 1971 as an intergovernmental framework for European
cooperation in science and technology. The goal of COST is to ensure that Europe
holds a strong position in the field of scientific and technical research for peaceful
purposes, by increasing European co-operation and interaction in this field. It is based
on so-called ‘Actions’, which are networks of co-ordinated national research projects in
fields that are of interest to a minimum number of participants (at least 5) from
different member states. The Actions are defined by a Memorandum of Understanding
(MoU) signed by the Governments of the COST states wishing to participate in the
Action.
One of the 19 domains within the COST organisation is that of Forests and Forestry
Products (FFP). Forestry represents the greatest single land use within Europe,
involving some 10 million forest owners. Forest product manufacturing employs an
estimated two million people, making forests an invaluable resource for economic
development.
Europe is a highly urban continent, with soon 75 % of its population residing in urban
areas. In the urban landscape, trees and woodlands are probably the most important
biological elements. They are essential contributors to a high quality of urban life and
environment. Planning and management of urban forests and trees are essential to
encourage production, leisure, and sustainability for future generations. The need to
advance research and development activities on urban forests and trees in Europe by
means of international cooperation led to the establishment of COST Action E12
‘Urban Forests and Trees’ within the COST FFP domain.
Objectives
COST Action E12’s main objective was to improve the knowledge base needed for
better planning, design, establishment and management of urban forests and urban
Kjell Nilsson (Chairman COST E12) & Cecil Konijnendijk (Coordinator COST E12)
Rolighedsvej 23, DK 1958 Frederiksberg, DenmarkForest & Landscape Denmark
COST Action E12 Urban Forests & Trees

12
trees in Europe, and, by doing this, to establish urban forests and urban trees as a
scientific domain in Europe.
The Action aimed to improve this knowledge base through the establishment of a
comprehensive description of the state of the art on urban forests and trees. This
description would include available relevant European research resources and ongoing
work. It aimed to create a lasting European, multi-disciplinary research network on
urban forests and trees and identification and promotion of interactions with relevant
other international networks would be made.
COST Action E12 set out to establish new research tasks and make priorities for urban
forests and trees and propose new research projects, all at the European level. This was
expected to raise awareness of the benefits of urban forests and trees and concerns in
the population at large. Furthermore the Action would:
- Improve the methods of valuation of the benefits and costs of urban forests and
trees.
- Improve the methods of establishment of urban trees, as well as of plant selection
methods.
- Improve the methods of management for urban forests and trees.
Additionally, the Action aimed to establish interactions with other COST Actions and
international organisations as the topics of urban forests and trees are related to many
aspects of the environment and to human behaviour. COST Action E12 would
facilitate the transfer of research results and existing technology. It wanted to lead to
new approaches and management techniques of urban forests throughout Europe.
Technical description and implementation
The scientists and professionals working under this Action originated from many
different backgrounds as researchers within forestry, biology, geography, sociology,
urban planning, horticulture, arboriculture and landscape architecture are all dealing
with urban forests and urban trees. This multidisciplinary character of the research
field needed to be recognised and strengthened. Moreover, the Action aimed to
highlight the European dimension of research issues with regards to urban forests and
urban trees. Traditionally, much of the research in the field had taken place at a local or
regional scale, with a limited exchange of experiences.
The scientific programme for the Action was arranged via three Working Groups, each
of which composed a key element of the Action. In the Working Groups, new
research tasks were formulated and national pilot studies were initiated. In this way,
Working Group coordination elucidated the variation between the participating

13
countries but also facilitated the formulation of new research tasks. The following list
presents the three Working Groups; for each, specific research tasks are mentioned.
1. Objectives and functions of urban forests and urban trees:
− Assessment of urban forest benefits which includes people’s valuation of their
living environment.
− Planning and design of urban forests and trees that incorporate a stand of
uneven structured and aged trees, with amenity values.
− Design of urban tree planting with respect to the infrastructure in order to
secure optimum growing conditions for the trees.
− Development of models for strategic planting of street trees.
2. Establishment of trees for urban uses, including identification and selection of species, provenances
and cultivars:
− Establishment methods of urban forests and urban trees which are superior in
the harsh urban growing mediums.
− Selection of urban tree cultivars against new environmental constraints such as
de-icing salts.
− Selection of trees with good survivability as alternatives to Elm trees (Ulmus spp.)
in Northern Europe and Plane trees (Platanus spp.) in Southern Europe.
− Use of provenance selection for urban purposes (collection of propagation
material from different geographical locations).
3. Management of urban forests and urban trees:
− Development of a management method which can produce a multi-functional,
biodiverse and sustainable urban forest.
− Development of methods to predict weak and hazardous trees in order to
determine the vitality of street trees.
− Exchange of pruning and thinning techniques, supplemented with regional
silvicultural practices throughout Europe.
− Development and exchange of basic knowledge of the pathogens that affect
trees in order to systematise this subject.
− Development of Geographic Information Systems (GIS) as a planning and ma-
nagement system related to urban forests and trees.
− Development of management methods that ensure optimal coordination
between aesthetics, infrastructure and growth rates for street trees.
Scientific tasks for each of the groups were developed and pilot studies were initiated
(see the next section). All pilot-study trails were or will be presented in publications
containing (i) national results and (ii) a summary of the European dimension within
the topic. The pilot studies were primarily carried out on a national basis but

14
coordinated by the Working Groups and eventually by the Management Committee.
On the basis of the national (but highly coordinated) pilot studies, new international
and multi-disciplinary research programs have been formulated.
The daily coordination of COST Action E12 was in the hands of the Danish Forest
and Landscape Research Institute, where the Action’s secretariat was located. Steering
of the Action was done by the Management Committee and its representative, the
Core Group. This core group consisted of the chairman and vice-chair of the Action,
the three WG-leaders, and the Action’s coordinator, in some cases supplemented with a
local organiser of a seminar and meeting.
Activities and results
State of the art and pilot studies
During 1998 and the first half of 1999, the national experts prepared state-of-the-art
reports on research on urban forests and urban trees in their respective countries.
These reports were standardised, edited and compiled into the report ‘COST Action
E12 – Research and Development in Urban Forestry in Europe’, published by the European
Commission at the end of 1999 (see list of publications). The book includes national
reports from 20 countries and lists over 400 research projects. It is the first overview
publication of research on urban forests and urban trees in Europe. With the
publication of this book, one of the main objectives of COST E12 – i.e. providing an
overview of recent and ongoing urban forestry research in Europe – has been met.
Within COST E12, a review on the state-of-the-art of urban forestry research and
education was carried out. This study was started through the state-of-the-art inventory
of research mentioned above. From March 1999 onwards, the ‘review’ was granted
special funding and extended to include additional countries and analysis, as well as a
review of higher education on urban forests and trees in Europe. The project was
completed in spring 2001, with E12’s coordinator as main researcher, assisted by a
research assistant at the Danish Forest and Landscape Research Institute. An overview
of higher education on urban forests and urban trees in Europe was compiled by
means of a questionnaire. The final report of this work, with 28 country reports on
higher education on urban forests and trees was published in March 2002 by the
European Communities’ Printing Office.
One of the other aims of COST E12 was the initiation of pilot studies. These studies
had the intention to enlarge the knowledge base within a certain field, and/or to act as
a ‘stepping stone’ towards new research. Various pilot studies were carried out starting

15
from 1999. Below, the studies are briefly presented for each of E12’s working groups.
National experts coordinated these studies, with the assistance of the Working Group
leaders.
• Pilot study within WG 1 ‘Benefits and functions,
• Pilot studies within WG 2 ‘Selection and establishment,
Study
nr.
Objective and activities Description Outputs
1 The aim was to identify urban forest
resources and their planning and
management in larger European
cities.
By means of a questionnaire, two of
the largest cities for each country
involved (ca. 20) were studied.
Coordination by national experts.
An overview of urban forests and urban
forestry in selected, larger European
cities based on which e.g. research &
development needs could be identified.
Among the study areas were:
• Resource information (e.g. green
area in and near city, division over
diverse types of green space;
ownership, trends).
• Information on use of green areas.
• Planning and management (plans,
practices, responsibilities,
participation).
• Problems, issues and needs.
Publication submitted to scientific
journal (Urban Forestry & Urban
Greening) as well as national
journals. Study also provided
input to the COST E12 reference
book on urban forests and trees.
2 The aim to was to provide a first
overview of recent and ongoing
research on public attitudes and
perceptions towards urban forests
and trees in Europe.
To be included in the COST E12 urban
forestry reference book.
Material from different countries
was compiled for the COST E12
reference book on urban forestry.
Study
nr.
Objective and activities Description Outputs
1 Inventory of selection criteria for
breeding new plant material.
Inventory by means of a
questionnaire, distributed via national
experts.
An overview of selection criteria used in
Europe, by means of a questionnaire.
The results were compiled and
provide an important input to the
COST E12 reference book on
urban forests and trees.
2 Tests of Dutch hybrid Elms.
Inventory of state-of-the-art by means
of a questionnaire sent to relevant
research capacities.
Identifying to present location and
condition of hybrid Elms, bred in the
Netherlands in early 1980s. Assessing
the resistance against Dutch Elm
Disease.
Study was concluded and a final
meeting was held in Belgium in
2001. The selection work has
resulted in a new, resistant
cultivar now on the market.
3 Criteria for establishment of urban
trees.
Questionnaire, to be distributed
among local authorities, via national
experts.
An overview of establishment criteria as
used in European cities.
Study was finalised and results
were presented at the COST E12
Wageningen conference. A
scientific article was prepared and
submitted to a scientific journal
(Urban Forestry & Urban
Greening). The Dutch media
presented some of the study’s
results after the conference in
Wageningen. Moreover, the
study provided input to several
chapters of the COST E12
reference book.
16
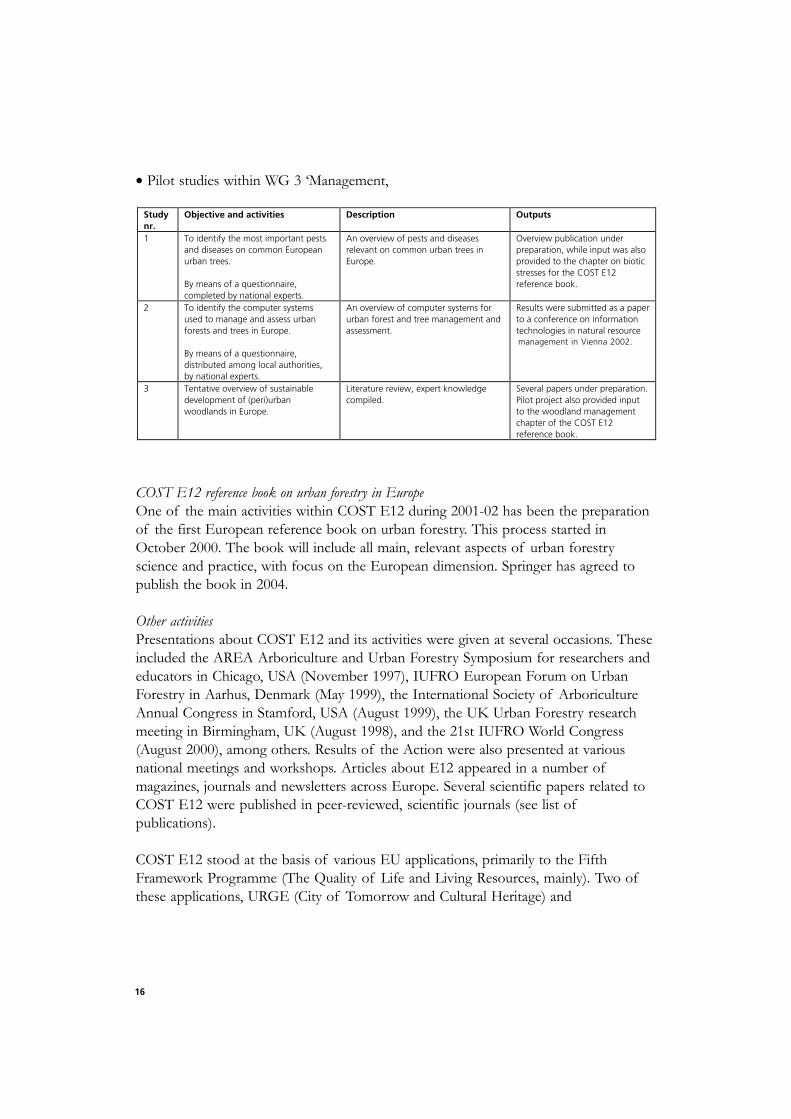
• Pilot studies within WG 3 ‘Management,
COST E12 reference book on urban forestry in Europe
One of the main activities within COST E12 during 2001-02 has been the preparation
of the first European reference book on urban forestry. This process started in
October 2000. The book will include all main, relevant aspects of urban forestry
science and practice, with focus on the European dimension. Springer has agreed to
publish the book in 2004.
Other activities
Presentations about COST E12 and its activities were given at several occasions. These
included the AREA Arboriculture and Urban Forestry Symposium for researchers and
educators in Chicago, USA (November 1997), IUFRO European Forum on Urban
Forestry in Aarhus, Denmark (May 1999), the International Society of Arboriculture
Annual Congress in Stamford, USA (August 1999), the UK Urban Forestry research
meeting in Birmingham, UK (August 1998), and the 21st IUFRO World Congress
(August 2000), among others. Results of the Action were also presented at various
national meetings and workshops. Articles about E12 appeared in a number of
magazines, journals and newsletters across Europe. Several scientific papers related to
COST E12 were published in peer-reviewed, scientific journals (see list of
publications).
COST E12 stood at the basis of various EU applications, primarily to the Fifth
Framework Programme (The Quality of Life and Living Resources, mainly). Two of
these applications, URGE (City of Tomorrow and Cultural Heritage) and
Study
nr.
Objective and activities Description Outputs
1 To identify the most important pests
and diseases on common European
urban trees.
By means of a questionnaire,
completed by national experts.
An overview of pests and diseases
relevant on common urban trees in
Europe.
Overview publication under
preparation, while input was also
provided to the chapter on biotic
stresses for the COST E12
reference book.
2 To identify the computer systems
used to manage and assess urban
forests and trees in Europe.
By means of a questionnaire,
distributed among local authorities,
by national experts.
An overview of computer systems for
urban forest and tree management and
assessment.
Results were submitted as a paper
to a conference on information
technologies in natural resource
management to be held in Vienna
during 2002.
3 Tentative overview of sustainable
development of (peri)urban
woodlands in Europe.
Literature review, expert knowledge
compiled.
Several papers under preparation.
Pilot project also provided input
to the woodland management
chapter of the COST E12
reference book.
management in Vienna 2002.

17
NeighbourWoods (Quality of Life and Management of Living Resources) were
successful under the EU’s Fifth Framework Programme; the projects were started in
2001. Through its networking function, researchers from across Europe have had the
opportunity to meet each other and coordinate their research activities. At the time of
concluding the Action, an Expression of Interest (NoI) for a Network of Excellence
on Urban Forestry & Urban Greening had been submitted under the EU’s Sixth
Framework Programme. Although the establishment of such a project seemed unlikely
by the time of the first call under the programme, several opportunities for urban
forestry elements in new research have emerged. New activities will be firmly based on
the existing COST E12 network, but includes additional partners in the form of
scientists as well as end users from e.g. local authorities.
Dissemination of results
Publications and reports
During its existence, COST Action E12 was the topic and/or initiator of a wide range
of scientific and professional publications. Here, only those publications are listed that
have been directly linked to the Action. Overall, it is estimated that the national experts
involved in COST E12 issued at least 800-1000 scientific and popular publications on
various aspects of urban forests and trees.
Conferences and workshops
Two research conferences were organised within the frame of the Action. In June
1999, the conference ‘Urban Greening and Landscape Architecture’ was held in
Copenhagen, Denmark, in collaboration with the International Society of
Arboriculture (ISA), the International Union of Forest Research Organizations
(IUFRO), the International Federation of Landscape Architects (IFLA), and local
Danish organisers. 150 experts from 34 countries, both European and other,
participated in the event. The research symposium ‘The changing role of forestry in
Europe, between urbanization and rural development’ attracted about 130 experts
from approx. 30 countries. The event was organised together with EU/FAIR-project
Multifor.RD that studies the changing role of rural forests in Europe. Local organiser
was Wageningen University and Research Centre.
In addition to the research conferences in Copenhagen and Wageningen, COST E12
seminars were held in Vienna, Leeds, Madrid, Dublin, Reykjavik, Florence, Ljubljana,
Thessaloniki, and Bruges.

18
Web site
Scientific and technical cooperation
Cooperation
Throughout the year, regular contacts were maintained with relevant institutions
outside the Action, such as the International Society of Arboriculture, and the
International Federation of Landscape Architects. The joint organisation of the two
research symposiums was a concrete example of cooperation. Regular contacts
between E12 and other COST Actions (such as C3) were maintained. The coordinator
of COST Action E12 was also elected as coordinator of IUFRO’s urban forestry unit
(6.14.00) in August 2000, a position held by the Action’s chairman earlier. During the
second part of the Action, close cooperation was also established with COST Action
C11 on Green Structures and Urban Planning. Some of COST E12’s experts became
active in that Action and some joint activities were undertaken.
Short Term Scientific Missions
20 STSMs were approved within the framework of the Action, of which 1 had to be
cancelled because of personal reasons of the applicant. The first 9 STSMs were carried
out with funding under a 1997 grant; 9 have been carried out under the 1999 grant.
The final mission was provisionally approved (together with 2 additional proposals).
When COST informed the coordinators that no new grant could be awarded because
of budget limitations, mission no. 19 was about to start. The coordinators therefore
decided to finance this mission from their own means.
1. Vladimir Kusan, Croatia (April-May 1998): Mr. Kusan travelled to Germany (Munich)
to study methods of photogrammetry and remote sensing to be used in urban
forestry.
2. Stephan Pauleit, Germany (April-May 1998): In his own research, Stephan Pauleit aims
to identify promising tree species for large urban areas. Tree health status and
environmental site conditions have proven to be closely related. A comparison of
tree stock in different cities and towns therefore is very useful. Mr. Pauleit visited
Ljubjana, Zagreb, Budapest and Sopron to learn more about the local situation.
A COST E12 web site based at the DFLRI’s server, has been operative since March
2000 at www.fsl.dk/cost_e12. Its main functions have been to enhance communication and the exchange of documents among the E12 experts, as well as to provide information on the Action to those not participating in it. The website was updated on a regular basis by the coordinators and will remain online in the near future. Although the Action has ended, the website will be maintained linked to the website of the European Urban Forestry Research & Information Centre (EUFORIC, www.sl.kvl.dk/ euforic).

19
3. Primoz Oven, Slovenia (August-September 1998): Primoz Oven visited arboricultural in-
stitutions in Hamburg. During his visited, his knowledge on techniques and
methods used for tree control (e.g. diagnosis of tree health, assessment of tree
safety and decay) was enhanced.
4. Minna Komulainen, Finland (August 1998): Ms. Komulainen visited the United
Kingdom and was hosted by the Forestry Commission. The aim of her mission was
to compare Finnish and British community woodland policies and design.
5. Horst Stobbe, Germany (October 1998): Horst Stobbe specialises in the study and
development of tree care and pruning methods. As both France and Germany are
considered to be leading countries in this field, he decided to visit France and learn
from French experiences. Mr. Stobbe studied the differences in aspects of tree and
came to an exchange of experiences with French experts.
6. Cristina Redondo Casero, Spain (June 1999): Ms. Redondo Casero visited Padua and
Florence to compare decay processes in urban trees in some species frequently used
in Spain and Italy.
7. Horst Stobbe, Germany (August-September 1999): Following Mr. Oven’s visit to
Hamburg, Horst Stobbe visited Slovenia to elaborate further on the exchange of
information and experiences between Slovenia and Germany. He studied
differences of wound response in xylem, cambium and bark, as specialisation of the
researchers in Ljubljana.
8. Joanna Schönenberger, Switzerland (November-December 1999): Ms. Joanna Schönenberger
visited researchers at the European Forest Institute, Finland, specialised in tools for
forest and land use planning. Moreover, she interviewed a number of Finnish urban
forestry researchers at a range of institutions. During her stay, she learnt more
about land use planning methodologies.
9. Cecil Konijnendijk, Netherlands/Denmark (March 2000): Mr. Cecil Konijnendijk visited
England to get more familiar with developments in (peri)urban woodland
development. By field visits, discussion with local planners, experts and other
stakeholders, and attending a seminar, he became more familiar with integrated
planning, design and the financing of urban woodlands in England.
10.Zelimir Borzan, Croatia (March 2000): Mr. Zelimir Borzan, an expert of e.g. tree
dendrology and arboriculture, visited Germany to study and discuss urban forestry
standards in gardening, arboriculture and landscaping.
11.Massimo Pilotti, Italy (April 2000): Mr. Massimo Pilotti of the Plant Pathology Re-
search Institute (ISPAVE) of Rome visited INRA in Montpellier. Together with
French experts, Mr. Pilotti studied insects and pathogens of plane trees and ways of
improving their resistance to these.
12.Carlo M. Marini, Italy (August-September 2000): Mr. Carlo Marini of the Municipality
of Florence, DG Environment, visited two institutions in France to identify ways
of improving tree management techniques for the urban environment, as well as to
study ways of fighting canker stain disease of Platanus.
20
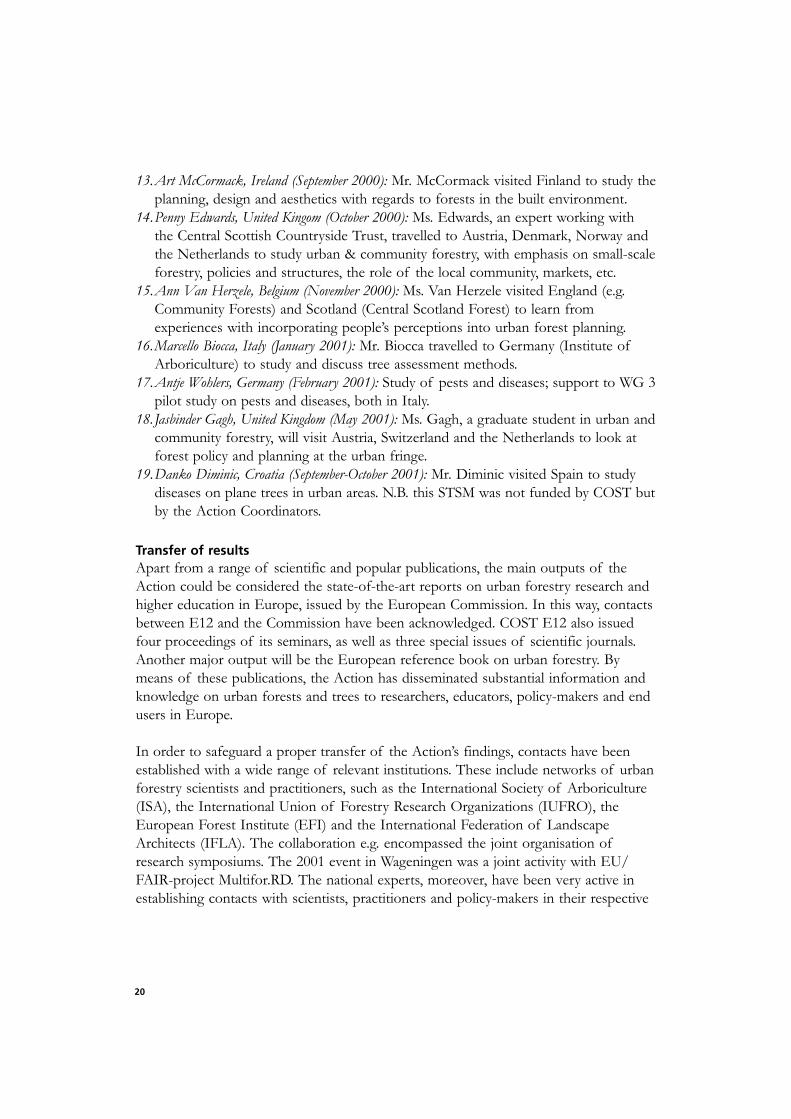
13.Art McCormack, Ireland (September 2000): Mr. McCormack visited Finland to study the
planning, design and aesthetics with regards to forests in the built environment.
14.Penny Edwards, United Kingom (October 2000): Ms. Edwards, an expert working with
the Central Scottish Countryside Trust, travelled to Austria, Denmark, Norway and
the Netherlands to study urban & community forestry, with emphasis on small-scale
forestry, policies and structures, the role of the local community, markets, etc.
15.Ann Van Herzele, Belgium (November 2000): Ms. Van Herzele visited England (e.g.
Community Forests) and Scotland (Central Scotland Forest) to learn from
experiences with incorporating people’s perceptions into urban forest planning.
16.Marcello Biocca, Italy (January 2001): Mr. Biocca travelled to Germany (Institute of
Arboriculture) to study and discuss tree assessment methods.
17.Antje Wohlers, Germany (February 2001): Study of pests and diseases; support to WG 3
pilot study on pests and diseases, both in Italy.
18.Jasbinder Gagh, United Kingdom (May 2001): Ms. Gagh, a graduate student in urban and
community forestry, will visit Austria, Switzerland and the Netherlands to look at
forest policy and planning at the urban fringe.
19.Danko Diminic, Croatia (September-October 2001): Mr. Diminic visited Spain to study
diseases on plane trees in urban areas. N.B. this STSM was not funded by COST but
by the Action Coordinators.
Transfer of results
Apart from a range of scientific and popular publications, the main outputs of the
Action could be considered the state-of-the-art reports on urban forestry research and
higher education in Europe, issued by the European Commission. In this way, contacts
between E12 and the Commission have been acknowledged. COST E12 also issued
four proceedings of its seminars, as well as three special issues of scientific journals.
Another major output will be the European reference book on urban forestry. By
means of these publications, the Action has disseminated substantial information and
knowledge on urban forests and trees to researchers, educators, policy-makers and end
users in Europe.
In order to safeguard a proper transfer of the Action’s findings, contacts have been
established with a wide range of relevant institutions. These include networks of urban
forestry scientists and practitioners, such as the International Society of Arboriculture
(ISA), the International Union of Forestry Research Organizations (IUFRO), the
European Forest Institute (EFI) and the International Federation of Landscape
Architects (IFLA). The collaboration e.g. encompassed the joint organisation of
research symposiums. The 2001 event in Wageningen was a joint activity with EU/
FAIR-project Multifor.RD. The national experts, moreover, have been very active in
establishing contacts with scientists, practitioners and policy-makers in their respective

21
countries. In Italy, the UK and Switzerland, for example, national COST E12 meetings
were held.
EFI recognised the importance of urban forestry and the role the Action and its
Coordinator played by establishing a Regional Project Centre on urban forestry based
at the Danish Forest and Landscape Research Institute in 2001. This centre, named the
European Urban Forestry Research and Information Centre (EUFORIC), will ensure
sustainability of the Action’s network. It has also provided the bases for an Expression
of Interest in establishing a Network of Excellence on urban forestry and urban
greening under the EU’s Sixth Framework Programme.
A recent cooperation was established with FAO’s staff involved with urban and peri-
urban forestry. The forest resources division of FAO participated in the Florence
meeting. The former and current coordinator of E12 then became involved in the
preparation of a new strategy for urban and peri-urban forestry for FAO. The
development of this strategy was started at the end of 2001. North-South networking
was enhanced by having the theme ‘Threats to urban forests and trees: the North-
South dimension’ as theme for the meeting in Thessaloniki.
The former and current coordinator of COST E12 were asked by Urban & Fischer
Publishers to set up a new scientific journal called ‘Urban Forestry & Urban Greening’
(www.urbanfischer.de/journals/ufug). The first issue of this journal was published in
August 2002.
Evaluation
The main framework for evaluating COST Actions is the Memorandum of
Understanding prepared and signed at the outset of each Action. In the case of COST
E12, the experts feel that the Action succeeded in meeting its main objective, i.e. to
improve the knowledge base needed for better planning, design, establishment and
management of urban forests and urban trees in Europe, and, by doing so, to establish
urban forests and urban trees as a scientific domain in Europe. Through its networking
and coordinating activities, and wide range of publications, COST E12 established
urban forests and urban trees as a pan-European research domain with a large
potential for further development. Moreover, the state-of-art and pilot studies
undertaken and disseminated provide a sound basis for future research, development,
education and implementation at the pan-European as well as national and local level.
It is believed that a lasting network was created, and also that new research was
stimulated.

22
The success of COST E12 can be derived from, for example:
- The high number of countries (22), institutions (79; universities, research institutes
as well as end users) and individual experts (close to 100) that participated in the
Action.
- The success of the pilot studies as well as the review of research and knowledge on
urban forests and urban trees in Europe.
- The quality and quantity of the publications issued by the Action.
- The preparation of a first European reference book on urban forests and urban
trees in Europe.
- The success of the two research conferences organised by the Action.
- The interest of e.g. high-level local and national politicians as well as the media
during COST E12 seminars.
- The successful networking with other institutions involved in urban forestry and
urban greening, such as other COST Actions and EU-funded initiatives, FAO, ISA,
IUFRO, EFI, and other.
- The submission of an Expression of Interest to establish a Network of Excellence
on urban forestry and urban greening, based on the COST E12 network and
experience.
- The establishment of an EFI Regional Project Centre on urban forestry during the
Action.
- The setting up of a new scientific journal specifically on urban forestry (‘Urban
Forestry & Urban Greening’) by the Action Coordinators and network.
The experts also feel that the Action could have been more successful in some matters,
for example:
- Due to funding restrictions, a number of meetings within the Action could have a
limited participation of experts only, thus limiting the networking and activity of
the Action.
- The number of STSMs carried out. E.g. due to lack of interest at the outset of the
Action and later funding restrictions, the number of STSMs was limited to 19.
- Although some new, pan-European research projects were set up, the COST E12
network had hoped to be more successful especially in attracting EU-funding for
R&D projects. New activities are undertaken to mend this situation within the 6th
Framework Programme.
- Due to the wide scope and limited resources involved in a COST Action, some re-
search topics could not be explored in full depth. The Action has, however,
provided a sound basis for further detailed R&D during the years to come.

23
List of publications
COST E12 books issued by COST/EU or major publishers:
Forrest M, Konijnendijk CC & Randrup TB (Eds.) (1999).COST Action E12 - Research and development in urban forestry in Europe. Euro-
pean Commission, Luxembourg. (Includes 20 country reports prepared by the Acti-
on’s national experts.)
Konijnendijk CC, Schipperijn J & Nilsson K (2003).COST Action E12 ‘Urban Forests and Trees’ – Proceedings No. 2. Printing Office
of the European Communities, Luxembourg. (Includes approx. 20 papers presented
at various COST E12 conferences and seminars.)
Nilsson K, Randrup TB & Konijnendijk CC (Eds.) (in prep).Urban forests and trees in Europe. Reference book on European urban forestry.
Springer Academic Publishers.
Randrup TB, Konijnendijk CC & Andersen F (2001).Review of higher education on urban forestry in Europe. Report of COST Action
E12 Urban Forests and Trees. Printing Office of the European Communities,
Brussels. (Includes 28 country reports on the status of higher education on urban
forests and trees.)
Randrup TB, Konijnendijk CC, Christophersen T & Nilsson K (Eds.) (2002).COST Action E12 ‘Urban Forests and Trees’ - Proceedings No. 1. Printing Office
of the European Communities, Luxembourg. (Includes approx. 20 papers presented
at various COST E12 conferences and seminars.)
Proceedings and reports of COST E12 seminars and conferences:
Collins K & Konijnendijk CC (Eds.) (2001).Planting the idea - the role of education in urban forestry. Proceedings of COST
Action E12 ’Urban Forests and Trees’ seminar, Dublin, 23 March, 2000. The Tree
Council of Ireland et al., Dublin.
Randrup TB (Ed.) (1999).Proceedings from the Urban Greening and Landscape Architecture research sym-
posium. The Royal Veterinary and Agricultural University, Copenhagen, Denmark,
June 23-25, 1999. Proceedings No. 2. Danish Forest and Landscape Research
Institute, Hoersholm.
Special issues of peer-reviewed scientific journals:
Journal of Arboriculture (2000). Papers from the COST E12 research symposium ‘Ur-
ban Greening and Landscape Architecture’, edited by Randrup TB:

24
Pedersen LB, Randrup TB & Ingerslev MEffects of road distance and protective measures on deicing NaCl deposition and
soil solution chemistry in planted median strips.
Tello ML, Redondo C & Mateo-Sagaste EHealth status of Plane trees (Platanus spp.) in Spain.
Sæbø A & Johnsen JGrowth and morphology differ between wind-exposed families of Sorbus aucuparia
(L.)
Drénou CPruning trees: the problem of forks.
Stobbe H, Dujesiefken D & Schröder KTree crown stabilization with the double-belt system Osnabruck.
Galvin MF, Wilson B & Honeczy M Maryland’s Forest Conservation Act: a process of urban greenspace protection
during the development process.
Landscape and Urban Planning (Volume 52(2-3) (2000)), with papers presented at the re-
search symposium ‘Urban Greening and Landscape Architecture’, edited by Randrup TB
and Konijnendijk CC:
Randrup TB & Konijnendijk CCUrban Greening and Landscape Architecture. Prepared on the basis of the Re-
search Symposium on Urban Greening and Landscape Architecture, Copenhagen,
Denmark, June 1999.
Fukamachi K, Oku H, Kumagi Y & Shimomura AChanges in landscape planning and land management in Arashiyama National
Forest in Kyoto.
Konijnendijk CCAdapting forestry to urban demands - role of communication in urban forestry in
Europe.
Florgård CLong-term changes in indigenous vegetation preserved in urban areas.
Jensen MB, Persson B, Guldager S, Reeh U & Nilsson KGreen structure and sustainability - developing a tool for local planning.

25
Pirnat JConservation and management of forest patches and corridors in suburban
landscapes.
Attwell KUrban land resources and urban planting - case studies from Denmark.
Oguz DUser surveys of Ankara’s urban parks.
Millard AThe potential role of natural colonisation as a design tool for urban forestry - a pi-
lot study.
Coles RW & Bussey SCUrban forest landscapes in the UK - progressing the social agenda.
Simson AJThe post-romantic landscape of Telford New Town.
Selected papers from the research symposium in Wageningen were included in the new
scientific journal Urban Forestry & Urban Greening (Vol. 1, issue 1).
Jönssen A & Gustavsson RManagement styles and knowledge cultures, past present and future, related to mul-
tiple-use and urban woodlands.
Ode Å & Fry GVisual aspects in urban woodland management.
Samyn J & Vos B DeThe assessment of mulch sheets to inhibit competitive vegetation in tree plantations
in urban and natural environment.
Seeland K, Moser K, Scheuthle H & Kaiser FGPublic acceptance of restrictions imposed on recreational activities in the peri-ur-
ban nature reserve Sihlwald in Switzerland.
Vries S de & Goossen MModelling recreational visits to forests and nature areas.
Other international, peer-reviewed articles:
Andersen F, Konijnendijk CC & Randrup TB (2002).Higher education on urban forestry in Europe: An overview. Forestry 75(5): 501-511.
26
Konijnendijk CC, Randrup TB & Nilsson K (2000).Urban Forestry research in Europe: An overview. Journal of Arboriculture 26(3): 152-
161.
Ottitsch A (in review)Urban forest policies: Objectives and functions, trend and developments. Results
from a comparative European study. Submitted to Urban Forestry & Urban Greening.
Pauleit S, Jones N, Garcia-Marin G, Garcia-Valdecantos GL, Rivière LM, Vidal-Beaudet L,Bodson M & Randrup TB (2002).
Tree selection and establishment practices in Europe - results from a European
survey. Urban Forestry & Urban Greening 1(2).
Randrup TB & Nilsson K (1998).Research note: Co-ordination of European research on urban forests and trees.
Arboricultural Journal 22(2): 173-177.
Other publications:
Andersen F & Randrup TB (2001).Plantning og pleje af bytræer i Europa. Grønt Miljø 2001(7): 44-47. (In Danish.)
Bianchi M, de Rogatis A, Motta E, Mutto Accordi S & Salbitano F (1998).Per una rete di richerche europee sugli alberi e le foreste in città: l’azione COST E12
‘Urban forests and trees’. In: Atti del nono seminario dell’International Association
for Environmental Design ‘La città sostenible’. IAED, Roma. (In Italian.)
Bouter H (2001).Stedelingen maken van bos een topattractie. WB 15/11/01. (In Dutch.)
Collins KD & Konijnendijk CC (2000).COST Action E12, Urban Forests and Trees, comes to Ireland. Arborist News, June
2000: 45-46.
Couenberg E (2002).Symposium Wageningen 2001: interessante ontwikkelingen in het stedelijk groen.
KPB Nieuwsbrief 5(11): 8-9. (In Dutch.)
Dansk Træplejeforening (2000).Beskæring af træer - European Tree Pruning Guide. Copenhagen. (In Danish.)
Duhme F & Dujesiefken D (1998).COST Action E12 ‘Wälder und Bäume im städtischen Raum’ (Urban Forests and
Trees). Stadt und Grün 1998(1): 10-11. (In German.)

27
Dujesiefken D & Duhme F (1999).Eine neue europäische Zusammenarbeit zur Pflege und zum Erhalt von Bäumen im
urbanen Bereich (COST Aktion E 12). In: Dujesiefken, D. and Kockerbeck, P.
(eds.). Jahrbuch der Baumpflege 1999. Verlag Thalacker Medien, Braunschweig. Pp.
260-261. (In German.)
Dujesiefken D, Konijnendijk CC, Randrup TB & Nilsson K (2000).Forschung in Europa über Bäume in urbanen Gebieten. Stadt & Grün, 2000(13),
Sonderheft (special issue): 21-22. (In German.)
Dujesiefken D, Konijnendijk CC, Randrup TB & Nilsson K (2000).Review of research and knowledge on urban forests and urban trees in Europe. In:
Backhaus GF, Balder H, Idczak E (Eds.) International Symposium on Plant Health
in Urban Horticulture, Braunschweig, Germany, from May 22 to May 25, 2000: 19-
22. Mitteilungen aus der Biologischen Bundesanstalt für Land- und Forstwirtschaft
Berlin-Dahlem, Heft 370.
Embo T (1998).COST E12: Urban Forests and Trees. De Boskrant 28(4): 96. (In Dutch.)
García-Martín G & García-Valdecantos JL (2001).El arbolado urbano en las ciudades españolas. In: Montes para la sociedad del nueve
milenio, III Congreso Forestal Español, Granada, 25-28 septiembre 2001: 467-474.
(In Spanish.)
Gundersen V & Sæbø A (2001).Bynært skogbruk - behov for utvikling og kunnskap. Norsk Skogbruk 2001(10): 24-
25. (In Norwegian.)
Konijnendijk CC (1999).Greener European cities: A COST review of research and knowledge on Europe’s
urban forests. European Arborist News June 1999, supplement to Arborist News 8(3).
Konijnendijk CC (2000).Skove som løftestang for bedre lokalområdet. Park og Landskab Videnblade 3.1-26.
Based upon a COST E12 STSM. Skov og Landskab, Hørsholm. (In Danish.)
Konijnendijk CC & Simson A (2000).Community Forest, Jaguarbos en Faith Wood - nieuwe bosbouw, English style. Ne-
derlands Bosbouwtijdschrift 72(6): 240-246. (In Dutch.)
Konijnendijk CC (2002).The urban face of forestry. EFI-News: 3-6.

28
Löfström I & Tyrväinen L (1997).
Kunnat tarvitsevat viheralueohjelmat (vieraskynä-artikkeli). Helsingin Sanomat. (In
Finnish.)
Löfström I & Tyrväinen L (1998).
Suomi mukana COST -hankkeessa. Viherympäristö 1. (In Finnish.)
Löfström I & Tyrväinen L (1999).
Maisemalliset ja ekologiset arvot taajamametsien vuorovaikutteisessa suunnittelussa.
Julkaisussa: Virtanen, E., Saarinen, J. & Raivo, P. (Eds.). Metsä, Harju ja Järvi:
suomalainen maisematutkimus ja -suunnittelu uuden vuosituhannen kynnyksellä: 8.
Abstract, pp. 8. (In Finnish.)
Nilsson K (1998).
Presentation of COST Action E12 ‘Urban Forests and Trees’. In: Krott, M. and K.
Nilsson (eds.). Multiple-use of town forests in international comparison.
Proceedings of the first European Forum on Urban Forestry, Wuppertal, May 1998:
101-105. IUFRO, etc.
Nilsson K, Konijnendijk CC & Randrup TB (2000).
State-of-the-art of research and knowledge on urban forests and trees in Europe.
Abstract. In: Forests and society: the role of research. Volume 2: abstracts of group
discussions. Proceedings of the XXI IUFRO World Congress, Kuala Lumpur, 7-12
August 2000: Kuala Lumpur. Pp. 270-271.
Nilsson K, Konijnendijk CC & Randrup TB (2000).
Urban forestry: where people meet trees. In: Community Forestry - a change for the
better. Conference Proceedings: 28-31. 7-8 December 1999, London. Forestry
Commission & Countryside Agency. Pp. 28-31
Nilsson K, Konijnendijk CC & Randrup TB (2001).
Linnanmetsandus - Euroopa perspektiiv. Linnanmetsad ja linnanmetsandus Eestis.
Akadeemilise Metsaseltsi toimetised XVI: 17-24. Forest Research Institute of EAU,
Tartu. Pp. 17-24. (In Estonian.)
Nilsson K & Randrup TB (1997a).
Urban and periurban forestry. In: Forest and tree resources. Proceedings of the XI
World Forestry Congress, 13-22 October 1997, Antalya. Volume 1: 97-110. Antalya.
Nilsson K & Randrup TB (1997b).
What is urban forestry? BUFPRA Newsletter 1(2): 2.
Nilsson K & Randrup TB (1998).
Internationell fokus på parker och parkforskning. Utemiljö 1998(4): 33-38. (In
Swedish.)

29
Oven P (2000).Kaj pravzaprav je arboristika. (Actually, what is arboriculture, English abstract).
Proteus 63(2): 78-81. (In Slovenian.)
Pauleit S (1999).Study in Southeastern Central Europe identifies need for urban forestry approach.
European Arborist News, August 1999, supplement to Arborist News 8(4): 43.
Pillmann W (2002).Tree preservation legislation in European cities. Results of a COST E12 pilot study.
Unpublished manuscript. (In German.)
Randrup TB & Konijnendijk CC (1999).Urban Greening - Research symposium ‘Urban Greening and Landscape
Architecture’, Denmark, June 23-25, 1999, IUFRO 6.14.00. IUFRO News 28(3): 7.
Randrup TB & Nilsson K (1997a).Fokus på bytræer i europæisk samarbejde. Grønt Miljø 1997(6): 72-75. (In Danish.)
Randrup TB & Nilsson K (1997b).Research on urban trees in Europe. In: ISA. Proceedings of the III: Europäischer
Baumpflege-Kongress, Merano, 14-16 May 1997. Pp. 133-141.
Randrup TB & Nilsson K (1999a).Co-ordination of European research: Urban Forests and Trees. EFI News 7(1): 3.
Randrup TB & Nilsson K (1999b).Internationalt forskertræf om byskove og bytrær- Holdes i København til juni som
led i verdenskongres for landskabere. Grønt Miljø 1999(1): 54. (In Danish.)
Sander H (1999).Symposium ‘Urban Greening and Landscape Architecture Research’. Baltic Forestry
5(2): 75.
Seeland K (1999).Die sozialintegrativen Wirkungen von Parks und Wäldern als gestaltete Naturräume.
Erste Ergebnisse zweier Untersuchungen in der Schweiz und in Deutschland.
(Results of Swiss COST E12 study.) Schweizerische Zeitschrift für Forstwesen 10: 362-369.
(In German.)
Seeland K (1999).Peri-urbane Natur im Spiegel zukünfstiger Nutzungsbedürfnsse. In: Eidg.
Forschungsanstalt für Wald, Schnee und Landschaft, Forum für Wissen 1: 7-11.

30
Seeland K & Nicolè S (1999).
Studio sulle potentialità d’integrazione sociale offerte da spazi naturali. Due essempi
di progetti con persone disabili in Svizzera e Germania. (Results of Swiss COST
E12 study.) Forstwissenschaftliche Beiträge der Forstprofessur Forstpolitik und
Forstökonomi 22. 140 p. (In Italian.)
Seeland K, Chiari Ch & Nicolè S (2000).
Gardino per tutti. Sociale negli spazi naturali. (Results of Swiss COST E12 study.)
Architettura del paessaggio 5: 4-7. (In Italian.)
Simson A (1999).
The three net/works. Landlines July 1999: 6.
Siwecki R, Szyper L & Rosiak S (2000).
Management and protection of urban forests and urban trees in Kolberg. In:
Backhaus GF, Balder H, Idczak E (Eds.). International Symposium on Plant Health
in Urban Horticulture, Braunschweig, Germany, from May 22 to May 25, 2000: 224-
230. Mitteilungen aus der Biologischen Bundesanstalt für Land- und Forstwirtschaft
Berlin-Dahlem, Heft 370. Pp. 224-230.
Steidle-Schwahn A (1999).
Urban Greening and Landscape Architecture - Forschungssymposium vom 23.-25.
Juni 1999 in Kopenhagen. Stadt und Grün 11(1999): 742-744. (In German.)
Sæbø A & PA Pedersen (2002).
For få treslag brukt langs gater og veier. Trepleie 2002(1): 13-15. (In Norwegian.)
Smith K & Oven P (2000).
Arboriculture in Ljubljana, Slovenia. Arborist news 9(4): 43-45.
Broeck A Van den (2001).
Inheemse olmen behoeden voor uitsterven - Internationale bijeenkomst van
wetenschappers. Groenkontakt 2001(6): 23-24. (In Dutch.)
31
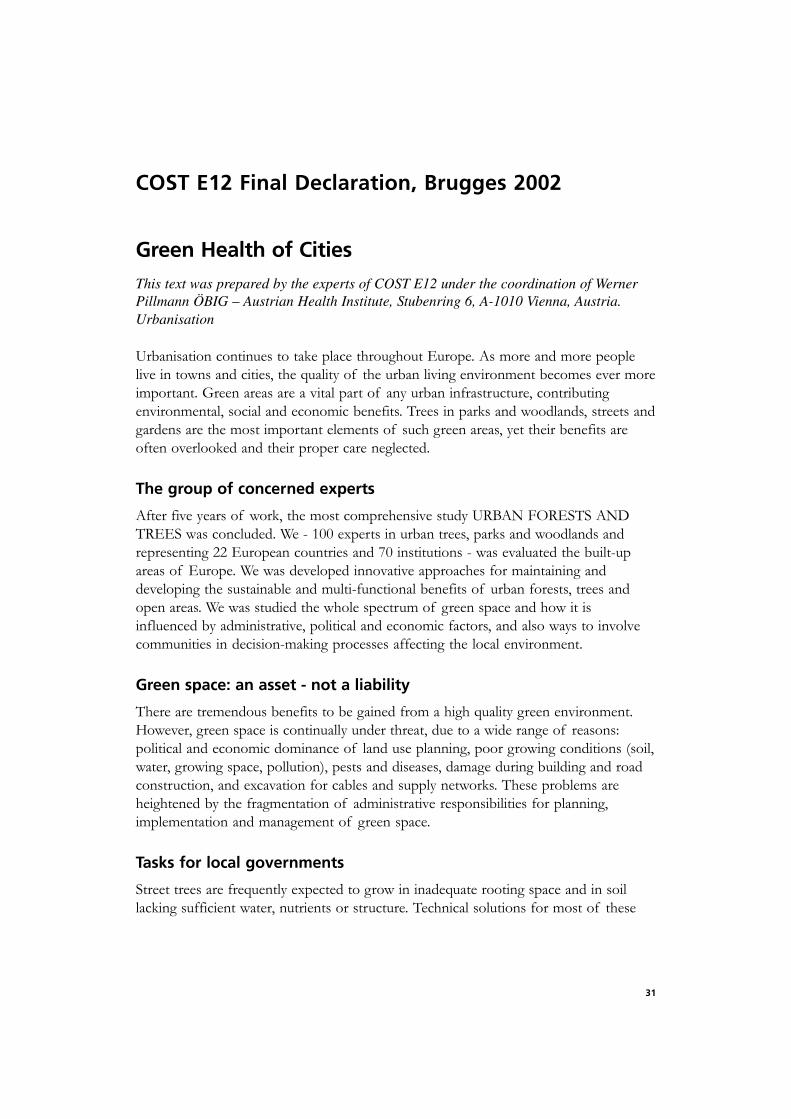
COST E12 Final Declaration, Brugges 2002
Green Health of Cities
This text was prepared by the experts of COST E12 under the coordination of WernerPillmann ÖBIG – Austrian Health Institute, Stubenring 6, A-1010 Vienna, Austria.Urbanisation
Urbanisation continues to take place throughout Europe. As more and more people
live in towns and cities, the quality of the urban living environment becomes ever more
important. Green areas are a vital part of any urban infrastructure, contributing
environmental, social and economic benefits. Trees in parks and woodlands, streets and
gardens are the most important elements of such green areas, yet their benefits are
often overlooked and their proper care neglected.
The group of concerned experts
After five years of work, the most comprehensive study URBAN FORESTS AND
TREES was concluded. We - 100 experts in urban trees, parks and woodlands and
representing 22 European countries and 70 institutions - was evaluated the built-up
areas of Europe. We was developed innovative approaches for maintaining and
developing the sustainable and multi-functional benefits of urban forests, trees and
open areas. We was studied the whole spectrum of green space and how it is
influenced by administrative, political and economic factors, and also ways to involve
communities in decision-making processes affecting the local environment.
Green space: an asset - not a liability
There are tremendous benefits to be gained from a high quality green environment.
However, green space is continually under threat, due to a wide range of reasons:
political and economic dominance of land use planning, poor growing conditions (soil,
water, growing space, pollution), pests and diseases, damage during building and road
construction, and excavation for cables and supply networks. These problems are
heightened by the fragmentation of administrative responsibilities for planning,
implementation and management of green space.
Tasks for local governments
Street trees are frequently expected to grow in inadequate rooting space and in soil
lacking sufficient water, nutrients or structure. Technical solutions for most of these

32
problems was brought together by the group during the course of the COST Action2
and are highly advisable for implementation. Spatial considerations of trees and green
space should be an increasing aspect of design and landuse planning. The monitoring,
design and management of urban greenery have to be fully integrated throughout all
aspects of city administration.
Tasks within Europe
There is a real need to strengthen legislation designed to protect urban greenery. A
consistent approach to tree preservation within and between European countries
would be advisable. Good practices should be introduced at all stages.
We call upon local and national politicians in all European countries to develop sound
policies for the appropriate planning, management, funding and long-term administra-
tion of urban green areas. Properly managed forests and trees are essential for
underpinning the quality of urban life, enabling European towns and cities to develop
as sustainable and enjoyable places for people to live, work, recreate and play.
2 COST: European Cooperation in the field of Scientific and Technical Research, Action E12
„Urban Forests and Trees“

33
Policy-making, planning and design forurban forests and trees
Chapter 2

35
Urban Forestry and Open Space in the UrbanisedContext of Western Europe: A policy Point of View
Peter JanssensSecretariat General of the BeneluxRegentschapsstraat 39,B-1000 Brussels, Belgium
Introduction
This contribution deals with the role and the function of open spaces, and more
specifically urban forestry, in the development of a spatial policy for Western Europe
in general and for the Benelux countries more specifically.
The spatial context
Western Europe can be characterised as a very urbanised area in the European Spatial
context. The study on the Central and Capital Cities and Regions (the so-called ‘CCC
study’), one of the studies in the framework of the program Europe 2000+ of the
European Commission in the beginning of the 1990s, dealt with the spatial
developments in the area covering the south–east of the United Kingdom, the western,
southern and eastern parts of the Netherlands, the whole of Belgium and
Luxembourg, the northern part of France, and the western part of Germany. The
northern part of the area is characterised by population densities of more than 500
inhabitants/km² while in the southern parts 145 is the average. The CCC study
estimated that 66,5 % of the CCC population lives in urban areas, which is much
higher than the EU average of 55,7 %. About 54 % of the CCC population lives in
urban areas of more than 50,000 inhabitants; more specifically 39,3 % is living within
the six metropolitan systems (London, Paris, Rhine-Ruhr, Rhine-Main Randstad and
ABG-stad (Antwerp, Brussels, Ghent)). 14.8% lives in urban areas of more than
50,000 inhabitants outside these six metropolitan systems. In contrast to that, 74,3 %
of the CCC area is considered as non-urban and is populated by 33,5 % of the CCC-
population (see Figure 1).
This study was aimed at exploring and defining the issues relevant for a transnational
spatial policy. The study had a so-called prospective character and defined a macro-
spatial structure as well as making a comparison between two spatial development
scenarios. The first was a trend scenario based on the assumption that each region and
estate continues to develop their own spatial policy, trying to develop their practical
answers to the issues and problems that arise (see Figure 2). The second, policy

36
scenario, however demonstrates the impact and rule of the more coherent and
commonly developed transnational spatial policy (see Figure 3).
Together with a wide range of issues the environmental issues demonstrated some
transnational and commonly recognised problems all over the CCC area. Some of
them, relevant in relation to forestry, dealt with the over-exploitation and the lowering
of the groundwater level, a problem which seems to be intensively related to the
presence of large population numbers in the urbanised neighbouring regions. Other
issues dealt with pollution of ground water and surface water reserves e.g. by pesticide
leaching. The wood production in the CCC area was estimated to be 21,5 million m³
while the consumption was estimated at 66,5 million m³. This means that annually 45
million m³ has to be imported.
In the development and comparison of the two spatial development scenarios, two
separate but important aspects of forestry in this very urbanised context became
visible. The first issue was the recognition of the very important role of forests in the
‘heads’ of the river basins. As one can observe the most urbanised areas and the large
population concentration are situated in the lower parts of the main rivers, such as the
Rhine, the Meuse and the Scheldt. The water provision to these population masses is
Figure 1. Population density in the CCC area.

37
served directly by the rivers, but indirectly also by feeding the groundwater reserves.
This means that upstream parts of the river basins play a role as regulator of the
quantity and quality of water, in relation to the lower situated and densely populated
areas. Especially woodlands are very important in playing this role. In the CCC study
this double role was described as the ‘Sponge’ and the ‘Filter’ function of woodlands.
Forests, as they are very present in for example the Ardennes, the Eiffel, and Saarland,
Figure 2. Trend scenario for the CCC area.
Demography:Urban growthStationary or recoveringDominant patterns of declineUrbanization in progress
Urban areas:Metropolitan areasCitiesInner-city declineUrban and semi-urban reconversion areas
Rural areas:Intensively used by agriculture facing economic threatsWith limited agricultureUnder urban pressureMain woodlandAreas with rural tourism
Coastal areas:Coastal areas with concentrations of human activityNatural and semi-natural coastal areas
Infrastructure:Eurocorridors in formationAirportsSeaportsCongestion in air trafficBarriers to integration
Environmental issues:Consentration of urban environmental problemsConsentration of safety risks (nuclear, Seveso, ...)Main riversMost polluted riversCoastal pollution
Trend scenario

38
therefore have a crucial role to play in relation to the quantity and also the quality of
these water reserves. Beside that, the forests play a crucial role in what planners often
call ‘spatial quality’. More specifically, in their role as a counterweight for the very
urbanised areas, woodlands constitute building stones for rural areas or open spaces.
This is true on two levels: on the transnational level, the green areas of the Ardennes,
Eiffel, Saarland and the northern part of Luxembourg were considered as very
important counter weights for the lack of openness and the high population densities
in the urbanised metropolitan systems. The growth of different kinds of rural tourism,
Figure 3. Policy scenario for the CCC area.
Metropolitan cooperation and connectivity to be improvedEurocorridors to be developed
Existing metropolitan areas, need:internal restructuringquality improvementreduced congestion
Potential for crossborder metropolitan development to beplannedCluster of urban areas for coordinated planning
Urban areas with different development characteristicsnear a metropolitan system
´freestanding’ urban areas
in econversion areas
in coastal areas
in border areas
Rural areas with agriculture to be regenerated
Environmental issuesImprovement of urban environment recommended
‘Green Belt’ strategy
Environmental sanitation in rural areas
Tentative main ecological structure
Increased inter-regional water management
Accelerated economic restructuring necessary
Development possibilities

39
and the increase of short holidays, demonstrates this role and the tourist potential
becomes a very important issue in the spatial policies of these areas. Secondly, on a
more regional or local level, forests play a very important role in structuring the
developments of the urban fringes. The CCC study also demonstrated the need for a
common application of the so-called ‘Green Belt’ strategies for the surroundings of
the large urban areas. This is necessary, not only to maintain the contrast between
urban and non-urban areas but also to structure the urban development and avoid
unstructured and space consuming sub urban developments, which hampers dynamic
and attractive urban development.
An attractive urban and suburban environment was even considered sometimes as a
prerequisite for attracting important economic functions, as demonstrated by the case
of Frankfurt, where the concentration of financial business is (partly) explained by the
presence of attractive woodlands in the neighbourhood.
In the development of the different variations of these kind of greenbelt strategies, the
development of common spatial patrimony, recognised and given a high symbolic
value by the urban people, is considered as very important for the protection for these
open areas. Public recognition and the public symbolic value can best be demonstrated
by means of urban forests, in a harmonised balance with non-forest landscapes with a
high cultural value. They contribute to the spatial qualities of urban areas and urban
fringes.
Policy answers
The CCC study was a study with a high political character that demonstrated the
common aspects of spatial policies in the north-western European context. Since the
beginning of the 1990s, several efforts have been attempted towards the development
of spatial policies on a transnational level.
Second outline for the Benelux
A first political fact relevant in this context is the development of the Second
Structural Outline of the Benelux. This second structural outline is a commonly
developed point of view and a basis for the Benelux partners (the Netherlands, the
Belgian regions Flanders, Wallonia and Brussels and the Grand Duché Luxembourg)
for transnational spatial policy. The document was accepted by the Ministers of spatial
planning of the five partners in 1997 and ultimately approved in 2000.
The Second Outline starts from the aim to at improve spatial quality as the main
principle. The document recognises the presence and the importance of the
metropolitan systems, in this document called ‘urban networks’, as basic building

40
stones in the transnational spatial policy. Not only the known urban networks, such as
the ‘Central Belgian Network’ or the Dutch ‘Randstad’ (actually called the Delta
metropolis) but also the cross border networks such as MHAL and the French Belgian
metropolis (encompassing amongst others Lille, Tournai Kortrijk) are recognised. The
role of open areas in the surroundings of the urban areas on the macro level as well as
on the micro level is recognised and the interrelation between regions dealing with the
common water issues also demonstrated. Especially the concept of a ‘Network of
open areas’ in the central and strongly urbanised Benelux Delta is very relevant in this
context (see Figure 4). This network of open areas is supposed to play a role as a
buffer in relationship to the development of the urban areas.
Figure 4. Main principles of the Second Structural Outline of the Benelux.

41
The second structural outline is the common basis of the Benelux partners in common
positioning of the points of view towards European spatial planning, for the
development of their proper spatial policy and for the cross border co-operation. The
outline has also proved to be a common building block in the development of the
European Spatial Development perspective and several Interreg1 development projects.
The European Spatial Development Perspective
Another important fact in this context is the acceptance (in Potsdam 1999) of the
European ‘Spatial Development perspective (ESDP)’. In this document, the result of a
long term intergovernmental process (1993-1999) and basically the product of the
member states together with the European Commission, the issues identified in the
CCC study are more or less confirmed as important.
The ESDP also stresses the need for a well-considered and balanced development of
the urban fringes and the negative effects of an unstructured and chaotic urbanisation
1 A programme to strengthen collaboration between the regions of the European Union.
Figure 5. Cross-border urban networks
Grens overschrijdende Réseaux(Stedelijke) (Urbains)Netwerken Transfrontaliers
Toplocaties in Localisationsstedelijke préférentielles dans
knooppunten en les noeuds etnetwerken réseaux urbains
Pilcotproject Projet pilotelandschapspark parc paysagerKempen-Zeelan Kempen-Zeeland
Stedelijke Noeuds urbainsKnooppunten
Stedelijk gebied Zone urbaine
Internationaal Réseau urbain stedelijk netwerk International
Grensoverschrijdend Réseau urbainstedelijke netwerken transfrontalier
Rijn Scheide Delta Zone de contact du contactzone Delta Rhin-Escaul
Bestuurlijke Capitale administrative hoofdstad
Belangrijke relatie Relation Importante
1 Randstad Holland
2 Reseau urbain central belge/centraal Belgisch stedelijk netwerk
3 Rhein-Ruhr4 Ile de France - Bassin Porssien5 Greater London
GPCICOPIT Lille-Kortrijk Mouscron-leper RoeselareSarlorlux Scarland-Lorraine-Luxembourg
MHAL Maastricht-HeerlenHassellt/Genk-Aachen-Liege
ANKE Arnhem/Nijmegen-Kleve-Emmerich
HEG Hengelo/Enschede-Gronau

42
process. Moreover, it recommends the development of partnerships and intense
interrelations between urban and rural areas in order to safeguard their specific spatial
development and manage the interdependencies. Also the role of woodlands in the
general policy of the transnational water management is (again) underlined.
Interreg IIC and IIIB
A third important aspect of the Transnational Policy evolution is the development of
the Interreg Program. The Interreg IIc program (1999-2001) and the Interreg IIIb
program (2002-2006) are supporting several transnational projects aimed at developing
several aspects of the transnational spatial policy. Regional and/or local partners
elaborate these projects and some of them deal specifically with the issues of open
areas in relationship to the urbanised context, as described above.
One relevant project, called ‘Sustainable Open Space’ (S.O.S.), dealt with open spaces in
the urbanised context. The outcome of it can be basically described as the exchange of
points of view and experiences, but also a platform for strengthening the importance
and the political awareness for open areas. Forestry is recognised as an important
building stone in this context.
Another project, called ‘Network of Cross Border Urban Networks’, was also a
platform of commonly developed new research, exchange of experience and a political
platform for cross-border urban networks. Amongst others, the importance of open
areas policy in the development of the ‘new’ cross border networks in the European
spatial, domain is demonstrated (Figure 5).
The Interreg IIIb program has not yet been fully developed in order to point the
relevant issues and projects in relation to the issue of this paper, but it can be expected
that some projects will also deal with the issues of open areas.
Also others projects in the Interreg IIc program, such as ‘Eurbanet’ dealing with the
development of the international Urban Networks, have partly paid attention to spatial
quality and the role of nearby open areas.
National and regional spatial planning
Beside the development of common transnational policy documents and projects, it is
remarkable that the internal spatial policy within nations and regions and the awareness
of the alignment of the urban developments become very important but sensitive
elements. In the Flemish region for example the ‘alignment processes’ of urban areas
are an important priority. Also in the Netherlands, with the recently developed Fifth
National Policy Document on Spatial Planning, the alignment process (called
43
‘Contourenbeleid’) has become very important. In the spatial policy of other Benelux
partners, such as the Walloon and the Brussels region, and Luxembourg, the urban
fringes and specifically the woodlands become very important issues as well.
Interesting is the case of the so called ‘Zoniënwoud’, a large woodland in the south-
east of the Brussels region. This forest fully plays the role of urban forest for the
Brussels urban area, but also crossing the borders with the Flemish and the Walloon
region. The so-called Walloon axe, the urban network connecting the main urban areas
in Wallonia from the west to the east, is in the south bordered by a string of urban
forests, playing their role as a counterpart. The urban fringe of Luxembourg as well is
characterised by the presence of urban forests. It can be assumed that these issues are
now commonly accepted as very relevant issues in national and regional spatial policies.
General conclusion
In none of the issues described above, urban forests are considered as the only
relevant issue in the spatial policy of these urban areas and urban fringes. But on the
other hand, urban forests are commonly considered as very important building stones
for the development of an active open space policy, as counterbalance for the urban
areas.
More specifically it is assumed that urban forestry has an important role to play in an
integrated spatial policy and therefore spatial planners expect urban forestry to provide
a real contribution to the general aim at the improvement of the spatial quality. The
decreasing role of the agricultural sector creates a challenge to create new and active
functions in order to exploit the specific spatial potentials of these open spaces in the
urban context and to maintain and improve the general spatial qualities. It is within this
context that spatial planning and urban forestry become objective partners in creating
spatial quality.
The specific spatial condition of Northwest Europe can in this context be considered a
very interesting challenge. This observation also implies an invitation towards the
urban forestry sector to take up this challenge, in order to demonstrate the specific role
of urban forestry in the general aim for a better spatial quality and thereby the
sustainable spatial development in general and in West Europe more specifically.
Literature used
De Boe Ph, Vanhecke E & Janssens P(2000).
Spatial Integration. Study Report on European Spatial Planning. Final Report.
Nordregio.

44
D’Hondt F & De Boe Ph (2002).
Benelux & Interreg: van visie naar inter-actie. Adviesnota voor de Bijzondere
Commissie voor de Ruimtelijke Ordening van de Benelux Economische Unie.
Europe 2000+ (1994).
Coopération pour l’aménagement du territoire européen. Commission Européenne
DG16, Brussels.
European Commission (1999).
European Spatial Development Perspective, Op weg naar een evenwichtige en
duurzame ontwikkeling van het grondgebied van de EU. Brussels.
Ipenburg D & Lambregts B (2001).
Polynuclear urban regions in North West Europa. A survey of key actor views.
Report of the Eurbanet project. Housing and Urban policy studies. OTB Research
Institute for housing, urban and moblity studies. Delft Univerity of Technology,
Delft.
Janssens P (1994).
Regio’s in Noord-West Europa: ontwikkelingen en beleid. Presentatie voor de
Planologische Discusssiedagen te Eindhoven op 30 mei 1994. Published in
Stedebouw en Volkshuisvesting.
Janssens P (1998).
Over het bos en de bomen. De relatie tussen het EROP, Europa 2000+, Interreg
IIC en de Tweede Structuurschets voor de Benelux. Janssens, P. In: EROP Katern:
’Er op of Er onder’. Planologisch Nieuws 18(3).
Janssens P & D’hondt F (1999).
Europese en transnationale ruimtelijke planning. Een discussie waard! TROS
(Tijdschrift voor Ruimtelijke ordening en Stedenbouw.), Die Keure.
Janssens P (2001).
De actuele en potentiële betekenis van geïntegreerd transnationaal en Europees
ruimtelijk beleid in (open) ruimten onder verstedelijkingsdruk, Symposium Open
Ruimtefuncties onder Verstedelijkingsdruk. Proceedings. Flemish Ministry of
Environment and Agriculture, Brussels.
Joint Operational Programme for the North-Western Metropolitan(XXXX).
Area. Interreg IIC Community Initiative Programme 1997-1999.
Prospects for the development of het central and capital cities and regions (1996).
European Commission Directorate General 16, Brussels.

45
Réseau de réseaux (Urbains) Transfrontaliers (2001).
Laboratoire de cooperation Transfrontalière. Rapport final du projet Interreg IIc
“Reseau de réseaux (urbains) transfrontaliers”. Secretariat Général de Benelux et
Ministère de la Région Wallonne.
Tweede Benelux Structuurschets. Concept . Ruimte voor Samenwerking. (1996).
Secretariaat-Generaal voor de Benelux, Brussels.
Tweede Benelux Structuurschets. Beslisnota. Ruimte voor Samenwerking. (1996).
Secretariaat-Generaal voor de Benelux, Brussels.
Sustainable Open Spaces. Report of the Workshops (2001).
(co-financed by Interreg IIc).


47
Realising Urban Forests in Flanders: A PolicyPerspective
Jeroen Nachtergaele1, Rik De Vreese2, Raoul Vanhaeren1 and Jos Van Slycken3
1 Ministry of the Flemish Community, Forest and Green Areas Division, Brussels, Belgium2 Flemish Forest Organisation, Gontrode, Belgium3 The Institute of Forestry and Game Management, Geraardsbergen, Belgium
Abstract
Flanders (Belgium) has a low and spatially unequally distributed forest cover with
extremely fragmented forests both in terms of space and property. To cope with this a
forest expansion programme has been set up in order to reinforce the Flemish forest
structure and to establish large-scale urban forests near cities and in low-forested areas.
Within a highly urbanised region such as Flanders, land pressure and spatial claims in
the vicinity of cities are very high. Therefore the realisation of urban forests in
Flanders is a complex issue, requiring a well-thought-out scenario. Thus the Forest and
Green Areas Division of Flanders has developed a three-step process in cooperation
with the Spatial Planning Division, each step answering an elementary question:
1) Localisation phase ⇒ Where should urban forest be localised?
2) Concept phase ⇒ What should urban forest look like?
3) Implementation phase ⇒ How can the desired urban forest be realised on the
selected location?
The strength and importance of this three-step approach has two elements. First, it
guarantees an equal distribution of money and means over the respective aspects of
the realisation process and allows for specific partnerships and participation schemes
to be made for each of the steps. Furthermore, the decision making process is spread
out over three steps. Given the often-controversial nature of the idea of realising an
urban forest, it is more likely for politicians to accept such an idea gradually.
Key words: urban forests, realisation scheme, localisation, design, implementation.
Introduction
The latest forest inventory reveals that Flanders has a forest cover of 10.8%, which is
amongst the lowest in Europe. Within Flanders, the forest index varies from 2.3 % in
the most westerly province, to 20.6 % in the most easterly province (Figure 1).

48
Besides the problem of a low and spatially unequally distributed forest cover, forests in
Flanders are also extremely fragmented both in terms of space and property. With
respect to the spatial fragmentation Embo (2001) stated that more than half of the
Flemish forests are smaller than 100 ha and circa 25% are even smaller than 40 ha.
Fragmentation of property in Flemish forests was illustrated by the latest forest
inventory that revealed that circa 70% of the Flemish forests are private property,
while 13% is owned by the Flemish government and 17% by other public owners.
Evidently, the relatively small area of public forests in Flanders has been experiencing
substantial (recreational) pressure. Therefore scientists emphasised the need to
reinforce the existing Flemish forest structure, and to establish large-scale urban forests
in the vicinity of densely populated areas and areas short of forest (Embo 2001).
Forest expansion programme in Flanders
The forest expansion programme in Flanders is embedded in the Spatial Structure Plan
for Flanders (SSPF). In order to face the spatial challenges within Flanders the Flemish
government has (since 1992) been working on a spatial policy based on a new planning
methodology called structure planning. Structure planning is characterised by a
coherent approach of the spatial claims by various economic and social activities. The
law on spatial planning of July 24th of 1996 has provided the legal basis for structure
planning. Since this law the Flemish region, provinces and municipalities have the
authority to develop their own spatial policy, with the principle of subsidiarity as an
essential framework for task separation between the three administrative levels.
The SSPF contains essential options for the spatial development of Flanders and
hence provides a frame for the preparation, assessment and execution of all decisions
with spatial impact for the next ten years.
Figure 1. Forest indices in Flanders per province. The average forest index for Flanders is 10.8%.
2.3% 5.6%
16.2%
12.0%
20.6%

49
With respect to forest expansion, the SSPF states that by the year 2007, 10,000 ha of
new forest will be needed to meet social demand in Flanders. The Flemish forest
expansion programme comprises the creation of 10,000 ha of forest (expansion) areas
in zoning plans (plan expansion, PE) and the creation of 10,000 ha of new forest
(effective expansion; EE). Evidently, the PE and the EE will overlap to a large extent.
Yet, it is important to distinguish between PE and EE as to prevent the Flemish forest
expansion programme from remaining a simple desktop exercise. In other words, the
Flemish forest expansion programme requires the actual implementation of the spatial
options taken in zoning plans. The Forest and Green Area Division of the Ministry of
the Flemish Community has subdivided the 10,000 ha of PE for Flanders over its five
provinces, hereby aiming at compensating the actual inequality of forest distribution in
Flanders (Figure 2). Figures for the EE (Figure 2) show that 13,665 ha, rather than
10,000 ha have to be realised. The difference between both figures is explained by a net
deforestation between 1994, the SSPF reference year, and 2000, the start of the
Flemish forest expansion programme. This observation emphasises the importance of
the Flemish forest expansion programme, since the programme not only aim to create
new forests, but it first has to reverse the existing trend of deforestation. With respect
to the latter, the Flemish government has installed a moratorium on any form of
Figure 2. Planned and effective forest expansion in Flanders figures given per province.
2500 3000
1500
1500
1500
total=
10 000 ha
Planned Expansion
2441(+59)
3416(-416)
3184(-1684)
1885(-385)
2739(-1239)
total=
13 665 ha
Effective expansion (situation 2000, reference 1994)

50
deforestation, while for forest expansion the Flemish government has installed a
special forest expansion unit (consisting of 8 persons in total) within its Forest and the
Green Areas Division. The Flemish government aims to acquire 1000 ha of new forest
per year. Moreover, partnerships with local authorities and private individuals should
lead to the realisation of the required 13,665 ha of new forest.
Priorities within the Flemish forest expansion programme have been defined as:
- De-fragmentation of existing (public) forests;
- creation of large multifunctional forests; and
- creation of recreational forest complexes nearby urbanised areas (urban forests).
Within this priority list, one of the major challenges is the realisation of urban forests
within the direct neighbourhood of Flanders’ major cities. Within a highly urbanised
region such as Flanders, land pressure and spatial claims in the vicinity of cities are
very high. Therefore the realisation of urban forests in Flanders is a complex issue,
requiring a well-thought-out scenario. The Forest and Green Areas Division has, in
cooperation with the Spatial Planning Division, developed a three-step process.
From idea to realization of an urban forest, three phases are considered, each of them
answering an elementary question:
Localisation phase ⇒ Where should urban forest be localised?
Concept phase ⇒ What should urban forest look like?
Implementation phase ⇒ How can the desired urban forest be realised in the selected
location?
Localisation phase
A first step in the creation of an urban forest consists of finding a location that is both
suitable and feasible. Van Elegem et al. (2002) have developed a multicriteria analysis to
select such locations. Essentially, the methodology of Van Elegem et al. (2002)
considers three phases (Figure 3):
(1) The excluding phase, where exclusive criteria are used to select a number of locations
potentially suitable for the creation of an urban forest.
(2) The ordering (or ranking) phase, when the potential locations from the excluding phase
are tested for their suitability. This leads to the selection and ranking of a limited
number of ‘most suitable locations’. Criteria used for this selection can be
subdivided into three groups: (a) criteria related to functional elements, (b) criteria
related to structural strengthening of the landscape, and (c) criteria related to
ecological quality.
(3) Phase 2 is followed by feasibility phase, when the most suitable locations are tested for
their feasibility. This last phase should guarantee the realisation of an urban forest
within a relatively short term.

51
A more elaborate overview of the methodology to select the best locations for new
urban forests using multicriteria analysis can be found in Van Elegem et al. (2002).
The concept phase
After having selected a suitable and feasible location for the creation of an urban
woodland (localisation phase), the next question to be addressed is What should the forest
look like? The second phase, which is called the concept phase, concentrates on the
optimal lay out of the urban forest to be created. In order to reach this optimal lay out,
a two-step approach is followed.
Step 1: inventory
An inventory of the area selected for the future urban forest should reveal (a) the
historic and current land use, (b) the current biotic and a-biotic characteristics, (c) the
judicial context (zoning, property, protected areas, etc.) and (d) the actual functional
and spatial organisation of the area (internal as well as external). Through such an
inventory both the pull and push factors of the area can be mapped out, which, in
turn, serves as a basis for step 2: the development of the urban forest’s future design.
Step 2: conceptual framework
The development of a conceptual framework for the future urban forest is the result
of a continuous exchange of information between the meso- and micro-scale. While in
a first stage the most ideal design for the urban forest is developed at the meso-scale, a
Figure 3. Scheme for the localisation phase of the Flemish forest expansion programme (after VanElegem et al. 2002).
1 Excluding phase excluding criteria
Search Area
Parts of the
search area
Most suitable locations
Most suitable and
feasible locations
filter Examine against the desired
profile of the urban forest– Functional elements
– Structural elements
– Ecological elements
3 Feasibility phase
2 Ordering phase
Potential
locations
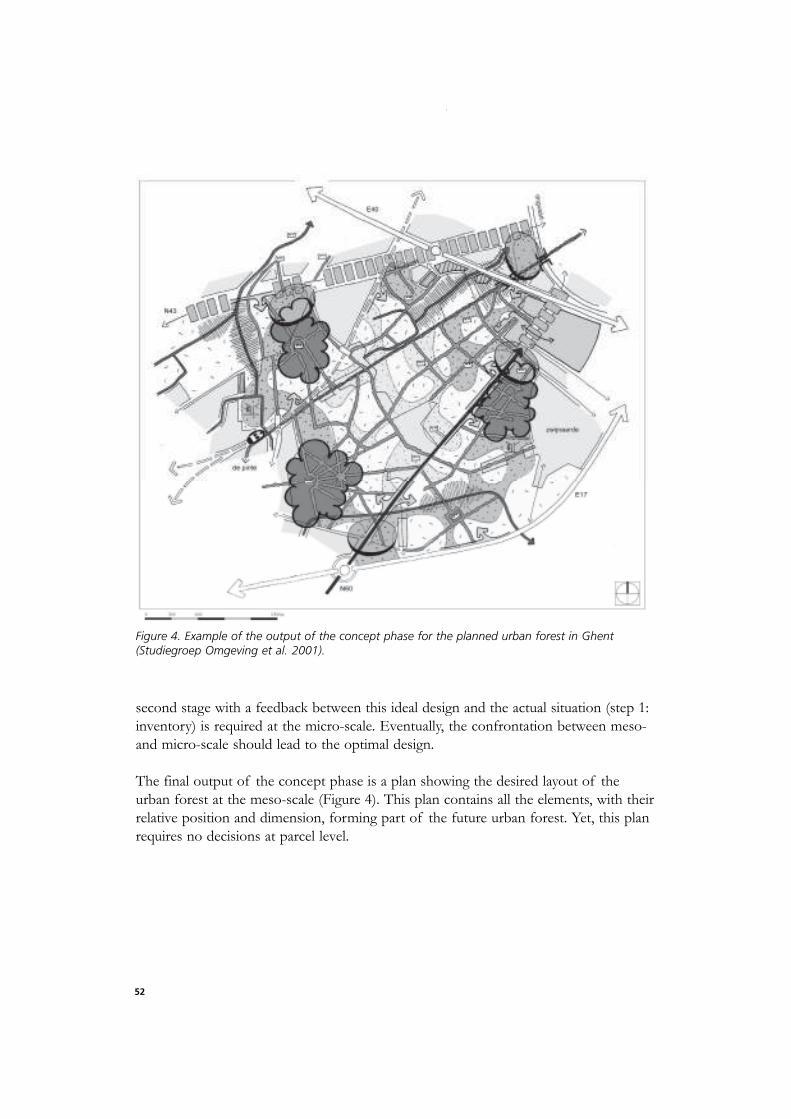
52
second stage with a feedback between this ideal design and the actual situation (step 1:
inventory) is required at the micro-scale. Eventually, the confrontation between meso-
and micro-scale should lead to the optimal design.
The final output of the concept phase is a plan showing the desired layout of the
urban forest at the meso-scale (Figure 4). This plan contains all the elements, with their
relative position and dimension, forming part of the future urban forest. Yet, this plan
requires no decisions at parcel level.
Figure 4. Example of the output of the concept phase for the planned urban forest in Ghent(Studiegroep Omgeving et al. 2001).

53
The implementation phase
Once the design for the urban forest to be developed is available, a scenario to
transform the actual situation into the designed situation has to be worked out. This
transformation process is subject of the third phase, called the implementation phase.
This implementation phase should guarantee that plans made in phase 2 would actually
be executed in the field.
Conclusions
In conclusion of this paper dealing with the policy perspective on realising urban
forests in Flanders: the Forest and Green Areas Division wants to stress both the
strength and the importance of their three-step approach.
First, splitting up the process ‘from idea to realisation of an urban forest’ in three
separate, well-defined steps guarantees that the input of money and means is equally
distributed over the respective aspects of the realisation process, with no chance of
owner zone landuse maintenance owner zone landuse maintenance
sustainble
recreation
actual situation
private agriculture forest economic
parcel ID desired situation
forest forestpublic
owner zone land use maintenance
change transfor-
zone mation
actions to be taken
buy forest
Figure 5. Output of the implementation phase, consisting of a table listing the actions to be takento go from the actual to the desired (designed) situation for each parcel of the selected area.

54
neglecting or omitting any of the process steps. Furthermore, the three-step process
enables specific partnerships and participation schemes to be made for each of the steps.
Moreover, not only the realisation process but also the decision making process is
spread out over three steps. It is much more likely for politicians to gradually accept a
controversial idea such as an urban forest. When using the three-step process,
politicians first deal with general interests: do the inhabitants of my city or community
want to have an urban forest? If yes, where should it be located and what should it
look like (step 1&2)? Only after having reached a consensus amongst decision makers
on the first two steps, the implementation phase, where personal interests are involved,
is started. During this implementation phase (step 3) decisions such as what to do with
this single farmer, or that local amateur football club within the perimeter of the urban
forest have to be made. Through lobbying personal interests may have a strong impact
on decision making, and by splitting up the decision making process, one can avoid
that personal interests clash/interfere with general interests, which, and this is the most
important, increases the realisation chances of the urban forest project.
References
Embo T (2001).
Finding public and political support for (new) urban forests. In: Konijnendijk, C.C.
and Flemish Forest Organisation (Eds.) Communicating and financing urban
woodlands in Europe. Proceedings of the 2nd and 3rd IUFRO European Forum
on Urban Forestry. Aarhus, Denmark, 4-6 May, 1999 & Gyarmatpuszta, Budapest,
Hungary, 9-12 May, 2000: 18-21.
Elegem B Van, Embo T, Muys B & Lust N (2002).
A methodology to select the best locations for new urban forests using multicriteria
analysis. Forestry 75 (1): 13-23.
Studiegroep Omgeving, Econnection and Bulck Consultants International (2001).
Gewestelijk RUP voor bosontwikkeling en bedrijvigheid – ontwerp eindrapport
(Regional Spatial Executive Plan for forest development and economic activity –
draft final report.) Under the authority of Ministry of the Flemish Community,
AROHM – Planning Department (ARP).
55
Planning New Forests in the Netherlands
Rien van den BergDepartment of Innovation and Knowledge Management,Government Service for Land and Water Use.P.O. Box 20021, NL-3502 LA Utrecht, The Netherlands.
Abstract
The forest area in the Netherlands is rather limited: forests cover about 8% of the total
land area. Most of the cities are situated in areas with little forest and people must
drive 50 kilometres or more to reach a landscape rich of forests. The lack of forests is
felt the most near the big cities and especially in the Randstad, the metropolitan area in
the western part of the Netherlands. Since the 1960s a national policy to plan and real-
ise new forests has been developed. In the Randstad the ‘Randstad Green Structure’
became an important planning objective in national and regional planning schemes.
The policy for new forests has been rather successful. Although the planned hectares
will not be fully realised, the location of new forests greatly attracted the attention of
professionals in spatial-planning and land-use-planning. New forests emerged like
mushrooms on the planners’ maps and the size of the largest forests grew from a few
hundred hectares (Bieslandse Bos) to a few thousand hectares (Horsterwold and
Bentwoud).
With the growing size of new forests the problems of planning and realisation also
increased. These include booming land prices, opposing farmers, traversing roads and
railways and local politics. Especially the Bentwoud in the province of Zuid-Holland
(South-Holland) illustrates the actual threats and challenges. The land in the new
polders, where the Horsterwold lays, has from the early beginning been owned by the
state. This has made it easier to develop a forest of this size.
Key words: afforestation, urban areas, planning.
Introduction
The topic of this paper are the landscape planning aspects of new forests. In the Net-
herlands a long tradition exists of using forests as a tool for improving and enhancing
landscape qualities. The flat country makes trees and forests strong instruments in
shaping the landscape. Planting forests is not always seen as an improvement. It can
disturb the open scenery and wide views typical for the landscape of the polders. But a

56
forest has an inner side, creates its own environment that offers people natural values,
forest landscapes, fresh air and all kind of other experiences. A forest is a mystery that
people need in our technical era. Research shows that 60% of the Dutch people think
they do not have enough forest in their neighbourhood.
Most of the forests in the Netherlands, like in many other countries, belonged to the
‘poor side’ of the landscape and not to the rich front. Only the very poor soils,
unsuitable for agriculture were used for forests. The forest-rich areas lay remote from
the cities in the western, most urbanised part of our country. “People in the cities need
more than grass between the paving stones” one of the great advocates for nature con-
servation and landscape planning (Cleyndert) said to politicians about sixty years ago.
One of the first examples of new forests near the cities was the forest near
Amsterdam, established in the 1930s. The 900 ha ‘Bosplan’ was in fact based on a park
concept with one-third grass, one-third water and one-third forest. The dominant
influence of trees and forest in its appearance gives it the character of a forest. The
Amsterdamse Bos was an initiative of the city. At that time no national policy existed.
Following the Second World War landscape planners experimented with new forests in
land consolidation plans. Examples are the rehabilitation of beautiful landscapes
(Walcheren) in the province of Zeeland which were destroyed by floods after the
Second World War and in 1953. Another example is the creation of complete new
landscapes in the IJsselmeer polders, land established at the site of a former sea in the
middle of the country. In these experimental phase timber production and recreation
were important functions but structuring the landscape was the leading principle in the
design. Land development plans often provided the legal framework for the mentioned
forests. These plans facilitate the availability of land on the right place, budgets, an
integrated planning approach and the organisation of the implementation. This ap-
proach covers about one third of the total land area of the Netherlands.
Need for policy development
In the 1960s ideas came up for a systematic approach for new forests near the cities.
People from the State Forest Service took the initiative to plan new forests and give
them a place on spatial planning maps. A specific policy was needed because of the
spatial dynamic environments around the cities, with intensive land use and constant
urban pressure. Forests need time to develop their values and need to be protected
against sudden land use changes. Investments in new forests are worthless if after
thirty years the whole forest is cut in order to establish an airport or a settlement. Little
changes at the edges of a forest, new spatial relations with other natural or even urban
areas are another story. They often enhance the diversity of the landscape. Since the
1960s many planning studies for new forests were executed and pilot projects and de-
sign competitions undertaken. But without a coherent policy, a strong set of instru-

57
ments and budgets, the purposes will not be achieved. It started with the objective of
30,000 ha of new forests mentioned in the long-term forestry plan of 1975. Then the
target was raised to 75,000 ha of new forests in the forestry policy report of 1992.
This paper will focus on the urban forestry part of this policy.
A green structure for the Randstad
In the 1970s a structural foundation was laid for the realisation of 30,000 ha of new
forests in the governmental Report for the rural areas. The establishment of a green
Figure 1. Search-area for new strategic Green Projects in the Randstad.

58
structure for the Randstad, the most urbanised part of the country, with 10,000 ha of
new forest became one of the main objectives of this policy report. The creation of
new state forests was an important instrument. The main functions in the beginning
were recreation, structuring the urban landscape and timber production. Later on, na-
ture functions became more important. People need real forests, not just trees and
forests as green curtains for recreation areas. The difference with green projects
especially for recreation was clearly expressed by the percentage of forest and the costs
per ha. One third of the area in recreation projects and 90% of the area in State forests
should be forested. The costs for the State forests were about one third of the costs
for recreation projects. That was an important argument for politicians: ‘natural’ forests
were much cheaper.
Ideas and plans for new forests emerged. Provincial governments and municipalities
took initiatives for location studies for new forests. State forest projects and land
development projects offered the main planning and organisational framework and
created the confidence for professional realisation and sustainable management. In
1992, six Strategic Green Projects for forests and nature were added to the Randstad
Green Structure (see Figure 1).
Bieslandse Bos and Balij
One of the most profound projects from that first period is the Bieslandse Bos and
the Balij, a new forest east of the government town of The Hague. This project
involves a forest area with a total area of 1000 ha, including 100 ha of water and
agricultural land. The need to create a strong landscape structure for the expected
development of urban settlements and greenhouses was the main motive. In this
project experience was gained with how to use unexpected developments like the
Floriade exposition, were 25 ha of new state forest was one of the exposition objects.
These 25 ha were used as ‘bridgehead’ for the Balij, which connected the Bieslandse
Bos with Zoetermeer, the main New Town in this part of Holland. The two forest
plans together made a really interesting forest area in the middle of existing and plan-
ned urban settlements (see Figure 2).

59
Figure 2. Location of new forest areas north of Rotterdam.
Horsterwold
The IJsselmeer Polders show a developing land use concept from traditional
agricultural polders in the early beginning to the modern Southern Flevoland with its
four functional zones. In this last reclaimed polder - the planned fifth polder
Markerwaard was cancelled - extensive areas are allocated for nature (the famous new
nature reserve Oostvaardersplassen), agriculture, a new city (Almere) for more than
300,000 inhabitants and a new forest (Horsterwold). During the early 1970s, when the
first drafts for this polder were prepared, landscape planners from the State Forest Ser

60
Bentwoud
In 1984, when the Randstad green structure plan was in full implementation, the
question arose how the new forest plans could contribute to ecological values. The idea
of ecological core forests and optimal connections with other ecological hot spots
came up. East of Zoetermeer and north of Rotterdam there remains an agricultural
area with very good soils and a large-scale landscape, i.e. an area with a great potential
for a new forest of a few thousand hectares. On the basis of ecological research the
Province of Zuid-Holland initiated a planning study. The province chose a compact
model for the new forest, with connections to other recreational and natural areas in
the region, like a spider in a web. A bold and fascinating plan was born. Provincial
politicians became enthusiastic and adopted it.
In the first plan the core forest was about 2,000 ha. But the farmers resisted strongly
against the forest plan. Over a few hundred years generations of farmers had had a
good living in this area. They feared the end of agriculture in the whole region because
of the forest. At the end of the regional planning procedure, the core forest will
consist of 1,000 ha with another 1,000 ha of connection zones. There is an option for
another 300 ha in a second phase. Farmers objected to the plan up to the highest
court, the Council of State, but lost because the plan had followed a democratic proce-
dure. Also the importance of a forest to society was a strong argument. This is a signal
for the diminishing role of agriculture in urban areas in the Netherlands.
Figure 3. Zoning in the Hosterwold, withthe silent core in the middle left.
vice introduced the idea of a large
broadleaf forest of 4,000 ha, i.e. a lands-
cape type not existing in the Netherlands
and which is rare even in Western Europe.
The forest was to be established near the
new expanding city and not far from
Amsterdam, Utrecht and the urbanised
Gooi area. A visionary idea and although
the land was owned by the state it took
persuasion and endurance to keep the full
forest plan on the map. The whole forest
plan is executed now, the last stage being a
silent ‘nature core’ in the middle of the
forest. A zoning plan was made with
multifunctional forest, mixed with
recreation and agriculture at the edges, and
a silent core of natural forest in the middle
(see Figure 3 and 4).

61
The Bentwoud project with its connection zones is now part of a larger integrated land
development project. The future forestland must be acquired on a voluntary base. And
that is a weak point in the plan. Farmers do not want to sell their land. They try to
prevent colleagues from selling. Land prices are raised because of urbanisation, inten-
sive land use and speculation. Only one hundred ha has been acquired to date. People
from the Government Service for Land and Water Use, who are assigned to the
project, think that without expropriation there will be no possibility to realise the
whole forest. To keep faith in the forest plan the planting of the first acquired hectares
has started. There is a clear zoning plan with a natural core of grazed forest in the
middle (see Figure 5).
Main questions for forest realisation
A number of questions remain for forest realisation:
- How to execute parts of the plan separately and still contribute to the planned larger
forest as a whole in the future?
- How to hold the interest of politicians and the public when only small fragments are
realised and the qualities of the whole forest are not yet visible?
Figure 4. Recreation mixed with forests in the Hosterwold.

62
- How to keep the area free of all kinds of local land use and urban initiatives which
are detrimental to the new forest?
- How to create an exciting forest were nature values and recreation go together?
- How to take advantage of the large scale of the open area while transforming it in a
forest landscape?
Co-operation with artists
One of the new aspects in working on this forest project is the co-operation with ar-
tists. From the ideas of ten artists, four were chosen to contribute to the forest plan.
The artists were selected because of their ideas about the contribution of the design
process to the concept of the whole forest. Isolated ideas with a land-art character
were not desirable in this stage of development of the forest. In design workshops the
forest planners and landscape architects worked together with the artists to elaborate
their ideas. This also provided answers to some of the questions mentioned above.
One artist concentrated on communication and acted as the forester of the still not
Figure 5. Layout of first part of the Bentwound.

63
existing forest. He stimulated children of schools in the surrounding area to draw their
perfect trees and forest. People started to think about the forest and it already
represents a value. Another artist challenged the planners to create a really exciting
forest and to find innovative tools for the development of natural values, for example
by using the earth-shaping function of streaming water, and to create a certain danger
so that people can loose their way during long walks. Yet another artist concentrated
on the function of the whole forest as a clean cell in an urban and technical
environment. He stressed enhancing the clean qualities. The fourth artist is a
Frenchman. He brought in the idea to see the forest as a supermarket, a place where all
kind of recreational functions have their logical place and offer a complete manmade
natural park north of Rotterdam.
The Bentwoud plan is still in a developing stage. The first 50 ha was planted one year
ago (in 2000). We try to put facts for the people in this area. Models are made for the
greater land development project. One model pays more attention to blue-green
elements for the inhabitants of the cities, while another model focuses on the rural
functions. The water aspect raises troubling questions because the designed creeks will
cause upward streaming brackish water from the underground. The future size of the
forest is still subject to discussion and at the edges land use conflicts often arise.
Evaluation
The implementation of the objectives of forest policy are monitored yearly and
evaluated every fourth year. The results are not bad, although the pace is decreasing the
last years. The average result is 73% realisation. In the Randstad, the realisation
remains behind target.
Final comment
For new forests in urbanised areas appealing plans are needed. People have to adopt
these plans and must protect them against all kind of interfering activities to be
expected in crowded areas. The forest must first be born in the fantasy of the planners
and then in the fantasy of politicians and of the people who will use it in the future. In
the beginning there is often resistance because loss of existing values. As soon as the
forest has its own identity it can protect itself. The growing internal values can embrace
people and convince them to protect and strengthen them.


65
The Design of Urban Woodlands in theNetherlands: Development of a ‘Polder Forest’
Dominique BlomTechnical University Delft, Faculty of Architecture,Berlageweg 1, 2628 CR Delft
Abstract
The paper provides insight into some main findings of a Ph.D.-study carried out at the
Technical University of Delft from 1996-2001. The study’s objective was to give an
overview and analysis of 20th century urban woodland plans in the western part of the
Netherlands. It shows the influence of modernism on urban woodland design and the
adaptation of these designs to the Dutch polder landscape. In this way a unique style
developed in Dutch urban woodland design in the 20th century.
In the urbanised western part of the Netherlands, the ‘Randstad’, a considerable
number of new woodlands was planned and designed during the 20th century. As most
woodlands in this area had disappeared during the Middle Ages this meant a substantial
transformation of the open polder landscape. In addition, it led to a new development
in urban green planning. Developing new urban woodlands was unique in Europe at
that time. In most countries remains of ancient forests near cities, like the Bois de
Boulogne in Paris, gradually evolved into urban woodlands.
In the early 20th century the first urban woodlands were projected on the cities’
outskirts, anticipating expansion of the urban area. These woodland designs were
mainly based on the English landscape style. Later that century larger woodlands, even
as large as thousands of hectares, were planned further away from the city. All of these
new urban woodlands were situated in the lowlands, and were meant for recreation and
nature development, this in contrast to most historical woodlands that were planted on
sand soil, and intended for wood production and hunting.
The study presented here study showed that during the 20th century a new kind of
landscape feature was established in the western part of the Netherlands: an urban
woodland closely linked to the Dutch polder landscape.
Key words: urban woodland design, landscape architecture, modernism, polder lands-
cape.

66
Introduction
In the 20th century several urban woodlands were laidout in the Randstad, the
urbanised western part of the Netherlands. This was a new and unique phenomenon,
as most urban woodlands in Europe developed from existing, historical woodlands that
were adapted to an urban setting and use. In the western part of the Netherlands
however, there were hardly any woodlands left around 1900. Even those few left were
all planted by man at some time in history. It was also unique that the new woodlands
were planned in polder landscape, an open and flat landscape, while most Dutch
forests are located on sandy soils with more relief. These forests also determine the
traditional image most people have of forests: a closed, irregular, mysterious landscape.
The designers and planners of the new urban woodlands in the Randstad had to meet
the challenge to create attractive urban woodlands for recreation in this polder lands-
cape, but also for nature and timber production.
Key aspects of urban woodlands in the Netherlands
In the study three key aspects were used to study the urban woodlands planned and
laid-out in the Randstad during the 20th century: planning, design and forest image.
During the 20th century these issues changed significantly.
Planning
Before World War II (WWII), urban woodlands were more like large city parks with a
local function, planned by local governments. After WWII the layout of urban
woodlands became part of the national policy on physical planning. These woodlands
were larger and had a more regional function, e.g. functioning as physical barrier to
keep two cities separated, or as woodland for the whole region.
Design
The first urban woodlands were designed in a romantic style, inspired by the English
landscape style, although they were laid-out in a polder landscape. The design of the
latest ones has evolved into a kind of ‘polder-style’.
Visual appearance of the forest
Urban woodland is built-up with open space and forested areas; these forested areas
have their own spatial characteristics, depending on the planted species, pattern, age
structure, and so forth. The use of a standard mixture of tree species has developed
into more creative use of tree species and mixtures.
These issues will be dealt with in this paper, using examples of urban forest plans from
three periods in the 20h century: before WWII, between WWII and 1975 and from
1975 until today.

67
Background
In the early Middle Ages there was a lot of woodland in the Netherlands. Even a large
part of Holland, the Western part of the Netherlands, was covered in forest. The po-
pulation increased considerably however, and more and more forests disappeared to
make room for agricultural land. The forested area decreased rapidly until at the end of
the Middle Ages very little woodland was left in Holland. This remained the same until
the 19th century; in 1900 there remained only about 35,000 ha of forest in the Nether-
lands (Al & Kuiper 2000), of which most was located outside Holland.
In the 19th century new forests were planted again to meet the demands of increasing
industrialisation, but of course these were mainly used for timber production.
Meanwhile industrialisation led to urbanisation and to bad living standards in the cities.
Cities turned into unhealthy and unpleasant places due to pollution and crowding;
there was hardly any green space left. To improve this situation parks were laid out in
the cities in the 19th century. Still there was a lack of green space outside the cities.
As reaction against the bad health and environmental situation in the cities an anti-ur-
ban feeling developed in these cities at the start of the 20th century. People wanted to
Figure 1. New urban woodlands as a national policy (Ministerie van Volkshuisvesting en RuimtelijkeOrdening 1960).

68
get back to nature. A cutback in working hours, due to an economical crisis, allowed
people to spend leisure time outside the cities in the fresh air. Possibilities were very
limited, however, as uncultivated land disappeared in the rural area due to cultivation.
To protect the few remaining uncultivated areas the first nature protection organisati-
ons were founded.
But protecting existing green was not enough, as there also was a need for green areas
close to or in the cities. Local governments took the first initiatives to lay out large
green areas or forests near cities at the start of the 20th century. The city of Rotterdam
was the first to develop a plan for a large green area, the Kralingse Bos1, soon after
followed by the well-known Amsterdamse Bos.
After WWII national planning developed and as part of the First National Policy
Document on Spatial Planning in 1960, a plan was presented for 11 new green areas
near large cities, for day recreation and nature (see Figure 1). Most of these were plan-
ned in the urbanised part of Holland, the Randstad. Later National Policy Documents
on this subject continued this policy of planning new large green areas near cities.
Even the last note, the Fifth National Policy Document on Spatial Planning
acknowledges a need for more green, especially in the Randstad (Ministerie van
Volkshuisvesting, Ruimtelijke Ordening en Milieu 2001). Unfortunately only a few of
the planned urban woodlands were planted so far; a few more are being realised right
now.
Before WWII: the first urban woodlands in the Randstad
Planning for the future
As mentioned before, the first urban woodlands were laid-out near Amsterdam and
Rotterdam. As urbanisation continued to grow, local governments became aware that it
was necessary to make a plan for the future in order to control unrestricted growth.
The two urban woodlands, Amsterdamse Bos and Kralingse Bos, were planned at the
cities’ outskirts anticipating further growth of the city but also - especially in the case
of the Kralingse Bos - to function as a future outer boundary for the city (see Figures 2
and 3).
The cities of Amsterdam and Rotterdam did not just want to make a park, but rather a
green area that would be “large enough to be a pleasure resort for our entire, numerous
population” as the city of Rotterdam described it in 1909. This was completely
different from the urban parks that were laid out in the cities in the 19th century. These
1 The Dutch word ‘bos’ means forest or woodland.

69
parks were just for walking and were supposed to be ‘uplifting’ for the ordinary urban
dweller who could look at ‘nature’ there. It was more about what people were
supposed to want than what they really wanted. But influenced by the Volkspark2
movement in Germany and by developments in architecture and art that led to
modernism3, planners started thinking about the real needs of people.
Strangely enough, a stimulating factor in planning these new green areas was the
economical crisis. There was a lot of unemployment, and planting forest was seen as a
good way to give these people an opportunity to work.
2 In Germany a need was felt to go beyond the 19th century concept of the urban park as a place
for the self-representation of the metropolitan bourgeoisie, just for walking. The Volkspark was
to be a place for activities and feelings that would lead man back to his/her natural roots and to
improve the self-esteem of the German people. On the one hand collective activity, on the other
hand contact with nature.3 Architects wanted to improve the living conditions for the not so wealthy. Their ideal was a
healthy environment for everyone, hygienic, with lots of light and fresh air. Living needs and
demands should be central, buildings should be functional.
Figure 2. General Development Plan Amsterdam (AUP), 1932 (Rossem 1993).
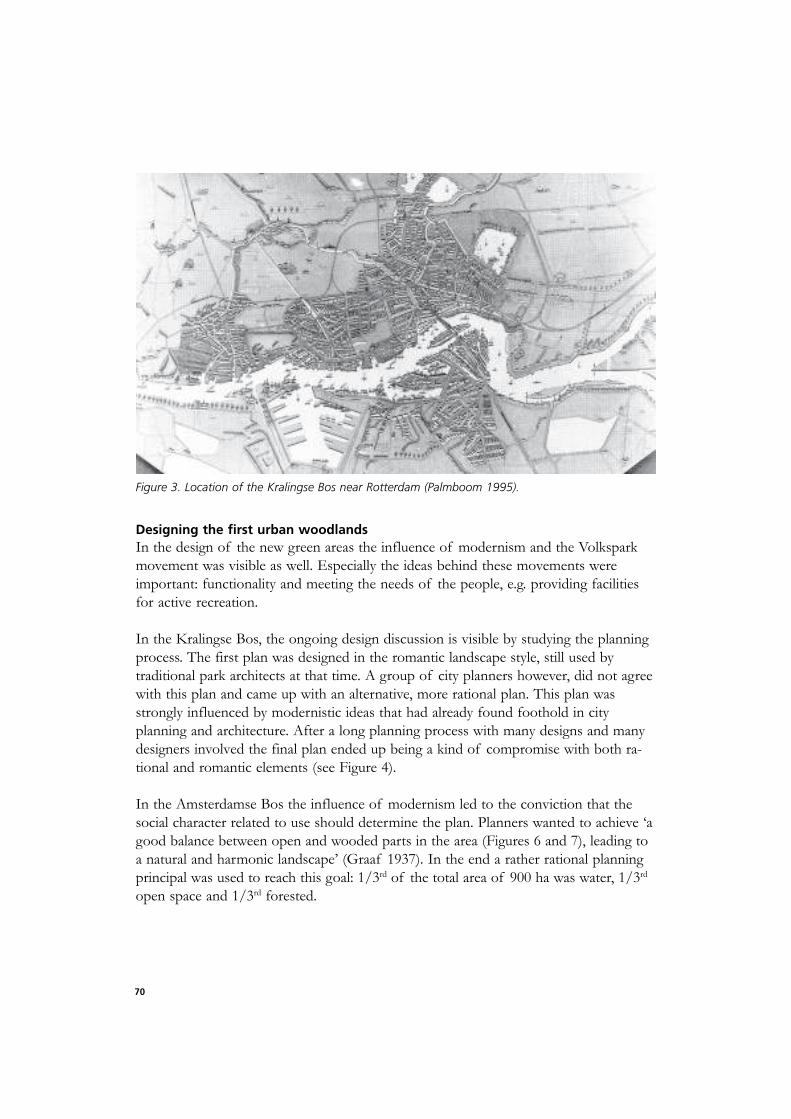
70
Designing the first urban woodlands
In the design of the new green areas the influence of modernism and the Volkspark
movement was visible as well. Especially the ideas behind these movements were
important: functionality and meeting the needs of the people, e.g. providing facilities
for active recreation.
In the Kralingse Bos, the ongoing design discussion is visible by studying the planning
process. The first plan was designed in the romantic landscape style, still used by
traditional park architects at that time. A group of city planners however, did not agree
with this plan and came up with an alternative, more rational plan. This plan was
strongly influenced by modernistic ideas that had already found foothold in city
planning and architecture. After a long planning process with many designs and many
designers involved the final plan ended up being a kind of compromise with both ra-
tional and romantic elements (see Figure 4).
In the Amsterdamse Bos the influence of modernism led to the conviction that the
social character related to use should determine the plan. Planners wanted to achieve ‘a
good balance between open and wooded parts in the area (Figures 6 and 7), leading to
a natural and harmonic landscape’ (Graaf 1937). In the end a rather rational planning
principal was used to reach this goal: 1/3rd of the total area of 900 ha was water, 1/3rd
open space and 1/3rd forested.
Figure 3. Location of the Kralingse Bos near Rotterdam (Palmboom 1995).

71
Figure 4. Plans for the Kralingse Bos (1911, 1920, 1951) (Oldenburger-Ebbers 1998).
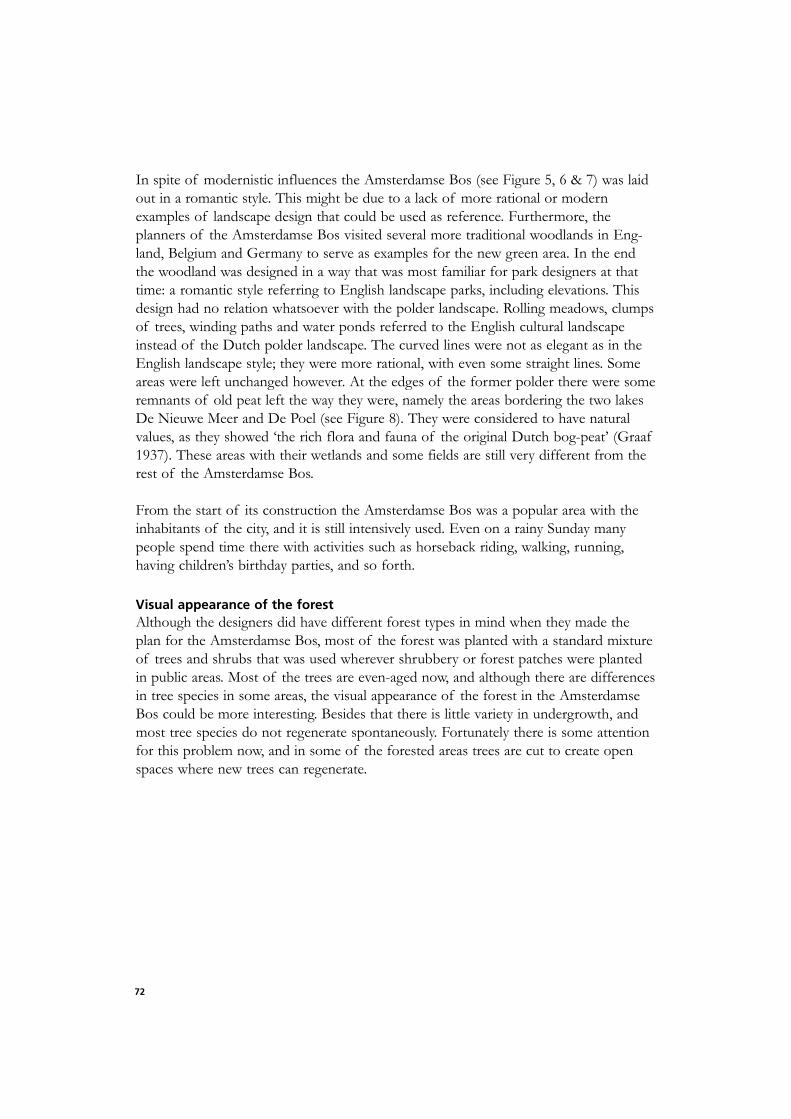
72
In spite of modernistic influences the Amsterdamse Bos (see Figure 5, 6 & 7) was laid
out in a romantic style. This might be due to a lack of more rational or modern
examples of landscape design that could be used as reference. Furthermore, the
planners of the Amsterdamse Bos visited several more traditional woodlands in Eng-
land, Belgium and Germany to serve as examples for the new green area. In the end
the woodland was designed in a way that was most familiar for park designers at that
time: a romantic style referring to English landscape parks, including elevations. This
design had no relation whatsoever with the polder landscape. Rolling meadows, clumps
of trees, winding paths and water ponds referred to the English cultural landscape
instead of the Dutch polder landscape. The curved lines were not as elegant as in the
English landscape style; they were more rational, with even some straight lines. Some
areas were left unchanged however. At the edges of the former polder there were some
remnants of old peat left the way they were, namely the areas bordering the two lakes
De Nieuwe Meer and De Poel (see Figure 8). They were considered to have natural
values, as they showed ‘the rich flora and fauna of the original Dutch bog-peat’ (Graaf
1937). These areas with their wetlands and some fields are still very different from the
rest of the Amsterdamse Bos.
From the start of its construction the Amsterdamse Bos was a popular area with the
inhabitants of the city, and it is still intensively used. Even on a rainy Sunday many
people spend time there with activities such as horseback riding, walking, running,
having children’s birthday parties, and so forth.
Visual appearance of the forest
Although the designers did have different forest types in mind when they made the
plan for the Amsterdamse Bos, most of the forest was planted with a standard mixture
of trees and shrubs that was used wherever shrubbery or forest patches were planted
in public areas. Most of the trees are even-aged now, and although there are differences
in tree species in some areas, the visual appearance of the forest in the Amsterdamse
Bos could be more interesting. Besides that there is little variety in undergrowth, and
most tree species do not regenerate spontaneously. Fortunately there is some attention
for this problem now, and in some of the forested areas trees are cut to create open
spaces where new trees can regenerate.

73
Figure 5. Amsterdamse Bos (Daalder 1999).
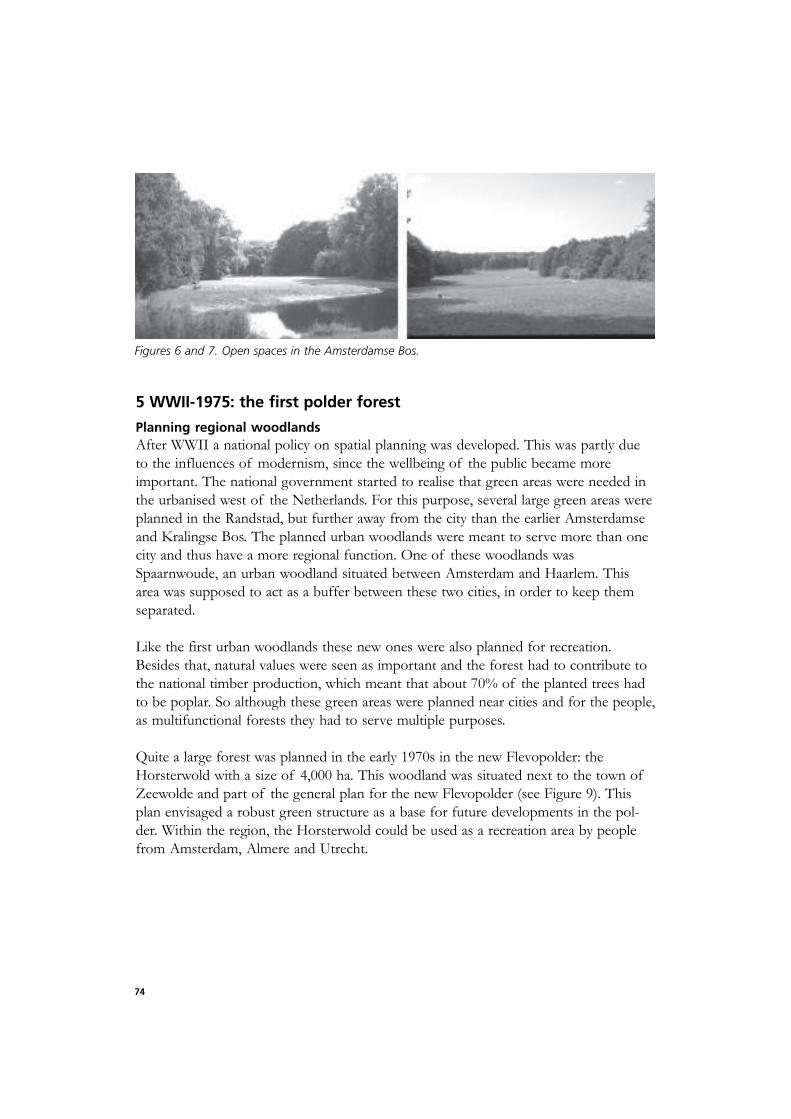
74
5 WWII-1975: the first polder forest
Planning regional woodlands
After WWII a national policy on spatial planning was developed. This was partly due
to the influences of modernism, since the wellbeing of the public became more
important. The national government started to realise that green areas were needed in
the urbanised west of the Netherlands. For this purpose, several large green areas were
planned in the Randstad, but further away from the city than the earlier Amsterdamse
and Kralingse Bos. The planned urban woodlands were meant to serve more than one
city and thus have a more regional function. One of these woodlands was
Spaarnwoude, an urban woodland situated between Amsterdam and Haarlem. This
area was supposed to act as a buffer between these two cities, in order to keep them
separated.
Like the first urban woodlands these new ones were also planned for recreation.
Besides that, natural values were seen as important and the forest had to contribute to
the national timber production, which meant that about 70% of the planted trees had
to be poplar. So although these green areas were planned near cities and for the people,
as multifunctional forests they had to serve multiple purposes.
Quite a large forest was planned in the early 1970s in the new Flevopolder: the
Horsterwold with a size of 4,000 ha. This woodland was situated next to the town of
Zeewolde and part of the general plan for the new Flevopolder (see Figure 9). This
plan envisaged a robust green structure as a base for future developments in the pol-
der. Within the region, the Horsterwold could be used as a recreation area by people
from Amsterdam, Almere and Utrecht.
Figures 6 and 7. Open spaces in the Amsterdamse Bos.
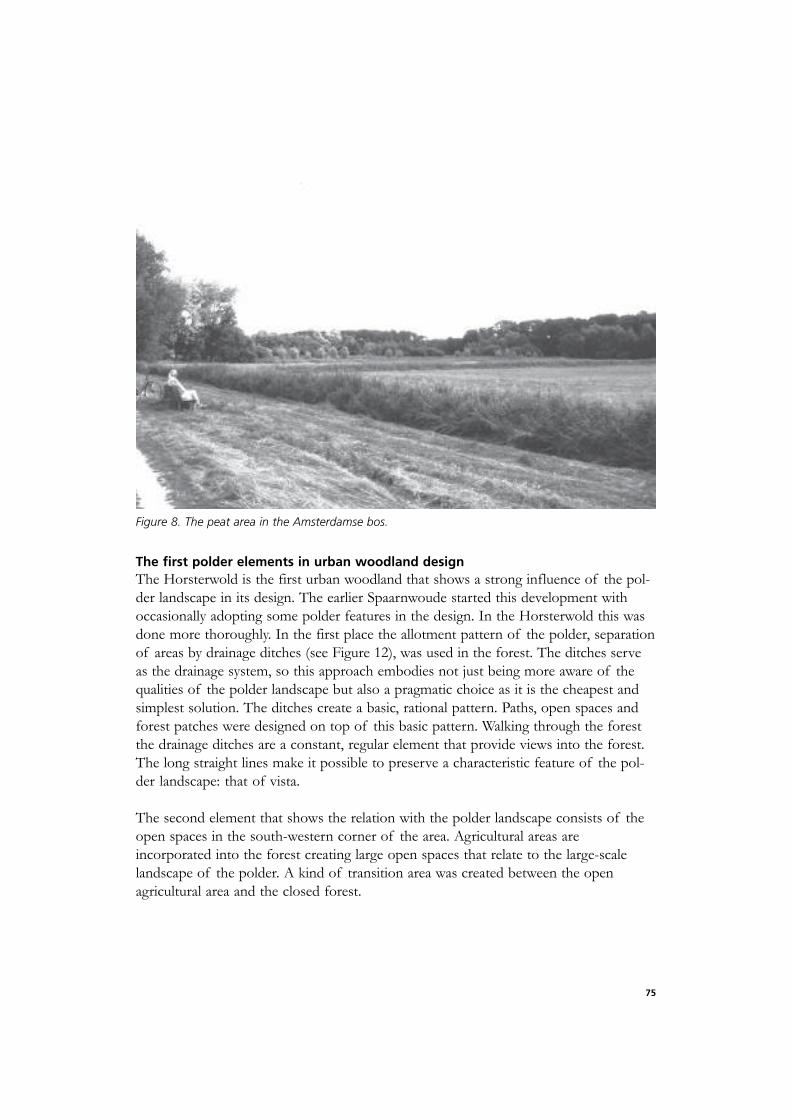
75
The first polder elements in urban woodland design
The Horsterwold is the first urban woodland that shows a strong influence of the pol-
der landscape in its design. The earlier Spaarnwoude started this development with
occasionally adopting some polder features in the design. In the Horsterwold this was
done more thoroughly. In the first place the allotment pattern of the polder, separation
of areas by drainage ditches (see Figure 12), was used in the forest. The ditches serve
as the drainage system, so this approach embodies not just being more aware of the
qualities of the polder landscape but also a pragmatic choice as it is the cheapest and
simplest solution. The ditches create a basic, rational pattern. Paths, open spaces and
forest patches were designed on top of this basic pattern. Walking through the forest
the drainage ditches are a constant, regular element that provide views into the forest.
The long straight lines make it possible to preserve a characteristic feature of the pol-
der landscape: that of vista.
The second element that shows the relation with the polder landscape consists of the
open spaces in the south-western corner of the area. Agricultural areas are
incorporated into the forest creating large open spaces that relate to the large-scale
landscape of the polder. A kind of transition area was created between the open
agricultural area and the closed forest.
Figure 8. The peat area in the Amsterdamse bos.

76
While the plan for the Horsterwold (see Figure 10) was developed, modernism was on
its return and designers started to appreciate historical styles again. This has become
known as post-modernism. In the Horsterwold this is visible as well. There are several
classical elements, e.g. an axis from the town of Zeewolde into the forest, geometrical
elements, and long avenues that remind of Baroque estates. All have been used without
their original symbolic meaning but translated or transformed to the current situation.
History became a source of inspiration for designers again, while in modernism
historical styles were denied or at least not used.
Figure 9. The location of the Horsterwold in the southern Flevopolder (Arnoldussen 1996).Figure 10.The plan of the Horsterwold (Arnoldussen 1996).

77
Figure 10. The plan of the Horsterwold (Arnoldussen 1996).

78
To provide possibilities for multiple use of the forest, the area was divided into zones.
At the eastern, northern and southern edges more facilities for active recreation were
situated, close to respectively Zeewolde, the canal and the so-called edge lakes4. At the
western side, next to open agricultural land, a core with higher nature values was plan-
ned to create a more quiet area. The area in between made a transition possible from
peaceful nature in the west to increasing human activity, especially near Zeewolde in
the east, but also to the northern and southern sides. This zoning concept was
incorporated into the spatial structure of the forest, with a closed and quiet core, and
an outer zone with more open spaces and a park-like character. Especially near
Zeewolde the landscape is diverse, small-scaled and transparent (see Figures 11, 12, 13,
14 and 15).
The design of the nature core was a long process, involving different designers. During
this period ideas about nature changed from leaving nature develop itself to
‘constructing nature’. In the end the nature core of the Horsterwold was constructed
using earthworks, which resulted in small-scale relief and some ponds with irregular
shapes giving way to a more ‘romantic’ nature idea. This design breaks with the basic
polder pattern in the rest of the forest, breaking the unity of the forest as well.
Visual appearance of the forest
Instead of planting the Horsterwold with mixed forest, the forest was divided into
small stands with different tree species in every stand. Among these species a large pro-
portion consists of poplar, since the forest had to meet the productivity, demand using
70% poplar. In general mainly deciduous broadleaf trees were planted in the forest,
also because there is too much chalk in most of the soil to plant coniferous trees. The
rich clay soil makes the development of vital high productive deciduous broadleaf
woodland possible. The structure of small forest patches with different tree types is
isually attractive. Although the trees are quite young it already provides variation.
4 These lakes, in Dutch ‘randmeren’, separate the Flevopolder from the mainland.

79
Figure 11. The nature core of the Horsterwold (Arnoldussen 1996).

80
Figure 12. Draining ditch in the Horsterwold.
Figure 13. Open agricultural space.

81
Figure 14. Axis from Zeewolde into the Horsterwolde forest.
Figure 15. Forest stands with poplar and beech.

82
End of the 20th century: increasing influence of history
Multifunctional planning
After about 1975 attention for the environment started to increase. Environmental
problems, nature conservation and recreation were seen as important issues in the rural
area, while agriculture lost its self-evident priority; people became aware that
agriculture could sometimes harm the environment. Especially in the Randstad with its
high urban pressure it became easier to discuss other uses. People became more aware
of the different interests in the rural area. In this atmosphere more urban woodlands
were planned, although these were still based on the ideas of the first two National
Policy Documents on Spatial Planning. During the last 25 years of the 20th century
only one urban woodland was realised, the Balij/Bieslandse Bos, and another one is
currently being realised. Both these woodlands are situated in the so-called south-wing
of the Randstad. In this area, the cities of Rotterdam, Den Haag, Delft and
Zoetermeer and several small towns are rapidly growing together. The urbanised lands-
cape becomes very complex, as landscapes get increasingly fragmented and borders
between urban and rural areas fade. There are fast changes and many different
interests.
In the Balij/Bieslandse Bos at first only the Bieslandse Bos was planned as a rather
small urban woodland near Delft. However, due to the fast growth of towns in the
area and the planning of the Floriade5 near Zoetermeer, the planners decided to extend
it all the way to Zoetermeer with the Balij, to prevent the towns from growing together
(see Figures 16 and 17).
The Bentwoud was planned as woodland between Zoetermeer and Boskoop but as
farmers are not obliged to sell their land to the government, most land still has to be
acquired and only a few lots were planted with trees. This urban woodland is situated at
the edge of the South-wing of the Randstad (see Figure 18).
5 A garden show held on different locations every 10 years.

83
Figure 16. Plan of the Balij / Bieslandse Bos (Dienst Landelijk Gebied, 1997).
Figure 17. Landscape pattern around 1900; area of the Balij/Bielandse Bos.

84
Design with historic perspective
The development, visible in the Horsterwold, to use elements of the original landscape
in woodland design was incorporated in the new plans. Planners and designers
distinguish different landscape types and acknowledge the specific characteristics of
these landscapes. There is a growing awareness of the fact that the landscape reflects
the natural genesis, the use of the landscape by man and the occupation history.
Identity of the landscape, often derived from its history, becomes a central issue and
gives foothold to designers in a fast changing society. Pressure and demands on the
landscape grow, as well as the many individual needs of people that need to be met.
While in modernism the design rules were clear, this is a time everything is possible but
nothing is clear.
In both woodlands, like in the Horsterwold, most of the ditch pattern has been
preserved as a basic allotment pattern that takes care of the drainage. The woodlands
were designed more or less independently of this ditch pattern.
However, other elements of the existing landscape were used as well. In the Bentwoud
an old creek system was used as a main design feature. This creek system was found in
the soil but is not visible in the landscape.
Figure 18. Plan of the Bentwoud (Stuurgroep Bentwoud 1996).

85
In the Bieslandse Bos the existing landscape was used in yet another way. The plan for
this forest was conceived over a long design period in which many different designers
were involved. It was based on the landscape with its many different small polders. The
dike system of these polders forms the main structure of this woodland. The areas
between the dikes, the old polders, all have a different design, some have more and
some have little to do with the polder landscape. In this way a varied woodland was
created with a clear main structure that reflects the character of the polder landscape.
Classical influences can also be recognised in these woodland designs. In the Bentwoud
the western area close to Zoetermeer resembles an estate forest, with its long straight
avenues. In the Balij a monumental axis was laid out at the Zoetermeer side leading
into the forest. This was clearly based on French baroque gardens. So again in these
forest plans historical design styles were used and adapted to a new situation.
Visual appearance of the forest
As the Balij/Bieslandse Bos was the only one of the two woodlands that is almost
planted now this issue will be discussed only for that forest. In the Balij/Bieslandse
Bos, again like in the Horsterwold, most of the forested area was planted with one spe-
cies per forest stand. Some areas were planted with mixed forest. When planning this
forest the production target of 70% poplar had to be met. This aim was abandoned in
the 1990s since it was no longer cost-effective due to the decreasing timber prices.
Figure 19. The axis at the Balij.

86
Figure 20. Open space in the Bieslandse Bos.
Figure 21. An old dike.

87
However, a creative solution was found in the area near Zoetermeer. Here the 30%
non-poplar part was concentrated in a triangular shaped beech stand. Surrounded by
the fast growing poplar this would in the beginning be an open space in the forest.
After 20 to 25 years when the poplar would be cut the effect would be reversed; the
beech stand would be seen as closed forest in an open space (see Figures 19, 20 and
21).
Three issues for the future
To conclude, some remarks are made on the three issues of planning, design and visual
appearance of the forest.
Planning
After seeing the growing scale of woodland planning one might wonder what will be
the future role of the urban woodland in the urban landscape. Generally it is expected
that the urban area will expand. Furthermore the border between urban and rural area
is continuously becoming less clear, and the landscape of the Randstad becomes more
and more a mixture of urban and rural. If this development continues the existing ur-
ban woodlands will become surrounded by urban sprawl. It is important, however, that
these green areas do not lie isolated in a large urban area. A coherent green structure
should be developed in the Randstad that can form a strong base for future urbanisat-
ion. To quote the emeritus professor in landscape architecture Em. Prof. Vroom: “It’s
time for the Olmsted of the Randstad”.
Design
It seems that landscape architects look more and more to the past for inspiration for
their landscape plans. They look at the historical design styles but also the history of
the landscape. Although it is important to take care of the values of a landscape this
should not evolve into an easy adoption of landscape features or other historical
elements in a plan. With the growing complexity of society it seems that designers
sometimes feel a lack of foothold. In that case it is easy to base a plan on what is
already there. However, designers should not copy these landscape features, but use
them in a creative way, adding new qualities to the landscape. It is important to find the
right balance between conservation and creation.
Visual appearance of the forest
Although most areas shown as examples in this paper are not mature enough yet to see
the spatial characteristics of the forest patches, the older cases do show how important
forest management is. In the Amsterdamse Bos not much was done in the forest, apart
from some thinning, and no major changes were achieved. To develop an interesting

88
visual appearance it is important that future management is aware of spatial
consequences of their interventions. But also designers should be more aware of the
development in time of a forest. The designer should not just make a plan and leave it
at that, being involved only at the starting point. Possibly more contact between desig-
ners and managers could be helpful, at the start of a project but also during the
following years.
References
Al E & Kuiper L (Eds) (2000).
Dutch woodlands. Stichting ProBos, Zeist.
Arnoldussen AH & Nip JA (1996).
Ontwikkelingsplan Horsterwold, Rijkswaterstaat Directie IJsselmeergebied,
Lelystad.
Daalder R (1999).
Het Amsterdamse Bos. Stad en Groen 2(1). Dienst Ruimtelijke Ordening,
Amsterdam.
Dienst Landelijk Gebied (1997).
Boswachterijen De Balij en Bieslandse Bos. DLG, Voorburg.
Graaf WA de (1937).
Toelichting Boschplan Amsterdam. Publieke Werken, Amsterdam.
Ministerie van Volkshuisvesting en Ruimtelijke Ordening (1960).
Eerste Nota over de Ruimtelijke Ordening. Staatsuitgeverij, Den Haag.
Ministerie van Volkshuisvesting, Ruimtelijke Ordening en Milieu (2001).
Vijfde Nota over de Ruimtelijke Ordening. Staatsuitgeverij, Den Haag.
Oldenburger-Ebbers CS, Backer AM & Blok E (1998).
Gids voor de Nederlandse tuin- en landschapsarchitectuur, deel West. De Hef,
Rotterdam.
Palmboom F (1995).
Rotterdam verstedelijkt landschap. Uitgeverij 010, Rotterdam.
Rossum V van (1993).
Het Algemeen Uitbreidingsplan van Amsterdam: geschiedenis en ontwerp. Nai
Uitgevers, Rotterdam.
Stuurgroep Bentwoud (1996).
Bentwoud: Kleurbehoud voor het Groene Hart. Provincie Zuid-Holland, Den
Haag.

89
A historical case of periurban forestry: the ‘SotosHistóricos’ of Aranjuez, Spain
José Luis García-ValdecantosInstituto Tecnológico de Desarrollo Agrario.Ronda de Atocha 17, 28012 Madrid, Spain
María Luisa Tello MariscalInstituto Madrileño de Investigación Agraria y AlimentariaCarretera N-II, Km. 38.200, 28800 Madrid, Spain
Abstract
The ‘Sotos Históricos de Aranjuez’ were established under King Philip II during the
16th century. Afterwards, the kings of the house of Bourbon developed his idea with
new plantations and buildings. At present these cover an area of 425 ha and extend
over 45 km of avenues planted with trees of different species (planes, oaks, limes,
poplars, and so forth). Some of these trees are older than 200 years and up to 40 me-
ters high. This ‘network’ of vegetation, close to the city of Aranjuez is a link between
the town, the agricultural properties and the historical buildings.
This paper presents various aspects of the green network, including its origin,
development, and present situation. Insight into the latter will be provided by means
of a general map, inventory of species, sanitary status, pattern of works undertaken in
recent years, plan of recovery of lost plantations and infrastructures, and
characteristics of the use of these avenues by the inhabitants of Aranjuez and visitors.
Also discussed will be problems originating from the agricultural exploitation and the
different institutions concerned. Institutions involved include city council, National
Heritage, Regional Government of Madrid, European Union, and other.
Key words: urban forestry, peri-urban parks, Aranjuez.
Basic data
Aranjuez is situated in the Madrid region, in the centre of the Iberian Peninsula. The
zone studied has a latitude between 40O 01’ and 40O 04’N, and a longitude between 3O
33’ and 3O 38’ W. Its altitude is 490 metres, and the area is almost completely flat.
According to Thornthwaite’s classification its climate is Mediterranean mesothermical
semiarid. Geologically it is an ensemble of fluvial limestone alluviums. Under an upper
layer of sandy brown limos lays a second layer of calcareous gravel. The resulting soil
is the typical calcareous xerofluvent. The whole area is under the influence of the
rivers Tajo and Jarama. Aranjuez is 50 km from the city of Madrid.

90
Origin
When Charles Vs son, the future Philip II, was heir to the throne of Spain, his father
ordered him to take charge of the Royal Sites, given that he wanted to enjoy places as
pleasant as the other European princes at that time did. The most important Spanish
architects, such as Juan de Herrera and Juan Bautista de Toledo, designed the first
buildings and gardens (Rivera 1984, Wilkinson Zerner 1996). In 1561 a large number
of trees began to be brought to Aranjuez. 5000 came from Flanders and other
quantities from France, Andalusia and Valencia. At the same time, Flemish and French
farmers started to cultivate the fields and gardens of Aranjuez according to their natio-
nal customs (Atienza & Félix unpubl.). It seems that the first structure adopted was a
network of parks, gardens and tree-lined avenues; the farms came afterwards (Figure
1). This explains (Terán 1949) why such a large amount of very rich agricultural soil
was devoted to landscape improvement: the main reason was the King’s personal will.
The idea, common to the European kings of that time, was to show their power and
wealth, as well as to enjoy beautiful places for hunting and resting. But, from the
beginning, there was a big difference among the ‘Sotos Históricos’ and the other gar-
dens, the latter being reserved for members of the royal Court, whereas the Sotos were
the way to get to the farms, as well as walking promenades.
Figure 1. Map of the “Sotos” of Aranjuez in the XVI century.

91
Development and evolution
The following kings of Spain kept this original network without significant changes.
Ferdinand VI had new streets established and put great emphasis on the economical
profit of the whole area, ordering the cultivation of more farms. By this time the trees
growing in the Sotos showed a twofold interest: their aesthetic value and also an
industrial exploitation. So, poplars were planted for timber production, mulberries for
feeding the silkworms ‘working’ at the local silk factory, and so forth. Charles III,
remembered as one of the best kings of Spain for having been a strong sponsor of
arts, sciences and industry, developed, completed and integrated the original idea of
Philip II into an ‘illustrated’ concept of a royal land. This combined the exhibition of
the latest agricultural features and trends in landscape management. So, farmers and
architects from various parts of Spain, France, Belgium, Italy, The Netherlands and
Germany worked in Aranjuez. By this time there was a strong relationship between
farms and avenue trees: farmers were in charge of the maintenance of the trees, mainly
by watering them when necessary (Figure 2). The development of infrastructures
during the 19th century negatively affected the ‘Sotos’. In 1851 the railway Madrid-
Aranjuez crossed over it, dividing five avenues. But, on the other hand, since 1869
many trains have allowed people from Madrid to visit Aranjuez at reasonable prices.
Figure 2. Traditional irrigation system in the “Sotos”.

92
The 20th century
In Spain as well as in the rest of Europe, the last century introduced sharp changes in
sociological and economical circumstances. First of all, the spread of new technologies
induced the rise of new agriculture, characterised by mechanisation and reduced
manpower. This resulted in an increased emigration from the countryside to the big
cities: fewer people were available to take care of non-intensive agricultural tasks. In
the last quarter of the century two main events affected the evolution of the Sotos.
First of all, Spain joined the European Union in 1986, enabling the farmers to obtain
European funds. Since these funds are selective, some traditional not funded crops (e.g.
horticultural crops) were neglected. Consequently, some estates adjacent to the avenues
which were usually well watered, changed to dry farming, thus shortening the water
supply to the trees. At the same time, the ownership of the Sotos was transferred from
the National Heritage to the Regional Government of Madrid. Unfortunately, the
result was the negligence of the maintenance of the trees for more than ten years.
Therefore, some species (mainly poplars and limes) suffered a lot of decay: dead
branches, dead trees, attacks by pests and diseases, etc. In 1997 the Technological
Institute for Rural Development (Regional Government of Madrid) took charge of
this network of avenues, trying to recover and improve them.
Present situation
The Sotos Históricos cover an area of 425 ha, with a total length of 35 km. The width
of the avenues ranges from 13 to 34 m. In 9 of the crossings there are roundabouts
that sometimes preserve architectural elements of great importance. The ‘Glorieta de
las Doce Calles’, for example, was built in 1613 and still shows a large part of its
former shape, though seriously damaged. The species represented are (in order of
importance): Platanus hispanica, Populus alba var. pyramidalis, Populus x canadensis, Populus
nigra, Ulmus pumila, Ulmus minor, Quercus robur, Tilia platyphyllos, Morus alba, Morus nigra,
Juglans regia, Photinia serrulata, Robinia pseudoacacia, Sophora japónica, Fraxinus angustifolia,
Melia azederach, Celtis australis and, to a lesser extent, Aesculus hippocastanum, Paulownia
tomentosa and Acer negundo. Each avenue, depending on its width, holds two, four, or six
rows of trees at different spacing, leaving a central pathway of 3 to 13 m (Figure 3).
The surface of the streets consists of compacted earth, paving, or asphalt, bearing
traffic of pedestrians and bicycles, agricultural vehicles, and, in some cases, all kinds of
vehicles. Irrigation is by means of ditches dug directly into the surface of the soil. It is
the traditional way (López 1988) and fulfils an aesthetical task: in dry countries the look
and sound of water is much more appreciated than in those that do not lack rainfall.
Some popular bars are scattered in the Sotos. They constitute interesting meeting
points, and could add a recreational value, but, as we will see later, they are also the
origin of important problems.(López y Malta 1988).

93
Man and trees in the ‘Sotos’: interaction
Coming back to the origin and first development
It was said before that the personal will of one man, Emperor Charles V, led to the
birth of this network of alleys and buildings. As his heirs were aware of the
importance of their heritage, they kept it in a fairly good state, and, as happened with
Fernando VI and Carlos III, improved and enlarged it. Philip II, in spite of being
concerned with the government of the largest empire ever known, made such precise
recommendations as “some poplars must be replaced in Aranjuez, as tall as possible, not to be
unworthy with the others still living” (Winthuysen 1990). People were allowed to enjoy these
royal properties, and farmers were in charge of them more or less consciously.
Moreover, the economical interest of part of the trees contributed to their
conservation. Thus there was a positive interaction among men and trees, which has
allowed us to see them today.
The Sotos today
The Sotos act as a link between the city, the farms, the historical buildings and the
industrial zone of Aranjuez. They provide a large open space for tourism, recreation
and environmental activities. However, the traffic of trucks, buses and private cars
constitutes a serious constraint for these uses in some streets. There is a positive
Figure 3. An avenue in the “Sotos”.

94
interaction between agricultural cultivation and trees: the avenues close to well-watered
farms keep their trees in a very good condition. Additional benefits of trees are to
allow activities such as walking, cycling, horseback riding, recreation, and so forth.
Man-induced damages
The bars and restaurants existing in the Sotos have sometimes invaded the space of the
trees. It is evident that public properties must be protected as carefully as private ones
are (Figure 4). Public infrastructure has affected important parts like the ‘Glorieta de
las Doce Calles’, with partial destruction of its original design due to the construction
of a busy road. Occurrence of vandalism is not very important, with the exception of
repeated fires that constitute a serious problem. Pruning by vandals for firewood
collection has also destroyed many trees, affecting very valuable species such as Quercus
robur, considered an excellent stock of fuel (Figure 5). This type of pruning causes a
strong physiological decay, killing the trees sooner or later. The appearance of different
fungi is not the cause, but the effect of such decay.
Abiotic damages
As is the case of many other urban and periurban areas in the world, there exists a
great number of factors of abiotic origin that cause severe damage to the Sotos of
Aranjuez. Apart from direct damage, these factors can affect the vitality of the tree and
Figure 4. A restaurant “invading” the space of the trees.
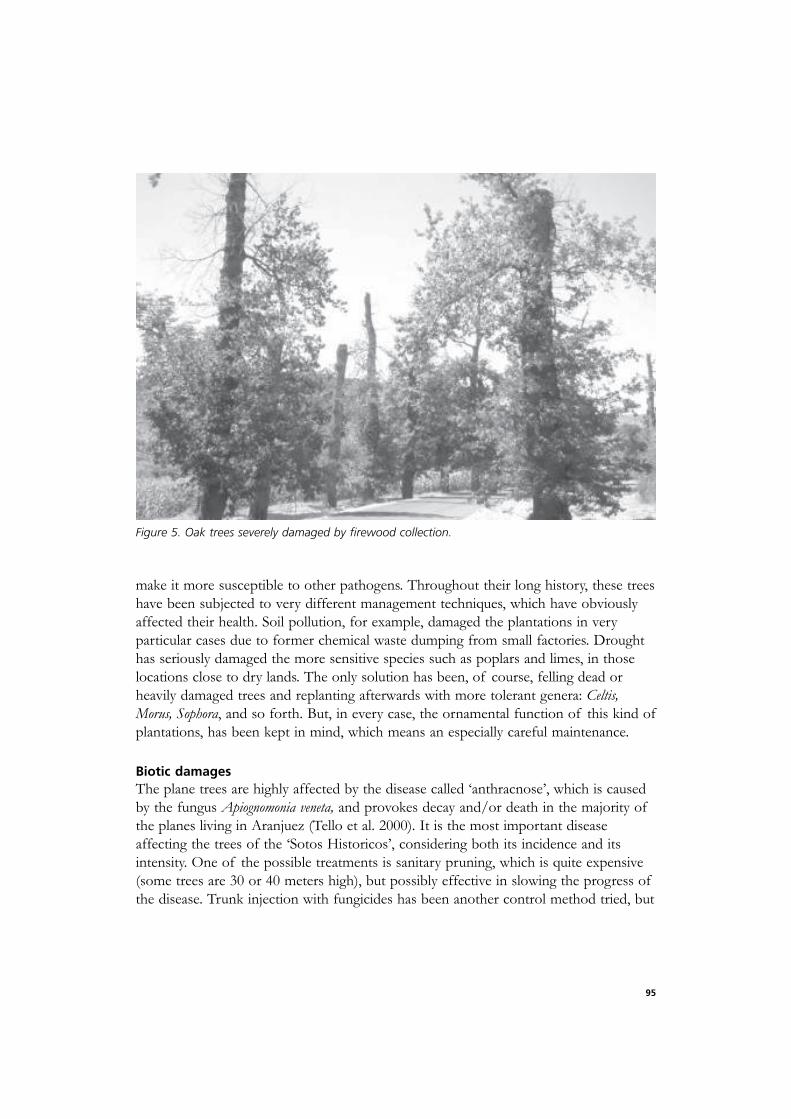
95
make it more susceptible to other pathogens. Throughout their long history, these trees
have been subjected to very different management techniques, which have obviously
affected their health. Soil pollution, for example, damaged the plantations in very
particular cases due to former chemical waste dumping from small factories. Drought
has seriously damaged the more sensitive species such as poplars and limes, in those
locations close to dry lands. The only solution has been, of course, felling dead or
heavily damaged trees and replanting afterwards with more tolerant genera: Celtis,
Morus, Sophora, and so forth. But, in every case, the ornamental function of this kind of
plantations, has been kept in mind, which means an especially careful maintenance.
Biotic damages
The plane trees are highly affected by the disease called ‘anthracnose’, which is caused
by the fungus Apiognomonia veneta, and provokes decay and/or death in the majority of
the planes living in Aranjuez (Tello et al. 2000). It is the most important disease
affecting the trees of the ‘Sotos Historicos’, considering both its incidence and its
intensity. One of the possible treatments is sanitary pruning, which is quite expensive
(some trees are 30 or 40 meters high), but possibly effective in slowing the progress of
the disease. Trunk injection with fungicides has been another control method tried, but
Figure 5. Oak trees severely damaged by firewood collection.

96
although much cheaper, at the moment it seems to have little effect. Nevertheless and
luckily, no signs of Ceratocystis fimbriata (cancer stain) in these trees have been found.
Attacks by insects such as Corythuca ciliata, known as Sycamore lace bug, are less
worrying and there is no need to control them. It is also worth mentioning Dutch elm
disease that severely affects most of the elms in the Sotos. Finally, several species of
wood decay fungi affect many different tree species. The most common in the ‘Sotos’
are Fomes fomentarius, Pleurotus ostreatus, Inonotus hispidus, Coriolopsis gallica, Schizophyllum
commune and Ganoderma spp. mainly on Platanus, Populus, Quercus and Tilia. Their
incidence is low, however, and restricted to individual decaying trees, previously
damaged by other factors, mainly anthropogenic.
Future development
The first activities developed since 1998 have been the restoration of heavily damaged
plantations, which were a real danger to people. Drs. Mateo-Sagasta and Tello carried
out a comprehensive study of the health status of the trees. A general inventory and
mapping by means of a GIS has shown to be an outstanding tool to manage the whole
and to store information on a daily basis. A previous assessment of the total cost of
the integral restoration of the Sotos (trees, pavements, architectural elements, etc.) is
about 2.5 million Euros. After a careful study of the uses of the different streets it has
been decided to cut down the traffic in most of them, only allowing the passage of
agricultural and specially authorised vehicles. On the contrary, facilities for pedestrians,
cyclists and horse-riders will be provided as much as possible (Figure 6).
Conclusions
In the last four centuries in Spain (and in Europe) the political frame has evolved from
God’s right monarchy to more or less democratic monarchies, to republics, and, in the
Spanish case, to a democratic monarchy. Many wars (civil, international and worldwide)
have passed. Great social and economical changes have occurred, greatly disturbing the
social scenario. But, year after year, century after century, the trees have remained.
Obviously, man needs trees. One should not forget that, not too many millenniums
ago we lived in the tops of them. The interaction man-tree has had some different
expressions in Aranjuez during the last four hundred years. A very first conception
phase: the heir to the throne’s idea. Secondly, the development of this idea with the
contribution of farmers, gardeners and architects from many European countries. In a
later stage, succeeding Spanish kings carried out the maintenance and improvement. In
the 20th century, dramatic changes in the social and political situation affected the Sotos
negatively, showing that technicians, scientists and designers must be continuously in
line with social evolution, anticipating the effects of the harsh evolution we have to live
with. This is the only way to achieve our goal: that trees, and designs made by us, will
remain much after we disappear.

97
References
López A (1988).
Antiguos riegos marginales de Aranjuez. Real Academia de la Historia, Madrid.
López y Malta C (1988.)
Historia descriptiva del Real Sitio de Aranjuez. Doce Calles, Aranjuez.
Rivera J (1984).
Juan Bautista de Toledo y Felipe II. Universidad de Valladolid, Valladolid.
Tello ML, Redondo C & Mateo-Sagasta E (2000).
Health status of plane trees (Platanus spp.) in Spain. Journal of Arboriculture 26(5):
246-254.
Terán M de (1949).
Huertas y jardines de Aranjuez. Universidad Complutense, Madrid.
Wilkinson Zerner C (1996).
Juan de Herrera, arquitecto de Felipe II. Akal, Madrid.
Winthuysen X de (1990).
Jardines clásicos de España. Doce Calles/Real Jardín Botánico. CSIC, Aranjuez.
Figure 6. Avenue with access restricted to non motorised traffic.


99
Chapter 3
Functions and benefits of urban forests and trees


101
Multi-functionality in Urban Forestry – A Dream ora Task?
Janez PinatBiotechnical Faculty, Dept. of Forestry and Renewable Forest Resources, University of LjubljanaVecna pot 83, SLO-1000 Ljubljana, Slovenia
Abstract
Ljubljana is the largest city (340,000) and capital of Slovenia. The most importantcategories of open green space are agricultural land, forests, gardens, parks and other.Forests are divided into forest patches of different size and for applied research in thefield of urban forestry, the largest forest patch on Golovec hill was chosen. For studypurposes the evaluation of generally beneficial urban forests functions and roles wascarried out, as well as the analysis of temporal changes in land use. The results showthat the forests on Golovec hill are the most stable land use category. However theirtimber production role is decreasing and their non-timber producing functions arebecoming more and more important. One of the drawbacks is the private ownershipof most forests and the fact that settlements are located in all suitable areas in thefoothills an valleys, which together with sometimes steep slopes seriously compromisesvisitor access to Golovec urban forest.
Future work in the field of urban forestry should concentrate on the development ofknowledge, legislation, protection, inventories, detailed silvicultural planning,operational strategy of management and development of co-operation between stateforestry service and local municipality regarding urban forest management.
In the future urban forestry will have to deal with a very wide range of humanactivities, from knowledge of the living and non-living environment to technologicaland sociological knowledge
Key words: multi-functionality, urban forestry, non-timber forest functions, Ljubljana,nature understanding
Introduction
Due to economic growth and development the image of Slovenia has rapidly changedduring recent years. Together with economic development the awareness of theimportance of urban forests is also growing (Golob 1993, Kova & Golob 1993). Oneof the most significant recent landscape changes is the construction of highway

102
corridors through Slovenia. It is likely that this change will emerge especially in theSlovenian capital Ljubljana, as with the construction of the system of bypass highwaysaround Ljubljana the borders of this space have been greatly changed. In spite ofcrossings (underpasses, crossovers) the highway creates a sharp boundary for the city,resulting in a defined townscape. The matter of concern is in general the role offorests and trees in the urban area since the forest represents an existential quality inthe life of people and animals in the urban environment. Therefore the aim of thepresented research was to provide an outlook of the forest patches in the townscapeof Ljubljana, with special focus on the Golovec hill, the biggest urban forest ofLjubljana.
The municipality of Ljubljana is responsible for maintenance of public green spaceand public trees, while the Slovenian Forests Service is responsible for the maintenanceof urban forests. The recently completed management plan for the Urban ForestManagement Unit ‘Rast’, elaborated by The Slovenian Forests Service, defines long-term and operational management planning in urban forests and operationalmanagement supervision in urban forests. At the moment between 2/3 to 3/4 of theurban forests are privately owned; after the ‘denationalisation’ this figure is expected tohave increased by an additional 5 -10% (Pirnat 2001).
The urban forests of Ljubljana are regulated according to the following laws and plans:
- The Slovenian Forest Act (1993)- The Proclamation Act on Forests with Special Purpose in the city of Ljubljana
(recently completed and to be adopted in this year)- The Forest Management Plan for the Forest Management Unit ‘Rast’ (1997-2006)
These three documents have led to much better public participation, since thedocuments are publicly available, and obligatory public presentations of differentprojects always enable various public interest groups to participate - either as urbanforest owners or citizens.
All mentioned documents regulate management in the urban forests of Ljubljana.Some interesting and important issues related to these documents are (Pirnat 2001):
- Close-to-nature and multi-purpose management in accordance with the principles ofprotection of the environment and natural values of urban (and all other) forestsregardless of ownership;
- free access to and movement in all forests regardless of ownership;- allocation of a category of forests with special purpose, being forests with significant
ecological or social functions provides the Forests Service and municipality with a

103
legal base for protection and specially adapted management in these forests.- an area of 1,503 ha around the city of Ljubljana should be proclaimed as urban
forest;- deforestation in protected areas is not allowed and clear cutting as a way of normal
forest management is prohibited; special forest management directives for adaptedmanagement are defined together with some limitations;
- the municipality has accepted the decision and financial frame for systematicredemption of urban forests based on the offers of private owners. Also a financialcompensation by the municipality to private owners due to limitations inmanagement in urban forests is being prepared;
- extension regarding urban forests and education on urban forest functions for forestowners is a task of The Slovenian Forests Service.
- on the basis of past development, the present state of the forests and their actualrole and significance, the main constraints, restrictions, general objectives and astrategy plan for adapted forest management were defined.
Study area
Ljubljana, the largest city and capital of Slovenia, is situated in a basin along the riverLjubljanica, surrounded by hills in western, northern and eastern direction and by amoor in southern direction. Its elevation is 310 m above sea level. The total residentialpopulation is about 340,000. The municipality area border (MAB) includes an area of27,491ha. This border, however, is stretching far into the rural surroundings especiallyin south-eastern direction. Since the MAB is not suitable for delineating urban forests,the border of Forest Management Unit ‘Rast’ slightly changed in the southern part dueto the newly constructed highway, and is accepted as the most suitable area for urbanforests in Ljubljana (Pirnat 2001). The management plan for the Forest ManagementUnit ‘Rast’ will guide management of the urban forests of Ljubljana. In this way theborder of real urban area is encircled much more logically. The study area dealt with inthis paper is therefore 8,716 ha. A detailed survey was carried out on the 895 haGolovec hill.
Methods
Data on current land use were obtained from Ljubljana municipality sources and partlycorrected by using aerial-photos. By means of two Geographical Information Systemsoftware packages, ArcView (ESRI 1996) and Idrisi (Eastman 1997), the forest patcheswithin the stated circle were selected and analysed by area and spatial distribution.
Since focus was especially on the forests of Golovec hill, the temporal analysis of landuse change has been carried out for the this area only. By means of GIS (Corson 1992,

104
Eastman 1997) the different historic (Franciscean cadastre from 1825) land uses weredigitised, transferred into Idrisi GIS raster images and evaluated (determination ofareas and spatial distribution of different land use categories). The data of recent(1997) land uses were also transferred into the Idrisi GIS environment which enabledcomparison with historic data.
Results
Forests within study area
Within the study area, 67% of the total area is green space. The most importantcategories of green space are agricultural and forested land use, followed by gardens,water, parks and other (see Table 1).
Table 1. The areas of different land use categories (ha).
All in all there are 62 forest patches larger than 1 ha. in study area (see Tables 2 and 3).The areas of Golovec hill and Rοznik hill together account for 70% of the total(Golovec itself almost 47%) and the patches in other areas only make up 30%. Thedistribution of forest patches means additional trouble. Larger patches, like Golovec,Grad, Roznik and the forests between the Roznik and the highway indicate certain‘green corridor’ possibilities in NW-SE direction, thus representing a link between twoneighbouring landscape sub-units, i.e. the Polhov Gradec Mountains and themountains between Ljubljana and the Litija basin. Regretfully enough, a suitablelinkage in south-western direction and especially towards the north-east cannot befound (Pirnat 1997).
Non-open space Category and area of green spaceBuildings, yards, paved areas Agricultura
lForests * Gardens Water Playground Cemetery Parks
4070 ha 1420 ha 117 ha 117 ha 81 ha 21 ha 17 ha70 % 24 % 2 % 2 % 1 % < 1 % < 1 %
2873 ha (33 %) 5843 ha (67 %)8716 ha
* Including scattered areas with forest trees and tree corridors
No. of patches Area class (ha) Total area (ha) Average area (ha) %
1 400 – 1000 655.91 655.911 200 – 400 329.49 329.49 77 %1 100 – 200 110.41 110.413 20 – 29.99 67.38 22.463 10 – 19.99 38.33 12.784 5 – 9.99 29.69 7.42 23 %11 3 – 4.99 46.14 4.1938 1 – 2.99 69.41 1.83
553 * 0.005 – 0.99 73.03 0.11
* Including scattered areas with forest trees and tree corridors.
Table 2. The number and area of individual forest patches*.

105
Case study Golovec hill
This applied research focused: on the development of guidelines for designating urbanforests; evaluation of generally beneficial urban forest functions and roles; onevaluation of needs and wishes of urban forest visitors; and on spatial forest divisionaccording to the differentiated forest uses by various target groups (owners, visitors,etc.) who in one way or another express their need for urban forests.
Golovec hill forms the largest urban forest patch in Ljubljana. Encircled by motorwaysand a railway on southern, western and northern side and by a highway on eastern sideit can be well distinguished from the rest of Ljubljana’s urban and agriculturallandscape. Current land uses are presented in Table 4.
Table 4. Present main land uses in the Golovec hill area in ha (Pirnat in press)
Golovec hill is not very high, situated between 286 and 450 m above sea level.Generally it is not very steep: nearly 2/3 of the hill has slopes with less than 35%inclination (see Table 5 for details) and long ridge on the top. Sometimes, however,steep parts appear already in the foothill, what can be regarded as a serious drawbackfor recreational use. Another drawback for recreation is the presence of settlements allaround the foothill and in the valleys, which beside the slopes, seriously limits accessinto the forest.
Forests andshrubs
Meadows Settlements,roads
Orchards Fields Other Total
662.13 121.39 74.31 21.04 13.43 2.08 894.3874% 14% 8% 2% 1% < 1% 100%
Table 3. Spatial distribution of urban forest patches and areas with tree vegetation* in Ljubljanatowncape.
* Including scattered areas with forest trees and tree corridors
Golovec Rožnik Grad Sava Podutik Zaj jadobrava
Scatteredin city
Total
Total area 662.13 334.65 10.10 154.02 52.64 32.44 173.81 1419.79No. of patches 22 15 11 14 10 20 523 * 615400 – 1000.00 1 1
C 200 – 400.00 1 1L 100 – 200.00 1 1A 20 – 29.99 2 1 3S 10 – 19.99 1 2 3S 5 – 9.99 1 1 2 4E 3 – 4.99 1 2 8 11S 1 – 2.99 1 3 5 2 5 22 38
0.005 – 0.99 20 11 9 4 6 14 489 * 553

106
Table 5. Data on altitude, slope inclination and slope aspect classes (Pirnat in press).
The comparison of historic land uses (Franciscean cadastre 1825) with current landuses (1997 land use survey) makes it possible to investigate the quantitative andqualitative changes in different types of land uses. In the following cross-tabulation-matrix (Table 6) the comparison of transition of land use changes for Golovec hill isgiven. Data for land use in year 1825 are given in columns and data for presentsituation (1997) are in rows.
Table 6. The comparison of transition between land uses in 1825 (columns) and 1997 (rows) in thearea of Golovec hill in ha (Pirnat in press).
The total area of forests is nearly the same as it was in the beginning of the 19thcentury. The spatial distribution, however, has changed. Beside stable forest areas mostother forest developed from former pastures, fields and meadows. On the other handsome former forest also changed into other land uses, mostly into meadows,settlements, roads, paths and even an orchard.
The area of fields is generally decreasing. They mostly were turned into meadows,some forest and also settlements. The pastures have disappeared completely, as mostof them were turned into forest and some meadows and settlements.
Altitudeclass
Relativefrequency
(%)
Cumulativerelative
frequency(%)
Slopeinclination
(%)
Relativefrequency
(%)
Cumulativerelative
frequency(%)
Slopeaspect
Relativefrequency
(%)
Cumulativerelative
frequency(%)
286-300 15 15 0-5 11 11 flat 11 11300-325 23 38 5-15 17 28 N 11 22325-350 21 59 15-25 12 40 NE 11 33350-375 18 77 25-35 24 64 E 10 43375-400 14 91 35-45 13 77 SE 13 56400-425 7 98 45-55 8 85 S 12 68425-450 2 100 55-65 5 90 SW 10 78
65-75 7 97 W 10 88over 75 3 100 NW 12 100
year 1825land use Forest Field Meadow Pasture Garden Orchard Settlement Path Total
forest 600.48 7.29 6.74 42.23 0.03 0.15 0.11 5.01 662.04field 2.99 5.51 3.92 0.67 0.12 0.10 0.05 0.08 13.43meadow 29.79 18.03 52.69 16.51 0.21 1.24 0.62 2.31 121.39garden 0.07 0.02 0.11 0.00 0.00 0.02 0.02 0.00 0.24
1 orchard 7.18 2.92 7.01 2.09 0.18 0.92 0.19 0.55 21.049 settlements 12.60 4.94 23.08 5.32 0.56 3.41 2.73 1.22 53.869 roads 5.13 1.19 4.01 1.41 0.07 0.16 0.27 1.39 13.637 paths 4.96 0.26 0.63 0.31 0.01 0.06 0.04 0.55 6.82
water 0.14 0.01 1.10 0.18 0.00 0.02 0.00 0.01 1.45barren 0.22 0.00 0.02 0.00 0.00 0.00 0.00 0.00 0.25park 0.00 0.00 0.02 0.12 0.00 0.00 0.00 0.00 0.14bush 0.06 0.00 1.22 0.00 0.00 0.00 0.00 0.00 1.28

107
Of all land uses the settlement area increased with nearly 50 ha, mostly from formermeadows, forests, pastures and fields. The area of meadows also increased, mostlyfrom former forests, fields and pastures. The area of orchards, roads and pathsincreased, primarily from forests and meadows. Other land use categories are small andtheir changes are relatively insignificant.
Multiple-purpose planning for urban forests
The vegetation on Golovec hill is fairly uniform. On brown soils, which rest oncarbonate slates and sandstone, the Blechno-Fagetum typicum and Blechno-Fagetum
luzuletosum (75%) dominate. Due to long-lasting human impact (gathering litter), thecommunities Vaccinio-Pinetum (20%), and occasionally Alnetum glutinosae (3%) andQuerco-Carpinetum (2%) also occur. The most widespread tree species is Europeanbeech. The Sessile oak is also common, and the Scotch pine and the Norway spruceare indicative for human impact. These forests are mainly privately owned, but the levelof economic utilisation is low for different reasons. Therefore the anticipated annualcut is, on average, merely 1m3/ha (Tavcar et al. 1997). Planned silvicultural measuresare adjusted to the timber production function and to other forest functions.
The most important cultivation measures are:- Thinning in the young pole stage;- selective cutting in the pole stage;- removing of dead and dying trees;- site preparation; and- young growth tending and planting.
Forest management section M2, a cadastral district of the Karlovško predmestje withan area of 38.95 hectares was selected as an example of what detailed silviculturalplanning could be like. The section M2 was divided into three management units. Thefirst unit consists of sub-sections in which the recreational function is of importance(in the vicinity of paths and roads - light grey colour in Figure 1). The second unit ismade up of areas which are not so interesting for recreation purposes either due tosteep slopes or lack of maintained paths (middle grey colour in Figure 1). The thirdunit is the zone above the rifle range in Rudnik, which is closed to the general public(dark grey colour in Figure 1).
Each management unit was divided into the silvicultural units provided in Table 7.
^
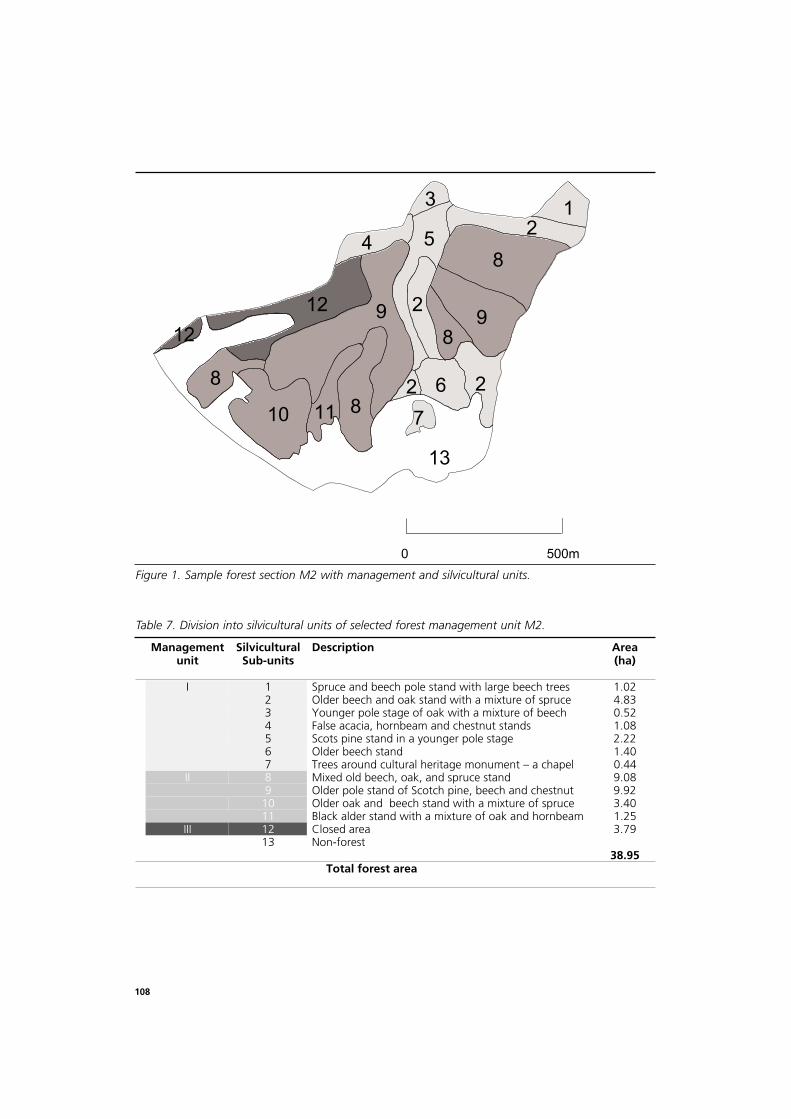
108
Table 7. Division into silvicultural units of selected forest management unit M2.
Managementunit
SilviculturalSub-units
Description Area(ha)
I 1 Spruce and beech pole stand with large beech trees 1.022 Older beech and oak stand with a mixture of spruce 4.833 Younger pole stage of oak with a mixture of beech 0.524 False acacia, hornbeam and chestnut stands 1.085 Scots pine stand in a younger pole stage 2.226 Older beech stand 1.407 Trees around cultural heritage monument – a chapel 0.44
II 8 Mixed old beech, oak, and spruce stand 9.089 Older pole stand of Scotch pine, beech and chestnut 9.92
10 Older oak and beech stand with a mixture of spruce 3.4011 Black alder stand with a mixture of oak and hornbeam 1.25
III 12 Closed area 3.7913 Non-forest
Total forest area38.95
Figure 1. Sample forest section M2 with management and silvicultural units.

109
Beside timber production the following non-timber functions of the urban forestGolovec are recognised by above mentioned documents (Pirnat 2001a):
Ecological forest functions:- Protection of soils on steep and highly erodibile sites;- hydrological function;- biodiversity function; and- climatic function.
Social forest functions:- Natural and cultural heritage protection function;- recreation function;- aesthetic function;- educational function; and- health function.
Some of these functions can be defined as static, since they are linked to certain areaconditions. The protective function, for example, is linked with inclination and bedrockand the hydrological function with the vicinity of water sources. The climatic andhealth function, moreover, is connected with the vicinity of towns (which is truepractically of the whole area of Golovec), and the natural and cultural heritageprotection function are characteristics of forests located in the direct vicinity of theseobjects.
Other forest functions can be regarded as more dynamic since our knowledge of themrapidly changes and so do our needs. Examples are the biodiversity, recreation,aesthetic and educational functions which will be dealt with in detail.
The biodiversity functionDue to the construction of a motorway around Ljubljana, a 450-meter long greenbeltabove the tunnel through the hill Golovec is the sole natural connection making itpossible for wild animals - with the exception of birds - to migrate from the suburbanlandscape to the city and back. An analysis of the recreational use of this part of thecity shows that this element of Golovec, except for the road leading to Orle, is lessimportant for most Ljubljana residents. Therefore the eastern and south-eastern partof Golovec can be regarded a significant area for ensuring biodiversity in the urbanforests of Ljubljana.

110
Measures to ensure sustainability of the biodiversity function include:- Conservation of so-called minority ecosystems or biotopes;- conservation of all sites and habitats of plants and wild animals included in the Red
List of endangered species;- preparation of recreation plans so that the above-mentioned areas are not included;
and- execution of silvicultural measures performed in the vicinity of habitats of rare and
endangered species of wild animals should be carried out in strict adherence to theappropriate time of year.
The recreation, aesthetic and educational functionsAlthough these functions are dealt with separately under the 1993 Forest act, they aredealt with together here for practical reasons and because of the similarity of measuresinvolved.
The recreation function of the Golovec forests was evaluated by counting visitors on a(sunny) Sunday (7 May 2000, from 8.00 a.m. to 19.00 p.m.). Visitors were counted byforestry undergraduates at 24 possible entry points where paths or roads lead into the
13
293
1424
1
22
1
45
62
110
290
16 14
33 33
95
50
386
0 0 18
196
1 2 3 4 5 6 7 8 9 10 11 12 13 14 15 16 17 18 19 20 21 22 23 24
Entry point
Nu
mb
er
of
vis
ito
rs
Figure 2. The number of visitors at individual entry points per day (Osani 2001).

111
forest. On that day a total of 1,608 hikers were counted. The majority was recorded atfour entry points (see Figure 2). The entry points were located along three mostimportant roads or pathways linking the hill Golovec with Ljubljana: the road leadingto Orle, the road which links the suburb of Rudnik with the suburb of Štepanjskonaselje via Golovec, and the pathway to the observatory on Golovec. At all other entrypoints considerably fewer hikers were observed, because these are, as a rule, less wellknown, hidden and narrow, and lead up the hill past backyards and individual houses.
The findings indicate that maintenance and accessibility of pathways are consideredimportant by most visitors. This is particularly true of the hill Golovec, which isregarded as rather steep for recreational use outside pathways. In addition to motorists,the most frequent visitors are hikers and cyclists followed by couples and families(Osani 2001). The main group activity is cycling.
Thus we can conclude the following:- The recreation forest function is linked with maintenance and accessibility of
pathways;- it is important that it is clear which part of the road is to be used by motorists and
cyclists, and which is intended for hikers;- signs and benches should be provided;- the forest should have a high maintenance intensity and should be well managed, so
that all development stages are represented, including natural regeneration, youngforest, mature forest, and an adequate number of trees of exceptional dimensions;and
- it is of importance that an alternative pathway is available when major forestmeasures (e.g. felling and regeneration) take place.
Difficulties and restrictions include:- Rather difficult and neglected access;- steep slope;- private ownership (formally, this is not necessarily a problem); and- excessive stress ( e.g. damage to trunks, compacted soil, erosion, and lack of natural
regeneration).
Thus it can be concluded that western parts of the hill Golovec are the mostappropriate for recreation purposes as this area has adequate pathways leading rightinto the heart of Ljubljana. This is, however, also an area where most conflicts arise.

112
Discussion
Small areas of urban forest, especially forest remnants in an urban landscape are understrong development pressure all the time. If there is a wish for more attractiveresidential areas, all existing forest patches ought to be preserved. The linkage betweentree corridors along the Ljubljanica River and along streets and parks will thus remainan important link in the green chain (Ahern 1995) of the Ljubljana townscape.
The natural tree structure should be conserved in all forest areas. In larger forestpatches the application of appropriate tools will have to enable the implementation ofa more emphasised recreational and aesthetic role of the forest and to stress theirsignificance for local habitats. Silvicultural measures - from stand tending toarboricultural measures - will have to be emphasised. This becomes/remains the taskof urban forestry.
An urban forest must preserve features of natural ecosystems in terms of structureand functioning on account of its sustainability and stability, and because a connectionwith a natural ecosystem is of vital importance for the physical, psychological andspiritual stability of visitors. It is essential that relationships between developmentphases are balanced as much as possible and interlinked within the whole area. In thisway these make it possible for the citizens of Ljubljana to have one of those rare linkswith a life cycle which they can observe from birth to death.
In the field of management of urban forests future work should concentrate on thefollowing topics:- Development of co-operation between state forestry service and local municipality
regarding urban forest management (from long-term strategic plans to detailedoperational plans and supervising operational management on different levels).
- Development of adapted management in urban and suburban forests on operationallevel with an emphasis on small forest remnant patches and rare and importantbiotopes (maintenance of biodiversity) in urban and suburban landscapes.
- Detailed silvicultural planning should focus on tending objectives that will enableurban forests to fulfil the expressed need for social and ecological functions of urbanforests (small scale measures carried out in winter time, selection cutting, chosentrees with special habitats). The structure and functioning of urban forests should bemaintained, howeer, in a close-to-nature way (site conditions with appropriate treespecies should never be neglected in planning), as an ecosystem rather that artificialpark. This can be achieved with the development of remote sensing based inventoryand management methods in urban forestry.
- Since the unsuitable ownership structure in urban forests (high number of privateowners with a small forest ownership) represents a serious obstacle to long-term

113
oriented forest management it is very important that the municipality supports thedecision for systematic redemption of privately-owned urban forests. Moreover itshould provide long-term financing for pre-emption of urban forests and foradapted forest management. Private ownership of urban forests is a potential sourceof conflicts between private and public interests.
- One of the future tasks of urban foresters also is the development of unusedpotential of forests for recreation and education, which is important since publicinterest in participation in management of urban forests is increasing. In this wayurban forestry will help to establish society sharing an interest in urban forestry(Pirnat in press).
In today’s urban society, a different level of awareness and of relationships has beendeveloped from that of the rural society of the recent past. A cult of youth, power,beauty and success has been created, and any departure from this ideal means, in fact, afailure.
Society, which is mainly aiming at a higher production level, has lost a great deal ofhumanity and also a link with nature. Similarly, this is happening to the basic humanexistential cell - the family. Today, birth, a great part of education and work, and, at theend, death take place quite often outside the family. Therefore, it is becomingincreasingly difficult for us to understand and accept a number of principles governingman’s physical, psychological and spiritual development. The same is also true for theknowledge and understanding of natural phenomena and principles which the post-industrial society tends to neglect and forget. So a question justly arises as to what(urban) forests can offer to (urban) inhabitants of the planet Earth. The questioncannot be answered unequivocally once and for all. Instead, a few points are presentedhere which will hopefully make each of us consider the issue and search for an answer.These points are, in fact, a survey of the man’s development as a whole and of hiseveryday decisions and doubts. An attempt is made to establish a link with individualdevelopmental stages of man’s attitude to the (urban) forest and the development ofurban forestry.
Human development versus (urban) forest development
Developmental stages of the forest
Young Thicket Thin pole Younger Older Old stand Forestgrowth pole stage pole stage regeneration
Stages in a person’s life
New-born Child Early Late Adulthood Early old age Late old ageadolescence adolescence

114
New-born baby:The environment ( ) exerts an influence
on a baby (→ ) who cannot react as yet.
Child:The environment experts an influence on a child, who react in acertain way but this response has no effect on the environment.
Early adolescence:The environment influences a teenagerwho reacts strongly in return
Late adolescence:The teenager has no interest at all in the environment,he is interested only in himself.
Adulthood:The time of life when a balance is established between theinfluence of the environment and an adult’s reaction to it.
Early old age:The environment exerts an influence on an old person, who reactsto it but this is of no consequence.
Late old age:he environment is of no importance any more. Instead, all whatmatters is internal wealth and the internal harvest.One can clearly compare certain stages of man’s physical development withdevelopmental stages of the forest:
.... ?

115
- Young growth: new-born baby.- Thicket: child.- Thin pole: early adolescence.- Younger pole stage: late adolescence.- Older pole stage: adulthood.- Old stand: early old age.- Forest in regeneration: late old age.
Man’s psychological development
Instinct Impulse Passion Motive Wish Intention Decision
- A person’s instinct is a basic and ubiquitous feeling, which influences the way he orshe acts, although it is not physically experienced.
- A person’s impulse affects the way he or she acts and it is physically experienced (e.g.food, sleep).
- Passion is a person’s instinct at a psychological level, which makes ideas orimpressions possible, but which is not yet present at the level of impulse.
- A person’s motive (idea) is his or her response to the environment, which is feltwithin.
- A person’s wish expresses the presence of his or her will for a certain action.- A person’s intention shows the development of his or her will, from a wish to a
decision.- A person’s decision is the final act which governs actions.
Man’s spiritual (in)balance
Trust Modesty Courage Enthusiasm Love Gratitude FaithGreed Arrogance Anger Laziness Lust Envy Greediness
Man’s rise and fall can be best illustrated with a symbolic representation of sevenvirtues and seven vices in terms of the polarities of good and evil.
The development of man’s attitude to the forest
Fear Survival Hunting Timber Other Multiple- Sustaina-production functions purpose use bility
- Fear: The forest is a dangerous place.- Survival: Despite man’s fear of the forest, it provides shelter in case of great danger.- Hunting: The forest is a source of food and it also provides an opportunity for
asserting oneself.

116
- Timber production function: The forest provides wood, which is a source ofcomfort and safety (house, tools, firewood).
- Other functions: The public is becoming aware that the forest is much more than asource of wood.
- Multiple-purpose use: This is a concept of how to ensure as many functions of thesame forest at the same time.
- Sustainability: This is a method for ensuring all of the above mentioned functionsover a longer period of time.
The reader may determine from her or his own experience what the main temptationsare to which man’s attitude to the forest is subjected.
Benefits of (urban) forests
Wood Other goods Water, air Diversity Recreation Amenity Meditation,prayer
At different stages in a person’s life, different benefits of an urban forest are ofinterest.
Fields of work of urban forestry
Non-living Flora Fauna Forestry Forest owners Politicians Generalnature profession public
Urban forestry deals with a very wide sphere of human activity, which can be summedup by the following categories:
Knowledge of living and non-living nature:- Knowledge of fundamental natural givens of space (geology, soil, site and plant
communities) and- knowledge of special features of planning and management required for urban
forests with all their functions and roles.
Technological knowledge:- Knowledge of remote sensing techniques and- knowledge of geographic information systems (GIS).Sociological knowledge:

117
- Solid knowledge of man’s development and of his physical, psychological and spiritualneeds - and of a link between these needs and nature or different needs at differentstages in a person’s life and
- solid knowledge of basic principles of psychology, pedagogy and communications(public relations, owners, general public, politicians, schoolchildren etc.).
Urban forestry is probably beyond the creative capacity of an individual. Hence itrequires co-operation of a team of professionals. Nevertheless, or for this very reason,demands of this job should pose a challenge rather than an unattainable goal.
References
Ahern J (1995).
Greenways as a planning strategy. V: Landscape and Urban Planning 33(1-3): 131-153.
Corson R J (1992).
ROOTS Digitizing System - User Manual. Skillman, Decision Images, Inc.
Eastman J R (1997).
IDRISI for Windows. User’s Guide, Version 2.0. IDRISI Production, ClarkUniversity, Worcester.
ESRI (1996).
ArcView GIS Understanding GIS. Redlands, California.
Franciscean cadastre (1825).
Cadastre for the cadastral communities in the study area.
Golob S (eds) (1993).
Nartovanje v gozdovih zelenega pasu Ljubljane. In: Mestni in primestni gozd-našaskupna dobrina.- Zbornik republiškega posvetovanja v okviru tedna gozdov, ZDITin IGLG, Ljubljana: 106 - 125.
Kova M & Golob S (1993).
Gozd in drevje v mestni krajini Ljubljane. -V: Mestni in primestni gozd - našaskupna dobrina. Ljubljana, Zbornik republiškega posvetovanja v okviru tednagozdov: 66-79.
Osani A (2001.)
Mnogonamensko gospodarjenje na primeru Golovca.- Diplomska naloga, BF,Oddelek za gozdarstvo.

118
Oven P, Brus R & Pirnat J (1999).
Slovenia State-of-the-art-report. In: Forrest M, Konijnendijk CC & Randrup TB(Eds) COST Action E12 - Research and development in urban forestry in Europe:254-266. Printing Office of the European Communities, Luxembourg.
Pirnat J (1997).
Razpored gozdov v ljubljanski urbani krajini.- Zbornik gozdarstva in lesarstva 53:159-182.
Pirnat J (2001).
Slovenian input to the questionnaire on city profiles, developed within theframework COST E12 Action (unpublished).
Pirnat J (in press).
The development of urban forestry in Slovenia – a key study of Ljubljana.Urbanistica.
Tavar M, Vidmar A & Vidmar J (1997).
Ljubljanski mestni gozd. Pobuda za razglasitev ljubljanskih mestnih gozdov za gozds posebnim namenom.
The Forest Management Plan for the Forest Management Unit ‘Rast’.
Unpublished manuscript.
The Slovenian Forest Act (1993).
Ministry for Agriculture and Forestry, Ljubljana.

119
Results of Changing Social Demands in IstanbulBahçeköy Forest Enterprise: a case study*
Ömer Eker & Kenan Ok
University of Istanbul, Faculty of Forest, Department of Forestry Economics80895 Bahçeköy, Istanbul, Turkey
Abstract
Istanbul is one of the heavily populated major cities in Turkey. In this study, theBahçeköy Forest Enterprise (BFE) - which is located nearby the Faculty of Forest,University of Istanbul and within the boundary of Belgrad Forest - was chosen as casestudy. It is one of the rare enterprises where the effects of rapid urbanisation andpopulation increase can be noticed in terms of varying demands of society.
During the early establishment period of the enterprise, timber production was theprimary objective. Recreation management was also carried out at a small-scale levelduring this period. In the forest, water production also takes place, using the reservoirsand aqueducts that were constructed during the Ottoman Empire Era. Distributionand sale of water, however, has moved out of the BFE. In the early establishmentyears of the enterprise, the water production objective was not primarily included inthe forest management plans.
With an increasing population, people’s demands from forests in Istanbul alsochanged. Considering the importance of non-timber values, the BFE is currentlyfocused on producing recreation and water collection services while considering timberproduction as a secondary use in its management plan.
In the research presented here, the balance sheet of the BFE and the demand changeindicators in the management plans were analysed.
Key words: changing social demand, forest functions, finance of forest enterprises
* This research was supported by the Research Fund of the University of Istanbul. ProjectNumber: B-1220/02082001.

120
Reasons for the choice of Bahçeköy Forest Enterprise as study subject
The Ministry of Forestry is responsible for forestry activities in Turkey. Forestryactivities have been carried out under the General Directorate of Forest (OGM), theGeneral Directorate of Afforestation and Erosion Control (AGM), the GeneralDirectorate of Forest and Rural Relations (ORKÖY) and the General Directorate ofNational Parks, Hunting and Wildlife (MP) of Turkey.
These general directorates also have sub-organisations at the local level calledenterprises in OGM and agencies called ‘Head-Engineerings’ in AGM, ORKÖY andMP. OGM has 241 forest enterprises. These enterprises are owned by the state andcarry out their activities under market rules and related legislation.
The reasons for the choice of the Bahçehöy Forest Enterprice as study subject can beexplained as follows:
- The BFE is the oldest enterprise among the 241 forest enterprises in Turkey. For themanagement of the forests within the boundaries of the BFE, five differentmanagement plans were drawn up beginning from 1937. In addition, a modelcoppice forest management plan and plans for the management of recreation siteswere made.
- The BFE is simultaneously responsible for the management of the forest functions:water, timber raw material, recreation, scientific research, and wildlife. The BFE israre among forest enterprises in Turkey for having a history of responding to avariety of demands.
- The BFE is located within the boundary of the biggest city in Turkey, Istanbul.Istanbul has been the capital of both the Byzantine and Ottoman Empires during itshistory. Although it lost capital-city status at the beginning of the Turkish Republic, itcontinues to be the centre of economic, social, and cultural activity. As seen in Table1, the population of Istanbul has increased faster than the population of Turkey.According to the results of the 1927 census, the population of Istanbul accountedfor 5.82 percent of Turkey’s total population. This proportion increased to 13.46percent in the 1995 census. Except for 1927-1950, Istanbul’s population growth ratehas been higher than that for Turkey as a whole. This growth in population is closelyrelated to rapid industrialisation and urbanisation in the Istanbul Region. Manyreforms have been observed firstly in Istanbul, including new social demands on theforest. The forest enterprises in Istanbul, therefore, have drawn attention forpioneering responses to the new social demands in comparison to enterprises inAnatolia.

121
Table 1. Population and population growth rates in Istanbul and Turkey.
Methodology
Unfortunately, comprehensive demand analyses have not been carried out for theforest enterprises in Turkey. The forests are managed, however, in compliance withmanagement plans. The decisions on targets and assumptions of planners andmanagers are substituted for actual demand analyses. Therefore, these decisions aboutland allocation and resource management can be accepted as indicators of socialdemand that are targeted to be satisfied in the planning process. In this study, anattempt has been made to introduce changes in social demand in light of forestmanagement plans prepared for the Belgrad Forest.
Management Plans include the fundamental decisions that affect the financial structureof an enterprise. Due to the decisions, which are taken according to these plans, theincome of the enterprise may increase or decrease. Income-cost combinations of theenterprise are affected by the management plans. Therefore, management plans haveeffects on profit or loss in the balance sheet of the enterprise. In order to see theactual financial structure of the BFE, analysis of balance sheets are also included inthis study.
A brief history of the Belgrad Forest and the BFE
During the Byzantine Era the Belgrad Forest was used for both timber and watersources. It was during the Ottoman Era, however, that the forest was utilised in anintensive way.
After the conquest of Istanbul by the Turks in 1453, the city’s population grew rapidlydue to migration. Large-scale construction projects were undertaken during this period,creating a large demand for forest products based on timber raw material. This caused
CensusYears
Populationof Turkey
Populationof stanbul
PopulationGrowth Rate
BetweenCensuses inTurkey (%)
PopulationGrowth Rate
BetweenCensuses instanbul (%)
Proportion ofstanbul inTurkey's
Population(%)
1927 13 648 000 794 444 5.821950 20 947 183 1 166 477 53.5 46.8 5.561960 27 754 820 1 882 092 32.5 61.3 6.781970 35 605 176 3 019 032 28.3 60.4 8.481980 44 736 957 4 741 890 25.6 57.1 10.591985 50 664 458 5 842 985 13.2 23.2 11.531990 56 473 035 7 309 190 12.0 25.1 12.941995 62 526 000 8 417 000 10.7 15.2 13.46
I
I
I

122
degradation of the forest. After the military expedition of Suleyman the Magnificent toBelgrade in 1521, immigrants from that region settled in the forest. The villagefounded by these immigrants got the name ‘Belgrad Village’. The forest, therefore,became known as ‘Belgrad Forest’. Between 1554 and 1564 existing waterways wereextensively repaired and new aqueducts were established in order to provide water forthe increasing needs of Istanbul city. In 1575, responsibility for protecting existingwaterways, aqueducts, and pools and partial responsibility for the forest was given to awater organisation called Sular Idaresi (Water Administration), which had beenestablished that same year. The Sular Idaresi was the first organisation responsible forprotecting the Belgrad Forest. In order to respond to the requirements of the city forwater, Kömürcü Bent (1620), Büyük Bent (1724), Topuz Bendi (1750), Ayvat Bendi(1765), Valide Sultan Bendi (1796), Kirazl1 Bent (1818), and Yeni Bent (1839)reservoirs were chronologically constructed in the 17th, 18th, and 19th centuries. Duringthe construction of Yeni Bent in 1839, other reservoirs and aqueducts were alsorepaired.
The 19th century is the period when efforts to establish a forest organisation by theOttomans began. In 1839 the General Directorate of Forestry was established, in 1857the first Forest School, in 1858 Land Act, and in 1870 Forest Regulations. During thisdevelopment process, the protection of the forest was taken from Sular Idaresi andgiven to a team consisting of a forest engineer and some supporting work forces. Thisteam carried on working under the umbrella of Istanbul Forest Head-Engineering,which is attached to OGM.
In 1894 an act was passed to remove the inhabitants of Belgrad Village to an areaoutside the forest because of the damage they were causing to the hydrologic functionof the forest. Strict protection measures within the boundaries of Belgrad Forestfollowed this action.
In 1914, however, with the beginning of World War I heavy tree cutting occurred inorder to provide railway-ties, fuel wood and other timber material for the army and city.The level of tree cutting continued to increase during the sovereignty period of theoccupying powers between 1918 and 1923. After the withdrawal of the occupyingpowers, the Belgrad Forest was put under protection again, but it was not possible torepair the damage done in the forest. By an act passed on November 12th, 1924 forestprotection organisations were strengthened and the forest care operation for BelgradForest was given to the existing Forest High School nearby. With a law passed on May26th, 1926, Belgrad Forest was given ‘State Forest Enterprise’ status for the first time,but a year later this enterprise was closed. In 1949, the BFE, which is responsible forthe management of the Belgrad Forest at present, was established as a ModelEnterprise (Eker 1997).

123
Utilisation of the Belgrad Forest according to management plans
Until now, five management plans for different periods have been drawn up to adjustutilisation from the Belgrad Forest. Apart from these plans a model coppice forestmanagement plan was also prepared.
1937 Management Plan
Efforts to clean up the heavy damage done both at the beginning of the 20th centuryand before and for improving the forest can be seen in the 1937 Management Plan.Strict measures were taken to protect the forest. In addition, some silviculturalinterventions to repair the forest were stressed in the plan.
During the preparation of the 1937 Plan, it was stated that special care must be givennot to cause negative effects on the reservoirs and aqueducts supplying water to thecity, and the rivers that joined in the Ka1thane watershed. Besides, while responding tothe education and research needs of the Faculty of Forest, University of Istanbul,which was formerly known as Forest High School, production of timber raw materialwhich would provide economic benefit was also targeted in this management plan.
According to records of the 1937 Plan, allocations for the aimed purposes in Table 2were made. Approximately, 56 % of forest area was allocated for timber production.The total area was 4 919,5 hectares in the 1937 Plan. 28,9 % of the area was allocatedfor water collection purposes. 11,5 % of the forest area was allocated as „protectedforest“ status due to heavy tree cuts made in recent years and this area was taken outof timber raw material production.
Table 2. Amount and Shares of the Areas Concerning Non-Timber Use in the 1937 Plan (OGM1937).
According to the forest inventory which was made for the preparation of 1937 Plan,the total growing stock was calculated to be 220,317 m³ and the growing stock perhectare was found to be 44.78 m³. In this plan, out of 2,200.4 m³/year annualincrement, 1003 m³/year (45,58 %) was decided as allowable cut.
Forest Land Use Type Area (ha) Percentage in Total Area (%)
Water Collection 1 424.05 28.9Protected Forest 568.15 11.5Scientific 92.20 1.8Recreational 80.95 1.6Wildlife Protection 14.00 0.3
Total 2 179.35 44.1

124
1949 Management Plan
The second management plan for the Belgrad Forest was prepared in 1949. When thisis examined, it can derived that some areas nearby the forest were added to theboundaries of the Belgrad Forest. Therefore, the total area increased from 4,919.5hectares to 5,294.1 hectares. It was decided that the protection measures takenaccording to the 1937 Plan would also continue in the second management plan.
Table 3. Amount and Shares of the Areas Concerning Non-Timber Use, in the 1949 Plan (OGM1949).
While no new decision was made about scientific and wildlife functions of the forest inthe 1949 Management Plan, thoughts of allocating some protected forest areas to thewater production area and narrowing the boundaries of areas for recreational purposesdid draw the attention. As seen by the comparison of Table 2 and Table 3 the amountof protected areas for water production increased in the 1949 Plan. The area allocatedfor functions other than timber production is approximately 37,5 % of the wholeforest.
During the preparation of the 1949 Plan, it was estimated that total growing stock wasapproximately 256,884 m³ according to inventory data. Although the total growingstock increased during this management period, no decision to yield timber as timberraw material was made. However, some silvicultural interventions requiring removal ofweak, diseased trees to improve the quality of the forest were carried out in the area.
During the application of the 1949 Management Plan, an area of 38 hectares wasallocated for construction of the Atatürk Arboretum. In 1954, an area of 70 hectareswas allocated for the establishment of ‘Wildlife Production Area’. In addition, areasnearby Valide Sultan Bendi, Yeni Bent and Neet Suyu were designated for picnicking inthe Belgrad Forest. These allocations were realised outside the decisions of the 1949Management Plan.
Forest Land Use Type Area(ha) Percentage in Total Area (%)
Water Collection 1 779.35 33.61Protected Forest 166.00 3.10Recreational 40.30 0.76
Total 1 985.65 37.47

125
1955 Model Coppice Forest Management Plan
In the 1937 Management Plan the compartments which were numbered as 82, 83, and84 were re-planned for the purpose of special coppice forest management. Theobjectives of allocating an area of 205.3 hectares for coppice forest management canbe explained as follows:- To provide fuel wood and raw material for the production of charcoal for local
villagers;- to supply wooden stakes to the villagers for supporting agricultural crops such as
tomatoes, beans, etc.; and- to establish an experimental model coppice forest for the students of the Faculty of
Forest (OGM 1955).
1965-1984 and 1971-1990 Management Plans
The first management plan following the 1939 and 1949 Plans was prepared for the1965-1984 time period. Before this period ended, a new management plan includingthe 1971-1990 period was also implemented. When these two plans are compared withthe former plans, it is observed that compartments in the area distribution table werenot recorded in detail. In the 1965-1984 Plan, it was decided that 49.43 ha, 103.64 haand 56.21 ha areas would be allocated for recreation, wildlife production, and theAtatürk Arboretum (OGM 1964a and 1964b). The 1971-1990 Plan included a recordallocated 36.73 hectares for recreation and 56.21 hectares for the Atatürk Arboretum.Information related to wildlife production areas was not part of the 1971-1990 Plan(OGM 1971).
According to data which was taken from the 1965-1984 Plan, the total growing stockwas 604 343 m³. In the 1971-1990 Plan, this increased to 714 558 m³. Optimalallowable cut in the 1965-1984 and 1971-1990 Management Plans were calculated as14,247 m³ and 18,094 m³. In the 1965-1984 Plan, allowable cut in the forest increasedto 1,47 % of the total growing stock.
1990-1999 Management Plan
The last forest management plan, which is called the ‘functional management plan’,was drawn up for the period of 1990-1999. In this plan, the entire forestland isallocated to different forest functions. The functions and the amount of areas devotedto each are given in Table 4.

126
Table 4. Amount and Shares of the Forest Functions, in the 1990-1999 Plan (OGM, 1990).
The sum of functional use areas is equal to the total area of the Belgrad Forest, whichwas not the case with the former plans. Only cutting to maintain the health of theforest is allowed in the forest area and timber production for timber raw material is notaccepted as a primary objective. Therefore, 100% of the forest area is allocated fornon-timber production objectives.
According to data of the forest inventory for the preparation of the 1990-1999 Plan,the level of growing stock increased to 1,083,781 m³. Annual increment is 18,182 m³.It was decided that the allowable cut would be 6,189.1 m³ which is equal to 34 % ofthe total annual increment in the forest.
Balance sheet data of the BFE (1990-2000)
As mentioned in the Methodology section, balance sheets of forest enterprises reflectthe financial results of their activities. Unfortunately, the balance sheets of the BFEdating back to its establishment in 1949 could not all be found. Some results ofcollected balance sheet data covering 1990-2000 are given in Table 5.
In column 2 and 4 of Table 5 nominal values of general administration costs andprofit/loss data including 1990-2000 period are shown. Because of the existing highinflation rate in Turkey, these values in column 2 and 4 were adjusted to real valueswith help of Price Indices from the Istanbul Chamber of Commerce, base 1963=100.Adjusted real values are shown in column 3 and 5, in Table 5.
In the past ten years while the average general administration cost was 11,193 TL(Turkish Liras), the BFE only had profit in the last two years. Between 1990-1998 theenterprise always incurred losses. In 1999 the Sariyer Forest Districts which formerlywas attached to the Directorate of Istanbul Forest Enterprise became part of the BFE.Therefore, the BFE artificially started to have profits after the addition the SariyerForest District.
Forest Land Use Type Area(ha) Percentage in Total Area (%)
Water Collection 1 406.16 26.44Erosion Control 2 248.17 42.26Scientific 651.66 12.25Recreational 910.06 17.10Wildlife Protection 103.64 1.95
Total 5 319.69 100

127
In the accounting system of forest enterprises in Turkey values such as timber,recreation, and water which can be measured in monetary terms are not recordedseparately. The main revenues of enterprises are based on timber sales. Revenueswhich are gained from uses other than timber sales are put together under the title‘other revenues’. Therefore, trends in these numbers can not be followed. Non-monetary benefits such as scientific research and erosion control, can not be reflectedin the balance sheets.
General Trends of Forest Functions for the BFE
When the management decisions in the records from the Belgrad Forest are examinedit is understood that the forest has been managed with the possibilities of supplyingproduction of timber raw material, water, recreation, scientific research and wildlife.However, historically, it is observed that the development of each use has been realisedas follows:
- Levels of total and unit area growing stocks which are the indicator of productionability of the forest from the view point of timber raw material have five timesincreased (from 220,317 m³ and 44.78 m³/ha to the level of 1,083,781 m³ and204.64 m³/ha) since 1937. However, the production level of timber did not increasecompared with the growing stock. Trends of growing stock and allowable cuts canbe seen in Figure 1. In fact, it is understood that the 205.3 ha area which wasallocated as coppice forest for the production of fuel wood and wooden stakes wasentirely converted to ‘high forest’. The need of villagers for fuel wood decreased asthey found alternative fuel sources and the demand for wooden stakes totallydisappeared. This is caused by the industrialisation and urbanisation which occurred
Table 5. Balance Sheet Data of the BFE (1990-2000). 10,000 Turkish Liras (TL) equalled 0.0185 eurosin 2000.
YearsGeneral
Administration Costs(TL)
Adjusted GeneralAdministration
Costs (TL)
Profit or/Loss(TL)
Adjusted Profitor Loss
(TL)
2000 174 429 640 000 11 269 1 072 856 250 691999 140 268 302 250 13 929 102 361 208 250 10 1651998 75 056 398 000 10 709 -53 318 103 259 -7 6081997 54 192 184 057 13 051 -44 130 320 100 -10 6281996 21 499 505 000 9 238 -5 255 752 000 -2 2581995 11 338 638 725 8 360 -8 352 941 790 -6 1591994 7 808 626 000 10 823 -2 113 054 500 -2 9291993 3 963 079 645 12 111 -4 808 701 945 -14 6951992 2 309 775 700 10 958 -11 071 972 -531991 1 382 782 694 10 965 -353 810 134 -2 8051990 1 022 378 422 12 368 -800 014 776 -9 678

128
in Istanbul and its surroundings. However, it is not possible to say that socialdemand for fuel wood produced by the BFE has entirely disappeared. Bread has agreat importance in Turkish dietary custom. Consumer demand has increased forbread baked in ‘wood heat’, especially in recent years. Therefore, it is understoodthat a limited demand for fuel wood continues.
- The importance of water resources in the Belgrad Forest for Istanbul has beenincreasing for five hundred years. Currently, the Belgrad Forest supplies 2.6 million/m³ of water to Istanbul (Destan 2000). To ensure the water supply forests nearbythe reservoirs and aqueducts were managed according to the water productionfunction by the BFE. However, water produced by the Belgrad Forest is distributedby ISKI, an organisation attached to the Municipality of Metropolitan Istanbul.ISKI is only in charge of the distribution of water, but it sells the water and collectsthe revenues of it. Therefore, no share of the income is added to the balance sheetof the BFE.
- The amount of land for recreational purposes within the Belgrad Forest hascontinuously been increased. At present, 322.5 hectares of the forest is used forrecreation. While the number of visitors per year for recreational purposes was630,128 in 1990, it increased 63% and reached 1,004,107 persons in the year 2000.The Belgrad Forest was visited by an average of 890,591 persons per year between1990-2000. As also seen from the studies (Pehlivanolu (1986), Çalayan (1999) andDestan (2000)) which were prepared for the Belgrad Forest, the demand forrecreation has continuously increased. Management of recreational areas, however,was taken from the BFE and has been given to the Head-Engineering of GeneralDirectorate of National Parks, Hunting and Wildlife. Thus, revenues gained fromrecreation are not reflected on the balance sheets of the BFE.
Growing Stock per
hectare m 3/ha
0
50
100
150
200
250
1937 1949 1965 1971 1990
Growing Stock m3
0
200000
400000
600000
800000
1000000
1200000
1937 1949 1965 1971 1990
Allowable cut m3
0
5000
10000
15000
20000
1937 1949 1965 1971 1990
Figure 1. Trends of growing stocks and allowable cut.

129
- Within the boundaries of the Belgrad Forest, deer have been bred in the wildlifeproduction area. A rapidly decreasing wildlife population has increased theimportance of this service. Demand for wildlife areas is rising. However,management of this area was given to MP as well.
- The Atatürk Arboretum supplies both scientific and cultural services for both theFaculty of Forest and people living in Istanbul. Concern for the Atatürk Arboretumis rising. According to data for the year 2001, there are 4,370 members of thearboretum who pay 200 million TL per year as a membership fee. By a regulationwhich was recently passed, the management of the Atatürk Arboretum was given tothe Directorate of the Forest Research Institute of 0stanbul. In the other sectionsof the Belgrad Forest scientific and educational activities of the Faculty of Forestare continuing.
Results and discussion
The demands of society related to the BFE moved from timber raw material to non-timber functions of the forest. Of these functions, water and recreation serve otherorganisations. Increasing recreational demand for the Belgrad Forest generatesrevenues in the form of entry fees for MP. Recreation also supports commercialactivities adjacent to the forest. New commercial activities, such as selling food, sportsequipment, and picnic materials appeared as recreational use of the forest increased.
In order to protect water quality and quantity, the BFE sacrifices some of its revenuesfrom timber production. Although there is not a formal agreement between ISKI andBFE on the distribution and sale of water collected in the Belgrad Forest, theseactivities are carried out by ISKI. The BFE can not obtain any revenue from waterproduction activities. Therefore, the BFE has lost an important source of revenue. Inaddition, general administration costs of the BFE have not decreased and BFE hasexperienced continuing budget deficits. The transfer of Atatürk Arboretum has causedthe enterprise to lose of an important source of prestige.
The collection of recreation revenues by MP may not cause any problem when theorganisation’s responsibilities for management and protection of the forest areconsidered. However, transfer of recreational areas to MP caused a decrease in BFE’srevenues, but it did not decrease the enterprise’s administration costs. This shows thateither the transfer of works related to recreational sites were improperly conceived orthe BFE has found new activities which would cause an increase in its generaladministration costs. However, there is no indication of these new activities. Therefore,it might be said that there is a problem in terms of arranging the transfer of therecreational areas.

130
Increasing demand for forest functions such as erosion control and, scientific andeducational research are not reflected in the balance sheet of the enterprise. As a result,the enterprise, which is facing a worsening financial situation, will struggle to managethe increasingly important forest.
Within the boundaries of the area the BFE is not responsible for revenues that couldbe gained from water collection, but instead an organisation which makes nocontribution in terms of the management and protection of the forest is responsible.Unfortunately, institutional regulations to improve this situation have not been realisedyet. The BFE must, at least, get the opportunity costs of timber production, which isforgone in order to increase the quality and quantity of water production. Otherwise,the enterprise would face financial problems due to its decreasing revenues. Therefore,the financial sources of the enterprises in Turkey should be revised to adaptthemselves to the developing new situations. The ways of reflecting non-monetaryforest functions in the balance sheets of enterprises should be investigated.
As seen in the BFE case study, population increase, urbanisation and industrialisationmay cause different problems for each of the other 240 forest enterprises in Turkey inthe future. For this reason, the definition of production, benefit, organisation andresponsibility of forest enterprises must be redefined in compliance with changingsocial demands.
References
Çalayan AY (1999).
Determining the features of recreational demand in the Belgrad Forest (In Turkish).MSc-thesis. University Of Istanbul, Istanbul.
Destan S (2000).
Management and functional characteristics and assessment of forest ecosystem inforest management activities. PhD-thesis. Sofia, Bulgaria. (In Bulgarian)
Eker Ö (1997).
The economics of multiple use of forest with special reference to Turkey. MSc-thesis. School of Agriculture and Forest Sciences University of Wales, Bangor.
OGM (1937).
Management Plan of Istanbul Belgrad State Forest. (In Turkish)
OGM (1949).
Revision Plan of Istanbul Belgrad State Forest. (In Turkish)

131
OGM (1955).
Model Coppice Forest Management Plan of Istanbul Belgrad State Forest. (InTurkish)
OGM (1964a).
Detailed Management Plan of Bahçeköy Model State Forest Enterprise for BentlerSeries. Istanbul Forest Head-Engineering. (In Turkish)
OGM (1964b).
Detailed Management Plan of Bahçeköy Model State Forest Enterprise forKurtkemeri Series. Istanbul Forest Head-Engineering. (In Turkish)
OGM (1971).
The First Detailed Revision Plan of the Head-Directorate of Bahçeköy ModelForest Enterprise for Bentler Series. (In Turkish)
OGM (1990).
Management Plan of Directorate of Bahçeköy Forest Enterprise, Directorate ofIstanbul District. (In Turkish)
Pehlivanolu T (1986).
Recreational potential of the Belgrad Forest and planning principles. PhD-thesis.University of Istanbul, Istanbul. (In Turkish)


133
Cost-benefit analysis of urban forests from aresearch point of view
Ellen Moons
Centre for Economic Studies, Faculty of Economics and Applied Economics, Catholic UniversityLeuven, Naamsestraat 69, B-3000 Leuven, Belgium
Abstract
In this paper we show how cost-benefit analysis can be used as a decision supportmechanism for the location of new (urban) forest land, starting from themultifunctional role of these new forests. We start with a simple presentation of thecost-benefit analysis (CBA) technique. Key features of this evaluation technique arethat (i) all - both positive and negative - impacts for all relevant parties (i.e. not only theproject promoter) are taken into account and (ii) evaluation occurs on the basis ofmonetary values. Next, we give an overview of all relevant costs and benefits ofafforestation projects for the society as a whole. On the cost side, we distinguish costsdirectly related to the afforestation project itself, such as tree planting and forestmanagement on the one hand, and opportunity costs on the other hand. On thebenefit side we make a distinction between use and non-use values. Use values includetimber production, hunting, recreation and ecosystem values. Non-use and optionvalues capture forest benefits that are independent from the actual use of the forestarea. As valuation of recreation and non-use/option values is not straightforward, wediscuss their valuation methods in more detail. For valuing recreation the travel costmethod (TCM) is the most widely used technique. TCM shows how the visit frequencyresponds to changes in the price of a visit. Non-use values can only be valued usingthe contingent valuation method (CVM). CVM uses survey questions to elicit people’spreferences for public goods by finding out what they would be willing to pay forspecified changes in them. Finally, we apply the CBA to a real life policy problem. TheFlemish government has agreed on a 10,000 ha forest expansion in Flanders, focusingon the multifunction role of forests. In our case study we give an example for theGhent region (East Flanders). We investigate the net benefits per hectare ofcombinations of potential forests that meet the surface restriction of 540 ha. Theimportance is shown of including recreation benefits in the evaluation of afforestationprojects and more specifically the role of alternative forests (substitutes) in thevaluation of one specific forest. It is concluded that this substitution effect issignificant in the decision on the location of new forests and leads to a wide variationin the net benefits per hectare of different combinations.

134
Key words: environmental economics, cost-benefit analysis, valuation, land usechange, forestry.
Introduction
The Flemish government has set aside a budget for the expansion of existing forestsand the creation of new forests. The Land-use Structure Plan of Flanders (RuimtelijkStructuurplan Vlaanderen) allocates 10,000 hectares for ecological forest expansion.According to the Long Term Regional Forest Plan (1993), multi-functionality offorestry is the most important criterion for forest expansion. The latter has to beaimed for in areas where five functions - the economic, educational, shelter, ecologicaland social functions - can be fulfilled within one forest. The decision on the locationof these 10,000 hectares should therefore take into account all functions of theseforests. How this can be done is not straightforward. Cost-benefit analysis is atechnique that was developed to evaluate investments taking into account all positiveand negative impacts of the investment on all parties involved. In this paper we firstdiscuss the basic idea of cost-benefit analysis. Next, we explain how this technique canbe used to evaluate land use changes such as afforestation on former agricultural land.We give an overview of the different costs and benefits of afforestation projects anddiscuss their measurement and valuation. To conclude an example is given of the useof cost-benefit analysis in deciding on the location of multiple new urban forests.
Cost-benefit analysis: an introduction
Cost-benefit analysis (CBA) is a technique developed to evaluate investments from asocial-economic point of view. It helps decision-makers:
1. To decide on the optimal level of the investment (e.g. the optimal forest expansionarea);
2. to find the optimal mix of investments maximising efficiency (e.g. the optimal mixof urban and regional forests); and
3. to choose among several alternative investments (e.g. the optimal location of newforests) (Loomis & Walsh 1997).
A key factor of CBA is that the evaluation is made on the basis of monetary values.
The basic idea is very simple. If we have to decide whether to make investment A ornot, the rule is: do A only if the benefits exceed those of the next best alternative. The‘benefits of the next best alternative’ are referred to as the ‘costs’ of A. The basic rulecan now be formulated as follows: do A if the benefits exceed the costs, and nototherwise (Layard & Glaister 1994).

135
The first questions that come to mind are how to measure and value these costs andbenefits and which costs and benefits should be taken into account. Assuming thatonly people matter, two (more theoretical) steps can be distinguished: first, find outhow the investment affects the individual’s welfare. This impact is measured by theindividual’s own valuation. Next, deduce the change in social welfare from thesechanges in individual welfare. All positive and negative impacts in each year of theproject should be taken into account. We will discuss this in more detail in section 3.
Secondly, what is the relevant society for which the change in welfare should beanalysed? Either one takes on an international point of view or one limits the analysisto the population of the country undertaking the investment. In either case, costs andbenefits to all members of society are included and not only the monetaryexpenditures and receipts of the project promoter.
A third question concerns distribution effects. The underlying assumption in mostCBA studies is that income is optimally distributed or that – in case of non-optimaldistribution – there is some form of redistribution. Consequently, each person’s 1 eurohas the same weight. However, in real situations this might not always be true. Thisimplies that one needs to value a poor person’s 1 euro higher than that of a rich person(Layard & Glaister 1994).
A final issue is the choice of the discount rate. An aggregate present value of theproject is obtained by discounting costs and benefits in future years to make themcommensurate with present costs and benefits. A high or low discount rate has a largeimpact on the final result (the net present value) when costs and benefits occur atdifferent points in time.
The advantage of CBA compared to other evaluation techniques is the transparent andobjective comparison between projects, since all impacts are expressed in monetaryvalues that can be added up/distracted.
Costs and benefits of afforestation projects
The most obvious benefits of a forest relate to timber production. In some forests,hunting permits are issued. On the cost side, plantation and management are the firstcosts that come to mind. All these costs and benefits are financial expenditures orrevenues for the forest owners.
A social CBA however takes into account costs and benefits for the whole society. Thisimplies that impacts related to the afforestation project that do not directly accrue to

136
the project promoters should be taken into account. A full overview of all costs andbenefits related to afforestation projects on agricultural land is given in Table 1.
Table 1. Costs and benefits of afforestation projects on agricultural land.
Costs
Two main categories of costs can be distinguished. On the one hand there are costsdirectly related to the afforestation project itself. These include costs of tree plantingand forest management. The latter includes site preparation, pruning, thinning, felling,etc. On the other hand one should take into account the net benefits of the land thatare lost when the project is executed, i.e. the opportunity cost of the project. In theory,these should be the benefits of the next best alternative land use, in practice, it isobvious one should take the benefits of the current use of the land, i.e. agriculture. Inthe Flemish case, the opportunity cost includes both the agricultural production lostand the manure deposition lost. Calculating the loss of agricultural production is acomplex matter due to the high level of subsidisation of the agricultural sector onboth European and national level. These subsidies are merely transfers betweendifferent groups in society and should therefore be subtracted from the observedmarket prices for agricultural goods. One way of dealing with this problem is to useworld prices to value agricultural production. In the Flemish case, this leads to a netloss instead of profit for most agricultural crops.
During the past decades, norms for using manure have become more and morerestricted in Flanders due to environmental concerns. For each parcel we now have amaximum amount of manure that can be used. As farmers have a choice betweenmanure deposition on agricultural land (which is free but restricted by law) or manureprocessing (which is costly), afforestation of agricultural land implies an increase in thecost of manure processing.
Measuring and valuing the costs of afforestation is rather straightforward. Inputs forafforestation, inputs and outputs of agricultural production and manure processing aretraded on markets. Consequently, market prices for all these goods are available andreflect the willingness of persons to pay for these goods. However, as mentioned
COSTS BENEFITS
Tree planting and forest managementOpportunity cost of afforestation:
Loss of agricultural productionLoss of manure deposition possibilities
Use values:Direct use values: timber, hunting, recreationIndirect use values: ecosystem values (e.g. carbon fixation, biodiversity, …)
Non-use values:Existence valuesBequest values

137
before, one needs to pay attention to government interventions such as subsidies andtaxes. In a CBA social values rather than pure market prices matter
Benefits
On the benefit side we make a (theoretical) distinction between use and non-use values.As the name suggests the use benefits are the values arising from the actual use of aforest. The use values are divided into direct use values, such as timber production,hunting or sightseeing, and indirect use values, which refer to the benefits derived fromthe forest’s functional support (shortly named in economics as externalities) to for theexample CO
2 absorption.
On the other hand, there are non-use values that capture the forest benefits that areindependent from the actual use of such forest area. The non-use values are composedof a bequest value, i.e. the benefit accruing to any individual from the knowledge thatothers might benefit from the forest in the future, and an existence value, i.e. thebenefit accruing to any individual from the knowledge of that forest area.
Valuation of the benefits is more difficult. What is the willingness to pay of personsfor these benefits? Only for direct use values such as timber and hunting, markets fortrading these goods exist. All other values, especially non-use benefits, are moreintangible. The value assessment of such functions requires special concepts and tools.Valuation of recreational benefits will be discussed next, followed by valuation ofoption and non-use values.
Valuation of forest recreation: the travel cost methodHotelling first mentioned the travel cost method (TCM) in 1947 but it was formallyfirst used in literature several years later by Wood & Trice (1958) and Clawson &Knetsch (1966). The method is based on observed market behaviour of a cross sectionof users and is therefore the preferred method for outdoor recreation modelling formost economists (Loomis & Walsh 1997). It is considered to be an empiricalapplication of the household production approach pioneered by Becker (1965).
a) The basic method:The TCM shows how the visit frequency of users responds to changes in the price ofa visit. The costs of travelling to the site, both direct monetary and time costs, and on-site costs, such as entry fees, are used as a proxy for price (Hanley & Spash 1993). Thebasic premise of the approach is that the number of visits to the site decreases withincreases in the travel costs, to a major extent determined by distance travelled.We can formally represent travel costs (TC) to a given site ‘j’ as follows:
( ), , 1... ; 1...ij ij ij iTC TC DC TTC F i n j m= = =

138
where DC are distance costs for each individual ‘i’, dependent on the distance travelledand the cost per kilometre1. TTC are time costs. These depend on how long it takesindividual ‘i’ to get to the site and on the valuation of that individual’s time. F standsfor on-site costs including an entrance fee that is charged for some sites2. These travelcosts are one of the independent variables that are used to explain the dependentvariable, some form of quantity of recreation. Usually, one takes the number of visitstaken by a person over a year or visits per capita from a specific zone to a recreationsite (Loomis & Walsh 1997)3.
Other variables that influence visit frequency are socio-economic characteristics suchas income, education and age level, family composition, gender, as well as variablesgiving information on the type of trip. The latter include mainly forest characteristicsin the case of forest recreation. The last factor that influences visit frequency is theprice and availability of substitutes. Substitutes are, in the case of forest recreation,other forests an individual could visit. The more substitutes a visitor has, or the morenearby substitutes are, the lower the number of visits to the studied site.
b) Recreation-demand functionWe now have all the ingredients to specify a recreation demand function4 that explainsthe quantity of recreation in terms of the price and other explanatory variables. Thiscan formally be stated as follows:
where V are visits of individual ‘i’ to site ‘j’, TC are travel costs, SC are socio-economiccharacteristics, FC are forest characteristics and S is the price of visiting other sites.This demand function, sometimes also referred to as ‘trip generating function’ (Hanley& Spash, 1993) is estimated using multiple regression techniques. Using the statisticalcoefficients from the regression, a demand curve or willingness to pay curve
( , , , ) 1... , 1...ij ij ij i iV V TC SC FC S i n j m= = =
1 The cost per kilometre consists of variable costs such as fuel costs as well as fixed costs such asinsurance, taxes, acquisition costs etc.
2 Entrance fees are unusual for forests with public access.3 Depending on how the dependent variable is defined, the TCM is described as individual or
zonal TCM.4 From this point forward we will limit the discussion to the individual TCM.

139
representing the relationship between the number of visits and the cost (price) of atrip can be traced out with increments in costs starting from the current cost of eachindividual.
The key assumption behind the demand curve is that as travel costs increase thenumber of visits falls. There exists a cost TC* at which no more visits will be made.This is called the ‘choke price’. On the other hand, when costs are zero, the number ofvisits will be highest (V
T). At any price higher than zero, the number of visits will drop,
i.e. at a positive price TC1 visits will drop to V
1.
c) Consumer surplusThe area under the demand curve measures the visitor’s net willingness to pay orconsumer surplus attributed to the site (Loomis & Walsh 1997). It is the surplusbenefit (grey triangle) over and above the cost (dotted rectangle). From Figure 1 weknow that at a cost TC
1 an individual would make V
1 visits. However, the individual is
willing to pay almost TC* for the first visit and any amount between TC* and TC1 for
the following trips (up to V1). From that point onwards, the cost of a visit is higher
than what the individual is willing to pay for the trip.
d) Problems with the travel cost method- Multipurpose trips vs. single destination tripsIf an individual leaves home and drives directly to the recreation site and returns home
V1 VT Visits, V
Costs, TC
TC*
TC1
Figure 1. Demand curve and consumer surplus.

140
directly afterwards, costs of making the trip can be exclusively attributed to the sitevisit. This type of visitors is often referred to as ‘purposeful visitors’ (Hanley & Spash1993). Those visitors for whom a visit to the site is only part of the purpose of theirtrip are called ‘meanderers’. In the latter case, taking into account the full cost of thetrip will lead to an overestimation of benefits attributable to the recreation area(Loomis & Walsh 1997). There is not a theoretically correct way to allocate the tripcosts among multiple destinations. Either these observations are dropped from theanalysis or the visitors are asked to subjectively attribute a proportion of trip costs tovisiting each destination.
- Distance costsIncreases in distance are converted to the monetary amounts visitors would pay if theywere required to travel the additional distance. There are basically two options tocalculate a price per kilometre: (1) use fuel costs only as an estimate of marginal cost or(2) use full costs including an allowance for depreciation, insurance, etc. as an estimateof average cost. Consumer surplus measures will depend on the choice.
- Travel time costsTravel time costs are calculated by multiplying the duration of the trip (depending ondistance and transport mode) by the value of travel time. The value of travel time isthe opportunity cost of that time. The time spent on the trip5, which is assumed tocreate no benefits, cannot be spent in another way like benefit creating activities suchas working or alternative recreational activities. Saving time in travelling to the siteclearly has a positive value, or, time spent travelling in itself has a negative value. If theindividual is giving up working time in order to visit a site, the wage rate is the correctopportunity cost of time travelled. However, most individuals are restricted by fixedworking hours and will therefore make the trip in their leisure time. The travel time toa site would alternatively be spent on other leisure activities. No labour income isforegone and the correct opportunity cost here is the value, at the margin, of the otherrecreation activities foregone.
- Statistical problemsSeveral statistical problems can occur when estimating a (recreation) demand function.First, there are problems related to the independent variables in the regressionequation. All relevant variables affecting visitor behaviour need to be included.Omission of variables will bias the coefficient estimates and therefore bias the
5 Here we assume time spent on site has no value, although we are aware of the debate in the lite-rature regarding this aspect of TCM applications.

141
consumer surplus estimates. However, it is not necessary to include variables that donot vary among individuals or according to distance travelled, as these variables willnot change the slope or the area under the demand curve. Second, the dependentvariable is subject to both truncation and endogenous stratification (Hellerstein 1992).Truncation occurs when observations are only available greater than (or less than)some lower (or upper) bound. This is the case for most TCM studies whenobservations originate from on-site surveys and all respondents make at least one visitto the site. The dependent variable (visits) is said to be truncated at one. Endogenousstratification occurs when the probability of being sampled is a function of the valueof the dependent variable. When interviewing visitors at specific checkpoints on site,people with higher visit frequencies have a higher chance of being interviewed.Truncation and endogenous stratification require the functional form of the recreationdemand function to be chosen with care. A good choice seems to be using count datamodels that are based on probability distributions that are defined for nonnegativeintegers only (Hellerstein 1992).
Valuation of non-use values: the contingent valuation methodA procedure to convert changes (qualitative or quantitative) in environmental goodsinto monetary terms (Willingness To Pay or WTP) is the contingent valuation method(CVM). CVM uses survey questions to elicit people’s preferences for public goods byfinding out what they would be willing to pay for specified changes in them (Mitchell &Carson 1989). Constructing a hypothetical yet detailed and realistic market in whichconsumers have the opportunity to buy the good circumvents the problem of missingmarkets for many environmental goods. Because valuation is contingent upon theparticular hypothetical market, this approach is called the contingent valuation method(Brookshire & Eubanks 1978, Brookshire & Randall 1978, Schulze & d’Arge 1978).The first empirical study can be traced back to 1958 and more studies were done sincethe 1970s. However, the method only became widely known and used since the ExxonValdez oil tanker ran aground in Prince William Sound, Alaska (1989). Two groups ofeminent economists were asked to undertake an extensive and thorough CVassessment of the non-use damages caused by this disaster (Bateman & Willis 1999).One study was commissioned by the State of Alaska6, and the other by the ExxonCompany because the latter questioned the validity of the CV technique (Hausman1993). As a consequence of the disagreement on the validity of the method, theNational Oceanic and Atmospheric Administration (NOAA) commissioned aninvestigation of the CVM. This resulted in a set of explicit guidelines that should befollowed in order to perform a valid CVM study (Arrow et al. 1993).
6 The results of this study can be found in Carson et al. (1992).

142
a) Survey structureThe CVM is solely dependent on survey data. The design of the survey is therefore akey element in determining the quality of the study. The survey has to be tested insmall discussion groups and in a small sample of respondents. This helps to determinewhether respondents are likely to correctly interpret the questions, whether responsecategories are unambiguous and whether visual aids are clear and sufficient (Loomis &Walsh 1997). Respondents are best interviewed in person due to the complex nature ofa CVM questionnaire. The survey itself consists of three parts (Mitchell & Carson1989):
- The first part gives a precise description of the good that has to be valued and thehypothetical circumstances under which the public good is made available to therespondent. It also describes the baseline level of provision, the range of availablesubstitutes and the method of payment.
- The second part consists of questions intended to elicit the respondents’ WTP forthe defined change of availability of the environmental good. An alternative wouldbe asking the respondents’ WTP for a qualitative or quantitative change of thegood. It is often desirable to ask respondents to specify the reasons for theirreported choices, especially when respondents report they are not willing to payanything. Adding questions about the reason of their zero answer can identifywhether their true valuation is zero or whether they protest against the hypotheticalmarket or method of payment.
- The third part of the survey asks for the characteristics of the respondents (e.g.income, age), their preferences relevant to the good being valued and their use ofthe good. This information is used to explain the WTP of the respondents and todetermine the validity and reliability of the CVM as a measuring instrument ofWTP for environmental goods.
The answers to the valuation questions provide information on the WTP ofrespondents. These amounts can then be used to develop an estimate of the benefit ofthe good.
b) WTP vs. WTAAsking maximum WTP for an increase in quality of quantity of a good is the preferredapproach for determining economic benefits (Loomis & Walsh 1997). The alternativeis to ask for an individual’s minimum willingness to accept (WTA) compensation for adecrease in the quality or quantity of a resource. Since WTA is not directly constrainedby income, chances are WTA is greater than WTP, which is constrained by income(Loomis & Walsh 1997, Bishop & Heberlein 1979) and therefore leads to anoverestimation of benefits.

143
c) Method of paymentHow people are asked to pay for a change in the provision of a good determines to agreat extent the degree of honesty of their answers. Possibilities include taxes onincome or property, voluntary or compulsory donations or contributions, entrance feesfor visiting a nature area, hunting permits, etc. The NOAA-panel recommends the useof taxes because of their compulsory character.
d) Question formatThere are several possibilities to ask for the WTP of a person. Techniques differ in thedegree of accuracy, degree of non-response or ‘don’t know’ answers, difficulty ofstatistical processing, etc. The most straightforward way of asking is to ask directlywhat amount a person maximally would be willing to pay for the proposed change.This is called the open-ended question format. This is the simplest way to formulate thequestion and answers can be analysed without further data manipulation. The problemis that it is not straightforward for respondents to answer this question. They aresimply not familiar with placing a value on a good that is not traded in a normalmarket. On the one hand, this leads to a high degree of non-response and protestanswers, on the other hand, it creates incentives for strategic behaviour (i.e. stating ahigher or lower WTP than the actual WTP) (Desvousges et al. 1983).
The disadvantages of this elicitation format have lead to the development of newtechniques taking into account the difficulty for respondents to answer and thepossibilities for strategic behaviour without losing valuable information. The bidding
game (Davis 1964) is based on real-life situations in which individuals are asked to statea price for a specific good (cf. auctions). Respondents answer ‘yes’ or ‘no’ to aniteration of monetary amounts and this process goes on until the respondent changeshis answer. The last (or first) price a respondent accepts is his maximum WTP. Theadvantage is that this elicitation format directly gives the highest WTP (Cummings etal. 1986). Moreover, due to the iterative character of the approach a respondent hasmore time to carefully consider his valuation (Hoehn & Randall 1983). A disadvantageis the possibility of starting point bias implying that the starting bid influences to agreat extent the value for the good (Roberts et al. 1985)
Another question format frequently used is the payment card (Mitchell & Carson 1981,1984). Respondents are shown a card with alternative values and are asked to selecttheir maximum WTP from these values. Sometimes the card provides an indication ofwhat the respondent is already spending on other public goods or services, althoughthe answer can be influenced by these ‘benchmarks’. Advantages are that (1) theanswer does not depend on the starting bid and (2) respondents only have to answerone question.

144
The final important question format is the dichotomous choice question format (Bishop &Heberlein 1979, 1980). There are two versions currently in use. The first is the single
bounded dichotomous choice. The respondent is presented one of a list of previouslydetermined values and is asked whether or not he would be willing to pay this amountfor the proposed change. The major advantage of this approach is its simplicity for therespondent. Moreover, it has been shown (Hoehn & Randall 1987) that this approachminimises strategic behaviour. The primary drawback is inefficiency. A very largeamount of observations is needed for a correct estimate of the WTP. Also, one has tomake assumptions about the parametric specification of the valuation function toobtain mean WTP. Finally, the design of the bid amounts requires the greatest care.A variation of the single bounded is the double bounded dichotomous choice (Carson et al.1986). The respondent is presented with a follow up question with a bid that isdependent on his answer on the first dichotomous choice question. There is a list ofseveral bid values and follow up values. This elicitation method increases the efficiencyof the single bounded dichotomous choice and is the preferred format for the NOAA-panel. Studies have shown that the estimated WTP based on this format is lower thanbased on the single bounded dichotomous choice (Carson et al. 1999).
e) Possible biases of the WTP estimateDue to the hypothetical nature of the CVM, the method of payment used and otherfactors, the estimated WTP can be biased. These biases should and can be avoided asmuch as possible by performing statistical tests during survey design (e.g. after testing).A first possible bias is strategic behaviour of the respondent. This means therespondent ‘lies’ about his true WTP for the public good because he assumes that,although he states a low WTP, others will not answer strategically and the public goodwill be provided anyway. Once a forest is created, it is impossible to exclude thoserespondents that state a lower than their actual WTP. Strategic behaviour can beminimised by stressing the fact that everyone will have to pay, by not givinginformation on other respondents’ WTP and by making the provision of the gooddependent on the WTP of the respondents (Mitchell & Carson 1989). Other problemsare design and information biases. These problems are related to the design of thesurvey, the way information is presented and the amount and the kind of informationthat is given previously to the WTP question. Design bias also includes starting pointbias (Hanley & Spash 1993). Another problem arises from the hypothetical nature ofthe CVM questionnaire. This implies that incorrect WTP assessments by therespondent will not be punished. The respondent will never actually have to pay hisstated WTP.

145
Overview of benefits and their valuation
Table 2 summarises the different use and non-use value categories and their valuationmethods. The travel cost and contingent valuation method were discussed in detail inthis paper, other valuation techniques are not extensively used in this paper and aretherefore only briefly mentioned in the table.
Table 2. Benefits and their valuation.
Case study: location of new (urban) forest
Introduction
A methodology was developed to select a combination of potential forest areas(currently agricultural land) in the Ghent region (province of East Flanders, Belgium)that maximises net social benefits taking into account restrictions on the total surfaceof new forest land. We assumed that all newly created forests consist of oak and ashtrees and the time period is 200 years (one rotation of oak and two rotations of ash).Our main point of attention was the role of substitutes, both existing and other newforests, in determining the recreation value of the potential forest areas. To fulfil thesurface restriction, one potential forest area can be included in several combinations ofpotential forest areas. Therefore, the possible substitutes for its visitors will differdepending on the combination and as a consequence the recreation value of the sameforest in different combinations will be different.
In order to limit the number of potential forest areas, we started from the study“Gewenste Bosstructuur voor Vlaanderen” (desired forest structure for Flanders),executed by bureau ‘Mens en Ruimte’. Next, we excluded zones on the spatial planningmap coloured as valuable ecotopes, legally protected areas (Habitats Directive 92/43/EEC and Birds Directive 79/409/EEC), built-on areas, existing forests, infrastructure,industry and residential areas. Furthermore, ecological arguments like the proximity ofexisting forests and (non-) suitability for agricultural production reduced the totalpotential forest area even more. This lead to 14,565 ha potential forest area in thewhole province of East Flanders which was divided in 113 sites with a minimal surfaceof 20 ha each. The province was further subdivided into four parts, one of which isthe Ghent region in which 32 of the 113 potential forest areas are located (see Figure2). As it is an objective of the Flemish Community to allocate at least 2,500 ha of newforestland in East Flanders, proportionally 540 ha (539 – 541 ha) are to be allocated to
BENEFIT CATEGORIES POSSIBLE VALUATION METHODS
Direct use values: recreation Travel cost method, Contingent valuation methodDirect use values: hunting, timber Market approachIndirect use values: ecosystem Production cost method, Dose-response method; Damage methodNon-use values Contingent valuation method

146
the Ghent region. This gave us more than 51,000 possible combinations of four toeight forest areas out of a total of 32 potential forest areas for which the net socialbenefits per hectare were calculated for both the combination as a whole and for eachforest in the combination.
Costs and benefits of afforestation on agricultural land
All costs and benefits listed in Table 1 were included in the analysis. Most of the costsand benefits are fixed amounts per hectare of forestland and are independent both ofthe location of the potential forest area itself and the location of its substitutes. Thisapplies to planting and management costs, timber, hunting, carbon fixation and non-use values. Opportunity costs on the other hand differ according to the characteristicsof the soil. This applies to the loss of agricultural production as well as the loss ofmanure deposition. Consequently, opportunity costs per hectare can differ betweenforests but are the same regardless of the combination of potential forest areas thatparticular forest belongs to. Recreation is the only benefit category that is assumed tobe both dependent on the location of the forest and the location of its substitutes,which could be either existing or other new forests. The same forest will therefore havea different recreation value depending on the combination that is studied. An overviewof values for the cost and benefit categories is given in Table 3.
Figure 2. Geographical location of forest expansion projects and population density.
N
0 7 Kilometers
Population density (number/ha)0 - 33 - 77 - 1010 - 1515 - 2020 - 2525 - 3535 - 5050 - 60
Forest extensions

147
Table 3. Costs and benefits (ha-1year-1) of afforestation.
The figures show that forest planting and management costs are very modestcompared to opportunity costs. On the benefit side we see that non-tangible benefitslike non-use and recreation values are far more important than the benefits that aredirectly perceptible and create direct income for the forest owner (sale of timber andof hunting permits). As was explained before, recreation values per hectare varybetween forests and more importantly they depend on the combination of all potentialforest areas a forest area belongs to. A combination of forests that are geographicallylocated close to the same major population centres will each attract fewer visitors thanthey would when they were located further apart and closer to different populationcentres. This is the so-called substitution effect.
Results and discussion
We have analysed the maximisation problem in two different ways. First, we only tookinto account the tangible cost and benefit categories (limited analysis). This implies wedid not take into account carbon fixation, recreation and non-use values. Consequently,for each of the 32 potential forest areas we got one net benefit estimate independentof the combination they belong to. Summing net benefits over the different forestareas in the combination gave the net benefit of the combination or of a fixed surfaceof forest expansion in the Ghent region. The difference in net social benefits betweencombinations could be fully ascribed to differences in opportunity costs of thepotential afforestation areas, as these were the only cost or benefit categories that hadno fixed value per hectare. Opportunity costs per hectare differ between forests, butwere not dependent on the combination the forest areas belong to. Next, we includedcarbon fixation, recreation and non-use values as well (full analysis). The differencebetween the two analyses was that in the latter, combinations do matter. A forest has adifferent recreation value in combination ‘A’ and combination ‘B’. The results arepresented in Table 4 and Figure 3. Table 4 gives the numbers of the forests areas thatwere in the ‘best’ and ‘worst’ combination. Figure 3 shows the geographical location ofall numbered potential forest areas. Looking at the best combination according to thefull analysis showed that the potential forest areas are geographically spread throughoutthe region, but are all located in the Southeast to Southwest of the city of Ghentwhere we find the highest population density, i.e. highest number of potential visitors.Just looking at the map of Figure 3, the forest areas in the best combination of the
COSTS BENEFITS
Planting and management € 38.60 Timber € 28.50Loss of agricultural production € -714 - -362 Hunting € 15
Carbon fixation € 25Non-use € 3680
Loss of manure deposition € 457-590
Recreation Av. €1440

148
limited analysis are a bit more concentrated either on the Southwest or Southeast sideof Ghent. The forest areas in the worst combination of the full analysis are clearlylocated close to each other at the Southwest of Ghent. This implies they are closesubstitutes in recreation and therefore have low recreation values each, which explainstheir bad ranking. However, at first sight differences between locations for limited andfull analysis seem to be small.
Although results were not clear at first sight, according to the Wilcoxon Signed Rankstest for differences, adding recreation, non-use and carbon fixation values do make asignificant difference. Net benefits per hectare for both best and worst combinationsare significantly higher for the full analysis. This could also be expected based on thevalues given in Table 3. Ranking all possible combinations from highest to lowest netbenefits (full analysis) shows that the highest net benefit (best combination) is morethan 100 times higher than the lowest net benefit (worst combination) per hectare.This is clearly shown on Figure 4, which shows net social benefits per hectare ranked
25
15
4
1
Region GentForestexpansion proje c ts
0 5 10 Kilometers
N
30
12
14
21
24
1
2
3
56
7
8
9
10
11
13
1617
18
19
20 2223
2627
28
29
31
32
Figure 3. Numbered forest expansion projects in the Ghent region (Source: Moons et al., 2001).

149
from high to low for every tenth combination (out of the 51,000 possiblecombinations).
Concentrating on the results of the full analysis shows the importance of thesubstitution effect in estimating the recreational value of a potential forest area. Inother words, geographical location of a forest in itself and in relation to other forestsmatters. The greater the choice of forests a person can visit, the fewer the number ofvisits to one particular forest, the lower the recreational value of the forest and the
LIMITED ANALYSIS FULL ANALYSISBest combination Worst combination Best combination Worst combination
1 6 1 45 15 6 813 16 14 924 18 16 2926 1827 2430 2532 26
Table 4. Best and worst combinations for the limited and full analysis of the Ghent region.
0
5000000
10000000
15000000
20000000
25000000
30000000
35000000
0 1000 2000 3000 4000 5000 6000
Number of combination (best - worst)
Net
so
cia
l b
en
efi
t (€
pe
r h
ec
tare
)
Figure 4. Ranking of highest to lowest net social benefit per hectare for conbinations of forestexpansion proejtcs.

150
lower the net benefit per hectare. This finding is of great importance for theafforestation policy of the Flemish Community. Afforestation of a certain surface ofagricultural land at different locations leads to high variations in the net social benefitsper hectare of afforestation. In other words, the same euro spent on afforestation cancreate different net benefits.
Conclusions
In this paper we have shown how cost-benefit analysis can be used as a decisionsupport mechanism for the location of new (urban) forest land, starting from themultifunctional role of these new forests. Cost-benefit analysis is a techniquedeveloped to evaluate investments from a social-economic point of view. Key factorsof the CBA method are that (i) all impacts for the whole relevant population are takeninto account and that (ii) all evaluation occurs on the basis of monetary values. Wehave given an overview of the costs and benefits of afforestation projects on formeragricultural land. Apart from the straightforward costs of tree planting and forestmanagement and the direct revenues from the sale of timber and hunting permits, wehave shown the importance of recreation, non-use and option values. We havediscussed in detail the most widely used valuation techniques for these non-tangiblebenefits of forests. Recreation is valued using the travel cost method through therelationship between visit frequency and the price of a visit. Non-use benefits arevalued by the contingent valuation method that uses survey questions to elicit people’spreferences and willingness to pay for specific changes in public goods. We havedemonstrated how these methods can be used in land use change decisions in a casestudy for the location of a specific surface of new urban forest land in the Ghentregion in the province of East Flanders, Belgium. As the total surface of 540 hacannot be realised by one forest on one single location, we investigated the net benefitsper hectare of combinations of four to eight forests to meet the surface restriction. Wehave shown the importance of including recreation benefits in the evaluation ofafforestation projects. Within the valuation of recreation benefits, we focused on therole of alternative forests in the (recreational) valuation of one specific forest and wehave found that this substitution effect is significant in the decision on the location ofnew forests. Ranking all possible combinations from highest to lowest net socialbenefit shows that the net benefit of the best combination is more than 100 timeshigher than the net benefit of the worst combination, or, the same euro spent onafforestation combinations on different locations can create a wide variation in netsocial benefits.

151
References
AMINAL (1993).
Lange Termijnplanning Bosbouw Deel 1. AMINAL, Brussels.
AMINAL (1993).
Lange Termijnplanning Bosbouw Deel 2: Bijlage: Ondersteunend onderzoek.AMINAL, Brussels.
Arrow KJ, Solow R, Portney PR, Leamer EE, Radner R & Shuman EH (1993).
Report of the NOAA panel on contingent valuation, Federal Register 58: 4602-4614.
Bateman IJ & Willis KG (1999).
Valuing environmental preferences. Theory and practice of the contingent valuationmethod in the US, EU and developing countries. Oxford University Press, Oxford.
Becker GS (1965).
A theory of the allocation of time. The Economic Journal 75: 493-457.
Bishop RC & Heberlein TA (1979).
Measuring values of extra-market goods: are indirect measure biased? AmericanJournal of Agricultural Economics 61(5): 926-930.
Bishop RC & Heberlein TA (1980).
Simulated markets, hypothetical markets, and travel cost analysis: alternativemethods of estimating outdoor recreation demand. Staff Paper Series no. 187,Department of Agricultural Economics, University of Wisconsin.
Brookshire DS & Eubanks LS (1978).
Contingent valuation and revealing actual demand for public environmentalcommodities. Manuscript. University of Wyoming.
Brookshire DS and Randall A (1978).
Public policy alternatives, public goods, and contingent valuation mechanisms.Paper presented at the Western Economic Association Meeting, Honolulu, Hawaii.
Carson RT, Groves T & Machina MJ (1999).
Incentive and informational properties of preference questions. Plenary Address,EAERE Conference, Oslo, Norway.
Carson RT, Hanemann WM & Mitchell RC (1986).
Determining the demand for public goods by simulating referendums at differenttax prices. Manuscript, University of California, San Diego.
152
Carson RT, Mitchell RC, Hanemann WM, Kopp RJ, Presser S & Rudd PA (1992).
A contingent valuation study of lost passive use values resulting from the ExxonValdez oil spill. Report to the Attorney General of the State of Alaska, NaturalResource Damage Assessment Inc., San Diego.
Clawson M & Knetsch J (1966).
Economics of outdoor recreation. Johns Hopkins University Press, Baltimore.
Cummings RG, Schulze WD, Gerking SD & Brookshire DS (1986).
Measuring the elasticity of substitution of wages for municipal infrastructure: acomparison of the survey and wage hedonic approaches. Journal of EnvironmentalEconomics and Management 13(3): 269-276.
Davis RK (1964).
The value of big game hunting in a private forest. In: Transactions of the 29th
North American Wildlife and Natural Resources Conference. Wildlife ManagementInstitute, Washington DC.
Desvousges WH, Smith VK & McGivney MP (1983).
A comparison of alternative approaches for estimated recreation and relatedbenefits of water quality improvements. EPA-230-05-83-001. Office of PolicyAnalysis, U.S. Environmental Protection Agency, Washington DC.
Hanley N & Spash CL (1993).
Cost-benefit analysis and the environment. Edward Elgar Publishing Limited,Hants.
Hausman JA (1993).
Contingent valuation: a critical assessment. Elsevier Science Publishers, Amsterdam.
Hellerstein D (1992).
The treatment of nonparticipants in travel cost analysis and other demand models.Water Resources Research 28(8): 1999-2004.
Hoehn JP & Randall A (1983).
Incentives and performance in contingent policy valuation. Paper presented at theAmerican Agricultural Economics Association summer meetings, PurdueUniversity.
Hoehn JP & Randall A (1987).
A satisfactory benefit cost indicator from contingent valuation. Journal ofEnvironmental Economics and Management 14(3): 226-247.

153
Layard R & Glaister S (Eds) (1994).
Cost-benefit analysis. Cambridge University Press, Cambridge.
Loomis JB & Walsh RG (1997).
Recreation economic decisions. Comparing benefits and costs (2nd edition). StateCollege, Venture Publishing.
Mens & Ruimte (1996).
De gewenste bosstructuur voor Vlaanderen. Mens & Ruimte, Brussels.
Mitchell RC & Carson RT (1984).
A contingent valuation estimate of national freshwater benefits: technical report tothe U.S. Environmental Protection Agency. Resources for the Future, Washington.
Mitchell RC & Carson RT (1989).
Using surveys to value public goods: the contingent valuation method. Resourcesfor the Future, Washington.
Moons E, Proost S, Saveyn B & Scheirlinck H (2001).
Kosten-batenanalyse van bosuitbreiding in Oost-Vlaanderen. Final report VLINA-project 0017.
Roberts KJ, Thompson ME & Pawlyk PW (1985).
Contingent valuation of recreational diving at petroleum rigs, Gulf of Mexico.Transactions of the American Fisheries Society, 114(2): 214-219.
Schulze WD & d’Arge RC (1978).
On the valuation of recreational damages. Paper presented to the Association ofEnvironmental and Resource Economists, New York, December 1978.
Wood S & Trice A (1958).
Measurement of recreation benefits. Land Economics 34: 195-207.


155
Chapter 4
Threats to urban forests and trees


157
Analysis of the Wildland–Urban Interface FireProblem of Greece
Alexandros DimitrakopoulosDepartment of Forestry & Natural Environment, Aristotle UniversityP.O. Box 228, Thessaloniki 541 24, Greece
Abstract
During the last 30 years Greece gradually acquired a serious wildland–urban interface
fire problem, mostly intensified around metropolitan areas and tourist locations.
Urbanisation of the population, tourist development and a large need for summer
housing have created increased human pressure for land use change by applying fire
and, subsequent, encroachment on public wildlands. At the same time, human
settlements engulfed by wildlands and forestland fragmentation in a mosaic of
agricultural, forest and rural areas have created increased fire hazard and fire
suppression planning difficulties. The following measures are proposed for alleviating
the problem:
a) Establishment of legislature pertaining to the regional and urban planning of
wildland – urban intermix areas;
b) strict regulations regarding the location of waste disposal sites and other public and
private enterprises of human activities in forestlands;
c) establishment of fire safety regulations for houses and residents in the wildland-
urban interface;
d) assignment of a special category in forest management practices pertaining to ‘peri –
urban forests’ (wildlands that surround urban settlements); all silvicultural and
management practices will set as priority the protection of the urban structures that
they surround; and
e) special fire-safety planning and installations should be designed for cultural
monuments and antiquities that are surrounded by forest vegetation constituting the
natural setting of the monument and part of its scenic beauty.
Key words: peri-urban forest, wildland/urban interface, fire, Mediterranean, Greece.
Introduction
Greece has a severe wildland fire problem, which has significantly augmented during
the last 30 years. Almost 80% of the total number of fires occur in the Mediterranean
zone, which extends from the coastal line to an elevation of approximately 800 metres,
including all the islands. This area combines the typical Mediterranean climate
158
(pronounced hot and dry period during the summer, mild winters with most of the
total rainfall) with flammable vegetation types. The latter are comprised of drought
resistant and fire-adapted evergreen-broadleaved sclerophyllous shrublands (maquis)
and low-elevation coniferous forests of Aleppo pine (Pinus halepensis Mill.) on the
mainland and Calabrian pine (Pinus brutia Ten.) on the islands. Also, due to the fact that
the Mediterranean zone of Greece hosts most of the country’s economic activities
(agriculture, tourism, urban development, industry), over 70% of the total population
is concentrated in these areas. This has resulted in an ever-increasing human pressure
on the natural environment for land use change, which is reflected by the high
frequency of arsons and ‘unknown’-cause fires occurring in the wildlands. The
intermix of human settlements with natural ecosystems created a severe wildland-
urban interface fire problem that has become a major issue of political debate and
confrontation because of public awareness and mass media attention especially during
the summer months, when most fires occur. We will analyse the wildland-urban
interface fire problem of Greece in terms of its current status, causes and possible
mitigation measures.
Causes of the wildland-urban interface fire problem of Greece
Table 1 provides a synopsis of the wildland – urban interface problem of Greece. The
country has undergone significant social changes, since the 1970s. These have created
and aggravated its wildland-urban interface fire problem:
1. Large parts of the population from mountainous areas migrated to the major urban
centres (internal migration). The ‘urbanisation’ of Greece resulted in half its
population now residing in only two cities (Athens and Thessaloniki).
2. There has been a substantial tourist development of Greece and, especially on the
islands, resulting in continuous construction of holiday resorts and hotel
accommodations in the wildlands.
3. There has been a ‘fashion’ in most middle class urban families for building a
country house near the sea for summer vacations.
4. Activities inside the forests have multiplied due to the enhanced accessibility that
resulted from an extended forest road network in combination with the ever-
increasing number of private cars.
5. Numerous municipal waste disposal sites have been arbitrarily established on public
forestlands.
6. There has been extensive intermix of agricultural areas, forestlands and rural
settlements over large areas in the Greek Mediterranean countryside, creating a
‘mosaic’ of different land uses and fire hazards.
All these reasons resulted in tremendous pressure for change of use of the wildlands
for urban, tourist and agricultural development in the Mediterranean areas. Given the

159
fact that Greece still lacks a national cadastre (register) and land use classification
mapping, the public forestlands were the first to be attacked by arsonists. These aimed
at the destruction of the natural vegetation through fire and, subsequently, the
encroachment and conversion of the burned areas into urban settlements or
agricultural areas. In most cases, law enforcement procedures for the eviction of
intruders from the burned wildlands have been time-consuming and ineffective. On
the contrary, in many cases a ‘legalisation’ followed of the encroachment on the
burned public wildlands by the Greek government for ‘social reasons’, thus creating an
additional motive for arson. Consequently, in Greece the most densely inhabited or
touristically developed areas are fire-stricken (Attica peninsula with Athens
metropolitan area, Thessaloniki with the Chalkidiki peninsula, Kavala, Aegean and
Ionian islands, Crete, Magnesia and Evia). They face severe fire rural/urban interface
problems which coincide with a high fire frequency and areas burnt, mostly attributed
to arson or unknown causes.
The wildland-urban fire interface problem of Greece first became apparent when a
large, wind-driven fire on August 4 1981 occurred in the northern suburbs of Athens,
and resulted in the destruction of many luxurious residences. In 1985, numerous
arsons destroyed the peri-urban forests that surrounded Kavala, northern Greece. In
1995, a large fire (6,500 ha) on the Penteli mountain at the outskirts of Athens
metropolitan area, burnt approximately 100 structures causing panic to the population.
Another fire at the same mountain in 1998 was equally destructive and received huge
media attention and public awareness, thus creating a severe political issue. Multiple
arsons burnt most of the aesthetic forest that surrounded Thessaloniki in July 1997.
FIRE INTERFACE DESCRIPTION CAUSES
peri – urban
Expanding urbanization results in the construction of anever increasing number of illegal housing settlementsinside wildlands peripheral to metropolitan centers,without previous urban or regional planning andprovisions for fire safety. This created a major fire controlproblem. Also, increased human activities to peri – urbanforests, due to high population density and accessibility,have resulted in many arson and negligence fires.
Urbanization (internal migration) of a large part of the ruralpopulation since the 70’s caused very high demand for peri -urban land to meet the housing needs. Numerous arsons areset to wildlands surrounding urban centers to destroy naturalvegetation and facilitate subsequent encroachment on theburned public wildlands. Mismanaged municipal wastedisposal sites located inside forests also constitute a majorcause of wildlfires.
wildland -urban
The land value near touristically developing areas hasincreased dramatically, creating pressure for land usechange from wildland to urban through fire. Thus, thenumber of arsons has increased. Many summer housesand hotel accommodations have been constructed inremote areas inside forests, creating accessibility, highdispersion and water availability problems to firesuppression forces.
Substantial touristic development of Greece since the 80’s hasled to uncontrolled and illegal construction of hotelaccommodations in remote Mediterranean areas (especially inthe islands) of natural beauty without any fire safetyinfrastructure. Also, there has been a continuous trend sincethe 70’s for urban middle-class families to acquire a summerhouse close to nature for vacations. Increased outdooractivities in the forests have raised the number of fires.
rural – urban
There has been extensive intermix of agricultural areaswith forest lands and rural settlements over large areas inthe Greek mediterranean countryside, creating a mosaic ofdifferent land uses and fire hazards. This resulted in highfire risk (variety of human activities) and severe firebehavior problems (different kind of fuels and fireprotection planning and priorities).
Agriculture has expanded on forest lands causingfragmentation of the natural landscape and increasing thevarious land use activities. The traditional mediterranean modelof small rural villages is changing and farm houses are nowconstructed near agricultural fields, while wildlands becomemore isolated.
Table 1. Analysis of the wildland - urban interface probllem of Greece.

160
Numerous fires devastated large areas of public pine forests at the Chalkidiki peninsula
in 1981, 1985 and 1990, resulting in the development of numerous summer cottages
and villas in the burned areas without urban planning. Additionally, significant
economic losses result every year from fires that burn at the rural/urban interface and
expand from forest areas to adjacent agricultural lands (mostly olive groves, grapevines,
and wheat fields).
Finally, in most cases, the natural fire regime has been altered in the wildland /urban
interface due to increased fire frequency, thus adversely affecting biodiversity and
ecosystem processes in these areas. Also, expanding urbanisation has resulted in
wildlife habitat fragmentation.
Particularities of fire suppression in the wildland – urban interface
Fire suppression in the intermix context of urban and wildland is complicated and
particular. In some instances, wildlands constitute enclaves within urban
environments, and suppression proceeds within the general context of urban
firefighting. In other cases, houses form small ‘islands’ within a ‘sea’ of public
wildlands, and wildfires must be controlled as ancillary functions to general wildland
fire control. In other words, the mixture of wild, urban, agricultural, public and private
lands prevents either urban or wildland fire strategies (Pyne et al. 1996).
Perhaps the really unresolved issue is not so much the suppression of an isolated
structural fire but the protection of structures within the context of a true fire
intermix (Weise & Martin 1994). Ethical instincts and legal structures impose the
preferential protection of houses (not to mention their residents) even if this means
that the overall fire continues to propagate freely. Perimeter control is problematic;
counter-firing is almost impossible; prescription control unthinkable. No clearly
articulated strategy exists (NWCG 1989). Instead, fire-fighting resources, especially
engines, are massed and dispatched to protect structures. Control of structural fires
differs from control of wildland fires in several respects (Radke 1983). There is first
the question of people, victims who may need medical attention, residents who need
evacuation, onlookers who may require restraint. There is also a matter of fire
behaviour. Compared to wildland fires, fuel loads in structures are heavier, fuel
moisture lower, residence time longer, and fire build-up more rapid (Fischer & Arno
1988). A review of past wildland-urban interface fires showed that most structures
were lost or damaged when they were not separated from the surrounding flammable
vegetation, built on steep (over 50%) slopes, and the fire-fighting forces had poor
access to the structures, limited water supply, and arrived late (Moore 1981).

161
When a fire occurs, it is often unclear to what extent suppression should emphasise the
saving of property or the containment of the spreading fire. It is likely that fire
management will focus on just such issues in the coming decades (Gale & Cortner
1987).
Proposed measures for alleviation of the wildland-urban interfacefire problem
The wildland-urban interface fire problem of Greece can be alleviated with a
combination of institutional and technological measures:
1. Establishment of legislature pertaining to the regional and urban planning of
wildland-urban intermix areas. These regulations should provide for restricted areas
were construction is not allowed due to high fire risk, for maximum housing density
per unit of wildland area, for adequate road network density for easy accessibility of
all structures, for evacuation routes and sites in case of emergency. Also, strict
regulations should apply regarding the location of the waste disposal sites and other
public and private enterprises of human activities (open mines, amusement parks,
pick - nick areas, nature trails, etc).
2. Establishment of fire safety regulations for houses and residents in the wildland-
urban interface. Residents will be obliged to apply all fire safety regulations at their
own expense for their house (clearing vegetation, provide extra sources of water,
use appropriate building materials) with severe penalty for the violators.
3. Jurisdiction by legislature should be granted to the fire-fighting forces regarding the
selection of the appropriate fire strategy for optimal results (i.e., choice of fire
protection priorities, forced evacuation of people from residences, destruction of
fences and gardens, use of private water sources, curfew of vehicle circulation).
4. Assignment of a special category in forest management practices pertaining to
‘forests at the urban interface’. These forests should not be managed on a
traditional ‘sustained yield’ basis or as purely ‘protective forests’, but rather as ‘peri-
urban forests’ (wildlands that surround urban settlements) and, therefore, all
silvicultural and management practices will focus on the protection of the urban
structures that they harbour and border. In other words, the primary management
objective for peri-urban forests is the protection of human lives and structures that
reside in them, and secondary, the aesthetics of the landscape. These objectives
should be clearly described and imposed by specific and regulatory guidelines issued
by the Forest Service.
5. Provisions for extra water supply and intensive urban silviculture practices (pruning,
thinning, fuel removal and isolation, breaking of horizontal continuity, etc) should
be applied to all peri-urban forests. Special underground installations for ample
water supply should be established in the wildland areas prior to urban
development.

162
6. Special fire-safety planning and installations should be designed and established for
cultural monuments and antiquities that are surrounded by natural vegetation of
high aesthetic value, constituting the natural setting of the monument and part of
its scenic beauty (Ancient Olympia, Mount Athos, etc). In such cases, all fire
suppression measures should aim at adequately protecting the monument without
disturbing the natural beauty of the site (Dimitrakopoulos 2000).
Conclusions
During the last 30 years Greece acquired a serious fire problem at the wildland-urban
interface, mostly intensified around metropolitan areas and tourist locations. Internal
migration, tourist sector development and need for summer housing have created
increased human pressure for land use change by applying fire and, subsequent,
encroachment on public wildlands. Legislative and regulatory measures regarding the
function and management of ‘peri–urban forests’ need to be imposed by the State and
Municipal authorities for fire hazard reduction and the protection of human
settlements.
References
Dimitrakopoulos AP (2000).
Wildland fire protection of cultural monuments and National Parks of Greece. In:
Proceedings of the International Conference on ‘Fire Protection of Cultural Heri-
tage’, Thessaloniki, 1-2 June 2000: 195-200. Organised by EU, DG XII.
Fischer WC & Arno SF (eds) (1988).
Protecting people and homes from wildfire in the interior West. USDA, Forest Ser-
vice, Intermountain Research Station, Gen. Tech. Rep. INT – 251. Ogden, Utah.
Gale RD & Cortner HJ (eds) (1987).
People and fire at the wildland/urban interface: a sourcebook. USDA, Forest Ser-
vice, Washington DC.
Moore HE (1981).
Protecting residences from wildfires: a guide for homeowners, lawmakers, and
planners. USDA, Forest Service, Pacific Southwest Forest and Range Experiment
Station, General Technical Report PSW-50.
National Wildfire Coordinating Group (NWCG) (1989).
Wildland/urban interface reference materials.
Pyne SJ, Andrews PL & Laven RD (1996).
Introduction to wildland fire science. 2nd edition. John Wiley & Sons, New York.

163
Radke KW (1983).
Living more safely in the chaparral – urban interface. USDA, Forest Service, Pacific
Southwest Forest and Range Experiment Station, General Technical Report PSW-
67.
Weise DR & Martin RE (eds) (1994).
The Biswell Symposium: Fire issues and solutions in urban interface and wildland
ecosystems. USDA, Forest Service, Pacific Southwest Research Station, General
Technical Report PSW-GTR-158.


165
Pests and Diseases of Urban Forests in Greece
Helen Michalopoulos-SkarmoutsosForest Research Institute,570 06 Vassilika – Thessaloniki, Greece
Abstract
The rapid and in many cases uncontrolled urbanisation observed during the last fifty
years has created many social and environmental problems. It is believed that nowadays
more than half of the world’s population lives in urban areas. This huge shift of
populations all over the world had adversely affected the environment and demand for
land for housing purposes was satisfied to the expense of surrounding forests
(Unasylva 1993). Trees have always played an important role in human settlements
throughout history. In the past, however, urban forestry mainly had an aesthetic role.
Nowadays, with the explosion of the cities’ population, the environmental role of
urban forestry is a main issue both in developed and developing countries
(Kuchelmeister & Braatz 1993).
The value of urban forests to society is well known to everybody and is not going to
be repeated here, as the aim of this paper is a different one.
Urban forestry in Greece has an important role to play from many points of view, such
as aesthetic, environmental, recreational, touristic, wildlife conservation, landscape
design, protection against erosion and so forth.
These urban forests in Greece are mainly found at lower altitudes, where on one the
hand soil and climatic conditions are less favourable for forest development (shallow
and eroded soils, high summer temperatures and low rainfall) while on the other,
pressure for land use change for housing purposes is high. Such a situation poses a
serious threat to these forests from the forest fire point of view, and actually in Greece
most of the fires take place at altitudes from 1 – 700 m (Dimitrakopoulos pers.comm.).
At the same time, these forests are mainly artificial. They resulted from extending
reforestation projects all over the country during the last 50 years. The genus mostly
used for reforestation purposes in Greece is pine, represented by different species,
either indigenous or exotic ones. These include Pinus brutia, P. halepensis, P. nigra, P. pinea,
P. radiata and P. pinaster, while Pseudotsuga menziesii is more rarely used. Consequently
these forests are monocultures and even aged, and thus more prone to damages from
all potential damaging factors, either biotic or abiotic.

166
The present paper concentrates on the biotic factors (fungi, insects and nematodes)
affecting urban forests as well as trees in alleys and parks in Greece.
Key words: urban forests, pests, diseases, Greece
Diseases due to fungi
Table 1 shows those fungi that cause diseases and are most commonly found in urban
and sub-urban forests, alleys and parks. This list is not an exhaustive one and many
more fungi have been isolated during the last 30 years. Most of them, however, are of
minor importance. As seen from the Table, most of the fungi have been reported on
pines. The genus Pinus is the most important of conifers especially in the Northern
Hemisphere. Large areas of this part of the world are covered by natural pine forests
that form a variety of ecosystems and play an important role in the carbon cycle
(Hansen & Lewis 1997).
Table 1. The main fungi causing disease in urban and suburban forests and parks in Greece.
Forest species Fungus Kind of attack
Pinus spp. Coleosporium tussilaginis NeedlesPinus spp. Cyclaneusma minus NeedlesPinus spp. Cytospora pinastri NeedlesPinus spp. Dothistroma pini NeedlesPinus spp. Elytroderma sp. NeedlesPinus spp. Lophodermium spp. NeedlesPinus spp. Scirrhia acicola NeedlesPinus spp. Sclerophoma pithyophila NeedlesPinus spp. Brunchorstia pinea Twigs and branchesPinus spp. Cenangium ferruginosum Twigs and branchesPinus spp. Diplodia pinea Twigs and branches
Conifers & Broadleaves Wood decay fungi Wood decayCupressus sempervirens Seiridium cardinale BranchesPseudotsuga menziesii Rhabdocline pseudotsugae Needles
Platanus sp. Gnomonia platani LeavesPlatanus sp. Microsphaera platani Leaves
Robinia pseudoacacia Aglaospora profusa Twigs and branchesRobinia pseudoacacia Cucurbitaria elongata Twigs and branchesRobinia pseudoacacia Phomopsis oncostoma Twigs and branches
Albizzia julibrissin Fusarium oxysporum f. sp.perniciosum
Wilt disease
Ailanthus glandulosa Verticillium dahliae Wilt diseasePopulus clones Dothichiza populea Bark necrosis

167
At the same time, at least all over Europe pines have been extensively used in
reforestation projects and it is well known that this practice has attracted serious
criticism. The main reason for this practice in Greece is the suitability of pines for this
purpose, taking into account the poor soil conditions, high temperatures and low
precipitation, almost non-existent during the summer months. Pines are good
candidates for this type of conditions. The introduction of some exotic species has not
proved very successful. Species like P. radiata and P. pinaster were introduced as fast
growing ones. However, P. radiata on one hand succeeded only on better sites, being a
demanding species with regards to soil conditions and air humidity. P. pinaster, on the
other hand is not considered suitable for calcareous soils as is the prevalent case in
Greece. In fact this last species proved problematic in growth capability and at the
same time very susceptible to different damaging biotic factors.
The fungi on pine needles listed in Table 1 are among the most commonly found ones
worldwide (Gibson 1979, Hansen & Lewis 1997). Among them are some well known
pathogens like Cyclaneusma minus, Lophodermium sp., Scirrhia acicola, Elytroderma sp. and
Dothistroma pini, which have been repeatedly reported causing extensive damage in
plantations in other parts of the world. However, serious attacks by these fungi have
not been reported in Greece, except one by Dothistroma pini (Kailidis 1990). From the
literature (Gibson 1979, Hansen & Lewis 1997) it appears that epidemics and serious
damage are related to increased humidity which is not the case in Greece. Nevertheless,
it must be born in mind that repeated attacks by needle fungi and consequent needle
cast negatively influence the trees’ growth by destroying partly, at least, their
assimilating surface.
Pseudotsuga menziesii, an introduced species in Greece, is also used in plantations and for
Christmas tree purposes. It has been repeatedly found to suffer from Rhabdocline
pseudotsugae, a fungus causing premature needle cast (Skarmoutos 1986, Michalopoulos
& Skarmoutsos 1998).
Among the three most important fungi that affect twigs and branches of pines, namely
Diplodia pinea, Brunchorstia pinea and Cenangium ferruginosum, the latter is considered as the
most dangerous one. Although C. ferruginosum is generally seen as a saprophyte that
contributes to the natural pruning procedure of pines, in certain years and for reasons
that have not been fully elucidated it can cause serious disease. This has been the case
in Northern Greece in 1985 and 1986, when thousands of pines died during an
epidemic. Similar epidemics are also known from other European countries (IUFRO
1963, Skarmoutsos 1994). There is already serious suspicion that this year another
epidemic of the fungus is about to break out. A factor that has to be taken into
consideration is that last winter has been a very cold one with exceptionally low
temperatures that lasted over a period of several days.

168
Finally Fomes pini is quite well spread on P. halepensis at Chalkidiki, a highly touristic area.
The main reason for this infection is resin tapping. Other wood decay fungi are also
commonly found in parks and alleys. Fungal attack in this case is related to tree
wounds, usually inflicted by man (Skarmoutsos 1994).
Apart from pine, cypress is also a traditional tree species in Greece, as well as in other
Mediterranean countries. The most dangerous of diseases is that caused by the fungus
Seiridium cardinale (Kailidis 1990). The disease already had devastating effects on cypress
in southern Greece, while it is rather sporadically found in the northern part of the
country (Xenopoulos & Diamandis 1985). Control measures involve felling and
burning of affected trees, while fungicides may be used preventively. Efforts have also
been undertaken to produce resistant planting material by breeding (Panconesi et al.
1999).
Platanus sp. is another traditional species, admired for offering shadow during the
summer months. Very old and enormous plane trees can be found in many parts of
the country, quite often at recreational areas, thus having increased aesthetic value. The
most commonly found fungi affecting plane trees’ leaves are Gnomonia platani and
Microsphaera platani. The infections are not serious, apart from an aesthetic point of
view. It is difficult, however, to apply spraying on fungicides at recreational sites as
these are regularly used by people during the summer months (Kailidis 1990).
Robinia pseudoacacia is a multi-purpose species increasingly used during the last years. It
has been found to suffer from fungal pathogens, the most important ones being
Phomopsis oncostoma, Aglaospora profusa and Cucurbitaria elongata. These fungi affect twigs
and branches. Especially P. oncostoma may even cause the death of young trees of
Robinia (Michalopoulos-Skarmoutsos & Skarmoutsos 1999).
Different poplar clones have been extensively used in Greece during the last 50 years.
In many cases such clones have been used in alleys, as can easily been seen in
Thessaloniki. Poplars are susceptible to an array of fungi that cause disease. One of
the most important, internationally, is the bark necrosis caused by the fungus Dothichiza
populea. Epidemics by this fungus have been observed in Greece and although it is
generally considered as a disease of young poplars, it can also affect older ages when
trees suffer from other fungal infections and/or adverse environmental conditions.
Ailanthus glandulosa is an exotic species too, introduced in Greece a long time ago. It has
been fully acclimatised, it multiplies naturally and can be found forming hedgerows or
alleys in the outskirts of urban areas. In recent years it was found to suffer from wilt
disease, caused by Verticillium dahliae. As a consequence thousands of A. glandulosa trees
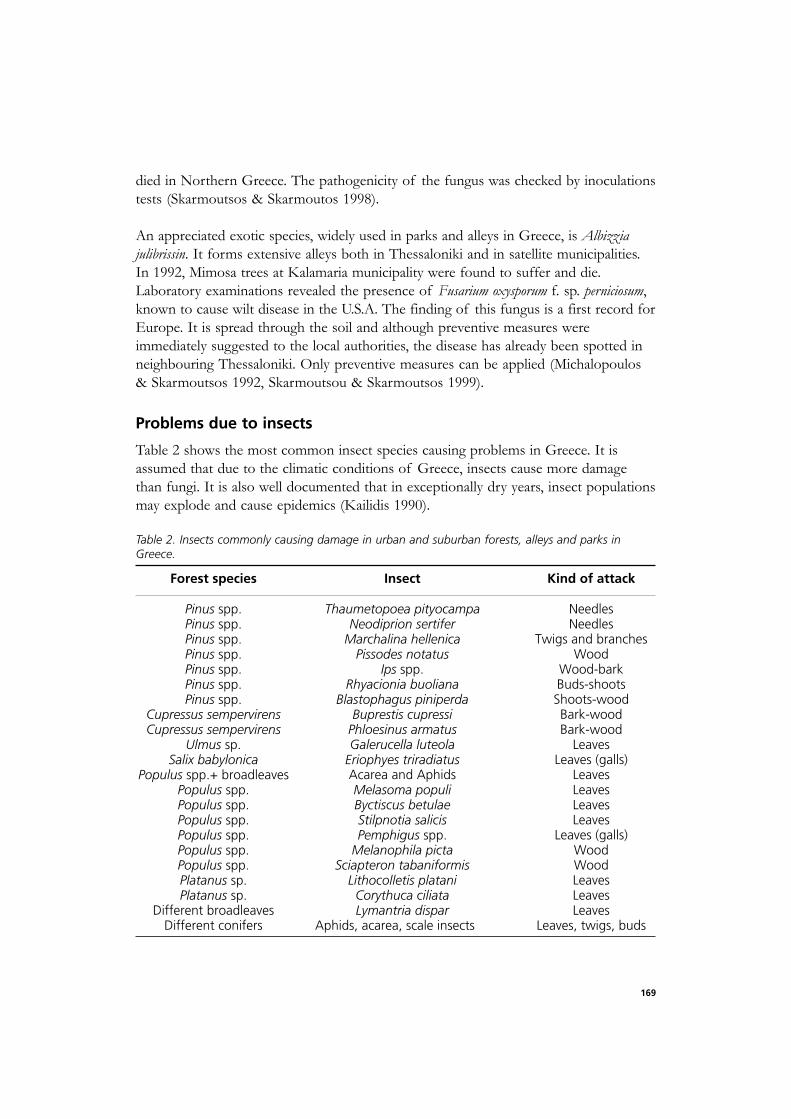
169
died in Northern Greece. The pathogenicity of the fungus was checked by inoculations
tests (Skarmoutsos & Skarmoutos 1998).
An appreciated exotic species, widely used in parks and alleys in Greece, is Albizzia
julibrissin. It forms extensive alleys both in Thessaloniki and in satellite municipalities.
In 1992, Mimosa trees at Kalamaria municipality were found to suffer and die.
Laboratory examinations revealed the presence of Fusarium oxysporum f. sp. perniciosum,
known to cause wilt disease in the U.S.A. The finding of this fungus is a first record for
Europe. It is spread through the soil and although preventive measures were
immediately suggested to the local authorities, the disease has already been spotted in
neighbouring Thessaloniki. Only preventive measures can be applied (Michalopoulos
& Skarmoutsos 1992, Skarmoutsou & Skarmoutsos 1999).
Problems due to insects
Table 2 shows the most common insect species causing problems in Greece. It is
assumed that due to the climatic conditions of Greece, insects cause more damage
than fungi. It is also well documented that in exceptionally dry years, insect populations
may explode and cause epidemics (Kailidis 1990).
Table 2. Insects commonly causing damage in urban and suburban forests, alleys and parks inGreece.
Forest species Insect Kind of attack
Pinus spp. Thaumetopoea pityocampa NeedlesPinus spp. Neodiprion sertifer NeedlesPinus spp. Marchalina hellenica Twigs and branchesPinus spp. Pissodes notatus WoodPinus spp. Ips spp. Wood-barkPinus spp. Rhyacionia buoliana Buds-shootsPinus spp. Blastophagus piniperda Shoots-wood
Cupressus sempervirens Buprestis cupressi Bark-woodCupressus sempervirens Phloesinus armatus Bark-wood
Ulmus sp. Galerucella luteola LeavesSalix babylonica Eriophyes triradiatus Leaves (galls)
Populus spp.+ broadleaves Acarea and Aphids LeavesPopulus spp. Melasoma populi LeavesPopulus spp. Byctiscus betulae LeavesPopulus spp. Stilpnotia salicis LeavesPopulus spp. Pemphigus spp. Leaves (galls)Populus spp. Melanophila picta WoodPopulus spp. Sciapteron tabaniformis WoodPlatanus sp. Lithocolletis platani LeavesPlatanus sp. Corythuca ciliata Leaves
Different broadleaves Lymantria dispar LeavesDifferent conifers Aphids, acarea, scale insects Leaves, twigs, buds

170
A great number of insect species have been recorded in Greece so far (Kailidis 1991),
however this paper refers to those more often associated with problems in urban
forests.
Pine trees in plantations in suburban areas are in almost all cases attacked by
Thaumetopoea pityocampa. The problem is well known across the Mediterranean area and
heavy even total defoliation may occur on certain years. In suburban areas dedicated to
aesthetic and recreational purposes, aerial control is undertaken with Bacillus thuringiensis
preparations. Neodiprion sertifer may also cause serious defoliation. As a result pines do
not grow well and may have a stunted appearance. Among the wood and bark insects,
Pissodes notatus and different Ips species are the commonest attackers, while buds and
shoots are usually attacked by Rhyacionia buoliana. A dangerous and ubiquitus insect
affecting shoots and wood at different stages of its life-cycle is Blastophagus piniperda.
This insect may also provoke the death of infected trees, while at the same time it has
been found to be the vector of the nematodes Bursaphelenchus sexdentati and B. hellenicus
(Braasch et al. 2000).
The most prevalent insects on cypress are Buprestis cupressi and Phloesinus armatus, both
found in wood. They can cause damage on cypress growing on poor soils, especially
during dry years.
Galerucella luteola has been found to cause serious damage to Elm trees in alleys, during
certain years. Salix babylonica, widely used in parks and gardens, suffers from Eriophyes
triradiatus attacks on its leaves, where it forms galls. The insect affects the trees from an
aesthetic point of view.
Different poplar hybrids and other broadleaved trees are used in alleys and parks. Leaf
eating insects include Acarea and Aphids, scale insects and different Pemphigus species
that form galls on the leaves. Insects of these groups also affect conifers. However,
such attacks are not considered serious. Melasoma populi, Byctiscus betulae and Stilpnotia
salicis are well known representatives of leaf eating insects. Melasoma populi and Stilpnotia
salicis have both been found to cause epidemics on certain years. However, the most
dangerous of the insects attacking poplar wood are Melanophila picta and Sciapteron
tabaniformis. The damage to poplars by the latter make trees susceptible to wind breaks.
Such wind broken trees may cause serious damage to property in urban areas.
The well-known honey dew insect Marchalina hellenica is widely spread in Greece and is
considered beneficial as contributing to the production of honey from conifer forests.
Lithocolletis platani causes serious defoliation of plane trees during years of epidemics.
Corythuca ciliata on the other hand is a relatively newly introduced species in Greece that

171
causes serious damage to Platanus leaves, thus affecting the general state of health of
the trees.
Finally Lymantria dispar is able to attack different broadleaved species. Its main hosts are
different Quercus species. Control of this insect is undertaken during certain years when
epidemics appear on plants around residential areas, in order to stop the insect moving
to neighbouring orchards.
Nematodes
Table 3 shows the Bursaphelenchus nematodes isolated so far from pines in Greece.
Table 3. Bursaphelenchus nematodes found on pines in urban and sub-urban forests in Greece.
It is well known that nematodes of the genus Bursaphelenchus are parasitic organisms
that live in the above-ground part of the conifers they attack. The most virulent of
them is Bursaphelenchus xylophilus, an indigenous species in North America, initially
transferred to Japan through timber trade and from there to the neighbouring
countries China, Korea and Taiwan. Although a quarantine species for the European
Union, the nematode was reported in 1999 in Portugal (Mota et al. 1999) and this
constitutes a first record in Europe. It has already been established in Portugal where it
causes damage to Pinus pinaster (Michalopoulos-Skarmoutsos 2001).
Apart from the reality with regards to the potential of establishment of B. xylophilus in
Europe, another reality has also caused concern in recent years. This is the observation
of pine decline phenomena in many countries and especially in South European ones,
the causes of which have not been fully clarified. In many such cases, different
Bursaphelenchus species have been isolated from dead or dying trees (Braasch et al. 2000,
Michalopoulos-Skarmoutsos 2001).
This situation was investigated through a EU-funded research project, namely ‘Pest
Risk Analysis of Pinewood Nematode Related Bursaphelenchus Species in View of South
Forest species Nematode Kind of attack
Pinus spp. B. sexdentati WoodPinus spp. B. leoni WoodPinus spp. B.teratospicularis WoodPinus spp. B. hellenicus WoodPinus spp. B. tusciae WoodPinus spp. B. eggersi WoodPinus spp. B. mucronatus Wood

172
European Pine Wilting and Imports from Asia’ (Braasch et al. 2000, Michalopoulos-
Skarmoutsos 2001). Results from Greece revealed the existence of seven species of
Bursaphelenchus, all isolated from different pine species. The nematodes isolated from
different parts of the country, were: B. sexdentati, B. leoni, B. teratospicularis, B. eggersi, B.
hellenicus, B. tusciae and B. mucronatus. They all constitute a first record for Greece, while
B. hellenicus is a species described for the first time in the framework of the above-
mentioned project. B. xylophilus was not isolated (Michalopoulos-Skarmoutsos 2001).
As different Bursaphelenchus nematodes are known to be transmitted by insects, relevant
studies during the project revealed that in Greece, B. sexdentati and B. hellenicus are
vectored by Blastophagus piniperda. At the same time, inoculation experiments on 3-year-
old pine seedlings, in order to test the pathogenicity of the isolated Bursaphelenchus
species, showed that B. sexdentati is highly pathogenic to indigenous pine species of this
age group. Of the rest of the nematodes, only B. leoni showed a moderate
pathogenicity on pine seedlings, while the other ones are considered as non-
pathogenic. No data on the pathogenic potential of B. teratospicularis were collected, as
this nematode could not be reared in the laboratory.
Discussion
A review was presented above on the situation of urban and suburban forests in
Greece with regards to their state of health in relation to biotic factors, such as fungal
diseases, insect attacks and pine wilt phenomena in which nematodes of the genus
Bursaphelenchus are involved. The lists of organisms presented are not, of course,
exhaustive, but they include the commonest of such organisms found in Greece.
Urban forestry, at the same time, has an important role to play in Greece and many
efforts are undertaken towards this aim. In a country with a long history of erosion,
urban and suburban forests are of immense importance and they have a multi-purpose
role to play, taking into account the fact that Greece strongly relies on tourism. In
general reforestation projects have taken place in many cases on degraded soils coupled
with difficult climatic conditions with low precipitation being a key issue. In this type
of environment, where water and nutrients are limited, trees have to face tremendous
challenges that affect their growth and survival. At the same time the resulting
plantations are monocultures of even age a fact that predisposes them to an easy build-
up of an epidemic by any pathogenic agent.
As stated previously in this paper, climatic conditions do not favour the creation of
epidemics by fungal pathogens except in years when conditions are favourable. In fact
few epidemics due to diseases have been observed in recent years. On the contrary,

173
insect pests are thought to be more dangerous under the climatic conditions of
Greece. Some of the insects referred in the list almost constantly cause major
problems, as is the case with Thaumetopoea pityocampa, Lymantria dispar, Melanophila picta,
Sciapteron tabaniformis, Blastophagus piniperda. Nematodes are also thought to contribute to
the decline phenomena of greek pine forests.
It is assumed that decline urban and sub-urban pine forests in Greece is a complex
phenomenon, which is provoked by adverse environmental conditions on the one
hand and on the other by the simultaneous action of insects, fungi and nematodes in
any combination.
The best control in this case lies more in a preventive rather than intervening
approach. The preventive approach involves the correct selection of species used in
reforestation projects and the correct and timely manipulation of the resulting stands
in their following stages. Mixed stands are more resistant to attacks while at the same
time more desirable from the aesthetic point of view. Health problems that appear on
trees in parks and alleys can be dealt with in a more individualistic approach and
control measures of the chemical type are easier to apply. Here, again, the correct
selection of the species to be planted is of eminent importance for the survival of the
trees and the creation of the desired effect.
References
Braasch H, Caroppo S, Michalopoulos-Skarmoutsos H & Tomiczek C (2000).
Final report of the project ‘Pest Risk Analysis of Pinewood Nematode Related
Bursaphelenchus Species in View of South European Pine Wilting and Wood Imports
from Asia’,Chapter 3.
Gibson IAS (1979).
Diseases of forest trees widely planted as exotics in the tropics and Southern
Hemisphere. Part II: The Genus Pinus: 134. Commonwealth Mycol. Inst. and
Commonwealth For. Inst., England.
Hansen EM & Lewis KJ (1997).
Compendium of conifer diseases: 1-101. APS Press.
IUFRO (1963).
Internationally dangerous forest tree diseases. Proceedings of 13th Congress.
Vienna, 1961. USDA Forest Service, Misc. Publ. No. 39.
Kailidis D (1990).
Diseases of trees in forests and parks. Christodoulidis Publ., Thessaloniki. (In
Greek)

174
Kailidis D (1991).
Forest entomology and zoology. 4th Ed. Christodoulidis Publ., Thessaloniki. (In
Greek)
Kuchelmeister G & Braatz S (1993).
Urban Forestry revisited. Unasylva 44(173): 3-12.
Michalopoulos-Skarmoutsos H (2001).
European conifer forests in regard to nematodes of the genus Bursaphelenchus.
Invited Paper. International Conference “Forest Research: A Challenge for an Inte-
grated European Approach” Thessaloniki, Greece 27-8 to 1-9-2001: 299-304.
Supported by the Research Directorate General of the European Commission,
Brussels.
Michalopoulou H & Skarmoutsos G (1992).
Necroses of Albizzia julibrissin due to the fungus Fusarium oxysporum f. sp. perniciosum
(Hepting) Toole. A new disese in Greece. Hellenic Forestry Society, 5th Panhellenic
Forestry Conference, Kalamata, Greece. 4 – 6 March 1992: 222 – 229. (In Greek)
Michalopoulou H & Skarmoutsos G (1998).
Infection of a plantation of Pseudotsuga at Pertouli forest by the fungus Rhabdocline
pseudotsugae Syd. Hellenic Forestry Society. 8th Panhellenic Forestry Conference,
Alexandroupolis, Greece, 6 – 8 April 1998: 303 – 387. (In Greek)
Michalopoulos-Skarmoutsos H & Skarmoutsos G (1999).
Pathogenicity of fungi affecting Black Locust (Robinia pseudoacacia) in Greece.
Phytoparasitica 27(3): 239 – 240.
Mota M, Braasch H, Bravo MA, Penas AC, Burgermeister W, Metge K & Sousa E (1999).
First report of Bursaphelenchus xylophilus in Portugal and Europe. Nematology 1: 727
– 734.
Panconesi A, Raddi P, Andréoli C, Xenopoulos S, Ramos P, Caetano F & Pinto-Ganhao J
(1999).
Chapter 5. In: Cypress: a practical Handbook. Commission of the European
Communities, Brussels.
Skarmoutsos G (1986).
The occurrence of Rhabdocline needle cast on Douglas fir in Greece. Eur. J. For.
Path. 16(4): 254 – 255.
Skarmoutsos G (1994).
The main pathogenic fungi affecting pine plantations in Northern Greece.
Geotechnic Scientific Issue, 5(2): 13 – 19. (In Greek)

175
Skarmoutsos G & Skarmoutsou H (1998).
Occurrence of wilt disease caused by Verticillium dahliae on Ailanthus glandulosa in
Greece. Plant Disease 82(1): 129.
Skarmoutsou H & Skarmoutsos G (1999).
First report of Fusarium wilt disease of Mimosa in Greece. Plant Disease 83(6): 590.
Unasylva (1993).
Editorial. Unasylva 44(173): 1.
Xenopoulos S & Diamandis S (1985).
A distribution map for Seiridium cardinale causing the cypress canker disease in
Greece. Eur. J. For. Path. 15: 223 – 226.


177
Threats to Urban Green Areas - Case study:Mexico City
Alicia Chacalo, Jaime Grabinsky, Hector Javier Vazquez and Alejandro AldamaUniversidad Autónoma Metropolitana, Azcapotzalco, Mexico
Introduction
Mexico City and its challenges
Mexico City is neither the largest nor the most populated city of the world as is
frequently believed to be. But it is a mega-city with 17 million people. Even though this
number includes the whole metropolitan area, it is a fact that there is no defined limit
separating the Federal District from its surroundings (INEGI - SEMARNAP 1998).
Urban conditions are difficult for the trees in any city of the world. In Mexico City,
conditions are worsened through the following factors:
a) Air pollution levels are very high all year round because the city is located 2240 m
above the sea level (masl) in a Valley surrounded by high mountains. Problems that
do not exist in other cities, such as photochemical pollution, or the enormous
Figure 1. Mexico city is densely populated and densely urbanized.

178
difficulty of bringing water from sources located very far away from the city - since
the local resource is not enough - are a daily concern. Once in the area, the water
needs to be pumped upwards for several hundred meters (Sedue 1986).
b) The average annual rainfall is between 600 mm in the drier area of the city to 1400
mm in the most humid part (INEGI 1993). Rainfall occurs mainly between May
and October, which means that the trees face a dry season lasting 6 months, most
of the times with no additional irrigation.
c) The city is densely populated (see Figure 1): 17% of the total population of Mexico
lives on 1% of the territory. In addition, the city is densely urbanised. It consisted
of 34,000 blocks in 1980, increasing to 55,000 blocks by 1994: a 62% increase in 14
years (INEGI 1994). During recent years, the city has been growing and invading
the natural areas, green areas and medians (Ezcurra 1990).
Mexico City, just as many other megacities, has the problem of intense and frequent
traffic. Strategies used to improve vehicular traffic have included the widening of
avenues, but at the cost of sacrificing the green areas.
A recent official project for the City has evoked intensive arguments. The project
outlines the construction of a second floor above the two most important high-speed
routes of the city: the Periferico and the Viaducto. Thousands of trees could be
affected by this construction. The contractors indicated that the trees were going to be
transplanted. However, there is no experienced personnel, no equipment, or
knowledge for the transplant of adult trees. We believe that if these transplants are
going to take place within the time limitations established by the government for this
project, the great majority of the trees are condemned to die. If this project is to be
developed someday, tree transplanting as well as the specifications related to adequate
equipment, the future location and care practices of the hundreds or thousands of
transplanted trees, must be planned in advance.
Human and green residents of urban areas
73.5% of the total population of the country inhabits urban zones (INEGI 1998). In
1940, only 35% of the population lived in cities and 66% resided in rural areas (Sedue
1986). It is calculated that in the year 2020, 80% of the population will be living in
cities (WRI 1999). The ratio rural/urban zones is quickly changing without the
planning and funding processes necessary to guarantee basic services to all the new
housing developments such as drinking water, electricity and drainage. Besides the new
housing developments, services and infrastructure that will be needed, the new urban
zones must be endowed with green areas in order to avoid pavement and concrete
islands.

179
There is a great disparity between the quantity of green areas at different socio-
economic levels (Chacalo et al. 1998). In the higher income zones infrastructure is
better, the sidewalks are wider and there are more financial resources to hire personnel
(gardeners), and purchasing materials and tools for tree care.
The location of Mexico City in a subtropical region means that climate and soil
conditions favour tree growth all year round (Chacalo et al. 1998) (see Figure 2). The
country and the city (Federal District) are located in a zone of great natural
biodiversity, which is not represented in the cities.
Figure 2. In this city, if a tree seed falls to the ground, it not only germinates but it easily becomesan adult tree.
One of the main environmental effects of the trees in this city - that has sunny days
almost all year round - is the shade. This function is highly appreciated by local
inhabitants. At the same time, the aesthetic and psychological beneficial effects of trees
and green areas in a densely paved city are immense.
Concrete, concrete, concrete. Mexico City is densely built and the local construction
style uses great quantities of concrete. Important amounts of resources are spent every
year for construction, but not even a minimal percentage of these resources is devoted
to develop the infrastructure that permits a friendly place for trees to live in (the

180
minimum suggested is 3%) nor to improve the quality of the existing green areas.
Utility lines are mainly external causing a constant struggle between the trees and the
infrastructure.
ThreatsStreet tree inventory
The diagnosis of the tree situation in Mexico City is the result of the development and
application of street tree inventories in local conditions during a period of 10 years.
Four professors of the Metropolitan University, 2 research assistants and 17 students
sampled 1,261 trees. The stratified sample was distributed proportionally by block
between all the boroughs or neighbourhoods of the Federal District, sampling 866
blocks that represented 1.5% of the total number of blocks in Mexico City. The
confidence level was of 95% with a maximum error of 2.25 trees per block. Ten
percent of the blocks were supervised (Chacalo et al. 1996 & 1994).
The tree inventory showed that more than half the trees are in regular or bad health
conditions. For the planting site, the results turned out to be very similar. There exists a
high correlation between these two factors, which means that the attention given to the
site and the appropriate match between trees and planting sites is beneficial for the
Figure 3. Only eight species constitute 72 % of the street trees. A single species, the ash: (Fraxinusuhdei) represents 19 % of the alignment trees.

181
trees. The inventory registered 1,827 wounds on 1,261 trees, i.e. more than one wound
per tree. 671 wounds were classified as severe.
Health conditions were not differentiated according to the socio-economic level of the
area. In the high income zones trees are distributed among the same categories as in
the low income zones, which means that the city has no culture for caring for trees
(Chacalo & Fernández 1995, Chacalo et al. 1994, 1996 & 1998).
Tree planting and species selection.
Species. Seventy percent of the trees are introduced and the 30% remaining are
indigenous species. We are aware that the origin of the species is not a decisive factor
for the success of the trees. However, the introduced species are used with great
frequency - although sometimes they have a poor ecological or ornamental quality -
because they are species that grow very fast, are easy to propagate, or simply because
they continue to propagate from seeds from the already existing trees in the streets. It
is important to start testing new potential species in order to diversify the population
of trees, to change the proportion of dominant species and to prevent possible
massive losses of trees due to pests (Figure 3).
Quality of the trees. It is common to see very small, newly planted trees. Some times the
trees are a little larger but still do not have the adequate proportions between trunk
diameter, root ball and height. Very few successful and well-planned tree plantings can
be seen (Figure 4).
The government, which is responsible for most of tree plantings, has undertaken
efforts to ‘re-green’ the streets. This effort, however must be supported by adequate
planning and training of qualified persons. The planting of trees is just one step in a
series of previous and subsequent activities that end in the newly planted trees turned
into adult and healthy trees.
Planting techniques
Distances. Trees are planted very closely together and their height at maturity is not
taken into consideration. In the best plantings, the distance usually maintained is max.
5 meters which in a very short period of time becomes insufficient for a healthy tree
growth.
Size of the sidewalk. The modal interval found during the inventory was 1.6 to 2 metres,
which is a very reduced space for the trees. Even if very small trees are planted, the
sidewalk is small in proportion to the container.

182
Literature indicating that planting bellow ground level should be avoided (Watson &
Himelick 1997) is completely ignored in Mexico City.
Figure 4. Quality of the trees planted. A great heterogeneity is seen in the tree population. Trees ofdifferent species, heights, ages and diameter are planted in the same street.
Care of planted trees. Unfortunately, more emphasis is still put on the quantity of the
trees planted than in the quality of the whole process. In Mexico City, trees are
forgotten - even in terms of watering - immediately after they have been planted
(Figure 5). During the rainy season the newly planted trees will grow well. If the trees
are planted close to the dry season, however, they can die due to severe stress.

183
Fig. 5. Trees that might have developed well with little care fail due to lack of attention after havingbeen planted.
Maintenance
Pruning. Probably the most serious problem faced by the trees consists of inappropriate
pruning practices. These ‘pruning’ practices are in fact mutilations that leave the trees
in very poor aesthetic and health conditions. Nevertheless, the climatic and edaphic
conditions of the city are so good that also when severely mutilated the trees manage
to survive, even when 100% of the crown has been eliminated.
Inventories. Even though some institutions have been pioneers in the use of tree
inventories, these methods have been primarily used in research projects or for internal
tree management. In the city, tree inventories are not yet used.
Pests. Some pests can cause severe problems. The species of trees affected, such as the
coral tree (Erythrina coralloides) or eucalyptus tree (Eucalyptus camaldulensis) are densely

184
planted in the city. In the near future the city will greatly require advisors with expertise
in arboriculture who will be able to substitute and eliminate species, and select and
plant the most adequate ones which are suitable for the local conditions.
Dead trees and hazardous trees. A first step in the management programme for trees in a
specific place is the elimination of dead and hazardous trees. If this is not done this
means there is a lack of priorities for the programme or that the team of persons
taking care of the trees is working just limiting themselves to solving problems as they
happen, with no planning. Two boroughs inventoried presented 21 and 23 %
respectively of dead trees! (Chacalo et al. 1996).
Notable trees. In several neighbourhoods of the city there still are a few trees considered
‘remarkable’ either by their size or because they belong to an interesting species (from
an ornamental, ecological or historical point of view). Regrettably, these trees do not
receive any special attention. Very frequently they end up surrounded by pavement, in
difficult conditions which accelerate the damage and stress. Throughout the years we
have witnessed how one after another of these trees have disappeared.
Cultural activities
Mulch. Although this has been a common practice for 25- 30 years in the United States,
Europe and Canada, mulching is not yet common in Mexico. Chippers are not used or
known in Mexico. Other friendly practices such as composting, which do not require
sophisticated equipment, are not common here either.
Irrigation. Trees recently planted in the city require water to grow well. In Mexico,
watering is not common during the dry season. In spite of the good weather of the
city, trees grow slowly without the appropriate irrigation. When the trees are watered, it
is done with trucks called here water pipes. Their hose has a broad opening and the
water jet is so strong it causes severe soil erosion. Actions such as watering the soil
around the tree instead of the trunk of the tree in order to avoid diseases are not
known or practised here (Lilly 1999). The irrigation pipes move slowly along the street
with a person on (the roof) managing the hose with the strong water jet, watering the
green areas. This way of watering is extremely dangerous. Many accidents have
happened already where the person on the roof has fallen down.
Site around the tree. Trees are surrounded by grass or concrete but there is no open space
around them in order to avoid water and nutrient competition between the roots of
the tree and the grass, other plants or other trees. When the trees are surrounded by
concrete (37 % of the inventoried trees are affected by this problem) rainfall can not
reach the roots inside the soil and root extension is very limited.

185
Construction activities. These activities cause more damage to trees than any other
(Figures 6 & 7). Trees that suddenly fall down have lost a good part of their root
system during different excavations. The construction materials and resulting soil from
the excavations is put all over the root system of the tree. When the excavations take
place during the dry season, the roots do not receive enough water to allow them to
regenerate. The simplest technique to protect the main roots is to tunnel below them
instead of trenching; this simple practice is not known or applied in Mexico City
(Watson & Himelick 1997, Lilly 1999).
Figure 6. In construction sites, many trees remain trapped between the walls of the new buildings.Surprisingly, it is often forgotten that trees are alive and need space to allow their growth.

186
Figur 7. Two or more trees sharing the same planting site.
Opportunities
Training program. The certification study guide of the International Society of
Arboriculture (ISA) has been already translated into Spanish and published. We are
hopeful that, once a considerable number of arborists are certified, the situation will
change. Certified arborists will be able to supervise empirical gardeners responsible for
the maintenance and planting activities in parks and gardens. Through the certification
program more people will be trained even if they themselves are not certified.
New species. Being Mexico, a highly diverse country, it would be a privilege to see the
local species of the flora represented in its cities (Chacalo & Fernández 1995).
Therefore, the search for new species can start locally, using the great natural species
palette.
187
Nature in the city. When the inhabitants of Mexico City wish to interact with nature, they
must leave the city and hike to the forests. Although this alternative should still be an
option, we think it is important also to bring nature to the city and not to take the people
away from the city and into the natural ecosystems as is currently happening. How is
this to happen? This is a great challenge for urban planners, architects, landscape
architects, arborists, and other professionals.
Legislation. In order to avoid repeating the same mistakes that have been made for 20
years, it is of the utmost importance not only to develop legislation but also to apply it.
Institutional tree care programs. Several institutions have implemented programmes
destined to care for their green areas and their trees. The few certified arborists and
people devoted to arboriculture are trying to put their knowledge to good use within
their own institutions. The quality of the results obtained is an excellent example that
should be used to educate at least some sectors of society. The tree quality at those
institutions will mark the difference between the quality obtained when managing a
green area with traditional empirical knowledge, or with the science and techniques
developed by this discipline in several countries for the past 80 years.
Research projects on local problems. Which species are more appropriate for each site? How
to control and prevent local pest problems? What soil type is appropriate for each
species? These are some of the important topics that could start a local research
program.
Tree culture. The Asociación Mexicana de Arboricultura (Mexican Arboriculture
Association), an association of recent creation, this association is trying to promote the
culture of tree care. Great challenges await us in this 21st century.
References
Chacalo A, Aldama A & Grabinsky J (1994).
Street Tree Inventory in Mexico City. Journal of Arboriculture 20(4): 222-226.
Chacalo A & Fernández R (1995).
Los árboles nativos e introducidos utilizados en la reforestación de la Ciudad de
México. Ciencia Revista de la Academia de la Investigación Científica 46(3): 383-
393.
Chacalo A, Grabinsky J & Aldama A (1996).
Inventario del arbolado de alineación de la ciudad de México. Ciencia Forestal en
México 21(79): 101-120.

188
Chacalo A, Grabinsky J & Aldama A (1998).
Site limitations to tree growth. In: Proceedings of the 9th METRIA Conference
(Metropolitan Tree Improvement Alliance). Published on the web page of the
University of Ohio State: www.hcs.ohio-state.edu.METRIA/Metria9.html.
Ezcurra E (1990).
De las chinampas a la megalopolis. El medio ambiente de la cuenca de México.
Fondo de Cultura Económica, colección la ciencia desde México no. 91. México.
INEGI (1993).
Anuario Estadístico del Distrito Federal. México.
INEGI (1994).
Governmental Institute for National and local Economic and Geographic Informa-
tion. Manzanas de la Ciudad de México. Comunicación Personal. México.
INEGI - SEMARNAP (1998).
Estadísticas del medio ambiente. Talleres del INEGI. México.
Lilly Sh (1999).
Manual de arboricultura: Guía de estudio para la certificación del arborista. Chacalo
A (ed of Spanish edition). ISA-UAM. Amalgama arte editorial, México.
Sedue (1986).
Informe sobre el estado del medio ambiente en México. Editores e Impresores Foc.,
México.
Watson G. & Himelick E (1997).
Principles and practice of planting trees and shrubs. International Society of
Arboriculture, Champaign IL.
WRI (1998).
World Resources 1998-99. World Resources Institute. Oxford University Press.

189
Management of urban forests and trees
Chapter 5


191
Weed Control in the Urban Environment inDenmark
Palle Kristoffersen & Camilla Blankholm LophavenSkov & Landskab, Danish Centre for Forest, Landscape and PlanningHørsholm Kongevej 11, DK-2970 Hørsholm, Denmark
Abstract
In 1998 the Danish Minister of Environment and Energy signed a voluntary
agreement with The National Association of Local Authorities in Denmark, The
Association of County Councils in Denmark and the cities of Copenhagen and
Frederiksberg. The agreement states that all publicly owned areas must be managed
and maintained entirely without the use of pesticides from 1 January 2003. The
agreement is a response to research results concerning the fate of pesticides in the
aquatic environment including our ground water resources upon which the Danish
drinking water supply is dependent.
In Denmark the use of pesticides for weed control on publicly owned non-cropland,
use of alternative methods and the drawing up of action plans according to the
agreement are monitored. In 1999 and 2000 the annual use of pesticides for weed
control on publicly owned non-cropland was estimated to account for 0.3 % of the
total use in Denmark. The use was reduced by 59 % in the period 1995 - 2000, from 29
to 12 tonnes of active substance.
A research project on weed control on non-cropland in Europe was carried out. The
main objectives of the project were to review the present national regulation on use of
pesticides and alternative methods for weed control on non-cropland in Europe and
also to summarise the status of Research & Development on non-chemical weed
control in Europe. Non-cropland is defined here as e.g. roads, squares, pavements,
parks, sports fields, cemeteries and golf courses.
Local authorities and counties in Denmark are currently in a transitional period in
which the methods used for weed control are changing. A number of research projects
on weed control on semi-hard and hard surfaces, mainly focusing on the biological
effect from non-chemical methods such as burning, steaming and brushing, as well as
research projects on sports fields and golf courses have been set up. For sports fields
and the like, the methods in focus are mechanical weed control, natural selection and
competition of turf grass species against weeds.

192
From being mostly chemical the methods are changing towards being primarily
thermal and mechanical. To meet the new demands experiments with these methods
on semi-hard and hard surfaces are being done as well as scenario studies describing
construction, economic and botanical consequences of various management and
treatment strategies.
Key words: Weed control, urban area, non-cropland, non-chemical weed control,
regulation.
Introduction
Weed control and the related use of pesticides is a still increasingly important issue in
both administrative and practical management of non-cropland like paved areas, sports
grounds, cemeteries etc. in urban areas. This is due to an emerging threat to the
environment including the ground water and surface water resources upon which our
drinking water supplies are based, and it is the case in Denmark as it is in the rest of
Europe (Lophaven & Kristoffersen in prep.). The aim of the study presented here was
therefore to enlighten the Danish general opinion regarding weed control on non-
cropland in urban areas, to show whether it could be possible to reduce the use of
pesticides, draw conclusions and offer perspectives for the consequences and needs in
relation to equipment and strategies presently used as well as in future weed control.
Materials and methods
The study has been separated in five parts. These five parts concern
1. The Danish legislation and regulation of use of pesticides for weed control in
urban areas primarily on paved areas;
2. current use of pesticides;
3. non-chemical methods for weed control on publicly owned areas;
4. European regulations and perceptions in weed control on non-cropland areas; and
5. Research and Development (R&D) on non-chemical weed control in Denmark.
The study of European perceptions is described in detail in Lophaven & Kristoffersen
Part Methodology Period
1 Survey 20012 Questionnaire 1995-20003 Questionnaire 1995-20004 Questionnaire 20015 Survey of field studies → 2001
Table 1. Methodology of the 5 parts of this study included their duration period.

193
(in prep.) and will not be presented in detail in this paper. The methodology of the five
parts and their duration is listed in Table 1.
Results & Discussion
The Danish regulation
There is only sparse regulation of weed control on non-cropland and therefore also in
urban areas. The Danish regulation is subordinate to the EU-legislation in force. This
is primarily the plant protection product regulation of which the Danish version is the
departmental order on plant protection products no. 241 of 27/04/1998. This act
regulates the use of chemical pesticides, thus also pesticides used for weed control on
non-cropland areas. Since March 1993 it has been forbidden to use chemical
substances for weed control on cemeteries managed by the Church in Denmark.
According to the Danish regulation and to the most recent re-evaluation of the active
substance Glyphosate, pesticides containing this can no longer be used on paved areas.
This will have enormous consequences for the future treatment of urban areas.
Alternative regulation – a voluntary agreement
In Denmark there also exists a voluntary agreement on ending the use of pesticides for
weed control on publicly owned areas by 1 January 2003. The agreement was signed in
1998 by the Minister of Environment and Energy, Svend Auken, the National
Association of Local Authorities and the Association of County Councils as well as
the cities of Copenhagen and Frederiksberg. The agreement covers all publicly owned
areas; both urban areas, cropland and forests. Only issues concerning urban areas are
considered in this paper.
There were two main reasons for deciding to regulate the pesticide use with this
voluntary agreement. The first reason was the finding of pesticides in Danish ground
water aquifers, which are the main source of our drinking water supply. Secondly, a
number of reports, initiatives and political declarations of intent since the mid-1990s
had showed a will and a wish for the public to be proactive in regard to minimising the
use of pesticides.
A third of the European countries had some kind of alternative regulation of the
pesticide use for weed control on non-cropland additional to the national regulation
that followed the EU-regulation. Examples of the alternative regulations were the
Dutch agreement of reduction of use, the Norwegian voluntary agreement concerning
publicly owned roads, special permits in Germany and a general tendency among
Swedish local authorities to stop using pesticides on non-cropland. There was also the
Swiss total prohibition by law of use of pesticides on roads, pavements and so forth
(Lophaven & Kristoffersen in prep.).

194
The Danish voluntary agreement also included reporting and follow-up which Skov &
Landskab performed for the Danish Ministry of the Environment by means of a
questionnaire sent to all state institutions, counties and local authorities in Denmark.
Among the subjects reported were:
- The use of pesticides in counties and local authorities and on specific area types.
Only plant protection products were in focus.
- The number of counties and local authorities who have phased out the use of
pesticides completely.
- The public authorities’ actions toward phasing out expressed as actual plans.
- Critical elements in the different public authorities, i.e. the elements that make or
made the phasing out difficult.
Pesticide use in Denmark
Table 2 shows the development of the use of pesticides for weed control on publicly
owned non-cropland areas in Denmark in the period 1995-1999 as reported in the
questionnaires. The column at the far right shows the reduction in percent for each of
the public authorities: state, counties and local authorities.
The greatest reduction took place in the counties. The state had the predominant part
of the pesticide use in 1999. Of this use, half was located at the Ministry of Transport
and used for keeping railway areas free from weeds. In total, the use of pesticides for
weed control on publicly owned non-cropland in Denmark was reduced by 59 percent
from 1995 to 1999 (Kristoffersen & Møller 2001).
Table 2. Danish pesticide use for weed control on non-cropland during the period 1995-1999.Calculations based on numbers from Kristoffersen and Møller (2001).
An interesting detail concerning the specifications of the use of pesticides was that the
vast majority were plant protection products containing the active substance
Glyphosate, as can be seen when comparing Table 2 with Table 3.
Pesticide use Reduction[Tonnes of active substance] [%]
1995 1999 1995-1999State 13.370 7.820 42Counties 1.674 0.351 79Local authorities
113.721 3.634 74
Total 28.765 11.805 59
1 Data for local authorities from 2001.

195
Table 3. Use of Glyphosate in state, counties and local authorities in tonnes. Calculations based ondata from Kristoffersen and Møller (2001).
Regarding Glyphosate, moreover, the counties had the largest percentage of reduction.
The tables illustrate the fact that the vast majority of the pesticides presently being
used contains Glyphosate, which in the near future might become a problem since
Glyphosate has been forbidden on these types of areas since the year 2000.
It should be noted that the pesticides used on non-cropland accounted for
approximately 12 tonnes, 0.3 %, in 1999 and 29 tonnes, 0.8 %, in 1995 of the total use
in Denmark. The main use was for agricultural purposes on cropland (Kristoffersen &
Møller 2001).
Table 4 shows how many of the 273 Danish local authorities that at the time of
registration in 2000 used pesticides for weed control on non-cropland. 70 local
authorities of the 250 answering the questionnaire had already ended their use of
pesticides. This equals approximately 40 %. Approximately 50 % of the local
authorities had a plan for their future use of pesticides. 91 local authorities,
approximately 35 %, had no plan and were still using pesticides.
Table 4. Pesticide use for weed control on non-cropland in local authorities in Denmark in 2000-numbers. Calculations based on numbers from Kristoffersen and Møller (2001).
Figure 1 shows past and expected development of the use of pesticides for weed
control on non-cropland in the period 1995 to 2003. In 1998 the voluntary agreement
came into force and in 1995 and 1999 registrations have taken place. The total stop of
the use of pesticides in 2003 is also plotted in the diagram. Compared to the fact that
approximately half the local communities had phased out pesticides in 1999 it can be
expected to achieve the goal of a total stop of the use of pesticides in 2003.
Local authorities Plan No plan Total
Use 89 91 180No use 28 42 70Total 117 133 250
1995 1999/2000 % reduction
State 6.880 5.555 19Counties 1.027 0.298 71Local authorities 5.876 2.154 63Total 13.783 8.007 42

196
Non-chemical weed control methods in Denmark
The non-chemical weed control methods used in Denmark are primarily motor
mechanical methods and thermal methods as well as a few manually performed
methods. The methods are shown in Table 5.
Table 5. Non-chemical weed control methods in use in Denmark.
Compared to other European countries the actual use of non-chemical weed control
methods in practice was generally higher in Denmark. The most prevalent methods in
Europe were mechanical, whereas the methods in Denmark were thermal, mechanical
and manually performed. This cannot be explained by regulation of the choice of
weed control methods in Denmark since such does not exist. Neither does it exist in
the rest of Europe and must therefore to a great extent be explained by the voluntary
agreement (Lophaven & Kristoffersen in prep.).
Critical elements
Initially a positive critical element which is important in understanding the future
concept of non-chemical weed control is that the public authorities all recognised an
increased knowledge of the various methods during the period of time that has passed
since the agreement was signed. However there were no improvements of machinery
to encourage the general application.
0
10
20
30
1995 1996 1997 1998 1999 2000 2001 2002 2003
tonnes of active
substance
1st
registration 2nd
registrationVoluntaryagreement
Total stop
Figure 1. Pesticide use in the period 1995-1999 illustrated with the most important events in thesequence. Calculations based on numbers from Kristoffersen & Møller (2001).
Grass areas Optimised grass growth by vertical cutting, etc.
Planted areas Mechanical weed control and soil coverage by mulchesand low plants
Paved areas Brushing, burning, harrowing and steaming

197
The fact that there were considerable extra economical charges involved in phasing out
the use of pesticides was generally a major critical element. Further reduction or a total
stop could mean great technical or work-related problems on certain area types like e.g.
road systems, squares, railway areas and airfields because the equipment simply was not
sufficient from a technical perspective (Kristoffersen & Møller 2001).
Research and Development in Denmark
Several experiments regarding thermal weed control methods have been carried out
during the last few years. These have included, for example:
- Dose-response tests regarding dose, driving speed, treated area, and treatment time.
The test should enforce the knowledge of the relationship between dose and
response by input of varying amounts of energy.
- Field experiments covering biological diversity throughout the year and
consequences for the weed control strategies on hard and semi-hard surfaces.
Minimisation of weeds on grass playing fields by optimising the growth of the grass
by designing different maintenance operations and maintenance strategies.
- Development of a material to be used in joints in both kerbs and pavements to
keep them free from weeds.
- The most recent projects are the development of a combined burner and steamer
and improvement and development of brushes also for non-chemical weed control
for paved areas in urban areas.
Thermal methods
Figure 2 shows a propane gas burner mounted on a tractor. By burning weeds with this
type of equipment it was possible to reduce weed infestation since the plant cells are
heated and then burst. Because of this the plant looses a lot of fluid and finally withers
and dies if done properly a number of times.
Figure 3 shows a Danish weed steamer. The principle of steaming was almost similar
to the gas burner, plant cells burst and the plant withers by being exposed to strong
heat and steam. In contrast to the burners there was no fire risk from using this
equipment.
Both Figure 2 and 3 show machinery from the dose-response-test. The machinery only
represented thermal methods: steaming and propane gas burning. A total of eight
different machines participated in the test and were all tested on three types of
vegetation representing typical weed species and with seven different energy doses.
The result of the test was that one gets the same good biological effect on the weeds
can be achieved by treatment with either steam or gas burning with equivalent energy
doses - 1000 kWh per hectare and approximately 80 kg propane gas per hectare
(Kristoffersen et al. 2001).

198
Figure 2. Propane gas burning equipment. Photo taken during dose-response test in autumn 2000.Picture: Camilla Blankholm Lophaven.
Figure 3. Steaming equipment. Picture taken during dose-response test in autumn 2000. Picture:Camilla Blankholm Lophaven.

199
Strategy development
During the period 1999-2001 different weed control strategies have been tested in six
local authorities in Denmark (Larsen & Larsen 2000). The test was finalised in 2001. A
number of strategies were tested in the experiment. The strategies involved weed
control by steaming, burning and brushing. The methods were applied with a varying
intensity to investigate the effect of an increasing level of weed control, but also during
the year and at different times to test the seasonal effect on the final weed infestation
by executing the weed control at different times of the year.
Figure 4 shows a reference stretch. The stretch had visible weeds to a height of 20-40
cm, i.e. the weed infestation was quite heavy.
Figure 4. Reference stretch from strategy-test, summer 2001. Picture: Palle Kristoffersen.
Figure 5 shows pictures from the propane gas burning treatments. The F4-stretch
shown to the left in figure 5 was to be treated four times a year during the three-year
period and is defined as a ‘minimum’ strategy. When the picture was taken the stretch
was burned three times that year, and the weeds had not disappeared. The amount of
energy used for the purpose was equivalent to 100 kg of propane gas per hectare per
treatment.
The F8-stretch to the right was to be treated eight times a year during the three-year
period. When the photograph was taken the stretch had been treated six times that
year. The strategy is called the ‘normal’ strategy. The weed infestation was significantly
lower than in the F4-stretch, which meant that burning eight times a year obviously
had an improved effect compared to burning four times a year.

200
Figure 5. Stretches treated with propane gas burning. To the left: four yearly treatments. To theright: Eight yearly treatments. Pictures taken in summer 2001. Pictures: Palle Kristoffersen.
Strategies
A number of strategies describing the economic costs related to choosing certain levels
of maintenance of the paved areas with regard to weed control were drawn up. The
strategies qualified and helped the local park management to prioritise their means of
business in choosing a weed control strategy. The strategies described the amount of
weed control, cleaning, weed infestation, consequences for paved areas, life span,
number of reconstructions of the paved areas and the cost of 30 years of
management including reconstruction. The strategies are described in detail in Table 6
(Kristoffersen & Larsen 2000).
The weed infestation decreases moving from left to right in the description of the
strategies. The expenses related to managing and reconstructing this type of area
decreases for each level of increasing weed control. This is due to an impediment by
the control elements of the weeds’ accelerated break down of the paved areas. The
span of the costs was from a maximum of 37 EUR/m2/30 years varying down to
approximately 12 EUR/m2/30 years for the ‘normal’ weed control strategy.
The strategies show that it can be expensive to be frugal when dealing with weeds on
non-cropland. The accelerated break down of the surfaces can lead to a threefold
increase of the costs related to managing and renovating paved areas over a 30-year
period when comparing the ‘no weed control’ strategy with the ‘normal’ weed control
strategy.

201
As the empirical basis of non-chemical weed control is expanded and confirmed with
both test results from the currently running R&D and real life experiences these
scenarios will be validated and adjusted to fitting present needs and knowledge.
Seen from a European perspective the Danish R&D ideas of primarily working with
thermal methods are in accordance with the rest of Europe. Approximately half of the
15 countries that participated in a European study confirmed that R&D focussed on
thermal methods like burning and steaming (Lophaven & Kristoffersen in prep.).
Conclusion
It is possible to manage and maintain non-cropland in urban areas without the use of
pesticides. This can be seen both experimentally and in practice in Denmark. The
Table 6. Five non-chemical weed control strategies.
Description No weed control Clean-up weedcontrol
Minimum weedcontrol
Normal weedcontrol
Maximum weedcontrol
Application On areas low inthe list of priori-ties
In outer areasand along kerbs
In residentialneighbourhoods,and along kerbs
On normally priori-tised areas, pave-ments etc.
On highly prioritisedlocalities, and high-value areas includ-ing areas with un-hewn stone
Treatment(yearly)
No treatment orcleaning
1 brushing 4 thermal treat-ments and 1brushing
8 thermal treat-ments
12 thermal treat-ments
Vegetation Overgrowing ofjoints and pavedareas
Overgrowing ofjoints, somevegetation onpaved areas
Overgrowing ofjoints, mostweeds below 5cm high
Overgrowing canbe prevented.Started weeds willbe below 2 cmhigh. No actualcontrol of startedweeds
Paved areas freefrom visually both-ering weeds. Jointsovergrown withmoss, Sagina sp.,and dwarf like typesof weeds
Consequences Paved areas notbrushable andsurface runoff isprevented. Pene-tration of waterinto the openjoints
Paved areashard to brush.Surface runoff iscomplicated.Some penetra-tion of waterinto open joints.
Weeds will notbother traffic.Weeds will openjoints, which mayrisk penetrationof water.
No damage on thepaved areas be-cause of weedgrowth
No damage on thepaved areas be-cause of weedgrowth
Life span Shortened from30 to 10 years
Shortened from30 to 15 years
Shortened from30 to 20 years
No shortening No shortening
Relay 3 times 2 times 1½ times 1 time 1 time
CalculatedValue
2
[EUR/m2/30
Years]
36.9 22.2 18.8 11.9 14.4
2 Calculated from 30 years of management and renovation, by the current rate of exchange 6 November 2001.

202
voluntary agreement has actually meant a reduction of the use of pesticides by
approximately 60% in a period of five years - and the bottom line has not even been
reached yet.
Even though it is no bed of roses because the non-chemical weed control methods are
expensive; the costs are higher than when using pesticides. It is also difficult because
the empirical basis is limited.
Perspectives
There exists a still increasing need for better equipment for weed control, and
somehow it seems that the machinery currently available is not sufficient to meet the
practitioners’ needs. Therefore there is a general agreement that new methods for non-
chemical weed control are needed.
Regarding the protection of our resources it can only be expected that even on
European level there will be an increased awareness of protecting ground and surface
water resources. These are the ones the societies rely upon for drinking water all over
Europe.
All of these demands point in one direction: decrease the use of pesticides for weed
control purposes. This will mean a higher weed infestation than traditionally accepted.
This is the situation society has faced and is still facing in Denmark; it means that it is
necessary for the actors in society to revise ideals of what is regarded as nice and what
can be accepted along roadsides and on pavements in the neighbourhood.
Acknowledgements
The authors gratefully acknowledge the dialogues about the drafts of this manuscript
with Thomas Barfoed Randrup and Cecil Konijnendijk, Danish Centre for Forest,
Landscape and Planning. Use of trade names in this paper does not imply
endorsement by the Danish Centre for Forest, Landscape and Planning of any product
or service.
References
Kristoffersen P & Larsen K (2000).
Kemikaliefri ukrudtsbekæmpelse. Stads- og haveneigeniøren 6-7: 6-11.
Kristoffersen P & Møller J (2001).
Undersøgelse af pesticidforbruget på offentlige arealer i 1999 og 2000. Skov &
Landskab, Hørsholm.

203
Kristoffersen P, Sørensen CB, Larsen K, Hansen P K, Noyé G & Hartvig P (2001).
Test af redskaber til termisk ukrudtsbekæmpelse, Fagbladet Grønt Miljø 5(1): 84-89.
Larsen SU & Larsen K (2000).
Pesticidfri Ukrudtsbekæmpelse på befæstede arealer, Forsøg 1999-2000,
Anlægsrapport 1.1. Frederiksborg Amt, Skov & Landskab, Hørsholm.
Lophaven CB & Kristoffersen P (in prep.).
Weed Control on non-cropland in Urban Areas in Europe. Journal of
Environmental Management. In review.


205
Urban Forest of Thessaloniki: Post-fire (1997)Restoration Perspectives
Ch. TourlakidisDivision of Reforestation of ThessalonikiThessaloniki, Greece
Abstract
The urban forest of Thessaloniki is an artificial one established over a period of 65
years. Its vegetation is composed mainly of Pinus brutia, Cupressus sp. and some other
species. The Greek Forest Service completed a number of activities, such as
establishment of forest roads, fire lanes, a fire watering system, recreation sites and
insect control.
In 1997, a fire destroyed 55% of the forest. Restoration started shortly after. The
District Forest Office cleared the burnt forest and the Division of Reforestation
constructed small-scale erosion and watershed control works. These included
matchsticks, log erosion barriers, ploughing & furrowing, small timbered dams, and
check dams. Reforestation plans were aimed at natural regeneration of Pinus brutia,
Cupressus sp. and Quercus coccifera on one hand. On the other hand artificial reforestation
was to be applied, using conifers and broadleaves, and mainly Cupressus sp., Cedrus sp.,
Quercus sp., Celtis sp., Fraxinus sp., Acer sp. and Robinia sp., some secondary species and
shrub species near recreation sites, forest roads and lanes, and Populus sp., and Platanus
sp. on stream bed sides.
Threats to the urban forest include land use change due to housing, forest fires, insect
pests, soil erosion, floods, drought, and heavy recreational exploitation.
A new project designed for the urban forest as a whole aims at vegetation
improvement and supplement, watershed management, new recreation design,
development of forest protection plans, and insect pest control.
Key Words: urban forest, forest fire, post-fire restoration.
Introduction
The urban forest of Thessaloniki covers the slopes of Kedrinos hills and expands
North-East of the town of Thessaloniki, bordering its residential areas. It is an
artificial forest, a result of a continuous and persistent effort that has lasted 65 years.

206
One case of reforestation is known from during the Turkish occupation in 1910. A
grove was established in an area of 20 hectares at a place called ‘Hilia Dendra’
(‘Thousand trees’). After liberation and the end of World War I, the first afforestating
effort was carried out in 1929 by Professor Petros Kontos and his students of the
newly established Forestry School at the Aristotle University of Thessaloniki.
Reforestation schemes became more intensive after 1934, on the basis of an applied
study conducted by the head of the Thessaloniki Forest Office and later professor at
the Forestry School, Dr. Antonis Georgopoulos. He also established a small-scale
nursery near the forest to produce the necessary planting stock.
At the beginning, afforestation plans aimed at watershed management through
restoration of the degraded forest ecosystem, consisting of short high bushland with
woody, hard-leafed evergreen broadleaves. Recreation and environmental approaches in
forestry emerged later, after urbanisation of the surrounding area and city
development.
During the 1980s, afforestation was completed. The Division of reforestation of
Thessaloniki established 8 recreation sites and constructed 4 paths with total length of
7 kilometres crossing the forest. At the same time, the District Forest Office of
Thessaloniki designed and constructed 90 kilometres of forest roads, 83 kilometres of
fire lanes, and a fire watering system consisting of 3 permanent tanks automatically
filled and 41 water filling points scattered across the area.
The final result was a Pinus brutia forest mixed in many places with Cupressus sempervirens
var. orizontalis, C. arizonica. Other indigenous species used were Pinus pinea, P. halepensis,
Celtis australis, and some others. The Greek Forest Service was proud of this work.
Under the given circumstances this was believed to be the best protected urban forest
in the Mediterranean region.
Two forest departments manage the urban forest of Thessaloniki:
- The District Forest Office is dealing with ownership, protection schemes, and forest
management.
- The Division of Reforestation is dealing with reforestation, recreation and watershed
management plans.
Field data
Geografical data of the site
The entire forest covers an area of 3,020 hectares and is in fact the central part of a
wider forested region around Thessaloniki consisting of 23,500 hectares of forestland
that has been mostly artificially reforested.

207
The forest forms a protective belt, a natural wall against torrential effects of the
Kedrinos currents, secondly, as well as a recreation site bordering the city and an
environmental filter. Administratively eight local communities share this area, namely
Thessaloniki, Pylaia, Panorama, Triandria, Sykies, Ag. Paylos, Hortiatis and Pefka, all
belonging to the Thessaloniki prefecture.
Ownership
The urban forest of Thessaloniki is mainly state-owned (2,261 ha). Part of it consists
of private forest land (645 ha). Another part is rural land (114 ha) scattered across the
area. To satisfy community needs 52.2 hectares were allocated for purposes of
education, sports, water provision and religion.
State, private and rural lands are all under strict forest legislation. This creates a
confrontation between land owners and government, particularly in the case of the
rural land use because of its high value for housing. By a High Court decision
provoked by environmental groups, this rural land became classified permanently as
forestland. This decision created problems to landowners and this debate is still
continuing.
To solve this problem, the Greek Government has two alternatives, as changing
forestland to land for housing is against the law. The first is to compensate the owners
against the real value of their land, and the second to compensate their land with
public land of equal value outside the area of the urban forest of Thessaloniki.
Vegetation
According to Professor Athanasiadis, the area belongs to the submeditteranean vegetation
zone (Quercetalia pubescentis). This is the most peculiar transitional vegetation zone
composed of hard-leafed evergreen broadleaves and deciduous broadleaves. The zone
includes hilly areas with an altitude varying from 100 to 500 metres found at some
distance from the sea all over the Northern part of the country. This area in particular
belongs to the community ostryo-carpinion and the vegetative association of coccifero-
carpinetum.
Before reforestation, this area was bushland of mainly Quercus coccifera, a very hard-
leafed, evergreen broadleaved species that may very easily transform from a tree to a
shrub due to, for example, goat grazing, forest fires, felling for obtaining fuelwood, and
so forth.
Phytogeography showed that during Middle ages this area was dominated by Oak forests
(Q. pubescens) in a mixture with other broadleaved species such as Acer campestris,

208
J F M J J S D Av
2.2 3.4 6.2 9.6 13.9 18.0 20.4 19.8 17.0 12.1 7.4 4.3 11.4
J F M J J S D Av
9.5 11.1 14.5 19.1 24.4 29.0 31.3 30.8 27.8 21.4 15.0 11.3 20.7
J F M J J S D Av
5.7 7.0 10.1 14.2 18.9 23.5 25.8 25.2 22.0 16.4 10.7 7.5 15.8
Fraxinus ornus, Carpinus betulus, Pistacia terebinthus, Ulmus campestris, Crategus oxyacantha,
Platanus orientalis, Populus alba, and so forth. Remnants of those forests still exist
scattered over either the area itself or in its vicinity (forest of Kouri). In the 14th century,
historian Houmnos describes vast broadleaved stands situated above the Acropolis of
Thessaloniki which inhabitants used for getting fuel.
Climatic considerations
Meteorological data presented here come from the Aristotle University Meteorological
Station, found at a distance of 1.5 kilometres of the area, over a period of 20 years
(1979-1999).
Air temperature
Information about average temperature throughout the year is summarised in Tables 1,
2 and 3.
Table 1. Mean average temperature throughout the year.
Table 2. Mean maximum temperatures throughout the year (warmest month so far was July 1998with an average 34.4oC).
Table 3. Mean minimum temperatures throughout the year (coldest month so far January 1982 with3.8oC).
The absolute maximum temperature measured in the area to date was 42.1oC on 7 July
1988, while the absolute minimum was -7.3oC on 10 January 1987.
Rainfall
The accumulative precipitation is 448.1 mm per year unevenly distributed over the year
as can be seen in Table 4. Maximum rainfall so far was 650.4 mm in 1987, while the
minimum level was 301.9 in 1984. Average rainfall for the growing season (March to
September) is 218.8 mm and for the wet period (October to February) 229.3 mm. The

209
J F M J J S D Av
71.0 68.0 69.0 67.0 67.0 60.0 59.0 63.0 66.0 71.0 75.0 72.0 67.0
J F M J J S D Av
24.7 32.7 42.3 37.6 41.4 33.5 24.3 23.1 16.6 42.6 74.5 54.8 448.1
driest season includes July, August and September. Temperature and rainfall are also
depicted in Figure 1. Rainfall has gradually decreased. During the last 9 years (1991-
1999), mean values reached 411.2 mm.
Table 4. Average rainfall (in mm) throughout the year.
Figure 1. Pluviothermic diagram for Aristotle University Meteorological Station.
Relative humidity
As Table 5 shows, relative humidity values from 52% to 84%.
Table 5. Relative humidity throughout the year.
0
5
10
15
20
25
30
35
40
Months
Tem
pera
ture
C
o
0
10
20
30
40
50
60
70
80
Rain
fall m
m
Aristotle University og ThessalonikiMeteorological StationPluviothermic diagram for the period 1979-1990
J M M J S N

210
Winds
The most frequently occurring winds are Northwest (Vardaris), being strong (8-40 km/
h), cold and dry. The western winds bring rain. Southern wind is hot (livas) and if
blowing during summer months (July, August, September) raises fire risk.
Days with snow and fog are very rare, and frost is exceptional.
Climate
According to Mavromatis (1980) the climate of the site is Meditteranean (pluviothermic
diagram with reverse temperature and rainfall graphs, see Figure 1). It is semiarid with
cold winters.
Soil conditions
Geology - parent material
From this perspective, the area belongs to the Axios river zone that covers central,
northern Greece and expands up to Bulgaria. Parent material is sedimentary and
metamorphic from the quartenary period. Rock types identified in the area include red
argils, phyllites, gneisses, gabbros, lime schists, dunites, peridotites and serpentines.
These rocks form horizontal layers along the long axis of the area.
Soil
As a result of the underlying rock and the interaction with climate, relief, rock
withering, erosion, vegetation, time and influence by human, site soil belongs to the
division of red gleys with clay loamy texture, and to yellow, non-calcareous gleys with
sandy-loamy texture. Both include low levels of organic matter. What particularly
matters is heavy erosion that occurred over long periods. Parent rock is very often
superficial.
Fire risk and insect pests
This type of forest is very susceptible to fire risk, particularly during the summer
months (dry season). Because of this, the District Forest Office of Thessaloniki,
responsible for forest protection, established a fire station in the middle of the forest
with easy accessibility to all parts of the forest. Besides that, a zone at the edges of
forest roads and fire lanes is cleared from branches and grass every year, in late spring.
In 1998, the Greek government enforced an act and transferred forest fire
responsibility and control from the Greek Forest Service to the Fire Brigade
Department. Since then, the Greek Forest Service plays an assisting role in this serious
matter.

211
Another threat to the forest is the insect pest Thaumetopea pityocampa which causes
severe damage to Pinus brutia foliage by foraging during the autumn and winter months.
This loss weakens trees that struggle to recover their foliage every spring. Apart from a
negative aesthetic impact it causes allergic skin disease to passers-by.
In recent years, an approved biological product applied by air - with the active
ingredient Bachillus thurigiensis - is used to control the insect. This product poses no
risks to the rest of the insects in the forest.
Disaster
A fire broke simultaneously at five places on the afternoon of 6 July 1997, a very hot
dry day with strong hot southern winds blowing. Within 40 hours, 1,664 hectares i.e
55% of the urban forest burnt.
According to Margaropoulos (1955) there have been cases in the past where floods
from currents of the Kedrinos hills caused serious damage after heavy rainfall, even
with human casualties. Therefore, after the fire, the possibility emerged that such a
phenomenon might be repeated as it had been the case in other places in Greece (e.g.
Athens, Chalkidiki, Corinth and Crete).
Applied studies
A special committee was set up at the Prefecture of Thessaloniki to manage this
‘crisis’. The Division of Reforestation started the task of restoration while the District
Forest Office of Thessaloniki had to produce and remove useful dead timber and sell
it to sawmills.
Within the first month (July 1997) a plan was prepared by a team of the Division of
Reforestation staff, titled : ‘Applied study for erosion and water flow control of the
burned area of the urban forest of Thessaloniki’. A budget of 3,610,000 was
allocated. During the next two months another study was completed, namely: ‘Applied
study for reforestation of the burned area of the urban forest of Thessaloniki’
(budget: 3,610,000
Restoration
The first thing to define was the degree of environmental impact. Emphasis was
placed on small-scale works leaving nature to recover, giving it the initiative and time to
adjust itself to a new forest model more effectively. Under this view, two kinds of
works were allocated: those on a temporary (5-10 years) and those on a permanent
basis.
=C).
=C

212
The District Forest Office and the Division of Reforestation rapidly made contracts
with 5 forest cooperative workers and forest work constructors from the Thessaloniki
area for two assignments. The first was to clear-fell and remove dead, raw timber and
the terrible mess on the site. The second assignment was to construct erosion and
waterflow control works.
1.Erosion control works. These have been built up on a temporary basis (5 years), aimed
to stop sheet erosion caused by heavy rain. They offer first degree protection and
include:
a) Matchsticks. In practice these are rows made of large and small branches,
thin boles, and residues of clear-fellings, stuck on the ground in
horizontal lines (on the uphill side of the stumps) in areas where the slope of
the ground varies between 0-30%. The distance between these rows has been
calculated to optimally be 10-15 metres depending on relief. Their dimensions
are: height 0.75 m, width 1.0-1.5 m and length from 1 to a thousand and more
metres. These structures work like a water filter collecting sediment, sand and
stones moving down the slope, stopping sheet erosion during heavy rainfall.
663,000 metres of these were constructed.
b) Log erosion barriers. These are structures made of logs of dead pine and cypress
trees, stuck in the ground by poles or tied to tree stumps in horizontal lines in
places where the slope varies from 31- 50%. A little trench is dug upwards to
stop downwards rainfall. Distance between the log lines is estimated to vary
between 8-10 metres, height-width equals log diameter (20 centimetres) and
length ranges from 1 to a thousand and more metres. 84,000 metres were
constructed.
c) Clear-fellings. At places where the slope exceeds 50%, dead trees were cut to
pieces of about 1 metre in length and spread on the site. This measure was
applied to a total area of 83.6 ha.
d) Ploughing - furrowing. A heavy machine (bulldozer) with two ripers at the back
(nails 1.0 m long at 2.0 m distance from each other) ploughed the area just once,
horizontally, at a depth of 0.70-1.0 m between matchsticks where slope was 0-
30 %, leaving a furrow. The measure aimed at three targets. First, by furrowing
the ground, water, soil, and sediment are collected into furrows. Secondly, by
loosening ground soil rainwater is absorbed and penetrates more easily into
deeper layers without eroding the surface. Thirdly, plantation is facilitated.
2,146,000 metres were ploughed.
2.Waterflow control works. These constitute second-degree protection works affecting the
city of Thessaloniki below and supplementing erosion control works. These works
aim to control flooding, keeping in place water, mud, sand and stones that have

213
escaped erosion control works. These works are of two kinds :
a) Small timbered dams. These are constructed on a temporary basis (7-10 years).
They are wooden structures made with logs from dead pines and cypresses on
2nd and 3rd degree currents built at certain locations along currentbeds. The
dams are stacked 1.0 metres in height. 188 were constructed.
b) Check dams. These are permanent basic constructions made of concrete with
a height of up to 5.0 metres placed at the lower elevations of the 1st degree
current beds. 22 small dams were constructed.
3 Reforestation. The new type of ecosystem should be a stable, upgraded, and adapted to
climatic and soil conditions, more resistant to fire and insect pests, with a normal
resource of fauna and flora. Services offered to people are watershed management,
recreation, aesthetics, sports and education. The type of forest that matches these
demands is a mixture of broadleaved species and conifers from this vegetation zone.
There have been two approaches to this aim:
a) Natural regeneration. Design involved natural regeneration of Pinus brutia, Cup
ressus sp. and Quercus coccifera, wherever these could be established. Particularly
natural regeneration of P. brutia was at risk, as pine trees were weakened from
drought and pests. On the other hand, cypress was expected to cover only its
own restricted area.
b) Artificial reforestation. This aimed first of all to fill the gaps left from natural
regeneration, secondly to re-introduce species that disappeared long ago
because of human activity, and thirdly to renew and improve vegetation.
Regarding the latter, species selected were indigenous, with some exotic exceptions,
belonging to this vegetative zone and surviving and growing well under the existing
these climatic conditions. The list of species used includes conifer and broadleaved
species, evergreen and deciduous. Particular site, space, altitude and exposure were
taken into account.
Briefly, plantation layout followed the following rules:
- Conifers were introduced to poorer soils and south exposures, and included Cupressus
sempervirens, Cupressus arizonica, Cedrus libani, Cedrus Atlantica, Cedrus deodara, Thuja
orientalis. The exception was Pinus pinea, which was used on deep and better-quality
soils.
- Broadleaved species were used in better environments and on better soils in the
following order :
Quercus aegilops and Quercus pubescens on southern exposed sites.
Quercus ilex on northern exposured sites.
Quercus conferta on higher and northern exposured sites.

214
Celtis australis, Cercis siliquastrum, Fraxinus oxycarpa, Fraxinus ornus, Acer campestris, Acer
negundo, Robinia pseudacacia, Tilia tomentosa on certain places all over the area.
Secondary species such as Prunus insititia, Pyrus communis, Prunus avium, Cornus mas,
Crataegus monogyna, Morus alba, ficus carica, Eleagnus angustifolia, Juglans regia and so
forth were used at different locations among other species to modify the
environment.
Shrub species such as Laurus nobilis, Spartium junceum, Rosmarinus officinalis, Nerium
oleander, Ligustrum vulgare, Cotoneaster orizontalis etc., were established around
recreation sites, fire lanes, forest roads.
On current and stream sides, Platanus orientalis, Populus alba, populus nigra, Fraxinus
excelsior, Acer pseudoplatanus were established.
Planting material was produced at the forest nurseries belonging to the Division of
Reforestation of Thessaloniki. Planting material was either containerised or bare-
rooted. In some cases seeding was applied.
One should keep in mind that the result embodies a potential situation. Nature will
accept or refuse human options. The Forest Service will be there to make the necessary
manipulations needed each time.
All the work described above lasted 8 months, from July 1997 to the end of February
1998.
Perspectives
All the above interventions referred to the burnt area of the Thessaloniki urban forest.
Five years after the fire, a new project (2003-2006) for the entire urban forest financed
by European Union was developed with the following elements:
- Vegetation improvement and complementing;
- watershed management;
- recreation cost analysis and facilities (new Master plan); and
- forest protection, forest road improvement, watering system expansion, control of
insect pests, forest cultivation.
The ultimate principle is that urban forest should remain a natural forest with all
natural functions operative. This is secured at present with the strict forest law being
implemented.

215
References
Athanasiadis (n.n.).
Forest phytosociology. Giahoudi-Diapouli, Thessaloniki. (In Greek)
Kapetanopoulos G (1984).
Element electronic calculation of weight dams. Ministry of Agriculture 142800/
13.3.1984, Athens.
Kotoulas D (1985).
Management and control of torrents. Part 1. Aristotle University of Thessaloniki,
University Press, Thessaloniki. (In Greek)
Kotoulas D (1989).
The small dams. Agricultural Chamber of Greece, Thessaloniki. (In Greek)
Kotoulas D (1997).
Management and torrent control in prefecture of Thessaloniki. Aristotle University
of Thessaloniki, Laboratory of Watershed Management, Thessaloniki.
Margaropoulos P (1950).
Hydraylic calculations of watershed management works. Ministry of Agriculture
KTGK & Forests, Athens. (In Greek)
Margaropoulos P (1955).
Applied study of watershed management of torrent Pylaeas (Kyberniou). Ministry
of Agriculture Y.P.E.M, Division of reforestation and Watershed Management,
Thessaloniki. (In Greek)
Mavromatis G (1980).
Le bioclimat de la Grèce. Relations entre le climat et la vegetation naturelle. Cartes
bioclimatiques. Institut des recherches forestiéres d’Athenes. Forest research V(1).
Stefanidis P (1990).
Morphometrical and hydrographical composition of torrent types in Northern
Greece. Aristotelian University of Thessaloniki. Scientific Annals of the
Department of Forestry and natural Environment. Appendix No 6 Volume LB
(Dissertation). Thessaloniki.
Stefanidis P, Sapountzis M & Stathis D (2001).
Sheet erosion after fire at the urban forest of Thessaloniki. Bulgarian Forest
Research Institute No 1. 2001. Printing House Bolid Bulgaria.
216
Spanos K et al. (2000).
Post fire establishment of plantings in the suburban forest park of Thessaloniki:
First results two years after the great fire. Forest Research Institute (NAGREF).
Aristotle University of Thessaloniki, Dept. of Forestry and Natural Environment.
District of Central Macedonia, Reforestation Directorate of Thessaloniki. National
Agricultural Research Foundation Vol. 13. Athens, Greece.
Vantellas A (1983).
Torrent basins of hydrographic network of Greece. Minisry of Agriculture, Athens.
(In Greek)

217
Arboricultural Research of Trees in City ofLjubljana and Instructions for their Care
Primoz OvenUniversity of Ljubljana, Biotechnical Faculty,Department of Wood Science and TechnologyRozna dolina VIII/34, 1000 Ljubljana, Slovenia
Abstract
In the City of Ljubljana 612 trees were investigated: 358 in Park Tivoli and 254 in other
areas of the City (Ambrozev trg, Eipprova, Mrtvaski most-Vrazov trg, Poljanski nasip,
Prule-Grudnovo nabrezje in Trnovski pristan). Species and biometrical characteristics
of trees were determined. Biotic and abiotic injuries of crown, stem and roots were
investigated. Growth history, wood structure and activity of the cambial zone were
additionally studied for 30 horse-chestnut trees. De-icing salts seriously affected trees,
growing along the streets. Early defoliation of horse-chestnut trees attacked by
Cameraria ohridella was not yet detectable in the annual increment or structure of the
wood. Trees were mechanically wounded by building operations, cars, vandalism,
mowing and non-professional pruning. Defects were described and adequate
arboricultural measurements were proposed for individual trees: 35 trees should be
removed and replaced, 26 trees needed a security system in the crown, 275 should be
nursed according to given instructions, and the rest of trees needed regular and
professional care.
Key words: arboriculture, urban tree, health status, hazardous trees, biotic and abiotic
injuries
Introduction
As opposed to larger European countries, management of street trees in Slovenia
lacked a systematic approach until recently. Increasing pressure of public opinion and
commercial interest for tree care during the last five years generated demands for
improved management. Interest for trees was mainly triggered by breakage and failure
of branches and trees in storms (wind, heavy snow) in the years 1996, 1998 and 1999,
as well as by an explosion of the horse-chestnut leaf miner (Cameraria ohridella)
population. Demands to cut down ‘sick and non-perspective’ tree species became very
strong, although the majority of trees are protected as a natural heritage. In response,
the City of Ljubljana initiated the research project “Arboricultural research of trees in

218
City of Ljubljana and instructions for their care” in 1999. Objectives of the project
were among others: to assess vitality of trees and to identify factors affecting it, to
evaluate hazard potential and to prepare instructions for tree care. Results of this
research are reported here.
Material and methods
Research included trees along streets with a high frequency of traffic and trees in Park
Tivoli. The latter served as a control trees and will be referred as to Park Tivoli trees in
this article. Street trees will be the term used to refer to first group of trees.
Due to the lack of data on trees in Ljubljana, we had to count the trees to obtain a
traceable identification number and to determine the species. Height and DBH (at 1.3
m above ground) were measured with Suunto instruments and served as basic
biometrical data.
To obtain an integral assessment of vitality of the investigated trees several methods
were used: visual assessment of the crown according to Rollof (1998); a study of the
anatomy of cambial zone was used to reveal seasonal activity of the cambium (Oven
1999); and dendrochronology was employed to reveal history of secondary growth of
trees in the last decades (Oven & Levanic 2001).
An evaluation of the hazard potential of the trees involved identification of target,
recording growth defects as well as the frequency and distribution of mechanical
wounds. Moreover, wood destroying fungi (fruit bodies) were identified and an
evaluation was made of the extent of decay using increment boring to obtain wood
cores, and drilling with a 3 mm bit to asses the colour, odour, and texture of the wood
particles. Methodologies described by Matheny & Clark (1994), Dujesiefken et al.
(1999) and Kowol et al. (1999) were applied.
Results and discussion
Collection of basic data revealed that 612 trees were included in the arboricultural
research (Figure 1). The number of tree species was relatively small. All trees from
Park Tivoli were horse-chestnut trees (Aesculus hippocastanum). This species also
prevailed among the street trees: 144 trees were horse-chestnut trees, 66 maples (Acer
psudoplatanus, A. platanoides, A. saccharinum) and 30 trees were willows (Salix x spulcralis).
The other trees were of the following species: Betula pendula, Ailanthus altissima, Platanus
x hispanica, Fraxinus excelsior „Pendula“, Sofora japonica and Tilia platyphyllos.
The majority of investigated trees were adults. Among the street trees only 13 were
young trees with a diameter at the breast height (DBH) smaller than 15 cm. 7 trees

219
(Salix x sepulcralis) had a DBH smaller than 10 cm. Due to a restoration program of
tree colonnades going on in Park Tivoli, the share of young trees was much higher, 121
horse-chestnuts had a DBH smaller than 15 cm. The DBH of adult trees ranged from
55 to 98 cm and the height ranged from 15 to 28 m.
Figure 1. Number of trees included in the arboricultural research in the City of Ljubljana.
Symptoms of more than one adverse factor diminishing the vitality of trees were
found for all investigated trees. All horse-chestnut trees were affected with C. ohridella
and Guignardia aesculi. The insect was detected in 1994 in Slovenia and is usually causing
defoliation in the middle of August every year. Typical symptoms of water stress and
de-icing salts were recognised on leaves of city trees, irrespective of the species. The
rate of street trees affected with de-icing salts reached 36 % (out of 131 trees) in the
examined city area Prule.
To examine the influence of above-mentioned adverse factors, a detailed analysis of
the seasonal duration of cambial activity and the history of secondary growth have
been studied in selected adult horse-chestnut trees.
The beginning of cambial activity did not reveal differences between affected street
trees and apparently healthy trees from Park Tivoli. The first cellular divisions in the
cambial zone were detected on April 21st, 1999 in both affected and healthy trees.
Differences between healthy park trees and affected street trees were visible at the end
of the growing period. The growing period of affected trees ended on August 4th, 2000
as assessed by the absence of cambial divisions. On the contrary, the cambial zone of
healthy trees still displayed divisional activity at this date. For all investigated affected
trees annual growth (increment) had already been completed by August 4th. This was
not the case for healthy trees. The annual increment consisted of already differentiated
wood elements and cells in the process of differentiation. It could be concluded that
the growing season of healthy trees is longer than the growing period of affected trees.
Park Tivoli
358 / 58%
Street trees
254 / 42%
No. of investigated trees = 612

220
The thickness of the annual growth rings in affected trees was smaller than in healthy
park trees (Figure 2).
Five groups of trees were selected for dendrochronology: six apparently healthy trees
from Park Tivoli, five topped trees, nine trees affected by de-icing salts and five trees
which were considered to be affected by C. ohridella earlier and more severe than other
test trees. Growth of apparently healthy trees was found to be stable during the last 80
years, despite unfavourable site conditions. Before 1954 tree rings of the other three
groups were two to three times wider than the reference trees. Thereafter the width of
the tree rings decreased, accompanied by changes in wood structure up to present
(Figure 2). Vessels of the trees affected with de-icing salts were numerous and smaller.
On the other hand, vessels were numerous but larger in topped trees, both compared
to healthy trees from Park Tivoli. It was concluded that the vitality of street trees in
Ljubljana had diminished primarily due to anthropogenic factors. It is supposed that
the survival chances of horse-chestnut trees drastically diminish due to a simultaneous
effect of a biological factor (leaf miner) and unfavourable anthropogenic influences.
Figure 2. Radial growth of apparently healthy horse-chestnut trees from Park Tivoli and affectedstreet trees in the City of Ljubljana during the last 80 years.
Identification of hazardous trees was based on the evaluation of target and inspection
of growth defects, frequency and distribution of mechanical wounds, identification of
wood destroying fungi (fruit bodies) and evaluation of extant of decay. Dead wood in
the crowns was present in each of the 612 trees. The number and diameter of dead
branches increased with diminishing vitality of trees. The presence of co-dominant
branches with included bark was the most obvious growth defect. Surprisingly all
investigated trees (612) were mechanically wounded. Improper and unnecessary
pruning (toping, flush cut) and failure of branches in crowns, vandalism, traffic
1920 1930 1940 1950 1960 1970 1980 1990 2000Year
0
500
1000
1954
19581973
1993
De-icing salts
Cameraria
Healthy trees
Topped trees
Radia
l in
cre
ment
(0,0
1 m
m)
1920 1930 1940 1950 1960 1970 1980 1990 2000Year

221
accidents on stems and construction activities around the root systems were identified
as main causes of damage to trees. Dieback of newly planted trees due to damage to
root crowns and vandalism was found to drastically diminish success of the replanting
program in Park Tivoli. Very often large pruning wounds and wounding of roots has
caused extensive dieback of cambium along the stems. In such cases bark is still
present on the stems, hence the defect cannot be recognized by visual inspection.
Measurements of electrical resistance of the cambial zone proved to be a very useful
tool for identification of such defects.
Instructions for management of investigated trees were prepared according to ZTV
Baumpflege (1993) and EAC (1999). Urgent felling (Figure 3) was recommended for
35 trees. For 26 trees it was recommended to use a security system in the crown (Cobra
system). Moreover, for 276 trees we recommended to employ one of the following
regular care pruning techniques, formative pruning, crown lifting and crown
maintenance.
Figure 3. Structure of recommended arboricultural measures for investigated trees in the City ofLjubljana.
For 275 trees (Figure 3) pruning for safety reasons was recommended, in addition to
other case sensitive recommendations. These included, for example, mulching,
supporting, removal of electrical infrastructure being attached to dead branches in
crown, removal of balustrades, prevention of parking, irrigation, change of the regime
of salt spreading, regular collection of affected leaves, and so forth.
In conclusion, it should be stressed that the decreasing vitality of trees and the
increasing rate of hazardous trees in the City of Ljubljana is due to anthropogenic
factors. The condition of trees could be improved by applying contemporary
arboricultural practice, which should replace the existing, experience-based approach.
It is likely however, that this could be achieved if stronger co-operation between the
Pruning for safety
resons
45%
Regular care
45%
Securty system in
the crown
4%
Felling
6%
(No. of trees = 612)

222
city administration, practitioners and research institutions could be established within
an extensive continuing tree program. Preparation of guidelines in Slovenian (Oven &
Zupancic 2001) could be considered as a first step in this direction.
Acknowledgment
This research was supported by the City of Ljubljana (Department of culture and
research, Department of municipal services and traffic) and the Ministry of Culture of
the Republic of Slovenia.
References
Dujesiefken D, Wohlers A & Kowol T (1999).
Die Hamburger Baumkontrolle – der Leitfaden für eine fachgerechte
Baumkontrolle. In: Dujesiefken D & Kockerbeck P (Eds) Jahrbuch der Baumpflege
1999: 124-138. Thalacker Medien, Braunschweig.
European Arboricultural Council (EAC) (1999).
European Tree Pruning Guide. Tree Advice Trust, Forest Research Station, Alice
Holt Lodge, Wrecclessham.
Kowol T, Wohlers A & Dujesiefken D (1999).
Baumkontrolle nach Baumarten differenziert typische Schadsymptome bei Linde,
Eiche und Roßkastanie. Jahrbuch der Baumpflege 1999: 139-156. Thalacker Medien,
Braunschweig.
Matheny P & Clark JR (1994).
A photographic guide to the evaluation of hazard trees in urban areas. 2nd edit.
International Society of Arboriculture, Savoy, Illinois.
Oven P (2000).
Arboristicna naliza drevja V MOL in navodila za njihovo nego. Biotehniska
fakulteta, Ljubljana.
Oven P & Levanic T (2001).
Jahrringanalytische und holzanatomische Untersuchungen unterschiedlich
befallener Rosskastanien (Aesculus hippocastanum L.) in der Stadt Ljubljana
(Slowenien). In: Dujesiefken D & Kockerbeck P (Eds) Jahrbuch der Baumpflege
2001: 254 – 259. Thalacker Medien, Braunschweig.
Oven P & Zupancic M (2001).
Navodila za obzagovanje urbanega drevja. V: Arboristicna preiskava izbranih
drevoredov v Mestni obcini Maribor in navodila za nego dreves. Biotehniska
fakulteta, Oddelek za lesarstvo: 90-99.

223
Rollof A (1998).
Vitalitätsbeurteilung anhand der Kronenstruktur. In: Dujesiefken D & Kockerbeck
P (Eds) Jahrbuch der Baumpflege 1998: 142 – 151. Thalacker Medien,
Braunschweig.
ZTV-Baumpflege (2001).
Zusätzliche Technische Vertragsbedingungen und Richtlinien für Baumpflege. 4.
Auflage, Forschungsgesellschaft Landschaftsentwicklung - Landschaftsbau e.V.
(FLL), Bonn.


225
Managing Forest Fires Near Urban Areas inMediterranean Countries
Ramon Vallejo, Susana Bautista, Jaime Baeza, and J.Antonio AllozaFundación CEAM, Parque TecnológicoCh. Darwin 14, 46980 Paterna, Spain
Abstracts
Wildfires are increasingly affecting the wildland-urban interface all over the world.
Therefore, protection measures are urgently required to prevent burning of structures
and to avoid post-fire damages in urban areas. Preventive measures are concentrated
on reducing the fuel load in the surroundings of settlements, to reduce flammability of
housing materials, and to ensure accesses and extinction systems. The complexity of
the problem of the wildland-urban interface makes it difficult to implement existing
regulations. Several techniques are developed to mitigate post-fire effects downslope.
Among them, emergency seeding has been widely used in the wildland-urban, interface
especially in southern California. The use of native herbaceous and shrubby species
together with onsite mulching material is recommended to protect only those hillsides
previously recognised as prone to soil erosion, and for those sites threatening
structures. In general, all restoration projects for burned lands should take into account
the principles of fire prevention
Key Words: forest fires, wildland-urban interface, fire prevention.
Introduction
Wildfires are becoming a major disturbance in forests and shrublands in the
Mediterranean, like in other parts of the world (Pausas & Vallejo 1999), and a threat to
properties and structures. In southern Europe, wildfires have greatly increased since
the last quarter of the 20th century, mainly in relation to rural land abandonment and
human activities (Moreno et al. 1998). A relevant part of wildfires in Mediterranean
countries affects periurban areas, and in many cases densely inhabited tourist areas in
summer, when wildfires mostly occur. The problem is likely to escalate in the future
with the urban developments in the coastal strips, which often invade wildland areas.
This generates the specific issue of fire management of the wildland/urban interface
(Davis 1990). This is especially critical in the USA, where in addition to the intermixing
of fuels with the settlements, in many cases the houses are made of wood and other
flammable materials (Cohen 2000). Unfortunately, experiences in the past
demonstrated the high danger for human beings and properties in these areas.

226
Particularities of the wildland/urban interface
For fire management, the wildland/urban interface has several characteristics (Davis
1990, Conard and Weise 1998, Cohen 1999) that deserve a different approach than
open wildland fires.
- Human activities are a major cause for fire occurrence, therefore high human
frequentation in the vicinities of settlements induces high ignition hazard. In this
way, the hot spots of high fire recurrence often happen in the wildland/urban interface.
- Fuels accumulated in vegetation, home ignitability and fuel load of buildings are very
high.
- Tourist developments often generate housing conflicts that may increase arson risk.
- Land abandonment is most frequent in periurban areas leading to the accumulation
of highly flammable fuels in the Mediterranean (Baeza et al. 1998).
- Urban development concentrates on private land, which complicates the intervention
of forest services for fire prevention measures (such as fuel control). In addition,
prescribed fire applications are restricted for safety reasons.
- High risk of structure losses in the first few hours of an incident, therefore fast in-
tervention is very critical.
- High human and property risk.
- Hazard of direct impact of post-fire flooding, erosion/sedimentation, and mud
flows on human population.
- High value of affected land. Therefore, higher potential investments for restoration
can be envisaged than in common wildlands.
- In general, closer proximity of fire brigades and (relatively) good access, though
sometimes access can be a bottleneck, demonstrated in some of the most dramatic
accidents.
Preventive measures
Fire prevention in the wildland/urban interface is relatively old as a recognised
problem (at least since the 1960’s in the USA) having old solutions as well, i.e.
managing fuels near structures (USDA 1996). But, in general, there is little real
implementation. Progress in those fields will require legal mandates, zoning regulations,
fire and building codes, insurance rating systems, and tackling social and psychological
factors (Davis 1990). In southern California (Conard and Weise 1998), mosaic burning
through prescribed fire programs was implemented since the 1980s to reduce fuel and
decrease the size of wildfires. According to the same authors, these programs have
been difficult to implement and little effective, especially in the wildland-urban
interface because of the risk of burning structures and public opposition. In view of
these limitations, Conard and Weise (1998) recommend to separate urban interface
areas from natural fuels through intensive and rotational fire risk management in these
areas, taking advantage of natural or man-made barriers, such as roads.

227
Fire prevention in the immediate wildland-urban interface has the twofold objective of
preventing ignition from the urban areas and preventing of damage in the settlements
from fires originated in wildland areas (Conard and Weise 1998). In these situations,
fire prevention is focused on the so-called “home ignition zone”, a zone with a 25-60
m radius surrounding the houses (Cohen 2000, Vélez 2000) or even less, e.g. 9 m
(SGSF 1998). Experimental and modelling evidence indicates that fuel reduction may
be inefficient at hundred of more meters around homes because the distance is greater
than necessary for reducing ignitions from flames. Also it is ineffective because it does
not sufficiently reduce firebrand production that potentially extend for several
kilometres away from structures (Cohen 1999). Tourist resorts would require a fire-
break strip at least 25 m wide, with adjoining trees pruned to a minimum height of 4 m
(Leone et al. 2000). Regulations intend to maintain a low fuel load in the home ignition
zone, to reduce flammability of housing materials, and to ensure access and proper
functioning of extinction systems. Usually there is no federal or national legislation in
this regard, but there is legislation at the local (community or municipality) level for fire
prevention in the periurban zone. In Spain, there is autonomic legislation for some
regions, e.g. in Catalonia a cleared protective belt of 25 m around urban settlements
should be maintained by the owners.
Vegetation management to reduce fire hazard should consider vegetation dynamics and
ecosystem conservation. In addition to fuel reduction, small changes in connectivity by
managing the spatial arrangement of fuels may largely influence fire spread (Turner et
Plot 1 Plot 2 Plot 3
Nu
mb
er
of
se
ed
lin
gs
(m
-2)
0
5
10
15
20
25
30
35
40
Slash
No slash
Figure 1. Control of fire-prone shrublands in Eastern Spain. Reduction of the fuel accumulator Ulexparviflorus germination by clearing and spreading slash on soil surface. Slash cover reduced seedgermination with respect to bare soil.
Ulex oarviflorus germination

228
al. 1989). Clearing techniques should be based on a deep knowledge of the biology of
the target plant species (fuel accumulators) in order to optimise the treatments. Often,
fire-prone ecosystems develop after land abandonment in southern Europe, and this
mainly occurs in the vicinity of settlements. As an example, in fire-prone shrublands
dominated by obligate seeders and fuel-accumulators, such as gorse (Ulex parviflorus) in
eastern Spain, clearing treatments spreading slash on soil surface allow reducing fuel
load and decrease gorse germination (Figure 1).
Post-fire emergency mitigation/rehabilitation treatments
Burned wildlands are exposed to increased water and wind erosion, and runoff, due to
the temporal loss of protective plant and litter cover. These processes can occur close
to structures, generating a high risk of damage to human properties and lives down
slope. The objective of post-fire management actions is to reduce runoff and soil
erosion, including offsite effects (flooding, mudflows, siltation), and promote
ecosystem recovery at the same time. The most common treatments are (Forrest and
Harding 1994, Robichaud et al. 2000):
- Seeding (aerial or ground) with mulching to promote a fast herbaceous cover to
reduce erosion risk;
- contour-felled logs;
- silt fences;
- check dams, gabions; and
- other hillside treatments: contour trenches, blankets.
This paper will concentrate on seeding practices, as they are controversial nowadays. In
a recent review (Robichaud et al. 2000), mostly based on the USA experience, several
potential shortcomings have been identified for seeding practices:
- Seeding may not be needed when natural regeneration is efficient;
- uncertain germination rates;
- risk of being affective only late in the first and second post-fire season; and
- competition of seeded non-native species (e.g. Lolium multiflorum) with native flora.
We have developed some experiments on post-fire emergency seeding in Eastern Spain
(Vallejo and Alloza 1998). The first step was to identify those burned areas that might
need emergency mitigation measures. The selection criteria were related to erosion and
runoff risk, namely steep slopes, erodible soil, and low regeneration capacity for
vegetation. Previous research (Abad et al. 1996) showed that the post-fire regeneration
capacity in eastern Spain was mainly controlled by the presence of resprouting species,
i.e. those areas dominated by resprouters showed an efficient plant cover regeneration,

229
quite independent of post-fire weather conditions, and unlikely to be improved by
seeding treatments. On the contrary, plant communities dominated by obligate seeders
often show slow plant cover regeneration, which, in addition, is highly dependent on
post-fire rainfall. This poor plant regeneration was concentrated on south-facing
slopes. Therefore, post-fire erosion and runoff risk could be assessed from pre-fire
conditions that can be obtained from available maps and/or a quick field survey just
after a fire.
Selected erosion-prone plots were seeded right after fires, using a mixture of seeds,
mulching material (200 gm–2 straw) and inorganic fertiliser. The seed mixture included
commercially available seeds of native or naturalised herbaceous species, combining
perennials with annuals, and grasses with legumes. Annuals show fast germination
ability after the first rain, whereas perennials allow longer persistence of plants,
independent of the uncertain flowering, seed production and germination rate of
introduced species. The different rooting depth and pattern of grasses and legumes,
and the potential N-fixing capacity of the latter, justify their mixed application.
Seeded plots showed a fast recovery of plant cover within two months after
application. Measurements taken 6 and 18 months after seeding showed a transient
increase in plant cover, especially significant under semi-arid conditions (Figure 2), with
almost all introduced species having disappeared after 18 months. Therefore, no
inhibition of regrowth of native species was observed in those plots. Treated plots
showed significantly lower erosion rates than the control plots (Figure 3). Therefore,
the technique proved to be efficient in protecting vulnerable ecosystems after fire.
Figure 2. Total plant cover 6 and 18 months after seeding in dry-sub-humid and semiarid burnedareas (mean values and standard error). Seeding + mulching treatment significantly increased plantcover in the short-term in semiarid conditions.
Dry-sub-humid
To
tal
pla
nt
co
ver
(%)
0
20
40
60
80
100
Semiarid
Seeding + Mulching
Control
6 months 18 months 6 months 18 months
*

230
We performed a subsequent set of erosion-plots experiments in a pine forest under
semi-arid conditions. The study was conducted in a periurban coastal stand moderately
impacted by tourist recreation and severely affected by a large wildfire. We compared a
seeding + mulching treatment with an only mulching treatment (no seeding) and
control plots. The two treatments applied showed similar results in terms of increasing
plant cover and reducing runoff and erosion, especially for the most vulnerable sites
within the burned stand (Table 1). It is interesting to note that mulching alone
protected soil surface from post-fire degradation and soil loss, and also enhanced
spontaneous plant growth (Bautista at al. 1996). Therefore, in our experimental sites,
mulching alone was effective and feasible enough as a mitigation measure after fire.
Table 1. Total sediment yield (g m-2) for the first 18 months after treatment application in a semiaridburned pine forest. B1, B2, and B3 sites represent increasing levels in fire severity.
Figure 3. Soil erosion rates in treated (seeding + mulching) and control plots in dry-sub-humid andsemiarid conditions (mean values and standard error). Seeding + mulching treatment significantlyreduced soil loss.
Semiarid
So
il l
os
s (
Mg
ha
-1 y
ear-1
)
0
5
10
15
20
25
30
35
Seeding + Mulching
Control
Dry-subhumid
Seeding +Mulching
Mulching Control
Site B1 14 9 18
Site B2 17 11 33
Site B3 21 18 292

231
According to Robichaud et al (2000) and our own experience described above, various
alternatives are proposed to the shortcomings of seeding treatments:
1) Previous assessment of natural regeneration potential:
a) selection of areas with poor regeneration potential (e.g. low resprouters cover);
b) high runoff and erosion risk (steep slope, compact soils); and
c) high downstream risk of damage (infrastructures, homes).
2) Spreading mulch (preferably onsite slash) to ensure immediate soil protection
3) Selection of seeding mixtures using native species:
a) Fast growing annuals;
b) Perennials for the persistence of soil protection;
c) Grasses and legumes; and
d) Shrubs and trees to enhance secondary succession.
In general, all restoration projects for burned lands in fire-prone ecosystems, being
either seeding or plantation, should take into account the principles of fire prevention
(Vélez 1990). E.g. to avoid mono-culture plantations, to reduce fuel accumulator
species, to promote more resilient and late-successional vegetation (Vallejo and Alloza
1998), and to design all interventions in the landscape so to reduce the hazard of fire
spread (Turner 1994, Forman and Collinge 1996).
Acknowledgements
This research has been supported by the Regional Government of Valencia (Generalitat
Valenciana) and Fundación Bancaixa.
References
Abad N, Caturla RN, Baeza J, Bladé C, Vieira F, Carbó E, Valdecantos A, Bonet A, Serrasolsas
I, Guardia R, Raventós J, Alloza JA, Escarré A, Bellot J & Vallejo VR (1996).
Regeneración de los montes quemados. In: La restauración de la cubierta vegetal en
la Comunidad Valenciana. V.R. Vallejo ed. 51-148. CEAM, Valencia.
Bautista S, Bellot J & Vallejo VR (1996).
Mulching treatment for postfire soil conservation in a semiarid ecosystem. Arid Soil
Res. and Rehab., 10: 235-242.
Baeza MJ, Raventós J & Escarré A. (1998).
Structural changes in relation to age in fire-prone mediterranean shrubland. II Int.
Confer. on Forest Fire Research. Vol II, 2567-2578. Luso, Protugal.

232
Cohen JD (1999).
Reducing the wildland fire threat to homes: Where and how much? USDA Forest
Service Gen. Tech. Rep. PSW-GTR-173, 189-195
Cohen JD (2000).
Preventing disaster: home ignitability in the wildland-urban interface. J. Forestry
98(3):15-21.
Conard SG & Weise DR (1998).
Management of fire regime, fuels, and fire effects in southern California chaparral:
lessons from the past and thoughts for the future. In: T.L. Pruden and L.A.
Brennan (Eds) Fire in ecosystem management: shifting the paradigm from suppres-
sion to prescription. Pp. 342-350, Tall Timbers Fire Ecology Conference Proc., no.
20, Tall Timbers Res. Station, Tallahassee, USA.
Davis J (1990).
The wildland-urban interface: Paradise or battleground? J. Forestry, 88 (1): 26-31.
Forman RTT & Collinge SK (1996).
The „spatial solution“ to conserving biodiversity in landscapes and regions. En:
R.M. DeGraaf and R.I. Miller (Eds) Conservation of Faunal Diversity in Forested
Landscapes: 537-569. Chapman & Hall, London.
Forrest CL & Harding MV (1994).
Erosion and sediment control: Preventing additional disasters after the southern
California fires. J. Soil and Water Conservation 49(6): 535-541.
Leone V, Saracino A, Trabaud L & Vélez R (2000).
Fire prevention and management policies in west Mediterranean pine forests. In:
Neleman G & Trabaud L (Eds): 335-353. Ecology, Biogeography and Management
of Pinus halepensis and P. brutia Forest Ecosystems in the Mediterranean Basin,
Blackhuys Publ., Leiden.
Moreno, J.M., Vázquez, A. and Vélez, R., 1998.
Recent history of forest fires in Spain. In: Moreno, JM (Ed): Large forest fires, J.M.
Moreno ed., 159-185. Backhuys Pub., Leiden, The Netherlands.
Pausas JG & Vallejo VR (1999).
The role of fire in European Mediterranean ecosystems. In: Chuvieco E. (Ed): pp.
3-16. Remote sensing of large wildfires in the European Mediterranean basin.
Springer-Verlag.
Robichaud PR, Beyers JL & Neary DG (2000).
Evaluating the effectiveness of postfire rehabilitation treatments. Gen. Tech. Rep.
RMRS-GTR-63. USDA, Forest Service, Rocky Mountain Res. Station. Fort Collins,
USA.

233
SGSF (Southern Group of State Foresters) (1998).
When the forest becomes a community. A forester’s handbook for the wildland/
urban interface. USDA Forest Service, Atlanta, USA.
Turner MG. (1994).
Landscape dynamics in crown fire ecosystems. Landscape Ecology 9(1): 59-77.
Turner MG., Gardner RH, Dale VH & O’Neill R V (1989).
Predicting the spread of disturbance across heterogeneous landscapes. Oikos 55:
121–129.
USDA (1996).
Federal wildland policy. USDA Forest Service. Avaliable online at: (http://
www.fs.fed.us/land/wdfire.htm).
Vallejo VR & Alloza JA (1998).
The restoration of burned lands: the case of eastern Spain. In: Moreno JM (Ed)
Large forest fires: 91-108. Backhuys, Leiden, Holland.
Vélez R (1990).
Algunas observaciones para una selvicultura preventiva de incendios forestales,
Ecología, Fuera de Serie nº 1: 561-571.
Vélez R (2000).
Otras infraestructuras preventivas. In: Vélez R (Ed) La defensa contra incendios
forestales: 14.82-14.86. McGraw-Hill, Madrid.


235
Partnerships for urban forestry
Chapter 6


237
The White Rose Forest – A Catalyst for theRegeneration of a Region
Alan SimsonLandscape at Leeds Research Group,Faculty of Health and Environment, LeedsMetropolitan UniversityBrunswick Building, Leeds LS2 8BU.United Kingdom
Abstract
It is generally believed that there is a ‘north – south divide’ in the UK, largely broughtabout by the undue centralisation of economic power on London and the southeastregion. The UK Government addressed this issue in December 1997, when it publis-hed a White Paper entitled ‘Building Partnerships for Prosperity’, which set outgovernment plans for the development of the English Regions. The subsequent ‘Re-gional Development Agencies Act’ (November 1998) set up nine RegionalDevelopment Agencies (RDA’s), one of which was the Yorkshire and Humber RDA,now known as Yorkshire Forward.
In the preface to its new Regional Development Strategy, Yorkshire Forwardarticulated a vision of a “world class region, strong and globally competitive, a goodregion within which to live, work and play, and be educated”. To assist in developingthis vision, Yorkshire Forward commissioned Leeds Metropolitan University (LMU) toresearch and collate a wide range of statistical indicators about the region, its economy,its environment and its quality of life.
As a result of this research, Yorkshire Forward recognised that rapid improvement inattracting and retaining inward investment into the area could be facilitated bycombining commercial success with environmental improvement, particularly bysignificantly increasing the tree and woodland cover of the region and by being at thecutting edge of sustainable development.
After a programme of consultation with the National Urban Forestry Unit (NUFU)and numerous other agencies, it was decided to develop a strategy for enhancing thetree and woodland cover of the Yorkshire region. This was officially launched on 1st
August 2000 as the White Rose Forest (WRF). The project initially concentrated on thefive local authority metropolitan districts of West Yorkshire, including all the cities,towns, villages and their rural hinterland. The project aimed to increase the total

238
woodland cover of the region to at least 6,5 % by 2016, which would entail theplanting of a minimum of 4000 ha of new woodland planting.
The vision of the White Rose Forest was to “create a genuinely sustainable well-wooded landscape which will benefit the people, the economy and the wildlife of(West) Yorkshire”. This paper considers the rationale behind this vision, its core aimsand priorities and the key actions involved in its delivery, including its role as a forumfor cross-authority working, training and research. The paper will conclude bysuggesting that the White Rose Forest could be considered as a national model forpromoting the positive role that trees and woodland can play in helping to deliver thewide range of policies of a Regional Development Agency.
Key words: urban forestry, trees, woodland, catalyst, regional regeneration, regionaldevelopment agency.
Introduction
There are those who say that there is a division between the people who live in thenorth of the UK, and those who live in the south. The implication is that in the north,things are not so good; there is a measure of unemployment, there is a post-industrial,despoiled landscape, the quality of life is compromised and people, particularly youngpeople, are leaving for richer pickings elsewhere. In the south however, the implicationis that the quality of life is good; there is full employment, there is a qualityenvironment, life has a certain ‘style’ to it. Like all good urban myths, there is a grainof truth in it although, as might be expected, it is not quite as simple as that.
What is true is that, historically speaking, too much power – particularly economicpower – has been centred on London. It has been suggested that, in terms ofeconomic performance, if London sneezed, then the English regions caught a badcold. Joking apart, what this means is that by setting a rigid, ‘one size fits all’ economicpolicy based on London, the government were contributing to this so-called ‘north-south divide’, or more accurately a ‘south-east – all other regions’ divide, by notrecognising that each region has its own aspirations, its own set of problems, andprobably its own ways of trying to solve them.
The UK government has made some progress with trying to address this issue. Walesand Scotland now enjoy a measure of devolution, and Northern Ireland has a measureof self-determination as well. In December 1997, it was the turn of the Englishregions, when the government published a White Paper entitled ‘Building Partnershipsfor Prosperity’, which set out plans for the development of the English regions. Thesubsequent Regional Development Agencies Act of November 1998 set up nine

239
Regional Development Agencies (RDA’s), one of which was the Yorkshire & HumberRDA, now known as Yorkshire Forward.
Yorkshire and Humber Region
Regional Development Agencies have both a wide networking role and a policydevelopment brief, as well as being responsible for delivering some services directly,but their core task is to revitalise their region by developing and delivering a new,visionary Regional Economic Strategy. Yorkshire Forward’s vision is simple andstraightforward. It is to be “the driving force behind the economic regeneration ofYorkshire & Humber, delivering a programme of change that will make a positivedifference to our people, our businesses and our environment” (Yorkshire Forward1999a).
To achieve this, the RDA articulated six prime objectives:- To grow the region’s businesses;- to achieve higher business births and survival rates;- to attract and retain more inward investment;- to improve education, learning and skills;- to target community-based regeneration programmes; and- to get the best from the region’s physical and environmental assets.
As part of the preparation for their new strategy, the Yorkshire & Humber RDAProject Team commissioned Leeds Metropolitan University to undertake a study ofthe region to produce a series of baseline studies (LMU 1998). This research presenteda picture of Yorkshire & Humber’s regional performance across a wide range ofregional issues and performance indicators, including environmental quality. The broadconclusion was that, although there were many significant success stories and newregeneration opportunities, the region was not performing well.
The region of Yorkshire & Humber is a strange admixture of contrasts. It covers ahuge area, in excess of 15,500 km2, and has a population of more than 5 millionpeople – approximately the same as Scotland or slightly less than Denmark. They arenot evenly distributed, there being an average of 0,3 people/ha in parts of the northof the region and 10,39 people / ha in parts of the south (the UK average is 3,6people/ha). The region has an ageing population, and it is predicted that over 10 % ofthe population under the age of 30 will have left the region by 2016. There are 9universities and over 40 colleges in the region, producing just over 10 % of all UKgraduates, and yet in 1996, the region was ranked 36 out of 38 when compared againstother comparable regions in the EU with regard to the percentage of 16-18 year oldswho were in some kind of education or training. The region’s GDP was only 87 % of

240
the EU average in 1996, with low levels of manufacturing investment, low employmentin the high technology sectors, low investment in research and development and poorsmall firm formation and survival rates. And yet the regional capital, the City of Leeds,has the fastest-growing city economy in the whole of the UK (LMU 1998).
Worst of all, from the urban forestry point of view, was the fact that the region hadone of the lowest percentages of woodland cover in the UK (4,3 %). This comparesvery unfavourably with the 7,6 % average woodland cover in England, let alone theaverage UK cover of 10,8 %, and is way behind that found in many mainlandEuropean countries. Worst still, although parts of Sheffield, Rotherham and Barnsleybenefit from being part of the South Yorkshire Community Forest, which is graduallyincreasing the local woodland cover, Wakefield has the lowest woodland cover of anyBritish local authority (3,5 %).
Depressing though these statistics are, they did serve a purpose. It was recognised bythe RDA Project Team that rapid improvement in attracting and retaining inwardinvestment into the area could only be made by combining business success withenvironmental improvement, being at the cutting edge of sustainable development,and significantly increasing the tree and woodland cover of the region (YorkshireForward 1999b). It is interesting to note that whilst the Regional DevelopmentAgencies were beginning to find their feet, the Forestry Commission was being re-organised by having their regional administrative boundaries re-drawn to co-inside withthe new RDA boundaries. More significantly however, they published a new series ofstrategic priorities and programmes under the guise of a new English Forest Strategy(Forestry Commission 1998). Wales and Scotland were to have their own strategies.
Under the English Strategy, four Programme Actions were proposed:- Forestry for Rural Development;- Forestry for Recreation, Access & Tourism;- Forestry for Environment & Conservation; and- Forestry for Economic Regeneration.
Specifically pledged under the latter was a commitment to encourage the RDA’s to useforestry & woodland programmes to help deliver their vision, and also to encouragethe development of new urban forestry initiatives that demonstrate ‘achievementthrough partnership’ approaches. This new strategy represented a significant stepforward for forestry, and particularly urban forestry, in the UK. An early initiative bythe National Urban Forestry Unit (NUFU), in partnership with a number of otherorganisations, persuaded Yorkshire Forward of the merits of using a long-term,regional programme of urban forestry as a catalyst for the regeneration of the region,and thus the concept of the White Rose Forest was born (Simson in press).

241
The White Rose Forest Strategy
Stimulated by their own beliefs in large-scale urban forestry and bolstered by a numberof UK governments reports (DETR 1999), NUFU commissioned a feasibility studyinto this potential regional urban forestry project (NUFU 1999), and following wideconsultation and an appraisal of existing regional and sub-regional planning and policyinitiatives, a one day seminar was held in Bradford in the September of 1999 to fullydiscuss the project. There was sufficient unanimity of purpose amongst the assembledpotential partners for a Forest Strategy Consultation report to be commissioned andpublished by NUFU in February 2000, although at that time, it was deemed politicallywise to limit the project to west Yorkshire, a sub-region of the county (GroundworkWakefield 2000).
Caution was thrown to the wind in July of that year, when it was agreed to change thename of the project to the White Rose Forest (WRF), thus declaring the project’sregional aspirations by adopting the floral emblem of Yorkshire. An outline strategywas also published that endeavoured to set out the first steps that would be required inorder to progress the project. These were:
- To establish a lead body capable of shaping and championing the strategy;- to make an inventory of existing and potential woodland sites to identify
opportunities for planting, public access and the enhancement of bio-diversity;- to relate the White Rose Forest Strategy to the rest of the region’s land-use planning
framework;- to secure the resources to enable the partners to implement the strategy;- to develop demonstration projects to promote the forest concepts; and- to raise public awareness of the benefits of more trees and woodland in and around
towns.
The project was officially launched on 1 August 2000 in the City of Bradford. Thepartnership comprised Yorkshire Forward, the Government Office for Yorkshire &The Humber, the National Urban Forestry Unit (NUFU), the five local authorities thatmake up West Yorkshire, and some 15 other institutions and organisations who had acommitment to or an interest in delivering the Forest on the ground (Simson in press).To date, this list of partners has remained the same, although several other localauthorities have expressed an interest in joining the partnership.
The mission statement for the White Rose Forest states that it is to “create a genuinelysustainable well-wooded landscape which will benefit the people, economy and wildlifeof (West) Yorkshire” (NUFU 2000). This would be achieved by establishing three coreaims:

242
Economic aims - to improve the environment of (West) Yorkshire, as a means ofincreasing the region’s capacity to attract and retain successful businesses by:- Creating a more attractive setting for housing, business and commerce;- involving the business community in planning for new woodland;- giving priority to areas identified for future development;- including economic, training and employment objectives in the planning and
design of woodland projects; and- helping to market local wood products.
Social aims – to involve local communities in site identification, planning, planting andaftercare by:- Encouraging and promoting safe and easy access to woodland;- helping community groups to identify sites and to plan, plant and manage trees and
woodland where appropriate; and- consulting with local people when planting is proposed by WRF partners.
Environmental aims - to increase the quality, quantity and physical continuity of tree andwoodland cover in (West) Yorkshire, on a scale that will improve air quality, stabiliseand reclaim dereliction, reduce the risk of flooding and enhance bio-diversity by:- Protecting and enhancing existing woodland areas of conservation value;- respecting landscape character when designing new woodlands;- assessing sites for existing archaeological, historical, ecological and social value;- selecting plant species which are appropriate to the local landscape;- targeting resources to the priority areas; and- relating the White Rose Forest to national sustainability indicators.
Of vital important was the fact that this strategy was wholeheartedly politicallyendorsed by Graham Hall, the Chairman of Yorkshire Forward, and in particular theeconomic benefits that would accrue from the project. He said: “The future economicsustainability of Yorkshire and Humber is linked directly to the quality of life of localpeople, and the environment plays a vital role in both. A greater investment in theplanting and management of trees and woodlands will bring all kinds of benefits, fromcleaner air and more accessible wildlife, to the reclamation of wasted land and reducedstorm-water flooding. The fortunes of the region are bound to improve as aconsequence.” (NUFU 2000)
The management of the project
Responsibility for running the WRF is taken by a Steering Group and DevelopmentTeam, chaired by the author. This meets every other month and is supplemented byquarterly meetings of a Land Use Survey Group, an External Funding Group and The

243
Development Officer Management Group. A Development Officer has been in postsince January 2000, and he is responsible for collating the annual planting programme,liasing with appropriate grant-making organisations, and drawing up a Business Planfor the Forest, in consultation with the project partners. A standard price of £12,000/ha. (approximately 19,675/ha.) has been agreed between the partners for theestablishment of new woodland. This guarantees funding for a five-year establishmentperiod, and although the cost may seem high, it does include a contingency sum of£5,000 ( 8,195) which can be claimed should poor site conditions demand additionalinvestment to ensure that robust woodland is quickly established. Community liaison isparticularly important, and to help with that task in the multi-ethnic communities ofthe industrial areas of Yorkshire, the White Rose Forest leaflets have been produced ina number of ethnic minority languages.
The Development Officer has a heavy workload, and in September of this year,funding was secured to appoint a White Rose Forest Partnership Manager, initially fora period of a year, to take on some of this load, but with the additional remit topromote the project politically and commercially.
Priority areas for planting have been identified, which include:- Transport corridors;- river valleys;- the old coalfield area;- extensions to existing local initiatives;- areas of social and economic deprivation; and- potential links between significant existing woodlands.
Future developments
Thus, significant achievements have already been made, but what of the future? It wasalways envisaged that it would take a generation to achieve the White Rose Forest, andalthough the momentum is building up, the amount of new planting achieved to date islower than had been hoped, only 44 ha of new woodland having been planted betweenthe 1998/99 and 2000/2001 planting seasons. The Foot and Mouth epidemic in theUK during the spring and early summer of 2001 was partially responsible for these lowfigures during the last planting season, because access to potential planting land wasprohibited. However, the momentum is building up with the 2001/2 season’sprogramme being about 40 ha, and the figures for 2002/3 and 2003/4 are provisionally54 ha and 60 ha respectively.
It has also proved necessary to draw up a legal agreement between the partners,primarily so that the White Rose Forest can access grant aid for tree planting or
C=
C=

244
research purposes. It is also a useful cement to bind the Partnership closer together incommon purpose, which in turn assists the promotion of the project as a single entity.Finding a form of agreement that was acceptable to local authorities, public limitedcompanies, voluntary organisations and charitable bodies has not been easy, but a JointVenture Agreement has been drawn up. A final draft will be agreed by January 2002,and a high-profile media event will be staged in the spring of 2002 to re-state thecommitment of the various partners to the project and to raise the political profile ofthe project in the region.
Such activity is of crucial importance to the future success of the White Rose Forest. Itis sometimes hard to persuade local politicians of the economic merits of a projectsuch as the White Rose Forest. Large or regional scale environmental improvementinitiatives such as this find themselves in competition with demands for funding fromother large-scale projects, such as new business or commercial start-up support,infrastructure or transport projects, and it is becoming increasingly necessary to be ableto justify environmental improvement investment programmes in terms of theeconomic benefits which will accrue as a result of their implementation. In otherwords, in order to secure appropriate levels of resourcing, both financially and in termsof land-use allocation, for regional-scale environmental improvement works, includingurban forestry, there must be a sound economic rationale behind the proposals. TheWhite Rose Forest has begun to do this. Figure 1 indicates the potential contributionsthat the White Rose Forest can make to Yorkshire Forward’s Regional EconomicStrategy (RES). Selected objectives from the RES have been chosen to illustrate themost significant contributions that the WRF can make.
In order to deliver these significant contributions, and to progress urban forestry on aregional scale, the spectrum of people with whom urban foresters should be involvedextends far beyond what might be termed ‘urban tree people’. It is likely to involveliaison with political and professional colleagues who, in the normal run of events,might not consider themselves to be ‘pro-urban trees’.
One such liaison has occurred between the White Rose Forest Partnership and aregional organisation known as Concourse, a registered charity dedicated to the supportand promotion of multi- and inter-disciplinary professional working in theconstruction and design industries. The dialogue with Concourse is significant, becauseConcourse has had discussions with the Council for Architecture and the BuiltEnvironment (CABE), an organisation set up by the government to take over much ofthe role played by the Royal Fine Arts Commission in championing good design in thebuilt environment. Part of CABE’s remit is to set up Regional Centres for the BuiltEnvironment, in conjunction with all the professional institutes associated with the

245
Objective 3: to attract and retain more investment by providing the right product for investors andmore effective marketing of the Region:
Deliverables: Delivery through the WRF:A) Market the Region more effectively: Woodland planting to improve the major
transport corridors, eg. targeting key sitesalong the motorway network with theHighways Agency.
B) Increase inward investment: Promote Yorkshire as an increasingly greenplace to live and work.
Objective 5: Implement targeted, community-based regeneration programmes to improve the livingstandards of the Region’s most deprived communities:
Deliverables: Delivery through the WRF:A) Develop sustainable neighbourhoods: Working with local communities to improve
their local environment
C) Increase the capacity of individuals, Through participation in the development local groups and businesses to be and delivery of schemes, and the acquisition effective partners, to influence of skills and experience. decisions and to participate in Regional initiatives:
D) Regenerate the region’s town and Through street tree and city centre city centres: arboretum projects, contributing to high-
quality urban landscapes.
E) Encourage community enterprise: Work with local Groundwork Trusts oncommunity enterprises ( eg Wakefield andthe proposal for a Community Forester.
Objective 6: getting the best out of the Region’s physical assets and conserving and enhancing itsenvironmental assets:
Deliverables: Delivery through the WRF:C) Optimise the availability of land The establishment of a wooded landscape and property for business: infrastructure, contributing to the supply of
high-quality sites for development.
E) Protect and enhance the Region’s Directly through woodland establishment on environment: disused and derelict land, and indirectly
from the environmental benefits of treecover (eg. improved air quality).
G) Promote initiatives to make better The establishment and management of use of natural resources: woodland for recreational use and the
sustainable harvesting of woodland for
Figure 1. Selected objectives of yorkshire forward’s regional economic strategy deliverable by theWhite Rose Forest (WRF).
246
built environment, as well as networks of artists and other agencies. This was one ofthe recommendations of Richard Rogers’ Urban Task Force, and was endorsed by thegovernment’s Urban White Paper (DETR 2000). The likely location for the Yorkshire& Humber Regional Centre is Leeds, although there will be several satellite centres inother towns and cities around the region. There is cross-party political backing for theproject, and urban forestry and the White Rose Forest Partnership have been in on theground floor of these negotiations. The application and bid to CABE for setting upthe initial phase of this centre was submitted on 31st October 2001.
Conclusion
In conclusion, it was always intended that, as well as providing a catalyst for the social,economic and environmental regeneration of the Yorkshire Region, the White RoseForest would act as a forum for the partners to exchange ideas, experiences andinformation, and to provide opportunities for cross-authority, multi-disciplinaryworking, training and research. Indeed, this was deemed to be essential, if progress wasto be made in promoting urban forestry within the region and expanding its influence.It has taken a while for this sort of activity to get off the ground, but initiatives havestarted to develop. One such initiative that will hopefully bear fruit in the future isinvestigating the concept of ‘green asset management’.
All local authorities in England are required by central government to draw up anAsset Management Plan, which is reviewed annually. In assessing which assets shouldbe included in the Plan, two questions are asked. First, “is there a maintenance liabilityassociated with the asset?”, and secondly, “is there an opportunity cost associated withthe holding of the asset?” To date, this has been defined narrowly, and it is only reallythe property portfolio of the local authority that features in these Asset ManagementPlans, together with prime areas of developable land, if there are any in local authorityownership. There are plans however to include other structures, such as bridges,possibly public squares, art treasures and museum artefacts, and stocks and shares. Butnot trees, or woodlands, or urban green space generally. Why not? The selection criteriathat deems what can be included in an Asset Management Plan would certainly applyto trees and urban forestry.
Research and discussion within the Partnership have agreed that the economic value ofa piece of commercial real estate depends just as much on where it is, as what it is. Inother words, location is everything, and it can be responsible for up to two thirds of thevalue of a commercial asset. Urban forestry can help to create location, and in somecases, makes it entirely. Thus trees and urban forestry deserve to be included in everylocal authority’s Asset Management Plan, indeed it must if the concept of urban

247
forestry is to be accepted as a prime mover in the regional or local regeneration game.It will be interesting to see whether progress can be made with these discussions, andwhether they turn out to be a good example of multi-disciplinary, cross-authorityworking and research.
Professionals involved in urban forestry should understand the benefits of multi-disciplinary working, and the creativity of the shared experience. We sometimes needto work hard at fanning the embers of the sort of productive relationships betweenindividuals, groups or partners that cannot be easily defined, or legislated for, ororganised or monitored, but where there is nevertheless a genuine delight in the cultureof the shared experience and the resulting progress made. If such a workingrelationship can be achieved within the White Rose Forest Partnership, then it couldwell become a powerful model of an urban forestry-stimulated catalyst for regionalregeneration for other regions to seriously consider.
References
DETR (1998).
The Regional Development Agency Act. Department of Environment, Transport& the Regions, London.
DETR (1999).
A better quality of life: A strategy for sustainable development in the UK. London.
DETR (2000).
Our towns and cities: The future – delivering an urban renaissance. November2000. Department of Environment, Transport & the Regions, London.
Forestry Commission (1998).
A focus for England’s woodlands - Strategic priorities and programmes: 16.Forestry Commission.
Groundwork Wakefield (2000).
The West Yorkshire Forest: A strategy report. Groundwork Wakefield.
LMU (1998).
The state of the region, A report for the Yorkshire and The Humberside RegionalDevelopment Agency. Leeds Metropolitan University, European Regional Businessand Economic Development Unit, Leeds.
NUFU (1999).
The West Yorkshire Urban Forest : The planning context for a West YorkshireStrategy. National Urban Forestry Unit, Wolverhampton.

248
NUFU (2000).
The White Rose Forest: A strategy for urban and rural renewal in West Yorkshireusing trees and woodland. National Urban Forestry Unit, Wolverhampton.
Simson AJ (in press).
Regional Regeneration and the White Rose Forest. Paper given to IUFRO’s 4th
European Forum on Urban Forestry, May 2000. Durham, UK. Proceedings.
Yorkshire Forward (1999a).
Yorkshire and Humber Regional Planning Guidance: 58. Yorkshire Forward, Leeds.
Yorkshire Forward (1999b).
Turning the vision into reality: A regional economic strategy for Yorkshire andHumber. Yorkshire Forward, Leeds.

249
Challenges of Neighbourhood Participation inCity-Scale Urban Green-space Planning
Ann Van HerzeleVrije Universiteit Brussel, Department of Human Ecology.Laarbeeklaan 103, B1090 Brussel, Belgium
Abstract
This paper deals with an unique example of how an active strategy of internal andexternal negotiation together with the early involvement of public actors led toconsensus for creating a new 17 ha park in a former railway yard in the city ofAntwerp (northern Belgium). Comparable experiments abroad have shown thatinvolving the public in large-scale urban renewal plans is quite problematic. The mainobstacles are the multiple-level interests, the diversity of stakeholders, the long timespan and the abstract level of the discussions. In addition, it is difficult to provide anoverview of the large scale of this project with its somewhat unlimited possibilities andalternatives. In an attempt to cope with these problems, informal participatoryworkshops involving ‘key actors’ were organised parallel to and interactively with theformal visionary process. The aims were to generate a creative input from the publicand to initiate a participatory process in the long term. Based on these experiences, thispaper aims to summarise and discuss a vision on the approach of participatoryplanning for large-scaled urban greening.
Key Words: urban greenspace, public participation, greenspace planning.
Introduction
The participation of people in shaping their local environment plays a central role inthe creation of liveable neighbourhoods. Although there is a trend to base planningprocesses on broad discussion and an interactive dialogue, and the number of groupsgetting involved and their powers are increasing, individual citizens hardly get a chanceto participate in this market of negotiations. The willingness of local authorities toprovide space for them to take part in the planning process is often limited to the levelof their direct living environment. Consequently, projects planned on a higher level -for example where city issues are at stake - often lack public understanding because theimpact on the surrounding neighbourhoods is neglected. On the other hand, well-meaning attempts and experiences have shown that involving the public in large-scaleurban renewal plans is quite problematic. The large scale of the plans bring manyobstacles to effective public involvement such as the diversity of the stakeholders, the

250
multiple levels of interest, the long time span and the abstract level of the discussions.In addition, it is difficult to provide an overview of the large scale of the project withits manifold possibilities and alternatives. This paper addresses possible approaches toacting and organising in the face of those obstacles related to the complex situation ofa the visionary process for an urban renewal project in a former railway yard in the cityof Antwerp. The case was chosen as it demonstrates so many challenges shared muchmore broadly.
Study context
The planning process concerns a former railway yard (24 ha) which is situated in thenorthern part of Antwerp, the district of Antwerp North (Flanders, northernBelgium), between the city centre and the port of Antwerp. The surrounding, densely-built neighbourhoods provide housing to over 35,000 inhabitants and are characterisedby low income levels, unemployment, high percentage of migrants, poor urban designetc. In addition, a recent study (Van Herzele et al. 2000, Van Herzele & Wiedemann inpress) showed that the neighbourhoods of Antwerp North are the most problematic inthe supply of green spaces on different functional levels.
In April 2001 the city government established a three step planning procedure. In thefirst step an internal consensus was reached on the future role of the area and thepreconditions for development. The largest part (17 ha) was designated to become apark and the remaining area in the western side for business development. In autumn2001 a successful external negotiation with the property owner, the Railway Company,was finished. In the third step the city will conduct the further project development inco-operation with other parties involved. Activities in this phase will be the clean up ofthe soils, the draw up of the land use plan and the organisation of an architecturalcompetition.
This paper deals with the first step of the planning procedure in which the city aims tocreate clarity about the objectives and to “speak with one voice” during the externalnegotiations. It particularly draws on the experiences from the study ‘Groen op hetSpoor’ (Van Herzele 2001) which was commissioned by the city authority to supportthe visionary process. This study was meant to provide essential elements for theunderpinning of the park idea, as well as to answer the many questions on where andwhat kind of greening should be developed. In the framework of this study aparticipatory approach was developed with the aim to generate a creative input fromthe public and to initiate a participatory process in the long term.

251
Critical issues and obstacles to effective involvement
To develop an appropriate approach this study started to consider a range of criticalissues in large-scale planning contexts. These issues make social interaction and moreparticularly the engagement of the wider public most difficult. The overview is basedon the exploration of comparable experiences elsewhere and the observations made inthis case. It seemed that even in largely different contexts, planning in large-scale urbandevelopment shares many challenges.
Many alternatives
Large-sized open spaces, especially when located in densely built areas provide asomewhat unlimited array of possibilities and alternatives for development. Incontrast, there is limited room to manoeuvre, as urban development increasingly needsto act in a market-led world where productivity and financial benefits are in the centreof attention. In this context the creation of greening is often seen as a visuallyattractive adjunct or as an environmentally conscious backdrop to development ratherthan as a necessary element to support the quality of life. In addition, the shift in land-use policy towards a more compact city form puts first pressure on those open spaces,which have so far remained undeveloped. In many examples the conflictingrequirements of providing space for business, housing and infrastructure and thedemand of the residents for green spaces have constrained the participation process asthe polarisation of those demands has deadlocked communication.
Multiple-level interests
Even when green space creation gets a serious chance in the development processconflicts of interest are likely to arise from the wide range of claims for attention. Incase of large development areas the geographical area of interest is not easilyrecognisable to both local authorities and inhabitants. Empirical studies do assume thatgreen spaces fulfil different functions at different levels (see: Van Herzele &Wiedemann in press). City parks, for example, may have significance to the totality ofan urban area for recreation, while at the same time they have a strong connection withthe very local popular culture and social life. In a participatory process dealing withlarge spaces, conflicts may arise between the everyday needs of the immediatecommunity and the demands of the larger community. In addition, there often exists adrive to use urban development (including city parks) as a prestige object and even as amarketing promotion feature, presenting the city as attractive for investment, tourismetc.
Complexity in decision-making
Decision-making involved on the level of large developments, which is a very strategicone, is inherently political rather than technical. Planners might be strongly influenced

252
by political pressures and external circumstances such as budgetary constraints ratherthan being driven from an articulated view of community needs. Moreover,negotiations operate in a multiplicity of formal and informal arenas and micro-processes within institutions and among local business interests may play a prominentrole. The complexity and confidentiality of negotiations and the unpredictability ofoutcomes are extremely difficult to manage in face of the public. On the other handlack of openness may cause uncertainty and distrust among the public andconsequently block their willingness to participate.
Abstract level of discussions
A common question in participatory planning is the difficulty to engage people withstrategic level planning where issues are discussed at a higher level of abstractionwithout being made concrete in practical measures. Many examples have shown thatonly when plans become tangible or conceivable participants become active. On theother hand, planners may feel hindered when too detailed issues are raised at this levelof general strategic choices.
Long time span
Involving people in a planning process does arouse expectations and hopes for thefuture. In the case of a large-scale development, realisations in the field will probablyonly become visible after many years. Continuation in communication over such a longtime span is difficult to organise and is often constrained by a loss of engagementamong participants. Moreover, on the short term local residents will be confrontedwith the inconveniences caused by works in the area, which may also be conductive toits negative image.
Vision on the participatory approach
Following the objectives of the study and in response to the described methodologicalchallenges, a vision on the overall approach was developed. It is described using fivekey characteristics. In an effort to make the vision on the approach more concrete, thedescription of each refers to practical experiences from application in this case.
Defining the area’s role as a whole
It was seen as crucial to first decide on the role and main function of the area as awhole by means of describing clear alternatives from the very beginning of theprocess. In the case of Antwerp North many uncertainties have arisen about the newrole of the railway yard during the past years. Residents and neighbourhood groupshave been requesting a park for several years. Within the city departments, however,diverse development scenarios have been proposed ranging from industrial

253
development or the construction of a road to the creation of a park. It was decided toassess the main scenarios using a Geograhical Information System (GIS) tool for thedetection of their impact on the supply of green spaces on different functional levels(see: Van Herzele & Wiedemann in press). In a first step the deficiencies of greenspaces’ supply within the potential ‘catchment area’ of the railway yard were assessedon two functional levels (city quarter or 800 m and city district or 1600 m). Next asimulation exercise was carried out using the different development scenarios discussedduring that time. The results were linked to the demographic data of theneighbourhoods located within the catchment areas. The results were discussed in thefirst ‘Thinking Day’ of the formal visionary process (see the next paragraph). Based onthe quantitative results, the participating officials were given the choice between a parkwith importance for the surrounding neighbourhoods or a park with importance for aconsiderable part of the city. The latter opinion was adopted, which means that it wasdecided that the park should have an unbroken surface of at least 10 ha and green-space should be the dominant function of the former railway yard. Supported by thisdecision, the planners were able to develop a first planning concept, which waspresented for discussion in the first participatory workshop.
The experience from this case was that the visualisation of the impact of the differentdevelopment scenarios has helped the city officials to see how the proposed scenarioswill change the deficiencies and has supported the choice for the park idea as the mainfunction of the area. In this very early planning phase the quantitative assessment usingGIS has worked as ‘strategic ammunition’ leading to quickly balancing a series ofcompeting claims and interests by quantifying the more ‘intangible’ benefits of urbangreening. Moreover, the decision made about the park scenario in the first ThinkingDay has allowed for a more open discussion in the workshops about the park qualitieswithout arousing false hopes.
A parallel process of formal and informal visioning
The visionary process established by the city government used the format of three‘Thinking Days’. Administrators from different city departments as well as politiciansand external experts were invited by the city planning team to develop a shared visionon the function of the area and to set preconditions for development. During themeetings the city officials worked together in prioritising between often conflictinggoals (e.g. the demand for housing provision, the adequacy of transportation, the city’svision on economic development, the lack of green-space) and in negotiating aboutthe proposed planning concept for development using feasibility requirements. Parallelto this internal negotiation forum two participatory meetings were organised within theframework of the ‘Groen op het Spoor’ study. In contrast with the formal visionaryprocedure, these meetings operated with a creative orientation, involving ‘key actors’

254
for discussion in ‘Creative Workshops’. About forty people collaborated, beingrepresentatives of neighbourhood groups, local schools, ethnic minorities, publicagencies (culture, sports, housing, crime prevention, sustainable development, etc.),business actors, regeneration practitioners, health workers, youth workers, a priest, andso forth, and independent local residents as well. The objective was to create a free andinformal setting which could provide distance from pressures: no decisions to make,no interests to defend etc., and give participants greater freedom to pursue ways ofthinking. At the beginning of the first workshop the city planning team presented theirfirst conceptual ideas which were used as a starting point for discussion. During thesecond workshop the planners presented new ideas and solutions in response to theoutcome of the first one and raised issues to be explored more in detail in workshopactivities. A constant and main concern of the ‘Groen op het Spoor’ study has beenthe interaction between both processes and in particular the implementation of theideas from the workshops into the formal process. However, as the outcome of theCreative Workshops could not be predicted - some scepticism was even apparent in theplanning team - implementation could not be foreseen at the outset. The outcome wassuccessful and was taken on board by the planning team in producing their planningconcept and it was decided to present the workshop results in the third Thinking Day.There the ideas from the workshops were welcomed as ‘high quality’ and it wasdecided to also include the workshop minutes into the Consensus Note (2001), whichwas the end product of the visionary process. As a formal document it was approvedby the city government in September 2001 and has gone through the externalnegotiation process in October 2001
In this case, the parallel construction allowed for flexibility, improvisation andreflective reasoning both in the concept development by the planners and theorganisation of interactions between the two processes. The creative workshopapproach has enabled to interactively build rich ideas, to freely exchange interests andconcerns within a wide scope of possibilities and in direct contact with theprofessionals. A main element is that such settings are more likely to provide quick andoptimal results as polarisation of interests is less likely to occur. Furthermore, theoutcome could provide a creative input to the formal policy forum where moreinstrumental and rational considerations were dominating the discourses. However, theinformal forum was not always able to stay clear from strategic considerations. Thiswas particularly clear where the desirability of business development in a part of thearea was discussed. The participants felt that they had to anticipate the externalnegotiations with the property owner by providing the necessary feasibility conditions.
Mixed level involvement
In the context of a large-scale development it is important to simultaneously

255
concentrate on small areas of neighbourhoods and gain insight in the wider strategiccontext. Therefore, it has been the purpose from the start to encourage local actors tothink beyond their own circle of neighbourhood relations and to link actors operatingat higher city levels (e.g. involved in tourism, cycling routes, cultural heritage) with thediversity of local situations. The creative workshops were designed as a mixed levelnegotiation platform for people to identify with interests and considerations atdifferent city levels (from very local to city level). The multiple level interests wereclearly reflected in the discussions during the workshops. Considerations weresimultaneously given to a variety of functional levels ranging from the surroundingneighbourhoods to the whole city and even wider. High hopes were expressed, forexample, for the fact that the development of a park in this area should turn thecurrent negative image of deprived neighbourhoods into a positive one. It wasgenerally taken for granted that people from outside the surrounding neighbourhoodsshould be attracted to the park. This should make the neighbourhoods more importantwithin the context of the whole city. However, an important precondition was that thewider level is not equal to large-scaled functions or events. The balance between bothlevels needs careful attention so that the park will be both of significance in the everyday life of the people who live nearby and a valued symbol of where they live.
From participants’ reactions after the workshops it became clear that the mixed levelapproach has had a learning effect in widening participants’ perspectives. Existingrelations were seen in a different context and this has influenced the content of thediscourse. Moreover, participants have not only begun to see another’s point of viewbut also could break away from assumptions taken for granted about each other’s waysof thinking. City officials were surprised, for example, that the locals were thinking in amuch wider scope than they had expected and vice versa, local residents were surprisedthat officials working at the city level were thinking along the same lines as they do.
Focus on the quality of discourse
In a planning process where place creation is the clear purpose, people’s involvement isnot only about the creation of a collectively shared vision but also about the goal ofusable changes worth making and to reach acceptance towards action. In the casedescribed here, the quality of discourse was seen a main argument for implementation.Therefore it was the aim to undertake great efforts to stimulate the creative input fromthe workshop participants. The variety of participants was seen as a first element tobring in a diversity of knowledge and life experiences generating a rich and creativediscourse. It was aimed to cover the main interests and controversies (leisure, sports,health, safety, youth, ethnic minorities etc), as well as to bring in people with a keyposition in neighbourhood surveillance, cultural events, schools, social welfare work,city tourism etc. About sixty people were personally invited and actively encouraged to

256
participate in two workshops. As a second element an informal setting was intended tostimulate a constructive debate. Interaction in small groups was used to encourage awide range and form of understanding, to facilitate the expression of ideas, toilluminate different perspectives through debate within the group, to avoidpreconceptions about the plan and to involve people more actively. Not everyone canbe expected to easily engage themselves in the abstract, conceptual and systemisedreasoning of plan making. Therefore, in the workshop approach it was seen asimportant to make room for manifold sorts of reasoning such as topic-oriented ordetailed reasoning as well as reasoning on the whole picture. Although the proper wayis to plan before designing and to design before managing, in this early planning phasepractical reasoning on design or even management was not denied. In order to makethe size and form more concrete, connections with the neighbourhoods werevisualised by means of street plans on which the walkable area (400m) around theproject was shown and participants were asked to draw attractive routes to the futurepark. To stimulate the brainstorm sessions, copies of the conceptual ideas andprovocative images of park characters were also used. Outcomes were discussed in aplenary feedback meeting. In addition, contact with the planners during the workshopswas considered an important pre-condition toward the implementation of ideas.Careful observation and reflection have enabled the planners to be responsive to theconsiderations and ideas expressed. In addition, much attention was given to thewriting of the minutes as a supporting tool for implementation.
In this case, the planning team has welcomed the workshop discussions as veryconstructive, providing them with new ideas as well as supporting them in their ownideas. Moreover, the output from the workshops has provided a wider base from whichto argue during the Third Thinking Day of the formal visionary process. Althoughthere was general agreement on the quality of the output, some critical notes wereexpressed on the ‘representativeness’ of the ideas. The workshop participants whoshowed a more than average interest in public policy, did not really represent thegeneral public and its average concerns and preferences. Another question emergingfrom the experience is the extent in which the discussion needs to be framed at theoutset. Some of the participants felt that the first conceptual ideas presented by theplanners at the start of the first workshop limited their creative thinking during theworkshop discussions. In contrast, others expressed that those ideas stimulated theircreative thinking. A clear limitation, however, was the short time span of the process.Processes of creative thinking need time. It seemed that during these two workshopsseveral problems, options and ideas were left unexplored. On the other hand it is notrealistic to expect participants to engage in long procedures as they might be too costlyin terms of the time and the energy the participants have to invest.

257
Balancing openness and confidentiality
Openness during the whole process, from initiation to implementation andcontinuation is a pre-requisite for building trust among the public. A challengetherefore exists in bringing people into the participatory process at the very early stagesof project development. Involving the wider public early in the process requires a highdegree of openness which, however, is not always felt as being desirable in planningfor large-scale development which is inherently strategic. In the case described theplanning team was initially hesitating to open the doors for citizens as this couldpossibly affect the negotiations with the railway company and arouse false hopesamong the local residents about the creation of a park in that area. Finding a balancebetween openness and confidentiality of information has been a continuous subject ofdiscussion in the framework of the ‘Groen op het Spoor’ study and between the city’splanning and communication departments. It was only from the moment that the parkscenario got accepted by the officials participating in the first Thinking Day that theyagreed upon the workshop approach in the ‘Groen op het Spoor’ study. Later on thediscussion continued when the Consensus Note was made: what information can begiven to the wider public and when? Then, the city’s communication department tookon an active role and organised an exhibition for the wider public. After heated debateit was decided to display the entire concept, along with a request for ideas, opinionsand further questions. The exhibition was concluded with a ‘talk café’, an informalpublic meeting where representatives of the city authority and railway company werebrought together in a panel and were asked to react to the issues raised during theexhibition and in the public meeting held at a local café. After the external negotiationsmore room was given to providing information more widely. Since then, the media areactively involved and the residents are regularly informed about the plan making bymeans of leaflets. Recently, a ‘Planning for Real’ event was organised in which almost200 people participated in providing their ideas about a range of design questions.
Residents responding widely and enthusiastically to consultation does not usuallyhappen as a result of one-off participatory events. In the long term the objectiveshould be the infusing of ideas into the wide array of social networks. So far, a clearvision and active strategies on how to draw attention from a wider public are lacking.Wider forums, such as the organisation of the interactive exhibition createopportunities for generating new ‘members’, new ideas and feedback. However, asthere was no strategy followed to establishing links with institutions (e.g. schools, socialwelfare work) and neighbourhood associations, only a limited section of the public wasreached. In this case, it also appeared that residents who were already participating inthe workshops or the exhibition, showed a range of expectations, uncertainties andeven distrust about their real impact. The further development of the plan has to paycareful attention to continuation of effective communication. This is not an easy taskin a context where political and external pressures as well as uncertainty about further

258
internal co-ordination make the further process less transparent. Also the legal contextmay not be favourable to participatory approaches, for example, the internationaldesign competition’s rules exclude citizens from taking part in the evaluation of thedesign proposals.
Conclusions
The purpose of the participatory approach in this case was not to confront interestsand viewpoints with each other and to reach a compromise, but to move peopletoward a common understanding of the issues and to create a sense of shared goals.The reactions from participants after the workshops suggest that a commonunderstanding was a significant outcome. Through this process of making sensetogether, no one set of interests was predominating the discourse and the ideasexpressed were linked up with the realities of local situations. However, as planninginherently seeks to connect knowledge and ideas to action, implementation to makethem true is the real challenge. This case has shown that much strategic power of thevisioning lies in co-ordination: the careful preparatory work and the flexiblemanagement of this intensive visionary process by a handful motivated people fromthe planning department as well as the elaborate workshop design in the ‘Groen op hetSpoor’ study. Most important are the exploration of the context in which approacheswill be practised - which includes sensitivity to how social interactions and settings mayshape the outcomes of participatory activities - and a flexible process management inorder to integrate participatory outcomes with policy making. Flexibility wasparticularly important as objectives and targets were an output rather than an input tothe process. In addition, a constant attention for new information and ideas that ariseduring the process is required.
The most powerful tool for implementation, however, has been the quality of thediscourse. Quality of discourse very much depends on the quality of the participants,the richness of their ideas and the way they are articulated, argued and mediated. Thehigh quality mutual work of workshop participants and planners has resulted in apowerful strategic idea, which has gained acceptance among the decision-makers and ison its way to enter popular consciousness.
The experience from this case, however, is limited to the very initial stage of visioning.The local population represents a huge potential, so far largely untapped, to delivercreative ideas, skills and manpower to contribute in the further planning, design andmanagement of the new park. The challenge will be to explore and develop possiblelinkages between the idea development in formal planning and day-to-day processesnot labelled officially as planning and designing. In addition, concerning the long time

259
span of the project, it is important to create a positive atmosphere around the project,showing people that things are changing and progress is being made. Nieuwinckel(1996) notes that a stimulating image of the city is needed to enable continuation ofthe creative generation of solutions: giving a positive meaning to urban culture is animportant part of this.
Each planning process based on consensus building will be unique in its organisationstructure and will require particular mechanisms at various stages for involving localpeople in the development process. Nevertheless, it is hoped that some general lessonscan be learned from this case and that its experiences will contribute to planning forurban greening that will no longer remain the exclusive domain of experts andauthorities, but will become a playground for all those it is designed to serve.
Acknowledgements
The ‘Groen op het Spoor’ study was carried out within the framework of the project‘Visieontwikkeling Spoorwegemplacement en Omgeving’ and financed by the ‘FederaalProgramma Grootstedenbeleid 2001’. The author would like to thank all the workshopparticipants, the planning team and the regeneration department for collaboration inthe activities and helpful feedback.
References
Herzele A Van (2001).
Groen op het Spoor (Green on the Rail). Supporting study in: OB/planningscel..Het grootstedenbeleid van de federale regering. Spoorwegemplacement enOmgeving. Consensusnota, October 2001.
Herzele A Van, Wiedemann T & Overmeire M Van (2000).
Stedelijk Milieu (Urban Environment). In: Steertegem M Van (Ed) Milieu- enNatuurrapport Vlaanderen MIRA-S 2000. Vlaamse Milieumaatschappij & GarantUitgevers NV, Leuven/Apeldoorn.
Herzele A Van & Wiedemann T (in press).
A Monitoring Tool for the Provision of Accessible and Attractive Green Spaces.Article accepted for publication in Landscape and Urban Planning.
Nieuwinckel S (1996).
De Wonderjaren Voorbij? Wijkontwikkeling in Antwerpen. In: De Decker P,Hubeau B & Nieuwinckel S (Eds) In de ban van stad en wijk. EPO Berchem.
OB/planningscel (2001).
Het grootstedenbeleid van de federale regering. Spoorwegemplacement enOmgeving. Consensusnota.


261
Urban Forestry in India and Nepal
Klaus SeelandChair of Forest Policy and Forest Economics,Swiss Federal Institute of TechnologyZurich, Switzerland
Introduction
By the year 2025, it is expected that two thirds of the world’s population will live indeveloping countries and the majority of them in and around cities. Urbanisation is aphenomenon in history, a development process characterising the rise of civilisation allover the world caused by a social division of labour and the development of politicaland social institutions. Urbanisation in non-European cultures, particularly with theadvent of colonial expansion in the two Americas, in Africa and most parts of Asia,has been marked by a process of demographic and cultural change and in recentdecades by a rapid population growth. Whereas the pre-colonial capitals of those areaswere centres of state power and administration or the stronghold of tribal rulers, thesewere either transformed to colonial cities representing the culture of the new rulers, ornew settlements were founded that developed from fortifications and commercialtowns into colonial cities. Urban development itself often was, and with respect toeconomic globalisation still is, a legacy of European political domination andexpansion in overseas areas. Social inequality and political domination was thus astructural characteristic of colonial urban development in the South. Along with ratherstable political conditions during the period of colonial rule and the improvement ofhealth services, a tremendous increase of the population contributed to an even morerapid growth of large cities. During the 20th century there was a remarkable drain ofrural poor and landless people searching for alternative sources of livelihood to thecities. Settlements that were planned for a few thousands of inhabitants grew to largeagglomerations hosting millions of people living with inadequate infrastructure. Whenthe colonial period came to an end and the previous colonies became independentstates, urban growth still used to continue and often with a much higher speed thanbefore. Industrialisation and ambitious targets of economic growth encouraged peopleto move to the cities. Thus regional and social unbalanced development within thedeveloping countries accelerated.
Major problems of urban environments in developing countries
The deterioration of living conditions, living standard and quality of the environmentin urban and peri-urban areas in developing countries is not always perceived bymunicipal authorities as a deficient situation. It has become, however, an all-pervading

262
phenomenon they have to cope with. Crisis management tries to avoid the collapse ofthe metropolises and to provide at least the most vital and basic services to the publicsuch as electricity and water supply, waste and sewage water disposal, traffic, healthservices and security. Public administration has severe difficulties to meet proper urbanlivelihood standards due to a lack of finances and administrational capacities. Aninherent inertia of the administrational staff and the politically responsible decisionmakers who sometimes show a lack of motivation as only few believe that there is achance for a change for the better. This hampers the process of finding solutions tothe manifold problems connected to the administration of large agglomerations.Taking all difficult circumstances into account one must admit that quick solutions tothe vast field of problems for a public green space policy in developing countries arenot at hand at the moment. However, the situation aggravates silently and there isdefinitely an urgent need for solutions at almost any level of the problem scenario.
In a nutshell, the major problems of public green space management in urban areas indeveloping countries are:
As the situation varies to a great extent depending on the country one looks at, we willtake India and Nepal as examples for steps that have been taken at the political and theimplementation level. Both countries are located in South Asia, but vary in size anddegree of urbanisation as well as in many other aspects. They have a common Hindutradition, mentality and culture and share similar approaches to face the challenges ofurban green space management. Both countries in principle have a top-down-approachto the management of their nationalised forests and have recently turned to social andcommunity forestry schemes based on participation intending to favour a decentralisedand more democratic management of forests and forest resources. These participatoryapproaches have been, based on the experiences that were made in joint forestmanagement (India) and community forestry (Nepal), partly tried to extend to themanagement of urban green spaces as well. Firstly, let us have a look at India and thenat Nepal.
• increasing population rate / over-population• migration from rural areas to the large agglomerations• air (toxic gases, heat and dust) and water pollution• little problem awareness among the public• little or no support by politicians concerning green space and related matters• solid waste disposal problems• lack of hygiene and sanitation• poverty creates slum and squatter areas• encroachment of wastelands by in-migrating people from rural areas, mostly with
herds of domestic animals• lack of open free space in and around cities

263
Participatory urban green space management in India
Urban demographics in India in the 20th century show a tremendous growth.According to census data, The population of the 384 urban agglomerations increasedmore than ten times from approximately 30 million in 1901 to 307 million onehundred years later. In 2001 more than 30 percent of the Indian population lived incities and the official growth rate against 1991 was 41 per cent. The actual growth isgenerally suspected to be much higher. Unregulated growth due to immigration fromthe countryside to slums and squatter settlements that are inhabited by a large numberof unregistered people who are not recorded in any statistics.
The administrational set-up of public environmental management in India is dividedinto three levels: the Ministry of Urban Development (Indian Union) at the centralgovernment level, the State level, the district level and finally the level of themetropolitan authorities. The legal basis for environmental legislation at present is the74th Amendment Act to the Indian Constitution, 1992. It focuses particularly on urbanagglomerations, as they are the most relevant centres of economic growth andgeneration of surplus value as well as modern development. It allots particular politicalimportance to municipal bodies (power, competence and finances) with the objectiveof supporting local self-government through deregulation and decentralisation. In thisregard the 12th Schedule of the Indian Constitution enables municipal bodies toinitiate among other measures for, e.g.:
These initiatives are relevant sectors of planning and management as far as urbangreen space in the widest sense is concerned. There is a lot of management capacity,political responsibility and financial resources and competence involved, marking anempowerment of the municipal authorities. It is therefore important that they are nottoo disperse and distributed over several levels of public administration. The majortypes of measures that have been taken up in the green sector over the recent decadesare:
• urban planning• regulation of land use and construction of buildings• planning for economic and social development• water supply• public health, sanitation, conservancy and solid waste management• provision of urban amenities and facilities (parks, gardens and playgrounds)• cremation grounds

264
• Urban Community Forestry (e.g. in Ahmedabad, Gujarat)Urban community forestry is by and large an adaptation of the principles andpractices of community forestry to urban conditions. Major objectives are theexclusion of unauthorised land users, free riders illegally appropriating green spaceproducts such as e.g. flowers, fruits, fuel wood or leaf fodder, squatters encroachingon public green space, etc. The goal of urban community forestry is a joint manage-ment of the respective municipal authorities with the legitimate users (registeredgroups of tax paying town dwellers) who have been allotted with an area of greenspace in order to manage and to care for it. Usually they are entitled to usufructrights for a certain time that has agreed upon in a contract.
• Greenbelts (e.g. in New Delhi; in Hyderabad, Andhra Pradesh)Greenbelts around the metropolitan area or at the outskirts of the inner city, wherethere is no or only little space for public green areas, provide the agglomeration witha cordon sanitaire, a large green space surrounding the core built area with meadows,parks, broad alleys and forests on public land.
• Green Partnership Projects being a co-operation of NGO, industrial enterprises,Government Departments, and private and public international donorsGreen partnership projects are the most recent developments in the green space ma-nagement sector uniting institutions and voluntary agencies in their efforts tocontribute to the upgrading of public green space, providing funds and managerialexpertise under prevailing conditions of small administrational budgets.
These measures always link social and environmental objectives such as incomegeneration for the urban and peri-urban poor with tree planting, nursing, watering,protecting saplings, and so forth. Major objectives are poverty eradication and theimprovement of the environmental living conditions including air quality (by reducingthe number of old and extremely air polluting vehicles), solid waste disposal and thesupply of safe drinking water. Anti-land speculation measures and the upgrading ofwaste lands suitable for urban agriculture and urban forestry, mainly through fencing,afforestation and enrichment planting are important objectives in urban green spacepolicy and management. Women’s clubs, youth clubs and religious institutions areproviding opportunities for self-employment by establishing school gardens andnurseries, temple forests to enhance diversity of tree species and medicinal plants.India’s mega-cities such as Mumbai (Bombay) with 13 million, Calcutta with 11 million,Delhi with 9 million and Chennai (Madras) with almost 6 million inhabitants, tomention only the largest ones, are urban landscapes of their own. Excluding Mumbai,which is an exception due to its location on a rather small peninsular, they are verymuch outspread, including forests, pastures and agricultural land for horticulture and

265
livestock keeping for the production of dairy products. Much intensified industrialproduction areas and densely built service oriented housing quarters with a largeinformal sector absorbs lots of land and labour in urban agglomerations. Tocompensate for these living conditions in a hot sub-tropical country, this requires greenspace areas to provide air circulation and free space to roam around under shady treesin a cool breeze, where lawn and flowers counterbalance the monotonous townscapeof mostly functional buildings. The aesthetic requirements combined with practicalamenities matter a lot for the satisfaction of basic quality of life standards in a countrywhere a substantial part of the urban population lives below the poverty line.
Urban community forestry management in Nepal
Nepal is a landlocked country located at the southern slopes of the Central HimalayanRange covering an altitude between 70 m and 8,848 m above sea level and an area of147,181 km2. Since 1991 Nepal is a constitutional monarchy with a population ofabout 25 million people in 2000, who are predominantly Hindus, and an annualpopulation growth rate of 2.5 per cent. The country ranges among the economicallyleast developed with a per capita income of US $ 210. It is country with a remarkablerural-urban migration and a high rate of dependence on forest products of all sectionsof the population. With the new Nepalese Constitution of 1990, democratisation anddecentralisation was promoted all over the country. In 1993 a strong Forest UserGroup Committee movement based on (1) a strong tradition of independent villagecommunities, (2) strong self esteem of castes and ethnic groups, and (3) self-relianceand economic subsistence was encouraged by local NGOs, the newly establishedpolitical parties and international development donor support. The socio-culturalvalues and ecological traditions of highly independent mountain communities havebeen transferred to urban livelihood conditions during the last decade. Urban life inNepal, which is still mostly an agrarian country, has a more or less rural character.Cities, perhaps apart from the capital Kathmandu, being an agglomeration of severaltowns with an estimated population of about one million in 2001, are big villages. Thisfacilitates the transfer and application of community development and communityforestry programmes to urban areas.
The alienation of the population from natural renewable resources through the ForestAct of 1957 by which all forests were nationalised has been counterbalanced bydecentralisation and the local self-management of forests in the wake of thecommunity forestry programme. This programme was established for the first time in1978. It was tried to transfer the mostly good experiences with community forestry inthe mid-hills of Nepal to urban and peri-urban areas of central and southern lowlandNepal. Urban forestry is yet little developed and shares many of its problems withIndian cities, as the social and cultural conditions of both countries are rather similar.

266
Obstacles to sound urban forest management are a strong social hierarchy andinequality of status and power due to the Hindu caste system and corruption in theadministration is common. Transgressions to the protected urban forests of otherusers than those who are entitled to use and manage the forests in and around thecities is one major problem caused mainly by poverty and sometimes by the illegalappropriation of timber and non-wood forest products by traders. Another form ofmismanagement in the urban forestry sector is caused by wealthy and influential peoplewho illegally fell trees to construct buildings or cut access roads to their housesthrough urban forests or clear-fell plots of urban forests to convert them into buildingsites.
However, even if urban forest protection schemes work well, there is a danger offurther degradation of non-protected forests in the vicinity or that the poorest peoplewho rely most on irregular use of forest produce are excluded from their customaryrights of small-scale exploitation. Furthermore, access to forest user groups, rural orurban, is more often than not denied to the poorest and low status people. Thuscommunity forestry can be an ambiguous approach to protect forest as social equity isdifficult to be achieved. The possibility of turning the rural poor to even moremarginal people and make them living in a state of misery is something that has to bepaid attention to. If neglected, this may raise opposition, if not obstruction, with theincreasing portion of the lower and lowest urban as well as rural sections of thesociety. The intention of the community forestry programme in Nepal is, however, asfar as the present political circumstances allow, a socially equal, not individualappropriation of economic benefits. And not at least it heads for sustainability offorest management through re-investment of a reasonable portion of the profit drawnfrom the managed forests into seedling production, planting, fencing and patrolling.This is a commitment that is a contractual obligation and precondition for handingover a forest to a forest user group.
Conclusion
Urban forestry in India and Nepal, as in many other developing countries, is a domainof self-management or joint management of locally appropriated resources in whichsocial objectives in focus through and in combination with urban environmentalmanagement. Social cohesion is enhanced through co-operation of members of forestuser groups, neighbouring communities who care for the quarter’s green space, as wellas through government institutions and non-governmental organisations, national,regional and local. Administration is often by-passed, like in Nepal, where a lack instaff capacities slows down the process of democratising the forests or urban forestrytends to become a grass-roots movement such as in more and more municipalities inIndia.

267
One aspect that gets less attention with the rise of the community forestry programmeand the decline of commercial timber harvesting oriented forestry, however, is theaspect of national equity. The benefits of urban community forestry go primarily tothe immediate users and to people who feel concerned and participate actively in it.There is little or no nation-wide distribution or appropriation in the form of revenuedrawn from the forest, as was the case when forests were commercially exploited bythe state. Decentralisation and democratisation of forest use and management focuseson a more direct access to, use of and responsibility for forests and green space in acommunity’s surroundings. The political legitimacy of urban community forestry lies inits service to the whole urban society. It is not an exclusive appropriation of economicbenefits or profits, but meant to be a contribution to the urban society as a whole.Provided that town and country implement community forestry as a societalassignment based on broad co-operation, it may serve the quality of the forest as itmay benefit the society. The examples of India and Nepal show ample hope thatexclusive state administration may not be the only way to handle forests and urbangreen space for good, but that there are other ways of a socially and environmentallysustainable use and management of these common pool resources.


269
Informing the public about the ecological impactof different methods for road and pavementwinter maintenance in Vienna
Monika Sieghardt and Martin WresowarInstitute of Forest Ecology,University of Agricultural Sciences.Vienna, Austria
Abstract
For city administrations in northern and middle Europe a severe conflict existsbetween the public demand for unrestricted mobility during winter season and thedemand for keeping urban vegetation alive. On behalf of the municipality of Viennaan environmental compatibility evaluation of road and pavement winter maintenancemethods was carried out reviewing scientific and public literature and own respectiveresearch as well. Most de-icing products in trade are promoted as being ecologicallycompletely harmless even when containing hazardous chemicals. Users can sometimeshardly distinguish how the chemical declaration and recommended application dosescorrelate with actual application fields and temperatures and what is the ecologicalimpact of the concerned product. The study includes the following wintermaintenance products: Gravel and expended clay (EC); halogenides (NaCl, MgCl
2,
CaCl2 and mixtures), K
2CO
3; N-containing de-icers (ammonium sulphate and urea).
Model calculations based on the ecological impact of the concerned product and ondifferent settings like type and quantity of de-icer, tree size and soil surface area lead tothe following environmental compatibility ranking for different methods of winterroad and pavement maintenance:
Key words: de-icing–agents, eco-toxicology
Introduction
For city administrations in northern and middle Europe a severe conflict existsbetween the public demand for unrestricted mobility during the winter season and thedemand for keeping urban vegetation alive. In Vienna the use of common salt as de-
Gravel = EC >> EC+Urea = EC+K2CO3 >> ammoniumsulphate Urea K2CO3 >
NaCl+CaCl2>NaCl

270
icer is restricted by order. Especially on pathways, minor roads, playgrounds, bikingways and parking areas the use of alternative de-icers is encouraged. Some of thesealternative de-icing agents have a high nitrogen content.
In Vienna a municipal institution called Öko-Kauf Wien (translated as ‘ecologicalbuying Vienna’) exists. In the project, information is collected to make ecological-orientated decisions when buying different equipment or rolling stock. This institutionconsists of a changing number of administrative departments and working groups aswell as of experts for special fields, who can be co-opted according to necessity. Onbehalf of the city department for environmental protection, which is part of ‘Öko-Kauf Wien’, an environmental compatibility evaluation of winter road maintenanceproducts was carried out. Our task was to review the respective scientific and publicliterature as well as own research in that field. The output of this evaluation wasextended knowledge on the environmental impact of different road wintermaintenance practices. Results can be seen at the homepage of the department (http://www.wien.gv.at/ma22/pool/doc/auftaumittel_abs.pdf) as well as a public abstract ofthe main results to be included in an information leaflet for city inhabitants.
The review focuses on comparing ‘conservative’ de-icing agents like NaCl, or CaCl2
and MgCl2, and so-called ‘alternative’ de-icers like potassium carbonate and N-
containing de-icers like urea and ammonium sulphate. We tried to answer the followingquestions:- Which products are applied and in trade for winter road maintenance: what is on the
market?; which names are used?; how is the chemical declaration of these products?;what are the advertisement strategies of the traders?
- What are the fields of application for different winter maintenance products: what isused for highways, roads, airports, pathways, pedestrian zones, parking areas, bikingways, and playgrounds?
- How effective are different winter maintenance methods?- What is the ecological impact of different winter maintenance products?- Which figures provide a simple tree/soil model concerning the impact of
applications of different de-icers?
Traded winter maintenance products
Table 1 summarises some traded products for Austria and gives information abouttemperature limits and application fields. Gravel and expanded clay are the ecologicallymost harmless products, but they are ineffective in terms of traffic security. Moreover,they involve high removal costs and problems in the sewage systems and because ofdust emission they are not well accepted by the public. In terms of eco-balanceexpanded clay comes off worse than gravel, because of high energy input during

27
1
Product Production Constituents GrainSize
Appliedas
Applicationlimits
Dosesg/m
2
Application fields
Gravel quarry basalt, dolomite variabel - 250 pavementsroads
Expanded Clay clay burned at1200 °C
light expanded clay aggregates variabel - - pavements
Anti-Gliss clay burned at1200 °C
clay aggregates variabel 8 pavements
Salt rock- or seasalt Na+ (39,3 %)Cl – (60,7 %)
0,15-5mm
wet salt(brine)
- 8 °C 6-15 roadshighways
CaCl2 by-product ofsoda
Ca++ (28 %)Cl – (51 %)
3-3,5 mm wet salt(solution)
- 22 °C 10 roadshighways
DI-Mix mixture 70 % NaCl30 % CaCl2
3 mm dry - 10 °C 6-15 roadshighways
Streumittel G- 149 mixture 96 % CaCl2, 2% MgCl2,2 % NaCl
variabel dry - 22 °C 6 roadshighways
ICE-Remover Monroex-73, Ice-Melter,Arkas Eisfresser
mixture 91 % CaCl2, 9 % unsoluble variabel dry - 22 °C - roadshighways
Greeny Eisschmelzer,Floralis Streudas,
Eskimo
gravel + brine 85 % gravel, 15 % NaCl variabel dry - 8 °C 30 (roads), pavements
K2CO3 potash, potas-sium-hydroxide
K2CO3 0,15-3mm
dry - 5 °C 6,25 roadspavements
Leca-Tau Sole D,Polar-Ultra-Grip
expanded clay +brine
EC aggregates + 15 % K2CO3 variabel dry - 5 °C 3016
pavements
Leca-Tau, Öko-Tau expanded clay +brine
light expanded clay aggregates +(NH2)2CO
variabel dry - 7 °C 15 pavements
Polar-Eis-Stop,Murexin-Eis-Ex
(NH4)2SO4 variabel dry - 7 °C 30-50 pavements
Plantabon Eisex mixture 67-80 % (NH4)2SO4
5-11 % (NH4)3PO4
12-17 % (NH2)2CO2-5 % unsoluble
0,9 mm dry - 7 °C 30-50 pavements
Table 1. Properties of different traded winter maintenance products.

272
production. For halogenides different mono-salts and mixtures are marketed withdifferent grain sizes and application limits. Some traded de-icing products are marketedwith advertisement slogans such as: ‘alternative de-icers, biological de-icers, ecologicallycompletely harmless, improving the environment, de-icer and fertiliser in one’ evenwhen containing ecologically hazardous chemicals. Trade names even suggest benefitsto the environment: Greeny, Floralis, Plantabon, Ökotau are trademarks that persuadepeople to apply them with the intention to do less damage to the environment. Usersare hardly able to distinguish how chemical declaration and recommended applicationdoses correlate with application fields, temperatures and ecological sensitivity of theenvironment.
Pathways of winter maintenance products to the vegetation site
Winter maintenance products are administered to the vegetation site partly as aerosol,partly deposited as contaminated snow or as contaminated runoff depending on trafficspeed, pavement construction and technical equipment (Figure 1). Paved areas arenormally not perfectly sealed; salt solutions penetrate through the surface or throughthe soil of the tree site and contaminate soil solution and groundwater or reach thesewage system. Between 20 to 60% of applied de-icers are transported by air,
snow,de-icing
agents, gravelaerosols
spray, contaminated
snow (snowploughing)
melting water, runoff
snow, de-icing agents, gravel
contaminated snow&
gravel
road
pavement
melting water,
runoff
25 % of applied de-icers reach via aerosol, spray and dust the vegetation site, depending on wind and traffic speed
40 % of applied de-icer reach the vegetation site depending on
type of snow ploughing, traffic speed and protection of tree disk
groundwater, aquifer
drainage
sewage
dust from
gravel
gravel
Figure 1. Pathways of de-icing agents and gravel to the vegation site.

273
deposited 2-40 m from the road. 90% of air-transported de-icer are deposited between15 and 20 m from the road (Leonardi & Flückiger1987, Blomqvist & Johansson 1999).On average 25% of applied de-icers reach the vegetation site via aerosol, spray anddust, depending on wind direction, wind and traffic speed (Blomqvist 1998).
Ecological impact of gravel and expanded clay
Traffic smashes gravel into small particles. The impact of these abrasive dust particleson human health is rather low (Litzka et al. 1995, Neuberger 1996), depending on howlong the material remains on the pavement, on traffic frequency and speed. Mechanicalinjuries of stems of road trees may occur depending on traffic speed and particle size.Gravel and expanded clay enhance soil surface sealing, change permeability for waterand air, surface and soil temperature and soil quality as seedbed. Soil structure maybenefit from their application. Dust layers on plants change the energy balance ofleaves and needles (Eller 1977). For dark coloured dusts the surface temperatureincreases, reflection decreases. Impact on spectral absorption by leaves has beenreported (Sieghardt 1983). In some cases stomata are sealed and gas exchange isreduced. The surface chemistry of vegetation and soil changes according to thechemical properties of the applied product influences the mycorrhiza distribution andquality (Turnau 1990). Gravel and expanded clay may cause mechanical problems inthe sewage systems (Matsché 1996).
Ecological impact of chloride-containing de-icers
Salt (NaCl), the most common and cheapest de-icer is very efficient in terms ofimproving traffic security in winter season, but even when applied as wet salt or brinewith reduced doses, it directly and indirectly causes dysfunction and instability ofurban greening (Figure 2). Chloride is highly toxic to the vegetation. It changes themembrane permeability of cells and increases the osmotic potential. Growthreduction, chlorosis and necrosis of leaves and dieback of tree crowns are symptomsthat occur after salt application. Via cation exchange high sodium saturation in soilscauses desorption of other cations (K, Ca, Mg, NH
4) and metals, which percolate
through the soil and in the worst case are leached out. This nutrient depletion is crucialfor growth of urban vegetation and misbalances mineral nutrition (Ruge 1974,Kreutzer 1974, Ernst & Feldermann 1975). Loss of calcium enhances the susceptibilityfor soil compaction at tree sites causing shrinkage and dispersion of soil aggregateswith negative impacts on soil water balance and soil aeration. Sites becomephysiologically dry. After high and frequent NaCl application doses, free Na+-ionsoccur in the soil solution via re-desorption of Na against H+ and cause alkalinisationby formation of sodium hydroxide. The increase of pH causes dissolution and loss ofhumus and changes of the bioavailability of heavy metals (Amrhein et al. 1992). MgCl
2

274
and CaCl2 are less harmful because they contain basic double charged cations, but they
still have the disadvantage of containing Cl as toxic anion (Bogemans et al. 1989). Clpercolates quickly through the soil system and contaminates the groundwater oraquifer and exceeds the target values for drinking water. In Austria, 8 drinking watersupply-sources were analysed, 5 of them situated near highways showed extraordinaryhigh chloride contents, wells along the most frequented transit route Brenner-highwayhad o be closed because of Cl-contents between 200 – 500 mg/l which manifoldexceeded target values (Peer & Podlesak 1991). High salt contents in the sewage water(> 2 % salt content) decrease the efficiency of nitrogen-decay; nitrification anddenitrification in the sewage system are reduced (Dincer & Kargi 1999).
Ecological evaluation of potassium carbonate (K2CO
3)
This chemical has a four times higher price compared to NaCl and is not directly toxicfor urban vegetation. In urban vegetation sites the usual practice of litter removal oftenleads to potassium deficiency, so in this respect this de-icer is ecologically indifferent aswell as the anion is. High K-uptake increases frost hardiness of urban plants. Onecrucial effect of this alternative de-icer is its potential for direct soil alkalinisation.
pota
ssiu
mcarb
onates
odiu
mchlo
ride
growth ↓↓↓↓ growth ↑↑↑↑ ↓↓↓↓,
stressresistance ↑↑↑↑
chloroses
necroses
Cl - (toxic)
Cl -, Na + ↑↑↑↑
Na +
soilcolloidK+
Ca ++
destruction of
soil aggregates
(and humus) Mg ++
pH ↑↑↑↑
K+, Ca++, Mg++, (NH4+)
heavy metal dislocation?
groundwater, aquifer
K+↑↑↑↑,
Ca++, Mg++↓↓↓↓
K+ (nutrient)
pH ↑↑↑↑ ↑↑↑↑
destruction of
soil aggregates
and humus
Ca ++
Mg ++
formation of
HCO3-, CO3
2-,
carbonates
nutritional
imbalances
Figure 2. Ecological impact of sodiumchloride and potassiumcarbonate.

275
Potassium carbonate solution has a pH of up to 14. After frequent application of highdoses soil structure collapses and soil humus is dissolved. NH
4, Ca and Mg are
exchanged against K and washed out with the percolating water. Deficiency symptoms,like growth reduction, necrosis and chlorosis occur due to nutritional imbalances aswell as decrease of soil aggregate stability (Sieghardt et al. 1998, Sieghardt 2000). Theseeffects are minimised and stabilised by formation of hydrocarbonates and carbonatesin calcareous soils (Figure 2). Because of high pH of solution-solution hypotheticallythe sewage water could be alkalinised and ammonia dissolved and evaporated. Inpractical experiments no increase of ammonia concentrations occurred, because of thehigh dilution rates in communal sewage water systems. Positive effects of potassiumcarbonate on the biozönoses of sewage systems have been reported (Frühwirth 1990).
Ecological impact of nitrogen containing de-icers
The ecologically hazardous constituents of nitrogen containing de-icers that are soldunder different trademarks are urea (46,6 % N) and ammonium sulphate (21,2 % N).These are frequently-used fertilisers. Primarily, the idea to use a fertiliser for de-icing
Figure 3. Ecological impact of sodiumchloride and potassiumcarbonate.
soilcolloid
groundwater, aquifer
ure
a(N
H2 )
2 -CO
NH4←←←←2 H+ + urea
hydrolysis, OH
NH3pH ↑↑↑↑
toxic
NH3,
NH4+
root growth &
mycorrhiza ↓↓↓↓,
element imbalances ↑↑↑↑
nitrifcation
pH↓↓↓↓
NO3-
K+, Ca++, Mg++,
NO3-
denitrification
N2O, NO
Norg
am
moniu
msulfate
NH3
2 H+
NH3,
K+, Ca++, Mg++,
NO3-, SO4
--
(NH4)2SO4
pH ↓↓↓↓
NO3-, NH4
+,
SO4 ↑↑↑↑
NO3-, NH4
+ ↑↑↑↑
growth, transpiration, element imbalances ↑↑↑↑
sensitivity against pathogens, drought, frost ↑↑↑↑
N2O, NON2O, NO

276
seems to be striking and harmless to the environment. This idea turned out to betotally wrong (Figure 3): N-containing de-icer are heavily affecting vegetation, soils,water and sewage systems by over-fertilisation and enhancing nutritional imbalancesand reducing frost hardiness (Balasch 1987).
Urea-hydrolysis causes a local increase of soil water pH and a higher solubility forammonia in water (Gubler 1993). Ammonia is highly bio-toxic: root growth andmycorrhiza frequency decrease. When penetrating to the ground- and surface water itis highly toxic for fish and for most micro-organisms (Dobson 1991) and has animpact on drinking water quality. Enzymatic hydrolysis of urea in soils is highlyoxygen-demanding, a severe problem in frequently compacted urban soils. Ammoniumitself causes an exchange against other cations resulting in nutritional deficiencies andimbalances. When it is nitrified, this 2 H+ are generated and pH decreases. In thesewage systems this process causes problematic changes and enhances the ammonium-output into surface waters. Urea also contributes to gaseous losses of Ammonia, N
2O
and NO via denitrification. The increasing uptake of nitrogen by urban vegetationenhances growth and imbalances the nutrient ratios in the biomass and increasestranspiration as well as the susceptibility to several stresses like drought, frost andpathogens (Bloom 1997, De Visser et al. 1996). The organic nitrogen pool in the soil isenriched presumed enough carbon is available. Even when we assume that urban sitesare in general low in nitrogen, uncontrolled applying nitrogen via de-icing agents isproblematic and enhances deficiencies by increasing growth and relatively dilutingother elements.
Ammonium sulphate reacts physiologically acidic in soils and decreases NH3-toxicity
depending on soil temperature and pH. Ammonium sulphate is highly corrosive(Dirnböck 1993). Additional to the impact of enhanced nitrogen supply and growththe nitrogen cycle is affected: nitrate availability as well as diverse exchange processesof cat ions versus ammonium is increased. It contains sulphate, which is easily leachedand as well easily taken up by vegetation. Excessive sulphate availability may enhanceinstability of urban vegetation as well.
Model calculations
Figure 4 shows the results of model calculations comparing element fluxes andenrichments after application of different de-icing agents. The respective calculationsinclude average deposition rates and are based on a tree disk of 4 m2, a tree with aDBH of 40 cm, a crown diameter of 7 m and de-icer applications according topractical doses and 20 times per year. The output is calculated via tree-leaf-litter andherbaceous vegetation, fertiliser recommendations are for forest plantations for onerotation of 80 years. Losses to the soil and the groundwater are not considered. Urea
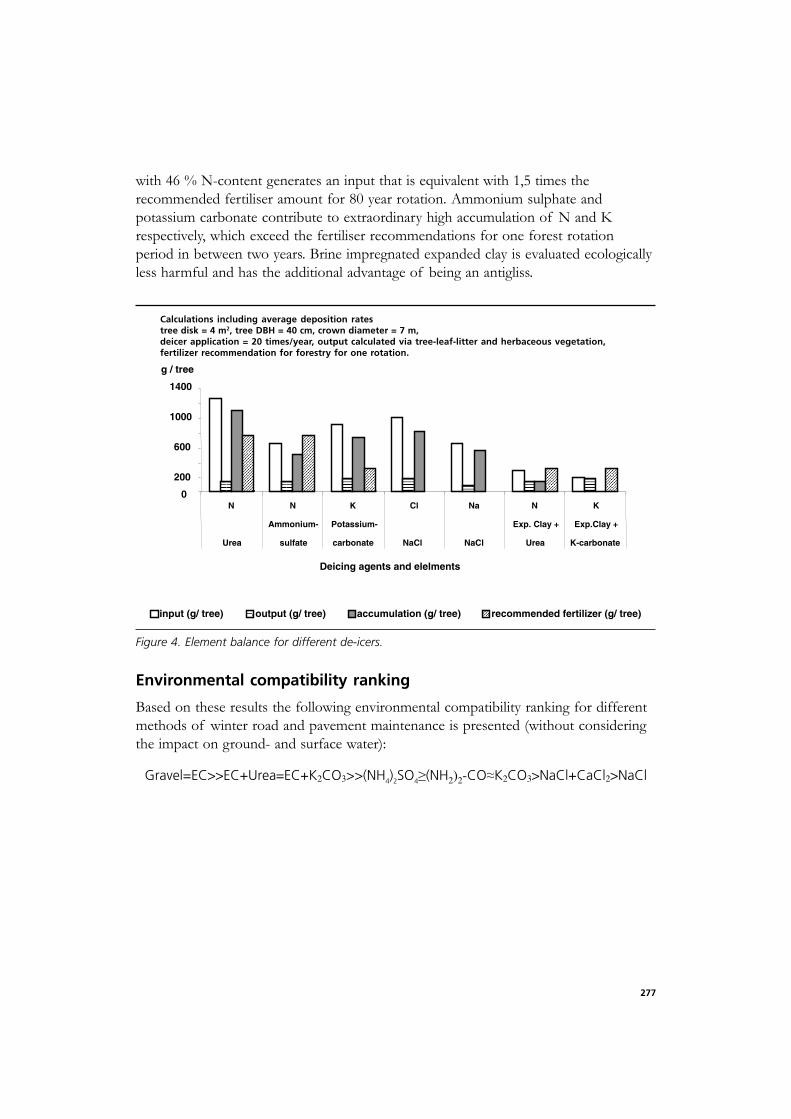
277
with 46 % N-content generates an input that is equivalent with 1,5 times therecommended fertiliser amount for 80 year rotation. Ammonium sulphate andpotassium carbonate contribute to extraordinary high accumulation of N and Krespectively, which exceed the fertiliser recommendations for one forest rotationperiod in between two years. Brine impregnated expanded clay is evaluated ecologicallyless harmful and has the additional advantage of being an antigliss.
Environmental compatibility ranking
Based on these results the following environmental compatibility ranking for differentmethods of winter road and pavement maintenance is presented (without consideringthe impact on ground- and surface water):
0
200
600
1000
1400
N N K Cl Na N K
Ammonium- Potassium- Exp. Clay + Exp.Clay +
Urea sulfate carbonate NaCl NaCl Urea K-carbonate
Deicing agents and elelments
g / tree
input (g/ tree) output (g/ tree) accumulation (g/ tree) recommended fertilizer (g/ tree)
Calculations including average deposition ratestree disk = 4 m2, tree DBH = 40 cm, crown diameter = 7 m,deicer application = 20 times/year, output calculated via tree-leaf-litter and herbaceous vegetation,fertilizer recommendation for forestry for one rotation.
Figure 4. Element balance for different de-icers.
Gravel=EC>>EC+Urea=EC+K2CO3>>(NH4)2SO4 (NH2)2-CO K2CO3>NaCl+CaCl2>NaCl

278
References
Amrhein C, Strong JE & Mosher PA (1992).
Effects of de-icing salts on metal and organic matter mobilization in roadside soils.Environmental Science and Technology 26: 703-709.
Balasch (1987)
Die Anwendung von Auftausalz und dessen Alternativen unter ökonomischen undökologischen Kriterien. Dissertation an der Wirtschaftsuniversität Wien. Wien.
Blomqvist G (1998).
Impact of de-icing salt on roadside vegetation, a literature review. VTI Rapport427A.
Blomqvist G & Johansson EL (1999).
Airborne spreading and deposition of de-icing salt – a case study. Sc. Tot.Environm235: 161-168.
Bloom AJ (1997).
Interaction between inorganic nitrogen nutrition and root development.Z.Pflanzenernaehr. Bodenk. 160: 253-259.
Bogemans J, Neirinckx L & Stassart JM (1989).
Effect of de-icing NaCl and CaCl2 on spruce (Picea abies). Plant and Soil 120: 203-211.
De Visser P, Keltjens W & Findenegg G (1996).
Transpiration and drought resistance of Douglas-fir seedlings exposed to excessammonium. Trees 10: 301-307.
Dincer AR & Kargi F (1999).
Salt inhibition of nitrification and denitrification in saline wastewater. Environ.Technol. 20: 1147-1153.
Dirnböck G (1993).
Umwelt- und Rechtsaspekte beim Streudienst. Mitteilungen des Institutes fürStraßenbau und Straßenerhaltung der Technischen Universität Wien, Heft 3. Wien.
Dobson MC (1991).
De-icing dalt damage to trees and shrubs. Forestry Bulletin 101. London.
Eller BM (1977).
Beeinflussung der Energiebilanz von Blättern durch Straßenstaub. Angew. Bot. 51:9-15
279
Ernst W & Feldermann D (1975).
Auswirkungen der Wintersalzstreuung auf den Mineralhaushalt von Linden. Z.Pflanzenernaer. Bodenk. 6: 629-640
Frühwirth I (1990).
Einsatz von Kaliumkarbonat als Auftaumittel: Auswirkungen auf die Kanalisationund auf die biologische Abwasserreinigung. Diplomarbeit am Institut fürWassergüte und Landschaftswasserbau der Technischen Universität Wien, Wien.
Gubler A (1993).
Literaturstudie: Salzersatz im Winterdienst. Institut f. Verkehrsplanung,Transporttechnik, Strassen- und Eisenbahnbau, Zürich.
Kreutzer K (1974).
Bodenkundliche Aspekte der Salzanwendung. Eur. J. For. Path. 4: 41-44.
Leornardi S & Flückiger W (1987).
Die Verfrachtung salzhaltiger Verkehrsgischt entlang Autobahnen und ihre Wirkungauf exponierte Gehölze. Straße und Verkehr 1-87.
Matsché N (1996).
Aspekte zum Salzeinsatz im Winterdienst: Auswirkungen auf das Wasser. In: LenzP (Ed) Aspekte zum Salzeinsatz im Winterdienst.
Neuberger M (1996).
Staubbelastung durch Straßenstreusplitt. Waste Magazin 3/96: 11-13.
Peer Th & Podlesak K (1991).
Auswirkungen von chloridhältigen Auftaumitteln auf Wasser und Boden im Bereichvon Autobahnen und Schnellstraßen. Österreichische Wasserwirtschaft,Sonderdruck 43: 24-36.
Ruge U (1974).
Ursachen der Schädigung des Straßenbegleitgrüns in Städten und an der Autobahn.Eur. J. For. Path. 4: 48-49.
Sieghardt H (1983).
Beeinflussung der spektralen Absorptionseigenschaften der Blätter von Hederahelix durch Staubimmissionen. Phyton 23: 177-184.
Sieghardt M, Wresowar M & Tartar A (1998).
Potassium carbonate as an alternative de-icer: impact on soil properties on vegeta-tion. NHP Report 43: 41-51.

280
Sieghardt M (2000).
Aktuelle Untersuchungen über die Auswirkungen von Auftausalzen auf Böden. In:Dujesiefken D & Kockerbeck P (Eds) Jahrbuch der Baumpflege 2000. ThalackerMedien.
Turnau K (1990).
The influence of industrial dusts on mycorrhizal status of plants in Pino-Quercetum forest. Ecological and applied aspects of ecto- and endomycorrhizalassociations 28(1-4): 529-533.

281
Appendix


283
Programme: Florence, Italy, 29-31 March 2001
Conservation and management of historical parks
Thursday 29 March
Plenary session
Time: 13.00 - 18.00
Kim Wilkie (Landscape Architect, UK)
Case studies of restoration projects: the Park of the river Thames and Villa La
Pietra.
Laura Gatti (ISA, Italy)
Historical parks, old trees: technical and research aspects of their conservation
and restoration.
Thomas Randrup and Cecil Konijnendijk (Danish Forest and Landscape
Research Institute, Denmark).
Review of higher education on urban forests and trees in Europe.
Roberto Causin (University of Padova, Italy)
Management of root disease in the Botanical Garden of the University of
Padova.
Mirella Di Giovine (Municipality of Rome, Italy)
The system of urban and historical Parks of Rome: case studies of the
Caffarella and Castelfusano Parks.
Emilio Amorini (Research Institute of Silviculture, Ministry of Agriculture and
Forest Politics, Italy)
The Castelfusano forest management: suggestions and issues.
Mario Bencivenni (University of Milan, Italy)
A walk through the historical public parks in Florence.
Fabio Salbitano (University of Florence, Italy)
The Urban Forest of Florence: environment, management and directions.

284
Programme, Ljubljana, Slovenia, 28-30 June 2001
Multifunctionality in urban forestry
Thursday 28 June
Plenary session
Time: 13.30 - 17.00
Rien van den Berg (Dutch Service of Land and Water Management, theNetherlands)Experiences with establishment of multifunctional urban and periurbanwoodlands in the Netherlands.
Janez Pirnat (Biotechnical Faculty, University of Ljubljana, Slovenia)Multifunctionality in urban forests - a dream or a task?
Primoz Oven (Biotechnical Faculty, University of Ljubljana, Slovenia)Report on research of trees in the city of Ljubljana (1999-2000).
Dusan Robic (emeritus professor of Phytosociology, University of Ljubljana,Slovenia)Forest vegetation of Slovenia as a reflection of physical environment and humanactivity.

285
Programme:11-14 November 2001, Wageningen,The Netherlands.
International Policy Research Symposium on: The changing role offorestry in Europe; between urbanization and rural development
Monday 12 November
Plenary sessionTime: 10.00 - 18.00
Nicolas Hanley (EU Division Nature & Biodiversity, DG Environment)The European Commission’s nature management policies and strategies inchanging European societies.
Nathalie Bertrand (Cemagref, France) & Marie-Christine Kovacshazy(Commissariat du Plan, France)Developments and recent driving forces in rural areas in a European perspective.
Gregory Ashworth (University of Groningen, the Netherlands)Developments and recent driving forces in urban areas in a Europeanperspective.
Klaas Kerkstra (Wageningen University, the Netherlands)Interaction between urban and rural areas in Europe – underlying processes andtheir consequences for forest and nature management.
Robert Sommer (University of California, USA)Changing relationships between people and nature - the impact of urbanizationand rural development.
Niels Elers Koch (Danish Forest and Landscape Research Institute, Denmark)The challenges of changing urban-rural relations for forest and nature management in Europe.
Birgit Elands (Wageningen University, the Netherlands) & Thomas O’Leary(University College Dublin, Ireland)Multifor: the role of forests for rural development in Europe – introduction andmain results.

286
Kjell Nilsson & Cecil Konijnendijk (Danish Forest and Landscape ResearchInstitute, Denmark)COST-E12: Urban forests and trees – introduction and main results -
Changing form, benefit and functions of urban forests and trees
Tuesday 13 November
Parallel sessions COST E12Time: 9.30 - 15.00
Developing the Social Values of Urban Forests
Sjerp de Vries and Martin Goossen (the Netherlands)Professionalising planning for the social functions of forests and nature areas.
Klaus Seeland (Switzerland) and Fabio Salbitano (Italy)The potential of social integration in some of the major cities of multiculturalSwitzerland and Italy in urban green areas.
Christin Janssens and Danny Wildemeersch (Belgium)Social learning and urban forestry planning - the case of Flanders.
Developing Innovative Programmes for Urban Forestry
Kevin Collins and John Brosnan (Ireland)Ireland’s NeighbourWood scheme - urban greening through partnerships.
Alan Simson (United Kingdom)The White Rose Forest - A catalyst for the regeneration of a region.
Ann Van Herzele (Belgium)Challenges of neighbourhood participation in city-scaled urban green-spaceplanning.
Case Studies of Urban Woodland Planning and Design
Simon Bell (United Kingdom)Use and abuse of woodlands in Central Scotland.
Dominique Blom (the Netherlands)Urban woodlands in the lowlands.
Iris Bernstein (Israel)Creating an urban forest in the city of Maale Edomim, Israel

287
Innovative approaches in selection and establishment of urban treeresources
Innovative Approaches in Plant Selection and Pest Control
Arne Sæbø (Norway), Thorarinn Benedikz (Iceland), Thomas Randrup(Denmark) and Jos Van Slycken (Belgium)Plant selection for street trees, park trees and urban woodlands.
Joanna L. Francis (Ireland)Enhancing the diversity of woodland field layer communities in urban plantationwoodlands for amenity and wildlife purposes
Marel Tomalak (Poland)Biological and integrated control of insect pests in urban parks and forests.
Innovative approaches in urban tree establishment
Stephan Pauleit (Germany), Louis Marie Rivière (France), Laure Vidal-Beaudet(France), Jose Luis Garcia-Valdecantos (Spain), Gemma Garcia-Marin (Spain),Monique Bodson (Belgium), and Nerys Jones (United Kingdom)Tree selection and establishment practices in Europe - Results from a Europeansurvey.
Monika Sieghardt and Martin Wresowar (Austria)Informing the public about the ecological impact of different methods of roadand pavement winter maintenance in Vienna.
Palle Kristoffersen and Camilla B. Sørensen (Denmark)Weed control in the urban environment in Denmark.
Improving Urban Soils for Urban Trees
Els Couenberg (the Netherlands)The Amsterdam Tree Soil revisited.
Jürgen Samyn (Belgium)The assessment of mulch sheets to inhibit competitive vegetation in treeplantations in urban and natural environment.
Jitze Kopinga (the Netherlands)The effect of adding mycorrhizae to planting soil on the establishment and firstgrowth of street tree plantings.
288
Innovative approaches in urban forest and tree management
Developing management systems in urban forestry
Werner Pillmann (Austria)Management of urban greenery - a system oriented model of tasks in urbanforestry.
Jens Ole Juul (Denmark), Susanne Guldager (Denmark), Alexander Alekseev(Rusland), Cecil Konijnendijk (Denmark), Evgeny Kouznetsov (Rusland) andAndrey Selikhovkin (Rusland)Developing an information system for structural urban green planning and management in St. Petersburg, Russia.
Martin Hermy and Johnny Cornelis (Belgium)Towards a monitoring method and a number of multifaceted and hierarchicalbiodiversity indicators for urban and suburban parks.
Management of urban woodlands
Åsa Ode (Sweden)Visual aspects in the management of urban woodland.
Anna Jönsson and Roland Gustavsson (Sweden)Management styles and knowledge cultures of yesterday and tomorrow formultiple use and urban woodland management.
Case studies of urban forestry ownership and management
Ömer Eker and Kenan Ok (Turkey)Results of changing social demands in Istanbul Bahcekoy Forest Enterprise: acase study.
José-Luis Garcia-Valdecantos and Maria-Louisa Tello (Spain)A historical case of periurban forestry: the ‘Sotos Históricos’ of Aranjuez, Spain

289
Programme, Thessaloniki, Greece, 11–13 April2002
Treats to urban forests and trees - the North-South perspective
Thursday 11 April
Plenary session
Time: 14.00 - 18.00
Guido Kuchelmeister (Tree City Initiative, Germany)
Urban forestry as a development tool.
Alicia Chacalo (Universidad Autónoma Metropolitana, Mexico)
Urban forestry in the South: the case of Mexico City.
Klaus Seeland (Technical University of Zurich, Switzerland)
Urban and community forestry in India and Nepal.
Syaka Sadio (FAO)
Urban forestry issues in Africa: case studies in Near East (Egypt, Sudan) and
Sahelian (Mauritania, Malia and Ethiopia) countries.
Ramon Vallejo Calzada (CEAM, Spain)
Managing forest fires near urban areas in Spain.
Helen Michalopoulos (National Agricultural Research Foundation/
Forest Research Institute of Thessaloniki,Greece)
Pests and diseases to urban forests in Greece.
Alexandros Dimitrakopoulos (Dept. of Forestry and Natural Environment,
Aristotle University of Thessaloniki, Greece)
Analysis of the wildland fire problem of Greece at the urban-rural interface.
Christos Tourlakidis (Director of Reforestation Service of Thessaloniki, Greece)
Periurban forest of Thessaloniki: Post-fire restoration and perspectives.

290
Bruges, Belgium, 13-15 June 2002
Integrating research and practice - optimal use of open space inEurope
Thursday 13 June 2002
Plenary Session
Time: 14.00 - 16.30
Peter Janssens (Benelux)
Urban forestry and efficient use of open space in western Europe from a
research point of view.
Roel Vanhaeren (Flemish Community, Forest and Green Areas Division)
Realising urban forests in Flanders: a policy perspective.
Ellen Moons (Catholic University of Leuven, Belgium)
Cost-revenue analysis of urban forests from a research point of view
Muriel Eyletters (Université Libre de Bruxelles)
‘Diagnosis of trees capacity to live in an urban environment’.
Ilse Wuyts (Ministerie van het Brussels Hoofdstedelijk Gewest)
„The Green Logic“, Renovation of street trees in Brussels.

291
Participants – Florence, Ljubljana, Wageningen,Thessaloniki, and Bruges
Participants at the COST E12 meetings in Florence (29-31 March, 2001), Ljubljana(28-20 June, 2001), Wageningen (11-14 November, 2001), Thessaloniki (11-13 April,2002) and Bruges (13-15 June, 2002)
Lastname Firstname Country
Aertsen Ekko The NetherlandsAmorini Emilio ItalyApostolides Christos GreeceAshworth Gregory The NetherlandsBaines Chris United KingdomBakker Teije The NetherlandsBell Simon United KingdomBencat Tibor SlovakiaBencivenni Mario ItalyBenedikz Thorarinn IcelandBernstein Iris IsraelBianchi Massimo ItalyBirot Yves FranceBlioumis Vaius GreeceBlom Dominique The NetherlandsBodson Monique BelgiumBonsen Karel The NetherlandsBorzan Zelimir CroatiaBostjan Anko SloveniaBroekhuijsen - de Hes Sanneke The NetherlandsBrosnan John IrelandBrus Robert SloveniaBuck Alexander AustriaBussche Brenda BelgiumBuyse Griet BelgiumCalvo Enrico ItalyCausin Roberto ItalyChacalo Alicia MexicoChristodoulou Athanasios GreeceCollet Gregor GermanyCollins Kevin Ireland

292
Lastname Firstname Country
Couenberg Els The NetherlandsCuizzi Danielle Italyde Deugd Maartje The NetherlandsDe Nutte Tim BelgiumDe Rogatis Anna Italyde Schrijver Filip BelgiumDe Vico Fallani Massimo ItalyDe Vreese Rik Belgiumde Vries Sjerp The NetherlandsDe Wilde Joris Belgiumde Winter PJ The NetherlandsDevaere Veerle BelgiumDi Giovine Mirella ItalyDimitrakopoulos Alexandros GreeceDominguez Gloria SpainDrénou Christphe FranceDucatillion Cathérine FranceDujesiefken Dirk GermanyEdelin Claude FranceEdwards Penny United KingdomEker Ömer TurkeyElands Birgit The NetherlandsEriksson Liselott SwedenEyletters Muriël BelgiumFalck Jan SwedenFede Salvatore ItalyForrest Mary IrelandFrom Johanna SwedenGarcia-Marin Gemma SpainGarcía-Valdecantos José Luis SpainGatti Laura ItalyGauthier Michelle FAOGerman Chiari Cristina SwitzerlandGhag Jasbinder United KingdomGijsbers Ineke United KingdomGijsel Katrijn BelgiumGoossen Martin The NetherlandsGorissen Dries BelgiumGundersen Vegard Norway
293
Lastname Firstname Country
Gustavsson Roland SwedenHanley Nicholas EUHasler Berit DenmarkHatzistathis Athanasios GreeceHermy Martin BelgiumHeyens Veerle BelgiumHoogstra Marjanke The NetherlandsHunter Beatrice The NetherlandsHyttinen Penti COSTHärdter Ulf GermanyJager Laslo HungaryJansen Hans The NetherlandsJanssens Peter BelgiumJensen Frank DenmarkJóhannesson Arni IcelandJones Nerys United KingdomJuul Jens Ole DenmarkJönsson Anna SwedenKalb Joop The NetherlandsKassioumis Konstantinos GreeceKeizer Gerrit Jan The NetherlandsKerkstra Klaas The NetherlandsKnol Reijer The NetherlandsKoch Niels Elers DenmarkKonijnendijk Cecil Denmark/The NetherlandsKoolen Jos The NetherlandsKopinga Jitze The NetherlandsKovacshazy Marie-Christine FranceKristofferesen Palle DenmarkKuchelmeister Guido GermanyKvarda Eva AustriaLagerstrom Tomas SwedenLarsen J. Bo Denmarkle Floch Sophie FranceLub Jan The NetherlandsLöfström Irja FinlandMalamidis George GreeceMartin Luis PortugalMcCormack Art Irelande

294
Lastname Firstname Country
Michalopoulos Helen GreeceMoons Ellen BelgiumMotta Emma ItalyMussche Sylvie BelgiumMutto Sergio ItalyNachtergaele Jeroen BelgiumNas Rob The NetherlandsNieto Laura SpainNilsson Kjell DenmarkNiskanen Anssi FinlandNyhuus Signe NorwayO’Sullivan Rory IrelandO’Brien Elizabeth United KingdomOde Åsa SwedenO’Leary Tomas IrelandOlsen Ib Asger DenmarkOosterbaan Anne The NetherlandsØsterbye Lars DenmarkO’Sullivan Rory IrelandOttitsch Andreas The Netherlands/AustriaOven Primoz SloveniaPaganova Viera SlovakiaPálsson Jóhann IcelandPapageorgiou Kostas GreecePauleit Stephan United Kingdom/GermanyPetit Franck BelgiumPiggen J The NetherlandsPillmann Werner AustriaPirnat Janez SloveniaPlana Eduard SpainPotyralska Aleksandra PolandPræstholm Søren DenmarkQuist Willem The NetherlandsRandrup Thomas DenmarkRautamäki Maija FinlandRego Francisco PortugalRobic Dusan SloveniaRolf Kaj SwedenRydberg Dan Sweden

295
Lastname Firstname Country
Sadio Syaka FAOSalbitano Fabio ItalySamyn Jürgen BelgiumSanesi Giovanni ItalySchanz Heiner The NetherlandsScheirlinck Hans BelgiumSchmidt Gbor HungarySchraml Ulrich GermanySchröder Klaus GermanySeeland Klaus SwitzerlandSelby Ashley FinlandShannon Denis IrelandSiegel Gunther COSTSieghardt Monika AustriaSimson Alan United KingdomSiwecki Ryszard PolandSkarphédinsdóttir Ragnhildur IcelandSlee Bill United KingdomSneep Huib The NetherlandsSoares Ana Luísa PortugalSommer Robert United States of AmericaSteidle-Schwahn Anna GermanyStoffer Bart The NetherlandsStoker Christian SwitzerlandSupuka Ján SlovakiaSusca Vito ItalySzepesi András HungarySæbø Arne NorwayTello Maria-Luisa SpainTerrasson Daniel FranceTomalak Marek PolandTourlakidis Christos GreeceTrakolis Dimitrios GreeceTyrväinen Liisa FinlandUilarino Jose SpainValk Remco The NetherlandsVallejo Ramon Spainvan den Berg Rien The Netherlandsvan der Sleesen Sasha Ireland

296
Lastname Firstname Country
van der Wiel Hans The Netherlandsvan der Wielen Pierre The NetherlandsVan Herzele Ann Belgiumvan Holsteijn Hein The NetherlandsVan Hoye Dirk Belgiumvan Ingen Michel The Netherlandsvan Kerckhove Geert BelgiumVan Slycken Jos Belgiumvan Tuyll van Serooskerken Frederik The Netherlandsvan Vliet Kees The NetherlandsVarga Gabor HungaryVeer Marije The NetherlandsVisschedijk Peter The NetherlandsVon Weisenberg Kim FinlandVriesman Kees The NetherlandsVuletic Dijana CroatiaWeber Norbert GermanyWiegersma Lodewijk The NetherlandsWiersum Freerk The NetherlandsWilderink Ellen The NetherlandsWilkie Kim United KingdomWohlers Antje GermanyWuyts Ilse BelgiumZagas Theocharis Greece


COST Office
COST domain: Forests and forestry products
EUR 21524 — COST Action E12 — Urban forests and trees — Proceedings No 2
Edited by: C. C. Konijnendijk, J. Schipperijn, K. Nilsson
Luxembourg: Office for Official Publications of the European Communities
2005 — 296 pp. — 17.6 x 25 cm
ISBN 92-898-0009-7
The purpose of this report is to make available the outcome of the work of COST Action 722 ‘Short-range fore-
casting of fog, visibility and low clouds’, which was carried out from 2002 to 2003. During this period, an inventory
of existing forecast methods and ongoing projects was made and an evaluation of requirements from customers
and from forecasters was prepared. These results will be used for the next phases of COST Action 722. However,
they could be also useful for a wider community interested in the processing of input data (in-situ, satellites), numer-
ical and statistical forecasting and in application purposes.
41BL17_Pages_lim 07-07-2005 10:20 Pagina 3
