urban geomatics for bulk information generation, data
TRANSCRIPT

PRIN PROJECT: URBAN GEOmatics for Bulk Information
Generation, Data Assessment and Technology Awareness
URBAN GEOmatics for Bulk Information
Generation, Data Assessment and
Technology Awareness
Workshop on Volunteered Geographic
Information
CNR, 16/04/2018
Maria Antonia Brovelli
Dept of Civil and Environmental Engineering
Politecnico di Milano

PRIN PROJECT: URBAN GEOmatics for Bulk Information Generation, Data Assessment and Technology Awareness
Project objective (2017-2020)
The project aims to develop innovative GIS methodologies and tools to
exploit the integration of:
traditional geomatic data,
Earth Observations (EO)
statistics data
new user-generated contents
for promoting a more effective management of urban resources and
infrastructures
To evaluate the system practicability, two topical (soil consumption
and mobility) issues and five cities (Milan, Naples, Padua, Rome and
Turin) among all the possible urban topics and cities, will be
considered as case studies:
PRIN PROJECT: URBAN GEOmatics for Bulk Information Generation, Data Assessment and Technology Awareness
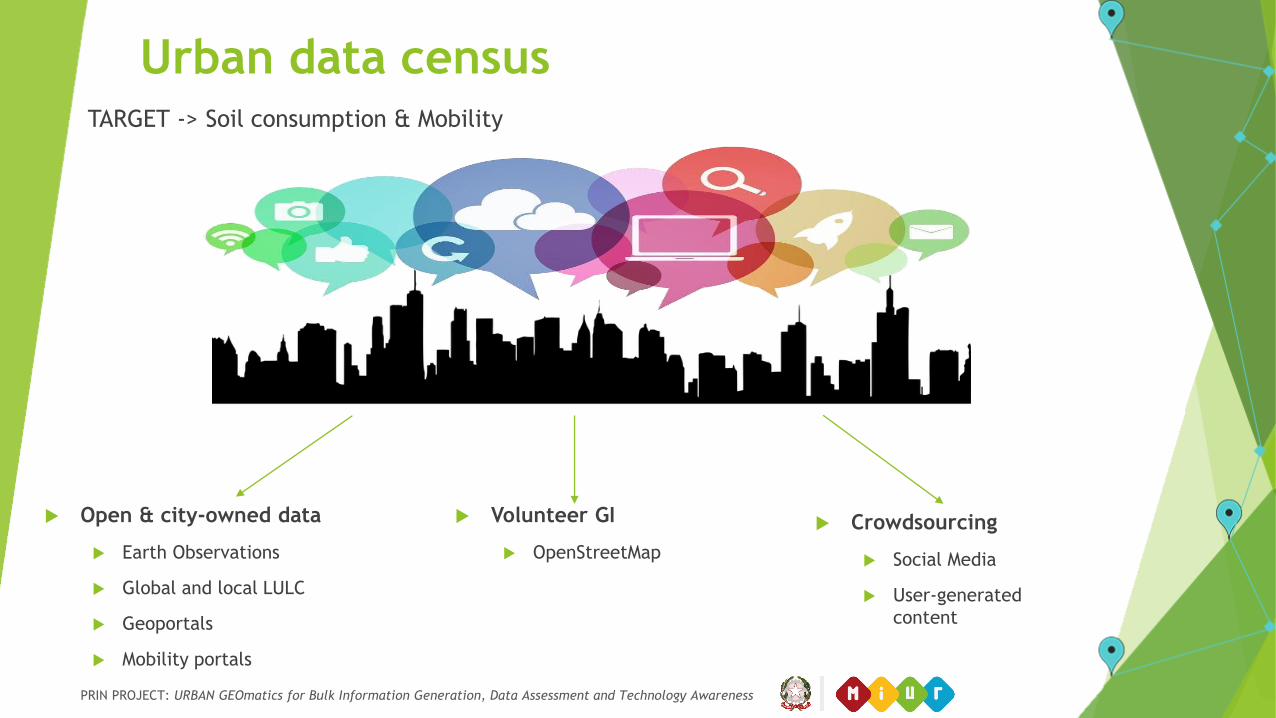
Urban data censusTARGET -> Soil consumption & Mobility
Open & city-owned data
Earth Observations
Global and local LULC
Geoportals
Mobility portals
Volunteer GI
OpenStreetMap
Crowdsourcing
Social Media
User-generated
content

Use Case1

Use Case2
PRIN PROJECT: URBAN GEOmatics for Bulk Information Generation, Data Assessment and Technology Awareness
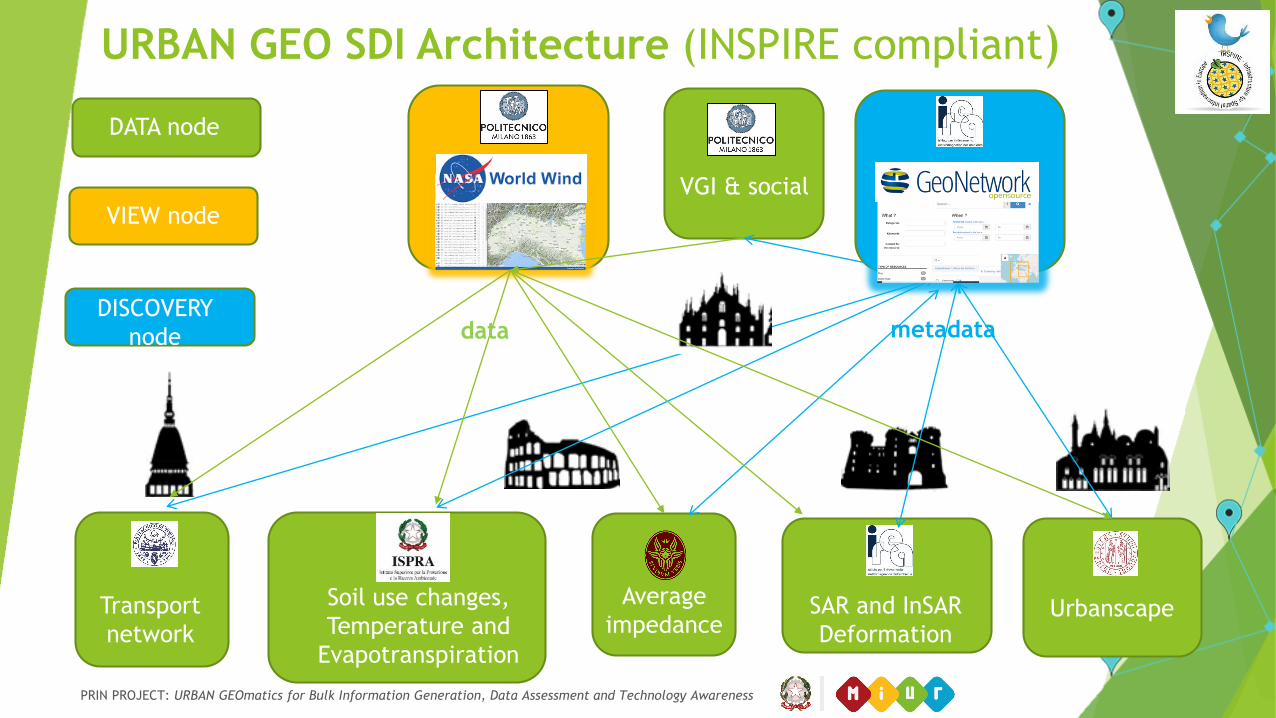
URBAN GEO SDI Architecture (INSPIRE compliant)
UrbanscapeSAR and InSAR
Deformation
Average
impedance
VGI & social
Transport
network
Soil use changes,
Temperature and
Evapotranspiration
metadatadata
DATA node
VIEW node
DISCOVERY
node

PRIN PROJECT: URBAN GEOmatics for Bulk Information Generation, Data Assessment and Technology Awareness
Focus: city 3D model – implementation of extract-transform-load
of spatial data, from topographic geodatabase to CityGML model
New collaboration agreement between UR Padova with VSIX –
“North East Neutral Access Point” for fast data
transfer/access/process
Online tool for ETL (Extract, Transform, Load) and sharing spatial
data…
http://217.146.204.139/sapps/zcitygml/
UrbanScape - CityGML

PRIN PROJECT: URBAN GEOmatics for Bulk Information Generation, Data Assessment and Technology Awareness
Online tool for ETL and sharing spatial data…

Smal
l Bas
elin
e
Inte
rfe
rogr
ams
Mean deformation velocity [cm/yr]> 0.75<- 0.75
Mt. VesuvioCampi Flegrei
Ischia
Example of Advanced DInSAR DATA
ENVISAT
ERS
ERS/ENVISAT images (1992 – 2010)

PRIN PROJECT: URBAN GEOmatics for Bulk Information Generation, Data Assessment and Technology Awareness
The Napoli Bay area
Campi Flegrei
Vomero Vesuvio
71 ERS-1/2 and 39 ENVISAT images acquired on ascending orbits (1993-2007)
197 ERS and 115 ENVISAT interferograms
PRIN PROJECT: URBAN GEOmatics for Bulk Information Generation, Data Assessment and Technology Awareness
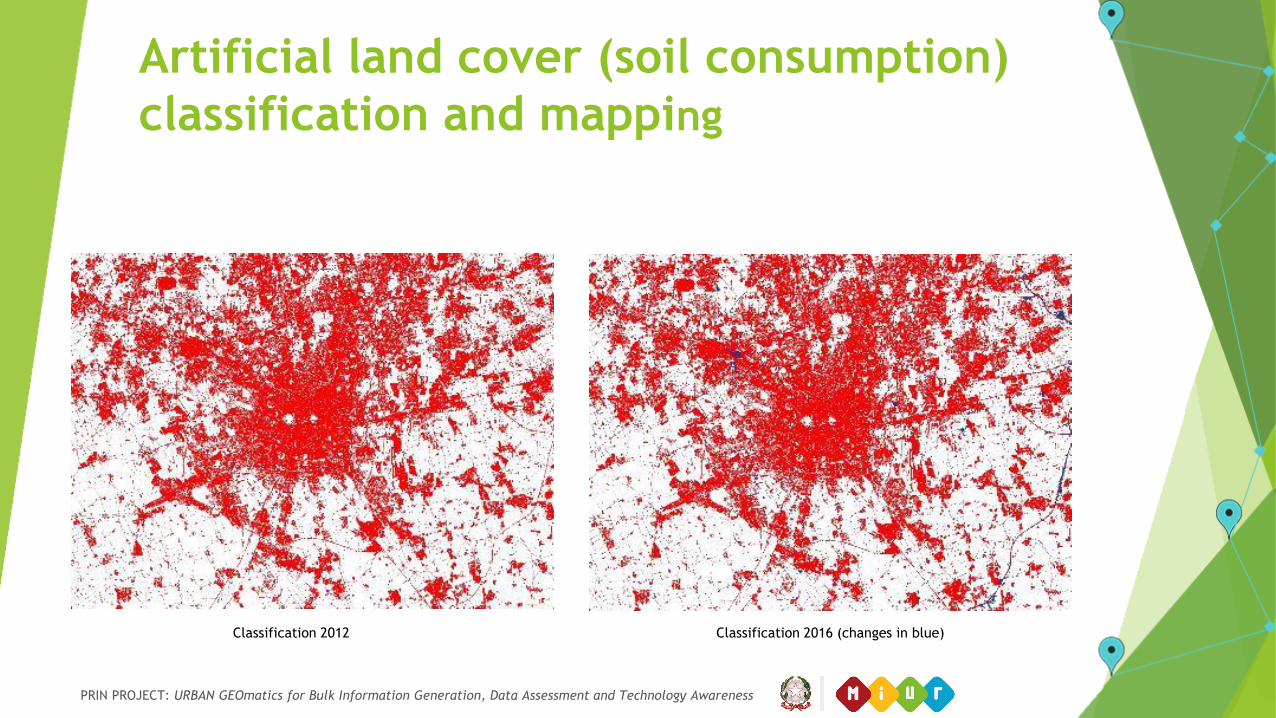
Artificial land cover (soil consumption)
classification and mapping
Classification 2012 Classification 2016 (changes in blue)

PRIN PROJECT: URBAN GEOmatics for Bulk Information Generation, Data Assessment and Technology Awareness
Mapping possible changes using Sentinel-2
Selection of images
without shift issues
Sentinel-2 images of
2016
Difference of max NDVIs
(change if difference >
0,4)
Sentinel-2 images of
2017
Selection of images
without shift issues
NDVI calculation for
every image
Maximum NDVI
calculation per pixel
2016
NDVI calculation for
every image
Maximum NDVI
calculation per pixel
2017

PRIN PROJECT: URBAN GEOmatics for Bulk Information Generation, Data Assessment and Technology Awareness
Mapping possible changes using Sentinel-1
Selection of intensity
images with polarization
VV
Sentinel-1 images of
2016
Difference of medians
(change if difference > 5)
Sentinel-1 images of
2017
Selection of intensity
images with polarization
VV
Calculation of the
median per pixel
Calculation of the
median per pixel

PRIN PROJECT: URBAN GEOmatics for Bulk Information Generation, Data Assessment and Technology Awareness
A physical implementation tailored on 5T TOC
of Turin, which allow visualization of
available static elements and dynamic
measures.
Spatial Data Model for Mobility ManagementMain components and Standards analysis
- Many standards to represent the road network elements;
- Many standards to represent the public transport
elements (spatial and non-spatial aspects);
- Many standards for events and traffic measures
management (spatial aspects and communication
protocols);
- Lack of elements to spatial represent traffic detectors
and other traffic ancillary elements.
TRANSMODEL
Private Mobility
Road Network
Representation
Public Transport
Traffic events and Measures
FGDC –Transportation
Data Model
INSPIRE Transport Network
INSPIRE O&M Standard
Implementation (ISO
19156:2011)
TMC –Traffic Message
Channel
DATEX
TRANSMODEL (NETEX)
S.I.MO.NE.
TRANSMODEL (IFOTP)
GTFS – General Transit
Feed Specification
Main results A logical data model, which can be applied to various mobility management contexts.

PRIN PROJECT: URBAN GEOmatics for Bulk Information Generation, Data Assessment and Technology Awareness
Implementation of Turin new strategy (extension of restricted access schedule, liberalization of the access to all
vehicles via a fee payment + 2 hours of parking right).
Enabling factors: plate recognition + timestamp → need to reduce latency time in plate recognition
improve human efforts? deep learning for feature extraction? telepass or rfid technology?
Estimation of access fee: Modelling total cost of private mobility → Total costs = Owner cost + Collectivity costs
First results: 13 million of km driven in Turin area (owner cost = 8 million in a day).
450K of km driven in the Turin RAA (owner cost = 250 k in a day).
Further DevelopmentsRestricted Access Area modelling
Connected vehicles
Autonomous driving
H2020 HPC proposal that aims to set up a test bed for connected vehicles, focused on proactive & early warning, in
order to alert for preventive maintenance, emulated ECUs failure, etc. The HPC challenge:
▶ Real-time integration and processing of a continuous big data streams, supporting the driving environment and
experience and providing information to assist driving and to guarantee car and people safety.
▶ HPC requirements, implementation and demonstration at one single location: generation of value added
information (fully supported by HPC, being these flows big data) enabling new possible mobility services both
from the driving environment point of view from the driving experience side.
On Board Unit (OBU) and infrastructure connection, enabling new services such as “Electronic Horizon”.
Geospatial requirements: fully 3D model with a very high accuracy (derived from aerial/satellite stereo
imageries ) in order to allow real time matching between OBU (GPS + video camera) and 3D coordinates.

PRIN PROJECT: URBAN GEOmatics for Bulk Information Generation, Data Assessment and Technology Awareness
Floating Car Data: velocity analysis
The Floating Car Data (FCD) of Turin Public Transportation system were acquired by everyvehicle of the fleet through its On Board Unit in the month of April 2017, with a variable timeinterval
The FCD are provided in the CSV format (2.19 GB, 30.000.000 records) and include thegeographical coordinates along with a set of attributes (vehicle code, line code, turn,timestamp, etc.)
The FCD were organised for lines, then for vehicles and finally they were chronologicallyordered; for every line of the transportation network:
the Vincenty formula was used to compute the planimetric displacement ∆s between two positions of the specificvehicle in two consecutive time moments
the velocities were computed as v =∆𝑠
∆𝑡
The computed velocities were represented as arrows and plotted on top of the Turin drivenetwork graph
Before proceeding with the time analysis, the outliers were removed by eliminating all therecords not statistically significant (t > 99.5th percentile & t < 0.5th percentile & v > vmean )

PRIN PROJECT: URBAN GEOmatics for Bulk Information Generation, Data Assessment and Technology Awareness
Example: Line 39 velocities
After the outlier removal, the reconstructed path follows more closely the actual line route: the
longest arrows, probably due to the bus routes from and to the depot, are eliminated

PRIN PROJECT: URBAN GEOmatics for Bulk Information Generation, Data Assessment and Technology Awareness
Topological problem
A dedicated procedure was developed to assign the velocities to the line network
topology
First tests on synthetic data

PRIN PROJECT: URBAN GEOmatics for Bulk Information Generation, Data Assessment and Technology Awareness
Conclusions and further developments
A general methodology able to analyse the huge amount of information contained in
Transport Big Data has been developed
Necessary further developments:
refine the outlier removal process in order to all the velocities not referable to the actual
path of the lines
to test the developed topological procedure on all the velocity data
to compute the impedence maps

PRIN PROJECT: URBAN GEOmatics for Bulk Information Generation, Data Assessment and Technology Awareness
Crowdsourced data collecting and storing
architecture
• 5 cities (~ 1000k tweets, ~ 200k geolocated tweets)
WAZE - traffic
• 30min API calls for Milan area (~ 11k calls, ~ 6 GB JSON stored)

PRIN PROJECT: URBAN GEOmatics for Bulk Information Generation, Data Assessment and Technology Awareness
Data processing and analysis
quality and accuracy check of
OSM-derived data against
authoritative data
OSM-derived LULC and soil
consumption maps
Road network layers enrichment
with crowdsourced mobility
information and spatial/temporal
pattern analysis
Users-city spaces interaction and
inter-city mobility demands
investigation using social media
data feeds

PRIN PROJECT: URBAN GEOmatics for Bulk Information Generation, Data Assessment and Technology Awareness
Positional Accuracy: mean and RMS of the distance between
homologous pairs of OSM and the Authoritative Maps in case
of building footprints
Building footprints in
• OSM
• Topographic Database DBT
(scale: 1:1000 1:5000)
Area DBT
buildings
DBT points OSM buildings OSM points
23.844 Km2 2794196 17604429 915696 7506851

PRIN PROJECT: URBAN GEOmatics for Bulk Information Generation, Data Assessment and Technology Awareness
TILE Points m(DX) var(DX) m(DY) var(DY) m(dist) var(dist) min(dist) max(dist) PtiDBT%) PtiOSM(%)
1 2359 0,588 2,070 -0,151 1,644 1,669 1,296 0,014 7,340 84,6 44,7
2 33540 -0,107 1,549 -0,560 1,532 1,465 1,261 0,000 6,634 72,8 23,6
3 372232 -0,118 1,992 -0,645 1,599 1,680 1,200 0,000 6,841 83,5 48,9
4 152706 0,015 2,753 -0,817 2,414 2,076 1,526 0,000 7,159 82,3 37,2
5 1366 -0,544 1,988 -0,547 1,836 1,776 1,264 0,022 6,673 80,5 35,9
7 117271 0,542 2,836 -0,344 2,168 1,999 1,420 0,000 7,361 75,1 62,6
8 170223 -0,013 1,670 -0,348 1,107 1,363 1,039 0,000 6,704 79,6 70,8
9 354194 0,235 1,585 0,024 1,689 1,430 1,285 0,000 6,701 79,5 44,9
10 568039 0,229 2,285 -0,375 2,318 1,770 1,664 0,000 6,798 77,6 40,0
11 128766 -0,019 2,740 -0,751 2,927 2,075 1,925 0,000 7,318 77,9 34,6
12 27452 0,556 4,112 -0,970 3,667 2,539 2,580 0,014 7,906 78,0 40,1
13 2394 -0,252 3,270 -0,898 1,583 2,054 1,503 0,010 6,780 87,8 47,9
15 18347 0,215 1,388 -0,671 1,697 1,486 1,374 0,000 6,621 85,6 40,1
16 179028 0,070 1,490 -0,803 2,420 1,706 1,651 0,000 7,469 83,4 53,3
17 216559 0,325 2,656 -0,689 2,364 1,979 1,682 0,000 7,089 83,4 40,9
18 43736 -0,060 2,871 -0,776 2,765 2,076 1,933 0,000 7,460 82,4 21,7
19 72066 0,319 3,183 -0,514 2,027 1,998 1,583 0,000 6,857 82,4 39,9
20 1684 0,763 3,136 -0,234 2,407 2,147 1,570 0,051 6,862 85,6 39,6

PRIN PROJECT: URBAN GEOmatics for Bulk Information Generation, Data Assessment and Technology Awareness
TILE Points m(DX) var(DX) m(DY) var(DY) m(dist) var(dist) min(dist) max(dist) PtiDBT%) PtiOSM(%)
22 20574 0,678 2,247 -0,214 1,654 1,597 1,854 0,000 7,312 78,6 42,4
23 34975 0,162 2,760 -0,780 3,646 2,216 2,129 0,000 7,784 78,7 50,1
24 133993 0,535 2,839 -1,254 3,324 2,436 2,085 0,000 7,641 81,5 42,3
25 17660 0,413 3,458 -0,739 3,309 2,395 1,747 0,010 7,567 83,1 36,2
26 52071 -0,281 3,291 -0,766 2,726 2,200 1,842 0,000 7,511 79,0 43,9
27 7840 0,559 4,841 -0,399 3,259 2,593 1,846 0,022 7,048 86,5 54,4
28 246 1,326 1,605 -0,228 0,980 1,836 1,019 0,054 7,112 80,4 51,7
29 5998 0,293 4,094 0,390 1,873 2,133 1,657 0,010 6,742 81,0 53,9
30 58863 0,406 3,169 -1,105 4,635 2,606 2,396 0,000 8,034 82,4 37,8
31 128898 0,578 3,696 -0,742 3,575 2,457 2,118 0,000 7,734 78,2 42,7
32 26561 0,427 4,010 0,270 2,987 2,343 1,761 0,014 8,081 81,4 50,1
33 15751 -0,253 2,943 -0,411 3,116 2,151 1,664 0,010 6,789 82,3 38,5
34 12746 -0,428 3,268 -0,460 3,291 2,304 1,645 0,014 7,562 85,0 38,5
35 109 -0,338 1,934 -0,114 1,044 1,342 1,287 0,000 5,237 58,3 0,9
36 21747 -0,214 2,473 0,131 2,078 1,761 1,513 0,000 6,427 71,0 35,5
37 6568 -0,330 3,765 0,961 2,611 2,381 1,739 0,022 8,133 79,1 47,9
38 11646 0,847 4,405 -0,037 2,632 2,413 1,931 0,000 9,533 76,6 40,3
39 2697 0,051 4,670 0,759 1,685 2,275 1,759 0,051 8,162 80,8 41,1
43 932 1,243 4,709 -0,128 1,405 2,227 2,713 0,000 8,623 59,1 1,8

PRIN PROJECT: URBAN GEOmatics for Bulk Information Generation, Data Assessment and Technology Awareness
Land Cover Collector
Crowdsourcing application available on browsers (https://landcover.como.polimi.it/collector/, so far tested on Google
Chrome and Mozilla Firefox), and as Android and iOS applications (cross-platform).
Data is stored in a NoSQL database, CouchDB, which in need can be set up to be distributed to support big data.
The collected data will also be embedded in the 3D viewer.

PRIN PROJECT: URBAN GEOmatics for Bulk Information Generation, Data Assessment and Technology Awareness
3D City
shapefile → CityGML (by University of Padova)
CityGML → gltF (by 3D City Database Importer/Exporter)
glTF in 3DCityDB-Web-Map-Client and Cesium virtual globe

PRIN PROJECT: URBAN GEOmatics for Bulk Information Generation, Data Assessment and Technology Awareness
3D Buildings
Using the plugin API developed for NASA Web WorldWind in 2017 GSoC project. Individual buildings’ height can be set
in different ways: manually (using LiDAR data and a suitable GIS software, editing GeoJSON), the height available in
OSM can be used, the same value can be assigned to all. Find more info at https://github.com/kilsedar/3dosm.

PRIN PROJECT: URBAN GEOmatics for Bulk Information Generation, Data Assessment and Technology Awareness
Naples Displacement Map
GeoServer and WMS is used, with GetFeatureInfo available to plot the changing velocity values through years.

PRIN PROJECT: URBAN GEOmatics for Bulk Information Generation, Data Assessment and Technology Awareness
Big raster data of soil consumption
WMTS with Time is implemented in GeoServer, animated using Cesium.
Click on play button or move the cursor to animate the imagery through years. Watch the video at
https://youtu.be/V94HpGhdCIE. It is also being implemented for Naples Displacement Map.

PRIN PROJECT: URBAN GEOmatics for Bulk Information Generation, Data Assessment and Technology Awareness
Big raster data of soil consumption
Devoleped using WMTS (Web Map Tile Service), available in GeoServer. Style will be applied with a legend for multiple
datasets.
rasdaman (raster data manager) will be used to access and analyze parts of big data on the client side through WCPS
queries. (e.g. difference of soil consumption between years for a specific region)

PRIN PROJECT: URBAN GEOmatics for Bulk Information
Generation, Data Assessment and Technology Awareness
Thank You!
Workshop on Volunteered Geographic
Information
CNR, 16/04/2018
• Milan: Maria Antonia Brovelli, Candan Eylül Kilsedar, Monia Elisa
Molinari, Daniele Oxoli, Giorgio Zamboni
• IREA – CNR: (Naples) Riccardo Lanari, A. Pepe, M. Bonano (IMAA), P.
Imperatore, M. Manzo; (Milan) G. Bordogna, L. Frigerio, P. Carrara
• ISPRA: Michele Munafò, Luca Congedo, Ines Marinosci
• Padua: Francesco Pirotti, Francesca Fissore, Marco Piragnolo
• Roma: Mattia Crespi, Roberta Ravanelli, Andrea Nascetti, Augusto
Mazzoni
• Turin: Piero Boccardo, Emere Arco