urban institute medicaid/chip participation among children and parents victoria lynch genevieve m....
TRANSCRIPT

URBAN INSTITUTE
Medicaid/CHIP Participation among Children and Parents
Victoria Lynch
Genevieve M. Kenney
The Urban Institute
December 17, 2012
URBAN INSTITUTE
Reference: Kenney, G., V. Lynch, M. Huntress, J. Haley, and N. Anderson. 2012. Medicaid/CHIP Participation Among Children and Parents. Washington, DC: Urban Institute and Robert Wood Johnson Foundation.
<http://www.urban.org/UploadedPDF/412719-Medicaid-CHIP-Participation-Among-Children-and-Parents.pdf>

URBAN INSTITUTE
Road Map• Data and Methods
• Participation in Medicaid/CHIP among Children
• Eligible but Uninsured Children
• Participation in Medicaid among Parents
• Eligible but Uninsured Parents

URBAN INSTITUTE
• American Community Survey
• Annual survey fielded continuously over a twelve months period.• Sample is drawn from each county in the nation.• The sample frame includes household with and without telephones.• Information on approximately 700,000 sample children and 600,000
parents available for analysis each year.• Mixed mode survey based on a combination of a mail survey and follow
up telephone and in person interviews.• Response rate of 98% reported by Census.
Allows more precise state and local estimates than previously possible.
Data
URBAN INSTITUTE
• Based on the long form from the decennial census:• Income, marital status, education, occupation, functional
limitation, etc.• Income and household structure information is more
limited than on the CPS but appears quite robust.
• In 2008, for the first time, households were asked about insurance coverage status.
What Information is Included on the ACS?
URBAN INSTITUTE
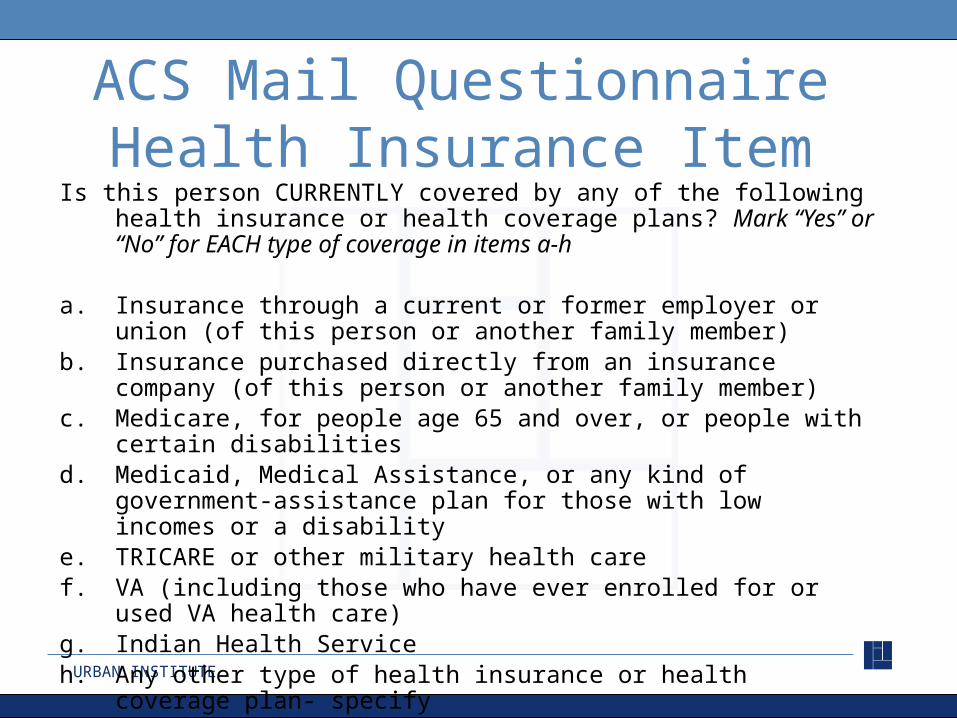
Is this person CURRENTLY covered by any of the following health insurance or health coverage plans? Mark “Yes” or “No” for EACH type of coverage in items a-h
a. Insurance through a current or former employer or union (of this person or another family member)
b. Insurance purchased directly from an insurance company (of this person or another family member)
c. Medicare, for people age 65 and over, or people with certain disabilitiesd. Medicaid, Medical Assistance, or any kind of government-assistance plan for
those with low incomes or a disabilitye. TRICARE or other military health caref. VA (including those who have ever enrolled for or used VA health care)g. Indian Health Serviceh. Any other type of health insurance or health coverage plan- specify
ACS Mail Questionnaire Health Insurance Item
URBAN INSTITUTE
• Concern that the ACS may understate Medicaid and CHIP coverage.
– Edit rules were applied that build on those developed by the Census Bureau to account for this. Result was an increase in estimated numbers of children and adults with Medicaid/CHIP and a reduction in the estimated number of uninsured children and an increase for adults—revised ACS estimates are closer to NHIS estimates.
• Simulation model uses state-level Medicaid and CHIP eligibility guidelines to determine eligibility of each child and parent based on family-level characteristics, including income.
Methods

URBAN INSTITUTE
• Participation rates are defined as the ratio of eligible children/parents enrolled in Medicaid/CHIP to those children/parents plus uninsured children/parents who are eligible for Medicaid/CHIP.
• Modeling eligibility/participation for adults is more difficult than for children due to greater complexity and variety in the pathways through which eligibility might be attained.
• All estimates use weights provided by the Census Bureau and standard errors use replicate weights that take into account the complex nature of the sample design.
Methods, cont.
URBAN INSTITUTE
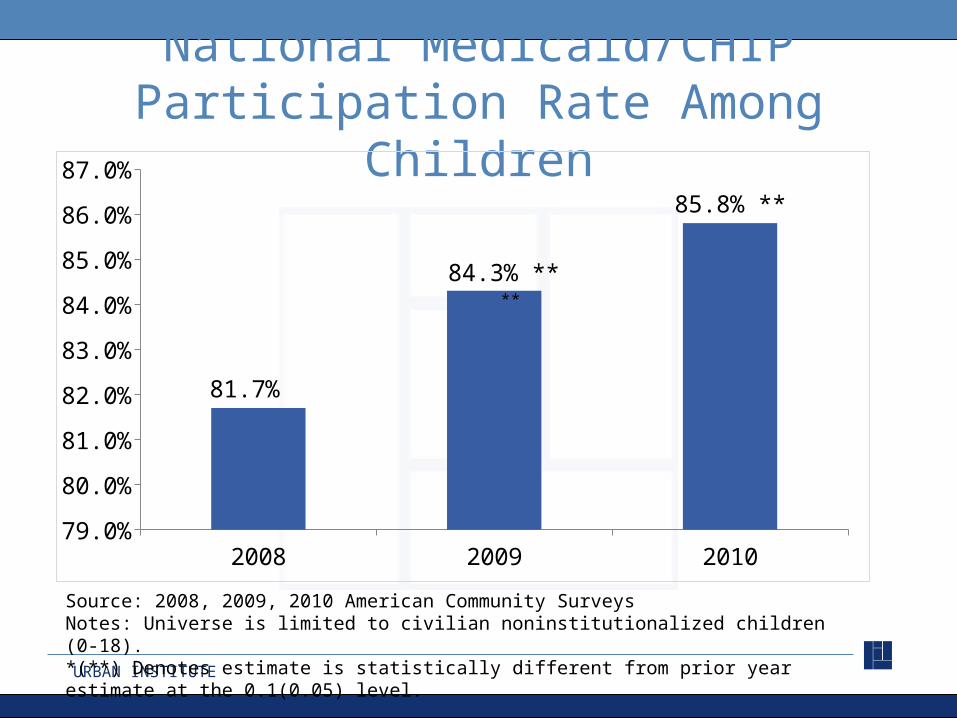
National Medicaid/CHIP Participation Rate Among Children
2008 2009 201079.0%
80.0%
81.0%
82.0%
83.0%
84.0%
85.0%
86.0%
87.0%
81.7%
85.8% **
84.3% ** **
Source: 2008, 2009, 2010 American Community SurveysNotes: Universe is limited to civilian noninstitutionalized children (0-18).*(**) Denotes estimate is statistically different from prior year estimate at the 0.1(0.05) level.

URBAN INSTITUTE
Changes in Medicaid/CHIP Participation Rates Among Children between 2008 and 2010
Source: Analysis of 2008 and 2010 American Community Surveys (ACS) data from the Integrated Public Use Microdata Series (IPUMS).Notes: ^ Denotes reference category within group. **(*) indicates estimate is statistically different from the reference category at the 0.05 (0.1) level. ++(+) indicates difference estimate is statistically different from zero at the 0.05 (0.1) level. Income is defined as gross income as a percentage of the Census defined poverty level.
Total 81.7% 85.8%
Age (years)
0 to 5 ^ 85.6% 89.9%6 to 12 82.4% ** 86.7% **
13 to 18 75.5% ** 79.5% **
English Speaking Parent in Home
At Least One ^ 84.3% 88.1%None 75.6% ** 80.5% **
Child Not Living with Parents 72.3% ** 77.4% **
Ethnicity or Race
Hispanic ^ 78.8% 84.1%White 81.4% ** 85.1% **
Black or African American 86.8% ** 90.5% **
Asian/Pacific Islander 79.2% 83.9%American Indian/Alaskan Native 68.4% ** 74.0% **
Other/Multiple 86.4% ** 88.5% **
Citizenship Status
Citizen Child with No Citizen Parents ^ 78.5% 85.0%Citizen Child with Citizen Parents 83.3% ** 86.9% **
Non-Citizen Child 78.5% 80.0% **
Child Not Living with Parents 75.5% ** 80.7% **
Rate2008 2010 Rate

URBAN INSTITUTE
Children’s Participation in Medicaid/CHIP, 2010
Source: 2010 American Community SurveyNotes: Universe limited to civilian noninstitutionalized children (0-18).

URBAN INSTITUTE
Source Analysis of Urban Institute Health Policy Center’s ACS Medicaid/CHIP Eligibility Simulation Model, based on American Community Survey (ACS) 2008, 2009 , and 2010 data from the Integrated Public Use Microdata Series (IPUMS). Notes Estimates reflect an adjustment for the underreporting of Medicaid/CHIP and military coverage on the ACS. *(**) Denotes estimate is statistically different from prior year estimate at the 0.1(0.05) level. #(##) Denotes 2010 estimate is statistically different from 2008 estimate at the 0.1(0.05) level.
Uninsurance Rate Among All Children, 2008, 2009, and 2010
2008 2009 20107.4%7.6%7.8%8.0%8.2%8.4%8.6%8.8%9.0%9.2%9.4%
9.2%
8.4%**
8.0%**##

URBAN INSTITUTE
2008 2009 20104000000
4100000
4200000
4300000
4400000
4500000
4600000
4700000
4800000
4900000
Estimated Number of Medicaid/CHIP Eligible but Uninsured Children
4.9 million
4.6 million
4.4 million
Source: 2008, 2009, and 2010 American Community SurveyNotes: Universe limited to civilian noninstitutionalized children (0-18).

URBAN INSTITUTE
Eligibility of Uninsured Children for Medicaid/CHIP Coverage, 2010
Source Analysis of Urban Institute Health Policy Center's ACS Medicaid/ CHIP Eligibility Simulation Model, based on data from the 2010 American Community Survey (ACS). Notes Estimates reflect an adjustment for the misreporting of coverage.
Eligible for Medicaid/CHIP, Less than 133% FPL (2.8 million)
Not Eligible for Medicaid/CHIP (1.9 million)
44.7%
30.4%
Eligible for Medicaid/CHIP, Greater than 133% FPL (1.6 million)
24.9%
{6.3 million uninsured in total}

URBAN INSTITUTE
Number of Eligible but Uninsured Children, Top 10 States
United States 4,457Texas 699 15.7% 15.7%California 666 14.9% 30.6%Florida 374 8.4% 39.0%Georgia 185 4.2% 43.2%New York 173 3.9% 47.0%Arizona 137 3.1% 50.1%Ohio 125 2.8% 52.9%Illinois 122 2.7% 55.7%North Carolina 120 2.7% 58.4%Indiana 119 2.7% 61.0%
Notes: Estimates reflect an adjustment for the misreporting of coverage on the ACS. Confidence intervals given at the
Source: Analysis of 2009/2010 Pooled American Community Surveys (ACS) data from the Integrated Public Use Microdata Series (IPUMS).
URBAN INSTITUTE
Opportunities to Cover More Children • Eligible but uninsured children are concentrated in
several states- almost half reside in just 5 states.– Successful efforts to enroll eligible children in these states
can have a large impact on the number of uninsured children nationwide.
• 1.8 million of the estimated 4.4 million eligible but uninsured children have uninsured parents who are currently eligible or could be under the ACA in 2014.– Policies aiming to insure parents are likely to have an impact
on their children’s insurance coverage as well.

URBAN INSTITUTE
Parents’ Participation in Medicaid/CHIP, 2010
Source: 2010 American Community SurveyNotes: Universe limited to civilian noninstitutionalized parents (19-64)
URBAN INSTITUTE
Participation Among Parents
• Participation rates among children are 20 percentage points higher than among parents nationally, with higher participation rates among children in every state.
• Participation patterns tend to be similar across states for both parents and children, though there are exceptions.

URBAN INSTITUTE
Eligible But Uninsured Parents
• One in 4 eligible parents was uninsured during 2009/2010.
• The uninsurance rate was over 40% among eligible parents in 8 states.
URBAN INSTITUTE
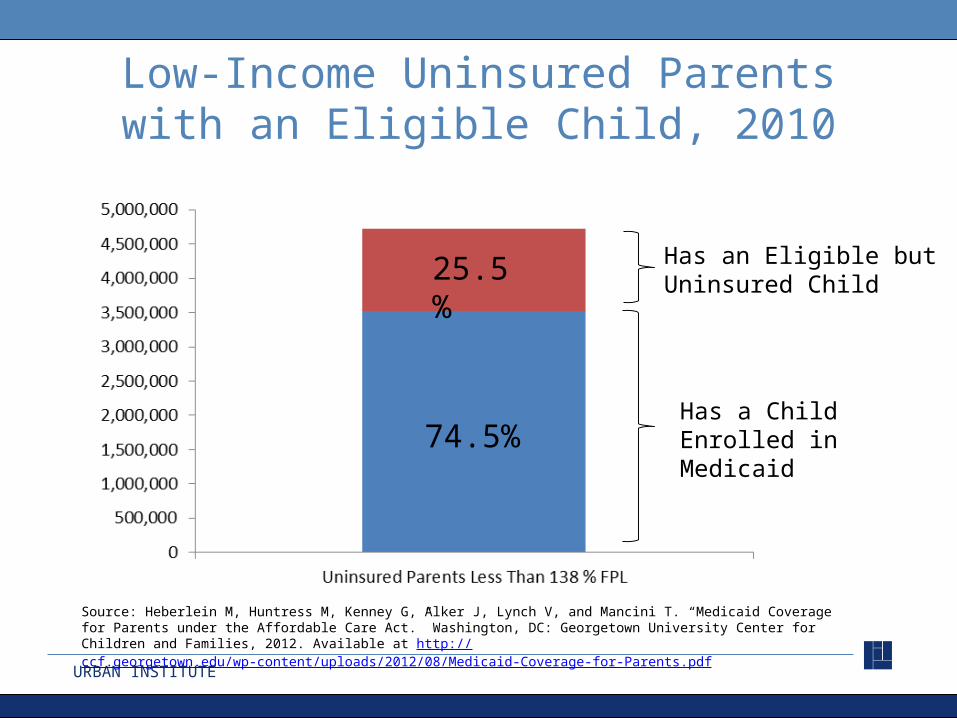
Low-Income Uninsured Parents with an Eligible Child, 2010
Source: Heberlein M, Huntress M, Kenney G, Alker J, Lynch V, and Mancini T. “Medicaid Coverage for Parents under the Affordable Care Act.” Washington, DC: Georgetown University Center for Children and Families, 2012. Available at http://ccf.georgetown.edu/wp-content/uploads/2012/08/Medicaid-Coverage-for-Parents.pdf
Has an Eligible but Uninsured Child
Has a Child Enrolled in Medicaid
25.5%
74.5%
URBAN INSTITUTE
Opportunities to Cover More Parents
• Approximately 2.2 million uninsured parents are currently eligible for Medicaid.
• Nearly three-quarters of the uninsured parents who could be eligible for Medicaid in 2014 have a child who is enrolled.– Target parents of children in Medicaid/CHIP for
enrollment
• Children’s participation increased after states implemented new policies under CHIPRA – Adopt the strategies that worked for children for adults

URBAN INSTITUTE
• Measurement error in coverage and other ACS data.
• Incomplete/inaccurate information in the eligibility simulation model.
• Small state estimates (such as North Dakota, Vermont, and Wyoming) are less precise because of the relatively smaller sample sizes available for them.
Limitations

URBAN INSTITUTE
Conclusions• Progress was made to reduce children’s uninsurance
between 2008 and 2010: – Successful outreach/enrollment efforts associated with increases in
Medicaid/CHIP participation and decreases in the number of eligible but children and the uninsured rate among children.
• Participation in Medicaid for parents trails behind children’s rates by large margins: – This may have adverse impacts not only on parents, but also on
their children’s and families’ health and wellbeing. – Many low income uninsured parents have children who are
enrolled in Medicaid/CHIP. This may serve as an efficient pathway to find and enroll eligible but uninsured parents, especially in 2014 for states that expand Medicaid.

URBAN INSTITUTE
• If fully implemented, the ACA is expected to reduce uninsurance among children and parents by 40 and 50 percent, respectively.– The gains projected under the ACA rely heavily on
increased enrollment in Medicaid/CHIP coverage and will depend on state-level decisions on the Medicaid expansion under the ACA as well as on state-level enrollment and retention polices.
Looking Ahead…

URBAN INSTITUTE
Works Cited• Heberlein M, Huntress M, Kenney G, Alker J, Lynch V, and Mancini T. “Medicaid Coverage for
Parents under the Affordable Care Act.” Washington, DC: Georgetown University Center for Children and Families, 2012.
• Kenney, G., M. Buettgens, J. Guyer, and M. Heberlein. 2011. “Improving Coverage For Children Under Health Reform Will Require Maintaining Current Eligibility Standards For Medicaid And CHIP.” Health Affairs 30(12): 2371-2381.
• Kenney, G., V. Lynch, J. Haley, M. Huntress, D. Resnick, and C. Coyer. 2011. Gains for Children: Increased Participation in Medicaid and CHIP in 2009. Washington, DC: Urban Institute and Robert Wood Johnson Foundation.
• Kenney, G., V. Lynch, M. Huntress, J. Haley, and N. Anderson. 2012. Medicaid/CHIP Participation Among Children and Parents. Washington, DC: Urban Institute and Robert Wood Johnson Foundation
• King, J., G. Kenney, and M. Huntress. 2011. “Reaching out in Rural AreasChildren’s Medicaid and CHIP Participation.” Presentation at Connecting Kids to Coverage: 2nd National Children’s Health Insurance Summit. Chicago, Il. November 3 rd, 2011.
• Lynch V., M. Boudreaux, and M. Davern. 2010. Applying and Evaluating Logical Coverage Edits to Health Insurance Coverage in the American Community Survey. Suitland, MD: U.S. Census Bureau, Housing and Household Economic Statistics Division
• Lynch V, G. Kenney, J. Haley, and D. Resnick. 2011. Improving the Validity of the Medicaid/CHIP Estimates on the American Community Survey: The Role of Logical Coverage Edits.
• McMorrow, S., G. Kenney, and C. Coyer. 2011. “Addressing Coverage Challenges for Children Under the Affordable Care Act.” Washington DC. The Urban Institute.