urban poverty in the global south
DESCRIPTION
PovertyTRANSCRIPT


Urban Poverty in the Global South
One in seven of the world’s population live in poverty in urban areas, and the vast majority of these live in the Global South – mostly in overcrowded informal settlements with inadequate water, sanitation, health care and schools provision. This book explains how and why the scale and depth of urban poverty is so frequently underestimated by governments and international agencies worldwide. The authors also consider whether economic growth does in fact reduce poverty, exploring the paradox of successful economies that show little evidence of decreasing poverty.
Many offi cial fi gures on urban poverty, including those based on the US$1 per day poverty line, present a very misleading picture of urban poverty’s scale. These common errors in defi nition and measurement by governments and international agencies lead to poor understanding of urban poverty and inadequate policy provision. This is compounded by the lack of voice and infl uence that low-income groups have in these offi cial spheres. This book explores many different aspects of urban poverty, including the associated health burden, inadequate food intake, inadequate incomes, assets and livelihood security, poor living and working conditions, and the absence of any rule of law.
Urban Poverty in the Global South: Scale and nature fi lls the gap for a much-needed systematic overview of the historical and contemporary state of urban poverty in the Global South. This comprehensive and detailed book is a unique resource for students and lecturers in development studies, urban development, development geography, social policy, urban planning and design, and poverty reduction.
Diana Mitlin is an economist and social development specialist working at the International Institute for Environment and Development (IIED), and a Professor at the University of Manchester, UK, working at the Global Urban Research Centre, the Institute for Development Policy and Management and the Brooks World Poverty Institute.
David Satterthwaite is a Senior Fellow at IIED and a Visiting Professor at the Development Planning Unit, University College London, UK. He is also editor of the international journal Environment and Urbanization.

‘This is a very important book. Urban poverty is seriously underestimated by dollar-a-day measures and national poverty estimates; it is neglected in terms of policy and action; and it is often sidelined in academic research and debates about development. This is really foolish – as the future of poverty is urban.
This book lays out in detail the ways in which present measures of poverty underestimate urban poverty and presents the data on urban poverty and inequality, and especially urban health deprivations. It demonstrates that research policy and action to improve the lives of low-income urban dwellers are a global priority. Read this book and your understanding of poverty will be transformed. I cannot recommend it highly enough.’
David Hulme, Brooks World Poverty Institute, University of Manchester, UK
‘With urban poverty growing at least as fast as booming urban populations, this is a challenging and constructive book. It challenges claims of global progress on poverty based on dollar-a-day poverty lines – these ignore the real costs and consequences of urban poverty. It challenges urban governments to meet their responsibilities – urban poverty has a local dimension which can and must be measured and tackled if urban poverty is to be reduced. And it shows how the challenges can be met.’
David Piachaud, London School of Economics, UK
‘Urban Poverty in the Global South: Scale and nature moves the discussion of the multiple dimensions of poverty out of the realm of theory and academic discourse, where the bulk of the literature has been concentrated, and shows how the recognition of multiple disadvantages can reframe and energize pro-poor policies and programs. Mitlin and Satterthwaite do more than outline the general principles that should guide the next generation of policy: they offer detailed, specifi c insights grounded in long experience with the urban poor of Africa, Asia, and Latin America. This book moves the fi eld forward.’
Mark Montgomery, Stony Brook University, USA

Urban Poverty in the Global SouthScale and nature
Diana Mitlin and David Satterthwaite

First published 2013by Routledge2 Park Square, Milton Park, Abingdon, Oxon, OX14 4RN
Simultaneously published in the USA and Canadaby Routledge711 Third Avenue, New York, NY 10017
Routledge is an imprint of the Taylor & Francis Group, an informa business
© 2013 Diana Mitlin and David Satterthwaite
The right of Diana Mitlin and David Satterthwaite to be identifi ed as authors of this work has been asserted by them in accordance with sections 77 and 78 of the Copyright, Designs and Patents Act 1988.
All rights reserved. No part of this book may be reprinted or reproduced or utilised in any form or by any electronic, mechanical, or other means, now known or hereafter invented, including photocopying and recording, or in any information storage or retrieval system, without permission in writing from the publishers.
Trademark notice: Product or corporate names may be trademarks or registered trademarks, and are used only for identifi cation and explanation without intent to infringe.
British Library Cataloguing in Publication DataA catalogue record for this book is available from the British Library
Library of Congress Cataloging-in-Publication DataUrban poverty in the global South : scale and nature / Diana Mitlin and David Satterthwaite.p. cm.Includes bibliographical references and index.1. Urban poor--Developing countries. I. Satterthwaite, David. II. Title. HV4173.M58 2013362.5’2091724--dc232012019196
ISBN13: 978-0-415-62466-4 (hbk)ISBN13: 978-0-415-62467-1 (pbk)ISBN13: 978-0-203-10431-6 (ebk)
Typeset in Times New Romanby Saxon Graphics Ltd., Derby

Contents
List of fi gures viiList of tables viiiList of boxes xAcknowledgements xi
1 Why this book? 1
Introduction 1The transition to an increasingly urbanized world 7How we came to be engaged in this issue 11Some notes on terminologies used 13
2 Measuring poverty 15
Introduction 15Understating urban poverty 20The unrealistic criteria used to set poverty lines 25Costs for non-food essentials 55Other limitations of poverty lines 70A framework for considering the multiple deprivations 89
3 Why is health so poor among low-income urban dwellers? 91
Introduction 91The determinants of health for urban populations 96Factors leading to poor health 102Urban poverty and mortality 105Urban poverty and nutrition 112Urban poverty and morbidity 114Urban poverty and environment 117Urban poverty and disasters 140Urban poverty and climate change 144

vi Contents
4 Incomes and livelihoods 151
Introduction 151Understanding the informal economy 155Securing income 164Labour and livelihoods 168Gender and generation 181Economies 193Conclusion 210
5 Critical issues in urban inequality 214
Introduction 214Why inequality matters 216Approaches and frameworks 220The experience of income inequalities 230‘Urban’inequality: The nexus between income, access to infrastructure and services and residential areas 249Political inequalities 266Conclusion 271
6 Broadening the understanding and measurement of urban poverty 278
Introduction 278Understanding the multiple deprivations associated with urban poverty 278Implications for incorporating the many dimensions of deprivation into poverty assessments and measurements 280Implications for reducing poverty 284The opportunities for enhancing income, consumption and services 286Implications for the measurement of urban poverty 290Urban poverty and health 295Comparing urban and rural poverty? 297Addressing inequality 301What is needed in a post-MDG world 303
Notes 304References 312Index 346
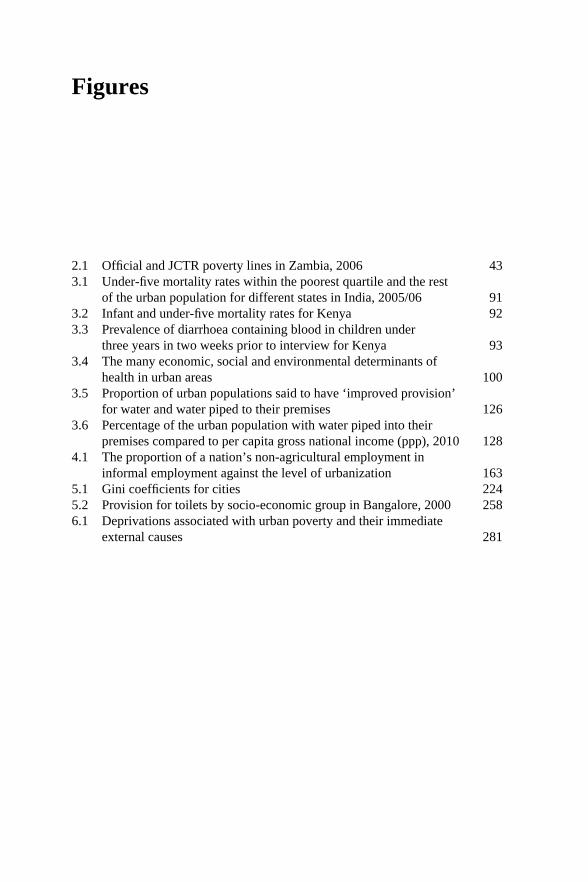
Figures
2.1 Offi cial and JCTR poverty lines in Zambia, 2006 433.1 Under-fi ve mortality rates within the poorest quartile and the rest
of the urban population for different states in India, 2005/06 913.2 Infant and under-fi ve mortality rates for Kenya 923.3 Prevalence of diarrhoea containing blood in children under
three years in two weeks prior to interview for Kenya 933.4 The many economic, social and environmental determinants of
health in urban areas 1003.5 Proportion of urban populations said to have ‘improved provision’
for water and water piped to their premises 1263.6 Percentage of the urban population with water piped into their
premises compared to per capita gross national income (ppp), 2010 1284.1 The proportion of a nation’s non-agricultural employment in
informal employment against the level of urbanization 1635.1 Gini coeffi cients for cities 2245.2 Provision for toilets by socio-economic group in Bangalore, 2000 2586.1 Deprivations associated with urban poverty and their immediate
external causes 281

Tables
1.1 The distribution of the world’s urban population by region 82.1 Number of times that urban poverty is mentioned in
28 poverty reduction strategy papers 262.2 Comparison of the number of times urban and rural poverty are
mentioned in 28 poverty reduction strategy papers 262.3 Levels of urban poverty according to ‘upper poverty lines’,
where some allowance is made for non-food needs, and the extent of the upward adjustment of ‘food poverty’ lines to take account of non-food needs 32
2.4 Intra-national variations in the per diems paid to international staff to cover living costs 53
2.5 Differentials in the prices paid for water 632.6 Degrees of poverty in urban areas 712.7 Summary of the Millennium Development Goals and their
associated targets 833.1 Examples of differentials in health and in health determinants
between the worst- and best-performing settlements within the urban population in low- and middle-income nations 96
3.2 Life expectancy at birth for cities in sub-Saharan Africa 1063.3 Examples of high under-fi ve mortality rates among national
urban populations 1073.4 Percentage of urban children stunted 1133.5 Estimates of the number and proportion of people without adequate
provision for water and sanitation in urban areas in 2000 1243.6 Provision for water and sanitation in Kenya’s largest urban centres 1343.7 Time needed for and incidence of problems in getting water in
informal settlements in Kenyan cities, 2006 1353.8 Household waste disposal in Kenyan cities, 2006 1353.9 Examples of likely impacts of climate change on urban populations 1474.1 Insecurity and vulnerability: a typology of employment and
enterprise categories for the self-employed 1574.2 Insecurity and vulnerability: a typology of employment and
enterprise categories for the employed 158

Tables ix
4.3 Subcategories of formal and informal work and their implications for poverty 159
4.4 Percentage of nations’ non-agricultural employment which is informal employment 161
4.5 Employment status and incidence of poverty among adult individuals in Nairobi and Dakar informal settlements, 2004 167
4.6 Employment in Nairobi’s informal settlements 1944.7 Household enterprises in Nairobi’s informal settlements –
primary activities 1955.1 Africa – comparative consumption inequalities 2345.2 Philippines – inequality estimates 2365.3 Comparative poverty and inequality in three sites in South Africa 2375.4 Income redistribution in South Africa 2445.5 Poverty in South Africa, 1993–2004 2455.6 Housing in San Salvador metropolitan area, 2000 2555.7 Housing and infrastructure in Tegucigalpa, Honduras, 2000 2565.8 Water and sanitation in Bangalore, 2000 2575.9 The interaction between inequalities, and their causes and
consequences 274

Boxes
2.1 Distinguishing between rural and urban areas 182.2 Different aspects of poverty 893.1 Women inhabitants’ assessments of provision for water and
sanitation in informal settlements in Mumbai and Pune, India 1303.2 Provision for water and sanitation in Kenya’s largest urban centres 1333.3 Fires and fi re risks in Imizamo Yethu, South Africa 1394.1 The role of informal employment in city case studies 1624.2 Street traders in Asia 1774.3 Livelihood and shelter strategies of one woman resident of
Chitungwiza, near Harare, Zimbabwe 1834.4 Informal work, low pay and poor nutrition in Accra 1845.1 Urban and rural income inequalities compared 2325.2 What happens when the state gets involved? 243

Acknowledgements
This book draws so much on all our friends within the many slum, shack-dweller and homeless people’s federations and networks and the local NGOs with whom we have worked or have visited over the last 20 years. It is also through these NGOs that we have come to meet and learn from many grassroots leaders. We learnt much from the perspectives they brought to rethinking poverty and how to reduce it.
We have drawn greatly on what we have learnt from friends and colleagues within the Human Settlements Group at IIED and at IIED-América Latina in Buenos Aires (especially the team that has worked for over 20 years in informal settlements).
In addition, there are the researchers and practitioners that have contributed working papers to our publication series on urban poverty, and papers on different aspects of urban poverty to the journal that we edit, Environment and Urbanization. We still owe a tremendous intellectual debt to Jorge Hardoy, who founded our research group and set new lines on which to consider urban poverty and how it should be reduced, lines which, even nearly two decades after his death, still inspire and inform us.
We are also very grateful to Khanam Virjee and Helena Hurd from Routledge for all their encouragement and support and to Kate Manson whose editing so improved our manuscript.


1 Why this book?
IntroductionWe believe that the scale and depth of urban poverty is ignored within most low-income nations, many middle-income nations and globally. We believe that this refl ects a considerable misrepresentation and underestimation of urban poverty, and occurs because of the very narrow ways in which poverty is usually conceived, defi ned and measured. This also refl ects a lack of interest from governments and international agencies in seeking to understand urban poverty and the many deprivations that it causes or contributes to. This book presents the evidence for these claims. A companion volume, to be published in early 2013, will focus on what has been learnt about the most effective means to reduce urban poverty.
This book also tries to make sense of why a large and growing evidence base on the multiple deprivations that are part of urban poverty has not helped change the ways that poverty is defi ned and measured. Part of the explanation is the extent to which the general literature on the defi nition and measurement of poverty does not draw on available evidence on urban poverty. But part of the explanation is the lack of attention given to urban poverty by development specialists. What began as our interest in why urban poverty was so often underestimated led us to more fundamental questions, including why urban issues are given so little attention.
Of course, poverty statistics are important for assessing the success (or not) of governments and of development assistance agencies (including aid agencies, development banks and international NGOs). The setting up of the Millennium Development Goals, with explicit targets for 2015 that have to be monitored in each nation, was meant to ensure more attention to poverty reduction. But as Chapter 2 shows, the main measure used for these goals (the dollar-a-day poverty line) is completely inappropriate for so many urban contexts. In addition, the direct measures of living conditions in the Millennium Development Goals are fl awed. The indicators chosen for assessing provision for water and sanitation do not measure who has adequate provision or, for water, whether it is safe to drink (as discussed in more detail in Chapters 2 and 3). And the MDG target for ‘slum dwellers’ – a signifi cant improvement in the lives of at least 100 million slum dwellers – is so much less ambitious than the other quantitative targets. While other quantitative targets are reductions by half (for hunger), two thirds (for

2 Why this book?
under-fi ve mortality rates) and three quarters (for maternal mortality), the quantitative target for signifi cantly improving the lives of slum dwellers is the equivalent of 10 per cent of slum dwellers in 2000, with no allowance for the growth in numbers of slum dwellers after 2000. And the date for the achievement of this far less ambitious quantitative target is set for 2020, not 2015. This book assembles the evidence to support its claims about the inadequacy of the indicators used and their measurement. In most nations, the evidence base on the scale, nature and location of urban poverty is remarkably limited. Also explored are some of the reasons for the lack of ambition in addressing the needs of slum dwellers, the immensity of the task, the lack of vision and capacity, and the consequences for those who are (and have long been) marginalized by the experts and agencies of international development assistance.
The strong infl uence of the World Bank in poverty assessment needs to be recognized. The Bank has helped ensure more attention is given to poverty in development plans and discussions. Most poverty lines are set following methodologies recommended by the World Bank and these are at the centre of why urban poverty is underestimated and misrepresented. The World Bank is also the main source for poverty statistics based on the dollar-a-day poverty line – as Chapter 2 explains – which underestimate the scale of urban poverty and misrepresent the tracking of income poverty for the Millennium Development Goals. World Bank data are available for an enormous number of development-related indicators for nations over time, but few are available for rural and urban areas, and even fewer are available for each district or city. When there are urban statistics, most are averages for national urban populations that generalize about what are so often very diverse experiences.
The measurement of poverty is always based on the construction of national poverty lines with limited, little or no adjustment for local costs and realities. As Chapter 2 describes, there is far more adjustment to local costs when setting the allowance for daily expenses for ‘experts’ – as there is in the offi cial rates set by the United Nations for these experts’ per diems when they work in low- or middle-income nations. Poverty lines are often not adjusted upwards for prosperous and high-cost cities, but allowances for much higher hotel costs certainly are made for foreign experts. This is part of a larger issue: so much offi cial data gathering relies on nationally representative sample surveys that can provide no data about each locality. So the understanding of poverty and its causes is constructed mainly on national sample surveys that have too little detail on key aspects of deprivation and sample sizes too small to be useful in identifying the nature, and spatial and social distribution of poverty. Not surprisingly, these surveys completely miss the particular political economy of poverty creation (or occasionally poverty reduction) in each locality. So it means very little detail of where the health or poverty problems identifi ed in these surveys are actually located. And the data provides no basis for planning and implementing local responses. To learn from some national sample survey (including the Demographic and Health Surveys1) that some precise percentage of a national (or a nation’s urban) population is lacking provision for water or sanitation or health care, or has a high infant mortality rate does not serve

Why this book? 3
needed policy responses, because it does not tell you where those facing these deprivations actually live. Somehow, the ‘data’ available to inform development has become lacking in information and detail about the local, in part to serve international agencies’ desire for national statistics that are comparable. As discussed in more detail in later chapters, this is true for statistics on poverty, on provision for water and sanitation, and on disasters and their impacts.
This lack of attention from the World Bank on understanding, measuring and acting on urban poverty is surprising because it was among the fi rst of the international development assistance agencies to recognize the scale of deprivation in urban centres and to promote new approaches that sought to work with the inhabitants of slums or informal settlements2 in upgrading their homes and neighbourhoods (Cohen 1983). The World Bank was also, in the 1970s, among the fi rst international agencies to demand greater focus on ‘meeting basic needs’, which was in effect a recognition of the need to address the needs of those ‘living in poverty’. However, whatever the reason for the lack of attention since then, it has been replicated in many national processes – while these may establish poverty lines that are more precise than the ‘dollar a day’, they often fail to take into account the costs of living (or more specifi cally the costs of non-food needs) in urban areas.
This book and its companion volume (Satterthwaite and Mitlin 2013) also highlight the lack of any engagement by governments and international agencies with low-income groups (‘the poor’3) in the defi nition of poverty and the setting of poverty lines. It is so often external specialists who set the criteria by which poverty is defi ned and measured within low- and middle-income nations. One wonders whether they have ever consulted these urban dwellers on the deprivations they face. After 60 years of development assistance, there is still very little dialogue between low-income groups, and development assistance agencies and national governments. Those who are often termed ‘the poor’ are not consulted about the ways in which poverty is defi ned and measured. Nor are they consulted about their priorities, or about what they do to avoid deprivation. There is no understanding of the knowledge, capacity and resources they bring to coping with poverty – and could bring to reducing it. Our analysis of poverty is not undertaken as an abstract exercise but in the hope that it will support more effective action. Low-income individuals and households in the towns and cities of the Global South face a constant struggle to make something of their lives despite the acute hardship and disadvantage that they face. The companion volume to this will discuss how governments and some international development assistance agencies have sought to address urban poverty, the underlying concepts behind these interventions and the limitations in their approaches. It will also discuss how the transformation of our understanding of urban poverty and its underlying causes can point to far more effective ways of reducing it. It will describe and analyse the depth and complexity of social movement strategies aimed at challenging adversity and securing justice and inclusion.
It seems to us that most of those who defi ne and set poverty lines do not have much understanding of the informal or illegal settlements in which such a high

4 Why this book?
proportion of low-income urban dwellers live, or of the actual costs they face or of the prices paid for non-food needs (most of which are unlikely to be captured in international price comparisons). For instance, as Chapter 2 shows, there are very large differences in the prices paid for water per litre, with those with the worst access usually paying the most and often paying many times the price of water from the mains. How would this be treated in international price comparisons?
There seems to be an assumption in much of the discussion of poverty that it is really only food costs that count. So if the income of an individual or household is enough to afford food costs, they are not really poor. Extreme poverty lines, usually set at levels that allow for only enough to buy food, are still regarded as valid. But access to water, to toilets and to accommodation are also needed by everyone, and these are commodities that have to be purchased in most urban areas. There is also an assumption that if the proportion of income that a household spends on food is less than 70–80 per cent, it is not poor. But in many urban contexts, some non-food needs are so costly that they push down the proportion of income spent on food. A fall in the proportion of income spent on food may be taken as a sign of less poverty – but it may also be a sign of higher prices having to be paid for non-food needs (rent or water prices going up or new or increased payments required to keep children at school).
In many nations, there is little link between how poverty is defi ned and measured and actions by government and international agencies to address the deprivations faced by those classifi ed as ‘poor’. Piachaud suggests the study of poverty is only justifi able ‘if it infl uences individual and social attitudes and actions’ and that this ‘must be borne in mind constantly if discussion on the defi nition of poverty is to avoid becoming an academic debate … a semantic and statistical squabble that is parasitic, voyeuristic and utterly unconstructive and which treats “the poor” as passive objects for attention’ (Piachaud 1987, page 161, quoted in Lister 2004; italics added). Most defi nitions of poverty and most measurements treat ‘the poor’ as passive objects. And many, by so underestimating and misrepresenting urban poverty, help ensure that the urban poor gain little attention.
Chapter 2 will challenge offi cial poverty statistics that suggest that a very small proportion of the world’s urban population are poor. According to Ravallion, Chen and Sangraula (2007), using the dollar-a-day poverty line ($1.08 a day at 1993 purchasing power parity), in 2002, less than 1 per cent of the urban populations of China, the Middle East and North Africa, and East Europe and Central Asia were poor. In Latin America and the Caribbean, less than 10 per cent of the urban population was poor. For all low- and middle-income nations, 87 per cent of their urban populations were not poor. If these fi gures are correct, it represents a triumph for development. Deaton and Dupriez (2011) suggest that the dollar-a-day poverty line used by the World Bank is actually too high; they do not give separate fi gures for rural and urban populations but their fi gures suggest that in 2005 in the Middle East and North Africa, only 3 million out of 242 million people are poor (i.e. 1.2 per cent). For Latin America and the Caribbean, only 30 million out of 535 million are poor (i.e. 5.6 per cent).

Why this book? 5
But get the poverty defi nitions and hence measurements wrong, and it can provide the basis for so many inappropriate responses – including the conviction that almost all poverty is in rural areas. It can produce nonsense statistics about the extent to which the Millennium Development Goals are being met in many nations. It may underpin inaccurate assessments of the extent to which economic growth reduces poverty.
Although there are lots of statistics about poverty, there is actually very little data collected on low-income groups or those that live in informal settlements, the costs they face (especially for non-food needs) and their living conditions. For instance, in most nations, little or no attempt is made to assess the cost that urban dwellers face in meeting non-food needs – including the cost of renting accommodation, of keeping children at school, of transport, of medicines and health care, of paying for fuel, water and access to toilets … . The scale and nature of urban poverty is not well documented in many nations.
At the core of our criticism is the use of inappropriate frameworks, tools and methods for defi ning and measuring poverty. Most of the tools and methods used today in low- and middle-income nations are based on those developed in high-income nations many decades ago. As these were fi rst applied, they were usually subject to professional and popular scrutiny, and this changed the ways that poverty was understood and measured. But these tools and methods (many of which are no longer applied in high-income nations) have been transferred without questioning many assumptions that underpinned their use which are not appropriate for low- and middle-income nations. For instance, when poverty lines came to be used in the UK, no provision was made to include the costs to individuals or households of health care and education because there was a national system in place that provided these at no cost. But education and health care are not free and not available to very large sections of the urban population in most low- and middle-income nations, where keeping children at school (or having to pay for private schools as they cannot get their children into government schools) and paying for health care and medicines often takes a signifi cant proportion of total income (see Chapter 2). Or the lack of income means that children are not sent to or are withdrawn from school, and needed health-care treatments and medicines are not used.
Similarly, in the use of poverty lines in the UK the costs of housing were not factored in because accommodation for low-income households was addressed by another government department; the costs of housing in low- and middle-income nations are often not factored into poverty lines, or unrealistically low allowances for this are made, yet there is no other provision to support low-income groups in getting accommodation. In high-income nations, almost all urban dwellers, regardless of income, live in houses that meet offi cial standards, with water piped in, toilets in each unit and regular services to collect solid waste. This is not the case for a high proportion of low-income urban dwellers elsewhere – and this often means high costs, as water has to be purchased from vendors or kiosks and access to toilets paid for.
The debates and discussions about better ways to defi ne and measure poverty in high-income nations over the last three decades have had very little infl uence

6 Why this book?
on how poverty is defi ned and measured in low-income and most middle-income nations. There is very little consideration of the limitations of setting absolute poverty lines. Indeed, the discussions around the setting of poverty lines in low- and middle-income nations today seem so anxious not to set these too high that they set them unrealistically low. There was actually more accuracy, detail and generosity in the defi nition and setting of poverty lines in the last years of the nineteenth and the beginning of the twentieth century in the UK than there is today in many nations. It is perhaps also worth noting that the fi rst study that sought to establish the income needed to avoid poverty (and how this would vary for different family sizes and compositions) was for a particular city (York ) and involved careful research into local conditions and prices (Rowntree 1902).
There are also very large differences in context and in data. For instance, how can there be a strong offi cial information base about the quality of housing and quality and extent of basic service provision in urban areas if a third to two thirds of the urban population live in informal or illegal settlements, many of which have never been included in any offi cial survey and lack any public provision for water, sanitation and drainage? And if they are included, this is almost universally only for the more offi cial and longstanding of the informal settlements, leaving out those that are likely to have the worst conditions. How can assumptions be made about the value of government services within poverty lines when large sections of the low-income urban population cannot get their children into government schools and cannot access government health care or other entitlements? This book will make clear that the proportion of the urban population that ‘lives in poverty’ is often far higher than the proportion defi ned as poor by offi cial poverty lines.
Some of the defi ciencies in the defi nition and measurement of urban poverty have been addressed in the last 10 to 15 years. But there is little evidence of any real engagement with most aspects of urban poverty by those who defi ne and measure poverty. For instance, it is common for the long and complex poverty assessments that are often undertaken in low- and middle-income nations (including poverty assessments and poverty reduction strategy papers4) not to mention ‘slums’, ‘squatter settlements’ or informal settlements, or to only mention them in passing without any considered analysis (see Chapter 2). This raises the issue of whether their inhabitants’ needs are actually covered by surveys. Since it is common for 30–60 per cent of the population of cities to live in illegal or informal settlements, one wonders if those who collect household data cover these. Do the sample frames for national surveys ensure suffi cient inclusion of those living in informal settlements – including settlements for which there are no maps or street names, and that do not appear in government statistics? Many case studies have pointed to the high prices that those living in informal settlements pay for water and sanitation (and sometimes for education and health care) and the high prices that many tenants pay for housing, but these are rarely refl ected in the provisions for ‘non-food needs’ in poverty lines.
This book will present numerous examples of poverty statistics applied to urban populations that are inappropriate or inaccurate – including some that are

Why this book? 7
nonsense. But inaccurate statistics (and sometimes nonsense statistics) are being used in ways which greatly overstate success in urban poverty reduction. This includes both national poverty lines and the international US$1 per person per day poverty line that is being used to monitor progress towards the Millennium Development Goals. The book will also question the assumption that cities’ key role in economic growth necessarily supports urban poverty reduction; indeed, many of the most successful cities in low-income nations have seen a rapid growth in the proportion of their population suffering poverty-related deprivations.
Finally, this book emphasizes the need to assess the validity of offi cial defi nitions and measures of poverty in the context of particular cities. In most (possibly all) nations, there are likely to be signifi cant differences in the income needed to ‘avoid poverty’ between different cities (and even between districts within cities) and these need to be taken into consideration. For large, economically successful cities with ineffective government of land, infrastructure and services, the income needed to ‘avoid poverty’ may be several times higher than the current poverty line. Certainly in a great many urban contexts the dollar-a-day poverty line (including its latest incarnation as $1.25 a day at 2005 prices), even with adjustments for purchasing power parity, is completely inappropriate.
This book includes examples that come from research that might be considered too far in the past to have a contemporary relevance – for instance reports on poverty in Harare (Zimbabwe) and the direct and indirect health costs low-income groups faced in Khulna (Bangladesh) in the early 1990s. We chose to include these and other such studies in part because of the quality and detail of their insights, in part because of the lack of more recent detailed research into urban poverty, and in part because we believe that they provide historical insight that is still relevant today.
The transition to an increasingly urbanized worldWe will not discuss in detail the growth in the urban population in the Global South and its underpinnings. Table 1.1 summarizes the most recent statistics available for urban populations and urban trends for different regions from 1950 to 2010, and projections for 2030 and 2050. A few points are worth noting, however.
1 Today, urban areas in what the UN terms the ‘less developed’ regions – which we term the ‘Global South’ – have around 2.7 billion inhabitants. This means that these urban areas have close to two fi fths of the world’s total population and close to three quarters of its urban population. The Global South also has most of the world’s large cities and most of its mega-cities. Of the twenty-three cities whose population was reported to exceed 10 million by 2011, only fi ve were in high-income nations (two in Japan, two in the USA, one in France). Of the remaining eighteen, four were in China, three in India and two in Brazil (United Nations 2012).

8 Why this book?
Table 1.1 The distribution of the world’s urban population by region, 1950–2010, with projections for 2030 and 2050
Major area, region or country
Year projected for1950 1970 1990 2010 2030 2050
Urban population (millions of inhabitants)
World 745 1,352 2,281 3,559 4,984 6,252
More developed regions 442 671 827 957 1,064 1,127Less developed regions 304 682 1,454 2,601 3,920 5,125 Least developed countries 15 41 107 234 477 860Sub-Saharan Africa 20 56 139 298 596 1,069Northern Africa 13 31 64 102 149 196Asia 245 506 1,032 1,848 2,703 3,310 China 65 142 303 660 958 1,002 India 63 109 223 379 606 875Europe 281 412 503 537 573 591Latin America and the Caribbean
69 163 312 465 585 650
Northern America 110 171 212 282 344 396Oceania 8 14 19 26 34 40
Proportion of population in urban areas (%)
World 29.4 36.6 43.0 51.6 59.9 67.2
More developed regions 54.5 66.6 72.3 77.5 82.1 85.9Less developed regions 17.6 25.3 34.9 46.0 55.8 64.1 Least developed countries 7.4 13.0 21.0 28.1 38.0 49.8Sub-Saharan Africa 11.2 19.5 28.2 36.3 45.7 56.5Northern Africa 25.8 37.2 45.6 51.2 57.5 65.3Asia 17.5 23.7 32.3 44.4 55.5 64.4 China 11.8 17.4 26.4 49.2 68.7 77.3 India 17.0 19.8 25.5 30.9 39.8 51.7Europe 51.3 62.8 69.8 72.7 77.4 82.2Latin America and the Caribbean
41.4 57.1 70.3 78.8 83.4 86.6
Northern America 63.9 73.8 75.4 82.0 85.8 88.6Oceania 62.4 71.2 70.7 70.7 71.4 73.0
Proportion of urban population (%)
World 100.0 100.0 100.0 100.0 100.0 100.0
More developed regions 59.3 49.6 36.3 26.9 21.4 18.0Less developed regions 40.7 50.4 63.7 73.1 78.6 82.0 Least developed countries 2.0 3.0 4.7 6.6 9.6 13.8Sub-Saharan Africa 2.7 4.1 6.1 8.4 11.9 17.1Northern Africa 1.7 2.3 2.8 2.9 3.0 3.1

Why this book? 9
Major area, region or country
Year projected for1950 1970 1990 2010 2030 2050
Asia 32.9 37.4 45.2 51.9 54.2 52.9 China 8.7 10.5 13.3 18.6 19.2 16.0 India 8.5 8.1 9.8 10.6 12.2 14.0Europe 37.6 30.5 22.0 15.1 11.5 9.5Latin America and the Caribbean
9.3 12.1 13.7 13.1 11.7 10.4
Northern America 14.7 12.6 9.3 7.9 6.9 6.3Oceania 1.1 1.0 0.8 0.7 0.7 0.6
Source: Data from United Nations (2012)
2 This concentration of the world’s urban population and its largest cities outside high-income nations represents an important change, in that historically most of the world’s urban population and most of its largest cities have been in its most prosperous nations. Table 1.1 shows the very large decrease in the proportion of the world’s urban population in high-income countries and regionally in Europe between 1950 and 2010, and the very large increase in the proportion of the world’s urban population in low- and middle-income countries (and regionally in Asia, with more than half this increase coming in China). In 1950, the nations that now make up Europe had nearly two fi fths of the world’s urban population; now they have around 15 per cent and they may have less than 10 per cent by 2050. It is also worth noting the scale of the growth in urban population in the Global South. If we take 1975 as a time when there was a growing concern that rural poverty was being ignored, between 1975 and 2010, the urban population in the Global South tripled (growing by 1.8 billion) while the rural population grew by 38 per cent (848 million). By 2020, the urban population in the Global South is likely to exceed its rural population. By 2010, among the regions in the Global South with more than half their population in urban areas were Northern and Southern Africa, Eastern and Western Asia and the Caribbean, Central America and South America. In 1970 only Central and South America were in this category (United Nations 2012).
3 However, there is still an economic logic underpinning urbanization (the increase in the proportion of a population living in urban areas) and the growth of most large cities. Most new capital investments and most new employment opportunities are concentrated in urban areas – or, more accurately, in particular urban areas (to which there are also generally the largest new migration fl ows). The world’s largest cities are heavily concentrated in the world’s largest economies – even if not all of these are among the economies with the highest per capita incomes. (For instance, China is the world’s second largest economy and India is among the world’s largest economies, and these two nations have a high concentration of the

10 Why this book?
world’s largest cities). All the world’s wealthiest nations are predominantly urban5 and virtually all the low- and middle-income nations that have urbanized most over the last few decades have experienced long periods of rapid economic growth and large shifts in the structure of their economy and employment, from agriculture, forestry and fi shing to industry and services. Most nations (and all relatively urbanized nations) have most of their GDP generated by industry and services and most of their workforce in these sectors. There are nations or regions of nations where there have been rapid migration fl ows to urban areas (or particular cities) that are not responses to economic growth – including some related to civil strife, rural impoverishment or disasters – but this does not alter the fact that most urbanization is linked to economic growth.6 However, the validity of international comparisons on the relationship between increasing levels of urbanization and economic growth are limited by the different criteria used by governments to defi ne their urban populations (as discussed in Chapter 2). Almost all commentaries on urban change globally include a comment that sub-Saharan Africa is urbanizing rapidly (or even that it is doing so at unprecedented rates). But some care is needed on this issue because of the lack of census data for many nations in this region. There are also the careful analyses by Deborah Potts that suggest that much of the region has not been urbanizing rapidly in the last decade or two (see Potts 2009). The latest UN statistics on urban trends also suggest that sub-Saharan Africa has not been urbanizing as rapidly as had been previously stated or expected. These suggest that the rate of increase in the level of urbanization was much more rapid in Asia than in sub-Saharan Africa for the periods 1990 to 2000 and 2000 to 2010. Eastern Asia (and China) had particularly high rates of urbanization between 2000 and 2010 (United Nations 2012).
4 Even if most new investment and employment opportunities are in urban areas, there has still been a rapid growth in the number of low-income urban dwellers. As Chapter 5 will describe, most of the benefi ts of economic growth go to non-poor groups. Certainly, the scale of urban poverty today is much larger than it was in the mid-1970s – and the proportion of the world’s population with inadequate incomes who live and work in urban areas has increased. But (as Chapter 2 explains) we do not know by how much because of the inadequacies in the international measurement of poverty.
5 To have detailed statistics on urban change for any nation over several decades does not mean that we understand its underpinnings – and these statistics are often misinterpreted because the degree to which they are based on estimates and projections, in the absence of census data, is not made explicit. The United Nations data sets on urban populations (the latest of which is United Nations [2012]) have long cautioned against this and they also specify which censuses have been drawn on for each nation – but these details are often overlooked. We can learn about the social, economic and political underpinnings of urbanization from a few detailed, historically rooted analyses of urban change in particular nations, and these remind us

Why this book? 11
how complicated and varied such change is. They also show how much it can vary within a nation and over time, and the complex mix of local, regional and international economic, social and political infl uences on it, as well as the effects of demographic changes – see, for example, Hasan and Raza (2002), Martine and McGranahan (2010), UNCHS (1996; this report has sections exploring this point for each of the world’s regions), and Manzanal and Vapnarsky (1986; an example of a sub-national region). Reading these studies should also encourage more caution in international comparisons of urbanization, which so often are dogged by inadequate knowledge of the countries being compared and inadequate appreciation of the defi ciencies or lack of compatibility in the statistics used for comparison.
6 The projections for urban populations in 2030 and 2050 shown in Table 1.1 are, of course, based on certain assumptions. We have long worried about projections for city populations or for levels of urbanization far into the future because future city populations and levels of urbanization are so much infl uenced by economic change. They are also sometimes infl uenced by political change – for instance, if the economic and political changes in China in the late 1970s and early 1980s and its subsequent economic success and integration into the world economy had not taken place, the list of the world’s largest cities and the scale of the world’s urban population would have been quite different today. The size of the world’s urban population in 2030 will be much infl uenced by the economic performance of the low- and middle-income nations with larger populations. Many of the UN projections for the population in the world’s largest cities made in the 1970s and 1980s for 2000 proved to be spectacularly wrong (see Satterthwaite 2007a, 2010). Few economists would dare to predict how well the economy of most nations will perform up to 2050. So we urge caution in using these projections. But what we do want to emphasize is the scale of the urban population in the Global South today and the likelihood that it will continue to house an increasing proportion of the world’s population.
How we came to be engaged in this issueFor more than two decades, we have had the chance to visit and collaborate with local NGOs that work with the residents of informal settlements or other low-income groups in urban areas in Africa, Asia and Latin America. We cannot produce empirical evidence documenting the precise scale and nature of the very poor quality and overcrowded conditions, and lack of infrastructure and services that exist in the tenements and informal settlements we have visited. We cannot produce evidence of the health burdens, premature deaths, evictions and other diffi culties that their inhabitants talk to us about. But spending time walking through Kibera or other informal settlements in Nairobi (which house around half the city’s population) makes it diffi cult to accept suggestions that a very small proportion of Kenya’s urban population is poor. Walking through informal settlements in Dar es Salaam and listening to the inhabitants discuss their

12 Why this book?
diffi culties with accessing water and sanitation makes it diffi cult to take seriously offi cial UN statistics on provision. For instance, the UN global assessment for 2000 suggested that 98 per cent of Tanzania’s urban population had ‘improved sanitation’ (and many other sub-Saharan African nations had similar levels), and these very high levels of coverage were widely cited as evidence of urban populations benefi ting from biases in development policies (UNICEF and WHO 2000). But at least some later estimates have greatly cut this (the 2012 UN assessment suggests only 15 per cent of Tanzania’s urban population had improved sanitation in 2000, rising to 20 per cent in 2010 – see UNICEF and WHO 2012). Sitting in on the discussions of women pavement and slum dwellers in Mumbai (Bombay) about the diffi culties they face getting water (see Bapat and Agarwal 2003) makes it diffi cult to accept the offi cial statistic that 100 per cent of the city’s population has access to piped water. When statistics are being produced on urban poverty where data is lacking, perhaps there is a need to develop ways to test the validity of these statistics, drawing on the knowledge of those with experience of conditions in the urban areas in question.
We also made the mistake of not engaging with how poverty is defi ned and measured until the early 1990s. We work in a research group that has long sought to document the scale and nature of deprivation in urban areas in low- and middle-income nations with regard to housing, infrastructure, services and tenure (see Hardoy and Satterthwaite 1981, 1989), with regard to health (Hardoy, Cairncross and Satterthwaite 1990) and with regard to environmental risks (Hardoy, Mitlin and Satterthwaite 1992, 2001). We have also sought to cover in some detail the most pressing environmental health issues facing low-income urban dwellers (Hardoy and Satterthwaite 1984; Hardoy, Mitlin and Satterthwaite 1992, 2001; Satterthwaite et al. 1996); so too have our colleagues (see, for instance, Bartlett 2002; Bartlett et al. 1999; McGranahan et al. 2001). The environmental health issues associated with water and sanitation have also been covered in two books prepared by our research team for UN-HABITAT (UN-HABITAT 2003a, 2006). The environmental problems associated with disasters have been covered in detail in the 2010 World Disasters Report that we helped prepare for the IFRC (IFRC 2010). Some consideration of the environmental health problems associated with climate change were addressed in Bicknell, Dodman and Satterthwaite 2009. The journal we edit and publish, Environment and Urbanization, has also had three special issues on urban health,7 the most recent in April 2011.
It was only when we began to notice the differences between estimates for the proportion of the urban population defi ned as poor and the proportion ‘living in poverty’ that we began to look at how poverty was defi ned and measured. This difference became more evident from the papers presented at an international seminar we helped organize in 1994 on urban poverty.8 Since then, we have paid more attention to how urban poverty is defi ned and measured and this book draws together and updates various working papers and reports we have written over the last 15 years.9
For people whose research is based more on qualitative techniques, it is often diffi cult to understand the reasons for what can be judged to be the inadequacies

Why this book? 13
in the questions asked in large-scale quantitative surveys, and for what appear to be questionable assumptions made when interpreting results to defi ne and measure poverty. In addition, much of the general literature on poverty lines is not very accessible to non-economists, but this book suggests that poverty defi nitions (including poverty lines) need to be scrutinized and questioned by a broader range of people, including urban poor organizations and the professionals who work with them. And, as covered in the fi nal chapter and developed more fully in the companion volume to this, working with these groups can do much to generate the data needed to support poverty reduction that is so lacking today.
Some notes on terminologies usedWe use the term ‘Global South’ because the terms used by the United Nations – ‘developing countries’, ‘less developed countries’ or ‘less developed regions’ – seem so inappropriate. Countries or regions that are more or less developed by what criteria – and by whose criteria? We acknowledge that the term ‘Global South’ is not very accurate geographically (a lot of the Global South is actually north of the equator). We used to use the term ‘Third World’ because its origins were based on the idea of the ‘Third Estate’ (the people) and it was a term chosen by non-aligned nations during the Cold War, but many interpreted this term as implying inferiority to the First World (high-income market economies) and Second World (what was the Soviet Union and other centrally planned economies). The term ‘Third World’ also became imprecise with the break-up of the Soviet Union and economic and political changes in many of the formerly centrally planned economies.
The ‘Global South’ is taken to include all nations classifi ed by the World Bank as low- and middle-income that are in Africa, Asia and Latin America and the Caribbean. It does not include low- and middle-income nations in Eastern Europe, including the Russian Federation, although clearly these have serious problems with urban poverty. There are also some countries in Africa, Asia and the Caribbean that have become high-income countries and yet may still be classifi ed as being within ‘less developed regions’ – for instance South Korea, Singapore, some small island nations, and some oil-rich nations in the Middle East. All European nations are included in the ‘more developed’ category by the UN, but many are not high-income nations – notably the Russian Federation and nations that emerged from its break-up or were part of its sphere of infl uence during the Cold War. Of course, when considering likely urban populations up to 2030, many nations may shift from the middle-income to the high-income classifi cation.
We had intended to avoid using the term ‘slum’ because of its derogatory connotations. Classify a settlement as a slum and it implies that it is poor quality and needs replacing (‘slum clearance’), so helping to legitimate the eviction of its inhabitants and the destruction of their homes. The term ‘slum’ is often used as a general term for a range of different kinds of housing or settlement, many of which provide valuable accommodation for low-income groups and do not need replacement but rather provision for infrastructure and services. However, it is

14 Why this book?
diffi cult to avoid the term for at least three reasons. The fi rst is that it is used in studies from which we want to draw. Second, some important urban poor groups have organized themselves as slum-dweller organizations or federations; although it could be argued that, while they may choose to include the term ‘slum’ in their titles, it is not appropriate for others to use it. It is also notable that in some Asian nations there are advantages for informal settlements in being recognized offi cially as ‘slums’ – indeed, residents may even lobby to become a ‘notifi ed slum’. The third reason is that the only global estimates for defi ciencies in housing collected by the United Nations are for slums. We continue to avoid the term where possible.
We also wish we could have avoided the term ‘the poor’, as it is so often used by external professionals and institutions to defi ne or classify groups in the population without their approval or even knowledge. And working with those classifi ed as ‘poor’ reveals how ‘unpoor’ they are in so many respects, especially in their competence and capacity to live with little income, with poor returns for their hours worked, with many costs and deprivations that should not be there. As noted in the acknowledgements, we have learnt so much from our work with and interactions with people and groups classifi ed as being among ‘the poor’. The chance to work with them or simply to visit them, sit in on their discussions or watch them work together – and watch them negotiate with politicians and civil servants – is to be reminded of this competence. Their willingness to talk to us and their generosity when we visit them also reminds us of the perils of classifying them as ‘poor’. We also see their capacity to work collectively and their willingness to work in partnership with local governments as one of the critical foundations for poverty reduction – as elaborated in the companion volume to this.
Where possible, we have replaced the use of the term ‘poor’, with something more precise, for example, ‘low-income’ or ‘resident of an informal settlement’.

2 Measuring poverty
Introduction
How different defi nitions infl uence the scale of poverty
Defi ning and measuring poverty is important to the work of governments, since this should help identify who is in need. It should also help identify the nature of need, which then serves as the basis for identifying the actions required to address need. Appropriate and accurate measurement methodologies need to be at the centre of the policies and interests of any aid agency, development bank or international NGO, whose very existence is justifi ed by their contribution to reducing poverty. In this context, it is important to get the defi nition and measurement right. This may also be important for governance as those suffering deprivations caused by poverty need to feel that their needs and priorities are represented within the defi nition and measurement processes (as well as in subsequent policies and actions).
Defi ning poverty may be considered to be relatively simple: there is not much disagreement that everyone needs suffi cient nutritious food, access to services such as health care and schools and a secure home with adequate provision for water and sanitation. It is accepted that ‘adequate’ income is the primary means by which urban individuals or households can meet these needs, in part because in urban areas there is generally less scope for self-production of food, housing or other needs. So a poverty line set at a particular income level can be used to measure who is poor, with a market value being attributed to self-production where relevant. This means that those who have suffi cient income for a set of goods and services considered as ‘needs’ are non-poor and those who do not are poor. There are needs other than suffi cient income such as the rule of law and respect for civil and political rights (and the means to ensure these are realized) – although these are not usually seen as part of poverty (even if inadequate rule of law and breaches of civil and political rights are often associated with poverty and may be major causes or contributors to poverty). There is also recognition that asset bases are important for allowing low-income individuals or households to avoid or better cope with poverty (Moser 1998, 2006a, 2006b, 2007) but very few poverty-line defi nitions include any consideration of assets – although sometimes assets are assessed separately within poverty assessments.

16 Measuring poverty
Despite the apparent simplicity of understanding what poverty is, there is no agreement on how best to defi ne and measure it. Different methodologies, the goods included as needs, price estimation techniques, and proxy value estimates all lead to different results. During the late 1990s, there were at least four fi gures for the proportion of Kenya’s urban population who were poor, ranging from 1 to 49 per cent.10 In the Philippines, in 2000, the proportion of the national population with below-poverty-line income was 12, 25, 40 or 45–46 per cent, depending on which poverty line is chosen (World Bank Philippines 200211). In Ethiopia, the proportion of the urban population with below-poverty-line incomes in 1995–96 could have been 49, 33 or 18 per cent, depending on the fi gure used for the average calorifi c requirement per person (World Bank Ethiopia 1999). In the Dominican Republic in October 2004, different criteria for setting the poverty line meant that the proportion of the urban population below the poverty line varied from 35.4 per cent to 2.1 per cent (World Bank Dominican Republic 2006). As this chapter will discuss in detail, research that examines the actual cost of meeting food and non-food needs in particular cities or within urban populations usually shows much higher proportions in poverty than offi cial statistics.
The very large differences in the proportion of the population considered poor (whether for all low- and middle-income nations or for national or urban populations within particular nations) are the result of different defi nitions of poverty. These differences usually lie in how to defi ne the income level that individuals or households need to avoid being poor, especially with regard to non-food essentials. However, the example from Ethiopia shows how infl uential the choice of which fi gure to use for food requirements can be.
The levels at which poverty lines are set are infl uenced by how food costs are analysed – for instance whether they are based on ‘expert’ judgements for the cheapest means of meeting food needs or based on the actual food that low-income groups eat. These differences can also be caused by whether the defi nition and measurement of poverty includes some consideration of basic service provision or housing quality (or the costs of these), and the quality or appropriateness of the data on which this is based. As discussed in more detail in the section on water and sanitation in Chapter 3, the proportion of a nation’s urban population judged to have adequate provision for water or sanitation also varies a lot, depending on what is considered ‘adequate’. In some cases, differences in estimates may be caused by the level of aggregation, and whether or not adjustments are made for the differences in price levels between, for example, urban and rural areas or between cities of different sizes.
If the different methods available for defi ning and measuring poverty produced similar fi gures for its scale and depth, then this concern over defi nitional issues would be less relevant. For instance, Kanbur and Squire (2001, page 216) suggest that ‘Although different methods of defi ning and measuring poverty inevitably identify different groups as poor, the evidence suggests that the differences may not be that great’. But this is not so if one defi nition of poverty suggests that 1 per cent of Kenya’s urban population are poor and another suggests 49 per cent. Even with the US-dollar-a-day poverty line, small adjustments and better data can mean

Measuring poverty 17
large differences in the number of people said to be poor. For instance, Chen and Ravallion (2008) note that the population under the dollar-a-day poverty line had been undercounted by 400 million for 2005 (see also Yifu Lin 2008); this does not inspire much confi dence in such estimates.
Clearly, the choice of which defi nition to use matters if one defi nition means a very small minority of the urban (or national) population are poor while another means that half are poor. In this context, the choice of defi nition will infl uence the response of governments and international agencies: if 1.2 per cent of Kenya’s or 2.3 per cent of Zimbabwe’s or 0.9 per cent of Senegal’s urban populations were poor in the mid- or late 1990s, as suggested by Sahn and Stifel (2003), clearly addressing urban poverty is not a priority, as in each of these nations a high proportion of the rural population suffers from poverty and most of their populations in the mid-1990s were in rural areas. But, if between one third and one half of these nations’ urban populations are facing serious deprivations (which we show to be the case), and most of the growth in poverty is taking place in urban areas (which is the case in some countries), the needs of the urban poor deserve far more attention.
With many governments and most international agencies now making more explicit commitments to reducing poverty, through poverty reduction strategies and by focusing on the Millennium Development Goals, the question of how urban poverty is defi ned and measured has great relevance for whether these organizations see urban poverty as worth addressing. An earlier review of the attention given to urban poverty in the poverty reduction strategy papers prior to 2004 suggested that there is considerable variability among governments with regard to whether urban poverty should get much attention (Mitlin 2004).
Much of the general literature on poverty does not recognize that there are particular ‘urban’ characteristics that most urban areas share which infl uence the scale and depth of poverty there (see, for instance, World Bank 2000). Much of the general literature also does not draw on the literature on urban problems. This means that key characteristics of urban areas (or of some urban areas or some districts within urban areas) are not taken into account in the defi nitions of poverty or in its measurement (see Box 2.1).
Combine a lack of knowledge (or data) about housing and living conditions with little or no allowance for the cost of non-food necessities in urban areas (or particular cities), and it is possible to produce statistics that so understate the scale and depth of urban poverty as to render them invalid, whatever defi nition is being used. For instance, for the city of Pune in India, offi cial statistics suggest that 2 per cent of the population are ‘poor’ yet close to 40 per cent live in very poor quality housing (Bapat 2009). In 2005, the Pune Municipal Corporation identifi ed 10,800 families as living below the poverty line although nearly 220,000 households lived in ‘slums’ in that same year (Bapat 2009). This blindness to living conditions is reinforced by the lack of knowledge among poverty specialists of urban contexts; anyone with any knowledge of urban centres in Kenya, Senegal or Zimbabwe would know that the urban poverty statistics noted above were wrong. This chapter has many other examples of urban poverty statistics that are at odds

18 Measuring poverty
Box 2.1 Distinguishing between rural and urban areasThere are obvious economic and physical characteristics, and usually also demographic, social and political characteristics, that distinguish urban areas from rural ones, and that have importance for understanding, then defi ning and measuring, poverty – for instance, as discussed in this chapter, higher monetary costs for many essential goods and services, more monetized housing and land-for-housing markets, and fewer possibilities for growing crops or accessing or using resources at no monetary cost. A higher proportion of urban dwellers than rural dwellers face harassment, eviction or arrest because their homes or their livelihoods are illegal. However, the wide variations between urban areas should be recognized – for instance, many small urban centres may have many rural characteristics (and have more in common with most large villages than with major cities). Similarly, some rural areas have urban characteristics; in some nations, highly urbanized settlements are still classifi ed as rural even though they have urban non-agricultural employment structures, house types, infra-structure provision and density. There are also many (poor and non-poor) individuals and households that have rural and urban components to their livelihoods, asset bases, incomes and social networks, which also cautions against simplistic ‘rural versus urban’ comparisons.12
There is no agreement as to how urban centres should be defi ned or distinguished from rural areas so there is considerable variation in how governments choose to defi ne urban areas – and this inevitably infl uences the proportion of the population said to live in urban areas. Some nations defi ne as urban centres all settlements with populations above a threshold – 1,000 or 2,500 or 5,000 are commonly used. This means that a nation’s urban population and the proportion of the national population living in urban centres can vary a lot, depending on the threshold used (or other criteria chosen and applied). For instance, India would become predominantly urban if it used a low population threshold for defi ning urban centres, say 1,000 inhabitants, as a high proportion of its rural population live in villages with more than 1,000 inhabitants. Although in virtually all nations settlements with 20,000 plus inhabitants are classifi ed as urban, differences emerge in the proportion of settlements with between a few hundred and 20,000 inhabitants classifi ed as rural or urban. This cautions against international comparisons between nations’ urban populations, given that a signifi cant proportion of the population in almost all nations live in settlements with between a few hundred and 20,000 inhabitants (see Hardoy and Satterthwaite 1989; Satterthwaite 2006).

Measuring poverty 19
with well-documented local realities, and other examples where the statistics appear faulty. It is odd to see references in many documents to those ‘living in poverty’ with no consideration given to housing and living conditions.
One other reason behind this capacity to produce questionable statistics is the lack of engagement by those who produce and use offi cial (government and international agency) poverty statistics with ‘the poor’ who are meant to be the object of their concern. Given the likely infl uence of poverty defi nitions on the policies and resource allocations of most governments and international agencies and the emphasis of international development agencies on participation, one would expect the defi nition of poverty and its measurement to be one of the key topics for public discussion and debate within each country (and, since the focus of this book is urban poverty, in each city or town). Such public debate is also important to guard against inappropriate defi nitions of ‘need’. But there is little evidence of such a public debate in most low-income nations.13 This may in part be because in many nations there is little link between the measurement of poverty and the capacity or willingness of government agencies to reduce it. Low-income groups will have little interest in being defi ned as ‘poor’ if this does not imply action will be taken to help them. However, part of the reason is the diffi culty non-specialists have in engaging in this discussion and in identifying all the infl uences and assumptions that are involved in the defi nition and measurement of poverty.
Rural versus urban
As with the other published work of our Institute (the International Institute for Environment and Development, or IIED) on urban poverty, we are not recommending that funds allocated to rural poverty reduction be redirected to urban poverty reduction; it may be that the scale and depth of rural poverty is also underestimated and misrepresented by conventional poverty statistics. The failure of consumption-based poverty lines to capture the extent and nature of deprivation in rural areas may actually be greater than in urban areas, because so much rural deprivation is related to lack of assets (especially fertile land) and lack of access to services, rather than lack of income. Nor is this book seeking to make judgements about the relative scale or depth of ‘urban’ poverty compared to ‘rural’ poverty. Where comparisons are made between the two, or between the ways in which they are understood, it is to highlight how the understanding or measurement of poverty in urban areas (or of poverty in general) has failed to take due note of costs or of forms of deprivation that are evident in some (or most) urban areas.
However, we do take issue with much of the general literature on ‘poverty’ and the writings of rural specialists who discuss ‘urban poverty’ yet fail to understand how urban contexts can generate or exacerbate poverty. Much of the general literature on poverty assumes that there is an ‘urban bias’ in international agencies’ priorities – this remains unproven14 and is certainly at odds with our analyses, which show a very low priority given by most international agencies to urban poverty reduction.15

20 Measuring poverty
The rest of this chapter discusses the value of giving greater attention to understanding and measuring urban poverty in ways that better capture the scale and nature of deprivation in each location and better serve poverty reduction, including supporting the role of local (governmental and civil society) actors. The case for more attention to urban poverty reduction is also reinforced by the evidence that much can be done to reduce urban poverty drawing only on the resources and powers available to urban governments and increasing the scope of action permitted to low-income groups and their organizations and federations; this is the focus of the companion volume to this. In Chapter 6, we return to the issue of where, when and how urban dwellers may enjoy an advantage over rural dwellers.
Understating urban poverty
The gaps between poverty statistics and data on living conditions16
If the term ‘poverty’ is taken to mean human needs that are not met, then most of the estimates for the scale of urban poverty in low- and middle-income countries appear too low. Statistics produced by international agencies consistently suggest that three quarters or more of the urban population in low- and middle-income countries are not poor. For instance, a publication of the Overseas Development Council in the USA in 1989 reported that only 130 million of the ‘poorest poor’ within low- and middle-income nations lived in urban areas (Leonard 1989); this estimate would mean that in 1989 more than nine out of ten of their urban populations were not among this group. World Bank estimates for 1988 suggested that there were 330 million ‘poor’ people living in urban areas in low- and middle-income countries (World Bank 1991), which meant that more than three quarters of their urban population were not ‘poor’ at that date.17 The 1999–2000 World Development Report (World Bank 1999) suggested that there were 495 million ‘urban poor’ by the year 2000, which meant that three quarters of the urban population were ‘not poor’. As noted in Chapter 1, according to Ravallion, Chen and Sangraula (2007), only a small minority of the urban population is poor and for many regions there is very little extreme poverty in urban areas. For instance, using the dollar-a-day poverty line ($1.08 per day at 1993 purchasing power parity), in 2002, less than 1 per cent of the urban populations of China, the Middle East and North Africa, and East Europe and Central Asia were poor. In Latin America and the Caribbean, less than 10 per cent of the urban population was poor. For all low- and middle-income nations, 87 per cent of their urban population was not poor. If these fi gures are correct, it represents a triumph for development. It is also noted in Chapter 1 that Deaton and Dupriez (2011) suggest that the dollar-a-day poverty line used by the World Bank is actually too high.
But this and later chapters show that it is common for 40 to 70 per cent of a nation’s urban population or a major city’s population to have incomes too low to allow them to meet their needs. The World Bank estimates for the scale of urban poverty for 1988 and 2000 suggest that there was no increase in the proportion of

Measuring poverty 21
the urban population living in poverty between these years. Yet many studies show increasing proportions of nations’ urban populations suffering from poverty during the 1980s or 1990s, refl ecting poor economic performance and/or structural adjustment (see, for instance, Kanji 1995; Latapí and de la Rocha 1995; Minujin 1995; Moser, Herbert and Makonnen 1993; Maxwell et al. 1998; de la Rocha 2007; Perlman 2010), although the evidence is not there to be able to generalize for all low- and middle-income nations.
In general, the proportion of urban dwellers living in poverty (i.e. in poor quality, overcrowded and often insecure housing lacking adequate provision for water, sanitation, drainage, etc.) and exposed to very high levels of environmental health risk is higher than the proportion defi ned as poor by poverty lines in sub-Saharan Africa and some other low- and middle-income nations.18 For instance, considerably more than one quarter of the urban population in most low- and middle-income nations live in poor quality (and often insecure or illegal) homes with inadequate provision for water, sanitation and drainage (Cairncross, Hardoy and Satterthwaite 1990; WHO 1992, 1999; Hardoy, Mitlin and Satterthwaite 2001; UN-HABITAT 2003a; see also Chapter 3). If the estimate for the number of ‘poor’ urban dwellers was based on the number living in poor quality housing with a lack of basic infrastructure and services, then at least 600 million were poor in 1990, with the numbers likely to have increased signifi cantly during the 1990s (Cairncross, Hardoy and Satterthwaite 1990; WHO 1992, 1999; UN-HABITAT 2003b). For instance, a detailed review of provision for water and sanitation in urban areas suggested that, in 2000, there were at least 650 million urban dwellers lacking adequate provision for water and at least 850 million lacking adequate provision for sanitation in Africa, Asia and Latin America (UN-HABITAT 2003a). UN-HABITAT (2003b) suggests that in 2001 there were 924 million people living in inadequate shelter with associated problems of lack of access to secure tenure, infrastructure and services; if these people are considered poor, then it challenges the World Bank estimate of 495 million ‘poor’ in 2000 and the validity of the dollar-a-day poverty line which suggests that only 291 million urban dwellers were poor in 2002 (Chen and Ravallion 200719).
It is not only global statistics that seem to underestimate the proportion of poor urban households, but also statistics for nations. For instance, the suggestion that 2.1 per cent of Zimbabwe’s urban population was poor in 1994 (Sahn and Stifel 2003) bears no relation to the documentation showing the scale of urban poverty in the early 1990s and the large increase in its scale and depth from large price rises, retrenchments and declines in the amount spent by poorer groups on food (see Kanji 1995) – or the offi cial survey in 1996 showing 46 per cent of urban households as poor, including 25 per cent who could not meet their basic nutritional requirements (offi cial government statistics quoted in Bijlmakers, Bassett and Sanders 1998). There is also a considerable literature on the very poor living conditions that much of Zimbabwe’s urban population endure (Chitekwe and Mitlin 2001; Potts and Mutambirwa 1991; Schlyter 1990; Rakodi and Withers 1995).

22 Measuring poverty
The suggestion that 1.5 per cent of Kenya’s urban population was poor in 1988 and that 1.2 per cent was poor in 1998 (Sahn and Stifel 2003) also bears no relation to fi gures drawn from other sources – for instance, the offi cial survey in 1997 which found that 49 per cent of the urban population was poor (Kenya, Government of 2000) – or to the very poor conditions in which a large proportion of the population of Kenya’s three largest cities live. (For Nairobi, see Lamba 1994; Alder 1995; APHRC 2002; Weru 2004. For Mombasa, see Rakodi, Gatabaki-Kamau and Devas 2000. For Kisumu see Karanja 2010.) Chapter 3 includes many more statistics for the inadequacies in provision for water and sanitation in Kenya’s urban population that show the high proportion suffering serious deprivation and very high infant and child mortality rates.
For Senegal, the suggestion that less than 1 per cent of its urban population was poor in 1997 (Sahn and Stifel 2003) hardly fi ts with the very poor conditions in which a signifi cant proportion of the urban population lives, or with the offi cial fi gure from 2001 which suggested that 44–59 per cent of the urban population was poor, depending on the zone (Senegal, Republic of 2002). Many other fi gures presented by Sahn and Stifel 2003 can be questioned – for instance, that only 5.4 per cent of Burkina Faso’s urban population was poor in 1999 or only 6.8 per cent of Ghana’s urban population in 1998.
Drawing from other sources, it is diffi cult to take seriously the suggestion that less than 2 per cent of China’s urban population was below the poverty line in 1994 (World Bank 1999) or that less than 1 per cent of the urban population was poor in 2002 (Ravallion, Chen and Sangraula 2007, applying the dollar-a-day poverty line). Solinger (2006) points to the very large numbers of urban dwellers who have been laid off and are unemployed and the migrant population of 100 million plus living in urban areas; also how different bases for setting poverty lines produce very different totals. One estimate suggests that 13 per cent of China’s urban population are poor, and this does not include the 100 million plus migrants. GHK and IIED (2004) show how much the scale of urban poverty in China depends on whether or not the 100 million ‘temporary’ migrants who live and work in urban areas are classifi ed as rural or urban.
Sabry (2009) notes how poverty statistics for Greater Cairo suggest that only 5–10 per cent of the city’s population are poor, and that the proportion is decreasing and contributing to the decrease in the proportion of the national population considered poor. But she then demonstrates that this is because of the unrealistically low value of the poverty lines for Greater Cairo, especially in relation to the high proportion of Cairo’s population living in ashwa’iyyat (informal settlements) and the rapid growth in their populations. In Greater Cairo, as in so many cities, the proportion of the population said to be poor bears no relation to those who live in poverty.
The government of Ghana claimed that only 3.8 per cent of Accra’s population was poor in 1998–99 (Ghana, Republic of 2000) yet Devas and Korboe (2000) describe a government living standards survey that had suggested that 23 per cent of Accra’s population was poor (see also Songsore and McGranahan 1993). An IFPRI study on urban livelihoods and food security in Accra also suggested much

Measuring poverty 23
higher levels of deprivation, and that, based on the calories available to household members per day (2,640 kilocalories per adult equivalent unit), about 40 per cent of households in the sample were food insecure (Maxwell et al. 1998).
Offi cial fi gures for the proportion of Phnom Penh’s population with below-poverty-line incomes in 1999 (9.7 per cent or 14.6 per cent depending on which survey is used; see Cambodia, Kingdom of 2002) bear little relation to the proportion living in illegal or informal settlements or crowded tenements with very inadequate provision for water and sanitation, which is estimated at around 40 per cent of the city’s population (Asian Coalition for Housing Rights 2001). Offi cial statistics for Colombo in 2009–10 suggest that only 3.6 per cent of the city’s population is poor – yet around half of Colombo’s population live in what are termed ‘under-served’ settlements characterized by poor quality, overcrowded housing lacking adequate provision for infrastructure and services. By 2004, there were 1,614 under-served settlements within the municipal limits of Colombo, housing around half its population (Romeshun and Mayadunne 2011).
In interviews with women living in informal settlements in Buenos Aires,20 all but one had incomes above the offi cial poverty line and all had incomes above the equivalent of US$1 or US$2 per person per day. Yet all live in informal settlements and most in settlements where their tenure of the house site is insecure. Most had built their houses with second-hand materials and many houses were far from fi nished. Most had struggled for years to get services – and most had diffi culties affording the costs of keeping their children at school. Most talked about the diffi culties they face in putting suffi cient food on their family’s table each day, and report buying food in small quantities locally because they only have enough money once or twice a month to be able to go to large supermarkets and benefi t from lower unit costs of bulk purchases (Hardoy with Almansi 2011).
Chapter 3 will discuss in more detail the defi ciencies in provision for water and sanitation in urban areas and how most reported indicators greatly underestimate the extent and depth of the inadequacies in provision in urban areas because of inappropriate assumptions and poor data. For instance, the UN’s Joint Monitoring Programme (JMP) for Water Supply and Sanitation now has data on the proportion of the urban population with water supply piped to their premises. If this data were used in assessing whether the Millennium Development Goal target of reducing the proportion of people without access to safe drinking water had been achieved in urban areas, it would completely change the picture (see Chapter 3). It is also common for inappropriate judgements to be made about the quality of housing based on the limited data available – for instance, the weight given to data on fl ooring materials, which is obviously a particularly inappropriate indicator for cities or urban districts with multi-storey housing. Much urban housing does not have a dirt fl oor but still has very high levels of overcrowding and inadequate or no provision for infrastructure and services. More importantly, the limited statistics on housing conditions tell us very little about the level of health risk for occupants from biological pathogens, chemical pollutants and physical hazards (the main means by which poor housing quality translates into illness, injury and premature death – see Hardoy, Mitlin and Satterthwaite 2001).

24 Measuring poverty
The gaps between poverty statistics and data on health
Chapter 3 discusses the health problems faced by those with low incomes and what underpins these – including the inadequacies in provision for water, sanitation, drainage and solid waste collection. For this chapter, it is worth noting that in the data, the proportion of the urban population facing high infant, child and maternal mortality rates is often substantially higher than the proportion defi ned as ‘poor’. Again, the suggestion that only 1.5 per cent of Kenya’s urban population is poor is inconsistent with the very high infant and child mortality rates within the informal settlements where half of Nairobi’s population lives (APHRC 2002).
In Dar es Salaam, Tanzania’s largest city, according to offi cial statistics 17.6 per cent of the population was poor in 2000–01, but the under-fi ve mortality rate in the city in 1999 was 173 per 1,000 live births – at least ten times what could be expected for a city with more than four fi fths of its population ‘not poor’ (Tanzania, United Republic of 2002a). The same document that claimed only 17.6 per cent of Dar es Salaam was poor also noted that 30 per cent of households lived in one room, that 60,000 lived in valleys that exposed them to the risk of fl oods and diseases, and that 15,000–20,000 lived on the streets (Tanzania, United Republic of 2002a). Documentation of provision for water and sanitation in Dar es Salaam shows that far more than 17.6 per cent face very serious defi ciencies (Glockner, Mkanga and Ndezi 2004). In addition, around 70 per cent of the entire city’s population lives in informal settlements (Ndezi 2009).
Chapter 3 also describes the many nations with high under-fi ve mortality rates and high levels of stunting in children in their urban populations, and these can suggest levels of deprivation that are not refl ected in offi cial poverty statistics. The fi gures available for infant, child and under-fi ve mortality rates and the proportion of children that are underheight or underweight are mostly averages for countries’ total urban populations. These will be much higher for low-income groups. For instance, in Kenya, infant and child mortality rates in the low-income settlements in Nairobi, where around half the city’s population live, were nearly twice those of the Kenya-wide urban average (APHRC 2002). In India, under-fi ve mortality rates are much higher among the poorest quartile of the urban population when compared to the rest of the population (Agarwal 2011; see also Chapter 3). The problem of undernutrition among lower-income groups in urban areas may be more serious than is assumed, but hidden in any urban average because of the concentration of better-fed middle- and upper-income groups in urban areas.
Thus, there are many nations where the proportion of urban dwellers who are poor according to offi cial poverty defi nitions is signifi cantly less than the proportion living in poverty, or signifi cantly less than the proportion with health outcomes or nutritional levels that one would assume are associated with poverty. This also true for particular cities. This may be because poverty lines are set too low in relation to the costs of housing and essential services. This is certainly the best explanation for the high proportion of underheight or underweight children. Or it may be related more to the incapacities of public, private or civil society