urban sprawl and growth management – drivers, impacts and
TRANSCRIPT
CASE STUDY Open Access
Urban sprawl and growth management –drivers, impacts and responses in selectedEuropean and US citiesChristian Fertner1* , Gertrud Jørgensen1, Thomas Alexander Sick Nielsen1 and Kjell Svenne Bernhard Nilsson2
Abstract
Urban growth management has become a common term to circumscribe strategies and tools to regulateurban land use in metropolitan areas. It is particularly used to counteract negative impacts of urban sprawl butalso to frame future urban development. We discuss recent challenges of urban growth in 6 European and 2US American city-regions. The paper compares the urban development focusing on a quantification of driversand effects of urban growth and a qualitative analysis of the applied urban growth management tools. Webuild our analysis on findings from the EU-FP6 project PLUREL. The cities have different success in dealing withurban growth pressure - some can accommodate most growth in existing urban areas and densify, othersexpand or sprawl. Urban growth management is no guarantee to contain urban growth, but the case studiesoffer some innovative ways how to deal with particular challenges.
Keywords: Growth management, Urban containment, Regional planning, Spatial strategies, Europe, USA, Landuse change, Area efficiency, Urban sprawl
BackgroundAround the world urban areas are growing, increasinglyconsuming open space [1] and Europe is no exceptionfrom this trend [2]. From 1990 to 2006 urban areas inEurope grew by ca. 15000 km2 [3], an increase of urbanland of half the size of Belgium within 16 years. Thereis a long tradition of management of urban growth inEurope, but just as the diversity in geography and his-tory on the continent, also the issues and challenges ofurban growth and its management vary a lot. However,as urban sprawl was recognized in the USA several de-cades ago, it is also worth while to look at how Ameri-can cities have dealt with that phenomenon and howEuropean cities could learn from the US experience. Atleast since the late 1980s, management of urban growthhas become an important issue in the USA since the im-pacts of urban sprawl on environmental sustainability,quality of life and the local economy got recognized [4].
On the background of these developments the termurban growth management has emerged in planning.In this paper we explore urban growth and growth
management in 8 city-regions which were studiedwith in the European FP6 project “PLUREL” [5].The six European cases are quite distinct, rooted intheir diverse histories [6]: From different western plan-ning traditions (Manchester in the UK, The Hague inThe Netherlands and Copenhagen in Denmark) to newplanning regimes in Eastern Europe (Warsaw inPoland), from cities with high population growth(Montpellier in France) to regions characterised byshrinkage (Leipzig in Germany). However, urban sprawlis an issue in all cases, and city administrationsrecognize the need to counteract it. The two US cases,Seattle in Washington State and Portland in Oregon,have experienced strong urban growth in recent de-cades and have been working with urban growth man-agement for many years. Grounds for planning aredifferent in the USA than in Europe, e.g. regarding plan-ning responsibilities of the public sector but also settle-ment structure, population development and landresources. Still, problems such as sprawl and infrastructure
* Correspondence: [email protected] of Geosciences and Natural Resource Management, Universityof Copenhagen, Rolighedsvej 23, 1958 Frederiksberg, DenmarkFull list of author information is available at the end of the article
Future Cities and Environment
© The Author(s). 2016 Open Access This article is distributed under the terms of the Creative Commons Attribution 4.0International License (http://creativecommons.org/licenses/by/4.0/), which permits unrestricted use, distribution, andreproduction in any medium, provided you give appropriate credit to the original author(s) and the source, provide a link tothe Creative Commons license, and indicate if changes were made.
Fertner et al. Future Cities and Environment (2016) 2:9 DOI 10.1186/s40984-016-0022-2

costs are similar, and good tools and instruments totackle these are rare. A comparison of the different is-sues and solutions across the different contexts canprovide new insights on the relation of urban growthand planning policies. As this relation is depending onmany factors related to the regional context, we will re-flect on the challenges of urban growth and analyse thedifferent elements of urban growth management in theeight city regions.The term growth management originates from plan-
ning in the US in the 1970s, although the idea of con-trolling urban growth to optimize land use is as old asspatial planning itself. However, first with the rapid ex-pansion of cities after World War II, uncontrolledsprawl of urban areas and the emerging paradigm ofsustainable development in recent decades, growthmanagement became an explicit goal in spatial planningin Europe and in the USA.One of the longest established explicit growth man-
agement policies in the USA began with the adoptionof Senate Bill 100 in Oregon in 1973, which establisheda framework for comprehensive land use planningthroughout the state [7]. The implementation of thisbill was due to an increasing concern over the loss ofagricultural and forest land to sub-urbanisation, threat-ening local farming and the timber industry. Followingthe new legislation, state-wide planning goals were re-written, requiring all cities to adopt urban growthboundaries. The use of urban growth management inthe US increased during the 1990s. Still, besides Oregononly a few other states, including Florida, Maryland, NewJersey and Washington, require or encourage growthmanagement and only a few metropolitan areas in otherstates have used such policies [8–10].In the European context ambitions towards manage-
ment of spatial development are present at all policylevels from the structural and territorial cohesion policesat EU level to the national, regional and local levels. Thefirst urban growth management policies go as far backas to 1900 when the first green belts were designated[11], following the garden city movement as well as thepreservation of green areas around major European cit-ies [12]. Today some variety of growth management ispart of a ‘standard mode of operation’ in spatial planning.There are however large national and regional differencesregarding competences, administrative delineations, sys-tems and public interests between different parts ofEurope. Still, the need to control urban sprawl is widelyaccepted [13, 14]. Except for a few cities, sprawl stays ageneral challenge in Europe [2, 15].
Methods and case descriptionOur main interest are the different forms of urbangrowth management in Europe and the USA as applied
in the recent years. We approach this by an explorative,comparative case study of eight city regions, usingquantitative and qualitative methods. Key statisticswere derived from public registers (Eurostat, US CensusBureau, US Bureau of Economic Analysis) and studiedtogether with actual land use changes, derived from theCORINE Land cover database [16] and the NationalLand Cover Data [17].Planning (re)actions were studied by document ana-
lysis of plans and other written official documents sup-ported by stakeholder interviews and previous researchon the respective case. We base our study on the ex-tensive work done during the EU-FP6 project PLUREL[5], with special focus on the following Deliverablereports:
� D2.4.1 Urban growth Management - Effectivenessof instruments and policies
� D3.3.1-D3.3.6 Regional spatial planning and decisionmaking strategies and their impact on land use inthe urban fringe
� D3.3.8 Governance patterns and performance ofregional strategies in peri-urban areas
� D3.4.3-D3.4.8 Reports on enhanced planningstrategies and decision making for urban fringesincluding scenarios for future land use development
While the first report (D2.4.1) covers all case studiesincluded in this paper, the other reports do not includeCopenhagen, Seattle and Portland. In these cities theauthors undertook additional research and conducted21 interviews with key stakeholders, including localpoliticians, planning officials on different levels andrepresentatives from local NGOs. All reports are avail-able on the PLUREL homepage (www.plurel.net), andpartially published in Nilsson et al. [18].Table 1 provides an overview of population, urban area
and economic performance in the 8 city-regions. Thedata is hereby referring to the rural-urban region (RUR)each city is located in. The RUR includes both the ‘Func-tional Urban Area’ (zone of daily commuting), and thesurrounding rural hinterland [19] and was elaborated inPLUREL for the whole of Europe. For the two US caseswe have used the Metropolitan Statistical Area asdefined by the US Census Bureau [20]. By aggregatingthe collected land use data into broad five categories(urban, other, agriculture, nature and water) a roughcomparison of European and US data is possible. In allcases, urban area expanded with an annual growthrate between 0.1% (Manchester-Liverpool) and 1.0%(Leipzig-Halle, including a considerable airport exten-sion). In the case of Seattle this meant, despite a rela-tively low growth rate (0.4%) an additional 800 ha ofurban land each year.
Fertner et al. Future Cities and Environment (2016) 2:9 Page 2 of 13

The cases vary in size and population and context-dependent issues such as historical development andcultural values, geographic features, and political and ad-ministrative decisions taken at levels superior to the cityor region [21] are important to consider for this com-parative perspective. We cannot study all contextual as-pects in detail. However, we will discuss issues regardingnational planning systems and local motivations whichare an important basis for growth management in thecases.Planning responses related to urban growth manage-
ment encompass a wide variety of policies, tools andgoals and have been categorized in various previous stud-ies including PLUREL (see e.g., [22–24]). We will structureour review and comparative analysis of growth manage-ment in the cases by the following key terms: (1) Urbancontainment visions and plans, (2) policies enhancingurban attraction and accommodation capacities, (3) pol-icies supporting rural and agricultural structures, (4)market-based tools and incentives and (5) co-ordinationbetween and co-operation across jurisdictions; we willstructure the case review by these broad categories,while focusing on the relations between the drivers andland use change and the planning policies in the discus-sion section.
Growth management policies in 8 city-regionsContaining urban land useThe main goal in many urban growth management pro-grammes is the containment of urban land, i.e. the im-plementation of a containment strategy through a visionor a plan. This includes often zoning regulations in theform of green belts, which are typically very tight, con-tainment boundaries or also urban service areas, whichare more loose in their character [10]. However, in practicethe differences between these three strategies are notthat clear and they are often used in combination.One example of a combination of an urban contain-
ment boundary (UCB) and a green belt is Copenhagen’s
Fingerplan, first developed in 1947 [25]. It proposed afuture urban development of the metropolitan area ofCopenhagen along five suburban railroads. The areas be-tween should be kept free from buildings, forming greenwedges and supplying the urban population with closerecreational areas. The latest version, the “Fingerplan2007” is a national directive which structures the regioninto 4 zones, each with different regulations for urbandevelopment. Only in the “palm of the hand” (core area)and the “fingers” urban development of regional import-ance is allowed. In the remaining metropolitan area onlyminor developments are allowed while the green wedgesmust be kept free from any development [26].The classic example for the use of an UCB in the US
is Portland, Oregon. The boundary was first introducedin 1979, delineating urban from rural land. The regionalgovernment is required to maintain a 20-year in-ventory of developable land within the urban growthboundary, which – due to the narrow delineation – isregularly amended [27]. Recent analyses indicate how-ever, that if certain policy changes and investments areput in place, “it is possible to support the high range ofdemand without changing current zoning or expandingthe [boundary]” [28] in the next 20 years. The Portlandgrowth boundary is broadly accepted and even part ofthe city identity, much in the same way as the Finger-plan of Copenhagen.In Washington growth management started in 1990
with the adoption of the Growth Management Act.UCBs are constituted following the same ideas as inOregon. However, differently to Portland, the PugetSound Region’s “Urban Growth Area” is relativelybroadly defined and includes a considerable share of agri-cultural areas. The remaining area is further split intorural areas and “Natural Resource Land”, which is spe-cially protected. Some local planners perceive this line asthe real containment boundary.In Leipzig, Manchester and Montpellier urban contain-
ment policies are implemented via green belt strategies,
Table 1 Population and urban area in the 8 city-regions
Population Urban area GDP
Case city CC Rural-Urban-Region (RUR) 2012 (pers.) 2006–2012 (annual %) 2012 (ha) 2006–2012 (annual %) 2006–2012 (annual %)
The Hague NL The Hague-Rotterdam 3 552 407 0.4% 73 318 0.8% 1.3%
Manchester UK Manchester-Liverpool 6 570 809 0.5% 155 898 0.1% − 0.9%
Montpellier FR Montpellier 1 077 627 1.2% 39 358 0.6% 3.4%
Warsaw PL Warsaw 3 258 938 0.5% 106 260 0.4% 6.9%
Leipzig DE Leipzig-Halle 1 499 876 − 0.3% 66 238 1.0% 2.8%
Copenhagen DK Copenhagen 1 920 263 0.8% 59 974 0.4% 2.8%
Seattle, WA US Puget Sound Regiona 3 752 820 1.4% 208 106 0.4% 4.1%
Portland, OR US Portland Metroa 2 100 199 1.2% 114 877 0.2% 5.0%aFor the two US cases, urban area data refers to 2011 instead of 2012
Fertner et al. Future Cities and Environment (2016) 2:9 Page 3 of 13

i.e. green areas in the surroundings of cities are protectedfrom urban growth. In Leipzig this is done since 1996 withthe “Green Ring”-Strategy to preserve the cultural land-scape around the city. The cooperation between 13 mu-nicipalities, progressive promotion to citizens via theinternet, partnerships with private firms and the inclu-sion of recreation and cultural issues ensures a goodanchorage of the strategy in the region [29]. Oppositeto Leipzig, Greater Manchester’s green belt policy re-stricts farm diversification, landscape maintenance andrural economic activities. Its social and economic im-pacts are therefore questionable, not least because ofthe effect of urban development leaping over the greenbelt [30].In the regional plan for the agglomeration of Montpellier
(SCoT) the concept of “sight inversion” was used, meaningthat landscapes with particular qualities were defined firstto support their characteristics and protect them fromurban development – similar to a green belt policy.Landscape, nature and agricultural areas, considered ascity qualities, are the basis of the SCoT [31].The Hague region is located in the agglomeration
Randstad, which surrounds the Green Heart, the Dutchversion of a green belt introduced in 1956 [32]. TheHague region itself is using a Regional Structure Plan toguide spatial development in the region. It is notspatially explicit; instead, the plan coordinates and im-plements a wide range of regional policies and plans. Itis politically supported which is shown by the adoptionof joint infrastructure goals for the nine municipalities, alimitation of housing outside the city and other strategicgoals. The opposite of this widely integrated approachcan be seen in Warsaw. Warsaw has been growingstrongly in population and even more in urban area dur-ing the period of transition, with most growth takingplace in suburban areas [33]. Although demanded bynational law since 2003, no spatial development planfor any metropolitan area, including Warsaw, has beendeveloped [34] and the municipalities within the regionmainly plan independently. A result of this is an im-mense oversupply of land designated for future devel-opment in the city’s periphery [33].The maps in Fig. 1 reveal the diversity of urban form
and urban change in the 8 city-regions. The existingurban structure is of considerable importance regardingpast and future transport infrastructure and potentialnew urban development. Copenhagen, Warsaw and alsoMontpellier appear more monocentric, while The Hague,Manchester and partially also Leipzig have several cen-tres within their Rural-Urban-Region. The two US citiesare very large (see also Table 1), with especially theSeattle-Tacoma agglomeration extending all along thePuget Sound coast. The maps also illustrate the changesduring the past few years, which are though difficult to
see, but, as indicated also in Table 1, still of significantextent. The Hague and Warsaw experienced the urban-isation of several bigger patches. The urban land take inthe other cities is less visible, but as around in Seattle ofconsiderable volume, just spread in many smallerpatches.
Enhancing urban attraction and accommodation capacitiesA complementary strategy to mere urban containment isthe improvement of the attractiveness and quality of lifein the urban centres. Many cities implement or supporturban renewal projects and install long running pro-grammes for deprived areas. Projects are financed bypublic authorities often in co-operation with privatehome-owners or investors. Also the EU is supportingurban renewal, e.g. by the URBAN II programme, whichhas a strong focus on governance and learning. In LeipzigURBAN II co-financed the greening of the urban centre.Combined with other revitalisation measures it shouldmake the shrinkage of population less apparent and thecity centre more attractive and thereby counteract urbansprawl. The urban centre of Leipzig is today growing inpopulation and reurbanising [35], however, the rest of re-gion is lacking behind.The huge investments in urban renewal in Copenhagen
changed the city considerably during the last three de-cades. Besides the development of the central harbour andthe new district of Ørestad through designated urban de-velopment corporations, many districts in the city centreunderwent area-based renewal programmes. The city ofCopenhagen is today experiencing a phase of reurbanisa-tion [36], though accompanied by gentrification effects insome areas [37]. In Montpellier the inner city develop-ment Antigone, finished after more than 20 years in 2000,also implied a symbolic revitalisation and included attract-ive waterfront locations. As in Copenhagen, the new dis-trict was connected by an effective public transportservice to the city [31].Infrastructure plays an important role for urban re-
newal as well as for the implementation of urban devel-opment strategies. Many cities use infrastructureprojects to trigger urban development in particularareas (and take pressure from others). In Oregon theprinciple of “transportation concurrency” demands on astate-wide basis, that any needed transportation infra-structure has to be in place or secured when an area isdeveloped. In the Copenhagen region urban develop-ment is closely tied to the accessibility of public trans-port by the so-called “station proximity principle”which restricts offices above 1500 m2 floor area to belocated within 600 m of a railroad station.Zoning and land use planning in general are common
measures to influence urban form – and are muchcheaper than e.g. infrastructure development. However,
Fertner et al. Future Cities and Environment (2016) 2:9 Page 4 of 13

they require a great deal of law enforcement and com-mitment to be useful in growth management. Besidesrules for the location of certain land use, (re)zoning (e.g.regarding density allowances) can be used to shift urbanpressures. The Seattle “Urban Village Strategy”, run-ning since 1994, proposes a polycentric development ofthe city whereas several existing areas were rezoned tohigher densities and mixed use development. Seattlehas a great potential for densification because 65% ofSeattle’s area is zoned as single family residential area.Opposite to typical urban renewal projects, the
depicted areas are not deprived, but relatively wellfunctioning suburban areas. The specific plans fordensification are to be provided by the local govern-ments in dialogue with the citizens. A recent evaluation[38] attested that 75% of all new housing sprang up inthe designated urban villages in the past 20 years. Aless spatially explicit, but nevertheless strongly com-mitted goal was adopted in The Hague Region. Thenine municipalities agreed to the joint objective to con-struct 80% of all new buildings within the existingurban fabric [32].
Fig. 1 Urban areas in 2006 and new urban areas in 2011/2012 in 8 city-regions
Fertner et al. Future Cities and Environment (2016) 2:9 Page 5 of 13

Urban renewal projects, infrastructure upgrades andurban design measures were traditionally not developedto hinder urban sprawl. However, in many of the casesthey are integrated in a general urban development strat-egy, supposing to take development pressure away fromgreen fields and supporting reurbanisation tendencies. Inthe US the term “Smart Growth” is a typical metaphorfor this way of thinking.A simple indicator for this development is to look at
densities. Figure 2 illustrates the average number ofinhabitants per hectare urban land use in the eightcity-regions. Densities reach from about 18 inhabi-tants/ha urban land in the two US cases up to almost50 in The Hague-Rotterdam. Still, looking at the devel-opment since 1990, the ratio decreased considerably inthe region, caused by a strong increase of urban areabut only a minor increase in population. In Warsawand Leipzig similar effects can be observed for the1990s. However, the two cities also illustrate differentimpacts of the transition from socialist to market econ-omies. The urban sprawl around Leipzig was verymuch driven by public policy and support for homeownership from the early 1990s, while in Warsaw sub-urbanisation was driven by a only slow renewal of theinner city and a later economic revitalization [6, 39]. Ingeneral, despite the Leipzig-Halle case which still facespopulation decline, we can speak of a densification orat least a decrease in dispersion in all cases in the most
recent years, opposing a general trend of urban disper-sion in Europe over the last decades [2]. Also the twoUS cases, Portland and Seattle, became denser overtime; they also have the biggest potential due to thehistorically very low density.Urban areas include not only urban cores and residen-
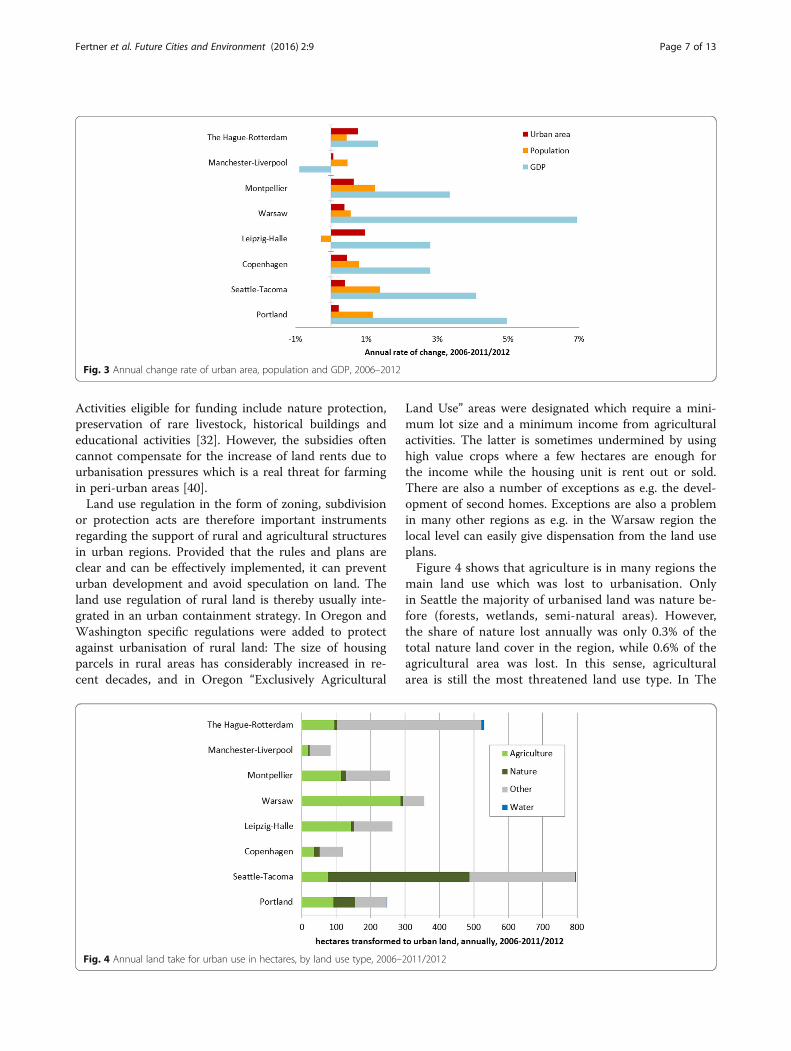
tial areas but also commercial areas as well as transportinfrastructure as ports and airports. It is therefore re-markable that The Hague-Rotterdam, despite the portarea of Rotterdam, which serves a huge hinterland, stillhas the highest density of the eight regions. But alsosome of the other regions have big ports or airports, es-pecially the two US cases. Leipzig-Halle has extendedits airport considerably in 2008, contributing to anincreasing urban land take despite stagnating populationnumbers. Figure 3 compares the most recent changein urban area, population and GDP in all eight cases.Also this figure shows a trend towards densification,at least compared to the general trend of urban dis-persion the years before, where urban land grew twice asfast as population in Europe and the US [5]. However,we cannot derive obvious relations between the threeindicators based on the eight cities. Still, despite ofManchester, economic growth seems to be an import-ant driver for urban growth in all case areas.
Supporting rural and agricultural structuresRural areas close to urban agglomerations are consider-ably different form remote rural areas. E.g. farms may besmaller and more diversified, and full time farming andincreased farm sizes is potentially rendered economicallyunviable at the urban fringes because the land rents arehigher than production outcome [40]. In some areas,policies go towards promoting increased farm sizes andthus competitiveness (e.g. the Netherlands), while inother cases (e.g. Denmark) the trend goes towards more“urbanized” part-time farming activities [41].Rural development in Europe is influenced to a great
deal by the EU’s rural and agricultural policies andtherefore can only be influenced to a minor degree byregional and city authorities. However, the funding istypically administered by national or regional bodies andsome regions also combine the funding with other pro-grammes for rural development. The rural developmentplan for Greater Manchester supports agricultural activ-ities by adding value to products through the processingand diversification of the rural economy. In The HagueRegion, the “Green-Blue-Service” initiative supports thecreation of ecosystem services by strengthening sustain-able agriculture. Farmers get compensated for theprovision of ecosystem services. The funding comesfrom neighbouring municipalities and even from privatesources, which shows the wide awareness of havingfunctioning rural areas close to towns in the region.
Fig. 2 Population per 1 hectare of urban land, 1990–2012(in Warsaw/Poland the land use inventory was changedbetween 2000 and 2006)
Fertner et al. Future Cities and Environment (2016) 2:9 Page 6 of 13
Activities eligible for funding include nature protection,preservation of rare livestock, historical buildings andeducational activities [32]. However, the subsidies oftencannot compensate for the increase of land rents due tourbanisation pressures which is a real threat for farmingin peri-urban areas [40].Land use regulation in the form of zoning, subdivision
or protection acts are therefore important instrumentsregarding the support of rural and agricultural structuresin urban regions. Provided that the rules and plans areclear and can be effectively implemented, it can preventurban development and avoid speculation on land. Theland use regulation of rural land is thereby usually inte-grated in an urban containment strategy. In Oregon andWashington specific regulations were added to protectagainst urbanisation of rural land: The size of housingparcels in rural areas has considerably increased in re-cent decades, and in Oregon “Exclusively Agricultural
Land Use” areas were designated which require a mini-mum lot size and a minimum income from agriculturalactivities. The latter is sometimes undermined by usinghigh value crops where a few hectares are enough forthe income while the housing unit is rent out or sold.There are also a number of exceptions as e.g. the devel-opment of second homes. Exceptions are also a problemin many other regions as e.g. in the Warsaw region thelocal level can easily give dispensation from the land useplans.Figure 4 shows that agriculture is in many regions the
main land use which was lost to urbanisation. Onlyin Seattle the majority of urbanised land was nature be-fore (forests, wetlands, semi-natural areas). However,the share of nature lost annually was only 0.3% of thetotal nature land cover in the region, while 0.6% of theagricultural area was lost. In this sense, agriculturalarea is still the most threatened land use type. In The
Fig. 3 Annual change rate of urban area, population and GDP, 2006–2012
Fig. 4 Annual land take for urban use in hectares, by land use type, 2006–2011/2012
Fertner et al. Future Cities and Environment (2016) 2:9 Page 7 of 13

Hague-Rotterdam nature areas experienced even a netgrowth, while, agricultural areas were reduced by some2% with about a quarter of it going directly into urbanuse, the rest of it transformed to nature or other areas.‘Other’ areas comprise in the European cases mainly re-creation (golf courses but also summer houses), miningand construction sites – at least the latter would be atypical category, as also seen in Fig. 4, to be transformedinto urban areas over time. However, the percentagesshould be taken with a grain of salt as they depend on thedelineation of the wider region. In general, though, purenature areas seem to be less endangered by urban growth.A reason might be that agricultural areas are more domin-ant in proximity to urban centres than nature areas, whichmoreover may tend to be protected.
Market-based tools and incentivesMarket-based mechanisms are often seen as having greatpotential to shift development pressures and to containurban growth. However, they are not widely used, oftenonly for particular, time-restricted projects. Nuissl et al.[42] name three economic tools which are used to con-tain growth: Taxes, subsidies and transferable develop-ment rights (TDR, sometimes also called transferableplanning permits, TPP). Taxes and subsidies are usuallysubject to national legislation and are harder to employfor a specific problem. They are however important forthe general conditions for urban growth and the func-tioning of the planning system. TDRs instead can beapplied to specific areas or regions. Among our casestudies they are only used in the two US regions.TDRs are market-based programmes, allowing to sep-
arate and trade the right to develop a certain piece ofland in a free-market system of willing sellers and buyers[43]. The property receiving the development right usu-ally gains an additional allowance in built-up density,while the sending site will be preserved through a con-servation easement. Besides the income through the sale,sending site owners often also profit from a reducedproperty tax.In Portland a few TDR programmes were designed
for specific areas. Additional development in someareas was allowed in 1991 and 1996 in return for thepreservation of important open spaces [44]. In acurrent TDR programme parts of the major urbangreenway, the Willamette River Greenway are to bepreserved in exchange to additional building densities.In Seattle TDRs are used in all four metropolitan coun-ties. Activity is very dependent on the general economicgrowth, dropping to zero transfers in 2008 in KingCounty [45]. Receiving sites usually gets a higher dens-ity allowance than taken from sending sites. However,the programme expands slowly and in 2011 a “Regional
TDR Alliance” was formed to coordinate the tradewithin the whole metropolitan region.The use of TDR is not widely spread in Europe,
though its potentials are discussed [46, 47]. One reasonmight be that many local administrations are more ac-tively purchasing and thereby controlling land in Europethan in the US. E.g. in the municipality of Køge in thesouthern part of the Copenhagen region, agriculturalplots considered to be transferred to urban land use arealmost always bought by the municipality and preparedfor development, before they are sold to private inves-tors. In the city of Copenhagen, the new metro was fi-nanced by selling the plots in the new development areaof Ørestad.Dutch municipalities can borrow money from the na-
tional government to cover the costs of land acquisitionand servicing. In The Hague Region land purchasing ismentioned as successful strategy to prevent areas fromurbanization [32]. It implies public compulsory land pur-chase, followed by the development of recreational func-tions or leased at long term by farmers for agriculturaluse. The difference between the lease price and the ac-tual interests will be paid by the public, who insteadstays in “control” with the land. It is thus heavily basedon public funding, and probably only viable in areaswhere it is of essential public interest to protect certainareas of agricultural land. However, as agricultural landis very scarce in the region and important for recreationand ecosystem services, it is an effective policy in thecase area. But also in our two US cases land purchasewas used to protect natural areas [44].Several other public measures can function as eco-
nomic incentives by changing the value or economicpotentials of land, including infrastructure developmentor the inclusion/exclusion of certain areas in an urbandevelopment plan. E.g. in Portland the designation ofurban and rural reserves for the next 40–50 years wasdone to provide investors with a better outlook – andincentives or disincentives for development. Such pol-icies are also related to the issue of increasing theattractiveness of the existing urban area as discussed inone of the previous sections.We do not have data directly related to the impact of
market-based tools and incentives. However, a relatedland use proxy is land fragmentation, as an expected re-sult is a more efficient use of land. Looking at the char-acteristics of the new urban areas established between2006 and 2011/2012 in the 8 cases, we can see quite adifferent pattern between them. Table 2 shows thenumber of new patches and their size. As a proxy forfragmentation, we calculated the number of patcheswhich got established adjacent to existing urban areaswhich were at least the same size as the new patch (thelatter to include urban extensions of small rural towns).
Fertner et al. Future Cities and Environment (2016) 2:9 Page 8 of 13
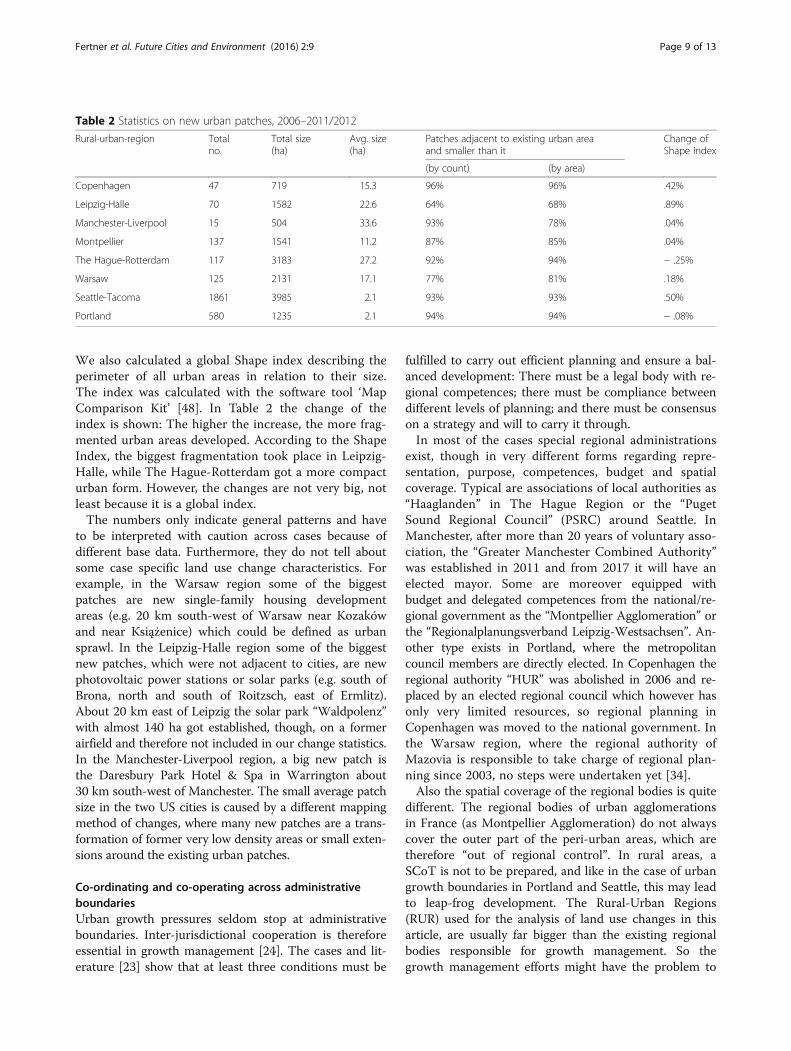
We also calculated a global Shape index describing theperimeter of all urban areas in relation to their size.The index was calculated with the software tool ‘MapComparison Kit’ [48]. In Table 2 the change of theindex is shown: The higher the increase, the more frag-mented urban areas developed. According to the ShapeIndex, the biggest fragmentation took place in Leipzig-Halle, while The Hague-Rotterdam got a more compacturban form. However, the changes are not very big, notleast because it is a global index.The numbers only indicate general patterns and have
to be interpreted with caution across cases because ofdifferent base data. Furthermore, they do not tell aboutsome case specific land use change characteristics. Forexample, in the Warsaw region some of the biggestpatches are new single-family housing developmentareas (e.g. 20 km south-west of Warsaw near Kozakówand near Książenice) which could be defined as urbansprawl. In the Leipzig-Halle region some of the biggestnew patches, which were not adjacent to cities, are newphotovoltaic power stations or solar parks (e.g. south ofBrona, north and south of Roitzsch, east of Ermlitz).About 20 km east of Leipzig the solar park “Waldpolenz”with almost 140 ha got established, though, on a formerairfield and therefore not included in our change statistics.In the Manchester-Liverpool region, a big new patch isthe Daresbury Park Hotel & Spa in Warrington about30 km south-west of Manchester. The small average patchsize in the two US cities is caused by a different mappingmethod of changes, where many new patches are a trans-formation of former very low density areas or small exten-sions around the existing urban patches.
Co-ordinating and co-operating across administrativeboundariesUrban growth pressures seldom stop at administrativeboundaries. Inter-jurisdictional cooperation is thereforeessential in growth management [24]. The cases and lit-erature [23] show that at least three conditions must be
fulfilled to carry out efficient planning and ensure a bal-anced development: There must be a legal body with re-gional competences; there must be compliance betweendifferent levels of planning; and there must be consensuson a strategy and will to carry it through.In most of the cases special regional administrations
exist, though in very different forms regarding repre-sentation, purpose, competences, budget and spatialcoverage. Typical are associations of local authorities as“Haaglanden” in The Hague Region or the “PugetSound Regional Council” (PSRC) around Seattle. InManchester, after more than 20 years of voluntary asso-ciation, the “Greater Manchester Combined Authority”was established in 2011 and from 2017 it will have anelected mayor. Some are moreover equipped withbudget and delegated competences from the national/re-gional government as the “Montpellier Agglomeration” orthe “Regionalplanungsverband Leipzig-Westsachsen”. An-other type exists in Portland, where the metropolitancouncil members are directly elected. In Copenhagen theregional authority “HUR” was abolished in 2006 and re-placed by an elected regional council which however hasonly very limited resources, so regional planning inCopenhagen was moved to the national government. Inthe Warsaw region, where the regional authority ofMazovia is responsible to take charge of regional plan-ning since 2003, no steps were undertaken yet [34].Also the spatial coverage of the regional bodies is quite
different. The regional bodies of urban agglomerationsin France (as Montpellier Agglomeration) do not alwayscover the outer part of the peri-urban areas, which aretherefore “out of regional control”. In rural areas, aSCoT is not to be prepared, and like in the case of urbangrowth boundaries in Portland and Seattle, this may leadto leap-frog development. The Rural-Urban Regions(RUR) used for the analysis of land use changes in thisarticle, are usually far bigger than the existing regionalbodies responsible for growth management. So thegrowth management efforts might have the problem to
Table 2 Statistics on new urban patches, 2006–2011/2012
Rural-urban-region Totalno.
Total size(ha)
Avg. size(ha)
Patches adjacent to existing urban areaand smaller than it
Change ofShape Index
(by count) (by area)
Copenhagen 47 719 15.3 96% 96% .42%
Leipzig-Halle 70 1582 22.6 64% 68% .89%
Manchester-Liverpool 15 504 33.6 93% 78% .04%
Montpellier 137 1541 11.2 87% 85% .04%
The Hague-Rotterdam 117 3183 27.2 92% 94% − .25%
Warsaw 125 2131 17.1 77% 81% .18%
Seattle-Tacoma 1861 3985 2.1 93% 93% .50%
Portland 580 1235 2.1 94% 94% − .08%
Fertner et al. Future Cities and Environment (2016) 2:9 Page 9 of 13
go not far enough in geographic terms and thereby pushdevelopment to places outside of the region.Another important issue besides the form of represen-
tation and the spatial competences is budget. Especiallyfor the purpose of land purchase to preserve certainareas from urbanisation, adequate financial resources areessential. The regional authority of Portland co-financesits activities by the disposal of solid waste services. Justas the PSRC in Washington, it is also the official Metro-politan Planning Organization, which means it allocatesthe federal infrastructure money in the region. Further-more, as written in the previous section, the city fundsbig land acquisitions by bonds. Many of the other re-gional bodies have a budget for the implementation ofvarious activities. Often though, like in The Hague Re-gion, the power is based on the municipalities takingpart in the regional co-operation. In this way the deci-sions should be anchored within the municipalities, buton the other hand it might be difficult to push thestrategies in directions which some of the partners donot like.In all cases there are demands or expectations of com-
pliance between planning levels. However, local munici-palities decide the legally binding land use plans, and insome cases municipalities have a considerable freedomwithin the regional framework – which is usually alsointended. More generally we can distinguish two issuesrelevant for growth management. The first one is thealready mentioned top-down compliance, i.e. the gradeto which overall visions and plans are taken into locallevel planning. In the Warsaw region this is a big prob-lem because the competences of the regional level areunclear and the local level has the possibility to givebuilding permissions on demand. The other issue –which is supporting the first one – is the participation ofthe local level in the vision or strategy making process.A joint strategy making may improve the local levels’commitment to the regional vision considerably, thoughsometimes at the cost of a very stringent plan [49]. Clearvisions and strategies seem to be a key to successful
compliance between the different levels of administra-tion in our case studies.
Discussion and evaluationThe relationship between pressures of urban growthand growth management effortsThe eight cases face diverse urban growth challengesand approach them also differently. Table 3 summarizesdrivers and main policy themes in the cases. In the lastcolumn the major effects of urban sprawl are summa-rized, based on the indicators presented in the resultssection. As there are many contextual as well as data is-sues affecting the indicators, we evaluate them only incategorical terms. Following that there are three regionswhich experience no or little sprawl and five which havesome negative development in one or more of theseindicators.Manchester, Copenhagen and Portland are in the first
group. Besides Manchester, they all experienced stronggrowth in population and GDP between 2006 and 2012which put considerable urban development pressure onthe regions. All three have a strong focus on contain-ment in their growth management and experienced arelatively low increase of urban areas. In Manchesterand Copenhagen, but also in The Hague, over 90% ofthe new urban patches were developed adjacent to exist-ing bigger urban areas. The US cities reach similarlevels. This, however, has to be seen in the light of therelative fragmented existing urban area (most new urbanareas are infills) and the different basis data with othermapping units.The second group, Montpellier, Warsaw, The Hague,
Seattle and Leipzig, is quite diverse. Different combina-tions of drivers can be found. Leipzig had the specialsituation with a shrinking population (although theurban centre is reurbanising), which is decreasing landand infrastructure efficiency. The focus of growth man-agement policies also varies more in this group and in-cludes containment, attraction and rural preservation.Market-based tools and incentives are only regularly
Table 3 Summary of significant drivers, policies and impacts in the eight cases, 2006–2012
Main drivers Main growth management policies Urban sprawl effectsa
Manchester Population Containment, rural preservation, co-ordination little
Copenhagen Population and conomy Containment, attraction, co-ordination little
Portland Population and economy Containment, attraction, co-ordination little
The Hague Economy Attraction, rural preservation, co-ordination Expansion, weak area efficiency
Montpellier Population and economy Containment Expansion, small patches
Warsaw Economy Co-ordination Expansion, leapfrogging on agricultural land
Seattle Population and economy Containment, market incentives, co-ordination Small patches, leapfrogging on nature areas
Leipzig Economy, (Population) Attraction, rural preservation Weak area efficiency, leapfroggingaRelative to its own urban structure and the other cities
Fertner et al. Future Cities and Environment (2016) 2:9 Page 10 of 13

applied in Seattle with a regional TDR-system. Althoughin all of these policies the co-operation aspect is import-ant, only a few actively use it in a broader perspective ase.g. The Hague with its deep co-operation between the 9municipalities.Our small sample does not assert any pattern regard-
ing urban growth and growth management. Neitherdoes strong population or economic growth necessarilylead to (relative) dispersion (Copenhagen, Portland),nor is urban growth management a guarantee to avoidit (Montpellier, Seattle). Also, urban sprawl does notautomatically trigger the establishment of strong growthmanagement, even if the problems are recognized(Warsaw). On the other hand, Manchester, Copenhagenand Portland seem to successfully condemn urban disper-sion and their urban growth management policies can beconsidered making an important contribution to that.However, further knowledge of the context is necessary toevaluate the influence of the growth management policies.
Context related differencesA regional driver like population increase can result invery different pressures, related to historical, geograph-ical or cultural settings. E.g. the increase in populationin Seattle, which traditionally is characterised by lowdensity and one-family housing, puts a different pressureon land development than the same population increasein Montpellier, where denser structures are more com-mon. But we can also see some ‘extreme’ disparities be-tween average population per urban land in a city andmost recent land consumption. For example, TheHague-Rotterdam had the highest inhabitant per urbanarea ratio of the eight cities with around 50 inhabitantsper hectare in 2012. On the other end of the scale areSeattle and Portland with 18 inhabitants per hectare (seeFig. 2). Still, looking at the incremental change, i.e. theratio of new inhabitants per new urban area from 2006to 2012, The Hague-Rotterdam had a rather low 28 newinhabitants per added urban ha 2006–2012, while inPortland this was 97. This also illustrates the differentconditions and possibilities in the regions, assuming thata city with low density like Portland has considerablepotential to densify its existing urban area, while in TheHague the only option is expansion, reaching limits interms of ‘sustainable’ levels of density [50]. Still, inManchester, the number even gets as high as 304, indi-cating that much population increase must have takenplace in renewed existing urban areas, probably takenplace in former industrial areas.Besides these region-specific contexts, the administra-
tive and governance system in the countries is of crucialimportance regarding conditions for and potentials ofgrowth management policies [51]. This includes the legalframework and thereby especially the planning law as
well as the allocation of responsibilities for spatial plan-ning [52]. The legal framework also includes legal plansfrom higher levels. In most of the case studies some kindof national planning strategy exists, that regional andlocal planning has to comply with. However, those areoften very loose regulations, seldom spatially explicit. Inthe smaller countries though, we can see more direct in-volvement of national planning at local level. Anotherissue which can be very different in the cases is the insti-tutional fragmentation. For example, Washington andOregon both consist of several counties, which are fur-ther divided into self-administered municipalities and‘unincorporated’ land, directly governed by the county.Several sector policies are often delegated to special dis-tricts, which are independent governmental units. Thearea covered by these districts does not necessarily coin-cide with other administrative boundaries, which is, to-gether with the dispersed responsibilities, an obstacle forcomprehensive planning [53].
Approaches to growth managementThe basis for growth management in most cases is somekind of urban containment plan or simplified vision.Several of them only deal with few ideas and distinctions– such as Copenhagen with four, Montpellier with threeand Portland even with only two categories in the plan:urban or non-urban. They are thus easy to grasp, butthey do not deal in any detail with existing urban struc-tures or topography. This often leads to a number ofamendments over the years. In Portland, for example,the very rigid boundary approach was now extended bya more long-term and flexible element of “urban re-serves”. Seattle instead implemented a very generouslylaid out containment boundary, but tries to concen-trate growth around growth poles. One could say thatPortland and Seattle have become more similar intheir approaches in recent years, trying to find a bal-ance between flexibility vs. a boundary set in stone.The other type of growth management deals more
specifically with place related problems and prioritieslike in The Hague. They are more complex and perhapsmore useful for prioritizing. But they are less iconic andmight rather be seen as a registration of the currentproblems and values than as a vision for the future ofthe urban region. In that case it can be more difficult togather political will and the citizens’ commitment to sup-port the plan. These are however crucial in fragmentedadministrative conditions with many local authorities. InCopenhagen the early and clear vision of the principles forurban development with the first Fingerplan from 1947has probably stimulated a relative consensus among plan-ners and politicians of the necessity of regulating urbandevelopment and how the city should grow.
Fertner et al. Future Cities and Environment (2016) 2:9 Page 11 of 13
Regarding other policies to support the general goals,supporting urban attraction are among the most usedones. Although they fulfil a lot of other goals, theyshould be considered as important parts of urbangrowth management. By making inner-cities more at-tractive, these policies take pressure from the urbanfringe. Rural policies are in particular used to preservecultural heritage and provide recreation functions. TheEuropean Structural and Agricultural Policies are im-portant sources for funding of these activities, as can beseen in The Hague and Manchester.In general, we can assert that the integration of differ-
ent policies is less developed in the two US cases. Thedifferent tools – be it a containment boundary, a TDRor an infrastructure establishment – have often one sin-gle particular purpose. However, with the adoption oflong term strategies in recent years, the two cities alsointegrate their policies more. However, as we can alsosee in the European cases, integrated policies often getvery complex and difficult to evaluate in detail.
ConclusionsWe explored urban growth in terms of land use changeand the use of growth management to steer it in sixEuropean and two US city regions. How urban growth ismanifested in each of the regions depends very much onthe regional context, including historical, geographicalor cultural factors. We discussed some of the issues re-garding different urban form as well as the political andlegal framework for spatial planning. More details onsome of the cases which go beyond this study can befound in Nilsson et al. [18], while this paper focuses onmain tendencies across these cities. Despite local vari-ation, urban sprawl is still a major challenge for them.Some cities experience strong population or economicgrowth, putting a high pressure on urban development.However, also cities with less growth are experiencingurban dispersion along with increasing per capita landconsumption.A dense built-up area like The Hague has less potential
for densification of its existing urban area, than a citycharacterised by many low density areas or formerbrownfields like Seattle. This trend might lead to aharmonization of urban density between the two typesof cities in the remote future, but there is still a hugegap regarding consumption of urban area with below 20inhabitants per hectare of urban area in Portland andSeattle opposite to 50 in The Hague-Rotterdam andmore than 40 in Manchester. The areas relatively mostunder pressure from urban growth are agricultural areasclose to the city, while pure nature areas are less endan-gered by urban growth.All the case city administrations have recognized the
problems with urban sprawl and are working with urban
growth management – though not always depicted assuch. Copenhagen, Portland and Manchester experi-enced least effects of sprawl between 2006 and 2011/2012 despite some development pressures. They all havea strong focus on containment in their growth manage-ment. Other cities focus on urban attraction and ruralpreservation. Market-based tools and incentives are onlyregularly applied in Seattle with a regional TDR system.A major issue for growth management policies in the
eight cases is to find a balance between a firm delinea-tion of urban areas and a certain flexibility for futuredevelopment. Some cities implement therefore onlygeneral guidelines for urban growth at the regionallevel, keeping some flexibility for the local level. Portlanddetermined urban reserves to increase the flexibility of itscontainment boundary. A crucial basis for that is a com-mon vision for future development. Simple and iconicspatial visions like the green belts of Manchester andLeipzig or the Fingerplan in Copenhagen are possibil-ities to gain support from stakeholders and citizens,though place-specific regulations should be used to an-chor and implement the vision locally. A policy mix ofeconomic and planning policies and the right co-operation within and between levels seems to be effect-ive in implementation of regional visions.
Authors’ contributionsAll authors read and approved the final manuscript.
Competing interestsThe authors declare that they have no competing interests.
Author details1Department of Geosciences and Natural Resource Management, Universityof Copenhagen, Rolighedsvej 23, 1958 Frederiksberg, Denmark. 2Nordregio,Box 1658SE-111 86 Stockholm, Sweden.
Received: 5 September 2016 Accepted: 14 November 2016
References1. Angel S, Parent J, Civco DL, Blei A, Potere D (2011) The dimensions of
global urban expansion: estimates and projections for all countries, 2000-2050. Prog Plan 75:53–107. doi:10.1016/j.progress.2011.04.001
2. EEA, FOEN (2016) Urban sprawl in Europe. Joint EEA-FOEN report3. Nilsson KSB, Nielsen TAS (2010) Towards green urban planning. In: World Eur.
Sustain. Cities Insights EU Res. European Commission, Brussels, pp 25–304. Burchell RW (1998) The costs of sprawl - revisited. TCRP, Washington DC5. Nilsson KSB, Nielsen TAS, Aalbers C, Bell S, Boitier B, Chery JP, Fertner C,
Groschowski M, Haase D, Loibl W, Pauleit S, Pintar M, Piorr A, Ravetz J, RistimäkiM, Rounsevell M, Tosics I, Westerink J, Zasada I (2014) Strategies for SustainableUrban Development and Urban-Rural Linkages. Eur J Spat Dev 1–26.
6. Pichler-Milanovic N, Gutry-Korycka M, Rink D (2007) Sprawl in the post-socialist city: the changing economic and institutional context of centraland Eastern European Cities. In: Couch C, Petschel-Held G, Leontidou L (eds)Urban sprawl Eur. Landsc. Land-Use Change Policy. Blackwell, Oxford, pp102–135
7. Seltzer E (2009) Maintaining the working landscape. The Portland metrourban growth boundary. In: van der Valk A, van Dijk T (eds) Reg. Plan. OpenSpace. Routledge, Oxon, pp 151–178
8. Ingram GK, Hong Y-H (2012) Evaluating smart growth policies in the UnitedStates. Informationen Zur Raumentwickl 2012:61–77
9. Nelson AC, Sanchez TW, Dawkins CJ (2007) The social impacts of urbancontainment. Ashgate, Aldershot
Fertner et al. Future Cities and Environment (2016) 2:9 Page 12 of 13

10. Pendall R, Martin J, Fulton W (2002) Holding The Line: Urban ContainmentIn The United States. The Brookings Institution Center on Urban andMetropolitan Policy, Washington DC
11. Ali AK (2008) Greenbelts to contain urban growth in Ontario, Canada:promises and prospects. Plan Pract Res 23:533–548. doi:10.1080/02697450802522889
12. Konijnendijk CC (2010) The role of forestry in the development and reformof green belts. Plan Pract Res 25:241–254. doi:10.1080/02697451003740270
13. Nuissl H, Couch C (2008) Lines of defence: policies for the control of Urbansprawl. In: Couch C, Petschel-Held G, Leontidou L (eds) Urban sprawl Eur.Landsc. Land-Use Change Policy. Blackwell, Oxford, pp 217–241
14. van den Berg L, Braun E, van der Meer J (2007) Synthesis. In: van den BergL, Braun E, van der Meer J (eds) Natl. Policy Responses Urban Chall. Eur.Ashgate, Adlershot, pp 399–432
15. Reckien D, Karecha J (2008) Sprawl in European Cities: the comparativebackground. In: Couch C, Petschel-Held G, Leontidou L (eds) Urban sprawlEur. Landsc. Land-Use Change Policy. Blackwell, Oxford, pp 39–68
16. EEA (2016) Corine Land Cover Data Version 18. www.eea.europa.eu/data-and-maps, last accessed June 2016, The European Topic Centre on LandUse and Spatial Information
17. Homer C, Dewitz J, Yang L, Jin S, Danielson P, Xian G, Coulston J, Herold N,Wickham J, Megown K (2015) Completion of the 2011 national land coverdatabase for the conterminous united states – representing a decade ofland cover change information. Photogramm Eng Remote Sens 81:345–354.doi:10.1016/S0099-1112(15)30100-2
18. Nilsson KSB, Pauleit S, Bell S, Aalbers C, Nielsen TAS (2013) Peri-urban futures:scenarios and models for land use change in Europe. Springer, Berlin
19. Loibl W, Piorr A, Ravetz J (2011) Concepts and methods. In: Piorr A, Ravetz J,Tosics I (eds) Peri-Urban. Eur. Eur. Policy sustain Urban-Rural Futur. Synth.Rep. University of Copenhagen, Academic Books Life Sciences,Frederiksberg, pp 24–29
20. US Census Bureau (2015) Current Lists of Metropolitan and MicropolitanStatistical Areas and Delineations. http://www.census.gov/population/metro/data/metrodef.html. Accessed 17 Nov 2016
21. Caruso G (2001) Peri-urbanisation: the situation in Europe, A bibliographicalnote and survey of studies in the Netherlands, Belgium, Great Britain,Germany, Italy and the Nordic countries. Report prepared for DATAR, France
22. Bengston DN, Fletcher JO, Nelson KC (2004) Public policies for managingurban growth and protecting open space: policy instruments and lessonslearned in the United States. Landsc Urban Plan 69:271–286
23. Jørgensen G, Nielsen TAS, Grunfelder J, Jensen JM (2011) Urban growthmanagement - Effectiveness of instruments and policies, EU-FP6 project PLUREL
24. Pallagst KM (2007) Growth management in the US. Between theory andpractice. Ashgate, Aldershot
25. Vejre H, Primdahl J, Brandt J (2007) The Copenhagen Fingerplan: Keeping agreen space structure by a simple planning metaphor. In: Pedroli B, VanDoorn A, De Blust G, Paracchini ML, Wascher D, Bunce F (eds) Eur. LivingLandsc. Essays Explor. Our Identity Countrys. Landscape Europe & KNNVPublishing, Zeist, pp 311–328
26. Hartoft-Nielsen P (2008) Fingerplan 2007 - holder den? byplan 60:30–4127. Abbott C, Margheim J (2008) Imagining Portland’s urban growth boundary:
planning regulation as cultural icon. J Am Plann Assoc 74:196–20828. Metro (2010) Urban growth report: 2009-2030 employment and residential29. Bauer A, Röhl D, Haase D, Schwarz N (2013) Leipzig-Halle - ecosystem
services in a stagnating urban region in Eastern Germany. In: Nilsson KSB,Pauleit S, Bell S, Aalbers C, Nielsen TAS (eds) Peri-Urban Futur. Scenar.Models Land Use Change Eur. Springer, Berlin, pp 209–240
30. Ravetz J, Warhurst P (2013) Manchester - re-inventing the local-global in theperi-urban city region. In: Nilsson KSB, Pauleit S, Bell S, Aalbers C, NielsenTAS (eds) Peri-Urban Futur. Scenar. Models land use change Eur. Springer,Berlin, pp 169–208
31. Jarrige F, Chery JP, Buyck J, Gambier JP (2013) The “montpellieragglomeration” new approaches for territorial coordination in the Periurban.In: Nilsson KSB, Pauleit S, Bell S, Aalbers C, Nielsen TAS (eds) Peri-UrbanFutur. Scenar. Models land use change Eur. Springer, Berlin, pp 241–274
32. Westerink J, Aalbers C (2013) The Hague Region: negotiating the commonground in Peri-Urban landscapes. In: Nilsson KSB, Pauleit S, Bell S, Aalbers C,Nielsen TAS (eds) Peri-Urban Futur. Scenar. Models land use change Eur.Springer, Berlin, pp 99–130
33. Lisowski A, Mantey D, Wilk W (2014) Lessons from Warsaw - the lack ofcoordinated planning and its impacts on urban sprawl. In: Stanilov K, Sýkora
L (eds) Confronting suburbanization - urban decentralization postsocialistcent. East. Eur. Wiley-Blackwell, Chichester, pp 225–255
34. Grochowski M, Korcelli P, Kozubek E, Slawinski T, Werner P (2013) Warsaw:spatial growth with limited control. In: Nilsson KSB, Pauleit S, Bell S, AalbersC, Nielsen TAS (eds) Peri-Urban Futur. Scenar. Models land use change Eur.Springer, Berlin, pp 131–168
35. Wolff M, Haase A, Haase D, Kabisch N (2016) The impact of urban regrowthon the built environment. Urban Stud. doi: 10.1177/0042098016658231
36. Fertner C (2013) The emergence and consolidation of the urban-ruralregion. Migration patterns around Copenhagen 1986-2011. Tijdschr VoorEcon En Soc Geogr 104:322–337. doi:10.1111/tesg.12007
37. Larsen HG, Hansen AL (2008) Gentrification - gentle or traumatic? urbanrenewal policies and socioeconomic transformations in Copenhagen. UrbanStud 45:2429–2448
38. Steinbrueck P, Winter M, Williamson S, Patterson M (2015) SSNAP report2014 Seattle sustainable neighborhoods assessment project. SteinbrueckUrban Strategies LLC, Seattle
39. Pichler-Milanovic N (2007) European urban sprawl: sustainability, cultures of(anti)urbanism and “hybrid cityscapes.”. Dela 2007:101–133. doi:10.4312/dela.27.6.101-133
40. van Rij E (2008) Improving institutions for green landscapes in metropolitanareas. Delft University Press, IOS Press, Amsterdam
41. Zasada I, Fertner C, Piorr A, Nielsen TAS (2011) Peri-urbanisation andmultifunctional adaptation of agriculture around Copenhagen. GeogrTidsskr-Dan J Geogr 111:59–72
42. Nuissl H, Schroeter-Schlaack C (2009) On the economic approach to thecontainment of land consumption. Environ Sci Policy 12:270–280
43. Kaplowitz MD, Machemer P, Pruetz R (2008) Planners’ experiences inmanaging growth using transferable development rights (TDR) in theUnited States. Land Use Policy 25:378–387
44. Pruetz R (2009) Green Legacy. Communities Worth Leaving to FutureGenerations. Arje Press, Burbank CA
45. Regional TDR Alliance (2013) Regional transfer of development rights inPuget sound
46. Henger R, Bizer K (2010) Tradable planning permits for land-use control inGermany. Land Use Policy 27:843–852. doi:10.1016/j.landusepol.2009.11.003
47. Süess A, Gmünder M (2005) Weniger Zersiederlung durch handelbareFlächennutzungszertifikate? DISP 160:58–66
48. RIKS (2010) Map comparison kit 3 user manual49. Healey P (2007) Urban complexity and spatial strategies, Towards a
Relational Planning for our Times. Routledge, Oxon50. Lehmann S (2016) Sustainable urbanism: towards a framework for quality and
optimal density? Future Cities Environ 2:1–13. doi:10.1186/s40984-016-0021-351. Tosics I (2013) Sustainable land use in Peri-Urban areas: government,
planning and financial instruments. In: Nilsson KSB, Pauleit S, Bell S, AalbersC, Nielsen TAS (eds) Peri-Urban Futur. Scenar. Models land use change Eur.Springer, Berlin, pp 373–404
52. European Commission (1997) The EU compendium of spatial planningsystems and policies. Luxembourg
53. van Dijk T (2009) Who is in charge of the urban fringe? neoliberalism, openspace preservation and growth control. Plan Pract Res 24:343–361
Submit your manuscript to a journal and benefi t from:
7 Convenient online submission
7 Rigorous peer review
7 Immediate publication on acceptance
7 Open access: articles freely available online
7 High visibility within the fi eld
7 Retaining the copyright to your article
Submit your next manuscript at 7 springeropen.com
Fertner et al. Future Cities and Environment (2016) 2:9 Page 13 of 13