urban study os map item b of the coventry area. use item b to give map evidence which shows that...
TRANSCRIPT
URBAN
Study OS map Item B of the Coventry area.
Use Item B to give map evidence which shows that part of Coventry’s CBD is located in grid square 3379.
3
SOURCESQA specimen
paper 2013

Answer
Many roads meet in this square (1), there is a tourist information centre (1), many churches (1), a cathedral (1), bus station (1).
3

URBAN
There is a plan to build a shopping centre in grid square 3981.
Give advantages and/or disadvantages of this location for a shopping centre.
You must use map evidence from Item B to support your answer.
5
SOURCESQA specimen
paper 2013

AnswerOne mark per valid statement or two for an extended point.Advantages:The land is flat so easy to build on (1) there is room for expansion (1) there are roads and motorways close by allowing the easy delivery of goods (1) and access for customers (1) eg the A46, M6 and M69 (1) the land is cheaper on the outskirts (1) the housing close by can supply a workforce (1) eg Walsgrave on Sowe (1) the city of Coventry can supply a large amount of customers (1).
Disadvantages:Roads take up a large amount of land so only a limited amount of land available to build on (1) and the road junctions could become congested at peak periods (1) the area could suffer from noise and air pollution (1) a river runs
5

URBAN
What effects does urban sprawl have on rural areas?
4
SOURCE Int 2 2010

Answer
Examples may come from ELDCs and/or EMDCs.• Some farmland is lost to new housing developments (1).
There is increased traffic on the roads during peak times (1). Commuter villages grow in size (1) and there is often an increase in house prices in rural areas (1). Young people from the rural area move away as they cannot afford the houses (1). Some local services are lost as urban commuters do not use them (1). Wildlife pushed further back into rural areas (1). Pollution (1).
• Or any other valid point.4

Urban
For a named city in the developed world, describe ways in which the inner city areas are being improved.
5
SOURCE Int 2 2012

Answer
Glasgow has landscaped older housing areas (1). They have renovated old tenements (1). New housing such as at Glasgow Harbour (1) has been put in place. Transport has been improved like the Partick Interchange (1). Tourist developments have been put in (1). Small industrial units have replaced the older industry (1).
Or any other valid points
If no named city mark out of 4.
5

UrbanFor a city you have studied:(i) What methods have been used to encourage
people to use public transport(ii) How successful have these methods been?
6
SOURCE Int 2 2011
Answer
Cost of car parking has been made very expensive (1). In some cases there is now no free parking (1). Some cities have introduced congestion charges (1). A lot of investment has been put into public transport systems (1). Fares have been reduced in order to encourage greater use by the public (1). Bus lanes have been introduced to try to speed up the service (1). Some cities have invested heavily in underground rail systems
For full marks there must be some sort of statement indicating the success of the methods.
6

URBAN
What are the advantages and disadvantages of this or any other Edge of Town shopping development you have studies?
5
SOURCE Int 2 2009

AnswerPlenty of parking space (1). Near to main roads (1). Many services in one location (1). Reduces congestion in city (1). Existing shops in CBD suffer (1). Creates extra traffic at edge of town (1). Uses up Green Belt (1).
Or any other valid point.
For full marks both advantages and disadvantages must be mentioned.
5

URBAN
Find Area A on Diagram Q1 and on the Ordnance Survey Map.Give reasons to explain the urban environment found in Area A.Your answer may refer to features such as street pattern, housing type and amount of open space.
5
SOURCESQA
Credit 2013
MAPExeter

Answer
Area A is on the edge of the town, so it has countryside areas adjacent to it, including a green wedge between the two major housing areas (1). Because it is a modern residential area there are no industries within it (1); and major roads and railways don’t go through it so less noise and air pollution (1); the streets are varied and curved in shape to create a pleasant environment (1); with many cul-del-sac street endings for safety (1). Amenities, including schools, a church and leisure centre have been provided for the residents (1); land is cheaper so houses are likely to be detached and semi-detached, with gardens, and it’s not as crowded as the inner city (2).

URBAN
What map evidence is there that Whimple (0497) is a commuter settlement?
4
SOURCESQA
Credit 2013
MAPExeter

Answer
Whimple is a big village with no evidence of industry, which suggests most people work elsewhere (2); it’s in the type of quiet, rural area, close to the city (1), where they may work (1), where some people prefer to live, away from the noisier urban environment (1); it has a station and direct rail link to Exeter (1), where there are many employment opportunities (1); it’s also only a short way from the A30, a good road link to the city (1); tourism might provide local jobs (1).
Or any other valid point.

URBAN
Using map evidence, explain how problems of traffic congestion in the Exeter area have been tackled.
4
SOURCESQA Credit 2012
MAPExeter

Answer
Main routes such as the M5/A38 and A30 bypass the city, so a lot of traffic doesn’t have to go into the centre (1); a number of large, modern junctions have been created (1), eg in 9691 (1), to ease the flow of traffic (1); park and ride schemes eg at 962918 reduce commuter traffic (1) and help rush-hour congestion (1); having industry eg the industrial estate at 9692 at/near the edge of the city reduces industrial traffic in the city (1); within the city, roundabouts eg 956921 reduce stoppages (1).
Or any other valid point. 4

URBAN
• A group of school pupils has carried out fieldwork along the transect shown on Diagrams Q1A and Q1B.
• They have correctly identified the land use zones shown on Diagram Q1B.
• Referring to at least three zones, give map evidence to support the pupils’ findings.
6
SOURCESQA Credit 2012

AnswerDormitory Settlement • No evidence of any industry in Broughton so people must travel to work elsewhere (1). There are only
low order services (1) such as the PO and school (1). There is good road access by A6 into centre of Preston (1). It is only 1km from the edge of a large town where people can work (1).
Green Belt • There is open space between Broughton and Preston which could be built on, so it is likely that
development has been restricted (2). Suburbs • The street pattern is modern geometric curves and cul-de-sacs (1). • The school, leisure centre and hospital provide modern services for residents (1). It is close to the
edge of town so was built more recently than other parts (1). There is more open space than in the area close to the centre (1).
Inner City • Streets are close together (1) and in a grid iron pattern (1). Large blocks by the railway nearby suggest
industry (1) so this will be housing built for workers (1). County Hall (1). CBD • There are many churches indicating the oldest part of town (1). Main roads converge here (1). It is in
the centre of Preston (1). Railway(1) and bus stations (1). Tourist information (1) and museum (1). Or any other valid point. For full marks candidates must refer to at least 3 zones. No marks for grid references. Otherwise maximum of 5.
Maximum of 3 marks for any one zone.

URBAN
On which site would it be better to build a new housing development?
Give reasons for your answer.5
SOURCESQA Credit 2012

AnswerBrownfield: Building here would rid the area of a derelict eyesore (1). Old industrial land is usually cheap to buy (1). Infrastructure such as road and power supplies would already be present (1). There would be easier access to services in the city (1) such as shopping, entertainment and schools (1). It would be difficult to get permission to build on the greenfield site (1) which could disturb natural habitats and wildlife (1) and the developer could face protests from environmentalists (1). Building on brownfield sites helps prevent urban sprawl (1). Greenfield: Out of town location means land will be cheap (1) and there will be plenty of space to build (1). There is a pleasant environment which may make it easier to sell the houses (2). The land has not been built on before so will be easier to develop (1). Brownfield area would be expensive to clean up and would increase building costs (2). People may not want to buy houses on brownfield sites as there will be more noise, congestion and pollution in the city (1).
Or any other valid point. Accept negative statements about the alternative site. Also accept answers that refer to both sites.
5

URBAN
Mr and Mrs Boal and their two teenage children are moving to the city shown opposite.
They have found houses for sale in the three locations identified.
Which location do you think they should choose?Give reasons for your choice.
5
SOURCESQA Credit 2011

AnswerLocation 1 – Inner City Close to the CBD for work (1) and very close to a regional shopping centre where they could do most of their shopping (1) reducing travelling cost (1). The houses here are mostly terraced housing so could be cheaper (1). There is a secondary school nearby for their teenage children to attend (1). They are near main roads and a train station for easy travel to the countryside (1). They will have a good riverside view (1). Location 2 – Inner Suburbs There is a secondary school close by for their teenage children to attend (1). The environment would be nicer because of more open space (1). Houses are likely to be more modern than those in location 1 (1). There is a mixture of council and private housing to choose from (1). Some of the houses will be detached or semi-detached (1) with gardens suitable for families (1). Near main road for easy access to the CBD and the countryside (1). There is likely to be less traffic as there are fewer main roads compared to location 1 (1).
Location 3 – Outer Suburbs Most modern private houses far from the city centre (1). Houses will have both front and back gardens (1) and garages (1). House will be mostly detached and semi detached with bay windows (1). They are well planned, spacious and safe (1). There is a regional shopping centre close by so no need to travel to the CBD for shopping (1) saving on travelling cost (1). Closest to the countryside for walks (1). There is a golf course close by if they fancy a round of golf (1). The air is much cleaner as there are few main roads/less air pollution (1). There is a main road nearby if they need to go to the city centre (1).
Or any other valid point.1 mark for a valid statement, 2 marks for a developed point. Accept negative/positive points about the other locations.
5

URBAN
What is the main present day function of Dunfermline?
Choose from: service centre tourist centre.
Use map evidence to support your answer.4
SOURCESQA Credit 2010
MAPDunfermline
AnswerIf service centre chosen:• There are many schools in Dunfermline (eg 1187) (2); and
also various hospitals (eg 112887) (1). Dunfermline has a variety of other services which are typical of a service centre including a college (1), police station (1) and a library (1). There are also bus and railway stations (1) and there is a football stadium at 103879 (1).
Tourist centre:• Any reference to parks (1), Fife Leisure Park (1), reference
to museums (1), abbey (1), loch with sailing (1), golf course at 1185 (2).
4

URBAN
Look at Diagrams Q6A and Q6B.
Choose any two zones shown in Diagram Q6A. For each zone chosen, give reasons for the ways in which the land has been used.
6
SOURCESQA Credit 2010

AnswerCBD: will have tall buildings because space is scarce (1) and land values are high (1); these buildings are likely to be occupied by high order services such as department stores, which need a central location to attract large numbers of customers (2).
Inner city: will have old factories because this is where industry set up first (1); close to old housing because people had to walk to work (1); the housing will be tenements or terraces which permit high housing densities (1); laid out in a grid-iron pattern to save space (1) and because little thought was given to environmental quality (1). The grid-iron pattern will encourage through traffic causing air and noise pollution (1).
Outskirts: Modern housing has been built away from the unpleasant conditions of the inner city for workers and managers who could afford transport (2); and may be detached or semi-detached houses with gardens for a pleasant environment (1). These houses usually have driveways and garages as many people now commute to work by car (1) and there is more space to build them as the land here is cheaper (1).
Green Belt: this land is protected by strong planning regulations to prevent urban sprawl from happening (1) which would use up more and more countryside and farmland (1). Recreational amenities may be found in the green belt such as golf courses/country parks, provided for the nearby population of the city (2); sometimes bypasses or ring roads are built here to ease traffic flow around the city (1).
Or any other valid point.

URBAN
Look at Reference Diagram Q1B.
Using map evidence, compare the main functions of Barmouth and Dolgellau.
You must refer to both similarities and differences in your answer.6
SOURCESQA Credit 2009
MAPBarmouth and
Dolgellau.

AnswerSimilaritiesBoth are holiday resorts (1) because both have a tourist information centre and a leisure centre, a cycle route passing through and a caravan/camp site. Barmouth has a sandy beach which would attract holiday makers and tourist facilities such as a museum while the attractions of Dolgellau are the surrounding hills and forests for walking. Both have footpaths leading out of town onto the surrounding hills (2). Both towns are service centres (1) because both of them have hotels, leisure centres and churches (2).
DifferencesDolgellau is a route centre (1) with 5 main roads meeting there (1) Barmouth has only the A496 passing through (1). Barmouth is a port (1) with a harbour and a ferry (2).
For full marks at least one similarity and one difference should be mentioned – if not mark out of 5.Max 2 marks for evidence relating to any single function.Differences which are implied should be credited.Max 1 for grid reference.
6

URBANLook at Reference Diagram Q5.
Give reasons for the patterns of the land use shown in both the suburbs and the Central Business District.
6
SOURCESQA Credit 2009

AnswerThere are more shops and offices in the CBD due to its greater accessibility (1) as a result of there being stations located there (1) and A class roads converging (1). Land values are high in the CBD so only large shops and offices can afford the rents (1). There are hotels in the centre because they are close to the stations (1). There is much less open space in the CBD due to thehigh demand for land (1). The residential land is mainly in the suburbs because land is cheaper there (1) and the environment is more suitable with cleaner air and less noise (1). There is industry in the suburbs because new industries are located at the edge of cities for ease of access by road, avoiding the traffic congestion of the centre (2).
6

URBAN
Describe the differences between the urban environments of Area A (0440) and Area B (0641).
5
SOURCE SQA Credit 2008MAP
Ilkley

Answer0440 is an area of newer housing, 0641 an older town centre/inner urban area (1). 0440 mainly suburban residential, 0641 greater variety – town centre, shops, offices and industry as well as housing (2). 0440 varied street pattern including crescents and cul-de-sacs, 0641 less varied (linear/rectangular/grid-iron) (1). 0440 has smaller buildings (houses), 0641 has large buildings including factories/industry (1). 0440 limited amount of traffic, less noise pollution, 0641 many main roads, railway (and station), bus station – more noise and pollution (2). 0440 more open spaces/access to countryside including nature reserve, 0641 less open space and poorer quality environment (2).
5

URBAN
Look at Reference Diagram Q5A.
Explain in detail why there are different types of houses in Zones 1 and 3.
6
SOURCE SQA Credit 2008

AnswerZone 1 19th C In the inner city tenements/terraced housing was built to save space (1), because this zone is close to the CBD where land is expensive (1) this allowed high population densities (1), houses were close to industry because people had to walk to work (1), little open space or gardens as land was scarce (1).
Zone 3 late 20th C Because it is on edge of town where land is cheaper there will be low housing density (1), houses are larger, detached or semi detached with back and front gardens and garages (1), newer housing so better planned layout with cul-de-sacs and crescents (1).
6
POPULATION
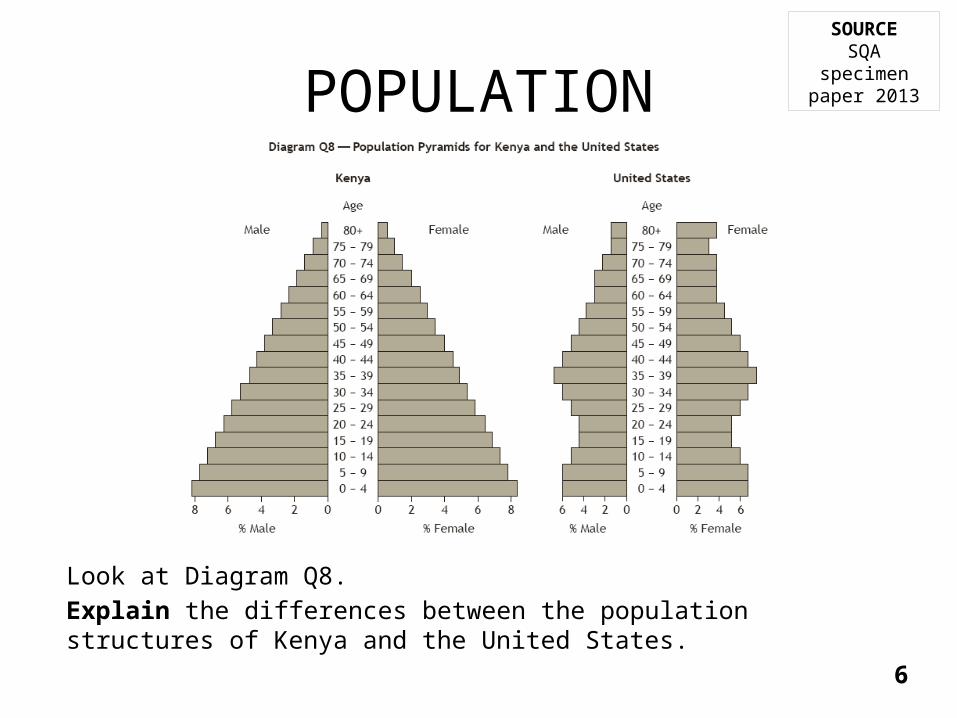
Look at Diagram Q8.Explain the differences between the population structures of Kenya and the United States.
6
SOURCESQA specimen
paper 2013

AnswerThere is a higher proportion of the population of Kenya under the age of 15 because birth rates are higher in developing countries (1) where fewer women get the chance of an education (1) and there is less use of contraception (1) and information on birth control is less easily accessed (1). There is a larger number of over 60s in the USA because more people have the chance of medical treatment than in Kenya where there is less money to set up health centres and hospitals (2). The high living standards in the USA mean that there are plenty of opportunities for women to have careers and this reduces birth rates (1). Child mortality rates are higher in Kenya so people have many children in order to ensure that some survive (1). Many families in Kenya have lots of children so they can contribute to the family income when old enough and look after them in old age (2).
Or any other valid point.
6
POPULATION
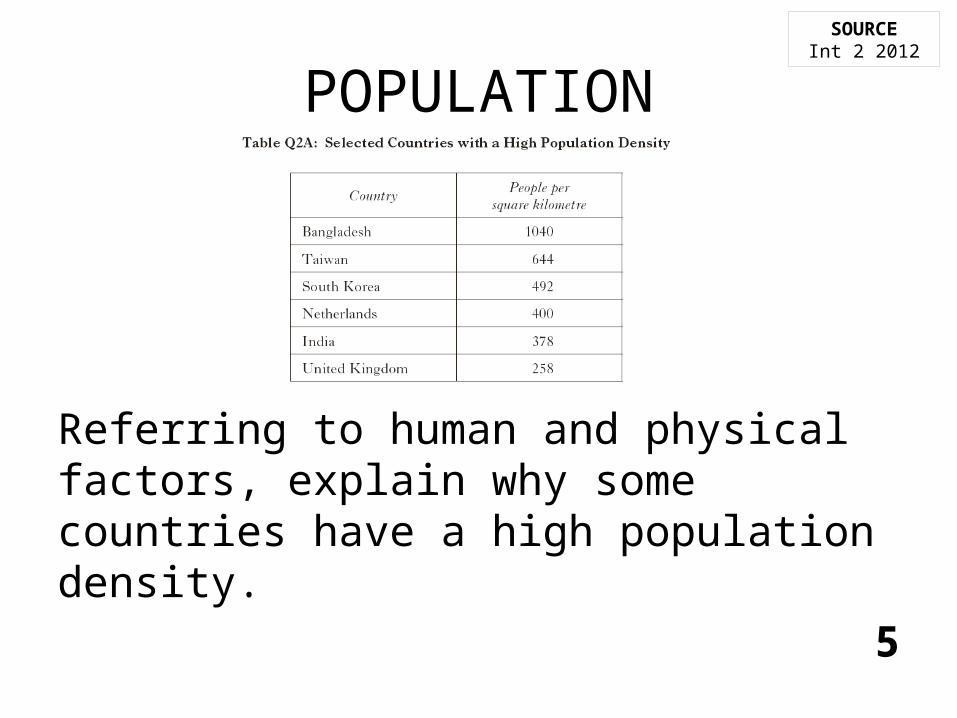
Referring to human and physical factors, explain why some countries have a high population density.
5
SOURCEInt 2 2012

AnswerSome areas have rich natural resources to be used (1) and this attracts people in (1). Some areas have many jobs available (1). Some areas have very good transport and are easy to get to (1). Some areas have a temperate climate (1), which allows many crops to be grown (1). High birth rate (1).
Or any other relevant point
For full marks reference to both human and physical must be made, otherwise mark out of 4.
5

POPULATION
Describe ways in which countries like China are attempting to reduce their population growth rate.
4
SOURCEInt 2 2012

Answer
China used the one child policy to help reduce growth (1). Indonesia introduced more free contraception (1). Some countries have used sexual education (1). Some countries use tax incentives to encourage smaller families (1). Increased level of education (1).
Or any other relevant point
4

POPULATION
Why do people in developing countries move from rural to urban areas?
6
SOURCEInt 2 2012

Answer
People move into cities to seek work (1). They leave rural areas which have few schools (1). They go to cities to get better health services (1). Younger people leave rural areas as they are attracted to shops/services in urban areas (1). They leave rural areas because of natural disasters (1). They leave rural areas due to under-employment (1).
6

POPULATION
Referring to human and physical factors, explain why some areas of the world are more densely populated than others.
5
SOURCEInt 2 2011

AnswerSome areas may be too steeply sloping for building on (1). In some areas there may be fertile soils (1); which allows people to grow enough food to feed themselves (1). Some areas may be too high for people to live comfortably (1). Temperate climate would make for a suitable place to live (1). Lack of water may prevent people from living in certain areas (1). High humidity could be a problem (1). Other areas may be too cold (1). Areas with many natural resources are usually attractive places for people to live (1)Areas with good transport links usually attract people (1); such areas usually attract industry, thus giving employment opportunities (1). Remote/isolated areas do not usually attract many people (1).
Both physical and human factors must be mentioned for full marks, otherwise mark out of 4.
5

POPULATION
For Scotland, or any other country you have studied, describe problems which may be caused by the population changes shown above.
5
SOURCEInt 2 2011

AnswerFew children are being born which could result in a shortage of working adults in years to come (1). This will result in fewer people paying tax which could affect the nation’s economy (1). Jobs could be lost in nurseries, schools etc (1). The country will start to develop an ageing population (1). More money will need to be spent on pensions (1). The cost of health care for the elderly will rise (1). More demand for care services such as meals on wheels (1). More demand for sheltered housing and old people’s homes (1).
Or any other valid point.5

POPULATION
Describe the changes in the World Population Growth rate from 1950 to 2050.
3
SOURCEInt 2 2010
Answer
In 1950 population growth rate was approx 1.7% (1), it then went up to 2%, in 1960s and 70s (1), it then fell from 70s to 80s (1), then steadied during 80s (1) but since then has fallen (1) and is projected to fall further (1).
3

POPULATION
What is the main difference in population growth between developing and developed countries? Give reasons for this difference.
6
SOURCEInt 2 2010

AnswerIf no difference mentioned max 5 marks.
1 mark for difference – population growth in EMDC hardly changing whereas in ELDCs rapid growth.
EMDCs are predicted to hardly change, this is because of increased use of family planning (1), less desire for large families (1), later marriages for women (1). ELDCs are continuing to grow due to need for families to look after elderly (1), bring in money for family (1), lack of education on family planning (1).Do not have to give both ELDC and EMDC.Or any other valid point.
6

POPULATION
Study Diagram Q2B.
For Kenya or Italy describe the population structure.
4
SOURCEInt 2 2010

AnswerMax 1 mark for explanation.Kenya – majority of the population are under the age of 15 (1), population numbers decrease as age increases (1), smaller numbers of people found over 60 (1). Nearly 7% under 4 years of age (1). Low life expectancy (1) high degree of juvenility (1) older males living longer than females (1).
Italy – largest number of people are in the economically active ages (1), fewer young people under 19 (1), more women then men (1), increased numbers of elderly population (1). % of young people drops dramatically (1).
Or any other valid point.
4

POPULATION
Describe the main differences in the population structures shown between the rural and urban areas, shown in Reference diagram Q2A, in an ELDC.
3
SOURCEInt 2 2009

Answer
Bigger % males in 20-35 age groups in Urban area (1). Fewer females in 20-35 groups in Urban area (1). Bigger % of female in 60+ groups in Rural area (1). Smaller % of children up to 14 in urban areas (1).
Credit references to birth and death rates (1).
Or any other valid point.3

POPULATION
Suggest reasons for the differences in the population structures you described in (a)(i).
4
SOURCEInt 2 2009

Answer
Emigration of young males to cities to find work (1). Women more likely to stay at home to look after family (1). Return home of some workers to rural area after living in the city (1). Elderly people staying in the rural area as did not want to move away (1). Higher birth rate in rural areas (1). Children can work on farms (1). Children to look after older parents.
4

POPULATION
Explain why Economically More Developed Countries (EMDCs) have a low infant mortality rate.
3
SOURCEInt 2 2009

Answer
EMDCs have child inoculation programme (1). EMDCs usually have more doctors per head of population (1). EMDCs have specialist child care maternity units (1). EMDCs have better access to post natal care (1). EMDCs have better equipped hospitals (1), better overall standard of living (1).
3

POPULATION
Study Reference Diagram Q2A.Referring to both physical and human factors, explain why some areas of the world have a population density of less than 20 persons per square km.
5
SOURCEInt 2 2008

AnswerBoth physical and human factors should be mentioned for full marks. Possible answers may include: Few people live where the climate is very cold (1). Few people live where there is very little rainfall (1). Few people live where there are very poor soils (1). Few people live where there are steep mountains ranges (1). Few people live where there are few or no resources (1). Few people live where transport systems are poor (1). Few people live where it is difficult to grow crops (1). Few people live where there are few employment opportunities (1).
5
POPULATION
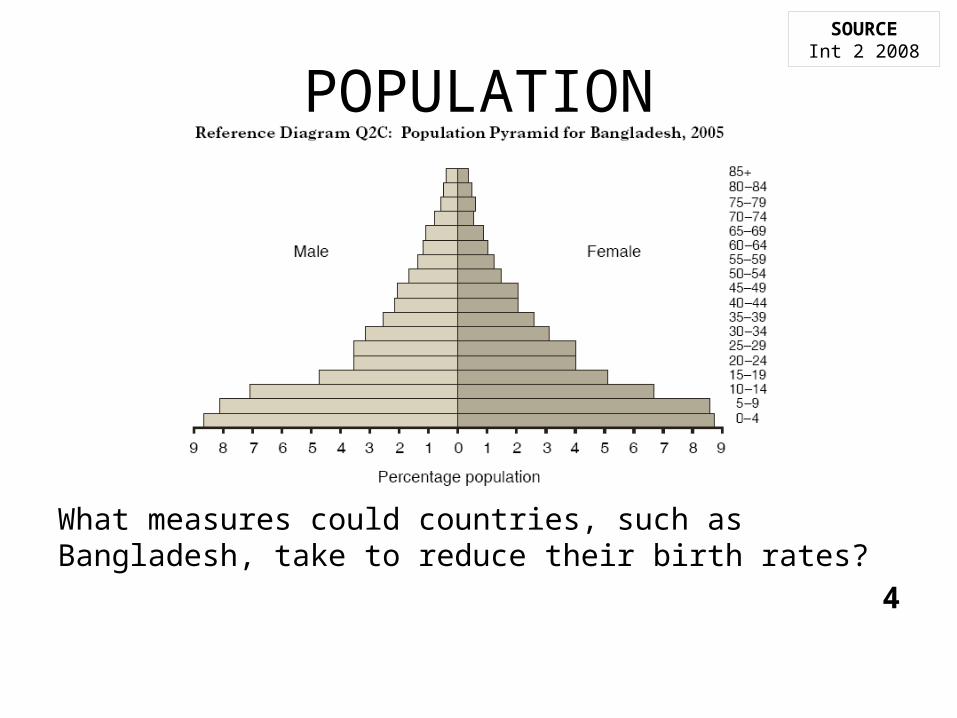
What measures could countries, such as Bangladesh, take to reduce their birth rates?
4
SOURCEInt 2 2008

Answer
Improve the education of females (1). Introduce laws to limit the size of the family (1). Provide male sterilisation programmes (1). Increase the availability of family planning (1). Provide incentives for people to limit the size of their family (1).
4

POPULATION
Describe, in detail, the trends shown from 1975 to 2015. 3
Explain the changes shown for cities with more than one million people.
4
SOURCEInt 2 2007

Answer
Rural population has decreased from 72% to 52% (1). Urban has increased from 28% to 48% (1). Cities of 1 million+ have gone up from 9% to 21% (1). If no data quoted, award maximum 1 mark
3
Decrease in rural – urban migration (1) due to pull factors eg jobs (1) more money available (1) entertainment (1) etc. Push factors such as poverty in the countryside (1), drought and famine (1), poor housing/lack of medicine/education (1) etc. Maximum 1 mark for simple list of push/pull factors.
4
SOURCEInt 2 2007

POPULATION
Study Reference Diagram Q2B.For Canada, or any other EMDC* you have studied, describe the long term problems which may be caused by its population structure.
5

Answer
Decreasing birth rate – shortage of trained workers (1), increased tax burden on working population (1), school closures (1). Increased life expectancy – large number of older dependants (1), increased health care costs (1), pressure on pension provision (1).
Or any other valid point. 5

POPULATION
Describe differences in the population structure of China between 2000 and 2050.
4
SOURCE SQA Credit 2013

Answer
As a percentage of the population there are fewer babies being born in 2050 (1) about 2% less (1) there are fewer children under the age of 15 (1) there is a smaller working population (1) there are far more people over the age of sixty (1) there is a great increase in the over 80’s (1) especially females (1).
Or any other valid point.

POPULATION
What problems might the projected structure of 2050 cause for the Government of China?
4
SOURCE SQA Credit 2013

AnswerMore care will need to be provided for the elderly (1) eg care homes (1). There may not be enough carers for the elderly (1). There will be a higher percentage of people in retirement with less working population to support them (1). The government will struggle to find the extra money needed for the increased elderly population (1). Increased strain on the already limited health services (1). A reduction in the labour force will affect the economic growth rate (1). Many buildings will be too big for the smaller number of school children (1).
Or any other valid point.

POPULATION
Look at Diagram Q8.Describe the social and economic effects these changes will have on remote areas such as Shetland.
5
SOURCE SQA Credit 2012

AnswerThere will be fewer children to fill the local schools which could result in the closure of schools and staff will become unemployed (2). With fewer children some schools may be amalgamated and children forced to travel greater distances (2). In future there will not be enough young people to fill the available jobs (1) and it will be difficult to attract workers as many people do not want to live in such isolated areas (1). Increasing numbers of pensioners means there will be less money coming into the local economy causing local services to close down (2). Providing care and services for the increasing elderly population is expensive and with fewer people of working age these services may be limited (2).
Do not accept straight lifts. Accept answers which are all about economic or social effects
5

POPULATION
Look at Diagrams Q9A and Q9B above.
Give reasons for the population changes in Kenya.
5
SOURCE SQA Credit 2011

AnswerPeople are moving from rural to urban areas (1) because they hope to improve their standard of living (1). In the cities there are better jobs with higher wages (1). There is education for their children (1) and better health care facilities (1) which may lead to a longer life (1). Life in the countryside is hard (1) and there are high levels of poverty (1). There is little employment outside agriculture (1) and wages are low (1). The countryside lacks services such as schools and health care (1).
Accept any other valid point.5

POPULATION
Look at Diagram Q10 above.“GDP per capita is a measure of wealth.”Explain why there is a link between GDP per capita and the number of births per woman as shown in the graph.
5
SOURCE SQA Credit 2011

AnswerThe number of births per woman is low where GDP per capita is high because: Women have access to family planning and contraception (1). Women are better educated and able to follow careers (1) this means they marry later and delay children until they are older (1) therefore having smaller families (1). Material aspirations means women work instead of staying at home to look after children (1). Infant mortality rates are low therefore less need to have so many children (1).
The number of births per woman is high where GDP per capita is low because: There is a lack of birth control and family planning (1). Poverty/lack of health care means many children die in infancy (1) so parents have more in the hope that a few will survive (1). In poor countries children are viewed as part of the labour force and earn money for families (2). A lack of pensions and social services means children are needed to provide for their parents in old age (2). Religious or social pressure encourages people to have more children (1). Women marry young and have larger families (1).
5

POPULATION
Study Diagrams Q8A, Q8B and Q8C.
Explain the distribution of population in Kenya.
4
SOURCESQA specimen
paper 2010
AnswerNorthern areas of Kenya are sparsely populated because these areas receive very little rainfall so there is a lack of water for domestic use and to irrigate crops (2); the south west of Kenya is wetter so population density is higher here as crops and livestock farming can take place (1); population density is high in and around Nairobi city as there are plantations nearby and these require many workers (1); the major industrial areas have a high population density as there are job opportunities for the people and services like schools, hospitals and shops (2); along the south eastern coast the population density is quite high as these areas have more rainfall and more pleasant to live in (1); Mombasa is a port so there are jobs here (1); this area also attracts tourists so there are lots of jobs available (1).
4

POPULATION
Look at Diagrams Q9A and Q9B.“The population growth of India will cause the
country many problems.”
Do you agree fully with this statement?Give reasons for your answer.
5
SOURCESQA specimen
paper 2009

AnswersYes:India will have to grow or import more food as there are more mouths to feed (1); there will be a large number of young people who will grow up and want to have their own families, so the population will continue to grow (1), putting even more pressure on resources like housing and health care (1); there might be a shortage of schools and trained teachers as the country will find it difficult to pay for them (1); this will result in a lack of knowledge about family planning and birth control (1); living standards are likely to drop and poverty and disease will increase as people cannot afford to feed themselves (2) or pay for hospital/medical treatment (1).
No:India’s growing population will provide a large active workforce (1); which will be able to produce more food (1) as well as goods for export which will help India’s economy to grow and help to improve its trade balance (2); there will be large number of fit people to join India’s armed forces to help defend the country (1).
One mark per valid point, two for a developed statement.Accept yes/no answers.Or any other valid point.
5

POPULATION
Study Reference Diagrams Q8A and Q8B.
Describe in detail the population distribution in Europe.4
SOURCESQA Credit 2009
Answer
Population is not evenly distributed across Europe (1) some areas such as England are quite densely populated (1) while other areas, such as most of Scandinavia, have low population densities of under 50 people per square kilometre (2). Some parts of the coastline seem to be quite densely populated (1) such as Spain and Portugal (1). Areas with mountains have quite low population densities such as Scotland, the Alps and the Pyrenees (2).
4

POPULATION
Look at Reference Diagrams Q9A and Q9B.(a) Describe the trends
shown in both graphs.4
(b) Explain why urban populations are expected to continue increasing.
5
SOURCESQA Credit 2009

AnswerThe percentage of the population living in urban areas is expected to increase in both ELDCs and in EMDCs (1). The percentage will rise to 83% in EMDCs by 2030, whereas in ELDCs it will increase to 56% (1) there is a bigger proportional increase in the ELDCs (1).Overall the total world population is rising but it is going up faster in urban than in rural areas (2). Between 1950 and 2030 the world’s urban population will have gone up about 5 times while the rural population will have increased by less than 50% (2) this shows a very dramatic rise in urban population (1).
One mark for each relevant point. Two marks for developed statements.
For full marks reference must be made to both graphs.
5

POPULATION
Look at Reference Diagram Q7A.
Describe in detail the changes shown on the Demographic Transition Model from Stage 1 to Stage 4.
4
SOURCESQA Credit 2008

AnswerBirth Rates In stage 1 these are high (over 40/1000) (1) remaining high in stage 2 (1) they fall sharply in stage 3 to around 10 per 1000 (1) levelling out and remaining low in stage 4 with one or two small baby booms (1).
Death Rates These were high and fluctuating in stage 1, between 43/1000 to 46/1000 (1) falling sharply in stage 2 to around 11/1000 (1) remaining low in stages 3 and 4 (1).
Total Population This remained low in stage 1 and into stage 2 (1) halfway through stage 2 total population started to increase (1) total population increased dramatically in stage 3 (1) levelling out in stage 4 (1).
4

POPULATION
Look at Reference Diagram Q7B.Choose one country shown on the table.
Suggest reasons for its rate of natural increase.4
SOURCESQA Credit 2008

AnswerNigeria In Nigeria there is little contraception available so birth rates are high (1), high numbers of births to ensure some children survive (1), children are needed for an income (1) and to look after parents in their old age (1) as no government pensions (1). Death rates are falling due to Primary Health Care (1) foreign aid (1) availability of medicines from developed countries (1) high birth rates and falling death rates means a large natural increase (1).
UK Low birth rates and low death rates mean very low natural increase (1). Low birth rates results from better medical care of mothers and babies (1), so most babies survive (1) so lower birth rate (1), low birth rate from use of contraception (1), birth rates low from later marriages (1), children are expensive (1), women want careers rather than children (1). Low death rates due to medical advances (1), good living conditions (1), National Health Service (1).
4
RURAL
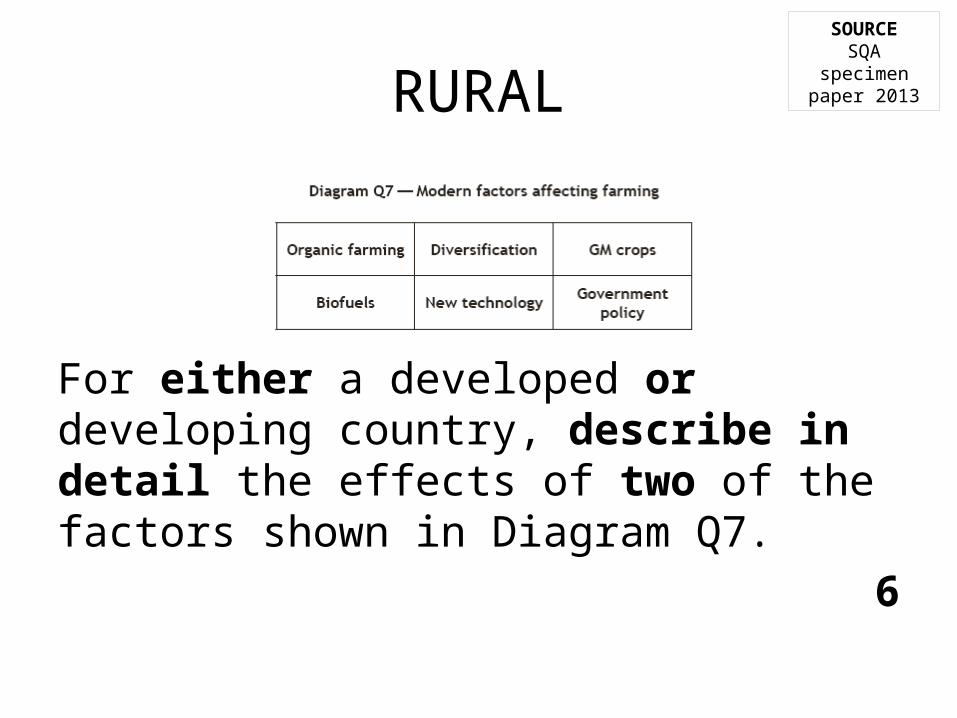
For either a developed or developing country, describe in detail the effects of two of the factors shown in Diagram Q7.
6
SOURCESQA specimen
paper 2013

Answereg If New Technology chosen:Developing Country — Increased crop yields (1) better profits for some farmers (1) which can then be used to improve overall standard of living (1) Less physical work for people (1) but fewer jobs for people (1) Expense of machines (1) machines need repairs costing more money (1) which many developing countries cannot afford (1).
Developed Country — Increases the efficiency on a farm enabling the farmer to plough, sow, spray etc, more quickly, covering larger areas (2) It also speeds up harvesting and results in the product being delivered to markets fresher (1) and at a higher premium (1). It also allows for a smaller work force (1) and therefore lower wage bills (1). It allows for the use of satellite technology/computers to control the application of fertilisers to particular areas of fields (1) improving yields (1) yet decrease the cost and waste as only the required amounts are delivered to each segment according to the soil quality there (2).
or any other valid point.
For full marks two factors should be mentioned.Award up to 4 marks for any single factor.1 mark per valid statement or 2 for an extended point.
6

RURAL
Explain how countries such as India have been able to rapidly increase crop production.
4

Answer
Indian farmers started to use HYV of rice (1). Farmers are using more fertilisers to help crops (1). Machinery has increased efficiency (1). Land reform has made bigger farms (1).
Or any other valid point.4
SOURCE Int 2 2010

RURAL
What benefits and problems have changes such as those shown in the diagram brought to ELDCs?
5

Answer
Benefits include increased crop yields (1). Better profits for some farmers (1). Less physical work for people (1). Problems include fewer jobs for people (1). Expense of machines (1). Machines need repairs costing more money (1). Fertilisers increase risk of pollution (1).
5For full marks both benefits and problems must be mentioned.

RURAL
Study Diagram Q6 above.Choose two of the developments shown in Diagram Q6 and explain how they have changed farming in Britain in recent years.
6
SOURCE SQA Credit 2013

AnswerMechanisation Mechanisation has increased farm efficiency (1) allowing crops to be harvested quicker (1) and delivered to markets fresher (1). Fewer workers are needed reducing wage bills (1) although this means that jobs have been lost in farming (1) contributing to rural depopulation (1) and run-down of rural services (1). Mechanisation has resulted in bigger fields as large machines need lots of room to work (2) meaning hedgerows have been removed spoiling the look of the countryside (1) and reducing wildlife habitats (1). Scientific Advances Yields have increased through selective breeding/genetic modification (1) and through increased use of fertilisers/pesticides (1). This means farmers’ profits have increased (1), although there are public concerns over food safety (1) which means more people have turned to organic produce creating new markets for farmers (1). Diversification Diversification has helped farmers increase profits (1) and means many now make money from tourists such as renting out cottages (1) or by using land for pursuits like golf/quad biking (1). Some have diversified by keeping exotic animals such as wild boar/bison (1). This means that farmers have had to learn new skills (1).

RURAL
Look at Diagrams Q6A and Q6B.
Explain the land use on the farm.
6
SOURCE SQA Credit 2012

AnswerMost of the land is high and cold so only hardy animals like sheep can survive (1). Mostly rough grazing due to steep slopes making it difficult to use machinery (1). Thin acid soils and cold wet climate make it difficult to grow crops (2). Short growing season due to high altitude also makes it difficult to grow crops (1). Flat land in valley floor enables machinery to be used to harvest crops like barley and turnips (1) which can be used as winter fodder for livestock (1). The limited amount of lowland has deeper soil and warmer climate enabling crops to grow (2). High rainfall means grass grows better than other crops, so there is more improved pasture than arable land (2).
Or any other valid point. 6

RURAL
Look at Diagram Q6.“Prospects for Scottish farmers in 2012 look bleak and uncertain.”Do you agree fully with this statement?Give reasons for your answer.
5
SOURCE SQA Credit 2011

AnswerYes: Fuel prices have gone up a lot and so it will be much dearer to run farm equipment and for farmers to import or export products (2). As there are less EU subsidies, farmers will have to work doubly hard to make up the shortfall (1) so some farmers may go bankrupt as a result (1). A rise in insect pests due to global warming may reduce yields (1) or increase farmers’ costs as they have to buy more insecticides (1). Increasing tourist numbers in the countryside could cause problems for the farmer if they leave gates open and allow livestock to escape (1) or drop litter which could harm the animals (1).
No: There are lots of opportunities for farms to increase their profits eg farms could diversify and run bed and breakfast in the farmhouse or rent out old farm workers’ cottages as holiday chalets (2). Extra income could be gained by offering pony trekking to increase numbers of tourists in the countryside (1). A well run farm shop would give farms the chance to bring in extra profit (1). There are extra grants available for looking after the environment, so farms might benefit by planting hedgerows and improving wildlife habitats (1). Global warming could mean that new crops could be produced that were not possible before (1).
5

RURAL
“Halbeath Farm at 126889 is an excellent location for farming.”
• Do you agree fully with this statement?• Give reasons for your answer.
4
SOURCE SQA Credit 2010
SOURCE Dunfermline

AnswerYes: it has excellent road access from a B class road which links within less than 1 kilometre to a motorway, so it will be easy to transport goods in and out (1); there is a large market close by in Dunfermline (1), from where it will also be easy to get labour (1); most of the land is not too steep so it will be possible to use machines to grow crops (1), gently sloping south facing land will be warm, sunny and is likely to be well drained, making it ideal for growing crops (2).
No:it is so close to an urban area that there may be problems with vandalism and people damaging crops by walking through the fields (2); there are air shafts just to the north of the farm which could cause problems for machines working in the fields (1); being so close to Dunfermline the farm’s land will be under threat from urban expansion (1); the steep hill indicated on the B road shows that some of the land may be too steep for machinery, so the farm will be limited in what it can do with this land (1); heavy traffic related to retail park may cause inconvenience for farmer (1).
4

RURAL
Look at Diagram Q7.The sources of this farmer’s income have changed since 1980.Give reasons for these changes.
6
SOURCE SQA Credit 2010

AnswerRedland Farm has diversified (1) and now earns a large percentage of its income from new activities such as rented holiday cottages because its old farming activities were not profitable enough (2) and new sources of income help to keep farm viable (1); some crops have become less fashionable, such as oil seed rape (1) while others, such as organic produce bring in a good income as they are becoming more popular, because people want to eat healthy food (2); also government and EU grants are now being given for different crops and activities compared with 1980 (1) such as grants for protecting the environment instead of growing crops (1). As tourism has grown, Redland Farm can now earn a good income from tourist related activities such as quad biking (1).
Or any other valid point.
6

RURALLook at Reference Diagrams Q6A and Q6B.“The changes in farming since 1950 have brought
more benefits than problems.”
Do you agree fully with this statement?Give reasons for your answer.
5
SOURCE SQA Credit 2009

AnswerAgreeMachines can do jobs faster and more efficiently than farm workers (1) Larger fields have made it easier to use machines and help increase yields (2) increased yields increase the farmer’s profit (1) and makes the country more self sufficient (1). Fewer farm workers saves the farmer paying wages (1) and he can use the empty farm workers cottages to get extra income by renting them out to tourists (1) Surplus food production has been reduced by using set aside (1) and the farmer is paid by the government/EU for doing this (1).DisagreeMachines are large and spoil the natural look of the countryside (1) and also pollute the atmosphere (1). Larger fields have meant hedgerows have been removed destroying the natural habitat of birds and animals (1) disease is more easily spread in large fields (1). Farm workers have been replaced b machines so farming jobs have been lost (1). Increased yields can lead to a food surplus (1) and to reduce this, land is left uncultivated (1) or farmers are given quotas to reduce output (1).
5
RURAL
Find Briery Wood Farm at 095474.
What are the advantages and/or disadvantages of this location for a farm?
4
SOURCE SQA Credit 2008MAP
Ilkley

AnswerAdvantages: land to the north of the farm is fairly gently sloping and could be suitable for pasture (1) and even for cultivation using machinery (1). There is access to services in nearby Ilkley (1) and to markets via the A65 primary route (1). Land is well drained because of slope (1).
Disadvantages: there are several footpaths in the area, and the Dales Way nearby, visitors/walkers could be a nuisance (1) location on the outskirts of town could cause vandalism/dumping problems (1) some of the land is very steep, especially to the south of farm buildings making use of machinery difficult (1). Woodland may be habitat for pests eg rabbits (1) land is high, >260 metres so temperatures may be low and it would be hard to grow crops (1).
4