urban supplement report city of … s. corzine governor, state of new jersey kris kolluri, esq....
TRANSCRIPT

Jon S. CorzineGOVERNOR, STATE OF NEW JERSEY
Kris Kolluri, Esq.COMMISSIONER, NEW JERSEY DEPARTMENT OF TRANSPORTATION
URBAN SUPPLEMENT REPORT
City of Paterson
Prepared for
NEW JERSEY DEPARTMENT OF TRANSPORTATION andNJ TRANSIT
Prepared by
New Jersey’s Long-RangeTransportation Plan
For Public DiscussionSeptember 2008

New Jersey’s Long-Range Transportation Plan
The preparation of this report has been financed in part by the US Department of Transportation, Federal Highway Administration and Federal Transit Administration.This document is disseminated under the sponsorship of the US Department of Transportationin the interest of information exchange. The United States Government assumes no liability for its contents or use thereof.
New Jersey’s Long-Range Transportation Plan
TABLE OF CONTENTSINTRODUCTION ......................................................................................................................................... 1
I. TRANSPORTATION AND DEMOGRAPHIC CONDITIONS ............................................................................. 2 A. EXISTING TRANSPORTATION NETWORK ............................................................................................... 2
1. Roads ............................................................................................................................................... 2 2. Public Transit .................................................................................................................................... 4 3. Bicycle and Pedestrian Facilities ........................................................................................................ 7 4. Goods Movement............................................................................................................................. 7
B. SYSTEM PERFORMANCE ........................................................................................................................ 8 1. Congestion ....................................................................................................................................... 8 2. Pavement Condition ......................................................................................................................... 8 3. Bridge Conditions ........................................................................................................................... 10 4. Safety ............................................................................................................................................. 11
C. DEMOGRAPHIC PROFILE ..................................................................................................................... 11 1. Population and Households ............................................................................................................ 11 2. Age Distribution ............................................................................................................................. 12 3. Racial and Ethnic Composition ....................................................................................................... 12 4. Income & Poverty .......................................................................................................................... 13 5. Automobile Ownership ................................................................................................................... 14 6. Employed Residents ........................................................................................................................ 14 7. Unemployment .............................................................................................................................. 15 8. Employed Residents by Industry ..................................................................................................... 15 9. Employed Residents by Occupation ................................................................................................ 16 10. Journey to Work -- Resident Labor Force ......................................................................................... 16 11. Employment ................................................................................................................................... 17 12. Journey to Work - Employees in the City ......................................................................................... 18
D. FUTURE CONDITIONS ......................................................................................................................... 19 1. Population Projections .................................................................................................................... 19 2. Employment Projections ................................................................................................................. 19 3. Transportation Conditions .............................................................................................................. 24
E. CURRENT AND FUTURE DEVELOPMENT .............................................................................................. 28 1. Background .................................................................................................................................... 28 2. Paterson ......................................................................................................................................... 28 3. Passaic County and Surroundings ................................................................................................... 30
F. TRANSPORTATION SYSTEM ISSUES ...................................................................................................... 32 1. Roads ............................................................................................................................................. 32 2. Public Transit .................................................................................................................................. 33 3. Bicycle and Pedestrian .................................................................................................................... 35
G. ASSESSMENT OF PROGRESS ................................................................................................................ 35 1. Roads ............................................................................................................................................. 36 2. Bus Transit System .......................................................................................................................... 36
II. TRANSPORTATION PROJECTS .................................................................................................................... 37 A. PATERSON ........................................................................................................................................... 37
1. Roads ............................................................................................................................................. 37 2. Bus Transit ...................................................................................................................................... 37 3. Bicycle and Pedestrian .................................................................................................................... 38
B. PASSAIC COUNTY AND SURROUNDINGS ............................................................................................ 38 1. Roads ............................................................................................................................................. 38 2. Bus Service ..................................................................................................................................... 38 3. Paratransit Service .......................................................................................................................... 39 4. Rail Transit ...................................................................................................................................... 39 5. Bicycle and Pedestrian Routes ......................................................................................................... 40
III. RECOMMENDATIONS .............................................................................................................................. 41 A. ROADS ................................................................................................................................................ 41 B. PUBLIC TRANSIT .................................................................................................................................. 41
1. Commuter Rail ............................................................................................................................... 41 2. Bus and Paratransit ......................................................................................................................... 41
C. BICYCLE AND PEDESTRIAN .................................................................................................................. 42
REFERENCES ................................................................................................................................................... 43
New Jersey’s Long-Range Transportation Plan
1
INTRODUCTION
State law requires the New Jersey Department of Transportation (NJDOT), in conjunction with NJ TRANSIT, to prepare and submit to the legislature an Urban Transportation Supplement to the state’s Long-Range Transportation Plan. The state requires that the Urban Supplement identify and address the transportation needs of the state’s seven largest cities: Atlantic City, Camden, Elizabeth, Jersey City, Newark, Paterson, and Trenton. Because the State Development and Redevelopment Plan (State Plan) recognizes New Brunswick as an eighth urban center, an Urban Supplement has also been prepared for that city. The Urban Supplement must outline means of improving access to these major urban centers, emphasizing the transportation needs of city residents who are employed or seeking employment in suburban locations.
The State Plan recognizes the importance of cities to future development in the state, and it proposes to target infrastructure investments to urban areas to support urban development and redevelopment. In recent years, cities have begun to experience modest to substantial gains in new development, and projections and plans indicate that urban development is likely to continue.
The transportation needs of the major cities can be summarized follows:
Diverse populations, including low-income, minority, and elderly citizens, many of whom depend on public transportation.
A need to serve both increasing development and redevelopment.
An aging infrastructure that must be maintained and rehabilitated.
A mismatch between the locations of housing and jobs.
This Urban Supplement for the City of Paterson updates previous reports from 1993 and 2001. NJDOT intends for this document to be a user-friendly guide to inform its planning and capital programming processes, and those of the counties and municipalities involved, particularly to support local economic development and land use objectives.
This report provides background data on transportation and demographic conditions, and it assesses transportation system issues and needs, especially in terms of meeting existing demands and accommodating new development and redevelopment. The report also identifi es current and proposed transportation investments and their status, and it proposes means of advancing key projects.
The study process involved interviews with representatives of several agencies including NJDOT Local Aid, NJ TRANSIT, the North Jersey Transportation Planning Authority (NJTPA), Meadowlink TMA, the Passaic County Planning Board, and the City of Paterson Department of Community Development.
The process also involved reviewing reports, information, and data from several agencies, including the US Census, NJ Department of Labor, NJDOT, NJ TRANSIT, NJTPA, and the Port Authority of New York and New Jersey. Key local planning documents reviewed include the Passaic County Cross-acceptance Report, the NJTPA’s Access & Mobility 2030 report, the City of Paterson Master Plan and the Urban Enterprise Zone Five Year Strategic Plan.

2
New Jersey’s Long-Range Transportation Plan
Urban Supplement for the City of Paterson
I. TRANSPORTATION AND DEMOGRAPHIC CONDITIONS
A. EXISTING TRANSPORTATION NETWORK
1. Roads
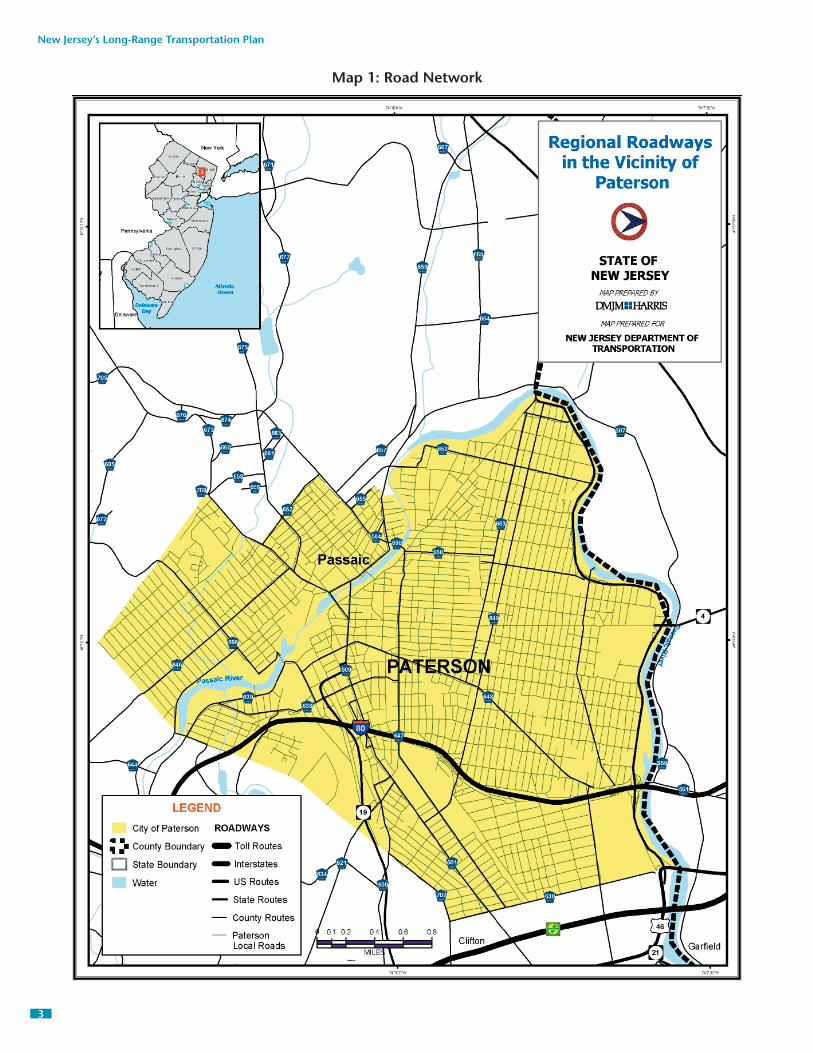
Regional/State RoadsThe major regional/state roads serving the Paterson area include Garden State Parkway (GSP), I-80, US 46, and State Routes 3, 4, 19, 20, 21, 23 and 208 (see Map 1).
Although the GSP traverses just south of the Paterson municipal boundary, it is signifi cant in terms of providing regional travel movements to and from the city.
US 46 and Route 21 are also located just outside the southeastern municipal boundary and play a key role in regional traffi c movements to and from the city.
Routes 3, 23, and 208 traverse the south, west and north sides of Paterson, respectively (outside the area displayed in Map 1).
Route 4 originates in Paterson and traverses east towards the George Washington Bridge, providing connection to New York City.
Route 19 originates in Paterson and traverses south.
I-80 and Route 20 run through Paterson; Route 20 runs along the eastern boundary of city of Paterson while I-80 cuts through Paterson in an east-west direction.
I-80 and Route 19 form a major interchange within Paterson.
County RoadsThe major county roads in Passaic County connecting Paterson to its environs include Route 507 (River Road), Route 509 (Marshal Street/Broad Street), Route 504 (Wagaraw Road), Union Boulevard, Riverview Drive, Black Oak Ridge Road, Terhune Drive, Paterson-Hamburg Turnpike, Ringwood Avenue, Greenwood Lake Turnpike and Sloatsburg Road. Other signifi cant county roads within Paterson include 18th Street, Broad Street, Broadway, Lafayette Street, Market Street, Main Avenue/Main Street, Madison Street, McClean Boulevard, River Street and Vreeland Avenue.
BridgesSeveral bridges cross the Passaic River connecting Paterson with surrounding townships. Some of the bridge crossings include I-80, Hillary Street, Broadway, Main Street, Lafayette Street, Lincoln Avenue, Maple Avenue, Fairlawn Avenue, Morlot Avenue and Market Street.
New Jersey’s Long-Range Transportation Plan
3
Map 1: Road Network
4
New Jersey’s Long-Range Transportation Plan
Urban Supplement for the City of Paterson
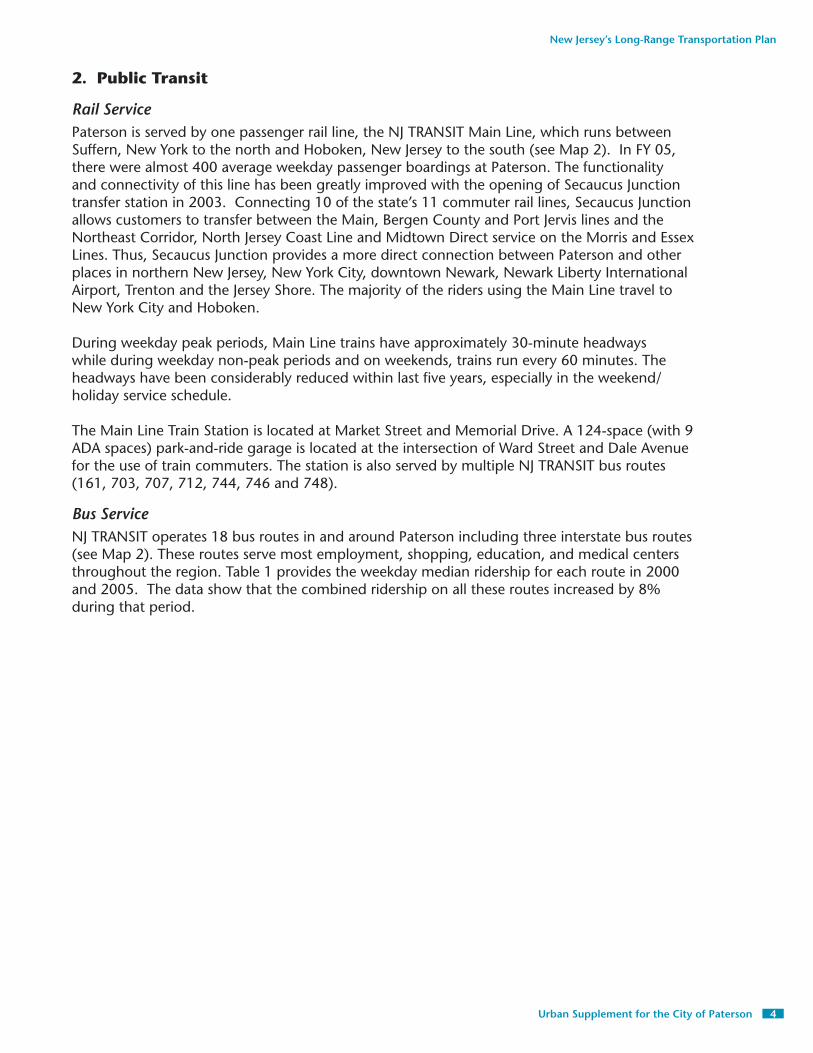
2. Public Transit
Rail ServicePaterson is served by one passenger rail line, the NJ TRANSIT Main Line, which runs between Suffern, New York to the north and Hoboken, New Jersey to the south (see Map 2). In FY 05, there were almost 400 average weekday passenger boardings at Paterson. The functionality and connectivity of this line has been greatly improved with the opening of Secaucus Junction transfer station in 2003. Connecting 10 of the state’s 11 commuter rail lines, Secaucus Junction allows customers to transfer between the Main, Bergen County and Port Jervis lines and the Northeast Corridor, North Jersey Coast Line and Midtown Direct service on the Morris and Essex Lines. Thus, Secaucus Junction provides a more direct connection between Paterson and other places in northern New Jersey, New York City, downtown Newark, Newark Liberty International Airport, Trenton and the Jersey Shore. The majority of the riders using the Main Line travel to New York City and Hoboken.
During weekday peak periods, Main Line trains have approximately 30-minute headways while during weekday non-peak periods and on weekends, trains run every 60 minutes. The headways have been considerably reduced within last fi ve years, especially in the weekend/holiday service schedule.
The Main Line Train Station is located at Market Street and Memorial Drive. A 124-space (with 9 ADA spaces) park-and-ride garage is located at the intersection of Ward Street and Dale Avenue for the use of train commuters. The station is also served by multiple NJ TRANSIT bus routes (161, 703, 707, 712, 744, 746 and 748).
Bus ServiceNJ TRANSIT operates 18 bus routes in and around Paterson including three interstate bus routes (see Map 2). These routes serve most employment, shopping, education, and medical centers throughout the region. Table 1 provides the weekday median ridership for each route in 2000 and 2005. The data show that the combined ridership on all these routes increased by 8% during that period.

New Jersey’s Long-Range Transportation Plan
5
Table 1: NJ TRANSIT Bus Routes and Median Weekday Ridership, 2000 and 2005
Bus Route # Route Details 2000 2005
72 Newark - Paterson 3,207 3,519
74 Newark - Paterson 5,734 5,454
161 Paterson - New York 5,758 6,722
171 Paterson - New York (George Washington Bridge) 2,803 1,670
190 Paterson - New York 8,377 9,588
702 Paterson - Elmwood Park 1,190 1,207
703 E. Rutherford - Haledon via Paterson 3,531 4,228
704 Paterson - Willowbrook Mall 2,456 2,930
707 Paterson - Saddle Brook 858 900
712 Hackensack - Willowbrook via Paterson 4,813 5,358
722 Paterson - Paramus Park 288 329
742 Paterson - Greystone Park 10 6
744 Passaic - Wayne via Paterson 2,244 2,750
746 Ringwood - Paterson 1,082 1,126
748 Paterson - Pompton Lakes 934 1,102
770 Hackensack - Paterson 2,278 2,196
970 Passaic - Paterson - Totowa 118 97
971 Passaic - Paterson - Totowa 142 129
Total: 45,823 49,311Source: NJ TRANSIT.
Other ServicesA number of other transportation services are provided within the City and between the City and surrounding areas. NJ TRANSIT’s Access Link program provides paratransit service to persons with disabilities for trips with an origin and destination within ¾ mile of a bus route, and the City provides paratransit service to elderly persons. The City also operates a free circulator trolley within the City limits. Private jitney services such as the one operated by Spanish Transportation provide service within the City and to destinations outside the City.
In 2002, Job Access and Reverse Commute (JARC) shuttle service was initiated by Meadowlink between Paterson and the two Preakness Healthcare Centers in Wayne near William Paterson University. Meadowlink is a public/private partnership created to improve access, reduce congestion and promote economic growth by working with businesses and government agencies to address employee commuting needs in northern New Jersey. Transportation programs and services are provided in partnership with Passaic County, the NJDOT and NJ TRANSIT. The Preakness Shuttle operates seven days a week. In 2005, Meadowlink reported that ridership on the Preakness Shuttle doubled since 2002.
In 2003, Meadowlink initiated the Haskell/Bloomingdale JARC Shuttle from Paterson to two healthcare centers (the Bloomingdale Healthcare Center and Wanaque Center for Nursing and Rehabilitation). This shuttle accommodates Work First New Jersey clients and operates seven days a week during all regular hospital shifts. The trip duration is one hour.
In 2005, Passaic County took over management and operation of the Preakness and Haskell/Bloomingdale JARC shuttle services.

6
New Jersey’s Long-Range Transportation Plan
Urban Supplement for the City of Paterson
Map 2: Transit Network

New Jersey’s Long-Range Transportation Plan
7
3. Bicycle and Pedestrian FacilitiesWithin the City limits, one signed bicycle route is provided on the west side of the Passaic River between Great Falls and Overlook Park. Constructed in the 1980’s, the existing path is slated to be refurbished using a $250,000 grant the City received and to construct an additional path on the east side of the river.
4. Goods MovementGoods movement is provided by freight rail and trucks. I-80 is part of the national large truck network. Norfolk Southern operates local and through freight service on the New York Susquehanna & Western Railroad corridor which passes through the City. In addition, Norfolk Southern operates daily, local freight service on NJ TRANSIT’s Main Line and Passaic Spur. Several freight rail service customers are located in the City of Paterson along the Main Line and Passaic Spur.
8
New Jersey’s Long-Range Transportation Plan
Urban Supplement for the City of Paterson
B. SYSTEM PERFORMANCEBased on the various management systems data maintained by NJDOT, this section provides information on transportation system performance.
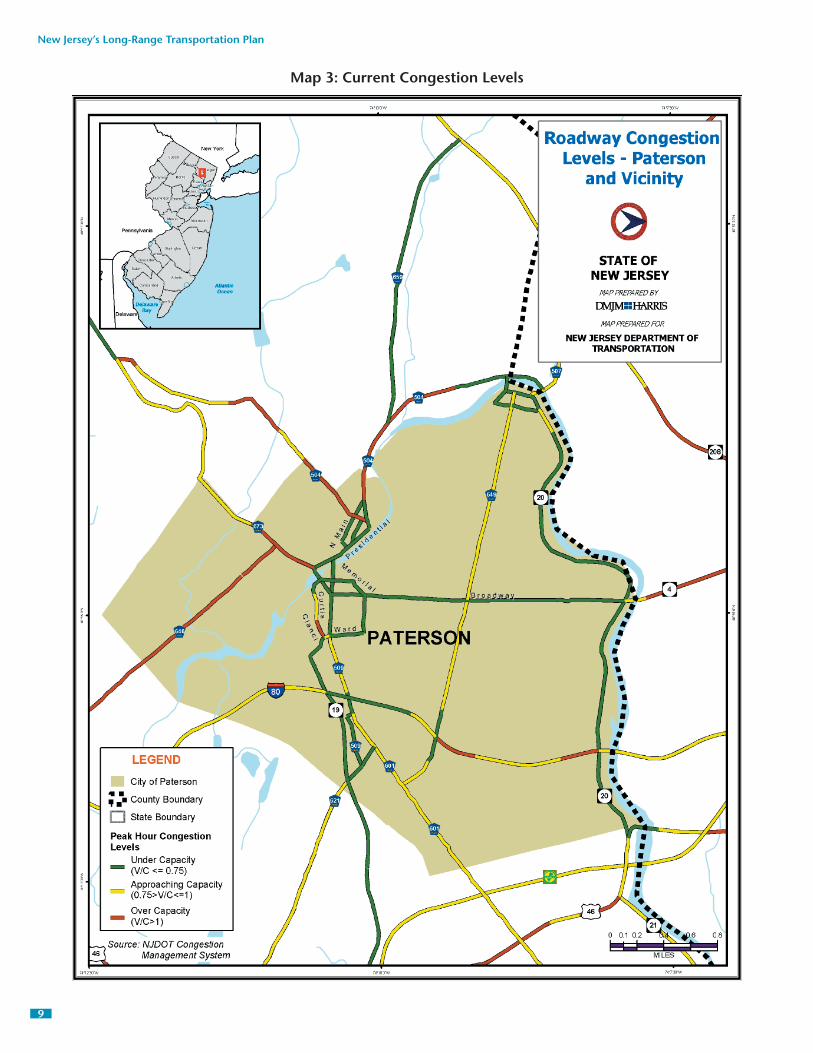
1. Congestion NJDOT’s Congestion Management System (CMS) is a primary source of information on roadway congestion. The CMS mainly focuses on interstate, toll, state and major county roadway facilities and measures congestion based upon a volume-to-capacity (v/c) ratio. A v/c ratio looks at the relationship between extent of traffi c volumes traveling along a roadway segment and design capacity of that segment to handle traffi c. Roadways operating below a 0.75 v/c ratio operate well and have suffi cient capacity to accommodate traffi c growth. On the other hand, roadways approaching a 1.0 v/c ratio have little ability to accept additional traffi c growth, and a v/c over 1.0 indicates that the roadway is operating at failing conditions and does not have the capacity for added traffi c.
Map 3 shows the 2005 v/c ratios for interstate, state and major county roadway segments in and around Paterson. The map shows that during existing peak hour conditions, except for Route 659 and Route 19, most of the roadway segments approaching Paterson are either nearing their capacity or already over their capacity. Within Paterson, Route 4 (east-west corridor) and Route 19 and Route 20 (north-south corridors) operate well during peak hours with suffi cient roadway capacity available for traffi c fl ows. Most of the remaining roadways either operate near or over capacity.
2. Pavement ConditionNJDOT maintains a Pavement Management System (PMS) database with information on the current condition of pavement throughout the state. The 2004 PMS database was used for this report. The PMS database includes all interstate, state and U.S. highways in New Jersey but does not include toll roads such as the NJ Turnpike and Garden State Parkway.
The rating system for the roadways is based the Surface Distress Index (SDI). SDI compiles and measures the severity of surface distresses such as cracking, patching, shoulder condition, shoulder drop, faulting, and joints. Table 2 shows the pavement condition of roads in Paterson by SDI, rating for 2004. The data show that more than 60% of the road segments have very good or good pavement conditions while over 35% percent are in fair condition. A minimal length of pavement (0.4 miles, 2.4%) is in poor condition, while no pavement is in very poor condition.
In terms of roughness or ride quality, the International Roughness Index (IRI) refl ects the amount of existing surface irregularities that cause a vehicle to loose contact with the surface (measured as the amount of suspension over distance). As a more focused measure, IRI defi ciencies are striking, but treatment may be less costly in terms of overlays than rehabilitation or reconstruction which may be the treatment for SDI defi ciencies. Table 3 shows the pavement condition of roads in Paterson, rated by the IRI, also for 2004. The data show that most roads have good to fair pavement conditions, but about one-third of roads have defi cient pavement.
New Jersey’s Long-Range Transportation Plan
9
Map 3: Current Congestion Levels

10
New Jersey’s Long-Range Transportation Plan
Urban Supplement for the City of Paterson
Table 2: Paterson Pavement Condition Summary by SDI
FacilityTotal Pavement Miles
(Both Directions)Very Good
SDI > 4Good
4 > SDI >3Fair
3 > SDI >2Poor
2 > SDI >1Very Poor
SDI <1
4 0.4 0.2 0.1 0.1 0.0 0.0
19 2.4 1.4 1.0 0.0 0.0 0.0
20 7.8 1.9 1.2 4.3 0.4 0.0
80 6.4 4.2 0.5 1.7 0.0 0.0
Total 17.0 7.7 2.8 6.1 0.4 0.0
% 100% 45% 17% 36% 2% 0.0%Source: NJDOT, Pavement Management System
Table 3: Paterson Pavement Condition Summary by IRI
FacilityTotal Pavement Miles
(Both Directions)Good Fair Defi cient
4 0.4 0.1 0.2 0.1
19 2.4 0.9 0.8 0.7
20 7.8 0.9 5.2 1.7
80 6.4 1.2 2 3.2
Total 17.0 3.1 8.2 5.7
% 100% 18% 48% 34%Source: NJDOT, Pavement Management System
3. Bridge ConditionsNJDOT employs a Bridge Management System (BMS) to maintain an inventory of all highway carrying bridges with a span over 20 feet; the BMS lists the physical characteristics, condition and ownership of each bridge. The bridges are rated for their structural condition as well as functional characteristics. Information on structural condition is also combined with bridge size and roadway type to help determine priorities for bridge improvement projects. Of the 53 bridges in Paterson, one-third of bridges are either structurally defi cient or functionally obsolete in 2005 (see Table 4). This fi gure is comparable to a statewide share of 35% defi cient bridges. The percentage of bridges in structurally defi cient condition in the city is lower compared to that of in the county and state. On the other hand, the percentage of functionally obsolete bridges in the city is higher in comparison with the county and state percentages.
Table 4: Bridge Conditions
Structurally Defi cient Functionally Obsolete Not Defi cient Totals Number % Number % Number %
Paterson 3 5.7% 15 28.3% 35 66.0% 53
Passaic County
43 13.8% 78 25.1% 190 61.1% 311
State 779 12.1% 1,459 22.7% 4,177 65.1% 6,415Source: NJDOT, Bridge Management System
New Jersey’s Long-Range Transportation Plan
11
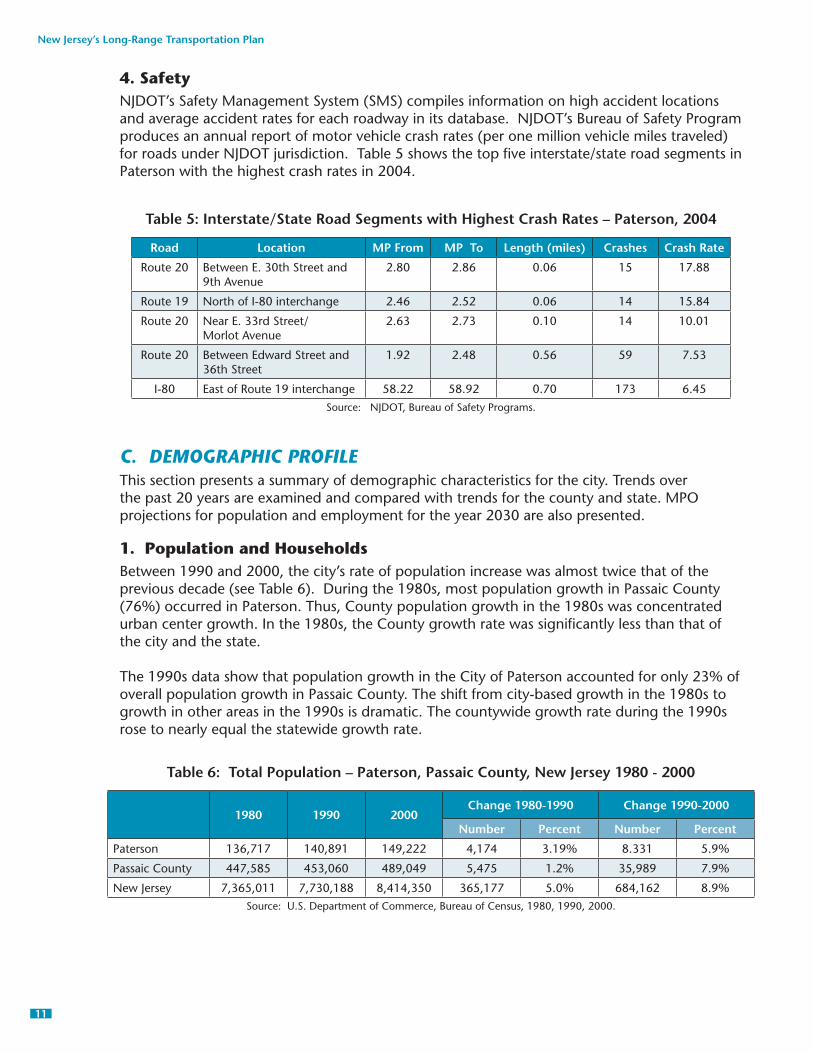
4. Safety NJDOT’s Safety Management System (SMS) compiles information on high accident locations and average accident rates for each roadway in its database. NJDOT’s Bureau of Safety Program produces an annual report of motor vehicle crash rates (per one million vehicle miles traveled) for roads under NJDOT jurisdiction. Table 5 shows the top fi ve interstate/state road segments in Paterson with the highest crash rates in 2004.
Table 5: Interstate/State Road Segments with Highest Crash Rates – Paterson, 2004
Road Location MP From MP To Length (miles) Crashes Crash Rate
Route 20 Between E. 30th Street and 9th Avenue
2.80 2.86 0.06 15 17.88
Route 19 North of I-80 interchange 2.46 2.52 0.06 14 15.84
Route 20 Near E. 33rd Street/Morlot Avenue
2.63 2.73 0.10 14 10.01
Route 20 Between Edward Street and 36th Street
1.92 2.48 0.56 59 7.53
I-80 East of Route 19 interchange 58.22 58.92 0.70 173 6.45
Source: NJDOT, Bureau of Safety Programs.
C. DEMOGRAPHIC PROFILE This section presents a summary of demographic characteristics for the city. Trends over the past 20 years are examined and compared with trends for the county and state. MPO projections for population and employment for the year 2030 are also presented.
1. Population and HouseholdsBetween 1990 and 2000, the city’s rate of population increase was almost twice that of the previous decade (see Table 6). During the 1980s, most population growth in Passaic County (76%) occurred in Paterson. Thus, County population growth in the 1980s was concentrated urban center growth. In the 1980s, the County growth rate was signifi cantly less than that of the city and the state.
The 1990s data show that population growth in the City of Paterson accounted for only 23% of overall population growth in Passaic County. The shift from city-based growth in the 1980s to growth in other areas in the 1990s is dramatic. The countywide growth rate during the 1990s rose to nearly equal the statewide growth rate.
Table 6: Total Population – Paterson, Passaic County, New Jersey 1980 - 2000
1980 1990 2000Change 1980-1990 Change 1990-2000
Number Percent Number Percent
Paterson 136,717 140,891 149,222 4,174 3.19% 8.331 5.9%
Passaic County 447,585 453,060 489,049 5,475 1.2% 35,989 7.9%
New Jersey 7,365,011 7,730,188 8,414,350 365,177 5.0% 684,162 8.9%Source: U.S. Department of Commerce, Bureau of Census, 1980, 1990, 2000.

12
New Jersey’s Long-Range Transportation Plan
Urban Supplement for the City of Paterson
2. Age DistributionAge profi le data shows a gradual increase in the median age of the city population in the past two decades (see Table 7). This incremental change is consistent with the trends for the county and state. The median age in the city in 2000 (32 years) was slightly lower than that of the county (35 years) and the state (37 years). The city has a slightly larger percentage of children under 5 years and a slightly lower share of people over 65 years, compared to the county and state, which helps to account for the difference in median ages.
Table 7: Age Profi le of the Population – Paterson, Passaic County, New Jersey, 1980-2000
1980 1990 2000
<5 Years
Paterson 8.7% 8.8% 8.4%
Passaic County 6.7% 7.6% 7.4%
New Jersey 6.3% 6.9% 6.7%
5-19 Years
Paterson 27.7% 23.6% 24.5%
Passaic County 24.2% 20.1% 21.3%
New Jersey 24.2% 19.1% 20.4%
20-64 Years
Paterson 53.2% 58.2% 58.7%
Passaic County 57.2% 59.8% 59.2%
New Jersey 57.8% 60.6% 59.7%
65+ Years
Paterson 10.4% 9.4% 8.4%
Passaic County 11.9% 12.4% 12.1%
New Jersey 11.7% 13.4% 13.2%
Median Age
Paterson 27.5 29.8 32.2
Passaic County 32.0 33.7 34.8
New Jersey 32.0 34.4 36.7
Source: U.S.Department of Commerce, Bureau of the Census, 1980, 1990, 2000.
3. Racial and Ethnic CompositionTable 8 indicates that Paterson experienced a shift in racial composition between 1990 and 2000, as the share of non-white population increased from 59% to 69%. A portion of this change may be attributed to a modifi ed census survey tabulation method in the 2000 Census. For the fi rst time in Census 2000, individuals could identify themselves as being of more than one race. Thus, this new category of ‘two or more races’ resulted in adjusted percentages of individual race categories from the 1990 Census.

New Jersey’s Long-Range Transportation Plan
13
Table 8: Racial Composition 1990-2000
1990 2000
White
Paterson 41.2% 30.8%
Passaic County 71.9% 62.3%
New Jersey 79.3% 72.6%
Black
Paterson 36.0% 32.9%
Passaic County 14.6% 13.2%
New Jersey 13.4% 13.6%
Other
Paterson 22.8% 36.3%
Passaic County 13.5% 24.5%
New Jersey 7.3% 13.8%Source: U.S.Department of Commerce, Bureau of the Census, 1990, 2000.
“Other Races” include Asian, Pacifi c Islander, American Indian and Alaska Natives. Hispanic origin is not a race and therefore, persons of Hispanic origin may be included in any of the race categories.
During the last decade, the statewide growth in Hispanic population accounted for more than half of state’s overall population growth, and Paterson showed a large increase in Hispanic population (30%). By 2000, one-half of the city’s population was Hispanic (see Table 9). The City’s Hispanic population percentage is almost four times the statewide Hispanic population percentage.
Passaic County (with a Hispanic population growth of 48,400 persons between 1990 and 2000) was the second highest county (36%) in the state in terms of Hispanic population growth after Hudson County. The city’s Hispanic population growth alone (17,063 persons) accounted for more than one-third of Passaic County’s overall Hispanic population growth during this time period.
Table 9: Percentage of Hispanic Population, 1990–2000
1990 2000 % Change
Paterson 41% 50% 22%
Passaic County 22% 30% 36%
New Jersey 10% 13% 30%
Source: U.S.Department of Commerce, Bureau of the Census, 1990, 2000.
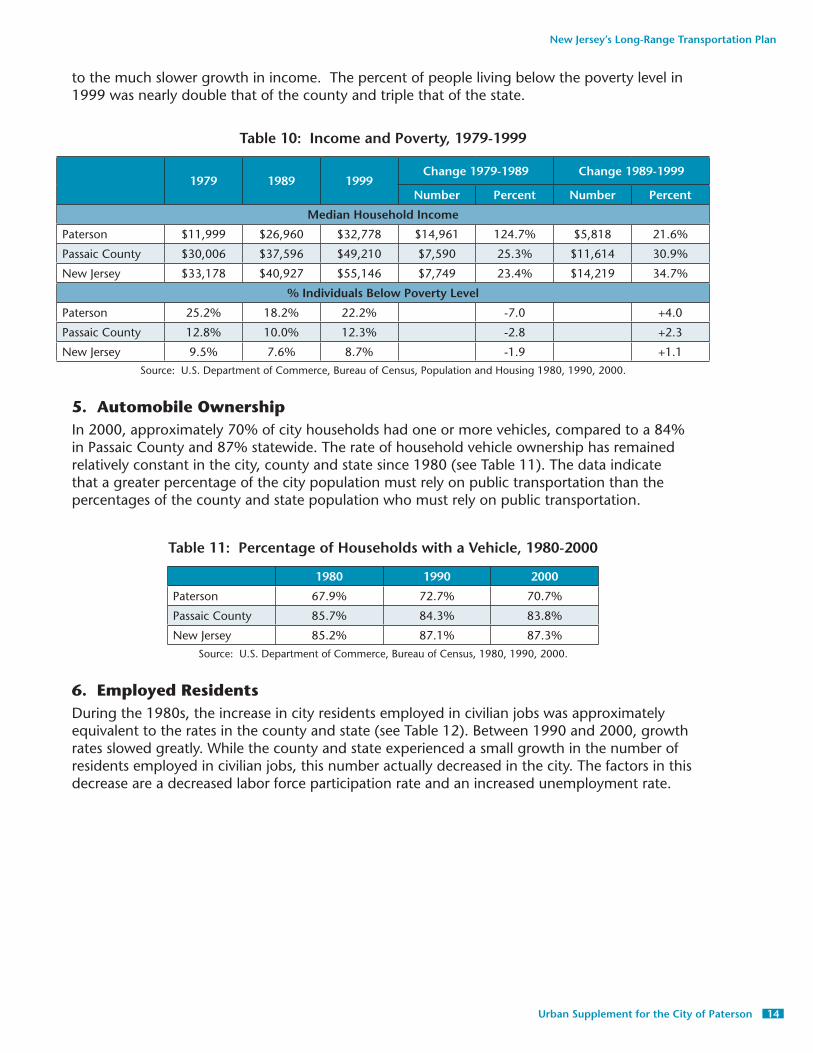
4. Income & PovertyMedian household income in the City of Paterson has lagged behind that of Passaic County and the state since 1979 (see Table 10). The city experienced economic stimulus during the decade of 1979 to 1989, and the increase in city median household income during this decade was twice that of the Passaic County and New Jersey. In the next decade (1989-1999), Paterson’s median household income growth slowed; Paterson’s median household income growth was almost half that of the county and almost one-third that of the state.
The percent of people living below the poverty level in the City of Paterson has been greater than that of Passaic County and the state since 1979. The decrease in percent of people living below the poverty level between 1979 and 1989 is related to the rapid rise in median household income, while the increase in the poverty rate between 1989 and 1999 correlates
14
New Jersey’s Long-Range Transportation Plan
Urban Supplement for the City of Paterson
to the much slower growth in income. The percent of people living below the poverty level in 1999 was nearly double that of the county and triple that of the state.
Table 10: Income and Poverty, 1979-1999
1979 1989 1999Change 1979-1989 Change 1989-1999
Number Percent Number Percent
Median Household Income
Paterson $11,999 $26,960 $32,778 $14,961 124.7% $5,818 21.6%
Passaic County $30,006 $37,596 $49,210 $7,590 25.3% $11,614 30.9%
New Jersey $33,178 $40,927 $55,146 $7,749 23.4% $14,219 34.7%
% Individuals Below Poverty Level
Paterson 25.2% 18.2% 22.2% -7.0 +4.0
Passaic County 12.8% 10.0% 12.3% -2.8 +2.3
New Jersey 9.5% 7.6% 8.7% -1.9 +1.1
Source: U.S. Department of Commerce, Bureau of Census, Population and Housing 1980, 1990, 2000.
5. Automobile OwnershipIn 2000, approximately 70% of city households had one or more vehicles, compared to a 84% in Passaic County and 87% statewide. The rate of household vehicle ownership has remained relatively constant in the city, county and state since 1980 (see Table 11). The data indicate that a greater percentage of the city population must rely on public transportation than the percentages of the county and state population who must rely on public transportation.
Table 11: Percentage of Households with a Vehicle, 1980-2000
1980 1990 2000
Paterson 67.9% 72.7% 70.7%
Passaic County 85.7% 84.3% 83.8%
New Jersey 85.2% 87.1% 87.3%
Source: U.S. Department of Commerce, Bureau of Census, 1980, 1990, 2000.
6. Employed ResidentsDuring the 1980s, the increase in city residents employed in civilian jobs was approximately equivalent to the rates in the county and state (see Table 12). Between 1990 and 2000, growth rates slowed greatly. While the county and state experienced a small growth in the number of residents employed in civilian jobs, this number actually decreased in the city. The factors in this decrease are a decreased labor force participation rate and an increased unemployment rate.
New Jersey’s Long-Range Transportation Plan
15
Table 12: Employed Residents, 1980 – 2000
1980 1990 2000Change 1980-1990 Change 1990-2000
Number Percent Number Percent
Paterson 52,753 62,543 52,545 9,790 18.6% -6,998 -11.2%
Passaic County 199,564 225,555 232,408 25,991 13.0% 6,6853 3.0%
New Jersey 3,288,302 3,868,698 3,950,029 580,396 17.7% 81,331 2.1%
Source: U.S. Department of Commerce, Bureau of Census, 1980, 1990; 2000.
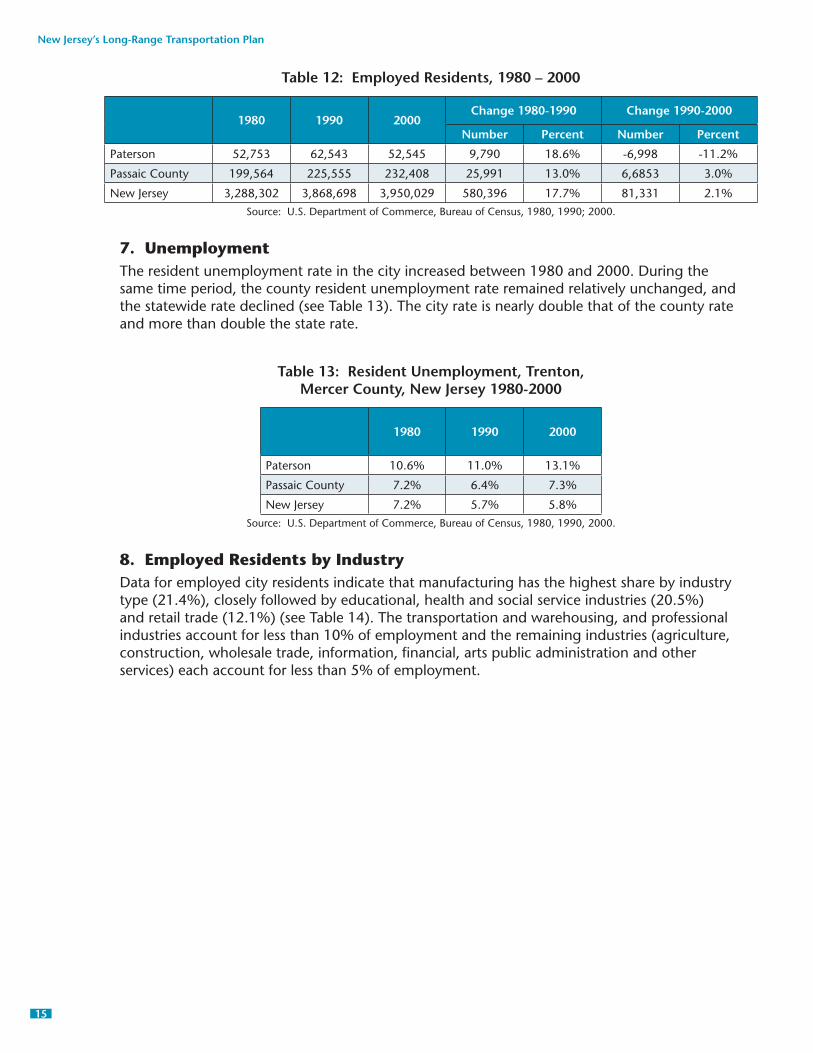
7. UnemploymentThe resident unemployment rate in the city increased between 1980 and 2000. During the same time period, the county resident unemployment rate remained relatively unchanged, and the statewide rate declined (see Table 13). The city rate is nearly double that of the county rate and more than double the state rate.
Table 13: Resident Unemployment, Trenton, Mercer County, New Jersey 1980-2000
1980 1990 2000
Paterson 10.6% 11.0% 13.1%
Passaic County 7.2% 6.4% 7.3%
New Jersey 7.2% 5.7% 5.8%
Source: U.S. Department of Commerce, Bureau of Census, 1980, 1990, 2000.
8. Employed Residents by IndustryData for employed city residents indicate that manufacturing has the highest share by industry type (21.4%), closely followed by educational, health and social service industries (20.5%) and retail trade (12.1%) (see Table 14). The transportation and warehousing, and professional industries account for less than 10% of employment and the remaining industries (agriculture, construction, wholesale trade, information, fi nancial, arts public administration and other services) each account for less than 5% of employment.

16
New Jersey’s Long-Range Transportation Plan
Urban Supplement for the City of Paterson
Table 14: Resident Employment by Industrial Sector, Paterson, 2000
Industry Employed Residents Percentage
Agriculture, forestry, fi shing and hunting, and mining
47 0.1%
Construction 2,092 4.0%
Manufacturing 11,235 21.4%
Wholesale trade 2,935 5.6%
Retail trade 6,339 12.1%
Transportation and warehousing, and utilities 3,402 6.5%
Information 1,273 2.4%
Finance, insurance, real estate, and rental and leasing
2,238 4.3%
Professional, scientifi c, management, administrative, waste management services
4,498 8.6%
Educational, health, and social services 10,766 20.5%
Arts, entertainment, recreation, accommodation, food services
3,046 5.8%
Other services (except public administration) 2,851 5.4%
Public administration 1,823 3.5%
Source: U.S. Department of Commerce, Bureau of Census, 2000.
9. Employed Residents by OccupationTable 15 shows the number and percentages of employed city residents by different occupation. Occupation with the largest city resident employment percentages are production and transportation (27%), sales and offi ce occupations (28%), service occupations (20%) and professional (17%). Occupations that employ minor numbers of city residents include construction and extraction (8%) and farming (0.2%).
Table 15: Resident Employment by Occupation, Paterson, 2000
Occupation Employed Residents Percentage
Management, professional, and related occupations 8,774 16.7%
Service occupations 10,640 20.2%
Sales and offi ce occupations 14,529 27.7%
Farming, fi shing, and forestry occupations 84 0.2%
Construction, extraction, and maintenance occupations 4,114 7.8%
Production, transportation, and material moving occupations 14,404 27.4%
Source: U.S. Department of Commerce, Bureau of Census, 2000.
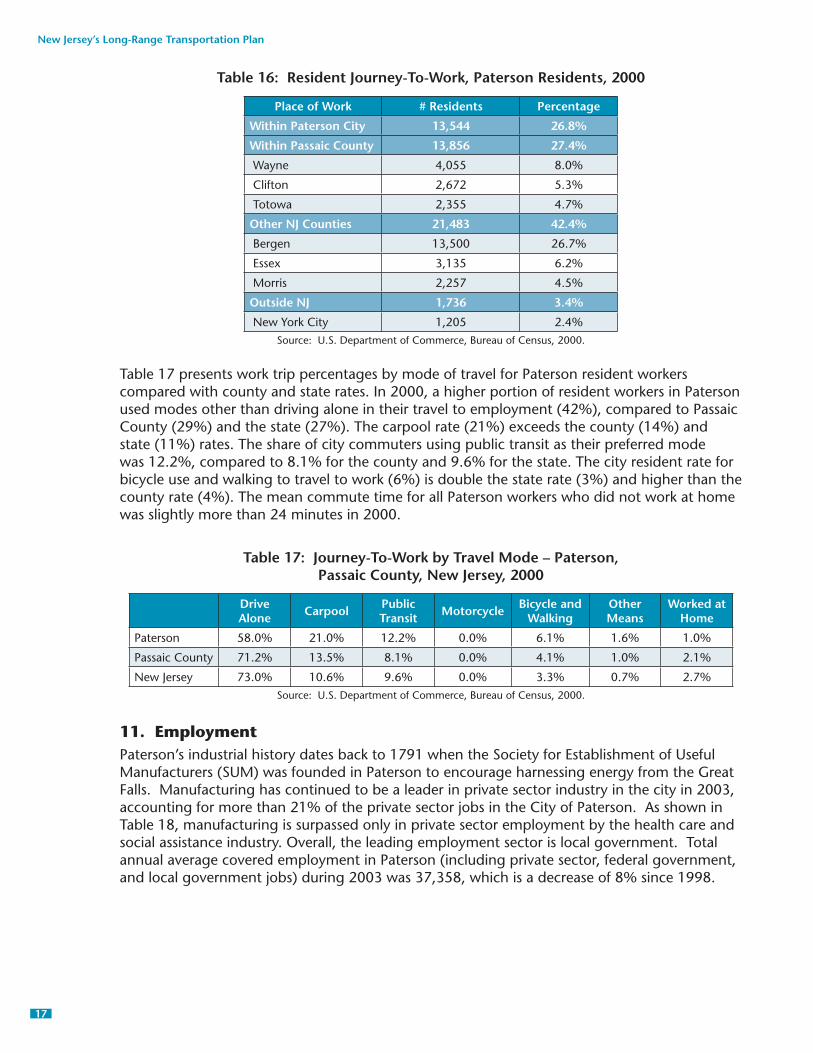
10. Journey to Work -- Resident Labor ForceTable 16 presents the number and percentage of city residents by their places of work. Approximately 27% of city residents work in the city, which is a decrease from 36% in 1990. Another 27% of residents work outside the city within Passaic County. About 42 percent of city residents work in other New Jersey counties, and 3% of city residents work outside New Jersey. Of those who work in other New Jersey counties, the highest percentage (27%) work in Bergen County.
New Jersey’s Long-Range Transportation Plan
17
Table 16: Resident Journey-To-Work, Paterson Residents, 2000
Place of Work # Residents Percentage
Within Paterson City 13,544 26.8%
Within Passaic County 13,856 27.4%
Wayne 4,055 8.0%
Clifton 2,672 5.3%
Totowa 2,355 4.7%
Other NJ Counties 21,483 42.4%
Bergen 13,500 26.7%
Essex 3,135 6.2%
Morris 2,257 4.5%
Outside NJ 1,736 3.4%
New York City 1,205 2.4%Source: U.S. Department of Commerce, Bureau of Census, 2000.
Table 17 presents work trip percentages by mode of travel for Paterson resident workers compared with county and state rates. In 2000, a higher portion of resident workers in Paterson used modes other than driving alone in their travel to employment (42%), compared to Passaic County (29%) and the state (27%). The carpool rate (21%) exceeds the county (14%) and state (11%) rates. The share of city commuters using public transit as their preferred mode was 12.2%, compared to 8.1% for the county and 9.6% for the state. The city resident rate for bicycle use and walking to travel to work (6%) is double the state rate (3%) and higher than the county rate (4%). The mean commute time for all Paterson workers who did not work at home was slightly more than 24 minutes in 2000.
Table 17: Journey-To-Work by Travel Mode – Paterson,Passaic County, New Jersey, 2000
Drive Alone Carpool Public
Transit Motorcycle Bicycle and Walking
Other Means
Worked at Home
Paterson 58.0% 21.0% 12.2% 0.0% 6.1% 1.6% 1.0%
Passaic County 71.2% 13.5% 8.1% 0.0% 4.1% 1.0% 2.1%
New Jersey 73.0% 10.6% 9.6% 0.0% 3.3% 0.7% 2.7%Source: U.S. Department of Commerce, Bureau of Census, 2000.
11. EmploymentPaterson’s industrial history dates back to 1791 when the Society for Establishment of Useful Manufacturers (SUM) was founded in Paterson to encourage harnessing energy from the Great Falls. Manufacturing has continued to be a leader in private sector industry in the city in 2003, accounting for more than 21% of the private sector jobs in the City of Paterson. As shown in Table 18, manufacturing is surpassed only in private sector employment by the health care and social assistance industry. Overall, the leading employment sector is local government. Total annual average covered employment in Paterson (including private sector, federal government, and local government jobs) during 2003 was 37,358, which is a decrease of 8% since 1998.

18
New Jersey’s Long-Range Transportation Plan
Urban Supplement for the City of Paterson
Table 18: Covered Employment by Sector – Paterson, 2003
Industry Annual Average
Construction 1,671
Manufacturing 5,996
Wholesale trade 2,183
Retail trade 2,761
Transportation and warehousing 867
Information 306
Finance and insurance 274
Real estate and rental and leasing 336
Professional and technical services 733
Administrative and waste services 1,681
Educational services 147
Health care and social assistance 7,498
Arts, entertainment, and recreation 49
Accommodation and food services 1,326
Other services, except public administration 1,628
Unclassifi ed entities 139
Private Sector Total 27,602
Federal Govt Total 789
Local Govt Total 8,967
Total Employment 37,358Source: NJ Department of Labor, NJ Employment & Wages: 2003 Annual Report. Covered employment refers to jobs covered by unemployment insurance. Private sector total does not match the sum of individual industries because NJDOL suppresses data for industries with few units (businesses) or where one employer is a signifi cant percentage of employment or wages of the industry.
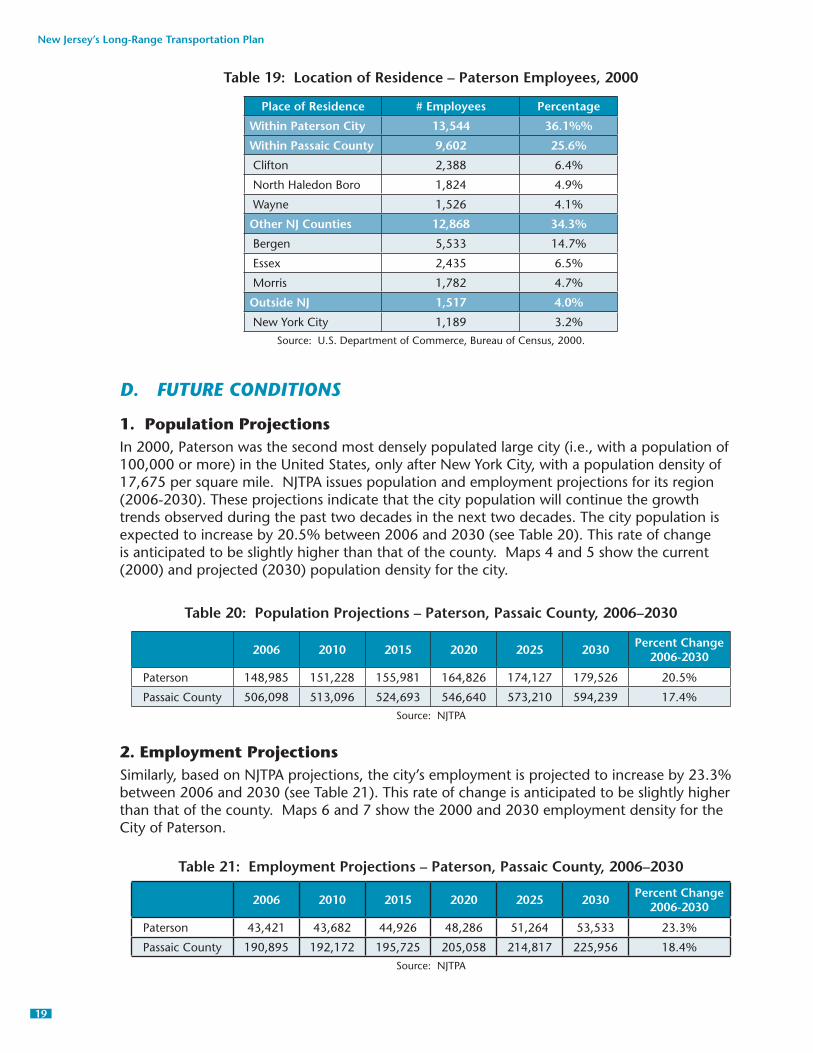
12. Journey to Work - Employees in the CityTable 19 presents the number and percentage of employees in the city by their places of residence. Approximately 36% of employees reside in the city which is equivalent to more than one out of every three employees. Another 26% of employees reside outside the city within Passaic County. Approximately 34% of employees in the city reside in other New Jersey counties, and 4% of employees reside outside New Jersey. Of those who reside in other New Jersey Counties, the highest percentage (15%) resides in Bergen County.
New Jersey’s Long-Range Transportation Plan
19
Table 19: Location of Residence – Paterson Employees, 2000
Place of Residence # Employees Percentage
Within Paterson City 13,544 36.1%%
Within Passaic County 9,602 25.6%
Clifton 2,388 6.4%
North Haledon Boro 1,824 4.9%
Wayne 1,526 4.1%
Other NJ Counties 12,868 34.3%
Bergen 5,533 14.7%
Essex 2,435 6.5%
Morris 1,782 4.7%
Outside NJ 1,517 4.0%
New York City 1,189 3.2%
Source: U.S. Department of Commerce, Bureau of Census, 2000.
D. FUTURE CONDITIONS
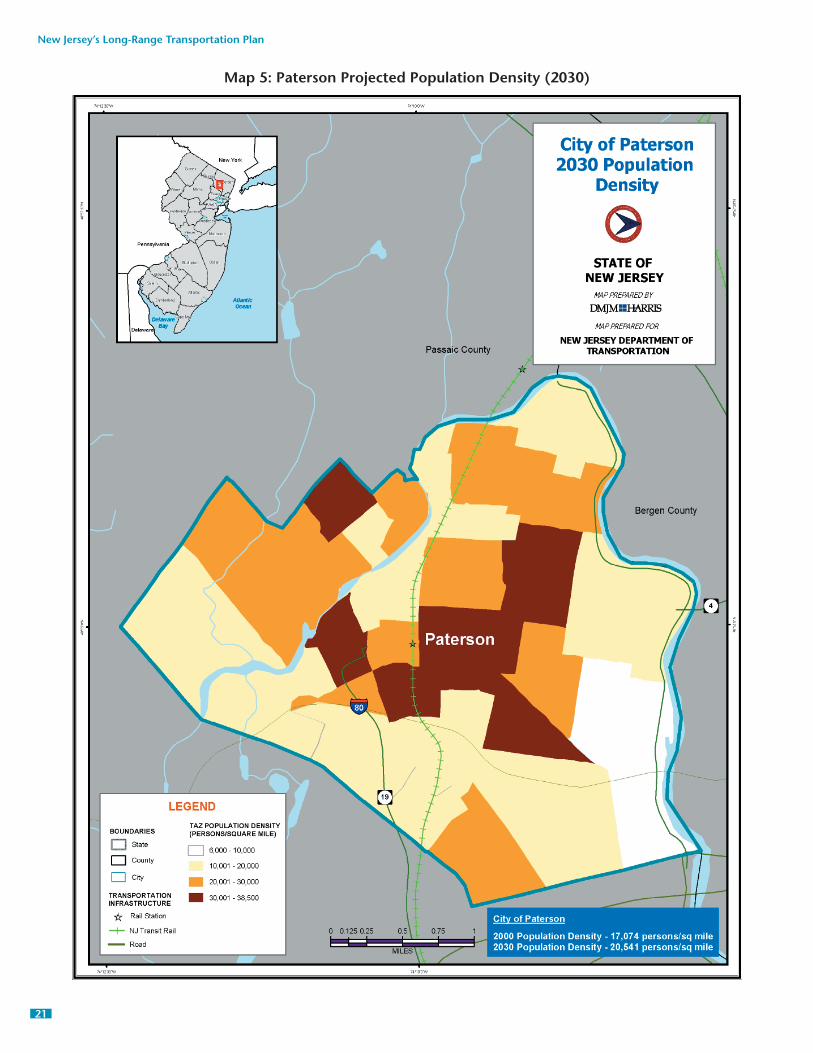
1. Population ProjectionsIn 2000, Paterson was the second most densely populated large city (i.e., with a population of 100,000 or more) in the United States, only after New York City, with a population density of 17,675 per square mile. NJTPA issues population and employment projections for its region (2006-2030). These projections indicate that the city population will continue the growth trends observed during the past two decades in the next two decades. The city population is expected to increase by 20.5% between 2006 and 2030 (see Table 20). This rate of change is anticipated to be slightly higher than that of the county. Maps 4 and 5 show the current (2000) and projected (2030) population density for the city.
Table 20: Population Projections – Paterson, Passaic County, 2006–2030
2006 2010 2015 2020 2025 2030 Percent Change 2006-2030
Paterson 148,985 151,228 155,981 164,826 174,127 179,526 20.5%
Passaic County 506,098 513,096 524,693 546,640 573,210 594,239 17.4%
Source: NJTPA
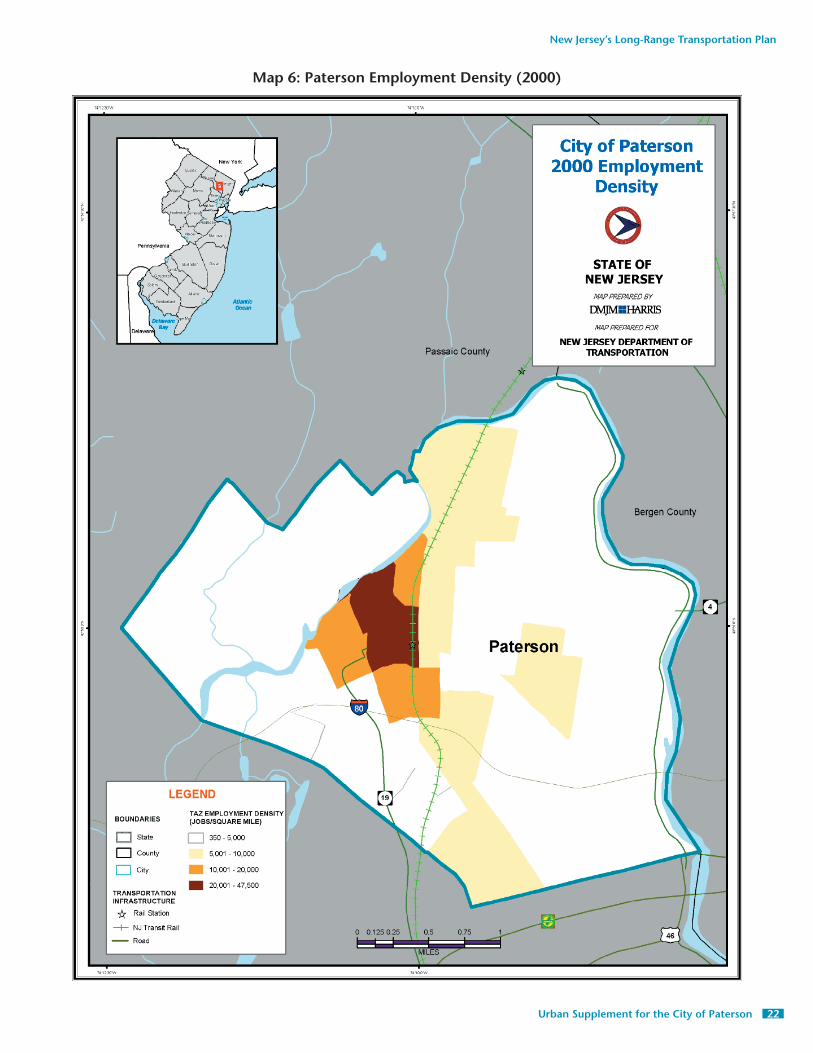
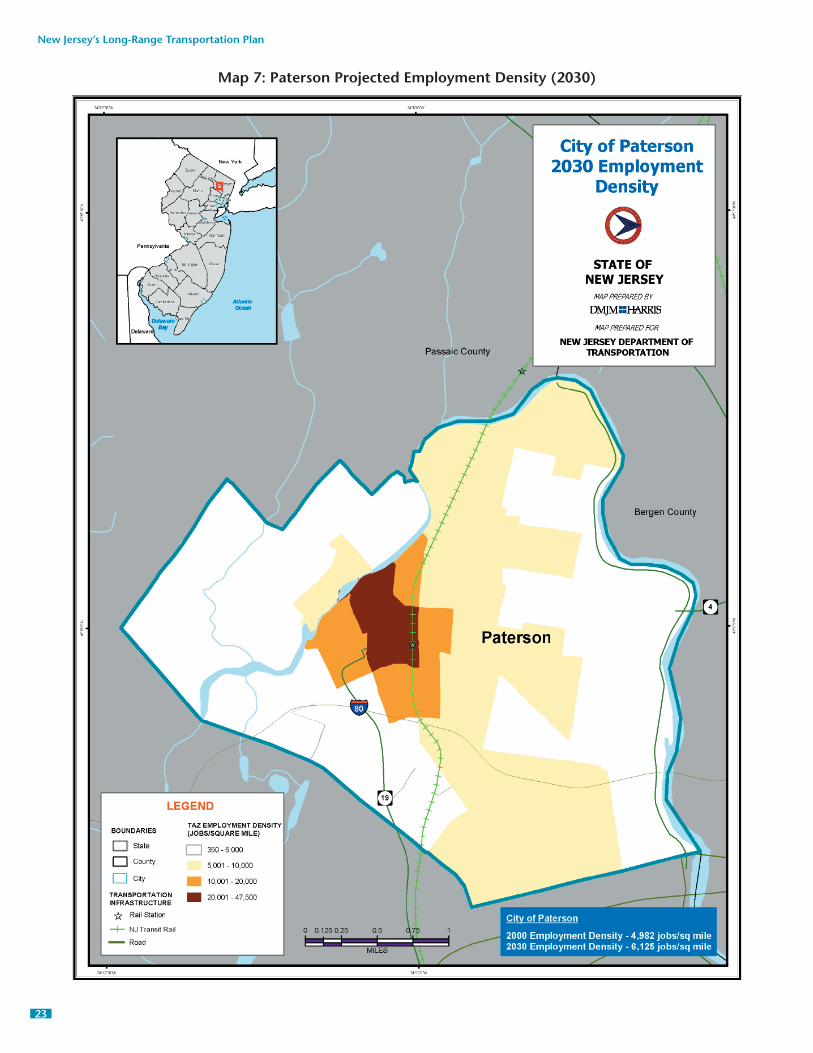
2. Employment ProjectionsSimilarly, based on NJTPA projections, the city’s employment is projected to increase by 23.3% between 2006 and 2030 (see Table 21). This rate of change is anticipated to be slightly higher than that of the county. Maps 6 and 7 show the 2000 and 2030 employment density for the City of Paterson.
Table 21: Employment Projections – Paterson, Passaic County, 2006–2030
2006 2010 2015 2020 2025 2030 Percent Change 2006-2030
Paterson 43,421 43,682 44,926 48,286 51,264 53,533 23.3%
Passaic County 190,895 192,172 195,725 205,058 214,817 225,956 18.4%
Source: NJTPA

20
New Jersey’s Long-Range Transportation Plan
Urban Supplement for the City of Paterson
Map 4: Paterson Population Density (2000)
New Jersey’s Long-Range Transportation Plan
21
Map 5: Paterson Projected Population Density (2030)
22
New Jersey’s Long-Range Transportation Plan
Urban Supplement for the City of Paterson
Map 6: Paterson Employment Density (2000)
New Jersey’s Long-Range Transportation Plan
23
Map 7: Paterson Projected Employment Density (2030)

24
New Jersey’s Long-Range Transportation Plan
Urban Supplement for the City of Paterson
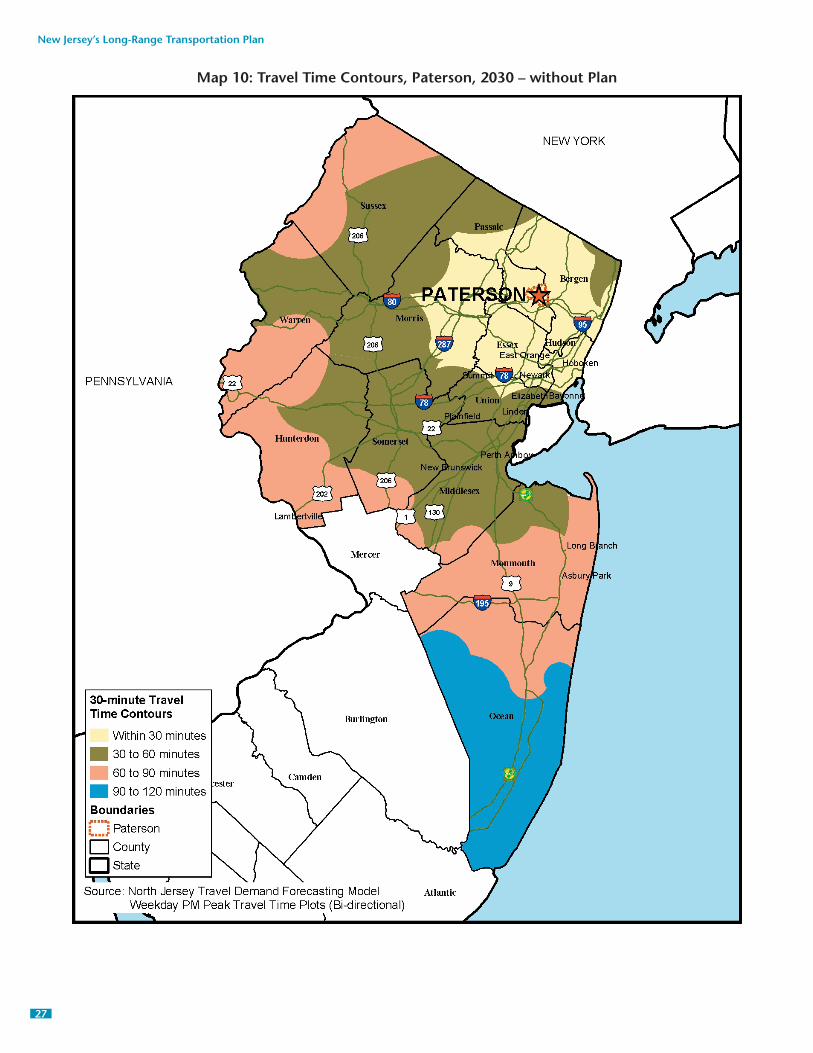
3. Transportation ConditionsRegional transportation models enable analysis of current and future travel conditions based upon various assumptions about land use and transportation system capacity. The model output can be used to prepare “travel time contour” maps, which show how far a motorist could travel between a specifi c point (e.g., the center of a city) and other points on the surrounding roadway system within given time frames. These maps refl ect the impact of roadway congestion upon travel time.
The work on the New Jersey Long-Range Transportation Plan included analyzing and preparing travel time contour maps under existing conditions (2005) and the 2030 Plan. These maps cover the surrounding roadway network that lies within the NJTPA region. The calculations are based upon evening peak hour traffi c volumes, and they are based upon traffi c heading both to and from the central point.
The 2005 existing condition map shows the current travel time limits (see Map 8).
The 2030 Plan map illustrates travel time with the package of transportation system investments contained in the 2030 Plan (see Map 9). The statewide long-range transportation plan, Transportation Choices 2030, contains specifi c information on these investments, and the plan is available on the internet at www.njchoices.com, the website for the statewide long-range transportation plan. The 2030 Plan recognizes the importance of completing key transit projects, and it envisions a signifi cant infusion of additional funds for transit-related projects and bringing transportation infrastructure to a state of good repair. The 2030 Plan also assumes reducing some auto trips by more aggressive travel demand management measures and adopting smart growth measures for new development and redevelopment.
As a contrast, Map 10 shows anticipated travel time limits in 2030 without the level of investments that are contained in the 2030 Plan. It is important to understand that these maps do not refl ect public transit travel times. Public transit provides signifi cant levels of access and mobility for the state’s largest cities, and increases in transit service would be expected to increase these levels of access and mobility.

New Jersey’s Long-Range Transportation Plan
25
Map 8: Travel Time Contours, Paterson, 2005

26
New Jersey’s Long-Range Transportation Plan
Urban Supplement for the City of Paterson
Map 9: Travel Time Contours, Paterson, 2030 – Plan
New Jersey’s Long-Range Transportation Plan
27
Map 10: Travel Time Contours, Paterson, 2030 – without Plan
28
New Jersey’s Long-Range Transportation Plan
Urban Supplement for the City of Paterson
E. CURRENT AND FUTURE DEVELOPMENT
1. BackgroundThe City of Paterson, originally settled by the Dutch in the late seventeenth century, became an industrial giant in the 1800’s. Using the power of the Passaic River at Great Falls, and then hydroelectric power, many silk, textile and paper mills and other industries were built. Paterson became a leading city for manufacturing silk, and was the fi fteenth largest city in the country by 1900. Because of the large number of available jobs, Paterson was the recipient of a wave of immigrants. Manufacturing was the mainstay of the economy until the 1950’s, but from that point on the industrial base declined. By the 1960’s, Paterson developed many economic problems, and by the 1970’s the city had experienced a loss of manufacturing jobs.
In an attempt to revitalize Paterson in the 1980’s, the Great Falls was designated a National Landmark, parts of the mill district were designated a National Historic District, and the hydroelectric plant was brought back to life. Paterson used various public grants and fi nancial tools to rejuvenate downtown, and middle-income housing was introduced. The recession of the late 1980’s and early 1990’s, however, reversed some of these tentative gains in Paterson. In the last ten years or so, Paterson has begun to grow again in terms of welcoming new businesses and developing its retail and residential areas.
2. PatersonUnlike other urban centers, Paterson did not experience a decline in population as its industrial base declined. The current city population is the highest it has ever been thanks to the large immigrant population which brings tremendous vitality to the city. Although many jobs have been lost in manufacturing within the city, relatively reasonable real estate costs in Paterson are already attracting redevelopment. For example, the fi rst big box retail center is being built now. It is hoped that undervalued grayfi eld and brownfi eld sites will continue to attract developers. Although city housing stock has been about 60% rental properties, people are beginning to buy and upgrade housing. Developers are considering transit-oriented design.
In addition to historic designations and the construction of new housing in the central city, Special Improvement Districts (SIDs) were formed. Visible changes in the Bunker Hill SID include repaved road surfaces, building maintenance and improvements in security and lighting. In the Downtown SID, shop owners are encouraged to upgrade buildings. Through these efforts, the SIDs have been a catalyst for positive change in the City of Paterson.
Consistent with observed trends, the 2003 City of Paterson Master Plan calls for the creation of redevelopment districts. The redevelopment district concept is intended to be a framework within which large scale redevelopment can be planned and implemented in a way that supports the economic and social goals of the city, meets the standards to qualify projects for redevelopment assistance, and attracts public/private partnerships that, in turn, will encourage private capital investment in redevelopment districts.
To date, Paterson has identifi ed four designated redevelopment areas in their citywide Redevelopment Plan: Passaic River Corridor, First Ward, Fourth Ward and Fifth Ward. The city’s Urban Enterprise Zone (UEZ) plan identifi es the following targeted projects:
Farmer’s Market - $2.1 million UEZ Revitalization project beginning in Fall 2004 along Farmer’s Market and Railroad Avenue.
Main Street - $1 million UEZ Revitalization project from Crooks Avenue to the Brownstone Restaurant.
New Jersey’s Long-Range Transportation Plan
29
Market Street Centers of Peace – UEZ Revitalization project from Spruce Street to the train station.
Center City – Redevelopment and revitalization including the historic district and waterfront. The project would upgrade the transit station and surrounding neighborhood with mixed use, parking, a multiplex theater and open space/atrium/promenade. Construction of a major mixed use project at the corner of Main & Ward Streets is scheduled to begin in April 2006. This project will feature over 300,000 square feet of retail space, movie theatres, and a supermarket.
Other areas in the city recognized as having growth potential include:
Valley of the Rock – This new mid-level to affordable housing and 10-story market-level townhouse development is under construction.
Garret Mountain – The Quarry/New Street area was rezoned from commercial to residential; 5 acres will be a 300-500 unit townhouse/condo development (under construction) and 3 acres for a hotel and banquet facility.
Route 20 – Potential for commercial/retail development. A new Lowe’s opened, in 2007 and ground breaking recently occurred for a new Home Depot.
River and Main Streets – Proposed mixed use development including residences, grocery store and restaurants.
Transit Oriented Development – Redevelopment near proposed Passaic-Bergen Commuter Rail stations.
A Transportation Opportunity Center was opened in Paterson in 2000. The purpose of the Transportation Opportunity Center is to offer programs and services to link low-income individuals with jobs in the suburbs, and to create new job opportunities in transportation and transportation construction industries. Housed in a building in Paterson’s Great Falls Historic District, the Center provides information about jobs and transportation, and training, educational and support programs to assist low-income citizens in obtaining employment.
Brownfi elds designation of sites along the Passaic River in the Great Falls area will encourage redevelopment of underutilized industrial properties. The City has solicited master plan designs for revitalization of the Great Falls Historic District. In 2006, the state announced the winner of a design competition for a new urban state park at Great Falls.
Major sites of employment in Paterson include hospitals and other health care providers with St. Joseph’s Hospital and Medical Center employing more than 3,000 people. As the county seat of Passaic County, many jobs are in the public sector. Manufacturing is important to the local economy; the city is actively pursuing on-going development of its industrial sites:
The Bunker Hill Industrial Area is about one square mile with approximately 108 companies. Some of the larger employers in this area are Accurate Box, Coca-Cola, and Cramer Chemicals. Bunker Hill is the future home of a 120,000-square-foot expansion, creating additional capacity for Fairfi eld Textiles and almost 100 new jobs.
The Marshall Street Industrial Area contains the A & P headquarters, Axelrod, American Flyer, IPF, and Bunk Trunk among others.
Likewise, there is a River Street Industrial Area with Baskin Foods and Sealy Mattress. Other industrial areas appear along Madison Avenue and Getty Street.
A Downtown Special Improvement District contains small businesses, as does the Historic District and Main Street.

30
New Jersey’s Long-Range Transportation Plan
Urban Supplement for the City of Paterson
Finally, PSE&G and Verizon have some employment growth potential, but offer limited opportunities of employment for Paterson residents because the majority of the jobs at these locations require extensive education and skills.
3. Passaic County and Surroundings As indicated in Section I.C.10, Passaic County and its neighbors, Bergen, Essex and Morris contain the majority of employment destinations for Patersonians who work outside the city.
CorridorsVirtually all major highway corridors in lower and central Passaic County and environs are experiencing increased development and redevelopment. Developed corridors include: Route 3 in Clifton and the Meadowlands; Route 4 in Paramus, Bergen County; Route 17, also in Bergen County; Route 20 to Fairlawn; Route 46 from Fairfi eld to Parsippany in Morris County; Route 208 in Fairlawn and Hawthorne; Route 504 in Wayne; and I-287 from Oakland and Franklin Lakes to Ringwood. Nearly all of these corridors have grown considerably, adding many new retail and some industrial jobs. In addition to Route 23, Route 46, I-287 in Ringwood and the Meadowlands are expected to be high growth corridors in the future.
The Route 46/I-80 corridor, which runs from Clifton to western Morris County, is located south of the City of Paterson. Areas of growth, particularly in retail, and to a lesser extent manufacturing, include the cities of Clifton, West Paterson, Totowa, Wayne, Fairfi eld and Hackensack. Along the route are many so-called “big box” retailers such as Home Depot, Staples and Marshalls that employ Paterson residents. For example, the Home Depot on Route 46 in Totowa employs more than 200 people, and there is another Home Depot in Wayne which employs a similar number of employees. Further west on Route 46, a United Parcel Service (UPS) offi ce and Coca-Cola manufacturing site are located near Parsippany and these employers attract Paterson residents.
Route 3 is experiencing a trend toward a reduction in industrial sites in favor of increased retail, but remains an important source of jobs. Clifton Commons provides some employment opportunities. More moderate potential for employment of Paterson residents is located along Route 4 East at places such as the Bergen Mall, the various industrial parks in Paramus and in Fairlawn across county lines in Bergen County.
Big box retail development along the Route 23 corridor north of I-287 has boomed in recent years and is a big area of new retail employment. Stores include BJ’s, Wal-Mart, Lowes, Target, Bed Bath and Beyond, Sports Authority, Pier 1 and Borders. As large lots along the Route 23 corridor are built out, the trend for the future will be redevelopment and small lot infi ll.
The Route 23 corridor south of I-287 runs in a northwestern direction from Essex County, traversing Passaic County west of the City of Paterson. Route 202 is merged with Route 23 through Wayne. The corridor has a largely developed concentration of retail strip malls, hotels and offi ce buildings as well as several residential developments. The focus of future development along this stretch of Route 23 is primarily redevelopment. The Township of Wayne is involved in planning future development along Route 23 in a way that will preserve its character and economic vitality.
Locations with potential for employment include the North Jersey Nursing and Convalescent Center on Route 504, the Wanaque Convalescent Center, development along Paterson-Hamburg Turnpike, at Nabisco on Route 208, and at various adult care facilities on Route 202. Indeed, health care expansion led by area hospitals and assisted living facilities is now a major factor in the economy of Passaic County.
New Jersey’s Long-Range Transportation Plan
31
Site DevelopmentSeveral municipalities around Paterson have designated and/or identifi ed potential redevelopment areas: Bloomingdale, Clifton, Haledon, Hawthorne, Little Falls, Passaic, Pompton Lakes, Ringwood, Totowa, Wanaque, Wayne, West Paterson. Residential and/or commercial/industrial development is contemplated for these areas.
Passaic County developed a Strategic Revitalization Plan in which two potential Regional Centers were identifi ed. The fi rst is the Highlands Regional Gateway which encompasses Pompton Lakes. The County’s development vision for the Highlands Regional Gateway is one of revitalization and enhancement to enable Pompton Lakes and its immediate area to serve as a transportation hub at the northern end of the Paterson-Hamburg Turnpike. More discussion of this hub plan is presented in the next chapter.
The second potential Regional Center identifi ed in the County Plan is the Preakness Center which is defi ned by William Paterson University, the County Preakness Complex and St. Joseph’s Hospital. The County Plan responds to guidance provided in the New Jersey State Development and Redevelopment Plan. Considerably more coordination between the County and municipalities must be undertaken to pursue the Regional Center concept at these locations. However, Regional Center designation would encourage high-intensity development and redevelopment that may create additional job opportunities.
The County Plan also identifi es two candidate Transit Village locations that would be related to the regional centers: Hawthorne and Pompton Lakes. Each location has the characteristics of available land for development or redevelopment and proximity to a transit facility. Like the regional center concept, considerably more coordination between the County and municipalities must be undertaken to pursue the Transit Village concept at these locations. However, Transit Village designation would encourage high-intensity development and redevelopment that may create additional job opportunities.
The emergence and popularity of age-restricted housing is expected to play a major role in future transit services. Notable facilities under construction or in operation today include Hovnanian’s “Four Seasons at Great Notch” that will introduce 814 new homes Route 46 in West Paterson, Cedar Crest Village on Route 23, and Van Dyk at Bald Eagle Commons in West Milford.
Supporting the expansion of the Port of Newark, subzones could be created in Passaic and Paterson on nearly 120 acres of redeveloped brownfi elds.
Ringwood Industrial Park, located two miles from I-287 in northern Passaic County, has a high potential for growth in jobs that could be fi lled by Paterson residents. The development of this Park is being advanced by the Ringwood Industrial Commission. The industrial jobs created in Ringwood could be a good match for the labor force in Paterson, but the area is diffi cult to reach by city residents. In June 2004, the State of New Jersey passed the Highlands Water Protection and Planning Act for the purpose of implementing a regional land use planning approach to protect future drinking water supplies, other signifi cant natural resources, protect quality of life and ensure long-term economic vitality of the region and the surrounding regions it supports. The Act established a Highlands Preservation Area that encompasses most Passaic County land north of I-287. This land is essentially closed to additional development. As a result, the Highlands Preservation Area for the most part is not considered a future employment destination for City residents. Thus, existing and future Passaic County employment destinations for Paterson residents are located primarily in the southern portion of the County, below I-287.

32
New Jersey’s Long-Range Transportation Plan
Urban Supplement for the City of Paterson
The Hackensack Meadowlands is currently a minor source of jobs for Paterson residents, but it may become more important as large planned developments are realized and planned transportation infrastructure becomes operational. Composed of 14 municipalities in Bergen and Hudson counties, the Meadowlands encompasses approximately 19,730 acres.
More than 75,000 permanent jobs and tens of thousands of construction jobs are located in the Meadowlands. Nineteen million people live within an hour drive from the Meadowlands, and employees are recruited from the Urban Supplement cities of Jersey City, Newark, and Paterson, and other locations in northern and central New Jersey. Over the years, there has been a signifi cant increase in jobs, and recently there has been an infl ux of high-tech positions. Many service sector jobs have also been created in hotels, banking and fi nance. Traditionally, the apparel industry, printing and warehouse distribution have been important mainstays of the local economy in the Meadowlands.
Secaucus is a signifi cant regional employment location within the Meadowlands, providing warehousing, retail, hotel and offi ce jobs. A major employment center in Secaucus is the Harmon Cove mixed use community which has 12 million square feet of offi ce and warehouse space, retail outlets and hotels. The Plaza at Harmon Meadow contains offi ce space, hotels and retail development; and the Mill Creek Mall contains offi ce space and retail development.
In planning or under construction in the Meadowlands are three major developments:
Xanadu will consist of 5 million square feet of entertainment, leisure, commercial and retail development including four 14-story offi ce buildings and a hotel.
Meadowlands Golf Village is a large mixed use development in Lyndhurst and North Arlington consisting of two golf courses, a hotel and luxury resort, 750,000 square feet of offi ce space, 100,000 square feet of retail space and 2,000 residential units. Meadowlands Golf Village is expected to generate 2,400 full time jobs.
Secaucus Junction Station area redevelopment is planned to include 750,000 square feet of offi ce and entertainment space, a hotel and conference center and 1,850 residential units.
F. TRANSPORTATION SYSTEM ISSUESThis section assesses the operations and performance of existing transportation system facilities and services. The objective is to identify critical transportation system issues and needs to support the city’s land use and development objectives.
1. Roads
CongestionThe system performance assessment undertaken as part of this Supplement indicates that under present conditions most of the roadway segments approaching the city boundary from all directions are either nearing capacity or already over capacity during peak period conditions. Within the city boundary, Route 4 (east-west corridor), Route19 and Route 20 (north-south corridors) operate well during peak hours with suffi cient roadway capacity available for traffi c fl ows. Most of the remaining roadways either operate near capacity or are over capacity. The data illustrates an on-going issue of traffi c congestion and the need for relief on many roads.
Within the city, traffi c fl ow is often hindered by congestion, poor traffi c signal coordination and narrow roads that are easily clogged by on-street parking, bus stops and truck loadingand unloading.
New Jersey’s Long-Range Transportation Plan
33
Pavement ImprovementsThe Surface Distress Index pavement rating data show that more than 60% of the road segments have very good or good pavement conditions while over 35% percent are in fair condition. Minimal length of pavement (0.4 miles, 2.4%) is in poor condition while no pavement is in very poor condition. The International Roughness Index pavement rating data show that most roads have good to fair pavement conditions, but about 1/3 of roads have defi cient pavement. This data illustrates an on-going need for pavement improvements.
BridgesOne third of the 53 bridges in the city are either structurally defi cient or functionally obsolete. This data illustrates an on-going need for bridge upgrades and replacements.
Key CorridorsIn pursuing its Smart Growth policies, Passaic County has identifi ed Paterson-Hamburg Turnpike as a priority for revitalization and optimization. On a map, Paterson-Hamburg Turnpike provides the straightest, apparently most direct connection between Paterson and Pompton Lakes. Unfortunately, on the ground traveling the Turnpike is slow-going. County and local offi cials are not interested in seeing the Turnpike widened and surrounding lands developed in a way that could produce another Route 3 or 4. The solution to current traffi c fl ow problems is not a simple matter of adding capacity; the solution lies in optimizing operations to improve travel time.
2. Public Transit
Commuter RailNJ TRANSIT double-tracked the Main Line from the XW Interlocking to Paterson Junction Interlocking which enables more trains to operate on the line with less delays. These improvements as well as the completed Secaucus Transfer Facility increase transportation choices for city residents. The city Master Plan identifi es a need to improve train station access and parking.
Local Bus
Late Evening and Weekend ServiceExisting demand for off-peak bus service for retail and service jobs – part-time and shift work - often necessitates travel to and from work during times other than traditional peak commuter periods. Existing transit services can be infrequent or non-existent, particularly during late evening and weekend hours. Several existing NJ TRANSIT bus routes provide night service to Paterson as late as 1:00 AM on weekdays. Some provide service from Paterson as early as 5:30 AM on weekdays. All Paterson bus routes provide Saturday service, but only some routes provide Sunday service. How well this service is accommodating demand should be examined.
Reverse Commute ServiceNJ TRANSIT has identifi ed an increasing demand for bus service to suburban Bergen and Passaic Counties, particularly to restaurant and retail jobs near Paramus and Willowbrook Malls and domestic jobs in affl uent areas of northeastern Bergen County. On-going issues experienced by these workers are diffi cult access by transit and non-standard shift work in Bergen County.
Bus service to suburban sites can be long and expensive; transfers may not be well coordinated. While demand for service to suburban sites is not great, the bus ride to Pompton Lakes is greater than an hour in length and one or more transfers is required. Bus arrival times at transfer sites are not coordinated, resulting in lengthy intervals between bus connections.
34
New Jersey’s Long-Range Transportation Plan
Urban Supplement for the City of Paterson
As part of their plan Access & Mobility 2030, the NJTPA conducted a strategy refi nement study of Paterson and the surrounding area which determined high needs for transit mobility centered on the reverse-commute from Paterson to suburban employment destinations. Transportation options to existing employment corridors and destinations such as Route 46 and Hackensack are in need of enhancement. Emerging employment destinations, such as Route 23 north of Pompton Lakes and the planned Meadowlands development require both new and enhanced transportation planning. Issues relevant to both existing and emerging employment destinations are:
Availability of transit service (presence, frequency of service, off-peak service)
Convenience of transit service (trip duration, need for transfers, ease of connections)
Transit operations (optimized schedule, ridership)
NJ TRANSIT intends to conduct a comprehensive bus service needs assessment that will include Paterson and the surrounding region. The county has recognized the need to develop a multi-modal plan to improve transportation in the Paterson area. This plan, which combines roadway, rail, bus, paratransit and bicycle/pedestrian strategies, will enhance transportation choices for Patersonians employed outside the city.
Competing Private TransportationLocal jitney service is eroding NJ TRANSIT bus ridership. Private services such as Spanish Transportation often provide redundant services to those provided by fi xed route bus service. As a result, ridership on fi xed route transit is reduced. Meadowlink has commented that integrating jitney service into the overall transportation system as a complementary service would eliminate redundancies and help fi ll a need for on-demand services. However, because existing jitney services are private, they are not subject to the more rigorous operating and reporting requirements of system participants. Otherwise desirable funding sources such as Casino Revenue Development Act (CRDA) funds can have burdensome requirements that are a disincentive for a small provider or town. Meadowlink would like to see funding regulations modifi ed to allow reporting coordination for multiple providers. This may be one way to encourage jitney services to participate and coordinate with city transportation planning and operations.
Bus Service PrioritizationFunding for transit service continues to be a challenge. Funding constraints on NJ TRANSIT bus service since 2001 have led to new thinking. Rather than expanding fi xed-route bus service and imposing added elements such as modifi ed-route service, the focus is on optimizing existing fi xed-route services. The applicability and benefi t of bus priority treatments to enable buses to operate at the posted speed limit 24 hours a day should be explored as one means of improving existing bus services.
ParatransitMeadowlink conducted Commuter Service Focus Groups in Paterson in 2001. Meadowlink is a public/private partnership created to improve access, reduce congestion and promote economic growth by working with businesses and government agencies to address employee commuting needs in northern New Jersey. Transportation programs and services are provided in partnership with Passaic County, the NJDOT and NJ TRANSIT. Focus Group input identifi ed a number of area employers such as Preakness Health Care Center that were not well served by transit but are major employment destinations for Paterson residents. With this data, two Meadowlink shuttles were established: Preakness Shuttle and the Haskell/Bloomingdale Shuttle. In 2005, Meadowlink reported that ridership on the Preakness Shuttle doubled since 2002.
New Jersey’s Long-Range Transportation Plan
35
In 2003, the Passaic County Department of Human Services held its second Transportation-to-Work Forum. The theme was “unifying Paterson’s independent transportation services” and the focus was on improving communications between shuttle service providers and employers. In addition to the Preakness and Haskell/Bloomingdale shuttles, existing shuttle services to other locations were identifi ed: Passaic County Youth Detention Center in Wayne, the Passaic County Technical Institute and Six Flags in Jackson. The need and provision for a Transportation Counseling Center in Paterson was also identifi ed and implemented. Projects proposed during the forum and still under consideration include the Carshare project (a Meadowlink project in the Meadowlands/Secaucus) and a pilot shuttle program to serve employers along the Route 46 corridor in Passaic County. Several companies have showed interest in the pilot program including Harbor House Employment Services, the NJ Division of Vocational Rehabilitation Services, and Barnert Hospital.
The shuttles, in concert with Meadowlink’s decision to locate an offi ce within the city to more closely coordinate with human services and provide transportation information to customers and the establishment of the Community Transportation Center, have signifi cantly improved communications between providers, agencies and customers. The Hispanic population has grown in the last fi ve years and is now 50 percent of the total city population. In response to the growth in the Hispanic population, Meadowlink requires its employees to be bilingual. As the current shuttle operator, the county is responding to that need as well.
Current thinking by Meadowlink is that NJ TRANSIT should limit its bus service to key trunk corridor routes as these are most cost-effective. Money saved can be provided to local agencies to plan and operate circulator services. This may allow for connection issues to be better addressed such as 10-minute rail headways but less frequent connecting bus service.
Nationwide, paratransit services continue to evolve, becoming more vital elements of the larger transportation systems, particularly providing links between other transportation modes. There is a universal need to break down the barriers that have been inherent in paratransit operations to date: rider eligibility and jurisdictional boundaries. Locally as nationally, expanding shuttle services to accommodate trips and needs beyond the specifi c eligibility requirements of customers for that service and expanding service beyond the jurisdictional boundaries of the service provider remain challenges to coordinating between operators as well as optimizing fl eets and operations. Meadowlink is currently evaluating the future possibility of using Medicaid funding to support transportation needs. Meadowlink recommends that the City continue to work with local transportation agencies such as Meadowlink to provide demand-response transit and paratransit.
3. Bicycle and PedestrianAs part of enhancing transportation options, the NJTPA completed a strategy refi nement study of Paterson and the surrounding area. This study determined there is a high need for walking and bicycle mobility. Encouraging those who are able to walk or bicycle to work is a county priority.
G. ASSESSMENT OF PROGRESSThe 2001 Urban Supplement recommended transportation improvements in several categories. This section presents an assessment of the progress in implementing these recommendations.
36
New Jersey’s Long-Range Transportation Plan
Urban Supplement for the City of Paterson
1. Roads
Recommendations from the 2001 Urban Supplement
Initiate studies and implement recommended improvements to relieve congestion on major roadways.
Improve access to Paterson from I-80.
Make improvements to Squirrelwood Road interchanges.
Undertake bridge upgrades and replacements.
Improve pavement conditions along Routes 3, 20, 46, and a section of Route 504 in the city.
Continue to address and implement safety improvements at high-accident locations, especially along Routes 4, 7, 23, and 46 near Paterson but not within the city limits.
The NJDOT has initiated a few major projects which address some of these recommendations. One project involves improvements at the interchange of I-80 with Route 20 (Market Street). This construction project will address weaving and grade crossing issues, improve sight distance, upgrade existing infrastructure and address connections to local streets. Another project is to rehabilitate the West Broadway Bridge over the Passaic River. This project will increase structural capacity and provide new roadway pavement, sidewalks and railings.
In addition, the NJDOT capital programming pipeline includes the following projects which respond to some of these recommendations:
Route 46/23/80 Interchange – This construction project will include roadway resurfacing, bridge deck replacements, acceleration/deceleration lane construction, new guide rails geometric improvements, new lighting and sign upgrades.
Route 46/23, I-80 Connector – This project will examine the feasibility of constructing a new roadway for traffi c from Routes 46 and 23 to I-80; it would eliminate an undesirable weaving section.
Route 46, Passaic Avenue to Willowbrook Mall – This design-phase project would widen Route 46 from four to six lanes and provide interim structural repairs to an existing bridge.
2. Bus Transit System
Recommendations from the 2001 Urban Supplement
Improve intracity bus service. The hub-and-spoke route structure that funnels all buses into the center of downtown should be modifi ed to provide more crosstown service to directly link Paterson’s neighborhoods and work sites.
Add late evening and/or early morning bus service to accommodate employees who work the second and third shifts.
Add Saturday and Sunday service to some bus routes and increase the frequency on others.
Consider adding bus service to new locations.
Offer more express bus service from Paterson to the Meadowlands.
Address competitive local van services.
In recent years, NJ TRANSIT has increased service on several bus routes that connect Paterson with regional employment locations. These routes include #72 (Newark), #161 (New York), #190 (New York), and #712 (Hackensack and Willowbrook Mall). Weekday service begins at
New Jersey’s Long-Range Transportation Plan
37
5:30 AM and goes until 1 AM on some lines. All lines provide Saturday service and some lines provide Sunday service. Demand for innovation in how and when bus service is provided to enable city residents to get to employment locations within and outside the city continues to be a key issue due to the increase in city population and resulting increase in demand for transportation, particularly outside the city.
II. TRANSPORTATION PROJECTS
A. PATERSON
1. RoadsAs discussed in Section I.F.1, NJDOT has several projects in various phases of its capital programming pipeline. The FY 2006 Transportation Capital Program includes the following projects:
Route 46/23/80 Interchange Improvements.
Barclay Street Viaduct – This city construction project will rehabilitate the viaduct from Route 19 to Marshall Street to increase the weight load of the structure. In addition to the above projects, the NJDOT FY 2006-2008 Transportation Improvement Program (STIP) includes a project to reconstruct Hazel Street, County Route 702. This project will widen the existing road from Broad and Marshall Streets to Crooks Avenue, add a parking lane and new curbs and sidewalks to enhance pedestrian safety.
Also, the NJDOT Study and Development Program includes the following two potential projects near Paterson:
Route 46/23, I-80 Connector.
Route 46, Passaic Avenue to Willowbrook Mall Widening.
Passaic County, which has jurisdiction over several important downtown streets, has identifi ed congestion and is working toward a plan to address traffi c congestion and roadway grid system issues. For example, the county considers Broadway and Madison Avenue to be main boulevards and focal points for transportation investments. Broadway is a major east-west road connecting to Route 4, and Madison Avenue is a major north-south artery. Coordinated signal timing on these and other major roads would signifi cantly improve traffi c fl ow and travel time.
The county’s fi rst priority for reducing traffi c congestion within the city is improving transit and access to transit. Reducing the number of vehicles on downtown roads by providing more desirable transportation options is a key step toward improving downtown traffi c fl ow. This priority is consistent with the 2003 City Master Plan economic development goal of ensuring that appropriate transportation facilities exist to attract light industrial and other businesses.
2. Bus TransitWhereas city bus routes tend to be radial, the county believes that a coordinated downtown circulator service would benefi t residents traveling within the city. The City of Paterson currently operates a free circulator trolley in town; better publicity about that service may increase its use. To address congestion issues related to bus activity in the city, the circulation component of the 2003 City Master Plan calls for coordination with NJ TRANSIT to consider reducing or combining stops, providing express service during peak periods, implementing signal priority technology and installing dedicated bus stop lanes.

38
New Jersey’s Long-Range Transportation Plan
Urban Supplement for the City of Paterson
3. Bicycle and PedestrianThe NJTPA has identifi ed a county strategy to implement pedestrian and bicycle enhancements along the Union Boulevard/Union Avenue corridor west from downtown Paterson. Bicycle lanes along this corridor could connect Paterson with Little Falls rail station and a proposed shared use bicycle trail along the Norfolk Southern freight corridor. The proposed trail would ultimately connect with an off-street bicycle path that Morris County has proposed along the Boonton Line corridor. More discussion of the proposed bicycle trails is presented later in this chapter.The 2003 City Master Plan recognizes the city’s one signed bicycle route on the west side of the Passaic River between Great Falls and Overlook Park. Constructed in the 1980’s, the existing path is slated to be refurbished using a $250,000 grant the city received and to construct an additional path on the east side of the river.
B. PASSAIC COUNTY AND SURROUNDINGS
1. RoadsPassaic County is actively examining land use and employment patterns and evaluating ways to improve transportation and expand transportation choices. Consistent with current New Jersey Department of Transportation (NJDOT) thinking, the county recognizes that it is no longer adequate and many times not possible to widen roads. Thus, the county is focusing on better ways to manage and optimize existing roads and other transportation resources. At the same time, the county is identifying and pursuing Smart Growth policies by designating or targeting specifi c communities and corridors for revitalization as hubs and focal points to implement Smart Growth strategies.
The NJTPA’s Access & Mobility 2030 Plan determined that a number of major corridors and arterials in Passaic County need rehabilitation and special treatment to help implement Smart Growth strategies. Union Boulevard from Totowa to Pompton Lakes is a major Smart Growth Corridor and needs integrated land use/transportation evaluation that includes integrated bicycle and pedestrian facilities. The county has identifi ed Paterson-Hamburg Turnpike as a priority for an integrated land use/transportation study.
As stated in the previous chapter, the portion of the county generally north of I-287 is within the Highlands Preservation Area and is essentially closed to additional development. The developed area just to the south, Bloomingdale and Pompton Lakes, is considered the “Highlands Gateway” and is a focus of revitalization. It is also the gateway to the major Route 23 commercial and employment corridor described in the previous chapter. The county vision is for Pompton Lakes to serve as a hub at the northern end of the Paterson-Hamburg Turnpike.
The county will be identifying a variety of techniques to optimizing operations on the Paterson-Hamburg Turnpike, including but not limited to transportation system management strategies (coordinated signals and intersection improvements, for example) and transit improvements (such as mid-block bus stops which could dramatically increase ridership).
2. Bus ServiceThe NJTPA strategy refi nement study recommended introducing reverse-commute bus service from Paterson to suburban employment centers such as Hackensack and Route 46 in Fairfi eld and Parsippany, and to new development in the Meadowlands. It was further recommended that the bus routes should complement other existing and proposed transportation services.However, NJ TRANSIT is constrained in its ability to increase bus service. Although fi nancial resources limit service expansion, NJ TRANSIT has recognized and prioritized additional potential service needs including increased service span and frequency along core routes, improved service

New Jersey’s Long-Range Transportation Plan
39
to New York City, and local service improvements targeting at changing employment patterns.
3. Paratransit Service The county plans to expand the origins and destinations served by their shuttles and expand opportunities for coordination and integration with fi xed bus route transit services and locally based community mobility services. One goal is to coordinate the two shuttle services, add route deviation, and operate during a 10-hour period during the weekdays. The second goal is to add demand-responsive service, both individual and subscription based, during a 6-hour evening and night period during weekdays, and a 12-hour period on weekends. Adding both modifi ed fi xed route and demand-responsive services would enable the shuttles to accommodate other trips and needs, thereby maximizing and optimizing their operations. It is planned to confi gure shuttle operations as follows:
Paterson to Pompton Lakes – a 10-mile corridor along the Paterson-Hamburg Turnpike, Central Ave and West Broadway
Pompton Lakes to Oakland - Use Pompton Lakes as a hub and transfer point, run west through Riverdale and Butler on Route 23, turn north along Ringwood Avenue to Wanaque, and then use I-287 to access Oakland Avenue in Oakland for approximately 12 miles. Major destinations on this route will include major retail centers, assisted living centers, William Paterson University and St. Joseph’s Wayne General Hospital.
Passaic County will be developing a Comprehensive Community Transportation Plan in the coming year that will examine the nontraditional services system involving public and non-profi t agencies and private for-profi t fi rms. The intent is to produce an action-oriented plan to enhance services to mobility-impaired segments of the community: the youth, the elderly, the disabled and the economically disadvantaged.
4. Rail Transit
Passaic-Bergen Commuter Rail ProjectA NJ TRANSIT rail project that is currently a candidate in the region’s Fiscally Constrained Regional Transportation Plan is the Passaic-Bergen commuter rail project. The Passaic-Bergen rail project would originate in Hawthorne and would serve the Pompton Lakes area of Passaic County. The initial phase of the 10-mile Passaic-Bergen rail project would extend from Hawthorne to Hackensack through Paterson. The Hackensack stop would afford access to one of Bergen County’s largest employers: Hackensack Medical Center. The Passaic-Bergen rail project would connect to three existing commuter rail lines (the Main Line, the Bergen Line to Elmwood Park, and the Boonton Line) and could eventually connect with the Hudson-Bergen LRT.
The Passaic-Bergen rail project is considered a high priority project as it would provide an additional transportation option for approximately 300,000 people and 100,000 jobs located within one mile of the corridor. Service is anticipated to begin in 2008. Eight stops are envisioned in Passaic County, including several within the City. The stops, particularly within Paterson, will create new opportunities for transit-oriented redevelopment, especially brownfi eld sites. NJ TRANSIT anticipates the need for pedestrian and roadway access improvements, as well as parking improvements along the line.
NYS&W Commuter Rail ProjectA NJ TRANSIT rail project that is also a candidate in the region’s Fiscally Constrained Regional Transportation Plan is restoring commuter rail service on the New York Susquehanna and Western (NYS&W) railroad corridor between Sparta and Hawthorne. Passenger service on the
40
New Jersey’s Long-Range Transportation Plan
Urban Supplement for the City of Paterson
NYS&W was suspended along the route in 1966; Norfolk Southern currently operates local and through freight service on the NYS&W. The project would consist of upgrading 40 miles of single track from Hawthorne to Sparta, sidings, nine new passenger stations, signaling infrastructure, and a storage and maintenance yard.
Restoration of passenger service would enable commuters to travel from Sussex, Morris, Bergen and Passaic counties to Hoboken or transfer at Secaucus to trains going to Manhattan or destinations on the Northeast Corridor such as Newark or Trenton.
5. Bicycle and Pedestrian RoutesPassaic County is pursuing development of a bicycle trail along the low intensity Norfolk Southern freight rail corridor in Paterson, Totowa and Wayne. Patersonians who travel to work by bicycle typically work within fi ve miles of the city, and 30% of Patersonians work in Totowa. Pedestrian and bicycle enhancements are proposed along the Union Boulevard/Union Avenue corridor west from downtown Paterson to Little Falls. This route would provide a direct connection to the bicycle trail. The bicycle trail would provide an important connection and increase bicycling as a transportation option. Reducing those trips on the roadway network could lead to signifi cant traffi c reduction. The bicycle trail would be extended to Pompton Lakes through Pequannock and Riverdale in Morris County via their bicycle trail plan.
New Jersey’s Long-Range Transportation Plan
41
III. RECOMMENDATIONSBased upon the analysis and fi ndings of this report, the following section presents recommendations for transportation improvements.
A. RoadsAs recommended in the 2001 Urban Supplement, NJDOT, the county and city should continue to address roadway congestion, access, pavement conditions and safety on roads within and outside the city.
Passaic County should pursue its intention to develop and implement a plan to address in-city roadway congestion, including establishing Broadway and Madison Avenue as main boulevards, addressing signal timing coordination needs on all roads, providing bus pull out areas where feasible by eliminating some on-street parking, and addressing safety issues at crosswalks by improving crosswalk visibility and signage.
Passaic County and NJDOT should pursue Smart Growth policies as identifi ed in the NJTPA’s Access & Mobility 2030 Plan by designating specifi c communities and corridors for Smart Growth, including Pompton Lakes, Union Boulevard (Totowa to Pompton Lakes) and the Paterson-Hamburg Turnpike (Paterson to Pompton Lakes). The county and NJDOT should identify and implement transportation system management and other strategies to improve mobility and increase transit ridership on these roadways.
B. Public Transit
1. Commuter Rail
NJ TRANSIT should complete the environmental assessment and related conceptual design for the proposed Passaic-Bergen commuter rail project and should coordinate with the city and county regarding strategic stop location planning in the city. The city should craft and implement local access and parking solutions at stop locations in order for those elements to be in place with Passaic-Bergen rail operation. The city should consider advancing transit-oriented development plans near Passaic-Bergen rail system stops.
In light of the Main Line double-tracking and presence of the Secaucus Transfer facility, the city should consider improving train station access and parking as recommended in the city Master Plan.
2. Bus and Paratransit
NJ TRANSIT, the county and the city should collaborate to conduct a comprehensive bus service needs assessment.
Following completion of NJ TRANSIT’s needs assessment, Passaic County should develop a multi-modal plan to improve transportation choices for Patersonians employed outside the city. This plan should form the basis for their new Comprehensive Community Transportation Plan. Recommended corollary activities include:
The county should use the results of NJ TRANSIT’s needs assessment study to determine •the need for a downtown circulator service that is coordinated with NJ TRANSIT bus service and the city’s free downtown trolley service. The city should provide better information on its service to increase ridership.
In developing transportation service schedules, the city, Passaic County and NJ TRANSIT •
42
New Jersey’s Long-Range Transportation Plan
Urban Supplement for the City of Paterson
should collaborate on addressing what NJ TRANSIT sees as the increasing demand for off-peak reverse-commute services to suburban areas of Passaic and Bergen counties that are not well-served by transit or where trips are long and transfers are diffi cult.
The county and city should collaborate with NJ TRANSIT in exploring the applicability •and benefi t of bus priority treatments to enable buses to operate at the posted speed limit 24 hours a day.
Passaic County and the city should consider expanding JARC shuttle origins and •destinations based on the fi ndings of the NJTPA strategy refi nement study of their Access & Mobility 2030 Plan.
Passaic County should fully implement its plan to expand opportunities to coordinate •and integrate JARC shuttle service with fi xed bus route transit services and locally based community mobility services.
Passaic County and other agencies operating shuttles should consider accommodating •trips and needs beyond the specifi c eligibility requirements of customers for that service and expanding service beyond the jurisdictional boundaries of the service provider.
As indicated in the city Master Plan, the City and Passaic County should coordinate with •NJ TRANSIT to develop and implement a plan to address the problem of jitney services eroding bus ridership and consider actions to better serve residents’ needs, thereby recouping ridership.
The city and Passaic County should use the results of NJ TRANSIT’s needs assessment •study to implement appropriate infrastructure improvements to accommodate bus service: reduce or combine in-city bus stops, implement signal priority technology and install dedicated bus stop lanes.
The State of New Jersey should consider the observation by Meadowlink that CRDA reporting requirements are a burden for service providers, a disincentive for towns and tend to promote private taxi services that erode transit ridership. Future report coordination among multiple providers should be considered.
C. Bicycle and PedestrianState and local agencies should continue to advance plans to improve bicycle and pedestrian access and safety, and they should seek available funding sources to implement these plans.
Passaic County should implement pedestrian and bicycle enhancements along the Union Boulevard/Union Avenue corridor from downtown Paterson to Little Falls.
Passaic County should implement the proposed bicycle trail along the Norfolk Southern corridor that would connect Union Boulevard with Morris County’s proposed bicycle path along the same corridor.
The city should refurbish the existing bicycle path between Great Falls and Overlook Park and construct the proposed additional path on the east side of the river.

New Jersey’s Long-Range Transportation Plan
43
REFERENCES
Blesso, Francis J., Director of Redevelopment, Department of Community Development, City of Paterson, February 8, 2006.
City of Paterson. 2003 Master Plan, City of Paterson. Heyer, Gruel & Associates.
Meadowlink, “Smart Commuter.” www.meadlowlink.org
New Jersey Department of Labor. NJ Employment and Wages: 2003 Annual Report, Municipalities by Industry.
New Jersey Department of Transportation, Bridge Management System.______. Bureau of Safety Programs.______. Congestion Management System.______. Pavement Management System.______. Straight Line Diagrams______. FY 2006-2008 Statewide Transportation Improvement Program______. FY 2006-07 Study and Development Program______. FY 2006 Transportation Capital Program. ______. 2001 Urban Transportation Supplement for Paterson.
NJ TRANSIT. Bus Schedules.______. “NJ TRANSIT Adding Capacity on 36 Bus Routes.” January 12, 2006.______. Rail Schedules.______. www.secaucusjunction.com
“NJ TRANSIT Revising Train Plan for Bergen.” Star-Ledger. May 12, 2005.
New Jersey Sports and Exposition Authority. Meadowlands Railroad and Roadway Improvement Project, Final Environmental Impact Statement.
North Jersey Transportation Planning Authority (NJTPA), Approved Demographic and Employment Forecasts. May 23, 2005.______. Access and Mobility 2030, Appendix G, Strategy Refi nement Study______. Job Access and Reverse Commute Project Summaries. 2006.______. FY 2007 Local Safety Program______. Other Regional Projects______. Subregional Issues. NJTPA.______. Subregional Study Program, FY 2006 – FY 2007. ______. Transportation Improvement Program
Passaic County, Final Cross-Acceptance III Report. February 28, 2005.______. Passaic County Transportation and Smart Growth Strategy Evaluation Model Report. June 2005______. Strategic Revitalization Plan.
The Record, August 2005. “The Big Box Blues.”
The Record, July 6, 2003. “Balancing Act.”
Rutgers University, Department of Urban Planning and Policy Development, Spring 1994. Selected Development & Redevelopment Strategies for Paterson, NJ.
www.aisc.org
Ridewise of Raritan Valley website. www.ridewise.org
U.S. Department of Commerce, Bureau of Census 1980, 1990, and 2000.
INTERVIEWS
May 26, 2005 phone interview with Neil Muller, Planning Director, Passaic County.
July 19, 2005 Interview with NJ TRANSIT staff: Steve Lax, Bus Service Director; Jim Gilligan, Bus Service Director; Richard Kerr, JARC director; Jim Flynn, JARC program; and Jerry Lutin, Senior Director of Statewide and Regional Planning.
August 3, 2005 Interview with Krishna Murthy, Meadowlink TMA
44
New Jersey’s Long-Range Transportation Plan
Urban Supplement for the City of Paterson
August 3, 2005 Interview with NJDOT Local Aid staff: Richard Lovelace, Eileen Schack.
August 3, 2005 Interview with North Jersey Transportation Planning Authority staff: Liz DeRuchie, David Dawson, Kevin Twine
December 22, 2005 Interview with Neil Muller
December 22, 2005 Interview with Edward Lipiner, Principal Planner, Transportation, Passaic County Planning Board.

New Jersey’s Long-Range Transportation Plan
45