urbanisation in india challenges of equity, crisis
TRANSCRIPT

Urbanisation in India
Challenges of Equity, Crisis
Managment & Sustainability
Amitabh Kundu
Special Foundation Course
at
Dr. Marri Channa Reddy Human Resource Development Institute of Telangana
The 3rd March 2021
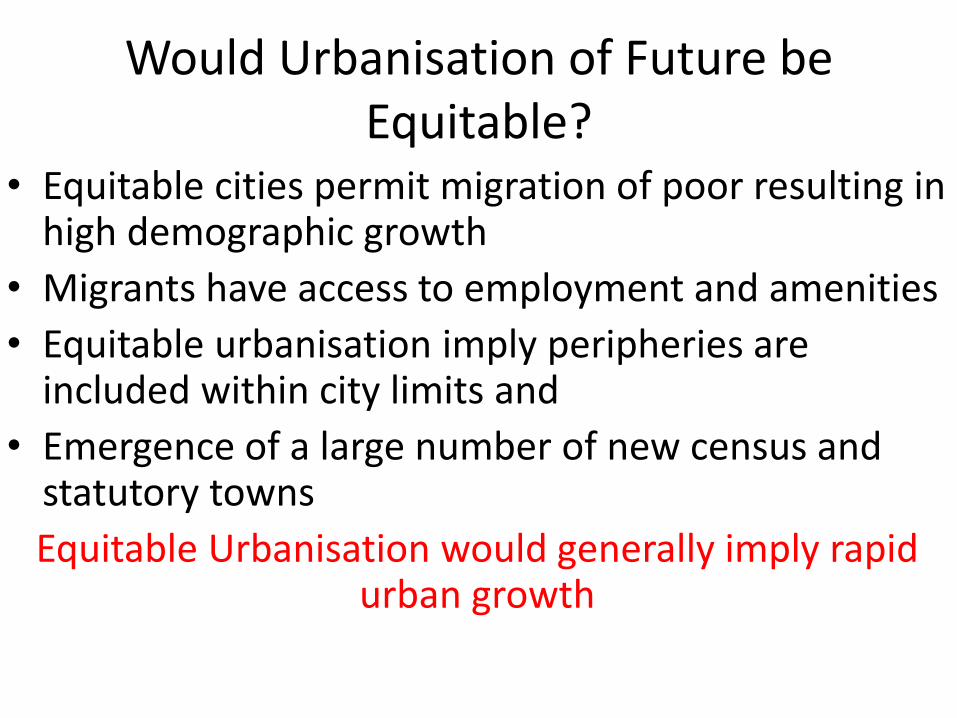
Would Urbanisation of Future be Equitable?
• Equitable cities permit migration of poor resulting in high demographic growth
• Migrants have access to employment and amenities
• Equitable urbanisation imply peripheries are included within city limits and
• Emergence of a large number of new census and statutory towns
Equitable Urbanisation would generally imply rapid urban growth
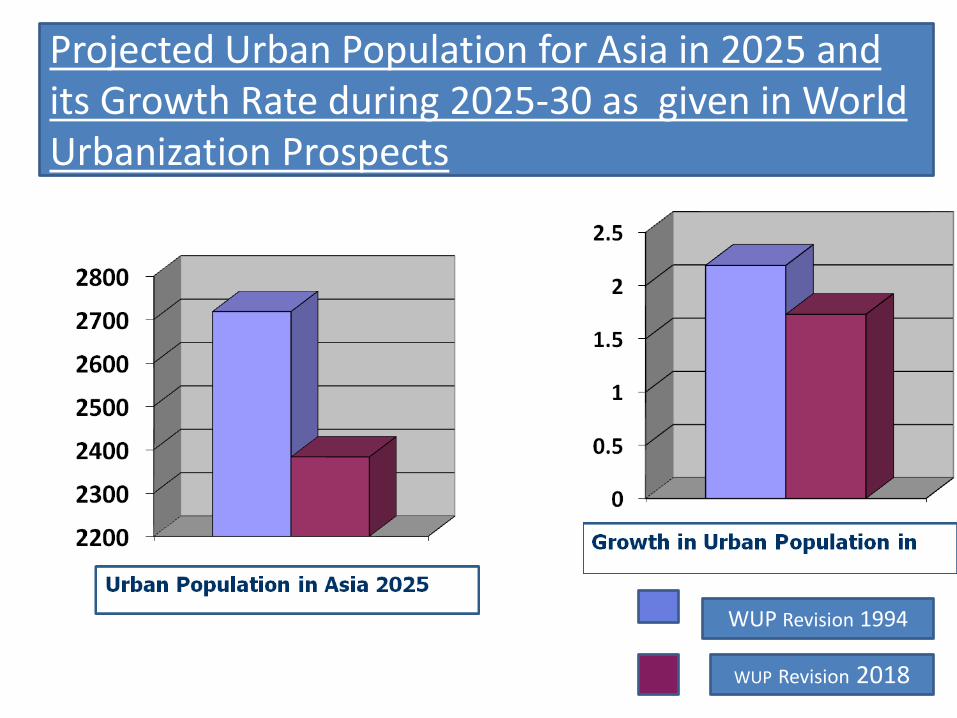
Projected Urban Population for Asia in 2025 and its Growth Rate during 2025-30 as given in World Urbanization Prospects
WUP Revision 1994
WUP Revision 2018

0
0.5
1
1.5
2
2.5
3
3.5
WUP 1995 WUP 2004 WUP 2008 WUP 2010 WUP 2012
Ra
tes o
f G
row
th
Growth Rates of Urban Population in India as Projected in World Urbanisation Prospects
(WUP)
2025-30
2045-50
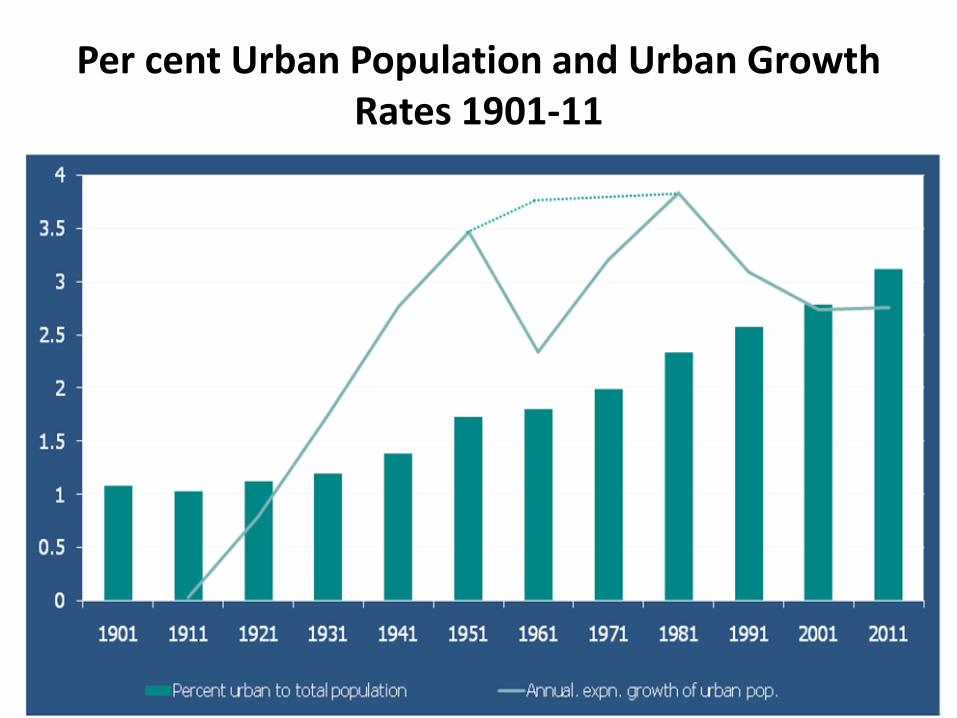
Per cent Urban Population and Urban Growth Rates 1901-11
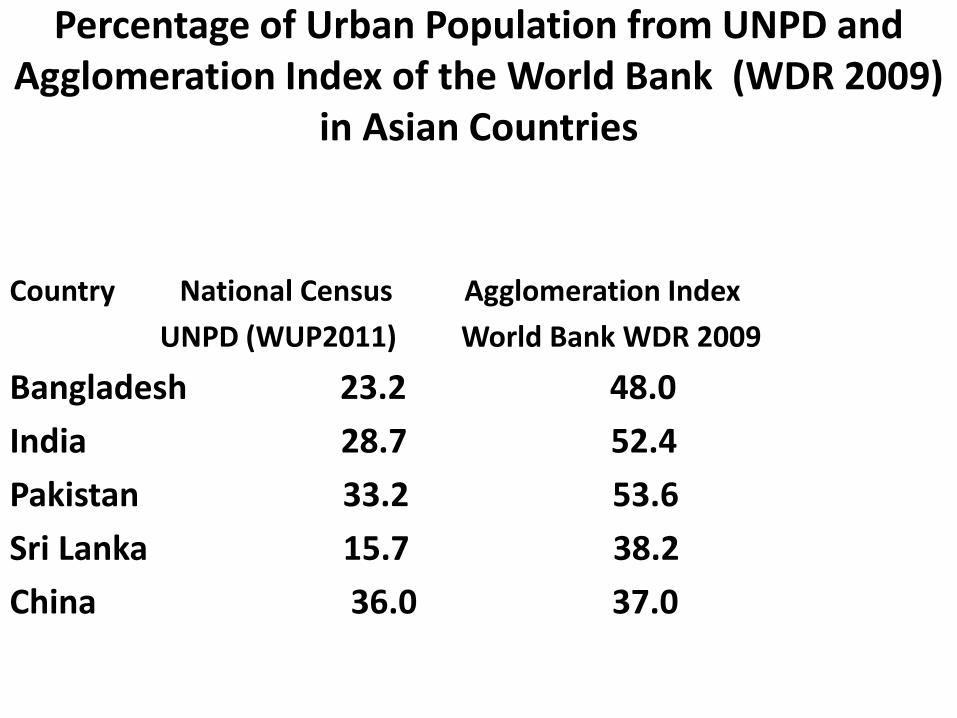
Percentage of Urban Population from UNPD and Agglomeration Index of the World Bank (WDR 2009)
in Asian Countries
Country National Census Agglomeration Index
UNPD (WUP2011) World Bank WDR 2009
Bangladesh 23.2 48.0
India 28.7 52.4
Pakistan 33.2 53.6
Sri Lanka 15.7 38.2
China 36.0 37.0
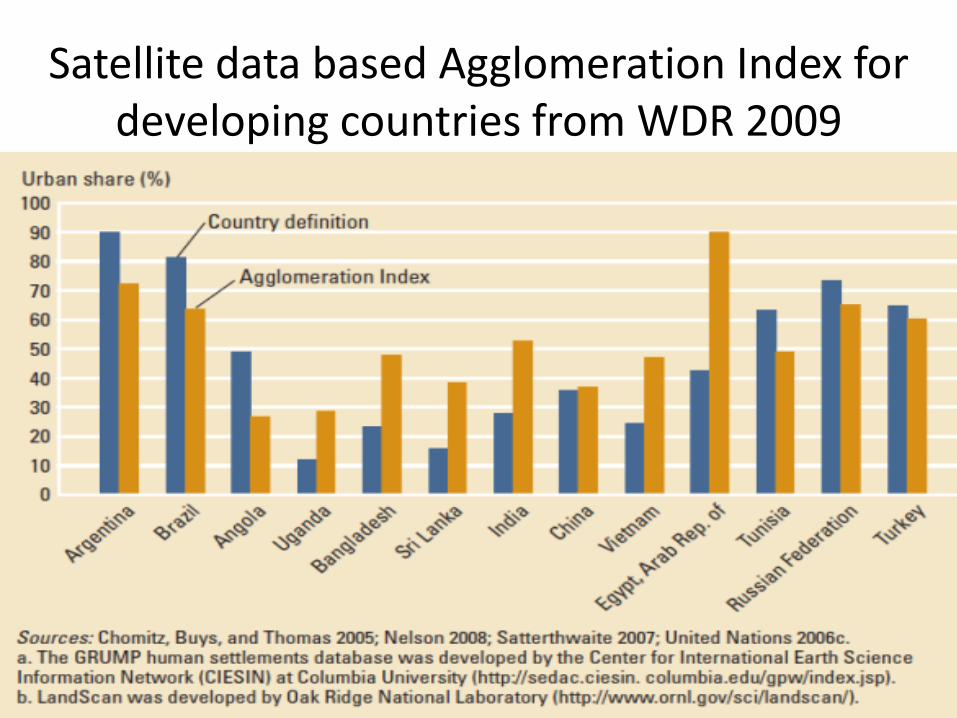
Satellite data based Agglomeration Index for developing countries from WDR 2009
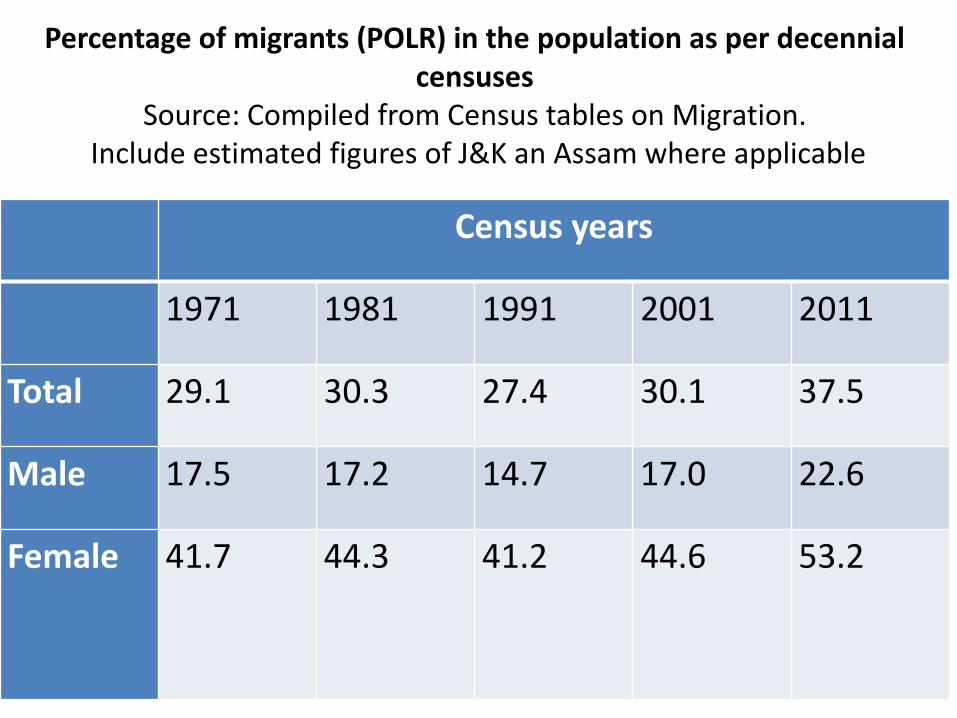
Census years
1971 1981 1991 2001 2011
Total 29.1 30.3 27.4 30.1 37.5
Male 17.5 17.2 14.7 17.0 22.6
Female 41.7 44.3 41.2 44.6 53.2
Percentage of migrants (POLR) in the population as per decennial censuses
Source: Compiled from Census tables on Migration. Include estimated figures of J&K an Assam where applicable

Total Net Inter-State Migration for India
(Economic Survey 2017)

Percentage Distribution
1991-01 2001- 2011
Total increase (in millions) 67.7 90.2
(a) Natural increase on base year
pop and on inter-censal migrants 59.4
48.4
(b) Population of new towns less
declassified towns 6.2 31.8
(c) Net RU migration 21.1 15.5 (d) Increase due to expansion in U
Area and merging of towns 13.0 4.3
Table 3: Decomposition of Total Incremental Urban Population into Components
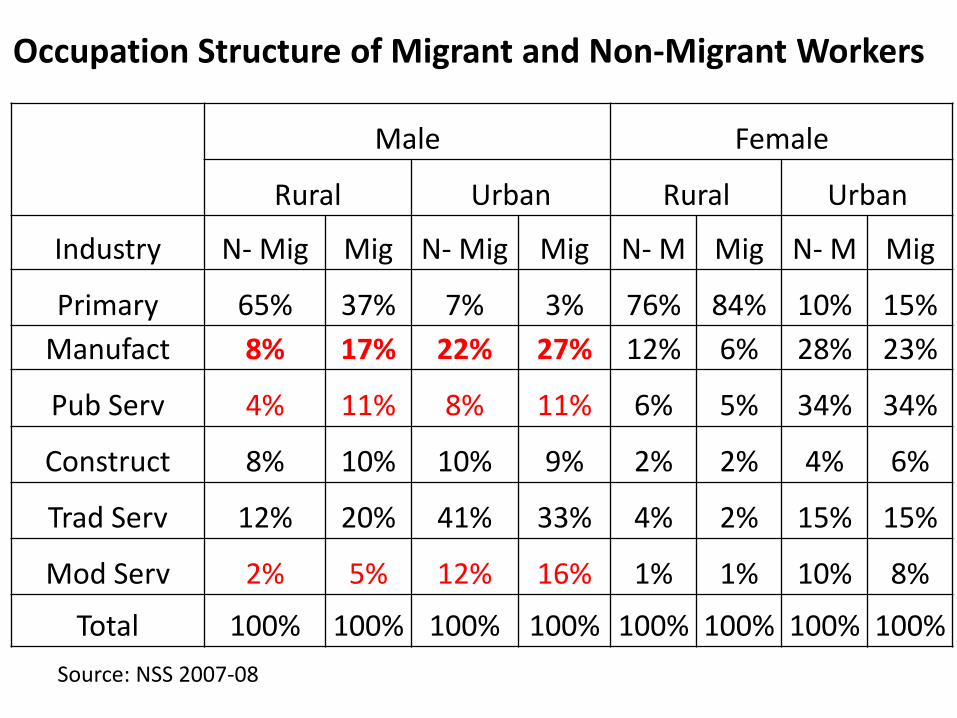
Male Female
Rural Urban Rural Urban
Industry N- Mig Mig N- Mig Mig N- M Mig N- M Mig
Primary 65% 37% 7% 3% 76% 84% 10% 15%
Manufact 8% 17% 22% 27% 12% 6% 28% 23%
Pub Serv 4% 11% 8% 11% 6% 5% 34% 34%
Construct 8% 10% 10% 9% 2% 2% 4% 6%
Trad Serv 12% 20% 41% 33% 4% 2% 15% 15%
Mod Serv 2% 5% 12% 16% 1% 1% 10% 8%
Total 100% 100% 100% 100% 100% 100% 100% 100%
Occupation Structure of Migrant and Non-Migrant Workers
Source: NSS 2007-08

Percentage Distribution of Adult Male Migrants and Non-Migrants by Household Monthly Per Capita Expenditure
0 5 10 15 20
More than 1,446
1,040-1,446
849-1,040
727-849
642-727
573-642
511-573
451-511
378-451
Less/equal 378
More than 885
659-885
549-659
477-549
421-477
376-421
335-376
294-335
246-294
Less/equal 246
20
07
-20
08
19
99
-20
00
Rural
Non-migrants Migrants
0 10 20 30 40 50
More than 1,446
1,040 -1,446
849-1,040
727-849
642-727
573-642
511-573
451-511
378-451
Less/equal 378
More than 885
659-885
549-659
477-549
421-477
376-421
335-376
294-335
246-294
Less/equal 246
20
07
-20
08
19
99
-20
00
Urban
Non-migrants Migrants
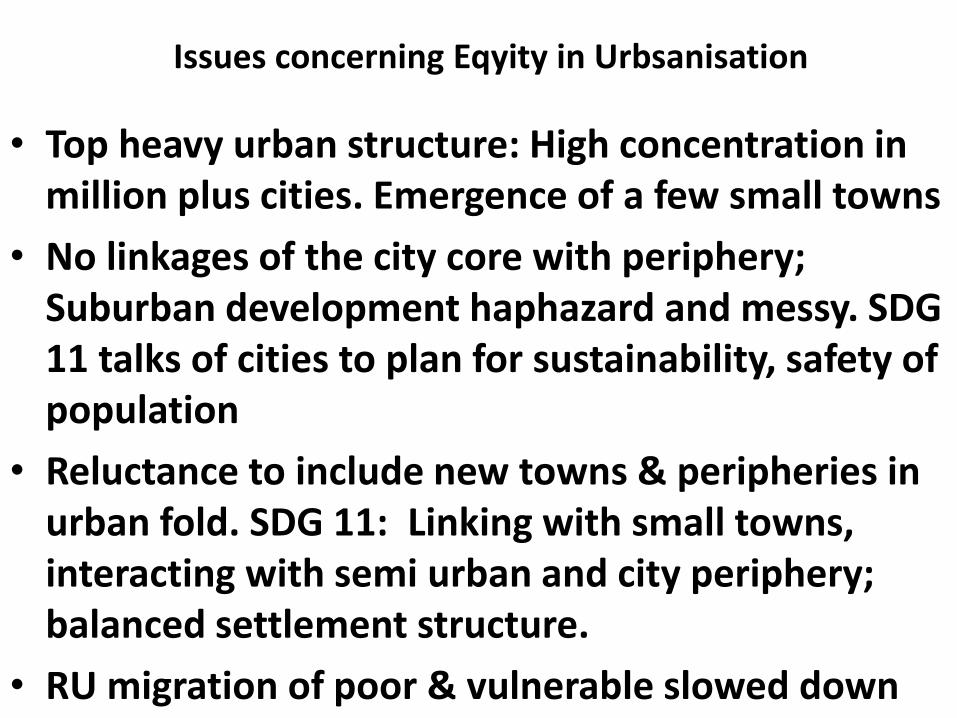
Issues concerning Eqyity in Urbsanisation
• Top heavy urban structure: High concentration in million plus cities. Emergence of a few small towns
• No linkages of the city core with periphery; Suburban development haphazard and messy. SDG 11 talks of cities to plan for sustainability, safety of population
• Reluctance to include new towns & peripheries in urban fold. SDG 11: Linking with small towns, interacting with semi urban and city periphery; balanced settlement structure.
• RU migration of poor & vulnerable slowed down

Crisis Managment
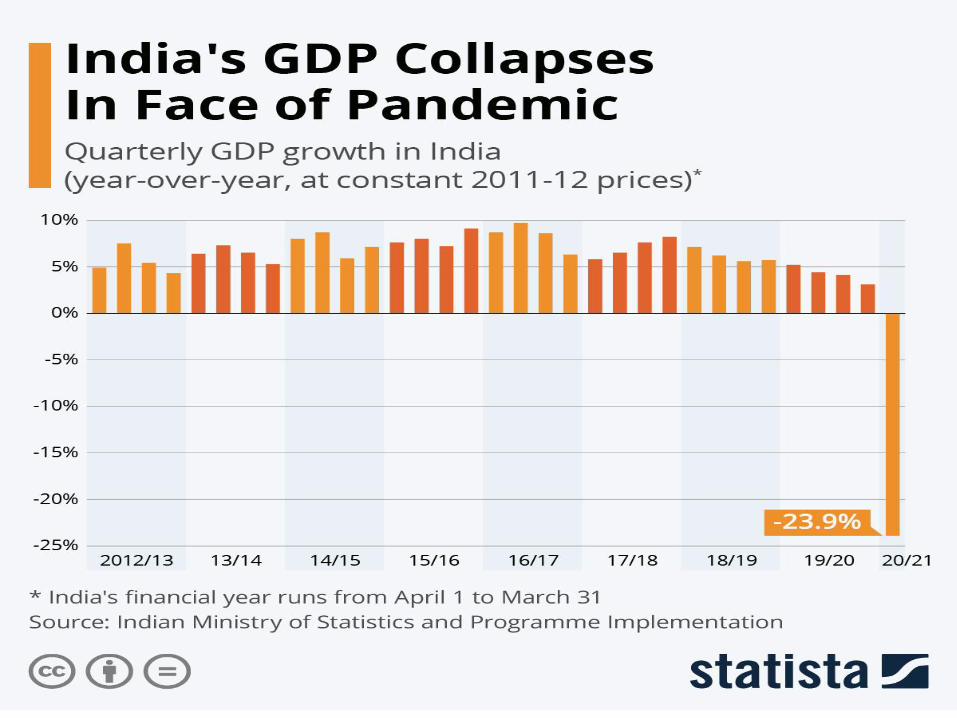
Pandemic, Premature Deindustrialisation and Crisis Management

Key Districts Accounting for Male Inter-State Out Migration from Rural To Urban Areas as per Census of 2001
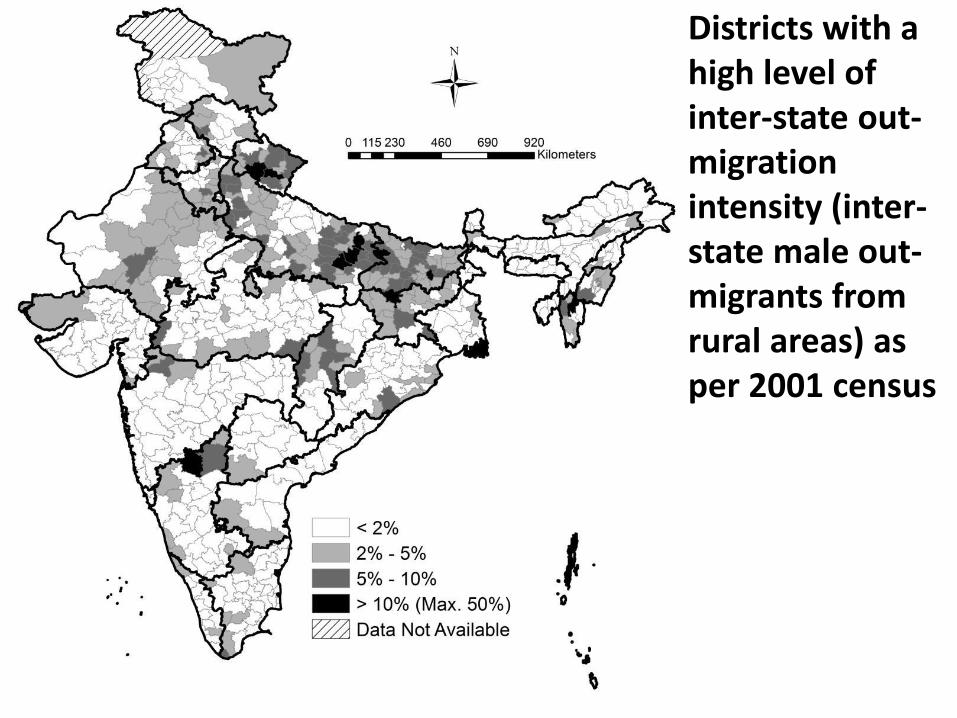
Districts with a high level of inter-state out-migration intensity (inter-state male out-migrants from rural areas) as per 2001 census

States/Uts Inter State International Total Inter state
International
Jammu and Kashmir 0.25 0.03 0.51 0.29 0.65
Himachal Pradesh 0.80 2.10 0.85 0.73 1.10
Punjab 5.24 6.38 2.77 4.59 5.05
Uttaranchal 2.97 0.76 1.12 2.30 1.50
Haryana 6.65 1.49 2.50 6.68 2.92
Delhi 13.01 2.50 1.92 11.67 3.24
Rajasthan 5.07 3.74 6.16 4.80 2.99
Uttar Pradesh 9.21 8.90 15.86 7.49 6.47
Bihar 1.57 0.64 5.33 2.05 7.26
Assam 0.31 0.27 1.17 0.91 2.01
Percentage Share of In-Migrants across States
NSS 2007-08 Census 2011
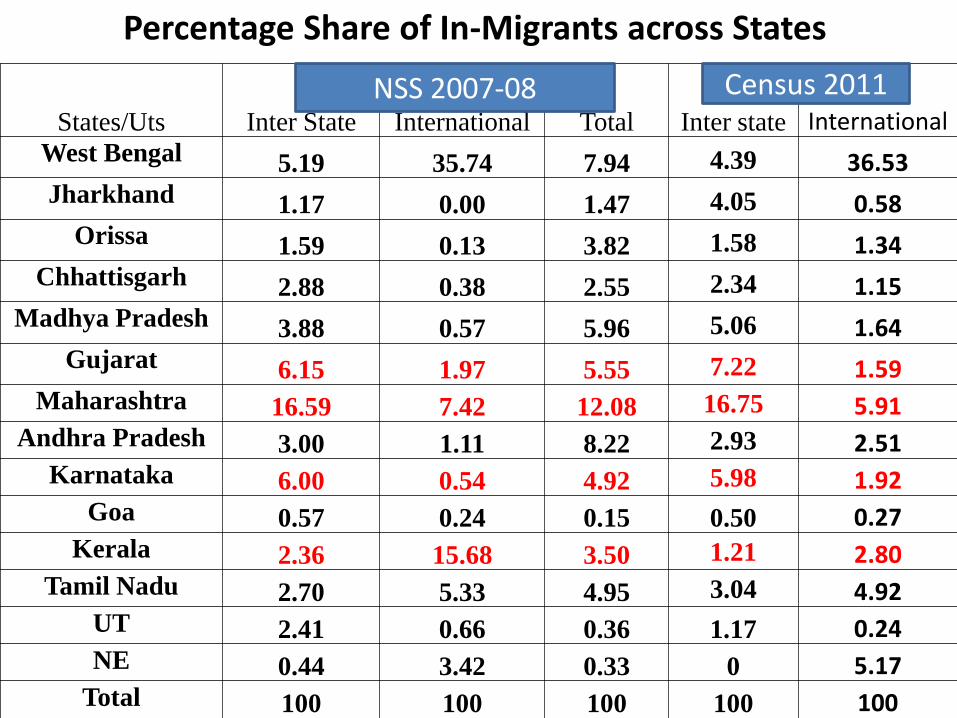
Percentage Share of In-Migrants across States
States/Uts Inter State International Total Inter state
International
West Bengal 5.19 35.74 7.94 4.39 36.53 Jharkhand 1.17 0.00 1.47 4.05 0.58
Orissa 1.59 0.13 3.82 1.58 1.34 Chhattisgarh 2.88 0.38 2.55 2.34 1.15
Madhya Pradesh 3.88 0.57 5.96 5.06 1.64 Gujarat 6.15 1.97 5.55 7.22 1.59
Maharashtra 16.59 7.42 12.08 16.75 5.91 Andhra Pradesh 3.00 1.11 8.22 2.93 2.51
Karnataka 6.00 0.54 4.92 5.98 1.92 Goa 0.57 0.24 0.15 0.50 0.27
Kerala 2.36 15.68 3.50 1.21 2.80 Tamil Nadu 2.70 5.33 4.95 3.04 4.92
UT 2.41 0.66 0.36 1.17 0.24 NE 0.44 3.42 0.33 0 5.17
Total 100 100 100 100 100
NSS 2007-08 Census 2011
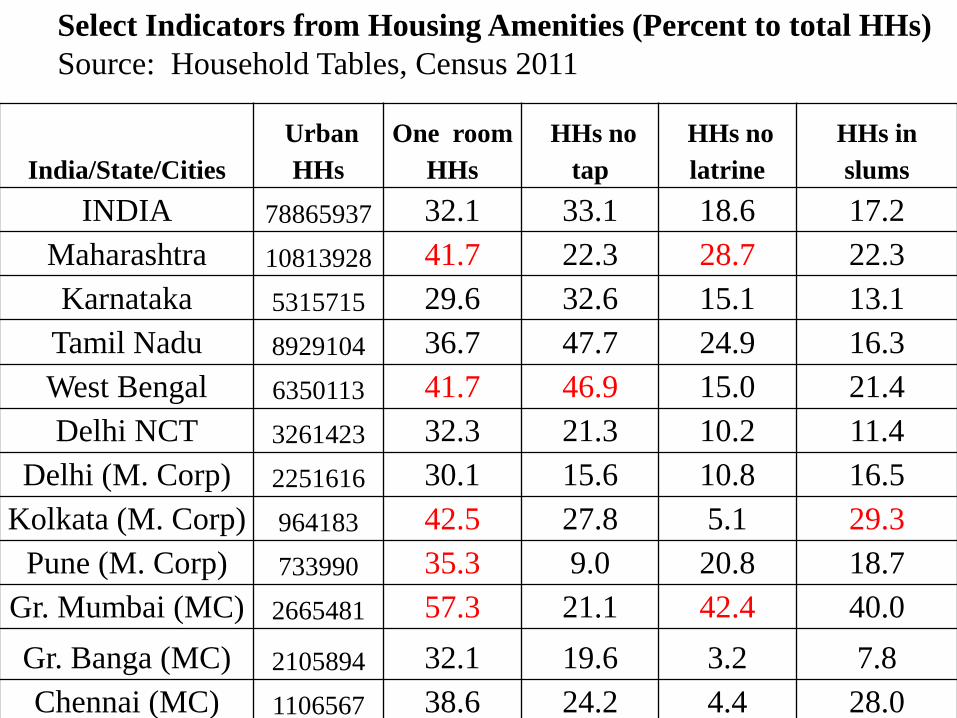
India/State/Cities
Urban
HHs
One room
HHs
HHs no
tap
HHs no
latrine
HHs in
slums
INDIA 78865937 32.1 33.1 18.6 17.2
Maharashtra 10813928 41.7 22.3 28.7 22.3
Karnataka 5315715 29.6 32.6 15.1 13.1
Tamil Nadu 8929104 36.7 47.7 24.9 16.3
West Bengal 6350113 41.7 46.9 15.0 21.4
Delhi NCT 3261423 32.3 21.3 10.2 11.4
Delhi (M. Corp) 2251616 30.1 15.6 10.8 16.5
Kolkata (M. Corp) 964183 42.5 27.8 5.1 29.3
Pune (M. Corp) 733990 35.3 9.0 20.8 18.7
Gr. Mumbai (MC) 2665481 57.3 21.1 42.4 40.0
Gr. Banga (MC) 2105894 32.1 19.6 3.2 7.8
Chennai (MC) 1106567 38.6 24.2 4.4 28.0
Select Indicators from Housing Amenities (Percent to total HHs)
Source: Household Tables, Census 2011
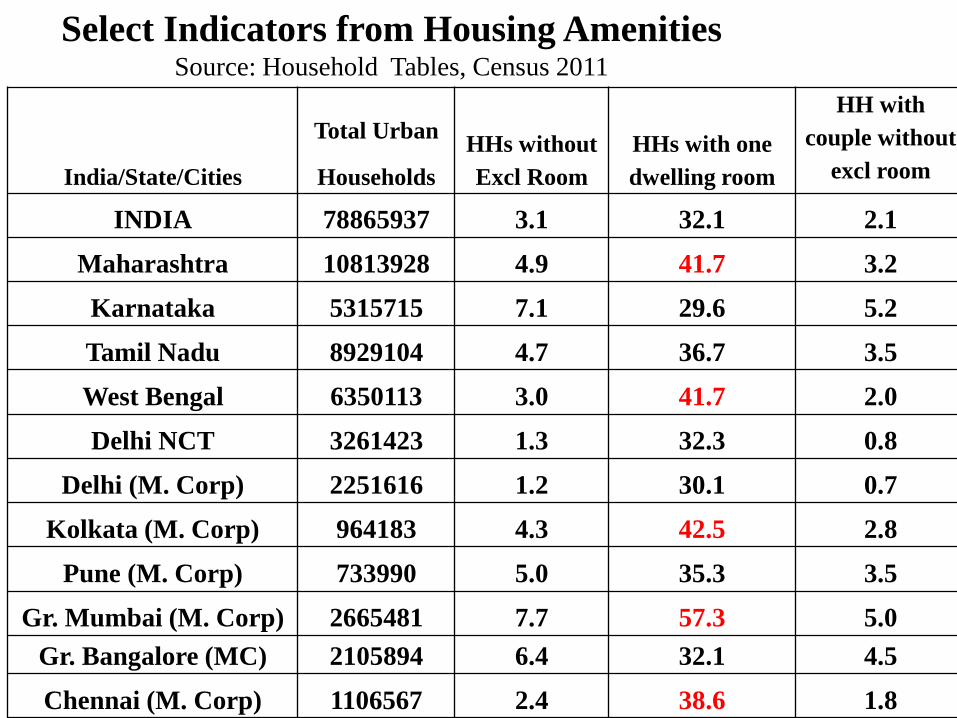
India/State/Cities
Total Urban
Households
HHs without
Excl Room
HHs with one
dwelling room
HH with
couple without
excl room
INDIA 78865937 3.1 32.1 2.1
Maharashtra 10813928 4.9 41.7 3.2
Karnataka 5315715 7.1 29.6 5.2
Tamil Nadu 8929104 4.7 36.7 3.5
West Bengal 6350113 3.0 41.7 2.0
Delhi NCT 3261423 1.3 32.3 0.8
Delhi (M. Corp) 2251616 1.2 30.1 0.7
Kolkata (M. Corp) 964183 4.3 42.5 2.8
Pune (M. Corp) 733990 5.0 35.3 3.5
Gr. Mumbai (M. Corp) 2665481 7.7 57.3 5.0
Gr. Bangalore (MC) 2105894 6.4 32.1 4.5
Chennai (M. Corp) 1106567 2.4 38.6 1.8
Select Indicators from Housing Amenities Source: Household Tables, Census 2011

21 COFACE COUNTRY RISK CONFERENCE 2013
Source: Coronavirus Resource Center, John Hopkins University &
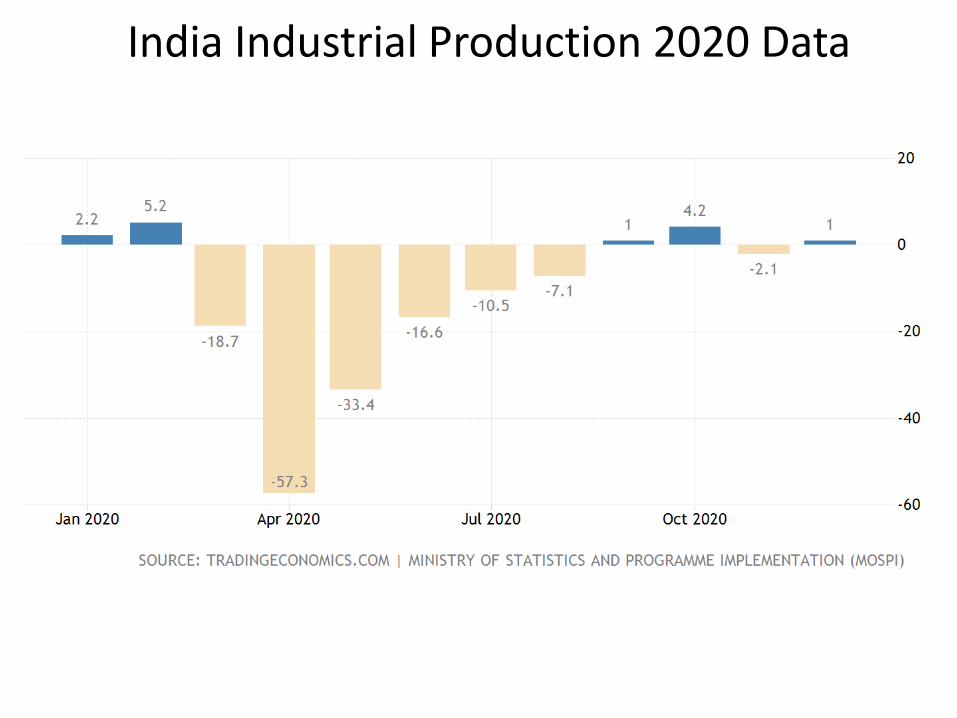
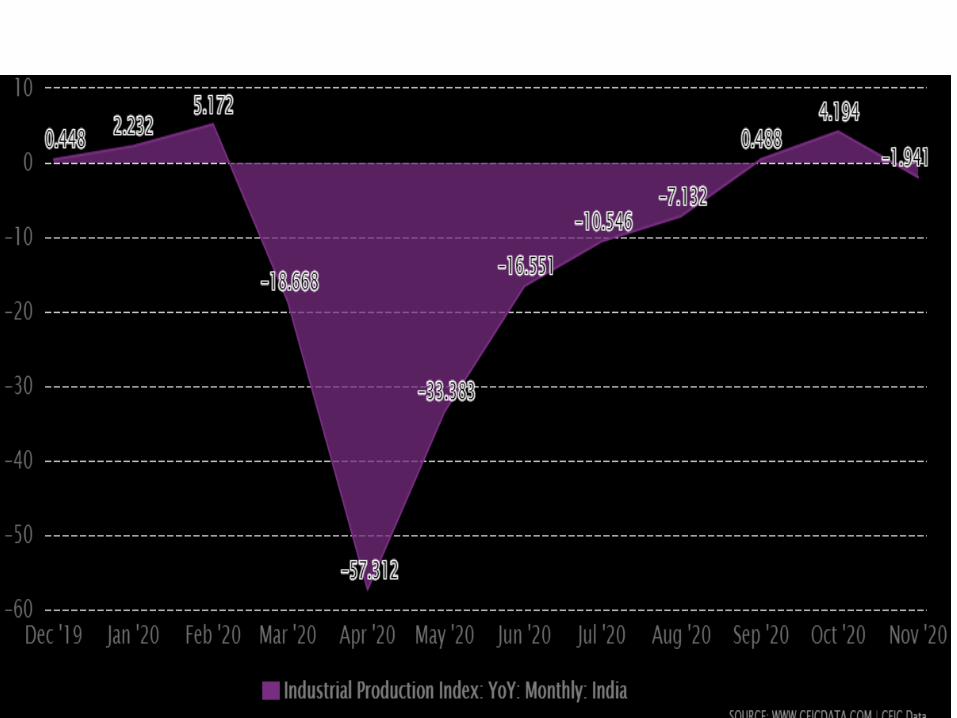
India Industrial Production 2020 Data
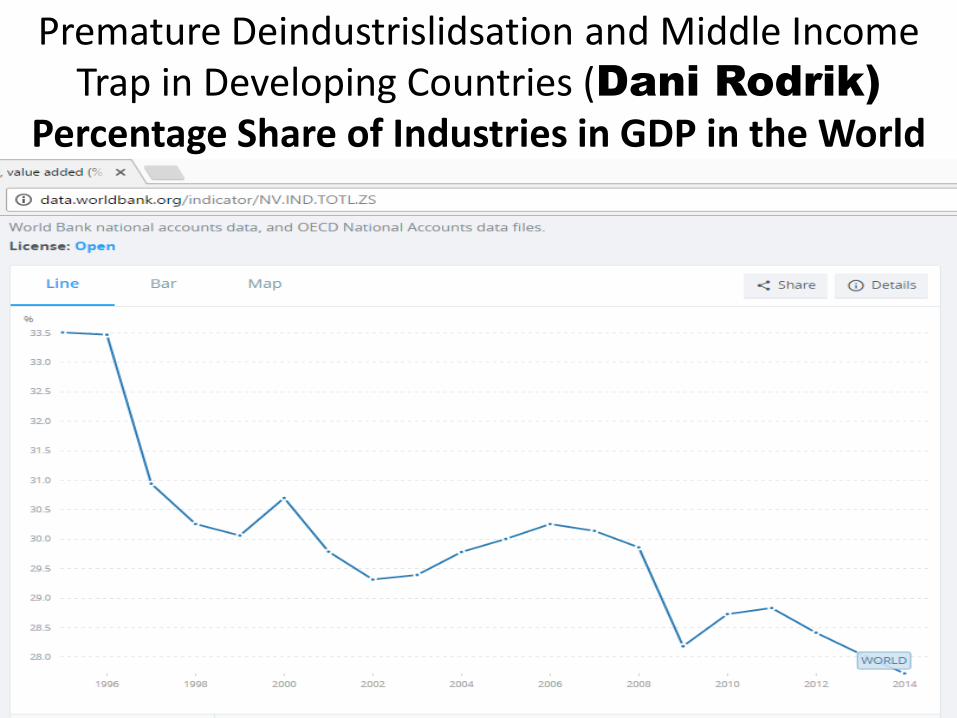
Premature Deindustrislidsation and Middle Income Trap in Developing Countries (Dani Rodrik)
Percentage Share of Industries in GDP in the World
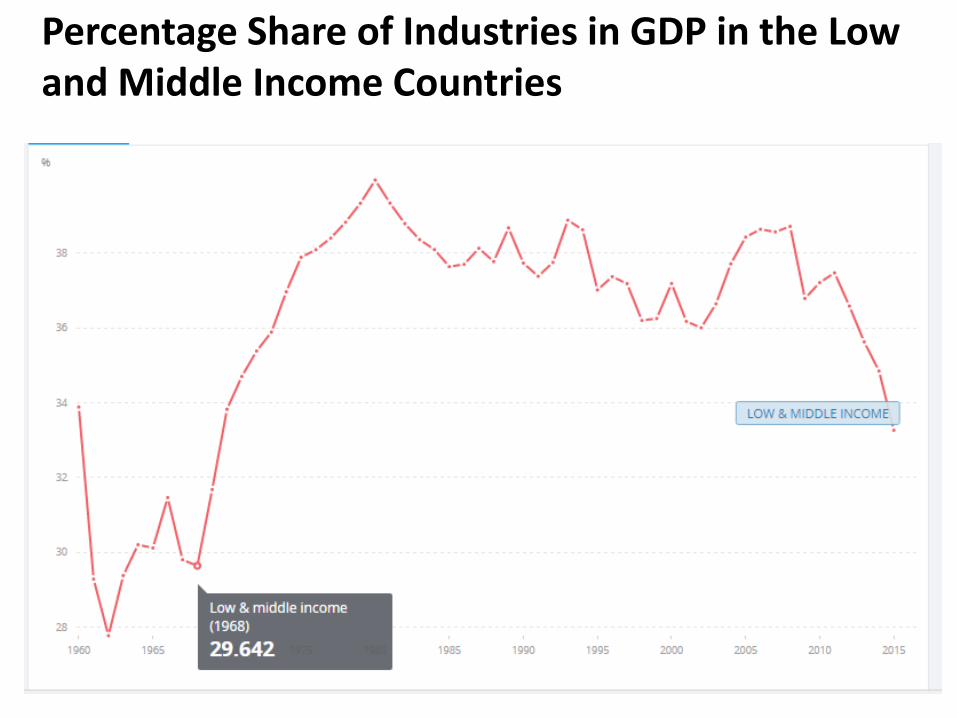
Percentage Share of Industries in GDP in the Low and Middle Income Countries

Percentage Share of Industries in GDP in China

Percentage Share of Industries in GDP in India

0
5
10
15
20
25
30
35
BangladeshIndiaSri LankaPakistan
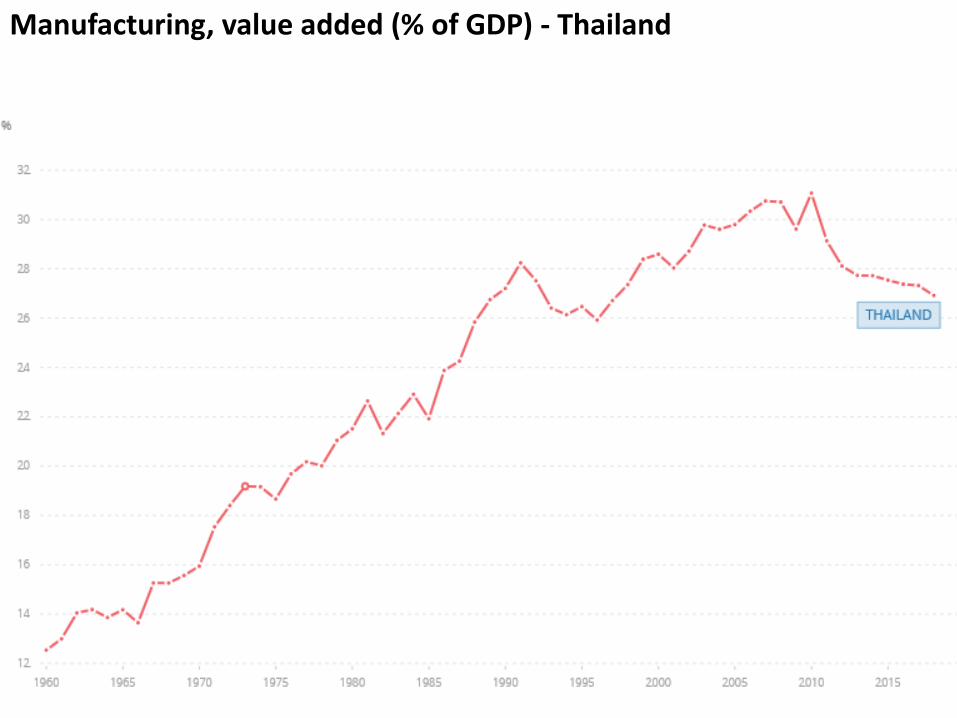
Manufacturing, value added (% of GDP) - Thailand
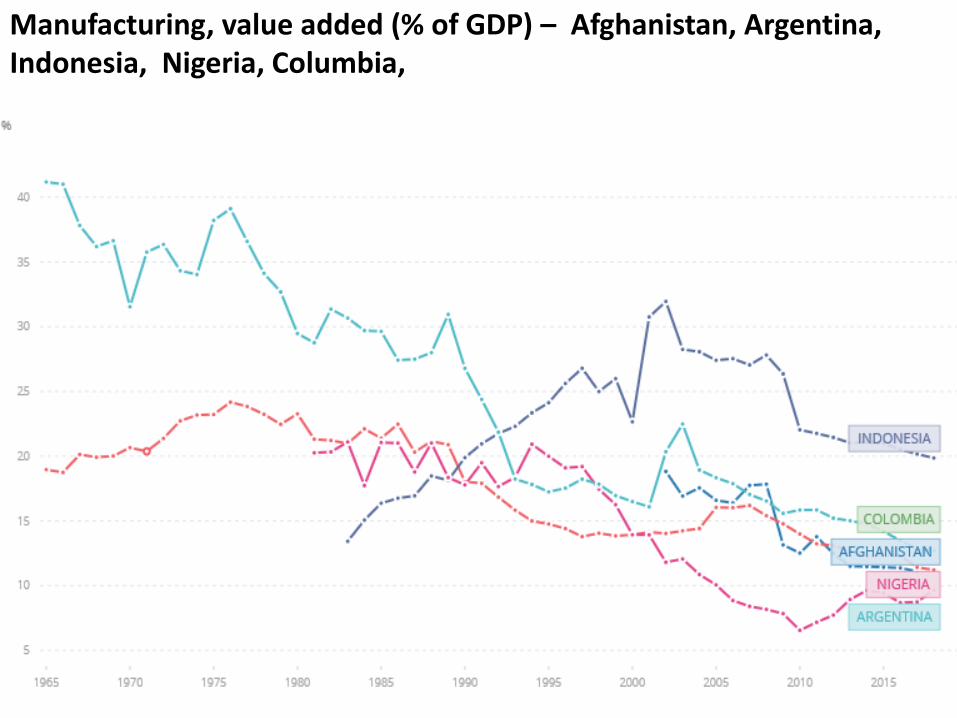
Manufacturing, value added (% of GDP) – Afghanistan, Argentina, Indonesia, Nigeria, Columbia,
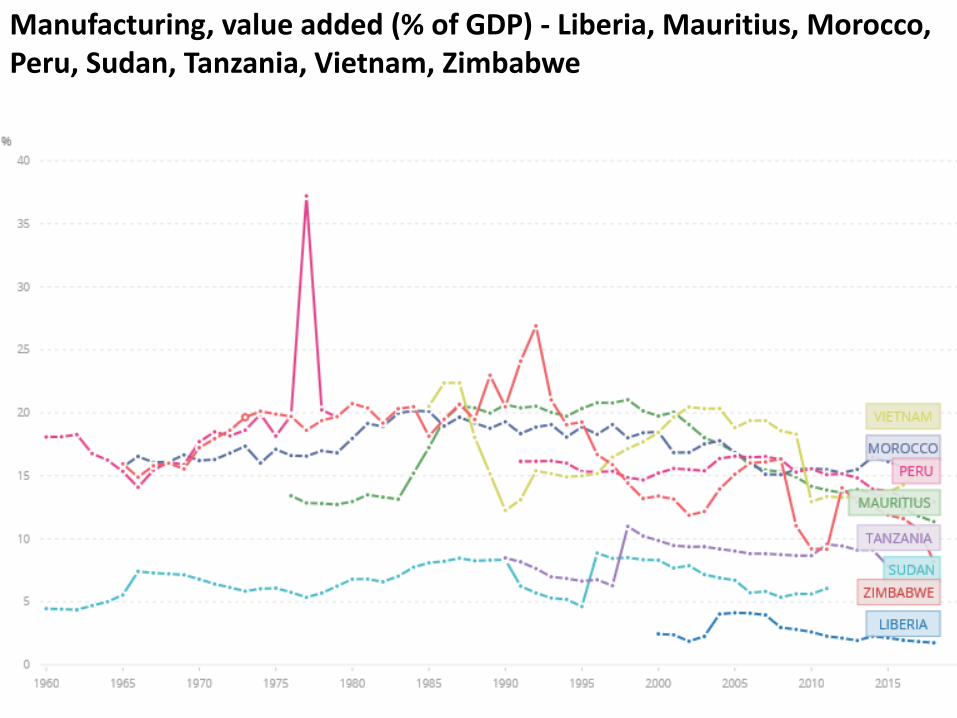
Manufacturing, value added (% of GDP) - Liberia, Mauritius, Morocco, Peru, Sudan, Tanzania, Vietnam, Zimbabwe

Restrictions on Interstate Movement
• AP, TN and Karnataka have some law, ordinance or admn. orders to reserve jobs in certain categories for the locals or language proficiency in public sector; recomended also for pvt sector.
• Maharashtra and Gujarat having reservation for locals in public sector units
• Rajasthan, Madhya Pradesh West Bengal, Goa etc. are considering reservation at least in state sector
All these are against the Article 16 of the Constitution and the spirit of Inter-state migrant
workmen Act, 1979
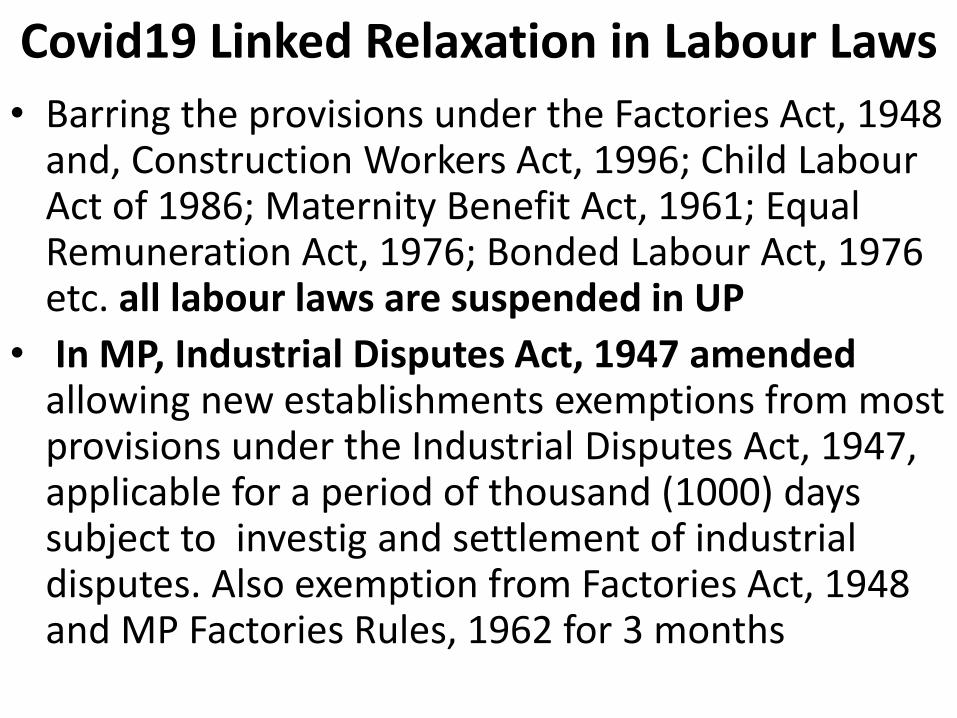
Covid19 Linked Relaxation in Labour Laws
• Barring the provisions under the Factories Act, 1948 and, Construction Workers Act, 1996; Child Labour Act of 1986; Maternity Benefit Act, 1961; Equal Remuneration Act, 1976; Bonded Labour Act, 1976 etc. all labour laws are suspended in UP
• In MP, Industrial Disputes Act, 1947 amended allowing new establishments exemptions from most provisions under the Industrial Disputes Act, 1947, applicable for a period of thousand (1000) days subject to investig and settlement of industrial disputes. Also exemption from Factories Act, 1948 and MP Factories Rules, 1962 for 3 months
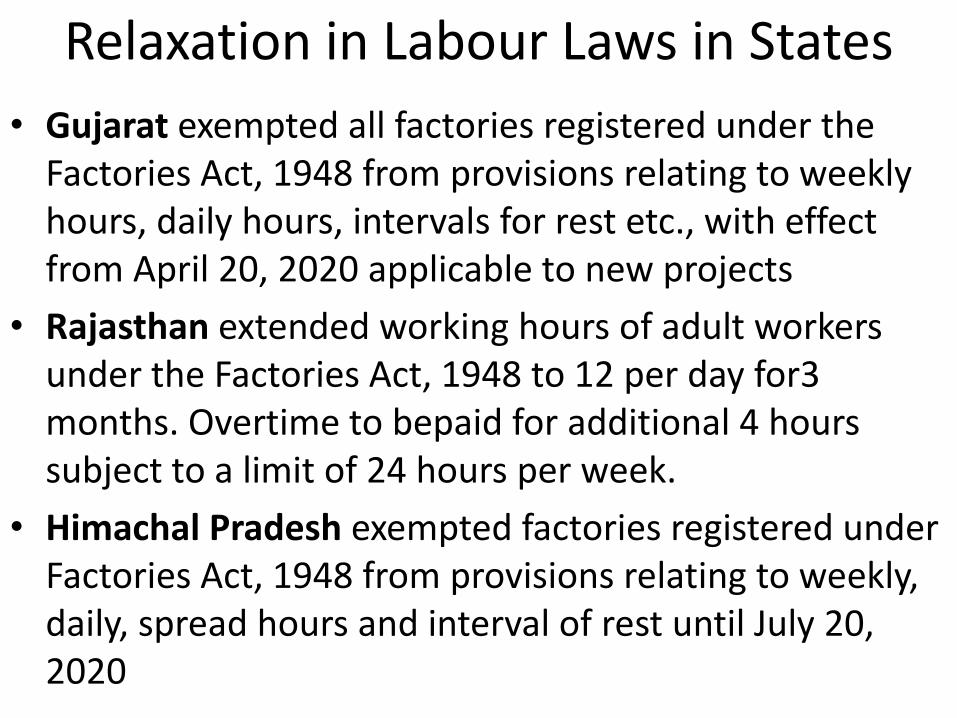
Relaxation in Labour Laws in States
• Gujarat exempted all factories registered under the Factories Act, 1948 from provisions relating to weekly hours, daily hours, intervals for rest etc., with effect from April 20, 2020 applicable to new projects
• Rajasthan extended working hours of adult workers under the Factories Act, 1948 to 12 per day for3 months. Overtime to bepaid for additional 4 hours subject to a limit of 24 hours per week.
• Himachal Pradesh exempted factories registered under Factories Act, 1948 from provisions relating to weekly, daily, spread hours and interval of rest until July 20, 2020
• History repeats itself but it can be transcended through foresight and planning. We should not be walking down this dangerous path.
• Revisit the modifications in Law by Dec 2020

Issues of Resilience

Bunker fuels are used for international transport is 3.1% of global emissions. Statistical differences between the global estimates and sum of national totals are 1.2% of global emissions.
Source: CDIAC; Le Quéré et al 2016; Global Carbon Budget 2016

Europe Africa Less
Developed
Countries
World
Average
Develope
d
Countries
Asia South
Central
Asia
India
Percentage of Population in Cities with Population
over 5 million to Total Urban Population
7.5 9 15 15.5 16 18 23 23.5
Implications of top heavy urban structure: high infrastructural cost, energy consumption, regional disparity and threat to sustainable development.

Proportion of urban population in different size categories,
1901–2001
0%
25%
50%
75%
100%
1901 1911 1921 1931 1941 1951 1961 1971 1981 1991 2001 2011
Class I Class II Class III Class IV Class V Class VI

0%
10%
20%
30%
40%
50%
60%
70%
80%
90%
100%
1901 1911 1921 1931 1941 1951 1961 1971 1981 1991 2001 2011
Percentage of Urban Population in West Bengal in
Different Size Classes 1901- 2011
VI V
IV III
II I
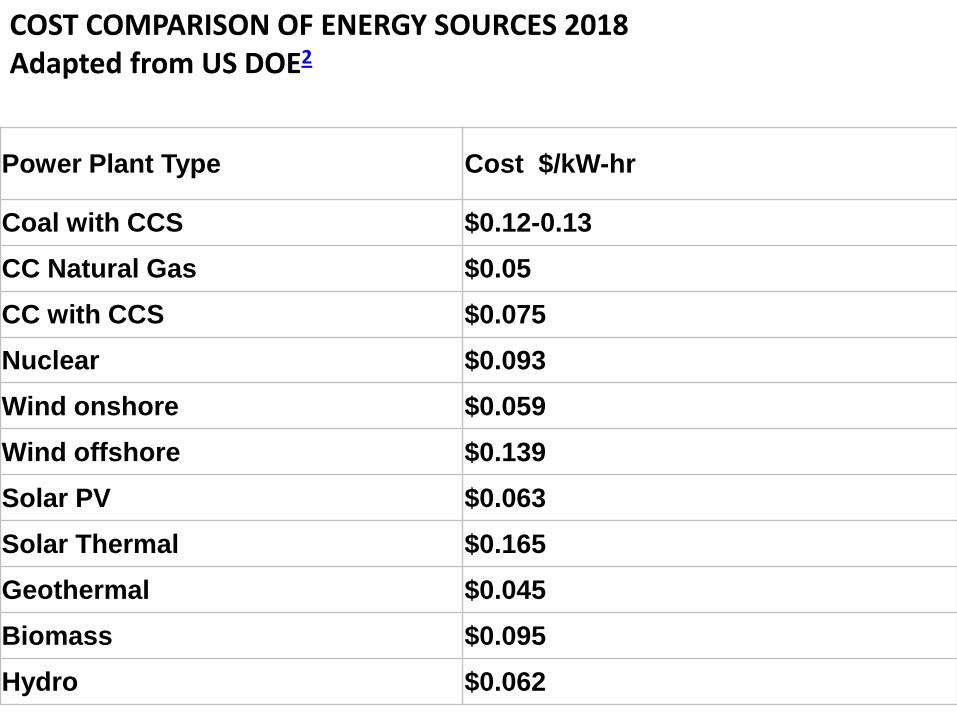
Power Plant Type Cost $/kW-hr
Coal with CCS $0.12-0.13
CC Natural Gas $0.05
CC with CCS $0.075
Nuclear $0.093
Wind onshore $0.059
Wind offshore $0.139
Solar PV $0.063
Solar Thermal $0.165
Geothermal $0.045
Biomass $0.095
Hydro $0.062
COST COMPARISON OF ENERGY SOURCES 2018 Adapted from US DOE2
The End