u.s. agency for international development bureau of ... food and nutrition technical assistance iii...
TRANSCRIPT

U.S. Agency for International Development
Bureau of Democracy, Conflict, and Humanitarian Assistance
Office of Food for Peace
Fiscal Year 2017 Annual Results Report Guidance for
Development Awards

2 |Page updated September 2017
LIST OF ACRONYMS ADS Automated Directives System
AOR Agreement Officer’s Representative
ARR Annual Results Report
CDF Community Development Funds
CRM Climate Risk Management
DEC Development Experience Clearinghouse
DIP Detailed Implementation Plan
DNA Disaggregates Not Available
DQA Data Quality Assessment
EMMP Environmental Mitigation and Monitoring Plan
FANTA Food and Nutrition Technical Assistance III Project
FFP Office of Food for Peace
FFPMIS Food for Peace Management Information System
FFPIB Food for Peace Information Bulletin
FFW Food for Work
FTF Feed the Future Presidential Initiative
FY Fiscal year (October 1 – September 30)
GPRAMA Government Performance and Results Act Modernization Act of 2010
HDDS Household Dietary Diversity Score
IDA International Disaster Assistance
IDP Internally Displaced Person
IEE Initial Environmental Examination
IPTT Indicator Performance Tracking Table
ITSH Internal Transportation, Storage, and Handling
IR Intermediate result
LOA Life of Award (same as Life of Program in FFPMIS until updated)
LRP Local and/or regional procurement
MT Metric Ton
MTZ Monetization
NGO Non-governmental Organization
OCO Overseas Contingency Operations
3 |Page updated September 2017
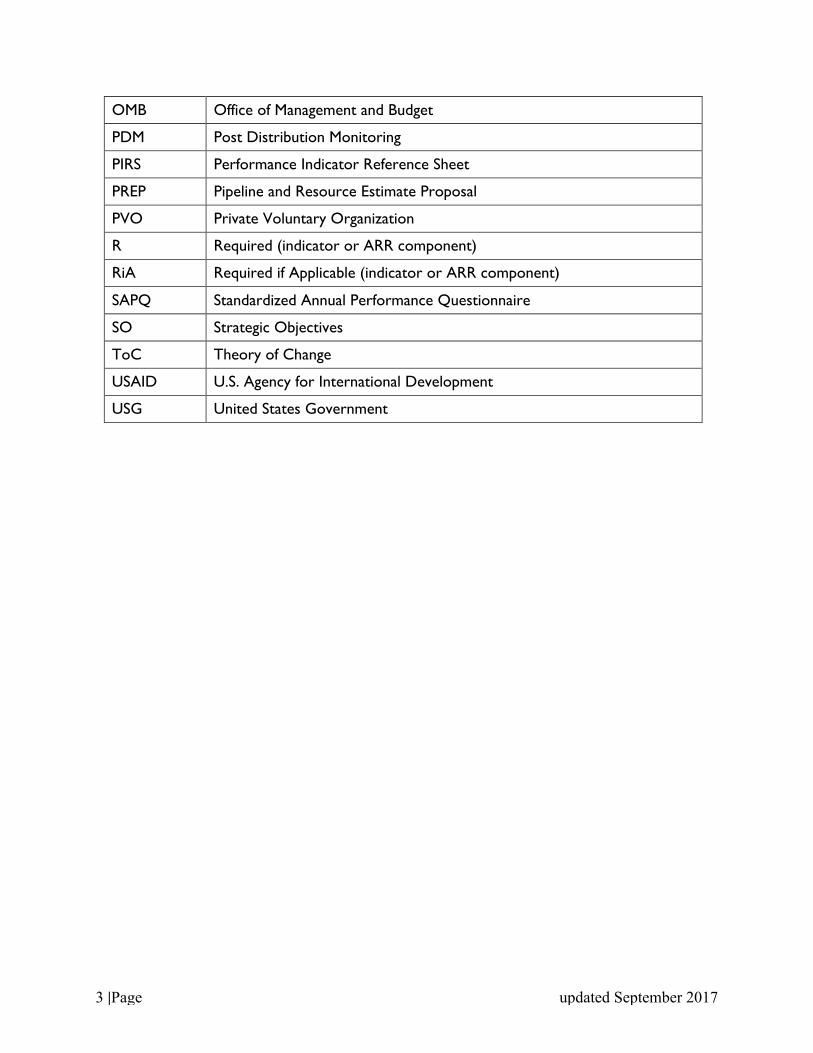
OMB Office of Management and Budget
PDM Post Distribution Monitoring
PIRS Performance Indicator Reference Sheet
PREP Pipeline and Resource Estimate Proposal
PVO Private Voluntary Organization
R Required (indicator or ARR component)
RiA Required if Applicable (indicator or ARR component)
SAPQ Standardized Annual Performance Questionnaire
SO Strategic Objectives
ToC Theory of Change
USAID U.S. Agency for International Development
USG United States Government

4 |Page updated September 2017
Table of Contents I. Background Purpose and Applicability 5
II. Annual Results Report Format 7
III. Annual Results Report Requirements 8
IV. Annual Results Report Components 10
Uploads to FFPMIS 10
A. ARR Narrative 10
B. Success Stories 15
C. Indicator Performance Tracking Table (IPTT) 15
D. Indicator Data Source Descriptions 15
E. Baseline/Evaluation, Assessments and Study Reports 16
Google Form 16
F. Technical Sectors Survey 16
FFPMIS Data Entry 16
G. Unique and Direct Participant’s Table 16
H. Program Area/Element Information 16
I. Monetization and Cost Recovery Date 20
J. Standardized Annual Performance Questionnaire 20
K. Actuals Table 20
ANNEX A: Standardized Annual Performance Questionnaire (SAPQ) 22
ANNEX B: Definitions for ARR 28
ANNEX C: Success Story Writing 101 37
ANNEX D: Checklist on Integrating Gender in ARR 40
ANNEX E: Indicator Performance Tracking Table Checklist in ARR 42
ANNEX F: ARR Narrative Quality Review Checklist 43
ANNEX G: Checklist on Integrating Environment in ARR 46
ANNEX H: Reference Documents and Websites 48

5 |Page updated September 2017
I. Background, Purpose, and Applicability The Annual Results Report (ARR) is an annual reporting requirement for current and recently closed Office of Food for Peace (FFP) awards implemented by U.S. or non-U.S. non-governmental organizations (NGOs), including private voluntary organizations (PVOs)1. FFP awardees that receive funding from the Food for Peace Act (Title II), International Disaster Assistance (IDA) account, Overseas Contingency Operations (OCO) account, and/or Community Development Funds (CDF) are required to submit ARRs. These include development, emergency and international food relief partnership awards. ARRs assist FFP with: (1) understanding, assessing, and managing the performance of FFP awards at all levels; (2) meeting statutory requirements and management needs in compliance with the Government Performance and Results Act Modernization Act (GPRAMA) of 2010 and other external policies; and (3) providing information to relevant stakeholders, such as U.S. Agency for International Development (USAID) missions and/or regional offices, the United States Government (USG) Feed the Future (FTF) Presidential Initiative, U.S. Congress, Department of State’s Office of U.S. Foreign Assistance Resources, and Office of Management and Budget (OMB). NGO and PVO awardees are required to submit an ARR for each fiscal year (FY) during which activities were implemented, unless the award was signed in the last quarter (July 1- September 30) of the reporting FY. The ARR is required even if the activity began late, ended early in the FY having implemented few interventions, or achieved limited or no results. An ARR covers results realized from activities implemented only during the reporting FY. Note that the FY runs from October 1 through September 30. For the FY 2017 ARR, awardees should report on activities and results realized from October 1, 2016 through September 30, 2017. If activities were not implemented during the reporting FY, e.g., due to late in-kind commodity arrivals, awardees should discuss with the agreement officer’s representative (AOR) which components of the ARR for the FY should be submitted. Awardees are encouraged to coordinate with FFP throughout the award to ensure fulfillment of reporting requirements. Questions about these requirements should be directed to the AOR. As a reminder, awardees should be using lessons learned in the ARR to guide their Environmental Status Report, M&E Plan updates, and changes to the Indicator Performance Tracking Table (IPTT), which should be completed before the Pipeline and Resources Proposal estimate (PREP) is submitted. Recommendations that are based on the interpretation of ARR data should be incorporated as learning in the award, and formalized through the PREP. Awardees are required to submit the ARR through the Food for Peace Management Information System (FFPMIS). Note that FFP development awards are part of the FTF Initiative and indicator results are reported to FTF by FFP/Washington; awardees and/or USAID Missions should NOT report on this data directly to Feed the Future Monitoring System. NOTE: GPRAMA requires USG agencies to conduct a data quality assessment (DQA) for
1 To qualify as a PVO, organizations must be registered with USAID.

6 |Page updated September 2017
indicators that are reported externally. Indicator data submitted through the ARR are subject to a USAID Mission-conducted DQA. Although GPRAMA requires conducting a DQA sometime within the three years before submission of the indicator data, USAID Missions may choose to conduct DQAs more frequently if needed. USAID Mission-conducted DQAs are separate from awardee DQAs that also must be conducted to ensure data quality.
● For the FY 2017 ARR, the deadline is November 6, 2017 no later than 12:00 pm Eastern Standard Time.
● Awards that end prior to the end of the FY and prior to the release of any updated guidance, if applicable, should follow the previous year’s ARR guidance for reporting.
● Awardees must submit the award’s final ARR, including entry of the Standardized Annual Performance Questionnaire (SAPQ)2 in FFPMIS, by the above-stated due date for the reporting FY or within 90 days of the date of the award’s expiration, whichever comes first.
● Questions related to the ARR and SAPQ process may be directed to [email protected]. Questions specific to individual awards and performance should be directed to the AOR.
● Awardees are required to submit all ARR information through FFPMIS. FFPMIS Users’ Guides can be found on the FSN Network site. Questions or problems related to FFPMIS may be directed to the Help Desk at [email protected]. The Help Desk hours are Monday to Friday from 9 am to 5 pm EST/EDT.
● Awardees are required to upload all annual survey data collected during the reporting FY to the Development Data Library (DDL).
● Awardees are required to upload to both FFPMIS and the Development Experience Clearinghouse (DEC) all approved final reports from evaluation and research activities conducted during the reporting FY. Awardees must submit the reports even when these activities are conducted by third-party firms or submitted with the Pipeline and Resource Estimate Proposal (PREP). If final reports for evaluation and research activities are not finalized at the time of ARR submission, awardees should note this in the ARR narrative and request to modify the ARR at a later date in order to upload them to FFPMIS.
● Within approximately one week of submitting an ARR, awardees should receive an ARR submission completeness check. Assuming the submission is complete, awardees will receive comments from FFP within two weeks. Awardees should revise and resubmit all ARR components within two weeks of receipt of the comments.
● Once an ARR is submitted, FFPMIS does not automatically notify awardees when the submission status changes. Awardees must login to the site to see the current status of submission and/or check with the AOR to inquire whether the ARR has been approved.
● Awardees must submit the ARR to the DEC within 30 days of AOR approval. The submission should include ARR narrative, an exported PDF copy of the SAPQ results (for development awards), and a copy of the success stories and
2 The SAPQ allows Awardees to report indicator targets and disaggregated annual results.

7 |Page updated September 2017
lessons learned. For more information on DEC submission requirements, please refer to USAID ADS 540, the DEC page, and/or the AOR. When submitting the ARR to the DEC, awardees should do the following: o under Document Type, select “Annual Report;” o under Primary Subject, select “Food Aid Programs;” and o under Additional Information, include the following text: “Add the following
USAID Thesaurus Terms and Tags: Food for Peace Title II, Food Security, Food and Nutrition Security, Maternal Child Health Nutrition, Malnutrition, Child Nutrition, Maternal Nutrition, and Disadvantaged Groups.” ▪ Depending on the activities and interventions, awardees can also include
these thesaurus terms and tags to the DEC submission: Development Assistance, Maternal Child Feeding Programs, Sustainable Agriculture, Livelihoods, Family Planning, Orphan and Vulnerable Children, Sanitation, Hygiene, Gender, Humanitarian Assistance, Disaster Recovery, Disaster Relief and Response, Displaced Persons, Natural Resource Management, and Poverty Reduction.
o Upon submission of the ARR to the DEC, awardees are responsible for sending the link of the uploaded document(s) to the AOR.
II. Annual Results Report Format Awardees must submit all ARR information into FFPMIS as a package through both data entry and document upload (see Table I for more information). Documents that are uploaded to FFPMIS should be in a printer-friendly format. ARRs that are not submitted according to the standards requested in this guidance will not be accepted and resubmission will be flagged in the completeness check notification. Please adhere to the following formats and guidance:
● The cover page of the ARR must include the following table:
Awardee Name and Host Country
Award Number
Activity Name
Activity Start Date
Activity End Date
Submission Date (mm/dd/yyyy)
Reporting Fiscal Year FY 20XX
Awardee HQ Contact Name
Awardee HQ Contact Address
Awardee HQ Contact Telephone Number

8 |Page updated September 2017
Awardee HQ Contact Email Address
Host Country Office Contact Name
Host Country Office Contact Telephone Number
Host Country Office Contact Email Address ● The ARR narrative should be no more than 23 pages in length, excluding cover page,
list of acronyms, photos, and attachments. ● All documents must be written in English. ● The narrative should be prepared in Microsoft Word in 12-point, Gill Sans font with
one-inch margins, left justification, and a footer on each page with the page number, date of submission, award number, and food security activity name.
● Include an acronym list. ● Avoid using jargon and technical terms specific to the award. The audience of the
report includes staff from FFP, USAID Missions and Bureaus, USG agencies, and other stakeholders, who may not be familiar with the particular terms.
● Ensure that the report is reviewed through proper channels within the awardee’s organization for accurate content, flow and correct grammar.
● Spreadsheets should be prepared in Microsoft Excel in 10-point, Gills Sans font, with print areas set to 8.5 x 11 inch, letter-sized paper. Only the indicator performance tracking tables (IPTT) may be submitted on 8.5 x 14 inches, legal-sized paper.
● Data for the Monetization (MTZ) and Cost Recovery tables (if applicable), Unique and Direct Participants, Specialized Food Products, Resources by Program Area/Element, Actuals Table (if applicable), and SAPQ will be entered directly into FFPMIS.
III. Annual Results Report Requirements The bulk of the ARR narrative comprises the awardee’s analysis of the important successes and challenges in implementation during the reporting FY, and their overall influence on progress towards the award’s strategic objectives (SO). The analysis must be supported by data and evidence of award progress. It should include a reflection on lessons learned and how that learning is informing current/future interventions and approaches, for example, revising targets or desired changes to the PREP. The ARR should include a brief section on the Theory of Change (ToC). Based on the analysis of the annual performance indicator data, the awardees are requested to review the likelihood of achieving the desired outcomes. Note: it is possible for an awardee to achieve FY targets, but have annual monitoring show only a marginal achievement of the desired outcome. Achieving targets but not progressing as quickly towards the desired outcome could happen for a variety of reasons: the quality of implementation might be an issue (e.g., poor or insufficient training, etc.), and/or contextual factors might have influenced the intermediate outcomes negatively (e.g., drought, unavailable/inaccessible high quality inputs, etc.), and/or the conditions identified on the pathway
9 |Page updated September 2017
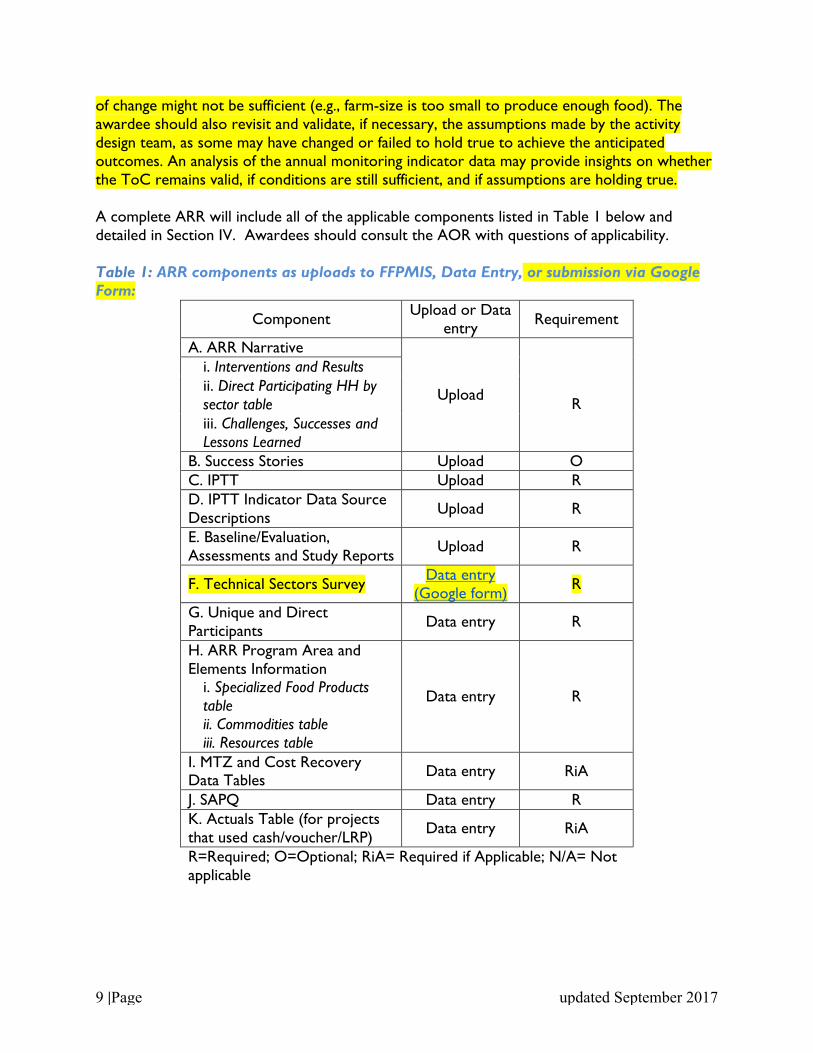
of change might not be sufficient (e.g., farm-size is too small to produce enough food). The awardee should also revisit and validate, if necessary, the assumptions made by the activity design team, as some may have changed or failed to hold true to achieve the anticipated outcomes. An analysis of the annual monitoring indicator data may provide insights on whether the ToC remains valid, if conditions are still sufficient, and if assumptions are holding true. A complete ARR will include all of the applicable components listed in Table 1 below and detailed in Section IV. Awardees should consult the AOR with questions of applicability. Table 1: ARR components as uploads to FFPMIS, Data Entry, or submission via Google Form:
Component Upload or Data entry Requirement
A. ARR Narrative
Upload
R
i. Interventions and Results ii. Direct Participating HH by sector table iii. Challenges, Successes and Lessons Learned
B. Success Stories Upload O C. IPTT Upload R D. IPTT Indicator Data Source Descriptions Upload R
E. Baseline/Evaluation, Assessments and Study Reports Upload R
F. Technical Sectors Survey Data entry (Google form) R
G. Unique and Direct Participants Data entry R
H. ARR Program Area and Elements Information
i. Specialized Food Products table ii. Commodities table iii. Resources table
Data entry R
I. MTZ and Cost Recovery Data Tables Data entry RiA
J. SAPQ Data entry R K. Actuals Table (for projects that used cash/voucher/LRP) Data entry RiA
R=Required; O=Optional; RiA= Required if Applicable; N/A= Not applicable

10 |Page updated September 2017
IV. Annual Results Report Components A complete ARR includes the timely submission of each component detailed below, provided in this order and with corresponding titles. Please include only the information requested. If any component is not relevant to the award, awardees should state that the section is not applicable (N/A) and explain in the ARR narrative. The ARR presents an award’s progress (or lack of progress) against the approved plan and targets during the reporting FY. The narrative should analyze and discuss the results as reported in the activity’s IPTT. Note: The ARR highlights interventions and progress during the reporting FY. While it replaces the fourth quarter quarterly report, it should present progress and results for the entire FY—not just the final quarter.
Uploads to FFPMIS
A. ARR Narrative i) Activity Interventions and Results The ARR is a performance reporting tool. Therefore, awardees must present and analyze the FY’s interventions and results against either plans/targets, or the annual plan approved in the PREP for the reporting FY.
While the SAPQ and IPTT allow awardees to quantitatively report against indicator targets and disaggregated annual results, the ARR narrative offers an analysis and interpretation of key data presented in the SAPQ, Actuals Table, and IPTT. Awardees should not overload the narrative with indicator results; the purpose of this section is to analyze and explain the activity’s progress over the past year using select indicators that help tell that story. Awardees should include a brief discussion on how these results affect the ToC and management of the award. More specifically:
● Organize the narrative by the components of the Results Framework (SO,
intermediate results (IR), and sub intermediate results (Sub IR)) or LogFrame (purpose, sub-purposes, intermediate outcomes, and outputs). Awards that are organized by Results Framework only (awarded before FY 2014) are not required to include a ToC; however, please use the example in 3a. below as a guide. For awards made during and after FY 2014, use the updated3 ToC as the basis for reporting.
● Use the IPTT and SAPQ to identify only the most relevant indicator actuals for
this reporting year to discuss successes/challenges to achieving the purpose and 3 The ToC is supposed to be revisited and revised annually. The awardee should submit the most updated (revised) version (likely different from the original, approved submission) with the ARR.

11 |Page updated September 2017
sub-purpose of the ToC. Based on the analysis of the SAPQ results, discuss the implications on the ToC and interpret the findings.
1. During the analysis, reference any sex-disaggregated results, making sure
to address any significant discrepancies in actuals across sexes, e.g., if significantly more women were reached than men (and vice versa), and discuss the implication on achieving purposes and sub-purposes.
2. Interpret and discuss the learning from the annual survey and/or routine monitoring, specifically, how such data will influence technical strategies, activities, underlying assumptions or the project’s ability to achieve key outputs, outcomes, where applicable.
3. Use the analysis or evidence to show specifically the level of progress towards achieving the results including gender dynamics, underlying assumptions, contextual factors or other key factors that led to the level of progress within the FY.
a. For example: in “x” award, there is Purpose 1.3, Diversification of
income sources in men and women increased. The ToC is “not only is it necessary that families increase their production for access to food, but also to increase their income to procure a variety of foods.” The hypothesis is that “when families increase their income sources, they are more likely to also increase diversification of and access to food.”
Using this example, awardees should consider the following
illustrative (not exhaustive) questions and present the analysis and conclusion in the ARR narratives.
What are the most relevant indicators in the IPTT/SAPQ within
Purpose 1.3 during the reporting year? Do the results demonstrate progress or lack of progress to achieving planned intermediate outcomes - and why? Have income sources increased or decreased and what happened to men and women’s participation as a result of the change? What contextual, underlying assumptions, programming changes, technical strategies or key interventions led to the changes? What does that imply about the technical approach, quality of the intervention, targeting, gender dynamics or other factors? During this year of the activity, is there evidence that the hypothesis is working or not? Is there a logical progression from outputs to outcomes? Based on all the above and any other evidence (quantitative or qualitative) including analysis of annual surveys, comparison against the last FY, participant feedback, what is the level of progress towards achieving the IR? Present the analysis and conclusion in the ARR narrative.
● Refer to Annex G on how to integrate environment into the narrative.

12 |Page updated September 2017
● Refer to Annex D on how to integrate gender into the narrative rather than discussing as a separate cross-cutting section. There should be an in-depth analysis of the effects of the activity on gender throughout the narrative. Make sure to explain any significant gender differences or gaps in the results being reported to ensure that related sex-disaggregated data for the most relevant indicators are analyzed and reported under the respective IR/sub-purpose.
● When applicable, reference any other data sources that show the level of
progress towards achieving results including analysis and conclusions from annual surveys, monitoring data analysis, recommendations from special studies, or other relevant studies that support data presented during the FY.
● Using the Direct Participating Households Receiving Multiple Interventions by
Sector (SO/Purpose) table, interpret the data collected in the table and the plan to improve greater integration of interventions. The interpretation may include a reference to the ToC and what differences are observed between households that are participating in a single sector interventions compared to multi-sectoral interventions. See page 13 for more information about how to fill in the table.
● Analyze and interpret the data reported in the Actuals Table. For example, an
awardee using cash and/or vouchers needs to report planned and actual transfers. When the planned and actuals are very different, some questions to consider are: what were the challenges faced, and how were they addressed? Were the transfers always on time? Why not? What was the extent of the delay? How did the delayed transfer affect the food security/welfare of the participating households? Did the transfer achieve intended objectives and intended benefits? For example, targeting women has an implicit objective, but experience shows that in many cases women do not get to decide or control the use of the transfer. Were there any problems redeeming vouchers, and what was the effect on the local market? In the case of local and/or regional procurement (LRP), how did it affect the market?
● Report on commodity, cash, and voucher management, internal and external
coordination, environmental risks and opportunities, monitoring and evaluation, and learning.
● Analyze and present results from market assessments and monitoring (source
and last mile markets). Discuss trends and potential programming impacts. In reporting price changes over time, comparisons should be made to any regular seasonal changes of prices. In the absence of robust pre-existing market information systems, awardees should utilize the most accurate, regular, and relevant prices available. Unexpected market impacts or disincentives to local production should be explained in the ARR, along with course corrections made.
● Describe how award management facilitated implementation, and discuss any
major challenges, including consortium management, that might have hindered

13 |Page updated September 2017
implementation during the reporting year. ● Report on new initiatives, innovations (e.g., approaches, methods, tools, and
processes), and collaborations with other stakeholders and briefly describe the implications, and challenges.
● When presenting or referencing any data that is expressed as a percentage
include the absolute number (i.e. 35 percent (70) of 200) in parenthesis. Development Food Security Activities Responding To Emergency Needs During the FY, if a development award implemented emergency interventions to respond to a shock, the awardee needs to describe the interventions and outputs. In this section, the ARR should also indicate whether the current resources were used or new emergency funding was received. In addition, the section should also describe the overall effect on planned development interventions as a result of the shock. ii) Direct Participating Households Receiving Multiple Interventions by
Sector (SO/Purpose)
Often the ToC suggests that if a household increases its capacity to access food (either through income, production or a combination) and acquires improved knowledge, practices, and behaviors on health, nutrition, and Water, Sanitation, and Hygiene (WASH), and also increases its capacity to manage shocks, the household will likely achieve food security. Evidence from past FFP awards show that households that participated in multiple interventions from different sectors achieved greater successes in terms of food security outcome indicators than those households who participated in interventions from only one sector (SO/P). FFP requests that awardees analyze and report participation data by sector to assess how well the interventions are integrated at the participating household level. In cases where integration was not planned or feasible, please state this briefly in the narrative. Note that this is different from the analysis of unique and direct participants. Please report the data in a table as formatted in Table 2 below.
Table 2: Number of Direct Participating Households Receiving Multiple Interventions by Sector (SO/Purpose) Column A B C D E F G H I
Total unique direct participating households
SO/P 1 only
SO/P 1 & 2
SO/P 2 only
SO/P 2 & 3
SO/P 3 only
SO/P 1 & 3
SO/P 1, 2, 3 Etc.
(B+C+D+E+ F+G+H+I…)
HHs If there are more than three purposes, add columns to report data for additional purposes and
14 |Page updated September 2017
participation. Describe how the awardees count direct unique participants for each SO/P and multiple SO/Ps.
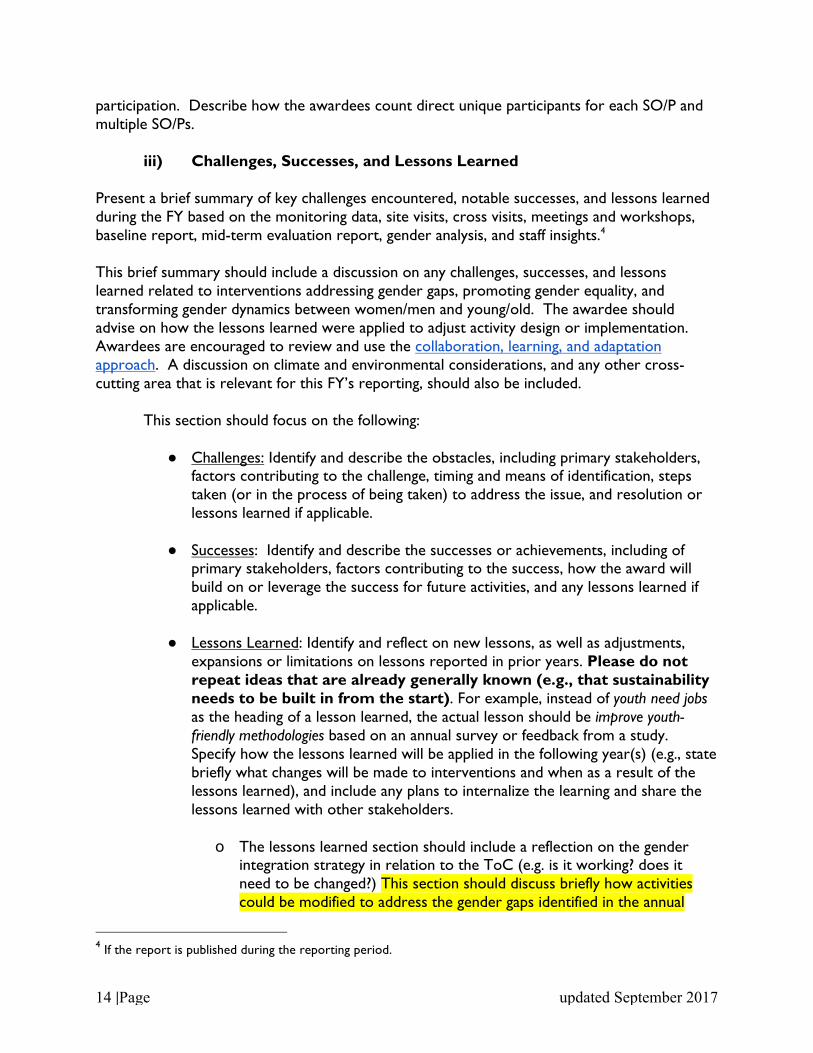
iii) Challenges, Successes, and Lessons Learned Present a brief summary of key challenges encountered, notable successes, and lessons learned during the FY based on the monitoring data, site visits, cross visits, meetings and workshops, baseline report, mid-term evaluation report, gender analysis, and staff insights.4 This brief summary should include a discussion on any challenges, successes, and lessons learned related to interventions addressing gender gaps, promoting gender equality, and transforming gender dynamics between women/men and young/old. The awardee should advise on how the lessons learned were applied to adjust activity design or implementation. Awardees are encouraged to review and use the collaboration, learning, and adaptation approach. A discussion on climate and environmental considerations, and any other cross-cutting area that is relevant for this FY’s reporting, should also be included.
This section should focus on the following: ● Challenges: Identify and describe the obstacles, including primary stakeholders,
factors contributing to the challenge, timing and means of identification, steps taken (or in the process of being taken) to address the issue, and resolution or lessons learned if applicable.
● Successes: Identify and describe the successes or achievements, including of
primary stakeholders, factors contributing to the success, how the award will build on or leverage the success for future activities, and any lessons learned if applicable.
● Lessons Learned: Identify and reflect on new lessons, as well as adjustments,
expansions or limitations on lessons reported in prior years. Please do not repeat ideas that are already generally known (e.g., that sustainability needs to be built in from the start). For example, instead of youth need jobs as the heading of a lesson learned, the actual lesson should be improve youth-friendly methodologies based on an annual survey or feedback from a study. Specify how the lessons learned will be applied in the following year(s) (e.g., state briefly what changes will be made to interventions and when as a result of the lessons learned), and include any plans to internalize the learning and share the lessons learned with other stakeholders.
o The lessons learned section should include a reflection on the gender
integration strategy in relation to the ToC (e.g. is it working? does it need to be changed?) This section should discuss briefly how activities could be modified to address the gender gaps identified in the annual
4 If the report is published during the reporting period.

15 |Page updated September 2017
monitoring results. The same should be done with the sustainability strategy using Sustaining Development: A Synthesis of Results from a Four-Country Study of Sustainability and Exit Strategies among Development Food Assistance Projects to frame the discussion on the anticipated outcomes and necessary conditions - including changes to the award - to achieve sustainability. Refer to the checklist in Annex D for further guidance.
o The ARR for development awards should also discuss the activities related to environment safeguards in relation to the ToC and discuss briefly how interventions could be modified to avoid harm to natural resources (i.e., introduction of invasive species), and/or seek strategies to address the evolving extreme weather risks identified in the annual monitoring results. Reporting should align with the framework of the Environmental Mitigation and Monitoring Plan (EMMP), as described in FFP’s guidance on Monitoring, Evaluation, and Reporting for Development Food Security Activities5. Refer to the Environment checklist in Annex G for further guidance.
B. Success Stories
As per USG guidance, success stories are optional; however, they are very valuable in telling FFP’s story. Awardees are encouraged to provide this input for public diplomacy and outreach purposes. Refer to the Success Stories guidance in Annex C for further information.
C. Indicator Performance Tracking Table
Development awardees should include a complete IPTT with indicator results added for the reporting FY. The IPTT must include targets for the next three future FYs. For example, an IPTT submitted for FY 2017 would include targets for FY 2018, 2019, and 2020. (Projects with fewer than three years remaining in their awards should include targets for the remaining FYs and LOA.) The IPTT must include results and targets for each disaggregated indicator by category. Please ensure there are no discrepancies in the data reported across the narrative, IPTT and SAPQ. Refer to the IPTT checklist in Annex E for further guidance.
D. IPTT Indicator Data Source Descriptions
Awardees should discuss data collection methods (routine monitoring or annual surveys), timing of collection, data processing and data analysis. If using a survey, the sampling strategy and sample weighting process must be presented and explained. For indicators that are
5 Section 2.4: Performance Indicator Reference Sheets, page 36.

16 |Page updated September 2017
presented as percentages, the number of project participants, sites, and/or households sampled for each indicator (i.e., the denominator) should be presented. For disaggregated indicators, the number in each category should be shown.
E. Baseline/Evaluation, Assessments and Study Reports
Awardees must submit the final reports, with all annexes, for any assessment, study, evaluation, or research conducted by the awardee or commissioned by the awardee to a third-party firm during the reporting FY. Examples include, but are not limited to, baseline surveys, mid-term and final evaluations, gender analyses, formative research, and case studies. If the reports are not finalized and available at the time of ARR submission, awardees should note in the ARR narrative that these activities were conducted during the FY and, at a later date, request to modify the ARR to upload them to FFPMIS.
Google Form F. Technical Sectors Survey
The Technical Sectors Survey must be completed using the following link: https://goo.gl/forms/nheK6capFAQijK6v1. Awardees must indicate any technical sector and sub-sector in which their awards implemented significant activities during the reporting FY. If the award did not implement activities in a particular sector or sub-sector during the FY, the question response should be left blank. Note that this is a tracking tool for FFP and that more boxes with “yes” responses are not better or even more desirable. Partners are encouraged to check a box only if it represents a significant focus this reporting year.
FFPMIS Data Entry G. Unique and Direct Participants
For the Unique and Direct Participants6 table, awardees should report on the number of planned and reached individuals—disaggregated by sex and age—who directly participated during the reporting FY, as well as the number of planned participants for the next three FYs. This is the link for the Unique and Direct Participant table spreadsheet. This spreadsheet is a tool designed to aid awardees in gathering data from the field. FFP does not require this spreadsheet be uploaded with the ARR.
H. ARR Program Area/Element Information
The Department of State and USAID jointly developed common definitions to describe and
6 Unique and direct participants refer to individuals that directly participate and benefit from the award. One participant may benefit from multiple interventions or from more than one program area/element, however when reporting on the total number of unique and direct project participants, this individual should only be counted once.

17 |Page updated September 2017
account for foreign assistance programs7. Prior to entering data in FFPMIS, awardees should become familiar with program area/element definitions (provided below) and select those most appropriate to their awards. The ARR Program Area/Element section consists of three tables:
1. Specialized Food Products Table 2. Commodities Table 3. Resources by Program Area/Element
• If an Awardee programmed Specialized Food Products, it will attribute corresponding resources to the program area/element “Nutrition.” Awardees must pair specialized food products with planned/reached beneficiaries, by sex, age and by commodity type in the Specialized Food Products table.
• In the Commodity table, for each program area/element, awardees must report
commodities distributed (in metric tons (MT)) by commodity type.
• For the Resources by Program Area/Element table, awardees must assign resources to all relevant program areas/elements in which the award implemented interventions. The following funding categories should be used: internal transportation, storage, and handling (ITSH), CDF, cost share; and other (Section 202(e) resources should go in this category). Note: If a development award received and used emergency resources from FFP to provide support for consumption smoothing or to cope with an emergency, the resources and participants should be reported under “(Emr) Protection, Assistance and Solutions” program area. However, if a development award used its development resources to provide emergency support to participants for consumption smoothing or to cope with an emergency, the awardee should report the participants under “(Dev) Protection, Assistance and Solutions” program area.
Foreign Assistance Standardized Program Structure (SPS) - Program Area/Elements and Definitions
The following Foreign Assistance SPS program areas pertain to development awards from FY 2017 and later. These areas have been added to existing options within the “Program Areas and Elements” list in FFPMIS. Awards prior to FY 2016 can continue to report in accordance with previous SPS structures.
● Civil Society: Support civil society as an effective arena that empowers citizens to advance democratic values of citizen participation and governmental accountability. This includes supporting an enabling legal environment that protects and promotes civil
7 The U.S. Foreign Assistance Standardized Program Structure and definitions establish a consistent way to categorize and account for State-USAID managed assistance, including a set of commonly agreed definitions. The information provided in the Project Participant and Resource Tracking Tables allows FFP to determine how food assistance resources are programmed and disaggregated by program area/elements and target groups in order to compare project participant projections with final results and respond to USG reporting requirements.

18 |Page updated September 2017
society and civic action; providing capacity development assistance to civil society organizations; supporting civic participation; bolstering government oversight and accountability activities; strengthening a democratic political culture that values civic engagement, tolerance, and respect for human rights; and strengthening independent and democratic trade/labor unions. Civil society organizations includes, but is not limited to, human rights organizations, youth movements, informal groups, religious organizations, labor and trade unions, professional associations, indigenous organizations, women organizations, Lesbian, Gay, Bisexual, and Transgender organizations, and think tanks.
● HIV/AIDS: Reduce the transmission and impact of HIV/AIDS through support for
prevention, care, and treatment programs.
● Maternal and Child Health (MCH): Increase the availability and use of proven life-saving interventions that address the major killers of mothers and children and improve their health status, including effective maternity care and management of obstetric complications; prevention services including newborn care, routine immunization, polio eradication, safe water and hygiene; and treatment of life-threatening childhood illnesses. Household-Level WASH interventions fall within the MCH program area. Increase household-level actions to prevent disease regardless of the state of public service infrastructure, including point-of-use water treatment, safe water storage and handling, sanitation marketing and promotion, promotion of handwashing with soap, reduction of exposure to indoor smoke from cooking and to local sources of environmental toxins such as lead.
● Family Planning and Reproductive Health: Expand access to high-quality voluntary
family planning services and information, and reproductive health care. This element contributes to reducing unintended pregnancy and promoting healthy reproductive behaviors of men and women, reducing abortion, and reducing maternal and child mortality and morbidity.
● Water Supply and Sanitation: Ensure broadly accessible, reliable and economically
sustainable water and sanitation services for health, security, and prosperity. Example activities include: source water protection; repair, rehabilitation, and/or construction of water sources and water supply infrastructure; and implementation of community-based approaches to the design, construction, and operations & maintenance of facilities. Where applicable and appropriate, cash for work or FFW mechanisms may be used to build water and sanitation-related infrastructure. Note: household-level interventions related to WASH fall within the MCH program area.
● Environment: Objectives, as they relate to FFP participants, include community-level
interventions to reduce health risks associated with environmental pollution (e.g. due to agriculture or other human activity). Example activities include improving management of solid waste; debris cleanup; drainage; livestock waste management; and environmental control activities for vector-borne disease. Note that household-level interventions related to environmental hygiene are reported on as part of the MCH program element.
19 |Page updated September 2017
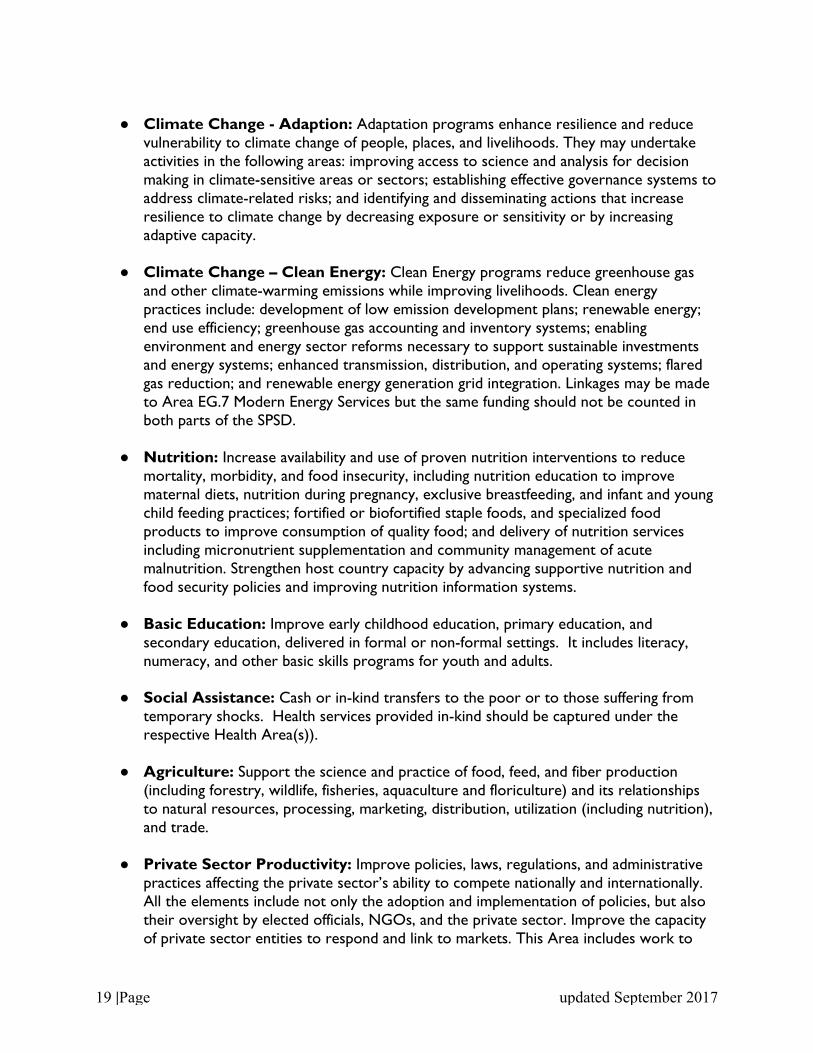
● Climate Change - Adaption: Adaptation programs enhance resilience and reduce
vulnerability to climate change of people, places, and livelihoods. They may undertake activities in the following areas: improving access to science and analysis for decision making in climate-sensitive areas or sectors; establishing effective governance systems to address climate-related risks; and identifying and disseminating actions that increase resilience to climate change by decreasing exposure or sensitivity or by increasing adaptive capacity.
● Climate Change – Clean Energy: Clean Energy programs reduce greenhouse gas
and other climate-warming emissions while improving livelihoods. Clean energy practices include: development of low emission development plans; renewable energy; end use efficiency; greenhouse gas accounting and inventory systems; enabling environment and energy sector reforms necessary to support sustainable investments and energy systems; enhanced transmission, distribution, and operating systems; flared gas reduction; and renewable energy generation grid integration. Linkages may be made to Area EG.7 Modern Energy Services but the same funding should not be counted in both parts of the SPSD.
● Nutrition: Increase availability and use of proven nutrition interventions to reduce
mortality, morbidity, and food insecurity, including nutrition education to improve maternal diets, nutrition during pregnancy, exclusive breastfeeding, and infant and young child feeding practices; fortified or biofortified staple foods, and specialized food products to improve consumption of quality food; and delivery of nutrition services including micronutrient supplementation and community management of acute malnutrition. Strengthen host country capacity by advancing supportive nutrition and food security policies and improving nutrition information systems.
● Basic Education: Improve early childhood education, primary education, and
secondary education, delivered in formal or non-formal settings. It includes literacy, numeracy, and other basic skills programs for youth and adults.
● Social Assistance: Cash or in-kind transfers to the poor or to those suffering from
temporary shocks. Health services provided in-kind should be captured under the respective Health Area(s)).
● Agriculture: Support the science and practice of food, feed, and fiber production
(including forestry, wildlife, fisheries, aquaculture and floriculture) and its relationships to natural resources, processing, marketing, distribution, utilization (including nutrition), and trade.
● Private Sector Productivity: Improve policies, laws, regulations, and administrative
practices affecting the private sector’s ability to compete nationally and internationally. All the elements include not only the adoption and implementation of policies, but also their oversight by elected officials, NGOs, and the private sector. Improve the capacity of private sector entities to respond and link to markets. This Area includes work to

20 |Page updated September 2017
link the poor to markets through effective and economically sustainable systems and relationships.
● Financial Sector: Support the establishment of a sound private, well-functioning,
equitable financial sector that fulfills critical roles in a market economy, most importantly financial intermediation – the efficient generation and allocation of savings to their most productive use.
● Protection, Assistance and Solutions: The provision of effective protection,
assistance, and durable solutions for refugees, internally displaced persons (IDPs), stateless persons, and other victims of conflict and disasters.
● Disaster Readiness: Improvement of the capacity of the USG, host countries and the
international community to reduce vulnerabilities to disasters and respond better to humanitarian emergencies.
I. Monetization and Cost Recovery Data
Awards that monetize commodities will provide the reporting year’s MTZ budget request; approved budget level; proceeds earned from sales; and total proceeds expended during that year into FFPMIS.
J. Standardized Annual Performance Questionnaire (SAPQ) (For detailed instructions on the SAPQ, including new required and required if applicable indicators for existing and new awards, please refer to Annex A)
The SAPQ is a reporting tool used by FFP to collect standard indicator data across awards on an annual basis. The data entered in the SAPQ module in FFPMIS must reflect the definitions and data collection methodology described in the PIRS because FFP will aggregate these standard data across all awards. In addition, indicator data from the SAPQ is included in FTF progress reports and the annual report to Congress.
K. Actuals Table (For detailed instructions on reporting in FFPMIS, please refer to the Guide to Reporting on Cash Transfers, Vouchers, and LRP in FFPMIS.)
The Actuals Table - located in the Program component of FFPMIS - should be completed for any FFP award distributing cash, vouchers or LRP commodities. Information to be reported includes the quantity procured (as applicable), cost, origin, number and quantity of transfers, and participants. To report “# of participants per month who received transfers”, the awardee should report average # of participants per month. If an award provided conditional and unconditional transfers to the same participant, the awardee should count the participant twice to estimate average.
o While the Actuals Table allows quarterly reporting, awardees should only select Q4
from the drop down menu and report for the entire FY.

21 |Page updated September 2017
o For LRP, please report all information requested in the Actuals Table including the quantity of commodities procured and distributed, costs, program area/element(s) and specific activities for which the commodities were used, effects on the market, and number of people who benefited.
o For cash and vouchers, please report all information requested in the Actuals Table including the value of transfer, number of cash or vouchers planned and distributed, number of participants per month and number of months, cost per month, and planned and actual participants for the FY.

22 |Page updated September 2017
ANNEX A: Standardized Annual Performance Questionnaire Purpose The SAPQ collects standardized data across all current and recently closed development awards annually. FFP aggregates this data to report to the U.S. Congress, FTF, and other stakeholders on annual activity results. Indicator results reported in the SAPQ should be for all activities implemented during the reporting FY. Note: FY 2016 awards are not required to provide FY 2017 data but are required to provide three out year targets for all reporting indicators.
SAPQ Instructions
Awardee Project and Contact Information Awardee Name(s): Use the drop down menu. Host Country(ies): Use the drop down menu. Project locations in host country: List the first- and second-level administrative divisions in the country where activities took place. Awardee Contact Information: Include the name, email address, address, and phone number of the main person(s) responsible for completing the food assistance project’s SAPQ. Should additional information be required, FFP will contact this person(s). Definitions
● Age groups are inclusive. For example, “6-59 months” refers to children from 6 to 59.9 months of age or all children from 6 months to under 60 months of age.
● The indicator HDDS is measured in a particular way that is explained in the
“Definitions” in Annex A. If an awardee does not use the same method that is described, the data should not be included in the SAPQ.
SAPQ General Instructions
● Awardees should refer to the SAPQ indicator template for additional information on FFP indicators and for data entry instructions for the SAPQ module in FFPMIS.
● Awardees should submit one SAPQ per award. If working in several different regions
or provinces in one host country under a single award, awardees should submit a single SAPQ covering the entire implementation area.
● Annual monitoring indicators are those for which awardees collect data every year
based on monitoring of participants. ● If outyear targets changed with PREP approval, the awardee should update those targets in the

23 |Page updated September 2017
SAPQ. Reporting year targets cannot be changed.
● If the indicator data collected by the project does not exactly correspond to the particular FFP indicator, please do not provide that data. For example, if the project measures the prevalence of underweight among children aged 6-36 months, but the FFP indicator measures the prevalence of underweight for children aged 0-59 months, please do NOT provide the project’s data.
● Awardees must enter into FFPMIS all indicator data from baseline studies and final
evaluations, even when these activities are conducted by a FFP- or Awardee- managed third-party firm. Awardees must indicate at the beginning of the FY SAPQ page that they have baseline and final evaluation data to enter in order to turn on that function.
SAPQ Specific Instructions
Development awards signed prior to FY 2014 should follow reporting requirements as per FFPIB 07-02, New Reporting Requirements for Food for Peace.
● For post-FY 2012 awards, please enter the names of second level administrative units from which the annual monitoring data were collected in the indicator comments tab. Also please note the unit of measurements in the comment tab where it is applicable and not obvious (e.g., gross margin five data points have different units of measurements).
● These awards are required to report on applicable impact and outcome indicators in the FYs in which the final evaluation is conducted.
● On an annual basis, these awards are required to report on all applicable annual indicators. In addition, these awards must report on the following R and RiA FFP indicators:
o FFP 34 (4.5.2 - 14): Number of vulnerable households benefiting directly from USG interventions;
o FFP 56 (3.1.9 - 1): Number of people trained in child health and nutrition through USG-supported programs;
o FFP 57 (3.1.9 - 15): Number of children under five reached by USG-supported nutrition programs; and
o FFP 58 (3.1.9.2 - 3): Number of children under five who received vitamin A from USG-supported programs.
● Deviation narratives are required for each indicator where the FY 2017 result achieved is +/- 10 percent than the target. As required by OMB, the deviation narrative must specifically state the problems encountered and describe what will be done to address challenges and overcome difficulties for meeting the target, or conversely, the reasons as to why it was exceeded. Awardees should include the deviation narratives in a separate Word document, titled “Deviation Narratives” and submit with other documents.
● For additional information on FFP reporting requirements prior to FY 2014, consult FFPIB 09-07, Description of Food for Peace Awardee Reporting Requirements.

24 |Page updated September 2017
Development awards signed in FY 2014 and FY 2015 are required to report on R and RiA indicators in the FFP Indicators List in April 2015. ● These awards are required to report on applicable impact and outcome indicators in
the FYs in which the baseline and final evaluation are conducted. ● Deviation narratives are required for each indicator where the FY 2017 result
achieved is +/- 10 percent than the target. As required by OMB, the deviation narrative must specifically state the problems encountered and describe what will be done to address challenges and overcome difficulties for meeting the target, or conversely, the reasons as to why it was exceeded. Deviation narratives should be submitted in FFPMIS, and also in the appropriate IPTT column (if the latter is an existing practice).
Development projects awarded in FY 2016 (Ethiopia and DRC) are required to report on R and RiA indicators in the FFP indicators list issued in September 2017. FFP is requesting all new awardees add the following new annual and baseline/endline RiA and R indicators:
FFP # New Indicators for out year targets only
ANNUAL INDICATORS 14a Number of farmers who used at least [a project-defined minimum number of]
sustainable agriculture (crop, livestock and/or NRM) practices and/or technologies (RiA)
75 Percentage of female direct participants of USG nutrition-sensitive agriculture activities consuming a diet of minimum diversity (RiA)
81 Yield of targeted agricultural commodities among program participants with USG assistance (RiA)
BASELINE/ENDLINE INDICATORS 82 Adaptive Capacity index (RiA) 83 Absorptive Capacity Index (RiA) 84 Transformative Capacity Index (RiA) 85 Prevalence of moderate or severe food insecurity in the households (FIES) (R) 86 Prevalence of wasted children under five years of age (R)
● The PIRS for new baseline/endline indicators are forthcoming; however, new
awardees should incorporate indicators 82-86 in their IPTTs.
● The PIRS for annual indicators FFP 14a, 75 and 81 can be found here. While awardees are not required to report on these indicators for FY 2017, they need to add the indicator(s) 14a, 75 and 81 (only if applicable) to their IPTT and SAPQ, and provide three out year targets (both in the IPTT and SAPQ). o NEW FFP 14a Number of farmers who used at least [a project-defined
minimum number of] sustainable crop, livestock and/or NRM practices and/or technologies. This indicator measures number of farmers who used at least a project defined minimum number of sustainable crop, livestock

25 |Page updated September 2017
and/or NRM practice and/or technologies in the reporting year. Sustainable crop, livestock and NRM practices and/or technologies is disaggregated by sex (male, female). Additional data points are also required: Minimum number of sustainable X practices and/or technologies; and Total number of direct beneficiaries participating in sustainable Crop, Livestock, and/or NRM practices and/or technologies. Provide three out year targets in the SAPQ and IPTT.
o NEW FFP 75 (EG 3.3-10): Percentage of female direct participants of USG nutrition-sensitive agriculture activities consuming a diet of minimum diversity. This indicator measures percentage of female direct beneficiary of a nutrition-sensitive agriculture activity that has explicitly-stated nutritional objectives. These nutrition-sensitive agriculture activities should address one or more of the three recognized agriculture-to-nutrition pathways: Food Production, Agricultural income, and Women’s Empowerment. In addition to reporting the percent value, an accurate count of the number of female direct beneficiaries of the nutrition-sensitive agriculture activities is necessary to allow a weighted average percent to be calculated across activities. Provide three out year targets in the SAPQ and IPTT.
o NEW FFP 81 Yield of targeted agricultural commodities among program participants with USG assistance. This indicator measures annual yield for all targeted crop, fish, milk, eggs, live animals for direct FFP beneficiaries. Measures of yield are important indicator of productivity and also provide a basis for assessing whether a farm, water body, or animals are supporting the livelihoods of the individuals who farm the land, aquaculture, or rear animal(s). Provide three out year targets in the SAPQ and IPTT
● Awardees must provide deviation narratives for each indicator where the FY 2017
achieved result is +/- 10 percent than the target. As required by OMB, the deviation narrative must specifically state the problems encountered and describe what will be done to address challenges and overcome difficulties for meeting the target, or conversely, the reasons as to why it was exceeded. Awardees should enter deviation narratives in the comment area for the corresponding indicator in the SAPQ module in FFPMIS and in the appropriate IPTT column.
All development awards will continue to report the following RiA annual monitoring indicators with minor changes: to title and disaggregation. For these minor changes, awardees are asked to make the corresponding changes in title and disaggregation in their IPTT and PIRS, and follow the specific instructions:
Title Only Change ● FFP 8 Farmer's gross margin per hectare, per animal or per cage obtained with USG
assistance. Clarified per hectare, per animal or per cage. Added unit of measurement text, “(kg, MT, number, or other unit of measure)”, after Total Production and Quantity of Sales data points. Added “(USD)” after Purchased Input Cost data point.
● FFP 15 Number of hectares of land under improved technologies or management

26 |Page updated September 2017
practices with USG assistance. Added “of land” to clarify type of hectares. ● FFP 16 Value of small-holder incremental sales generated with USG assistance.
Added “small-holder” to emphasize small-holder farmer and “generated with USG assistance” to emphasize as a result of the development activity interventions. Replaced “(MT)” with “(MT for crop; number for live animals and cages)” after Volume of Sales data point.
● FFP 26 Number of micro, small and medium enterprises (MSMEs), including farmers, accessing savings programs with FFP assistance. Spelled out MSME.
● FFP 25 Number of micro, small and medium (MSMEs), including farmers, receiving business development services from USG-assisted sources. Spelled out MSME.
Removed Disaggregate Validation
● FFP 27 Number of farmers who practiced the value chain activities promoted by the project. Provide unique values in Sex Type. Farmers can be counted in more than one value chain stage disaggregate if they participated in multiple value chain stages.
● FFP 57 Number of children under five (0-59 months) reached with nutrition-specific interventions through USG-supported programs. Provide unique values in Sex Type. Children under five can be counted in more than one intervention disaggregate if they were reached by multiple interventions in Intervention Type.
● FFP 80 Number of pregnant women reached with nutrition-specific interventions through USG-supported programs. Provide unique values in Age Type. Pregnant women can be counted in more than one intervention disaggregate if they were reached by multiple interventions in Intervention Type.
Special Notes FFP 78 (HL 9-4) Number of individuals receiving nutrition-related professional training through USG-supported programs is now available in the SAPQ. Awardees should enter FY17 data disaggregated by sex (male, female), as well as training type (non-degree seeking, degree seeking), and provide three out year targets. The following commodities were added to the commodities list for FFP indicators 8, 16 and 81. Awardees that selected alternative commodities last FY as a substitute due to the lack of precise commodity match must continue to use that commodity with a note in the comment box. Moving forward, contact FFPMIS Helpdesk for additional commodities if not found on the list.
Kale Butternut squash Irrigated maize Sugar beans (dry) Ginger Papaya Sweet gourd Bitter gourd

27 |Page updated September 2017
Bottle gourd Cauliflower Cucumber Cabbage

28 |Page updated September 2017
ANNEX B: Definitions for ARR Agriculture Technologies Agriculture technologies refer to a number of techniques, tools, and practices employed in: 1) combining land, labor, capital, and knowledge to 2) produce, market, distribute, utilize, and trade 3) food, feed, and fiber products. Illustrative sustainable agriculture technologies may include, but are not limited to, low-input approaches, crop rotation, i.e., for soil fertility enhancement and/or pest management, intercropping, integrated farm systems (for example, tree-crop-fish pond-livestock systems), reforestation, water conservation and harvesting, cover cropping, green manure, effective composting, erosion control, improved seed varieties, non-invasive species, and integrated pest management. PVOs are free to define technology. One approach, however, is to say that agricultural technologies are transferred as a package of technologies that, when used in combination, have a proven desired outcome, such as increased yield or reduced soil erosion or a decrease in post-harvest losses. For instance, an Integrated Rice System is a package designed to increase rice yields that consists of five technologies: seed selection, transplanting, water control, weeding, and fertilizing. Research shows that a 50 percent increase in yield if all five technologies are used, while the use of three or four of the technologies will increase yield, but not by 50 percent. Basic Drinking Water Service Basic drinking water services, according to the Joint Monitoring Program (JMP), are defined as improved sources or delivery points that by nature of their construction or through active intervention are protected from outside contamination, in particular from outside contamination with fecal matter, and where collection time is no more than 30 minutes for a roundtrip including queuing. Drinking water sources meeting this criteria include: piped drinking water supply on premises; public tap/standpost; tube well/borehole; protected dug well; protected spring; rainwater; and/or bottled water (when another basic service is used for hand washing, cooking or other basic personal hygiene purposes). Basic Sanitation Facility A basic sanitation facility service, defined according to the Joint Monitoring Program (JMP), is a sanitation facility that hygienically separates human excreta from human contact, and that is not shared with other households. Sanitation facilities meeting these criteria include: flush or pour/flush facility connected to a piped sewer system; a septic system or a pit latrine with slab; composting toilets; or ventilated improved pit latrines (with slab). All other sanitation facilities do not meet this definition and are considered “unimproved.” Unimproved sanitation includes: flush or pour/flush toilets without a sewer connection; pit latrines without slab/open pit; bucket latrines; or hanging toilets/latrines. Households that use a facility shared with other households are not counted as using a basic sanitation facility. All other services are considered to be “unimproved”, including: unprotected dug well, unprotected spring, cart with small tank/drum, tanker truck, surface water (river, dam, lake, pond, stream, canal, irrigation channel), and bottled water (unless basic services are being used for hand washing, cooking and other basic personal hygiene purposes). Carryover In-kind food commodities or funds unused during a FY that are transferred to the budget or
29 |Page updated September 2017
planning levels for the following financial or reporting year. Climate Integration Under the USAID policies and procedures described in 22 CFR 216 and Mandatory Reference for ADS Chapter 201 (Climate Change in USAID Country/Regional Strategies (201mat) and Climate Risk Management for USAID Projects and Activities (201mal)), integration of climate and environmental sensitivities is simply identifying such coupled risks and opportunities across the project life cycle. Since global drivers of climate change are already threatening natural resource-based components of food security, project managers must consider best available climate data and adaptation measures in designing activities. How these climate stressors interact with the natural capital base upon which livelihoods depend reinforces the importance of incorporating environmental safeguards across the FFP award. Following Mandatory Reference for ADS 201mat, USAID design teams must identify relevant climate risks, qualitatively assess them as low, moderate, or high, and determine appropriate risk management measures for those climate risks rated as moderate or high. This climate risk management (CRM) screening should be integrated throughout the environmental compliance process, including detailed coverage in a screening table and narrative within the project/activity Initial Environmental Examination (IEE). In addition, implementing partners compare relevant IPTT indicators with the approved award-level EMMP, which includes climate threats and opportunities. This comparison contextualizes IPTT indicators to local environmental baseline conditions. More information can be found in ADS 204, ADS 201mat, ADS 201mal, as well as in USAID’s Office for Food for Peace Policy and Guidance for Monitoring and Evaluation and Reporting for Development Food Assistance Projects. Communities This is intentionally left undefined so that awards may use their own definition of what constitutes a community. A community could be a village, but it doesn't necessarily have to be. A community is meant to be a geographic grouping (e.g., neighborhood, village, or commune) and does not refer to a group of people who all have a similar characteristic, like women or farmers. Community Capacity In this context, community capacity refers to a community’s ability to govern itself; to organize, analyze, plan, manage, problem-solve, implement actions, and represent its interests and participate in broader fora. This goes beyond targeted efforts to strengthen communities in nutrition, agriculture, infrastructure, early warning, or other topics covered elsewhere in FFP guidance. Direct Distribution Food Aid Commodities In-kind food commodities that are provided directly to project participants as in-kind take home rations or for on-site feeding (versus in-kind food commodities sold for MTZ proceeds). Direct Participants For the purposes of reporting, direct participants are defined as individuals who come into direct contact with the set of interventions (goods or services) provided by the project in each

30 |Page updated September 2017
technical area. Individuals who receive training or benefit from project-supported technical assistance or service provision are considered direct participants, as are those who receive a ration or another type of good. Services include training and technical assistance provided directly by project staff, and training and technical assistance provided by people who have been trained by project staff, (e.g., agricultural extension agents, village health workers). In a Food-for-Training activity, the direct project participants are those trained under the program. In a Food-for-Work (FFW) or Food for Assets activity implemented as a stand-alone, (e.g., not as part of a wider set of interventions in the technical sector), direct project participants are those who directly participate in the activity, (e.g., receive a ration, not all of those who use or benefit from the infrastructure/asset created, e.g., a road). If a FFW or Food for Assets activity forms part of a set of activities in a technical sector, (e.g., FFW to build irrigation infrastructure, accompanied by technical assistance in new cultivation techniques and water management to a targeted group of farmers), the direct participants include FFW participants and farmers receiving technical assistance, and the two groups may overlap. In the case of food rations, direct participants include the individual recipient in the case of individual rations, and the recipient plus his/her family members in the case of family rations. Direct participants do not include those who benefit indirectly from the goods and services provided to the project participants, (e.g., members of the household of a farmer who received technical assistance, seeds and tools, other inputs, credit, livestock; farmers from a neighboring community who might observe the effects of the training and demonstration plots in the target community and decide to adopt or model the new practices themselves; the population of all of the communities in a valley that uses a road improved by FFW; or all individuals who may have heard a radio message about prices, but who did not receive the other elements of an agricultural intervention necessary to increase incomes.) Such individuals are considered indirect participants (see definition). Environmental Assessment Triggered by a positive determination as identified in the project IEE, the Environmental Assessment is a detailed study of the reasonably foreseeable significant effects, both beneficial and adverse, of a proposed action on the environment. It is preceded by a Scoping Statement, in which a thorough stakeholder consultation process with community members, government, research, private, and non-profit institutions, serves to identify significant environmental issues that need to be assessed in the study. Environmental Mitigation and Monitoring Plan An EMMP is a document that establishes the set of actions that seek to avoid, mitigate, or compensate for the reasonably foreseeable impacts of award interventions identified by environmental impact analysis. The EMMP also sets out the indicators or criteria that will be used to monitor (1) whether the mitigation actions have been implemented, and (2) whether they are effective and sufficient. The EMMP also specifies the parties responsible for these actions and the schedule for these tasks. Exclusive Breastfeeding Exclusive breastfeeding means that an infant received breast milk (including milk expressed or

31 |Page updated September 2017
from a wet nurse) and might have received properly prepared oral rehydration solution (ORS), vitamins, minerals, and/or medicines, but did not receive any other food or liquid. A proxy measure is the percentage of children under 6 months exclusively breastfed during the day preceding the survey. Female Empowerment When women and girls acquire the power to act freely, exercise their rights, and fulfill their potential as full and equal members of society. While empowerment often comes from within, and individuals empower themselves, cultures, societies, and institutions create conditions that facilitate or undermine the possibilities for empowerment. More information can be found in ADS 205, Integrating Gender Equality and Female Empowerment in USAID’s Program Cycle. FFP Funding Sources - Development Resources Development resources are used in development awards for interventions that target chronically food insecure populations. These interventions include long-term safety nets and activities to enhance human capacities, livelihood capabilities, and community resiliency and capacity. Interventions may also include disaster risk reduction and early warning activities. FFP Funding Sources - Emergency Resources FFP resources used to fund emergency response and disaster risk reduction-type interventions. Emergency resources may be used in a development project for expanded safety net and asset protection activities that target populations suffering from transitory food insecurity during a shock or transition from an emergency situation, as well as to fund disaster risk reduction and early warning activities. Financial Services Financial services refer to services provided by formal or non-formal groups for the management of money. This includes credit (loans), savings, and insurance schemes run by for-profit, non-profit, and governmental organizations. Gender Analysis A gender analysis is an analytic, social science tool that is used to identify, understand, and explain gaps between males and females that exist in households, communities, and countries, and the relevance of gender norms and power relations in a specific context. Such analysis typically involves examining differences in the status of women and men and their differential access to assets, resources, opportunities and services; the influence of gender roles and norms on the division of time between paid employment, unpaid work (including subsistence production and care for family members), and volunteer activities; the influence of gender roles and norms on leadership roles and decision-making; constraints, opportunities, and entry points for narrowing gender gaps and empowering females; and potential differential impacts of development policies and programs on males and females, including unintended or negative consequences. More information can be found in ADS 205. Gender Equality Gender equality concerns fundamental social transformation, working with men and boys, women and girls to bring about changes in attitudes, behaviors, roles and responsibilities at

32 |Page updated September 2017
home, in the workplace, and in the community. Genuine equality means expanding freedoms and improving overall quality of life so that equality is achieved without sacrificing gains for males or females. More information can be found in ADS 205. Gender Equity Gender equity is the process of being fair to women and men. To ensure fairness, measures must often be available to compensate for historical and social disadvantages that prevent women and men from otherwise operating on a level playing field. Equity leads to equality. More information can be found in ADS Chapters 200 - 203. Gender Integration Gender integration refers to identifying and addressing gender inequalities during strategy and program design, implementation, and monitoring and evaluation. Since the roles and power relations between men and women affect how an activity is implemented, it is essential that project managers address these issues on an ongoing basis. More information can be found in ADS 205. Gender-Sensitive Indicators Gender-sensitive indicators highlight to what extent and in what ways development awards achieved results related to gender equality and whether and how reducing gaps between males and females and empowering women leads to better activity/development outcomes. More information can be found in ADS 205. Hand Washing Stations A handwashing station refers to a designated place where household members and guests can find soap and water for washing their hands. The prevalence of households with hand washing stations with soap and water is a measure of progress toward improved hygiene practices. HIV Programming Resources used for activities directly targeting people infected or affected by HIV or that use HIV-related factors, such as chronic illness, as part of the vulnerability criteria used for project entry/eligibility. This includes People Living with HIV (PLHIV), such as children; clients of Prevention of Mother to Child Transmission activities; Orphans and Vulnerable Children (OVC); the families and caregivers of PLHIV and OVC; and service providers supported through Food-for-Training (e.g., peer educators, home-based care volunteers, etc.). Note: Orphans are defined as children under the age of 18 years who have lost one or both parents to AIDS, and vulnerable children are those affected by HIV through the illness of a parent or principal caregiver. If there is a national-level definition of OVC, awardees should use the national definition instead. Household Dietary Diversity Score (HDDS) HDDS is a proxy measure of household socioeconomic status. It is derived from the number of different food groups consumed by a household over a 24-hour recall period. It is not a measure of dietary quality. Data are collected through a household questionnaire consisting of one single question, using 12 standard food groups, asked of the person responsible for food preparation in the household. For additional information on HDDS, refer to the FFP Indicators

33 |Page updated September 2017
Handbook, Part I: Indicators for Baseline and Final Evaluation Surveys. Initial Environmental Examination The first review of the reasonably foreseeable effects of a proposed action on the environment. Its function is to provide a brief statement of the factual basis for a Threshold Decision as to whether an Environmental Assessment will be required. Improved Storage Practices Improved storage techniques are methods for storing seeds, grains, animal feed, and aquaculture products that are cost-effective and allow for long-term storage. These techniques allow a farmer to safely store excess harvest from the plot where the farmer has decision-making power for subsequent sale, consumption, and/or propagative plant material, (e.g., seeds for future planting). Improved storage techniques should minimize post-harvest losses and maximize profits by allowing farmers to sell their products later in the season when excess product supply has diminished. Indirect participants Indirect project participants are those who benefit indirectly from the goods and services provided to the direct project participants (as defined below). For example, indirect project participants include members of the household of a farmer who received technical assistance, seeds, and tools, other inputs, credit, and livestock; farmers from a neighboring community who might observe the effects of the training and demonstration plots in the target community and decide to adopt or model the new practices themselves; the population of all of the communities in a valley that uses a road improved by a food for work activity; or all individuals who may have heard a radio message about prices, but who did not receive the other elements of an agricultural activity necessary to increase incomes. Mean Depth of Poverty Mean depth of poverty is a measurement based on the value of average daily consumption expenditure per person, where food and other items that a household consumes out of its own production are counted as if the household purchased those items at market prices. Metric ton(s) MT are the standard unit of measurement for Title II commodities. One MT equals 1,000 kilograms. Minimum Acceptable Diet (MAD) MAD is a measure of nutritional status of children that considers both frequency and diversity of diet. The method of measurement depends on the age of the child. If a child meets the minimum feeding frequency and minimum dietary diversity for his or her age group and breastfeeding status, then the child is considered to be receiving a minimum acceptable. Monetization (MTZ) MTZ is the sale of food aid commodities to obtain cash for use in development awards. Awardees monetize USG-donated food commodities to generate cash resources (proceeds) to cover expenses associated with implementing development awards. MTZ can be conducted by
34 |Page updated September 2017
direct negotiation or through sealed-bid auctions. Typical buyers include governments, parastatals, wholesalers and mid-level merchants. Pesticide Evaluation Report and Safe Use Action Plan (PERSUAP) The USAID regulatory analysis of any and all pesticides proposed for promotion, procurement, transport, storage or disposal. It evaluates the risk each proposed pesticide poses to human health and the environment, authorizes pesticides for specific uses and establishes mandatory conditions for safe use. Pipeline and Resource Estimate Proposal (PREP) A PREP describes an awardee’s food aid resource needs and activities for an award over the course of the upcoming FY, even if additional resources will not be requested. PREPs must be submitted annually for every development award on a date negotiated by the awardee, FFP/Washington and the FFP/Mission and/or Regional Office, as appropriate. Prevalence of Poverty Prevalence of poverty is the proportion of a population expending less than $1.25 per day, converted into local currency at 2005 “Purchasing Power Parity” (PPP) exchange rates, for food and other essential consumables, as opposed to durable assets. Measurement is based on the value of average daily consumption expenditure per person. Food and other items that a household produces for consumption are counted as if the household purchased those items at market prices. Stunting Stunting is a condition of slowed growth due to chronic malnutrition that has permanent effects on physical and mental capacity. It is identified using measure of height compared to a standard, sex-specific, reference for height (height-for-age)). Sustainable Agriculture The term sustainable agriculture (U.S. Code Title 7, Section 3103) refers to an integrated system of plant and animal production practices having a site-specific application that will over the long-term:
● Satisfy human food and fiber needs. ● Enhance environmental quality and the natural resource base upon which the agriculture
economy depends. ● Make the most efficient use of nonrenewable resources and on-farm resources and
integrate, where appropriate, natural biological cycles and controls. ● Sustain the economic viability of farm operations. ● Enhance the quality of life for farmers and society as a whole.
Sustainable agriculture seeks to sustain farmers, resources and communities by promoting farming practices and methods that are profitable, environmentally sound and good for communities.

35 |Page updated September 2017
Underweight Underweight is a condition of weighing less than is considered nutritionally healthy—either due to slowed growth (stunting) or thinness (wasting). For FFP, the condition of underweight for children under 5 years of age is determined by comparing an individual’s weight to an age- and sex-specific standard. Underweight among Women of Reproductive Age For women, underweight is based on having a body mass index < 18.5 kg/m2. The prevalence of underweight women indicator measures the percent of non-pregnant women of reproductive age (15-49 years). To calculate an individual’s BMI, weight and height data are needed. Body mass index is equal to weight (in kg) divided by height squared (in meters) multiplied by a correction factor. The data for this indicator is collected through the household questionnaire in a population-based survey. The population-based survey is usually conducted during the hungry season, on all the households selected in a representative sample. The questionnaire and instructions for data collection, tabulation, and analysis can be found in the Performance Indicators Reference Sheets for FFP Indicators. Value Chain Activities Value chain activities in agriculture are defined as a set of actors and activities that bring a basic agricultural product from production in the field to final consumption, where at each stage value is added to the product. A value chain can be a vertical linking or a network between various independent business organizations and can involve processing, packaging, storage, transport and distribution [http://www.fao.org/docrep/013/i2008e/i2008e04.pdf]. Value chain activities include, but are not limited to, pre- and post-harvest activities, such as joint purchase of inputs, bulking transporting, sorting, grading, processing, trading/marketing (wholesale, retail, export). Awards for which this indicator is applicable need to pre-identify a list of value chain activities that the project will be promoting during the award so that the baseline survey is able to measure the percentage of farmers that are already practicing these specific value chain activities. This will later be compared to the percentage of farmers practicing these value chain activities during the final evaluation survey at the end of the award. More on value chain activities can be found at the USAID’s value chain wiki link: [https://www.microlinks.org/good-practice-center/value-chain-wiki]. Vulnerable Children According to the PL 109-95 Implementation Strategy (May 2006), highly vulnerable children are “children and youth who are under 18 years whose safety, wellbeing, growth and development are at significant risk due to inadequate care, protection, or access to essential services.” Refer to [www.childreninadversity.gov] for further information. Women’s Dietary Diversity Score Women’s dietary diversity score is a measure of the micronutrient adequacy of the diet based on the mean number of food groups consumed in the previous day by women of reproductive age (15–49 years). Data is tabulated by averaging the number of food groups consumed out of the specified nine food groups across all women of reproductive age in the sample with data on dietary diversity.

36 |Page updated September 2017
Women’s Empowerment in Agriculture Index (WEAI) and Abbreviated Women’s Empowerment in Agriculture Index (A-WEAI) The Women’s Empowerment in Agriculture Index (WEAI) measures the empowerment, agency, and inclusion of women in the agriculture sector in an effort to identify and address the constraints that hinder women’s full engagement in the agriculture sector. Guidance on data collection and calculations of the Women’s Empowerment in Agriculture Index can be found in the Feed the Future Handbook of Indicator Definitions at http://feedthefuture.gov/resource/feed-future-handbook-indicator-definitions. Guidance for the A-WEAI is at https://feedthefuture.gov/article/lean-not-mean-streamlined-tool-measuring-women’s-empowerment
37 |Page updated September 2017
ANNEX C: Success Story Writing 101
Why are success stories necessary? Success stories are helpful to further educate the public about food assistance activities, particularly to demonstrate the impact that they have on peoples’ lives around the world. The stories should describe the food assistance activities in non-technical language and explain the results or benefit (where feasible). What type of stories is FFP expecting? FFP seeks descriptions of successes that go beyond the specifics of how much food was delivered and focus on progress made in reducing food insecurity in the populations receiving food assistance. In other words, they should showcase broad-scale sustainable development awards and/or highlight new, cutting edge innovations. FFP would like success stories from all regions, and for both emergency and development awards. We welcome stories that focus on transformational impacts of our development awards – for example:
● Reducing stunting ● Raising household incomes ● Increased agricultural productivity ● Regenerating watersheds or other natural resources ● Improving and maintaining community infrastructure ● Empowering women ● Mitigating future disasters or existing threats through disaster risk reduction
interventions ● Outcomes and results. We know this is a much more difficult ask than simple output
information (e.g. number of people trained vs. how did that training change a person’s behavior), but to the extent possible, USAID encourages partners to submit stories with this information.
● New opportunities and impacts for participants as a result of FFP and BFS-funded projects (or other USAID projects including OFDA projects) running together or in close proximity to each other.
We also welcome compelling stories of: ● Early response that clearly prevents loss of life or mitigates impacts of disasters ● Why flexibility to use cash-based resources was critical to an emergency response ● Lives saved and suffering alleviated ● Documented reductions in malnutrition or other key indicators ● Food for asset and other interventions that protect and/or advance livelihoods while
saving lives ● Creative approaches applying technology or other tools that clearly improve response ● Strategic application of multiple resources to improve overall impact (e.g., sequencing
EFSP and Title II awards that demonstrate the benefits of both resources and the improved response that results because both are available)
● Resilience building as part of an emergency response

38 |Page updated September 2017
The most effective success stories focus on the following: ● Individuals empowered to help themselves ● Sustainable change rather than one-off successes ● Permanent “leave behinds” created, such as new infrastructure, skills that have a
lasting impact, or reduced need for outside help in the future due to program results ● A “new” approach to aid, one that empowers targeted groups and works to avoid
dependency Also keep in mind that moral and ethical imperatives are a central part of the motivation for supporting assistance. Americans believe that the U.S. must act as a world leader to live up to its founding ideals. Try to factor this motivation into your story. Just remember, all success stories should point to results! How will my success story be used? Selected stories may be included on the USAID website, in the annual U.S. International Food Assistance Report and in other communications products that highlight the work of FFP and its awardees. What does a great success story look like? The formula is simple: use powerful statistics; communicate progress; frame your story around USAID’s larger Mission, not a specific award; and bring it to life with a personal narrative. Success stories should including the following sections (text does not have to be in this order):
1. Title or Heading (approximately 5-10 words including country and/or region of award) 2. 1-2 sentences (approximately 50 words) briefly describing the situation in the country
that required FFP assistance. Example: In December 2010, violence surrounding the contested Presidential election forced many Ivorians to flee from their homes. There are currently 15,725 IDPs within Côte d’Ivoire and 69,561 refugees in Liberia, where UNHCR reported 160,000 refugees at the height of the displacement in 2011.
3. 3-4 sentences (approximately 100-150 words) describing the award being implemented in country. Example: FFP is currently supporting an innovative World Food Program pilot program that uses cell phones to facilitate cash transfers to 54,000 people living in impoverished districts of Abidjan. These districts were badly affected in the post-election crisis and the lowest income families struggle to put food on the table. Through this program, more than 10,000 vulnerable households receive text messages on their cell phones alerting them to withdraw money from local cash points. This unconditional cash transfer is being implemented as a pilot program over a two month period, with each household receiving a total of $75 per month, equivalent to the food basket of an average family of five.
4. 1-2 sentences (approximately 25-50 words) describing why that activity was the most appropriate response to the situation described. Example: Participants describe how the cash transfer has allowed them to improve the quality of their family’s meals, by purchasing meat and fish to add protein to their diet.

39 |Page updated September 2017
5. 1-2 sentences (approximately 25-50 words) describing the results and success of the implemented award. Example: This innovative activity pioneers new methods of fighting hunger in the technology age and shows how these tools can provide new solutions for providing food assistance in a challenging urban post-crisis setting.
If including a picture, use .jpg or .tiff format and a file that is at least 300 dots per inch (dpi). The photo caption should include the photographer’s name and organization as well as a caption of 25 words or less summarizing what is occurring in the photo, including date, location, and names of person(s) in the photo. For all participants named or photographed, verbal consent must be obtained prior to being featured within the story. USAID understands that participants may ask to use a different name to remain anonymous. This is especially true in situations where naming or photographing individuals accepting U.S. Government assistance poses a potential threat to their life. If this is the case, please note this within the submission. What are some DOs and DON’Ts of writing Success Stories? DO… ● DO include quotes as much as possible. Some USAID communications platforms will not
post stories without quotes. ● DO use powerful statistics ● DO lead with results ● DO tell stories that demonstrate sustainable change ● DO create emotional/personal connections that bring viewers into the scene ● DO think big picture
DON’T… ● DON’T use acronyms ● DON’T use technical speak ● DON’T use statistics that present numbers or percentages with no sense of context or
scale ● DON’T lead with $$ amounts
Last but not least, remember that success stories are a way to tell the world about the great work that
USAID and our partners accomplish every day!

40 |Page updated September 2017
ANNEX D: Checklist on Integrating Gender in ARR
To determine the key gender issues to report on in the ARR and ensure they are effectively presented in the narrative, consider the following.
Yes No
Issue to Explore Further
or Address
Successes, Challenges,
Other to Report in
ARR Changes in & Consequences of Gender Dynamics - have you
1. Reviewed the gender analysis to recall the gender concerns and opportunities identified within the ToC, or each Purpose/Sub-purpose, and ensure award is addressing issues and implementing recommendations?
2. Discussed with colleagues and stakeholders their perception of: ● Whether women, girls, boys and men are all benefiting from interventions and their potential is being tapped across activity components? ● Ways in which gender roles and relations may be aiding or impeding interventions and outcomes? ● Whether interventions are changing- for better or for worse- gender norms, roles and relations between women and men? ● How interventions are affecting women’s time and what, if anything, can be done about it? ● If the attempt to empower women is creating
excessive friction in households with the risk (or actual result) of triggering Gender-Based Violence?
Data Presentation, Analysis & Interpretation - have you 3. Indicated where targets versus actuals for sex disaggregated data presented in the IPTT/SAPQ differ significantly and provided possible explanations why?
4. Provided a visual presentation of select indicators by sex and, if possible, age (e.g., graphs, charts, tables) that is useful to the reader to put the results from the FY in context with progression towards the FY targets?
5. Used qualitative and quantitative data to explain gender differences/ gaps related to the results being described in the narrative?
Programmatic Implications & Actions – have you 6. Discussed the implications (the "so what?") of the results being reported as it relates to achieving outcomes for men and women, girls and boys?

41 |Page updated September 2017
7. Identified where changes should be considered (activity implementation, ToC) to make the award more gender sensitive?
8. Considered specific actions that could be taken by the award to address gender gaps revealed by the annual monitoring results?
In Summary – have you 9. Provided a reflection/introspection on how the award is integrating gender to promote gender equality in order to achieve activity/FFP objectives (e.g., is it working, does it need to be adjusted)?

42 |Page updated September 2017
ANNEX E: Indicator Performance Tracking Table Checklist in ARR To examine the completeness and quality of your IPTT, review the IPTT and answer the following questions.
Yes No Note further actions needed
Overall Quality of the IPTT 1. Are all the required disaggregations in the IPTT? Is
each individual-level indicator sex and age disaggregated as appropriate?
2. Where appropriate, do the disaggregation(s) add up to the overall indicator total? (Where there is disaggregate “Total with one or more …”, the disaggregation does not sum up.)
3. Is the formula for complex indicator(s) with multiple data points available for review in the formula box? Is the formula correct? Indicators #8, #16 and #81 have complex formulas.
4. Are targets set for three out-years from the current FY?
5. Do all targets match their indicator in units of measurement?
6. Are the base values entered?
7. There are no blanks. Confirm Relationship between Indicators 8. FFP #10 and #12: Groups that apply improved
organization-level technologies and management practices are a subset of the groups that are assisted with food security related organizational development assistance. Note that length and timing of assistance and timing of application may offset these numbers in a reporting year.
9. FFP #9 and #15: The farmers in #9 are the cultivators of the hectares in #15. Check that the average farmer per hectare is reasonable and realistic.
10. FFP #9 and #10: Count the organization (enterprise, association, cooperative or CBO) applying an improved technology or management practice as one entity, and not as the number of employees or memberships. For example, if a farmers' association incorporates improved maize storage as a part of member services, the application is counted as one association and not multiplied by the number of farmer-members. However, if individual direct beneficiaries then use the association's maize storage service to improve post-harvest handling of production, they can be counted under FFP #9, Number of farmers and others applying improved technologies.

43 |Page updated September 2017
ANNEX F: ARR Narrative Quality Review Checklist
To ensure that key ARR components are effectively organized, analyzed and presented in the narrative, consider the following:
Yes
No
Issue to address
Additional topic to include
Overall report organization
1. Is the narrative organized by the components of the Results Framework SO, IR, and Sub IR or LogFrame (purpose, sub-purposes, intermediate outcomes, and outputs)?
Reporting results 2. Are the operational environment and enabling
factors that facilitated or hindered the achievements of planned results and interventions explained (environmental conditions, contextual factors including government policies, stakeholder coordination, management issues)?
3. Are any major challenges to implementation highlighted and explained including the quality of services (i.e. training, other inputs), technical challenges, sub-optimal design of interventions, missing complimentary services, critical barriers that are yet to be addressed?
4. Does the narrative describe briefly how the award will address any issue/challenge identified and the lessons learned during the FY?
5. Does the narrative address key management issues that have impacted the award during the FY (including partnership, staff turnover, inconsistent leadership, inadequate staff training, frequent breakdown of the resource pipeline, less than optimum gender equitable staff management)?
6. Are any deviations from the original or most-recently approved activity design identified?
7. Did your development award receive emergency funds for interventions during the FY? Does the ARR narrative include a description of these emergency interventions, and the implications of the emergency or shock on the development interventions and results?
Data presentation and analysis 8. Does the report present and interpret the analysis of
the most relevant indicators for this FY (including performance trends) to tell the story?

44 |Page updated September 2017
9. Are interventions and outcomes for this FY analyzed against planned interventions and output/outcome targets to demonstrate how the award performed against the targets and the ToC?
10. Does the analysis highlight important differences in results across geographic areas, sex of project participants, or other relevant sub-groups?
11. Is there an analysis, corrective action, and explanation for the need to adjust future targets (if applicable)? Is this information included in the deviation narrative?
Technical interventions 12. Does the narrative describe the quality of
interventions, technical strategies and linkages to the level of adoption of desired behaviors or practices?
13. Does the narrative include which targeted group did or did not benefit as planned from interventions during the FY and explain why?
14. Does the narrative describe the status of the sustainability strategy including what interventions were implemented during the FY to promote sustainability and how any challenges to sustainability were addressed?
Cross-cutting 15. Is sex disaggregation and gender analysis integrated
throughout the narrative? Refer to checklist for integrating gender.
16. Are other cross-cutting issues integrated in the narrative including climate change and conflict?
References, sources and attachments 17. Does the narrative identify sources and methods
used to obtain the information reported including participant/stakeholder feedback, PDM/ survey results?
18. Are indicators referenced by IPTT # in the narrative?
19. Are the most relevant and useful references and attachments included in the report and uploaded to the FFPMIS?
20. Are interventions and results against planned interventions and targets analyzed for project outputs, processes, or outcomes quantitatively and qualitatively (including PDM feedback mechanisms, market assessments, and final assessments)?

45 |Page updated September 2017
Overall 21. Does the report tell the story and help the reader
understand how the award led to the outcomes, what the challenges were, and how the award overcame them during the FY?

46 |Page updated September 2017
ANNEX G: Checklist on Integrating Environment in ARR
To determine the key environmental risks and opportunities to report on in the ARR and ensure they are effectively presented in the narrative, consider:
Yes No Issue to Explore Further
or Address
Successes, Challenges,
Other to Report in
ARR
Changes in Natural Resources Risk & Impact - have you
1. Reviewed biodiversity, tropical forestry, climate and geological hazard risk analyses, activity IEE, and relevant Pesticide Evaluation and Safer Use Action Plan or Environmental Assessment for nature-based risks and impacts? Strategically addressed these risks and opportunities via incorporation into the ToC, indicators, Purposes/Sub-purposes and/ or EMMP?
2. Discussed with colleagues and stakeholders their perception of:
How the activity has avoided causing detrimental impacts to the environment (e.g., activity-derived deforestation)?
How the activity can improve community resilience to environmental degradation and weather risks (e.g., water quality and supply)?
How the activity can work with the community to rehabilitate degraded natural resources relevant to food security (e.g., poor soil fertility)?
How the activity can strengthen knowledge, and change attitudes among target participants to better manage communal natural resources (e.g., eradication of invasive plants)?
Data Presentation, Analysis & Interpretation - have you
3. Indicated where targets versus actuals for climate indicator data presented in the IPTT/SAPQ differ significantly and provided possible explanations why?
4. Interpreted the results (e.g., in livelihoods or safety nets) to ensure that short-term annual gains are not at odds with longer term sustainability described in the project’s EMMP?

47 |Page updated September 2017
5. Used qualitative and quantitative data to explain hydro-meteorological, geohazard risks and impacts to natural resources related to the results being described in the narrative?
Programmatic Implications & Actions – have you
6. Discussed the implications (the "so what?") of the results being reported as it relates to achieving activity outcomes that do no harm to the environment?
7. Involved the community in making the activity more environment sensitive while increasing management of weather-related risks?
8. Considered specific actions that could be taken by the activity to address environmental risks revealed by the annual monitoring results?
In Summary – have you
9. Provided a reflection on how the activity is integrating perspectives of environmental impacts and risks in order to achieve activity/FFP objectives (e.g., is it working, does it need to be adjusted)?

48 |Page updated September 2017
ANNEX H: Reference Documents and Websites Development Experience Clearinghouse (DEC). https://dec.usaid.gov/dec/home/Default.aspx FANTA Anthropometric Indicators Measurement Guide. http://www.fantaproject.org/tools/anthropometry-guide Feed the Future Agricultural Indicators Guide. https://agrilinks.org/library/feed-the-future-ag-indicators-guide Feed the Future Handbook of Indicator Definitions. http://feedthefuture.gov/resource/feed-future-handbook-indicator-definitions FFPMIS Users’ Guides. http://www.fsnnetwork.org/document/food-peace-management-information-system-ffpmis-resources FFP Information Bulletins. http://www.usaid.gov/what-we-do/agriculture-and-food-security/food-assistance/guidance/food-peace-information-bulletins FFP Indicators Handbook, Part I: Indicators for Baseline and Final Evaluation Surveys. http://www.usaid.gov/sites/default/files/documents/1866/Part%20I_Baseline%20and%20Final%20Evaluation_04.13.2015.pdf FFP Indicators Handbook, Part II: Annual Monitoring Indicators. https://www.usaid.gov/sites/default/files/documents/1866/PartIIAnnualMonitoringIndicators_August_2017_FINAL_508_Compliant.pdf Foreign Assistance Standardized Program Structure. http://www.state.gov/f/indicators/ USAID’s ADS 201mat Climate Change in USAID Country/Regional Strategies. https://www.usaid.gov/sites/default/files/documents/1876/201mat.pdf
USAID’s 201 mal CRM for USAID Projects and Activities. https://www.usaid.gov/sites/default/files/documents/1868/201mal_042817.pdf
PEPFAR Guidance for Orphans and Vulnerable Children Programming. http://www.pepfar.gov/reports/guidance/c53568.htm USAID’s ADS 203. https://www.usaid.gov/ads/policy/200/203 USAID’s ADS 205. https://www.usaid.gov/ads/policy/200/205 USAID’s ADS 540. http://www.usaid.gov/ads/policy/500/540 USAID Thesaurus. http://pdf.usaid.gov/pdf_docs/pnaea100.pdf