us and global economic review & forecast 2010
TRANSCRIPT

Client-tailored solutions for what’s next
Economic Review and Forecast
Summary presentation of e-forecasting.com’s outlook for US
and global economic conditionsFriday, October 15th, 2010
Client-tailored solutions for what’s next 04/18/23
2
Presentation Agenda
Overview of recession/rebound
Snapshot of current economic climate: stagnation?
Future outlook
Q&A
Client-tailored solutions for what’s next 04/18/23
3

Client-tailored solutions for what’s next 04/18/23
4
Stagnation Nation?
European style high unemployment Where is US economic dynamism? Good, Bad & Ugly Policies? Major Risks
Client-tailored solutions for what’s next 04/18/23
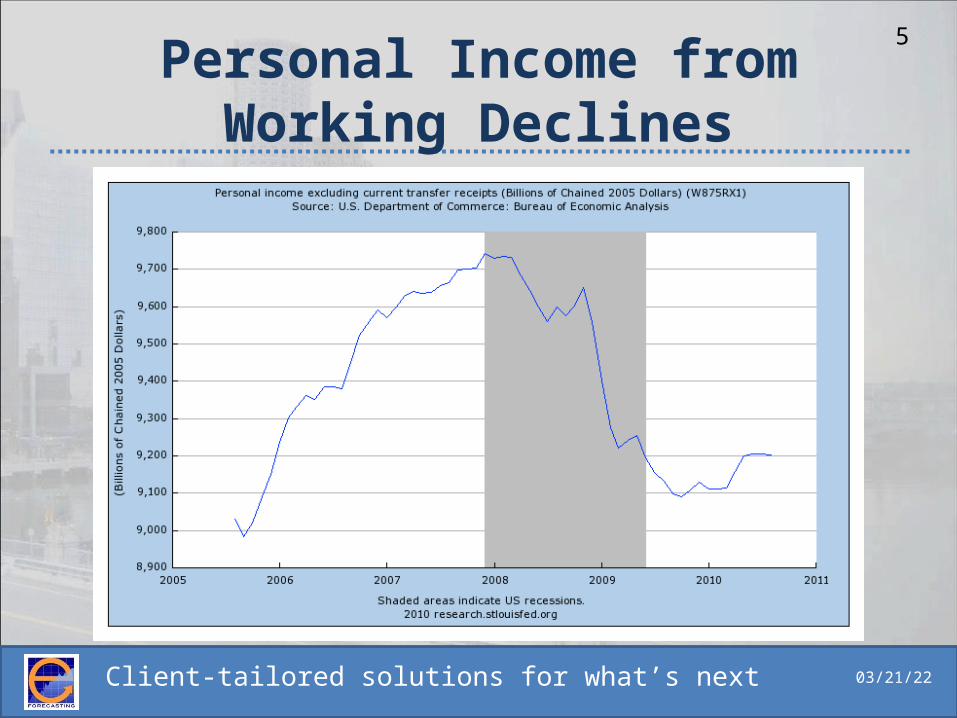
5Personal Income from
Working Declines
Client-tailored solutions for what’s next 04/18/23
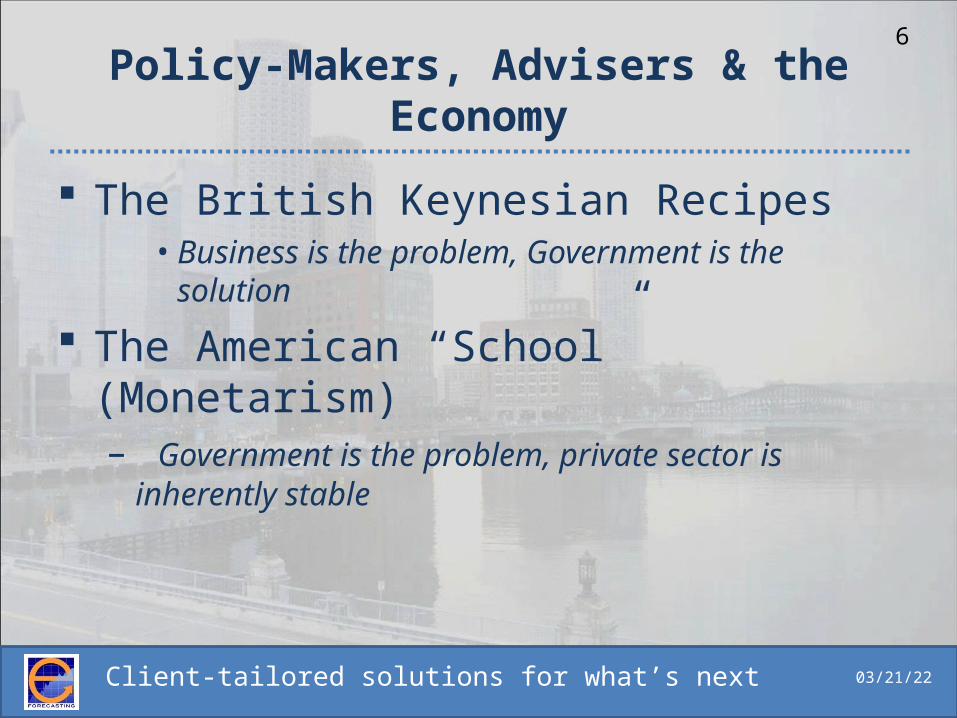
6Policy-Makers, Advisers & the
Economy
The British Keynesian Recipes• Business is the problem, Government is the
solution
The American “School” (Monetarism)– Government is the problem, private sector is
inherently stable

Client-tailored solutions for what’s next 04/18/23
7Policy-Makers, Advisers & the
Economy
Effectiveness of Policies Peoples reaction & behavior Permanent Policies vs. Transitory (Las
Vegas style) policies Income or Wealth (assets) drives
behavior
Client-tailored solutions for what’s next 04/18/23
8
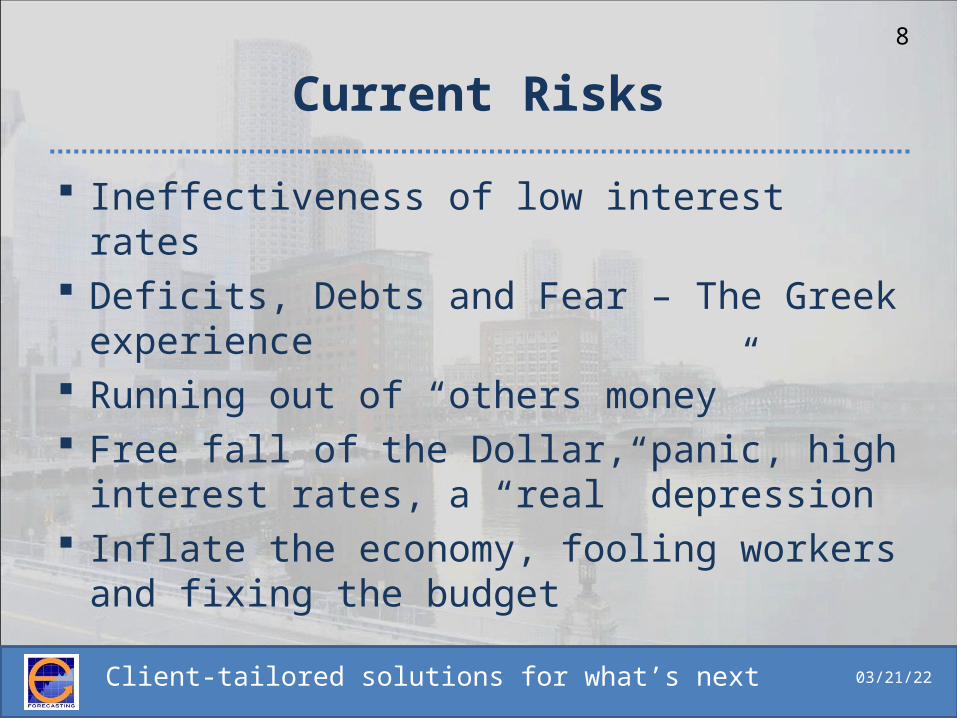
Current Risks
Ineffectiveness of low interest rates Deficits, Debts and Fear – The Greek
experience Running out of “others money” Free fall of the Dollar, panic, high
interest rates, a “real” depression Inflate the economy, fooling workers
and fixing the budget

Client-tailored solutions for what’s next 04/18/23
9
Client-tailored solutions for what’s next 04/18/23
10
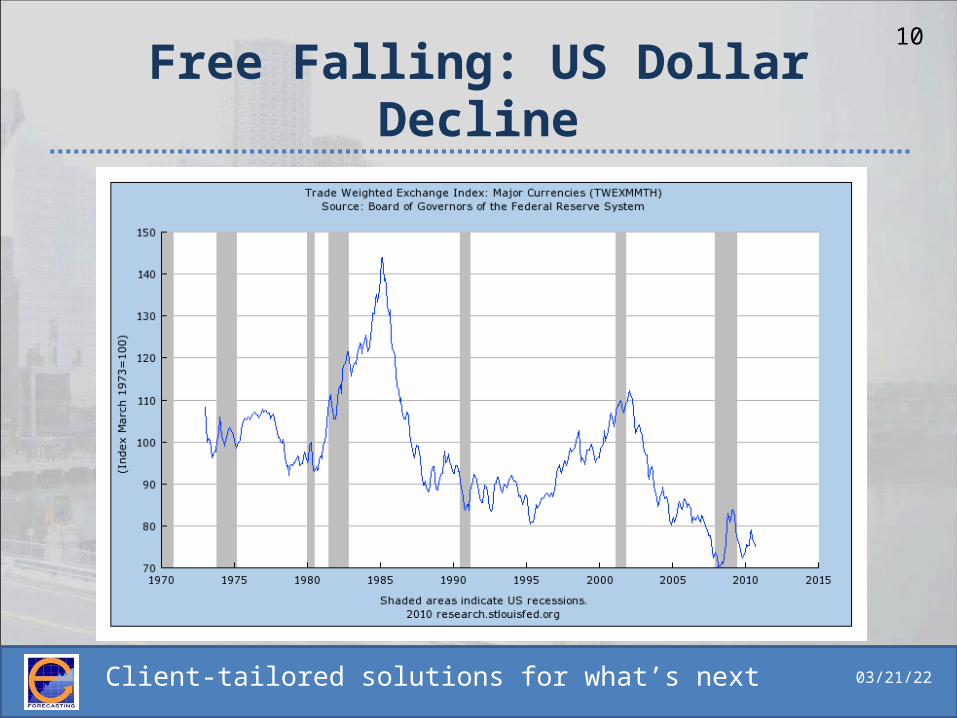
Free Falling: US Dollar Decline

Client-tailored solutions for what’s next 04/18/23
11
Fed in a printing mode again
Client-tailored solutions for what’s next 04/18/23
12
Real-Time Look @ Economy NOW
What is happening RIGHT now with the economy– US monthly GDP, current macro
components, policies, etc

Client-tailored solutions for what’s next 04/18/23
13
Real Time Monthly GDP
• e-forecasting estimates US monthly GDP increased 0.8% in September to $13,243B, after going up 2.4% in August
• Annual growth rate in the third quarter is estimated to be 1%
• Six-month growth rate, which signals confirmation of turning points, went up 1.8% in September, after going up 2.1% in August
$12,900
$13,000
$13,100
$13,200
$13,300
J F M Q1 A M J Q2 J A S Q3
Monthly GDP Up in September
BEA, Quarterly e-forecasting, Monthly
Client-tailored solutions for what’s next
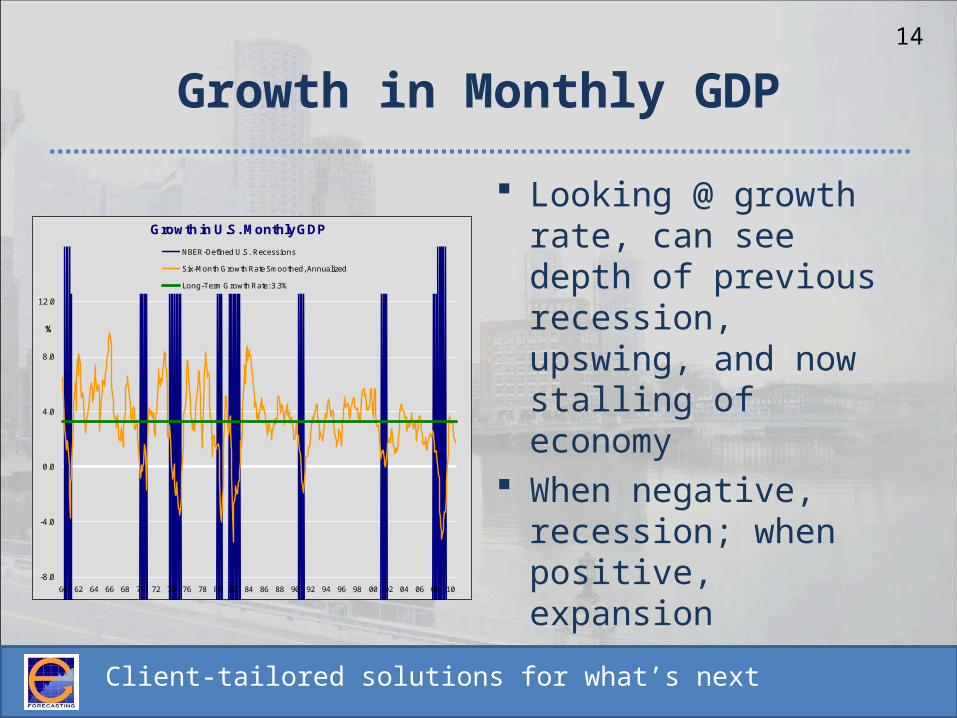
Growth in Monthly GDP
Looking @ growth rate, can see depth of previous recession, upswing, and now stalling of economy
When negative, recession; when positive, expansion
14
-8.0
-4.0
0.0
4.0
8.0
12.0
60 62 64 66 68 70 72 74 76 78 80 82 84 86 88 90 92 94 96 98 00 02 04 06 08 10
%
Growth in U.S. Monthly GDP
NBER-Defined U.S. Recessions
Six-Month Growth Rate Smoothed, Annualized
Long-Term Growth Rate: 3.3%
Client-tailored solutions for what’s next
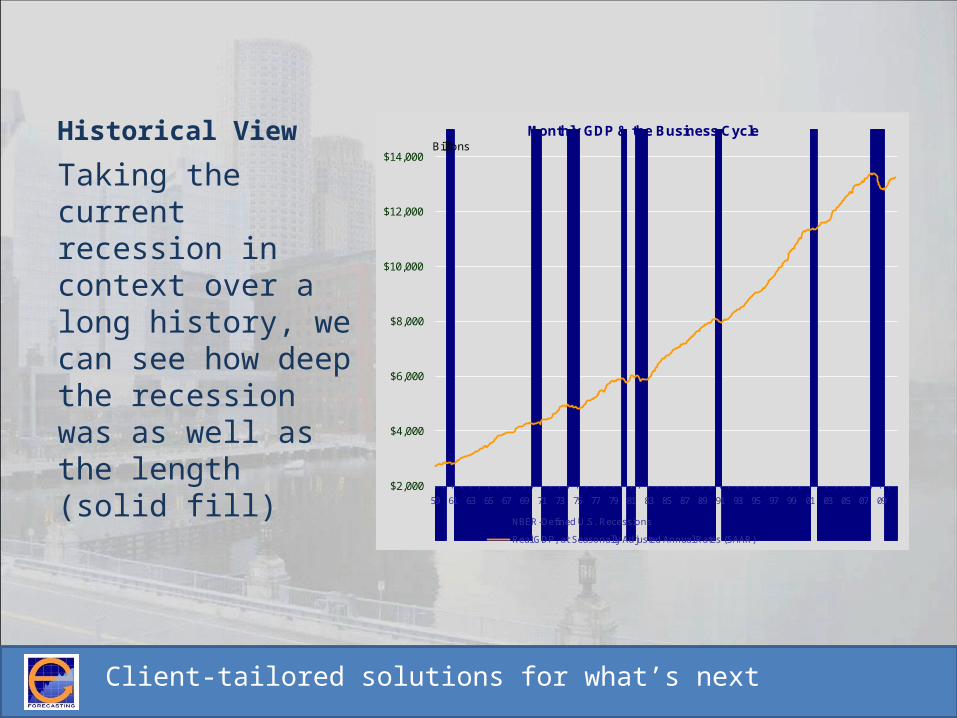
Historical View
Taking the current recession in context over a long history, we can see how deep the recession was as well as the length (solid fill)
$2,000
$4,000
$6,000
$8,000
$10,000
$12,000
$14,000
59 61 63 65 67 69 71 73 75 77 79 81 83 85 87 89 91 93 95 97 99 01 03 05 07 09
BillionsMonthly GDP & the Business Cycle
NBER-Defined U.S. Recessions
Real GDP, at Seasonally Adjusted Annual Rates (SAAR)
Client-tailored solutions for what’s next
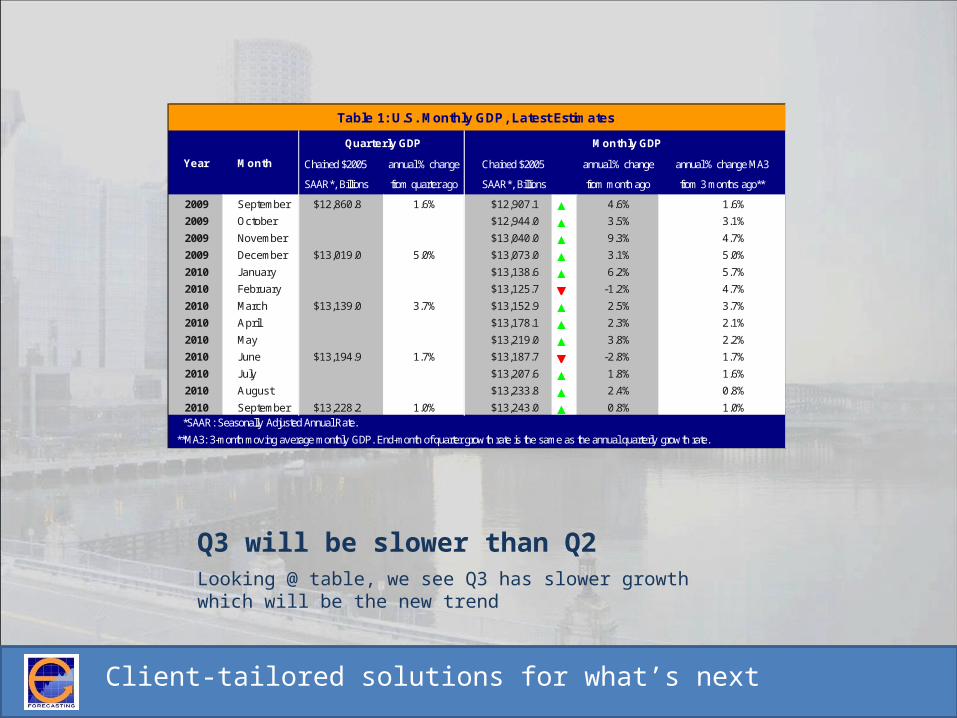
Q3 will be slower than Q2Looking @ table, we see Q3 has slower growth which will be the new trend
Chained $2005 annual % change annual % change annual % change MA3
SAAR*, Billions from quarter ago from month ago from 3 months ago**
2009 September $12,860.8 1.6% $12,907.1 ▲ 4.6% 1.6%
2009 October $12,944.0 ▲ 3.5% 3.1%
2009 November $13,040.0 ▲ 9.3% 4.7%
2009 December $13,019.0 5.0% $13,073.0 ▲ 3.1% 5.0%
2010 January $13,138.6 ▲ 6.2% 5.7%
2010 February $13,125.7 ▼ -1.2% 4.7%
2010 March $13,139.0 3.7% $13,152.9 ▲ 2.5% 3.7%
2010 April $13,178.1 ▲ 2.3% 2.1%
2010 May $13,219.0 ▲ 3.8% 2.2%
2010 June $13,194.9 1.7% $13,187.7 ▼ -2.8% 1.7%
2010 July $13,207.6 ▲ 1.8% 1.6%
2010 August $13,233.8 ▲ 2.4% 0.8%
2010 September $13,228.2 1.0% $13,243.0 ▲ 0.8% 1.0% *SAAR: Seasonally Adjusted Annual Rate.
Year
Quarterly GDP
Table 1: U.S. Monthly GDP, Latest Estimates
**MA3: 3-month mov ing av erage monthly GDP. End-month of quarter grow th rate is the same as the annual quarterly grow th rate.
Monthly GDP
Chained $2005
SAAR*, Billions
Month

Client-tailored solutions for what’s next 04/18/23
17
What’s Ahead?
Focus on manufacturing, inflation, other major factors
Global overview Exports/imports outlook

Client-tailored solutions for what’s next 04/18/23
18
Short-Term Outlook: US Lead
Using leading indicator helps with short-term forecast and turning point identification
US leading indicator has been slowing down last few months
Six month growth rate was negative for first time since May 09 in last report
0
20
40
60
80
100
120
59 63 67 71 75 79 83 87 91 95 99 03 07
© 2010 e-forecasting.com
e-forecasting Leading Economic Index
U.S. Recessions* eLEI, 2000=100

Client-tailored solutions for what’s next 04/18/23
19
Short-Term Outlook: US Lead
Six month growth rate was negative for first time since May 09 in last report
-20
-10
0
10
20
59 63 67 71 75 79 83 87 91 95 99 03 07
Expansion and Recession Signals from Growth in eLEI
Six-Month Growth Rate Smoothed, Annualized, in eLEI
U.S. Long-Term Growth Rate: 3.3%

Client-tailored solutions for what’s next 04/18/23
20US Leading indicator shows
double dip probabilities
4%
3%
3%
1%
19%
2%
1%
3%
32%
61%
52%
44%
0% 25% 50% 75% 100%
Oct-09
Nov-09
Dec-09
Jan-10
Feb-10
Mar-10
Apr-10
May-10
Jun-10Jul-10
Aug-10
Sep-10
Recession Probabilities
Client-tailored solutions for what’s next 04/18/23
21
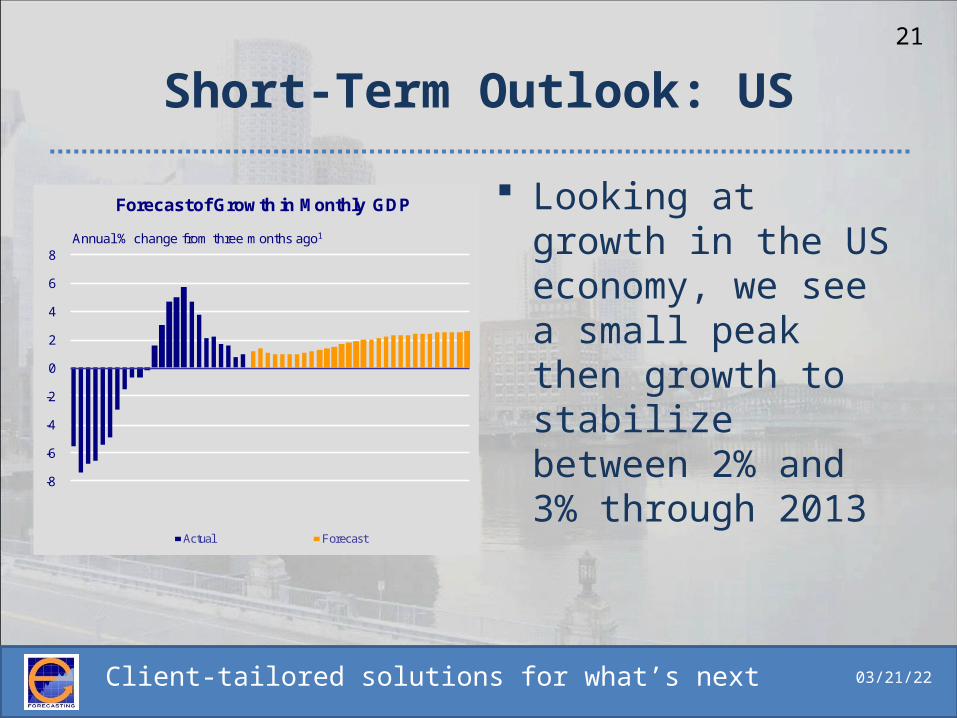
Short-Term Outlook: US
Looking at growth in the US economy, we see a small peak then growth to stabilize between 2% and 3% through 2013
-8
-6
-4
-2
0
2
4
6
8Annual % change from three months ago1
Forecast of Growth in Monthly GDP
Actual Forecast

Client-tailored solutions for what’s next 04/18/23
22
US Manufacturing
Manufacturing recovery will slow then continue, yet not reach peak of 06
80
85
90
95
100
105
00:Sep 02:Sep 04:Sep 06:Sep 08:Sep 10:Sep 12:Sep
Index, 2007=100
Manufacturing Production
Client-tailored solutions for what’s next 04/18/23
23
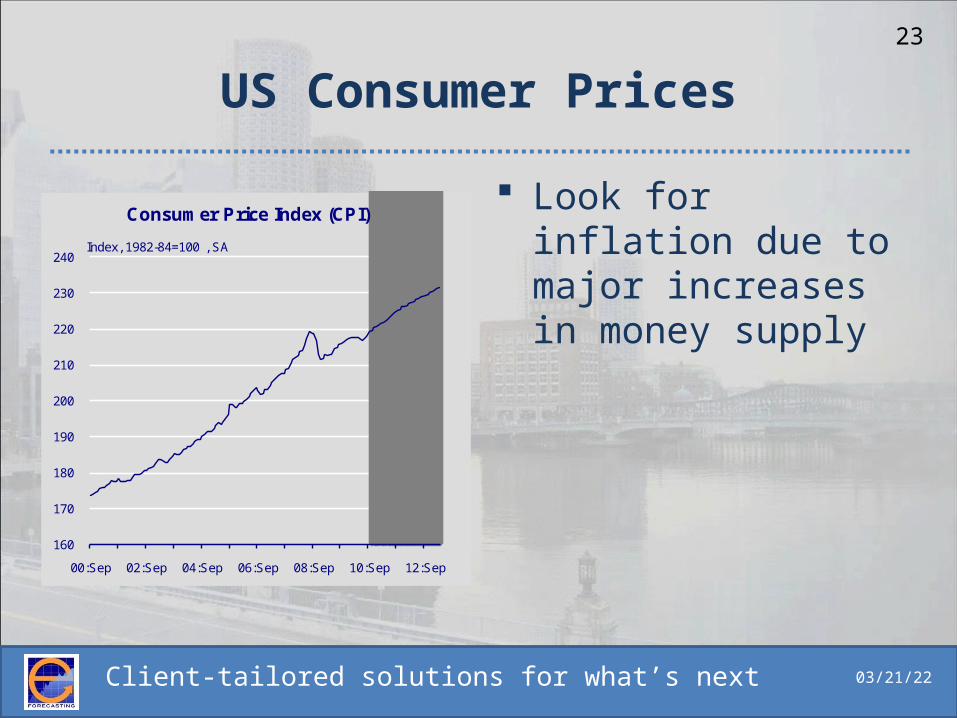
US Consumer Prices
Look for inflation due to major increases in money supply
160
170
180
190
200
210
220
230
240
00:Sep 02:Sep 04:Sep 06:Sep 08:Sep 10:Sep 12:Sep
Index, 1982-84=100 , SA
Consumer Price Index (CPI)

Client-tailored solutions for what’s next 04/18/23
24
US Durable Goods
Consumer expenditures on durable goods will continue to recover nearing $1,300 trillion at 2005 constant prices
$700
$800
$900
$1,000
$1,100
$1,200
$1,300
00:Sep 02:Sep 04:Sep 06:Sep 08:Sep 10:Sep 12:Sep
In Billions, SAAR
Consumer Expenditures on Durables
Client-tailored solutions for what’s next 04/18/23
25
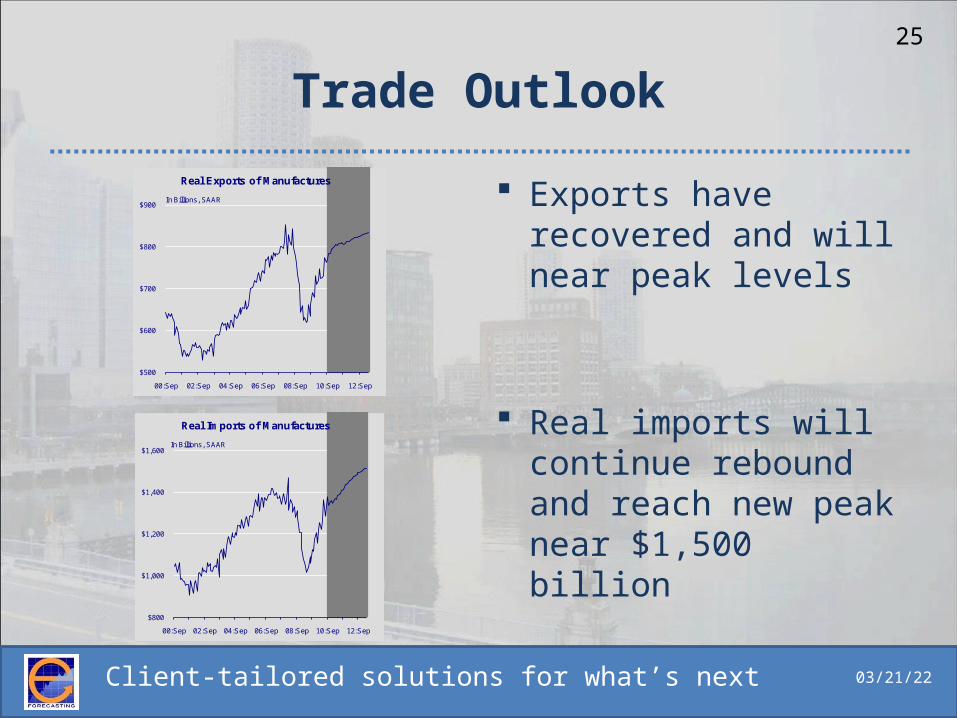
Trade Outlook
Exports have recovered and will near peak levels
Real imports will continue rebound and reach new peak near $1,500 billion
$500
$600
$700
$800
$900
00:Sep 02:Sep 04:Sep 06:Sep 08:Sep 10:Sep 12:Sep
In Billions, SAAR
Real Exports of Manufactures
$800
$1,000
$1,200
$1,400
$1,600
00:Sep 02:Sep 04:Sep 06:Sep 08:Sep 10:Sep 12:Sep
In Billions, SAAR
Real Imports of Manufactures
Client-tailored solutions for what’s next 04/18/23
26
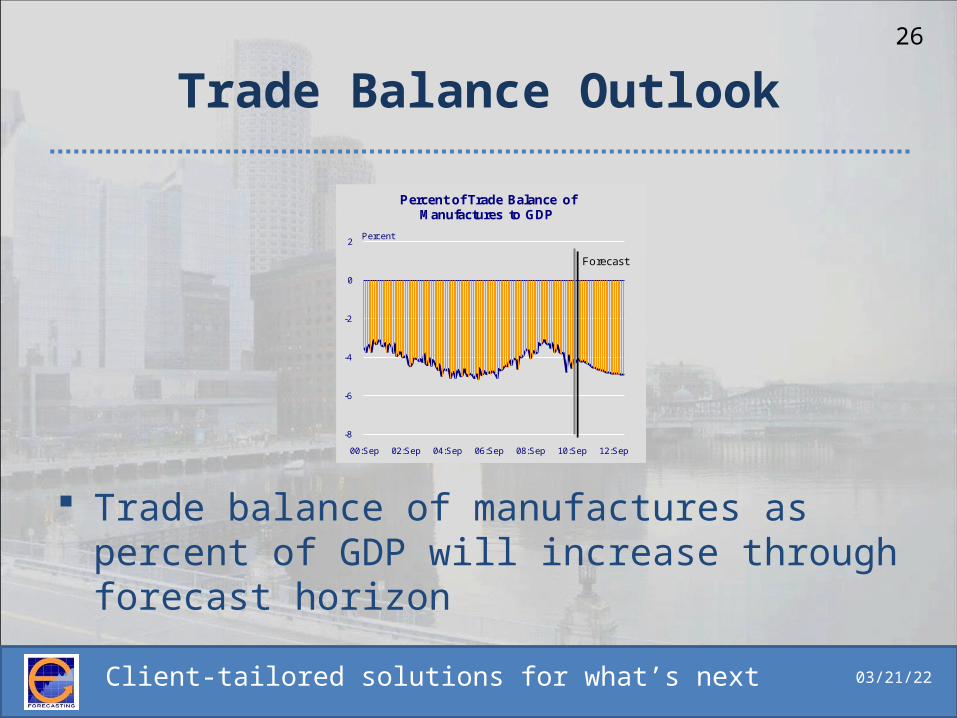
Trade Balance Outlook
Trade balance of manufactures as percent of GDP will increase through forecast horizon
-8
-6
-4
-2
0
2
00:Sep 02:Sep 04:Sep 06:Sep 08:Sep 10:Sep 12:Sep
Forecast
Percent
Percent of Trade Balance of Manufactures to GDP
Client-tailored solutions for what’s next 04/18/23
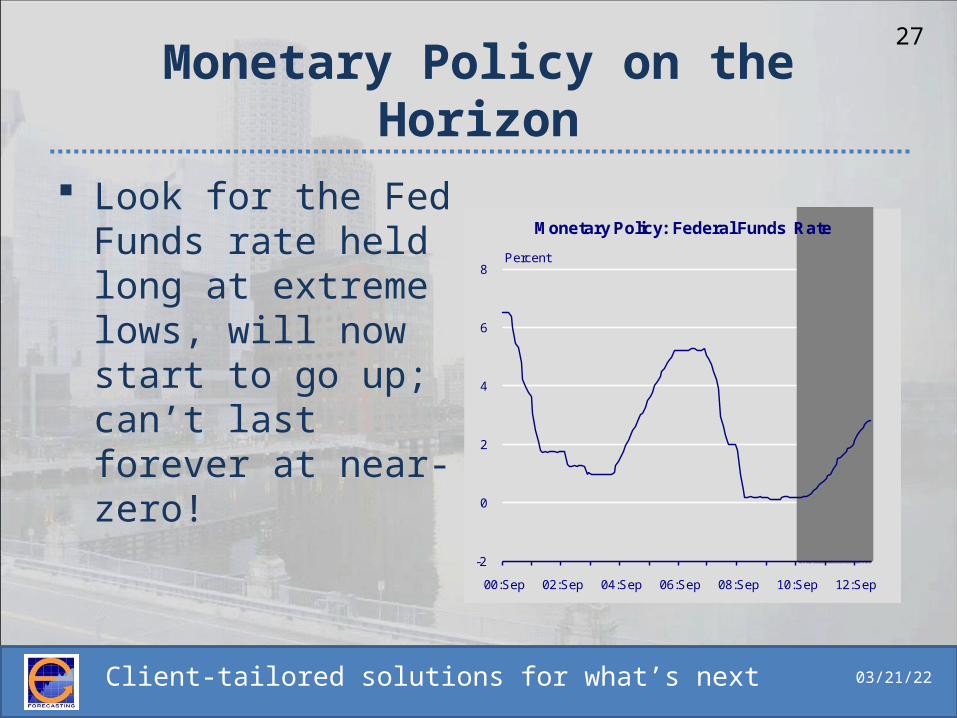
27Monetary Policy on the
Horizon Look for the Fed
Funds rate held long at extreme lows, will now start to go up; can’t last forever at near-zero!
-2
0
2
4
6
8
00:Sep 02:Sep 04:Sep 06:Sep 08:Sep 10:Sep 12:Sep
Percent
Monetary Policy: Federal Funds Rate

Client-tailored solutions for what’s next 04/18/23
28
Global Future Outlook
Looking @ major economic blocs and their leading indicators helps give an idea of turning points, which areas suffered more than others and which will come out of recession faster and stronger…
Client-tailored solutions for what’s next 04/18/23
29
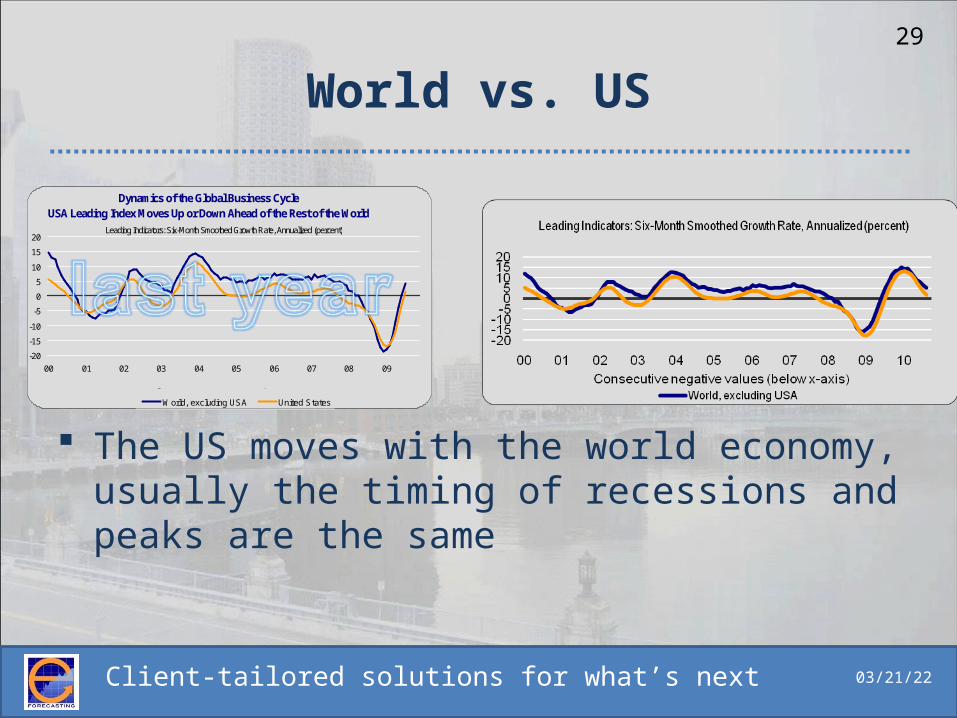
World vs. US
The US moves with the world economy, usually the timing of recessions and peaks are the same
Dynamics of the Global Business Cycle USA Leading Index Moves Up or Down Ahead of the Rest of the World
-20
-15
-10
-5
0
5
10
15
20
00 01 02 03 04 05 06 07 08 09
Leading Indicators: Six-Month Smoothed Growth Rate, Annualized (percent)
World, excluding USA United States
Consecutive negative values (below x-axis) predict recessions

Client-tailored solutions for what’s next 04/18/23
30
BRIC Attack
BRIC HAD been continually outperforming the world and USED TO move out of recession much faster
BRIC is now slowing down at same time and pace as the rest of the world
Early Warning Signals for Booms and Busts in BRIC Area
-20
-15
-10
-5
0
5
10
15
20
00 01 02 03 04 05 06 07 08 09
Leading Indicators: Six-Month Smoothed Growth Rate, Annualized (percent)
World BRIC Area
Consecutive negative values (below x-axis) predict recessions
Client-tailored solutions for what’s next 04/18/23
31
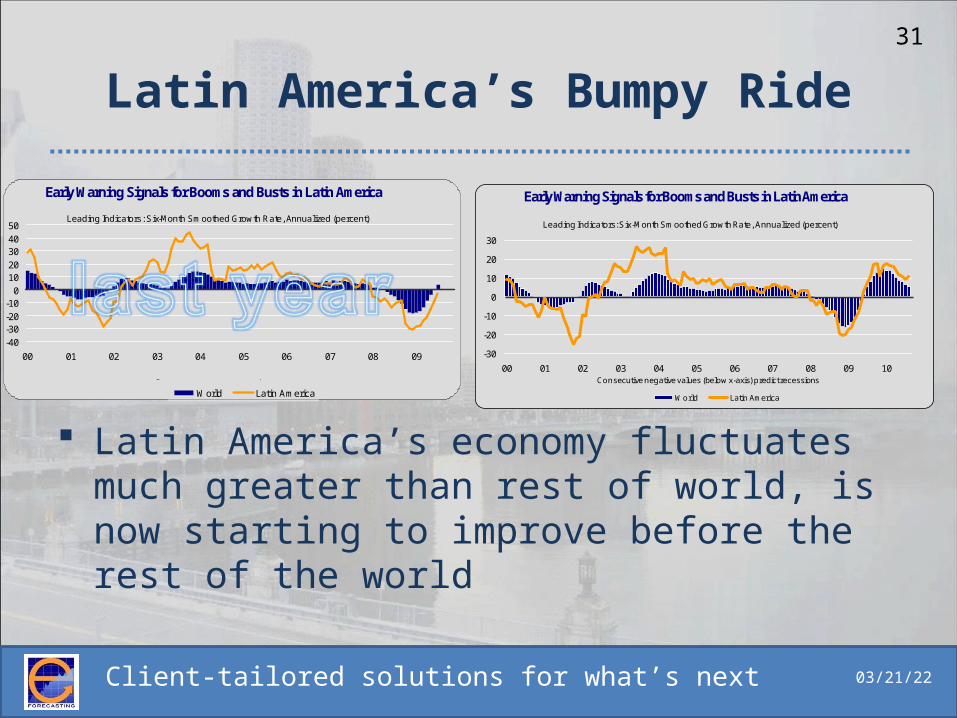
Latin America’s Bumpy Ride
Latin America’s economy fluctuates much greater than rest of world, is now starting to improve before the rest of the world
Early Warning Signals for Booms and Busts in Latin America
-40-30-20-10
01020304050
00 01 02 03 04 05 06 07 08 09
Leading Indicators: Six-Month Smoothed Growth Rate, Annualized (percent)
World Latin America
Consecutive negative values (below x-axis) predict recessions
-30
-20
-10
0
10
20
30
00 01 02 03 04 05 06 07 08 09 10
Leading Indicators: Six-Month Smoothed Growth Rate, Annualized (percent)
Early Warning Signals for Booms and Busts in Latin America
World Latin America
Consecutive negative values (below x-axis) predict recessions
Client-tailored solutions for what’s next 04/18/23
32
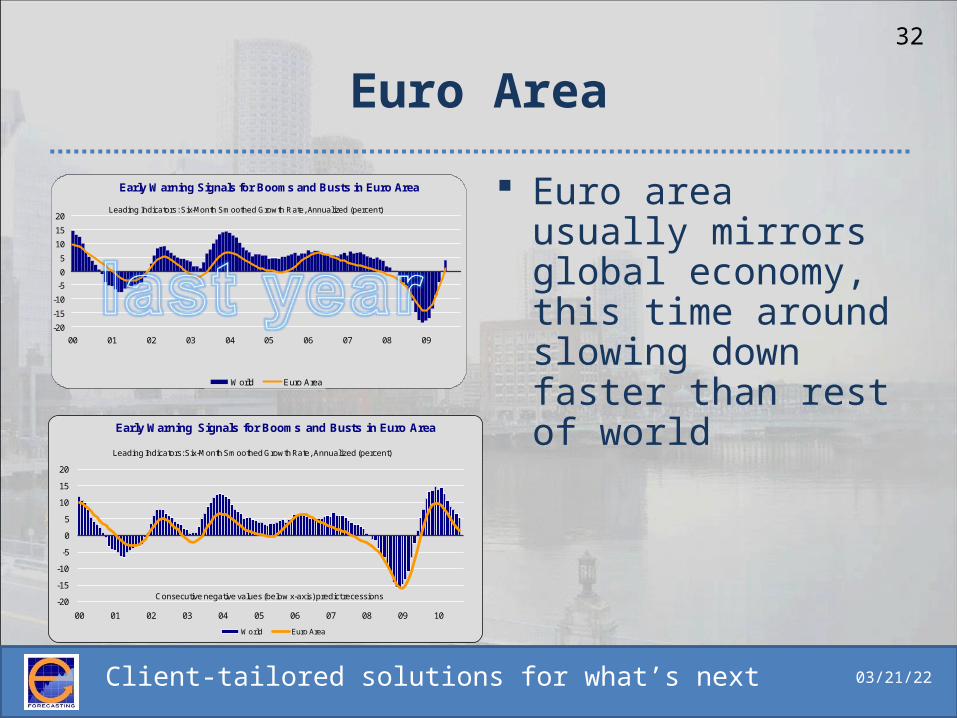
Euro Area
Early Warning Signals for Booms and Busts in Euro Area
-20
-15
-10
-5
0
5
10
15
20
00 01 02 03 04 05 06 07 08 09
Leading Indicators: Six-Month Smoothed Growth Rate, Annualized (percent)
World Euro Area
Consecutive negative values (below x-axis) predict recessions
Euro area usually mirrors global economy, this time around slowing down faster than rest of world
-20
-15
-10
-5
0
5
10
15
20
00 01 02 03 04 05 06 07 08 09 10
Leading Indicators: Six-Month Smoothed Growth Rate, Annualized (percent)
Early Warning Signals for Booms and Busts in Euro Area
World Euro Area
Consecutive negative values (below x-axis) predict recessions
Client-tailored solutions for what’s next 04/18/23
33
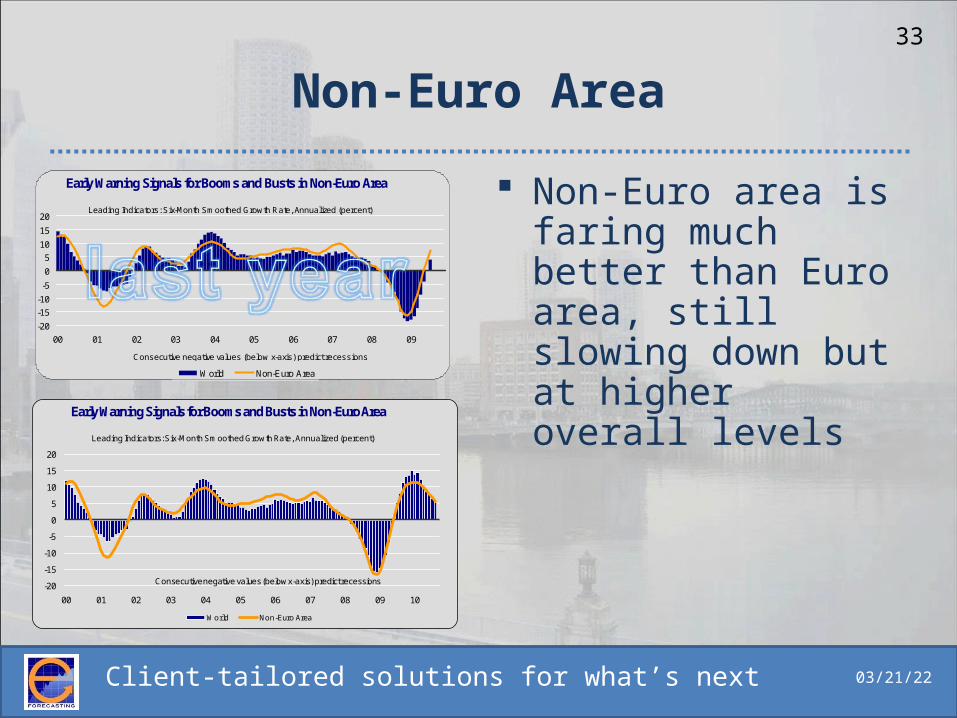
Non-Euro Area
Non-Euro area is faring much better than Euro area, still slowing down but at higher overall levels
Early Warning Signals for Booms and Busts in Non-Euro Area
-20
-15
-10
-5
0
5
10
15
20
00 01 02 03 04 05 06 07 08 09
Leading Indicators: Six-Month Smoothed Growth Rate, Annualized (percent)
World Non-Euro Area
Consecutive negative values (below x-axis) predict recessions
-20
-15
-10
-5
0
5
10
15
20
00 01 02 03 04 05 06 07 08 09 10
Leading Indicators: Six-Month Smoothed Growth Rate, Annualized (percent)
Early Warning Signals for Booms and Busts in Non-Euro Area
World Non-Euro Area
Consecutive negative values (below x-axis) predict recessions
Client-tailored solutions for what’s next 04/18/23
34
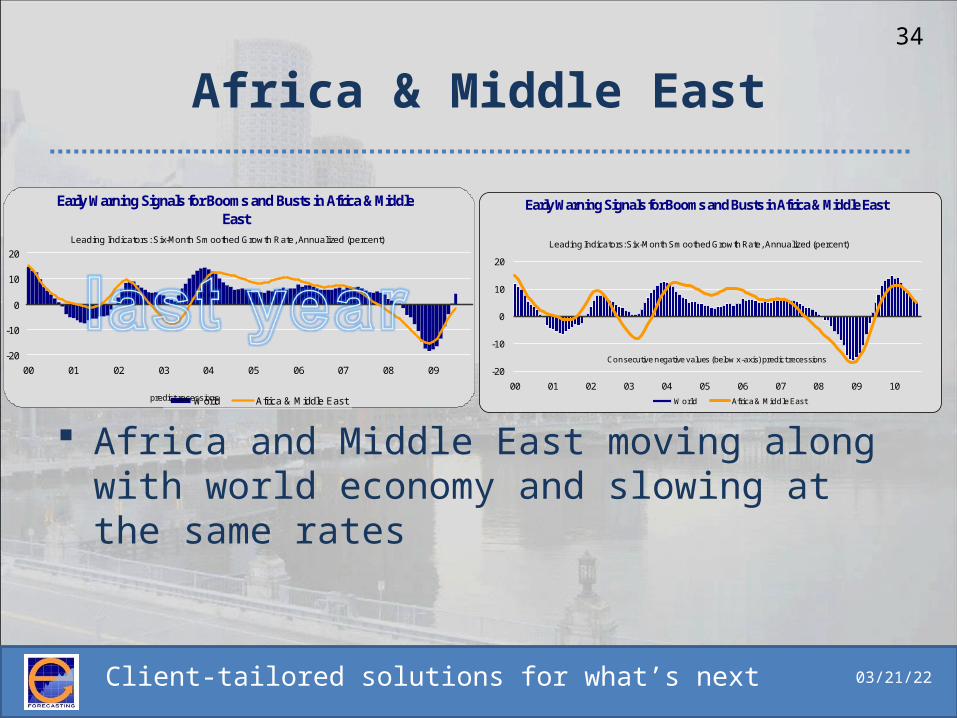
Africa & Middle East
Africa and Middle East moving along with world economy and slowing at the same rates
Early Warning Signals for Booms and Busts in Africa & Middle East
-20
-10
0
10
20
00 01 02 03 04 05 06 07 08 09
Leading Indicators: Six-Month Smoothed Growth Rate, Annualized (percent)
World Africa & Middle East
Consecutive negative values (below x-axis) predict recessions
-20
-10
0
10
20
00 01 02 03 04 05 06 07 08 09 10
Leading Indicators: Six-Month Smoothed Growth Rate, Annualized (percent)
Early Warning Signals for Booms and Busts in Africa & Middle East
World Africa & Middle East
Consecutive negative values (below x-axis) predict recessions

Client-tailored solutions for what’s next 04/18/23
35
Asia Pacific
Asia Pacific showed a lot of strength coming out of recession but is also victim to the recent and upcoming slowdown
Early Warning Signals for Booms and Busts in Asia & Pacific Area
-24
-18
-12
-6
0
6
12
18
24
00 01 02 03 04 05 06 07 08 09
Leading Indicators: Six-Month Smoothed Growth Rate, Annualized (percent)
World Asia & Pacific Area
Consecutive negative values (below x-axis) predict recessions-20
-10
0
10
20
30
00 01 02 03 04 05 06 07 08 09 10
Leading Indicators: Six-Month Smoothed Growth Rate, Annualized (percent)
Early Warning Signals for Booms and Busts in Asia & Pacific Area
World Asia & Pacific Area
Consecutive negative values (below x-axis) predict recessions

Client-tailored solutions for what’s next 04/18/23
36Emerging Asia will carry global
economy
2009 2010 2011 2012 2009 2010 2011 2012
-0.97 0.27 0.36 0.44 -129.7 7.1 10.2 11.3
-0.68 0.17 0.20 0.24 -90.9 4.5 5.8 6.3
-0.29 0.10 0.15 0.19 -38.7 2.6 4.3 5.0
-0.43 0.21 0.22 0.21 -57.2 5.6 6.3 5.6
-0.79 0.48 0.36 0.49 -104.8 12.6 10.1 12.7
-0.58 0.33 0.22 0.34 -77.4 8.6 6.2 8.9
-0.01 0.35 0.25 0.24 -1.6 9.0 7.1 6.2
-0.32 0.35 0.26 0.26 -42.9 9.2 7.3 6.9
1.54 1.96 1.87 1.99 205.5 51.2 53.4 51.8
1.50 1.60 1.57 1.67 199.9 41.7 44.8 43.4
0.05 0.14 0.14 0.16 6.1 3.6 3.9 4.1
-0.7 3.8 3.5 3.8 100.0 100.0 100.0 100.0
ASIA & PACIFIC INDUSTRIAL
EMERGING ASIA
China & India
MIDDLE EAST & AFRICA
WORLD GROWTH1
1Sum of Regional Contributions Source: www.e-forecasting.com
Euro Area (euro16)
Non-Euro Members (11)
OTHER EUROPE
NORTH AMERICA
United States
SOUTH AMERICA
TABLE 2
CONTRIBUTION OF REGIONS TO GLOBAL GROWTH
REGIONPercentage Points Contribution Relative Contribution, Percent
EUROPEAN UNION (EU27)

Client-tailored solutions for what’s next 04/18/23
37
Market size

Client-tailored solutions for what’s next 04/18/23
38

Client-tailored solutions for what’s next 04/18/23
39
Long term global forecast
Client-tailored solutions for what’s next 04/18/23
40
Wrap Up
Find us on the web: http://www.e-forecasting.com
Fan us on Facebook:http://www.facebook.com/eforecasting
Follow CEO Maria on twitter: http://www.twitter.com/mesimos
Information taken from our forecast and reports, for subscription queries, please contact:
Maria [email protected] you!