u.s. army tank-automotive command mm0 i1 · mesh filter media in pleated ... u.s. army...
TRANSCRIPT

~ ,Z
%'• "No. 13203
"EVALUATION OF ULTRA FINE METAL
MESH FILTER MEDIA IN PLEATED
CONFIGURATION FOR APPLICATION
TO AIR FILTERS FOR DIESEL AND
TURBINE COMBAT VEHICLES
MARCH 1985
'po'ý o 11;7/William F. Bos, P.E.Donald H. OstbyLee Ann RamthunFil-Tech Systems, Inc.P.O. Box 992
By Muskegon, MI 49443
APPROVED FOR PUBLIC RELEASE:DISTRIBUTION UNLIMITED
U.S. ARMY TANK-AUTOMOTIVE COMMANDRESEARCH, DEVELOPMENT & ENGINEERING CENTERWarren, Michigan 48397-5000 p I1 II7mm0

NOTICES
This report is not to be construed as an official Departmentof the Army position.
Mention of any trade names or manufacturers in this reportshall not be construed as an official indorsment or approvalof such products or companies by the U.S. Government
Destroy this report when it is no longer needed. Do notreturn it to the originator.

UNCLASSI FI EDSECURITY CLASSIFICATION OF THIS PAGE
Form ApprovedREPORT DOCUMENTATION PAGE OMB No. 0704-0188___________________________________________E£p Date" Jun 30, 7986
la. REPORT SECURITY CLASSIFICATION lb. RESTRICTIVE MARKINGS
Unclassified none2a. SECURITY CLASSIFICATION AUTHORITY 3. DISTRIBUTION /AVAILABILITY OF REPORT
2b. DECLASSIFICATION /DOWNGRADING SCHEDULE unI imi ted
4. PERFORMING ORGANIZATION REPORT NUMBER(S) 5. MONITORING ORGANIZATION REPORT NUMBER(S)
132036a. NAME OF PERFORMING ORGANIZATION 6b. OFFICE SYMBOL 7a. NAME OF MONITORING ORGANIZATION
Fil-Tech Systems, Inc. (if applicable) DCASMA, Grand Rapids
6c. ADDRESS (City, State, and ZIP Code) 7b. ADDRESS (City, State, and ZIP Code)
P.O. Box 992 Riverview Cntr. Bldg.Muskegon, Mich. 49443 678 Front St., N.W.
Grand Rapids, Mich.Ba. NAME OF FUNDING/SPONSORING 8b. OFFICE SYMBOL 9. PROCUREMENT INSTRUMENT IDENTIFICATION NUMBER
ORGANIZATION U. S. Army (If applicable) !DAAE07-84-C-R015Tank Automotive Command . AMSTA-RGT
8c. ADDRESS (City, State, and ZIP Code) 10. SOURCE OF FUNDING NUMBERS
PROGRAM PROJECT TASK WORK UNITWarren, Michigan 48397-5000 ELEMENT NO. NO. NO. ACCESSION NO.
11. TITLE (Include Security Classification)Evaluation of Ultra Fine Metal Mesh Filter Media In Pleated ConfigurationFor Application to Air Filters for Diesel and Turbine Combat Vehicles(U)
12. PERSONAL AUTHOR(S)
Bos, William F., P.E., Ostby, Donald H., and Ramthun, Lee Ann13a. TYPE OF REPORT '3b. TIME COVERED 114. DATE OF REPORT (Year, Month, Day)15. PAGE COUNT
Final FROM 2/84 TO 9/85 1985, March 7416. SUPPLEMENTARY NOTATION
17. COSATI CODES 18. SUBJECT TERMS (Continue on reverse if necessary and identify by block number)
FIELD GROUP SUB-GROUPFilter Media, Metal Mesh, Dust Mat, Air Filter
19. ABSTRACT (Continue on reverse if necessary and identify by block number)
The program reported determined the effectiveness of metal mesh filtermedia for military vehicle air filters when used in a pleated con-figuration. Three media were tested and there performance was foundto be more than adequate.
20 DISTRIBUTION/AVAILABILITY OF'ABSTRACT J21 ABSTRACT SECURITY CLASSIFICATION[UNCLASSIFIED/UNLIMITED El SAME AS RPT. El DTIC USERSI UNCLAS5I FIrD
22a NAME OF RESPONSIBLE INDIVIDUAL 22b TELEPHONE (Include Area Code) I22c OFFICE SYMBOL
DD FORM 1473, 84 MAR 83 APR edition may be used until exhausted SLC-URITY LiASSIFICATION OF THIS PA'.,LAll other editions are obsolete. U NCL ASS I F I ED
_1-
FIL -TECH S YS TEMS INC.
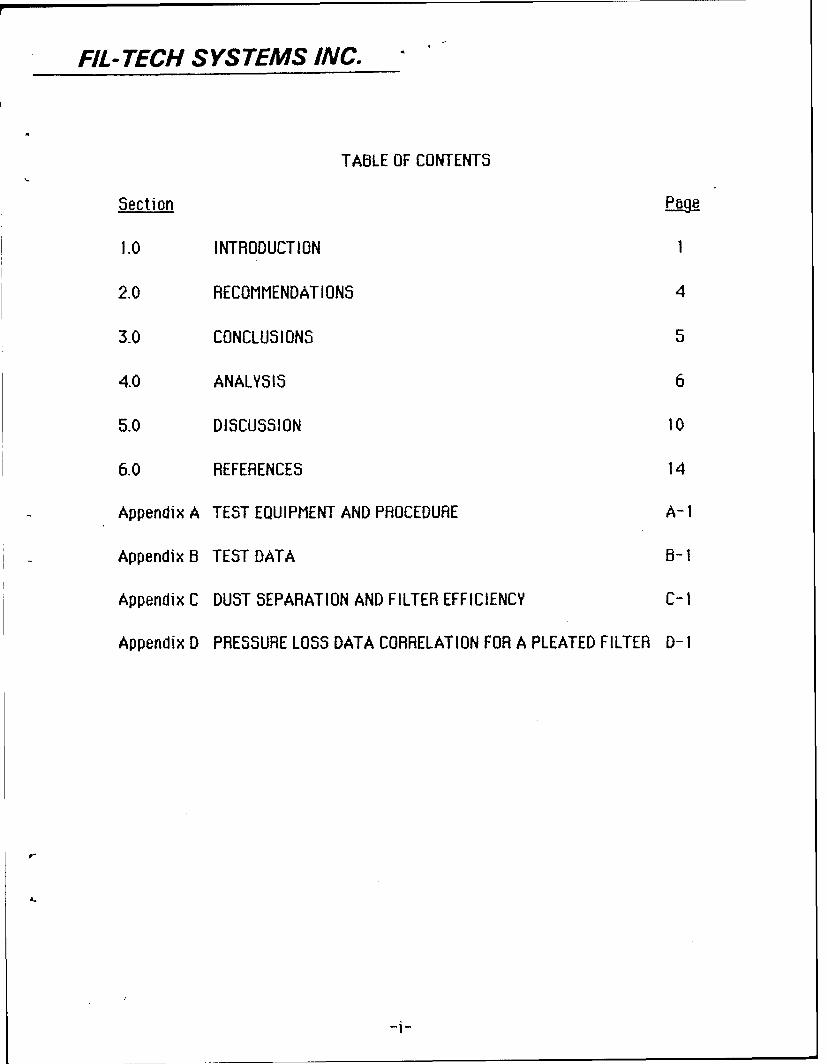
TABLE OF CONTENTS
Section Pbge
1.0 INTRODUCTION 1
2.0 RECOMMENDATIONS 4
3.0 CONCLUSIONS 5
4.0 ANALYSIS 6
5.0 DISCUSSION 10
6.0 REFERENCES 14
Appendix A TEST EQUIPMENT AND PROCEDURE A-I
Appendix B TEST DATA B-I
Appendix C DUST SEPARATION AND FILTER EFFICIENCY C-I
Appendix D PRESSURE LOSS DATA CORRELATION FOR A PLEATED FILTER D-1
A.

FIL- TECH SYSTEMS INC.
1.0 INTRODUCTION
One of the most troublesome items in military vehicle operations is the
maintenance of the engine air filters. Most of the problems are associated
with cleaning and replacing of the filter elements. The fabric media normally
used behave initially as depth filters. Some of the dust particles become
embedded in the medium. If they are not removed, the restriction across the
mat builds up to an unacceptable level after a few cleanings, and the filter
must be replaced. If the medium is cleaned with sufficient vigor to remove the
embedded particles, there is a high risk that the filter medium will be
damaged. Also, with the frequent removal, there is a high risk of damage to the
seals. As a result, engine damage due to air filter failure is frequent and
costly.
Air filter systems capable of self-cleaning and employing metal mesh
filter media have been developed for industrial applications. These systems
are covered by patents held by Mr. Donald Ostby of Fil-Tech Systems, Inc. If
these systems can be applied to military vehicle applications, there will be:
- no replacement or field servicing of the filter elements- no troublesome temporary seals- reduced space requirements- much more rugged construction
The U.S. Army Tank Automotive Command has undertaken a program to
determine if such a filter system can be applied to military vehicles. This
__________ ________-1-
FL -TECH S YS TEMS INC.
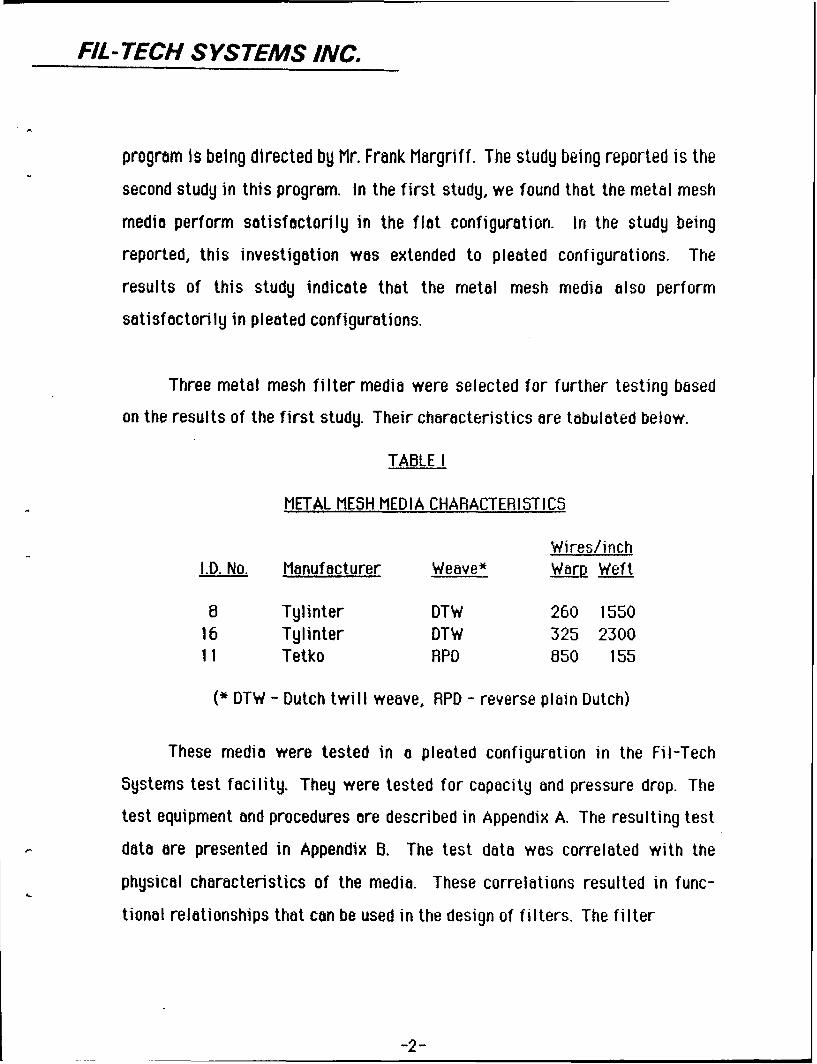
program is being directed by Mr. Frank Margriff. The study being reported is the
second study in this program. In the first study, we found that the metal mesh
media perform satisfactorily in the flat configuration. In the study being
reported, this investigation was extended to pleated configurations. The
results of this study indicate that the metal mesh media also perform
satisfactorily in pleated configurations.
Three metal mesh filter media were selected for further testing based
on the results of the first study. Their characteristics are tabulated below.
TABLE I
METAL MESH MEDIA CHARACTERISTICS
Wires/inchI.D. No. Manufacturer Weave* Warp Weft
8 Tylinter DTW 260 155016 Tylinter DTW 325 230011 Tetko RPD 850 155
(* DTW - Dutch twill weave, RPD - reverse plain Dutch)
These media were tested in a pleated configuration in the Fil-Tech
Systems test facility. They were tested for capacity and pressure drop. The
test equipment and procedures are described in Appendix A. The resulting test
data are presented in Appendix B. The test data was correlated with the
physical characteristics of the media. These correlations resulted in func-
tional relationships that can be used in the design of filters. The filter
-2-
FIL- TECH SYSTEMS INC.
performance correlation is discussed in detail in Appendix C and the pressure
loss correlation is discussed in detail in Appendix D.
-3-
FIL- TECH SYSTEMS INC.
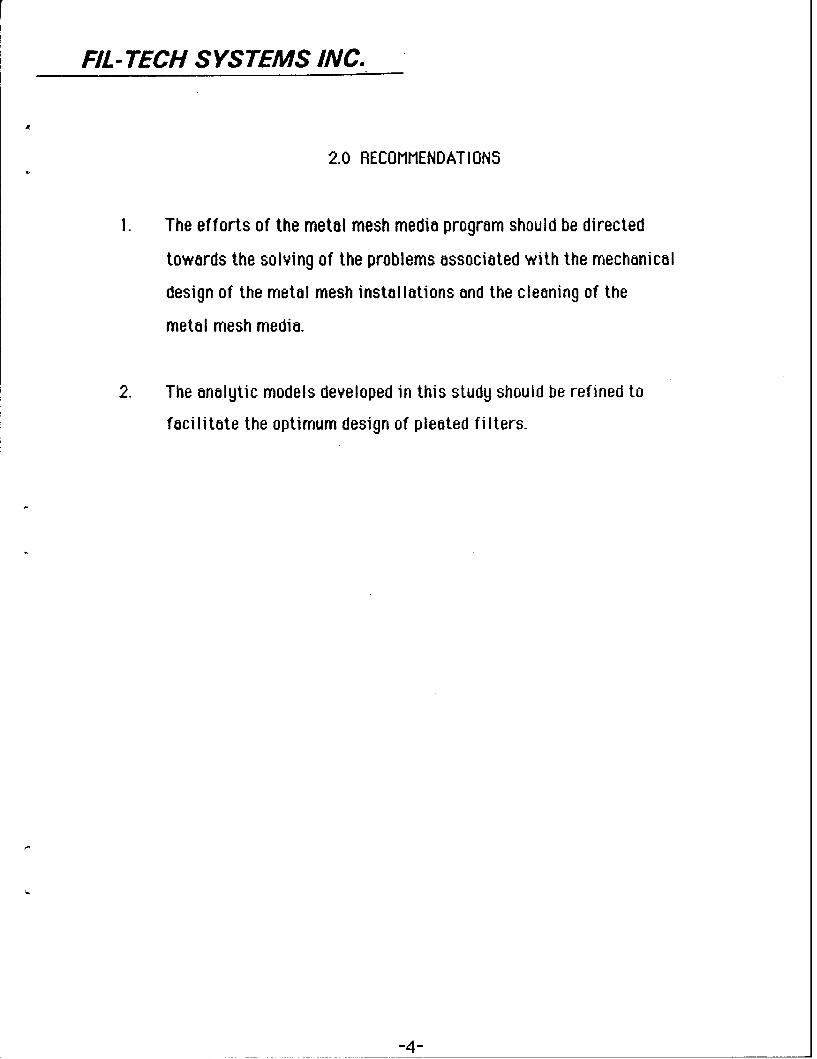
2.0 RECOMMENDATIONS
1. The efforts of the metal mesh media program should be directed
towards the solving of the problems associated with the mechanical
design of the metal mesh installations and the cleaning of the
metal mesh media.
2. The analytic models developed in this study should be refined to
facilitate the optimum design of pleated filters.
-4-

FIL- TECH SYSTEMS INC.
3.0 CONCLUSIONS
1. All of the performance characteristics of the conventional filter
media. can be matched with metal mesh filter media in pleated as
well as flat configurations.
2. The performance of pleated filters can be described analytically.
3. The remaining problems that must be investigated and solved
before metal mesh media can be implemented in military
vehicle applications are those associated with the mechanical
design.
-5-
FIL- TECH SYSTEMS INC.
4.0 ANALYSIS
The behavior of a pleated filter is much more difficult to analyze than
that of a flat filter. This is because dust deposited in a pleated filter takes on
a distribution such that the cross-section of the dust mat will have a catenary
shape. With this shape, the flow and efficiency will not only vary as a function
of time, like a flat filter, but also vary across the mat. The reason for this
catenary distribution is that the dust can only resist compressive loads. It
cannot resist shear loads. The only structural shape that satisfies these
criteria is a catenary.
Because the dust cannot resist shear flows, the flow into the mat must
be normal to the surface. If this is not the case, material will be sheared from
the surface by the tangential flow until the material is redistributed in such a
fashion that there is no tangential flow and resulting shear forces at the
surface. The surface will be normal to the streamlines of the entering flow
and must therefore represent a velocity potential surface.
Further, as the dust builds up on the surface, the flow will remain
normal to the curved planes that at one time were the surfaces of the mat.
These former dust mat surfaces will be the velocity potential surfaces and
their orthogonal trajectories will be the streamlines of the flow through the
mat. The velocity potential lines then can be approximated by the family of
hyperbolic cosine curves that pass through the two lips of the inlet to the
-6-

FIL- TECH SYSTEMS INC.
pleat. This is shown in the following sketch of an infinitely deep filter pleat.
I I_
N. >_., former Isra
if> / \- i trine TU__!. i ---xii~n
C-Eilta. Me iumh I ,,' ,iI- .• • _•D.,s i. t 'JLLP-.
SKETCH 1
STREAMLINES THROUGH A DUST MATWITH A CATENARY-SHAPED CROSS-SECTION
The flow along the streamlines will be governed by the Darcy Law of
Permeability. So, along any streamline, the total pressure loss will be
proportional to the integral of the velocity with distance. Then the flow rate
along the long complex streamlines will be much less than that along the short
steamlines. It is likely that a reasonable analytic approximation to the flow
system can be made by replacing the streamlines with straight lines
perpendicular to the face of the filter medium. When this was done, we found
that the results correlated surprisingly well with our test results. The details
of the analytic model and data correlation are discussed in detail in Appendix E.
This analytic model provides the means by which the results of this study can
be used to estimate the pressure loss and capacity of other pleated filter
configurations.
-7-
FIL- TECH SYSTEMS INC.
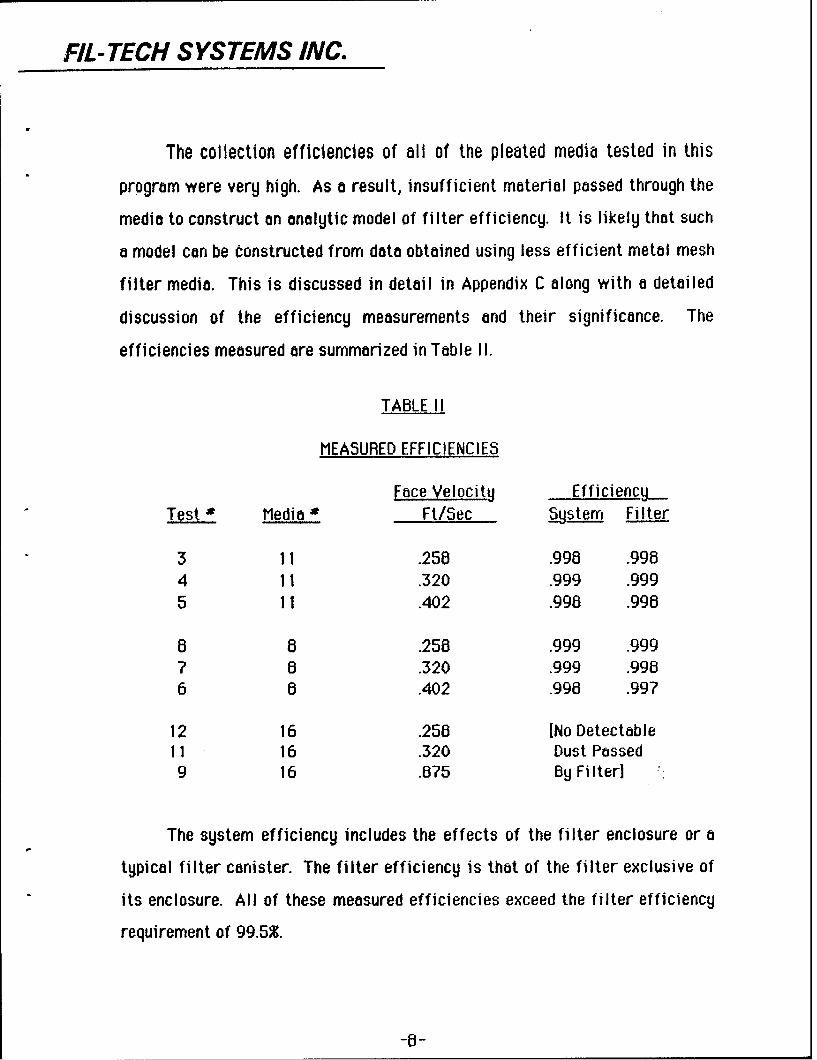
The collection efficiencies of all of the pleated media tested in this
program were very high. As a result, insufficient material passed through the
media to construct an analytic model of filter efficiency. It is likely that such
a model can be constructed from data obtained using less efficient metal mesh
filter media. This is discussed in detail in Appendix C along with a detailed
discussion of the efficiency measurements and their significance. The
efficiencies measured are summarized in Table II.
TABLE II
MEASURED EFFICIENCIES
Face Velocity Efficiency___Test # Media * Ft/Sec ý_ystem Filter
3 11 .258 .998 .9984 11 .320 .999 .9995 11 .402 .998 .998
8 8 .258 .999 .9997 8 .320 .999 .9986 8 .402 .998 .997
12 16 .258 [No Detectable11 16 .320 Dust Passed9 16 .875 By Filter]
The system efficiency includes the effects of the filter enclosure or a
typical filter canister. The filter efficiency is that of the filter exclusive of
its enclosure. All of these measured efficiencies exceed the filter efficiency
requirement of 99.5%.
-8-
FIL- TECH SYSTEMS INC.
The previously discussed inability of a dust mat to resist shear loads is
only true to an approximation. If this were not true, a dust mat could not exist
on a filter with a vertically oriented face. In practice, the mat will build up
until the shear forces in the dust mat caused by accelerations or gravity exceed
the static friction forces in the mat. The mat will then shear off. The first
particles that are captured by the filter become embedded into the filter
medium. These particles will remain in the mat and, as a consequence, the
pressure loss through the mat will be somewhat greater than at the start of
mat buildup. If this process is repeated, additional retained particles will
remain embedded in the mat after each mat removal and this "permanent"
resistance will increase with each cycle.
This phenomena was tested in the pleated metal mesh media by exposing
a filter to a dust stream until the restriction reached the rated value. The mat
was then removed by rapping. The cycle was repeated several times and the
pressure loss history was recorded. These tests were Tests R- 1 through R- 11
in the test series being reported. The results are presented in Appendix B on
Figures 145 and 158. It can be seen that they exhibit the expected behavior.
A cellulose medium, typical of those presently being used, was supplied
by TACOM for a reference testing. The results of these tests are presented in
Appendix B on Figures 110, 12B and 138. It can be seen that the filter
performance characteristics of this media is comparable to that of the metal
mesh media.
_ _ _ _ _ _ _ _ -9-_ __ _
FIL- TECH SYSTEMS INC.
5.0 DISCUSSION
The simple analytic pressure loss model correlated surprisingly well
with the test data considering the simplifying assumptions. This can be seen
by inspecting Figures 5D through ?D. This gives us confidence in the accuracy
of both the test procedure and the mathematical analysis. The one test that did
not correlate well was Test Number 9. This test was run at a face velocity
considerably higher than the other tests. Factors that may have caused the
variation in this one test are:
1. Dust mat compression
2. Distortion of the filter media under the greateraerodynamic loads
3. The onset of the dominance of aerodynamic momentumlosses proportional to the square of the velocity
4. Test error
The negative curvature of the dust capacity curve, Figure ?D, suggests
that the second factor caused the deviant behavior. If this is the case, it is a
mechanical problem. Further consideration of this one test is clearly outside
the scope of the present investigation. The problems peculiar to high velocity
filtration are very interesting but will have to be addressed in future work.
By inspecting the correlation curves, Figures 5D through ?D, it can be
seen that during most of the dust collecting cycle of the pleated filters, the
-10-
FIL- TECH S YS TEMS INC.
pressure loss is of the order of 20% to 30% of that of a flat filter with the
same face area. Low pressure during operation results in greater engine
performance and fuel economy. Therefore, it may be desirable to enhance this
behavior even at the expense of filter life when designing a filter for a specific
application. The analytic model indicates that this can be done by increasing
the width of the pleats. This is an additional factor which must be considered
when designing a filter. Also, we found that the resistance during the initial
phase of dust collection and capacity are strong functions of the shape of the
bottom of the pleat. The convexed shape used in the test fixture is poor in this
regard. Flat or concaved bottoms are preferable. It appears that there is much
that can be gained by controlling the shape of the pleats in a filter. Because of
their high strength and ductility, this can readily be done with metal mesh
media if the appropriate fabrication techniques are employed.
The analytic model which was based on a simplistic physical model is
quite adequate for the present purposes. There is, however, considerable room
for improvement. It can most certainly be refined to produce more precise
results and perhaps be simplified mathematically. This will be critical for
optimizing designs in the future.
The most important performance quality that metal mesh media must
have to be used in military vehicle applications is satisfactory collection
efficiencies. The collection efficiencies of the configurations tested were
satisfactory. This was discussed in detail in the analysis section and Appendix
-Il1-
FIL- TECH SYSTEMS INC.
C. All of the efficiencies measured were greater than 99.7%. The requirement
we were given is 99.5%.
Because of the high efficiencies, we were able to collect only limited
data on the actual dust collection process. As a consequence of this and the
process's complexity, we were unable to develop a mathematical model of
collection efficiency. With the support of an appropriately designed test
program, a useful collection efficiency model can be developed for pleated
metal mesh filters. This is discussed in detail in Appendix C.
The ease with which the bulk of the dust can be removed from a surface
filter and the subsequent increase in permanent resistance after each removal
was demonstrated in Tests R-1 through R-I 1. This behavior is typical of all
surface filters regardless of the composition of the media. The primary filter
media is actually the dust mat. In many applications, media are actually
selected for their dust mat retention capability after a mild cleaning. After
several cleanings, even the initial resistance of the filter becomes too great.
If sufficient cleaning force is applied to remove the deeply embedded particles,
it will also damage the media in the filters presently being used, so they must
be discarded. The metal mesh media, however, have sufficient strength to
withstand such cleaning operations. This is the primary advantage of the metal
mesh media.
In this study we have demonstrated that metal mesh filter media are
-12-

FIL- TECH S YS TEMS INC.
readily available with filter performance properties that are equal to or
superior to those of the filter media commonly used in military vehicle
applications. These filter media function satisfactorily both in flat and
pleated configurations. We must now direct our efforts towards solving the
mechanical problems associated with the implementation of these media and
exploitation of their unique strength properties which permit effective
cleaning.
-13-

FIL- TECH SYSTEMS INC.
6.0 REFERENCES
1. Bos, William F., P.E., Donald H. Ostby and Lee Ann Ramthun,Preliminary Evaluation of Ultrafine Wire Mesh Filter Mediaf or Application to Air Fi Iters for Diesel and Turbine-Powered Combat Vehicles, U.S. Army Tank-AutomotiveCommand Research and Development Center Report 12891,January, 1984.
2. S.A.E. Recommended Practice, Air Cleaner Test Code,SAE J726, September, 1979.
-14-
FIL- TECH S YS TEMS INC.
APPENDIX A
TEST EQUIPMENT AND PROCEDURE
The media being tested behave as true surface filters, thus the tests
closely followed the procedure outlined in Paragraph 3 of Reference 2. The
primary deviations from this procedure were:
1. The initial efficiency tests were not performed.
2. The data was not corrected for variation in theambient temperature and humidity.
These deviations were made for economic reasons. They will have little effect
on the results as long as they are used for the purposes for which they were
intended: the preliminary screening of metal mesh media for future filter
development. The procedure of Reference 2, along with the current filter
medium specification, are primarily intended for acceptance testing, not
development testing.
Initial efficiency tests would be very lengthy and costly to run on our
test equipment. Because of the small size of the equipment, the initial
efficiency test would have to be cycled many times in order to obtain a
measurable amount of dust on the final filter. As explained in the discussion
section, there are no adequate criteria for initial efficiency for this
application and although it is not completely negligible, the initial efficiency
A-I
FIL- TECH S YS TEMS INC.
will not be of primary Importance to the selection of the medium for the
vehicle application.
The data was not corrected for ambient temperature and humidity
because we felt that the effort was better spent on additional testing and
analysis. The variation due to these effects would be small compared to the
phenomena we are trying to understand in this development program. The
ambient conditions were recorded and the data can be corrected in the future if
it is desired.
The Fil-Tech filter media test unit was used to collect this data. This
unit is designed to test surface media. It has a test section that will
accommodate a pleated medium sample with a .866 square foot of effective
filter face area. The test unit is shown schematically on Figure IA. The test
procedure is outlined on Table IA and the data collected for each test is listed
on Table IIA.
A-2

FIL- TECH SYSTEMS INC.
TABLE IA
PLEATED WOVEN WIRE FILTER MEDIA TEST PROCECURE
1. Install the flow control orifice plate in test system.
2. Install the final filter on the filter mounting frame.
3. Dry the final filter and frame in drying oven.
4. Weigh the final filter and frame to nearest 0.10 gram.
5. Mount the final filter assembly in the filter test section(gasketed on both sides).
6. Mount the filter media in the pleat forming and holding housing.
7. Clamp the pleat forming and holding housing together.
8. Caulk all around the filter media to seal the top, bottom and sides.
9. Mount the pleat forming and holding housing onto the filter mediatest system.
10. Mount the dust injector assembly onto the plea forming andholding housing.
11. Connect the inclined manometer across the fi Iter media.
12. Connect the inclined manometer across the orifice plate.
13. Set the Dwyer Photohelic Pressure Switch Gauge to zero.
14. Level and adjust (2) inclined manometers to read zero.
15. Plug the blower power cord into electrical outlet.
A-3
FIL- TECH S YS TEMS INC.
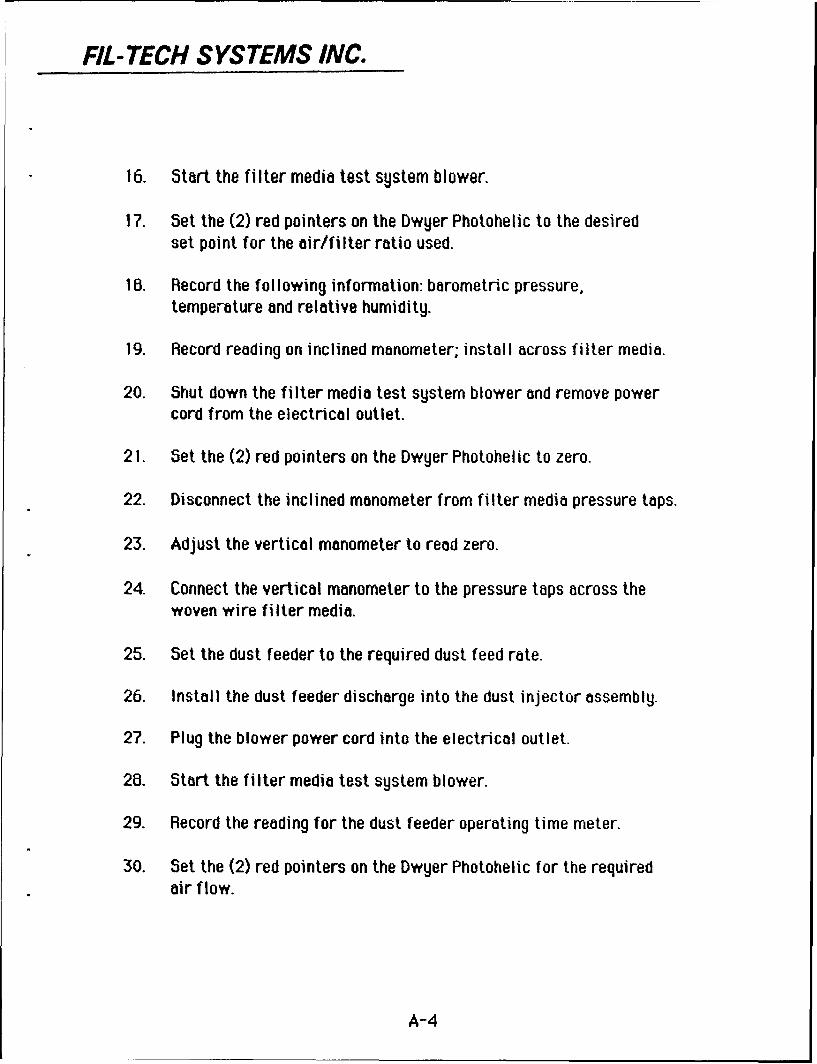
16. Start the filter media test system blower.
1?. Set the (2) red pointers on the Dwyer Photohelic to the desiredset point for the air/filter ratio used.
16. Record the following information: barometric pressure,
temperature and relatiye humidity.
19. Record reading on inclined manometer; install across filter media.
20. Shut down the filter media test system blower and remove powercord from the electrical outlet.
21. Set the (2) red pointers on the Dwyer Photohelic to zero.
22. Disconnect the inclined manometer from filter media pressure taps.
23. Adjust the vertical manometer to read zero.
24. Connect the vertical manometer to the pressure taps across thewoven wire filter media.
25. Set the dust feeder to the required dust feed rate.
26. Install the dust feeder discharge into the dust injector assembly.
2?. Plug the blower power cord into the electrical outlet.
28. Start the filter media test system blower.
29. Record the reading for the dust feeder operating time meter.
30. Set the (2) red pointers on the Dwyer Photohelic for the requiredair flow.
A-4

FIL- TECH SYSTEMS INC.
31. Start the dust feeder.
32. Record the dust feeder operating time meter when the verticalmanometer reads the following resistance across the filter media:1,2,3,4,5,6,7,8,9; 10, 11, 12, 13, 14, 15, 16, 1?, 18, 19 and 20.
33. When the resistance across the filter media reaches 20 in. w.c.,shut down the dust feeder and the fi Iter test system.
34. Record the reading from the dust feeder operating time meter.
35. Remove the dust feeder from the dust injector assembly.
36. Weigh sheet of newsprint and place under the dust injector assembly.
37. Remove the dust injector assembly, clean onto newsprint and recordweight of the dust removed from the injector assembly.
38. Weigh sheet of newsprint and place under the pleat forming andfixture housing.
39. Scrape the dust from the filter approach and the area betweenthe pleats onto the sheet of newsprint, weigh and record the weightof the dust removed from the filter approach.
40. Weigh sheet of newsprint and place under the pleat forming andholding housing.
41. Remove the pleat forming and holding housing from test system,rap the exterior of the housing so that the dust removed falI son the sheet of newsprint, weigh and record the weight of the dustremoved from the filter by rapping.
42. Remove the final filter and mounting frame from the filter mediatest system.
A-5

FIL- TECH SYSTEMS INC.
43. Place final filter and frame into oven, dry and record weight ofthe final filter and frame.
44. Blow out the dust remaining in the pleated fi Iter with 80 PSIcompressed air.
45. After the filter has been cleaned with compressed air, reassemblesystem and record the cleaned pleated fi Iter pressure drop.
A-6

FIL- TECH SYSTEMS INC.
TABLE IIA
FILTER TEST DATA LOG SHEET
I. Test No.: Will run in sequence.
2. Date: Date test was run.
3. Filter Weave: Filter media to be tested; weave is in wires per inch.
4. Sun lier: Will be Tylinter unless otherwise speci fied.
5. Orifice No.: The number of the flow control orifice that is installedfor test.
6. Delta 'P" (in. w.c.): Read on manometer connected across orifice plate.
7. Dwyer Set Point: Specified setting on Dwyer instrument (locatedon control panel).
8. Inlet Temperature: Read from thermometer on wall.
9. Barometric Pressure: Read from barometer on wall.
10. Relative Humidity: Read from instrument on wall.
11. Filter Area (sq ft.).: Effective area of filter tested.
12. System (cfm).: Cubic foot of air per minute through the test system.
13. Air/Filter Ratio: CFM/sq. ft. filter area.
14. Pressure Drop Across Filter After Test (in. w.c.): The pressuredrop across the filter after test.
A-?
FIL- TECH SYSTEMS INC.
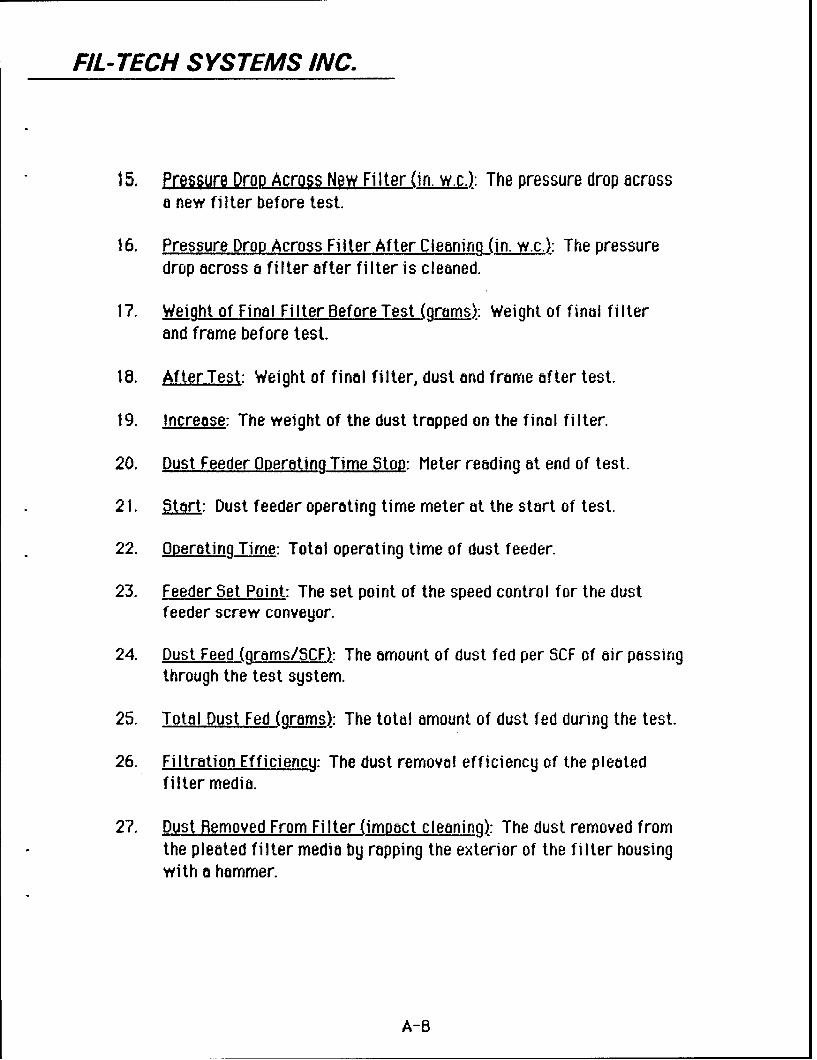
15. Pressure Drog Across New Filter in. w.c.): The pressure drop acrossa new filter before test.
16. Pressure Drop Across Filter After Cleaning (in. w.c.): The pressuredrop across a filter after filter is cleaned.
17. Weight of Final Filter Before Test (grams): Weight of final filterand frame before test.
18. After Test: Weight of final filter, dust and frame after test.
19. Increase: The weight of the dust trapped on the final filter.
20. Dust Feeder Operating Time Stop: Meter reading at end of test.
21. Start: Dust feeder operating time meter at the start of test.
22. Operating Time: Total operating time of dust feeder.
23. Feeder Set Point: The set point of the speed control for the dustfeeder screw conveyor.
24. Dust Feed (grams/SCF): The amount of dust fed per SCF of air passingthrough the test system.
25. Total Dust Fed (grams): The total amount of dust fed during the test.
26. Filtration Efficiency: The dust removal efficiency of the pleatedfilter media.
27. Dust Removed From Filter (impact cleaning): The dust removed fromthe pleated fi Iter media by rapping the exterior of the filter housingwith a hammer.
A-8
FIL- TECH SYSTEMS INC.
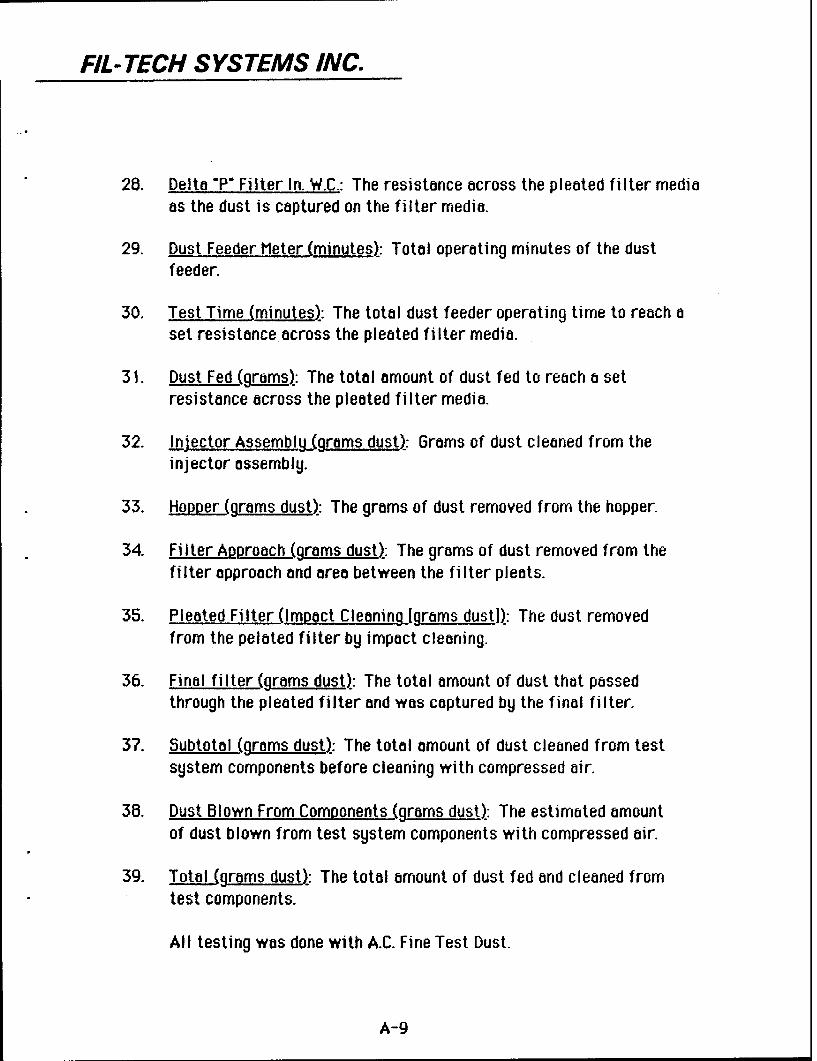
28. Delta "P" Filter In. W.C.: The resistance across the pleated filter mediaas the dust is captured on the filter media.
29. Dust Feeder Meter (minutes): Total operating minutes of the dustfeeder.
30. Test Time (minutes): The total dust feeder operating time to reach aset resistance across the pleated filter media.
31. Dust Fed (grams): The total amount of dust fed to reach a setresistance across the pleated filter media.
32. Injector Assembly I(grams dust): Grams of dust cleaned from the
injector assembly.
33. Hopoer (grams dust).: The grams of dust removed from the hopper.
34. Filter Approach (grams dust): The grams of dust removed from thefi Iter approach and area between the fi Iter pleats.
35. Pleated Filter (Impact Cleaning [grams dust]): The dust removedfrom the pelated filter by impact cleaning.
36. Final filter (grams dust): The total amount of dust that passedthrough the pleated filter and was captured by the final filter.
37. Subtotal (grams dust): The total amount of dust cleaned from testsystem components before cleaning with compressed air.
38. Dust Blown From Components (grams dust): The estimated amountof dust blown from test system components with compressed air.
39. Total (grams dust): The total amount of dust fed and cleaned fromtest components.
All testing was done with A.C. Fine Test Dust.
A-9

FIL- TECH S YS TEMS INC.
I Iz
-120
SCIIEMATIC OF FILTEk MEDIA TEST SY•,.I'm
I. Accu-rate dust feeder.
2. Dust feed hopper and hood.
3. Dust injector tube assembly.
4. Test system main air duct.
5. Pleated filter media.
6. Pleat forming filter housing.
7. Absolute final filter (efficiency 99.9Z for 0.10 micron particles).
8. Filter housing for the final filter.
9. Flow control orifice plate.
10. Motor-operated air flow control valve.
11. Air flow bypass line.
A-10
FIL- TECH S YS TEMS INC.
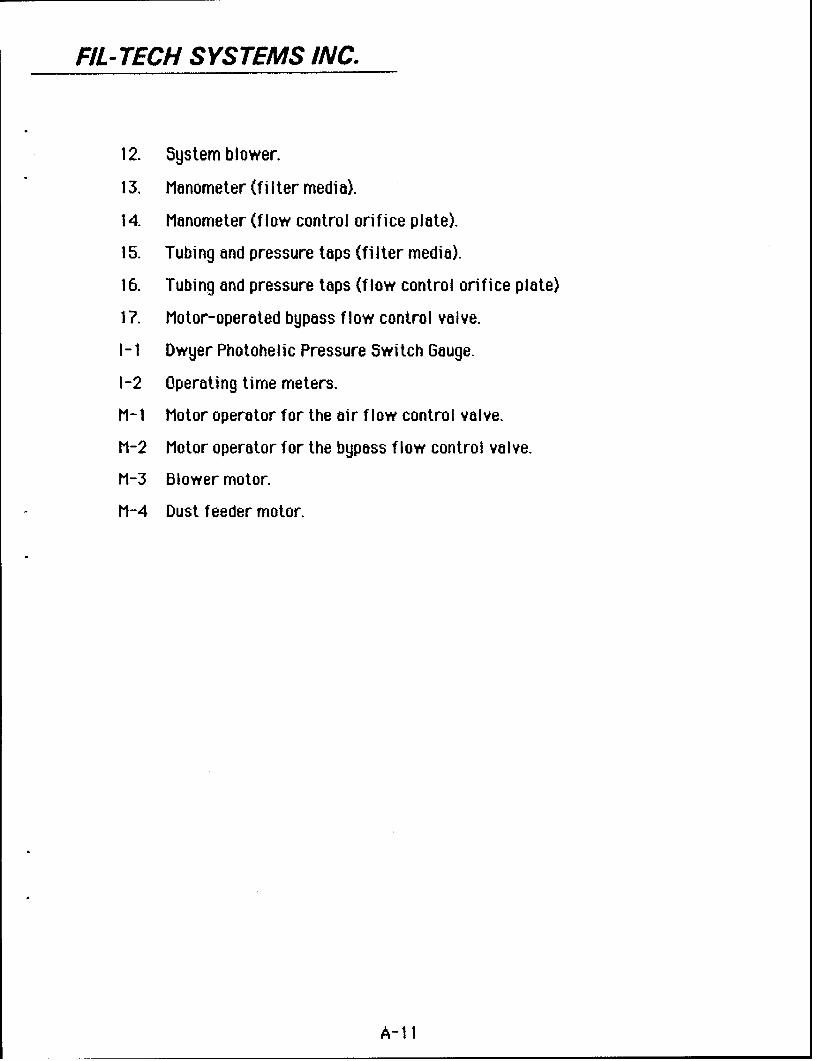
12. System blower.
13. Manometer (filter media).
14. Manometer (flow control orifice plate).
15. Tubing and pressure tops (filter media).
16. Tubing and pressure tops (flow control orifice plate)
17. Motor-operated bypass flow control valve.
I-i Dwyer Photohelic Pressure Switch Gouge.
1-2 Operating time meters.
M-1 Motor operator for the air flow control valve.
M-2 Motor operator for the bypass flow control valve.
M-3 Blower motor.
M-4 Dust feeder motor.
A-1I
FIL- TECH SYSTEMS INC.
APPENDIX B
TEST DATA
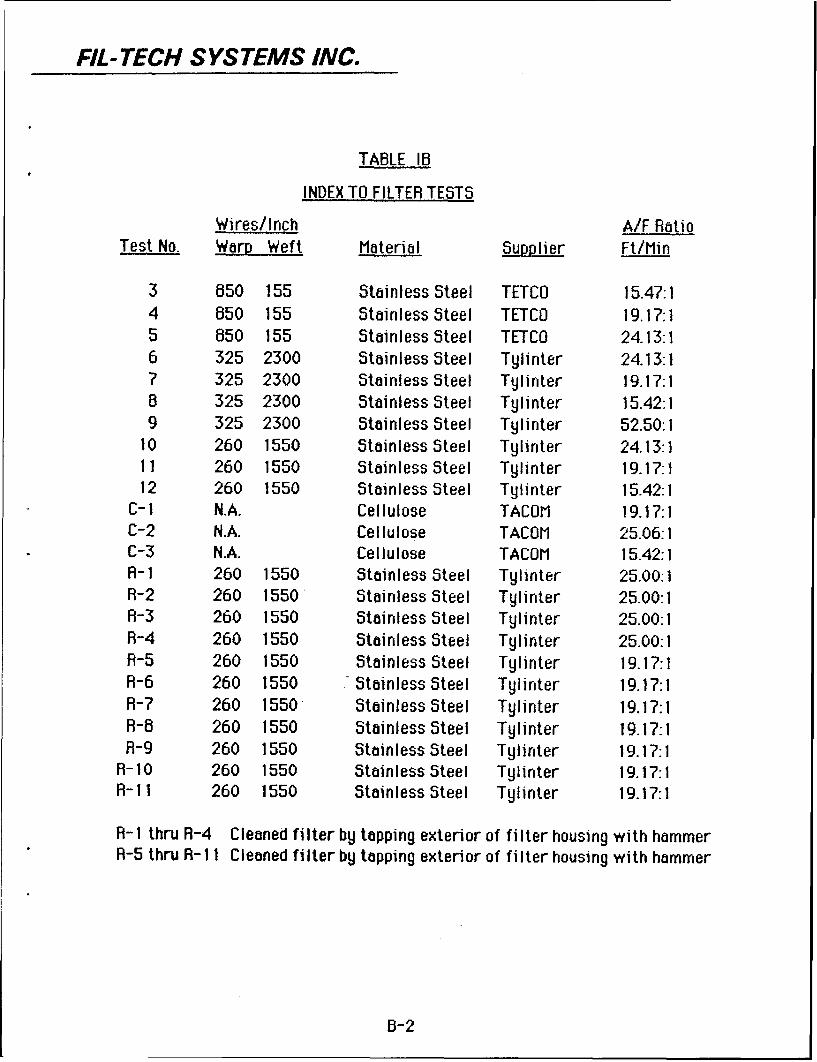
The experimental results are presented graphically on Figures 11B through
15B. An index to the test is given in Table 1B. The capacity data for the three
metal mesh media in a pleated configuration are presented on Figures 18
through 108. The metal mesh media were replaced by the cellulose medium
from the filter in current use by TACOM. The capacity data from these tests
are presented on Figures 11B through 13B.
One metal mesh medium was selected for a series of tests in which the
filter housing was tapped with a hammer to clean the filter between runs. The
data from these tests are shown on Figures 14B and 15B.
B-I
FIL- TECH SYSTEMS INC.
TABLE lB
INDEX TO FILTER TESTS
Wires/Inch A/F RatioTest No. Warp Weft Material Supplier Ft/Min
3 850 155 Stainless Steel TETCO 15.47:14 850 155 Stainless Steel TETCO 19.17:15 850 155 Stainless Steel TETCO 24.13:16 325 2300 Stainless Steel Tylinter 24.13:17 325 2300 Stainless Steel Tylinter 19.17:18 325 2300 Stainless Steel Tylinter 15.42:19 325 2300 Stainless Steel Tylinter 52.50:1
10 260 1550 Stainless Steel Tylinter 24.13:111 260 1550 Stainless Steel Tylinter 19.17:112 260 1550 Stainless Steel Tylinter 15.42:1
C-I N.A. Cellulose TACOM 19.17:1C-2 N.A. Cellulose TACOM 25.06:1C-3 N.A. Cellulose TACOM 15.42:1R-1 260 1550 Stainless Steel Tylinter 25.00:1R-2 260 1550 Stainless Steel Tylinter 25.00:1R-3 260 1550 Stainless Steel Tylinter 25.00:1R-4 260 1550 Stainless Steel Tylinter 25.00:1R-5 260 1550 Stainless Steel Tylinter 19.17:1R-6 260 1550 Stainless Steel Tylinter 19.17:1R-7 260 1550 Stainless Steel Tylinter 19.17:1R-8 260 1550 Stainless Steel Tylinter 19.17:1R-9 260 1550 Stainless Steel Tylinter 19.17:1
R-10 260 1550 Stainless Steel Tylinter 19.17:1R-1 1 260 1550 Stainless Steel Tylinter 19.17:1
R-I thru R-4 CIeaned filter by tapping exterior of filter housing with hammerR-5 thru R- 11 Cleaned filter by tapping exterior of filter housing with hammer
B-2
FIL - TECH S YS TEMS INC.
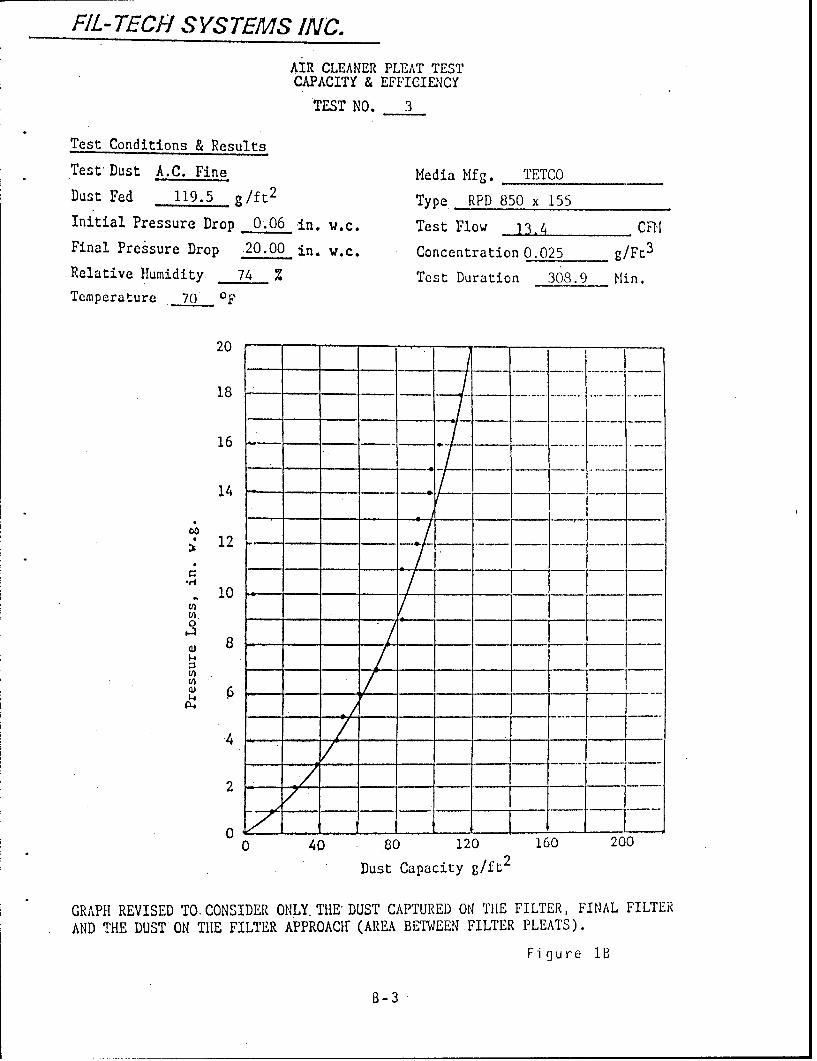
AIR CLEANER PLEAT TESTCAPACITY & EFFICIENCY
TEST NO. 3
Test Conditions & Results
Test'Dust A.C. Fine Media Mfg. TETCO
Dust Fed 119.5 g/ft 2 Type RPD 850 x 155
Initial Pressure Drop 0.06 in. w.c. Test Flow 13.4 CFI
Final Pressure Drop 20.00 in. w.c. Concentration 0.025 g/Ft3
Relative Humidity 74 % Test Duration 303.9 Min.Temperature 70 OF
18- - ..... . .
16 I-
14
12---- F--- - -
10 -
0 (fl.~ __I
.4-
- -
0 4 0 80 120 160 200
Dust Capacity g/ft 2
GRAPH REVISED TO-CONSIDER ONLY. THE-DUST CAPTURED Oil THE FILTER, FINAL FILTERAND THE DUST ON TIHE FILTER APPROACW (AREA BETWEEN FILTER PLEATS).
Fi gure 1B
B-3

FIL -TECH SYSTEMS INC.
AIR CLEANER PLEAT TESTCAPACITY & EFFICIENCY
TEST NO. 4
Test Conditions & Results
Test- Dbist A.C. Fine Media Mfg. TETCO
Dust Fed 87.9 g/ft 2 Type RPD 850 x 155
Initial Pressure Drop O.1O-in. w.c. Test Flow 16.6 CFT1
Final Pressure Drop 20.00in. w.c. Concentration 0.0251 gI/F 3
Relative Humidity 78 7. Test Duration 182.9 Min.
Temperature 70 OF
20 '" "
18 .-
16 - --
14 - -
212 f -
10
•" I
4 -
2 / .....-...K- --_
0 40 80 120 160 200
Dust Capacity g/ft 2
GRAPH REVISED TO.CONSIDER ONLY. THE DUST CAPTURED ON THE FILTER, FINAL FILTER
AND THE DUST ON THE FILTER APPROACif (AREA BETWEEN .FILTER PLEATS).
Figure 2B
B-4
FIL-TECH SYSTEMS 1VW.
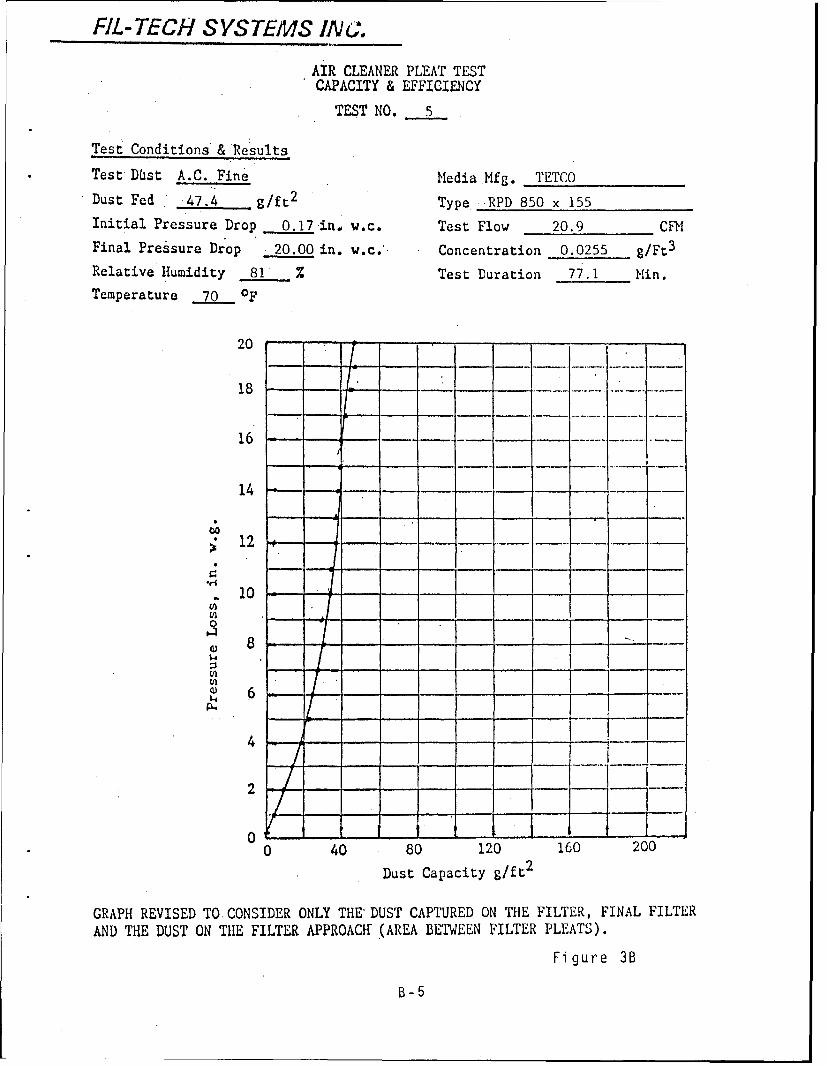
AIR CLEANER PLEAT TESTCAPACITY & EFFICIENCY
TEST NO. 5
Test Conditions*& Results
Test Dbst A.C. Fine Media Mfg. TETCO
Dust Fed 47.4 g/ft 2 Type RPD 850 x 155Initial Pressure Drop 0.17 in. w.c. Test Flow 20.9 CFll
Final Pressure Drop 20.00 in. w.c. Concentration 0.0255 g/Ft 3
Relative Humidity 81' Z Test Duration 77.1 Min.
Temperature 70 OF
20 --..-- ...
18--- -
16
14 -
12.-
- 10 - -
8-
0 40 80 120 160 200
Dust Capacity g/ft 2
GRAPH REVISED TO CONSIDER ONLYTHE DUST CAPTURED ON THE FILTER, FINAL FILTER
AND THE DUST ON THE FILTER APPROACIF (AREA BETWEEN FILTER PLEATS).
Figure 3B
B-5

FIL- TECH S YS TEMS INC.
AIR CLEANER PLEAT TESTCAPACITY & EFFICIENCY
TEST NO. -6
Test Conditions'& Results
Test Dest A.C. Fine Media Mfg. Tylinter
Dust Fed 38.8 g/ft 2 Type -DTW 325 x 2300
Initial Pressure Drop 0.64 in. w.c. Test Flow 20.9 CFllFinal Pressure Drop 20.00 in. w.c.' Concentration 0.025 g/Ft 3
Relative Humidity 75 % Test Duration 64.3 Hin.
Temperature 61 OF
20 - . -
18
16 -
14
0 12 0
10 -. .
(i 8
6.
0H-0 40 80 120 160 200
Dust Capacity g/ft 2
GRAPH REVISED TO-CONSIDER ONLY.THE'DUST CAPTURED ON THE FILTER, FINAL FILTERAND THE DUST ON THE FILTER APPROACH"-.AREA BETWEEN-FILTER PLEATS).
Figure 4B
B-6
FIL -TECH S YS TEMS INC.
Alit CLEANER PLEAT TESTCAPACITY & EFFICIENCY
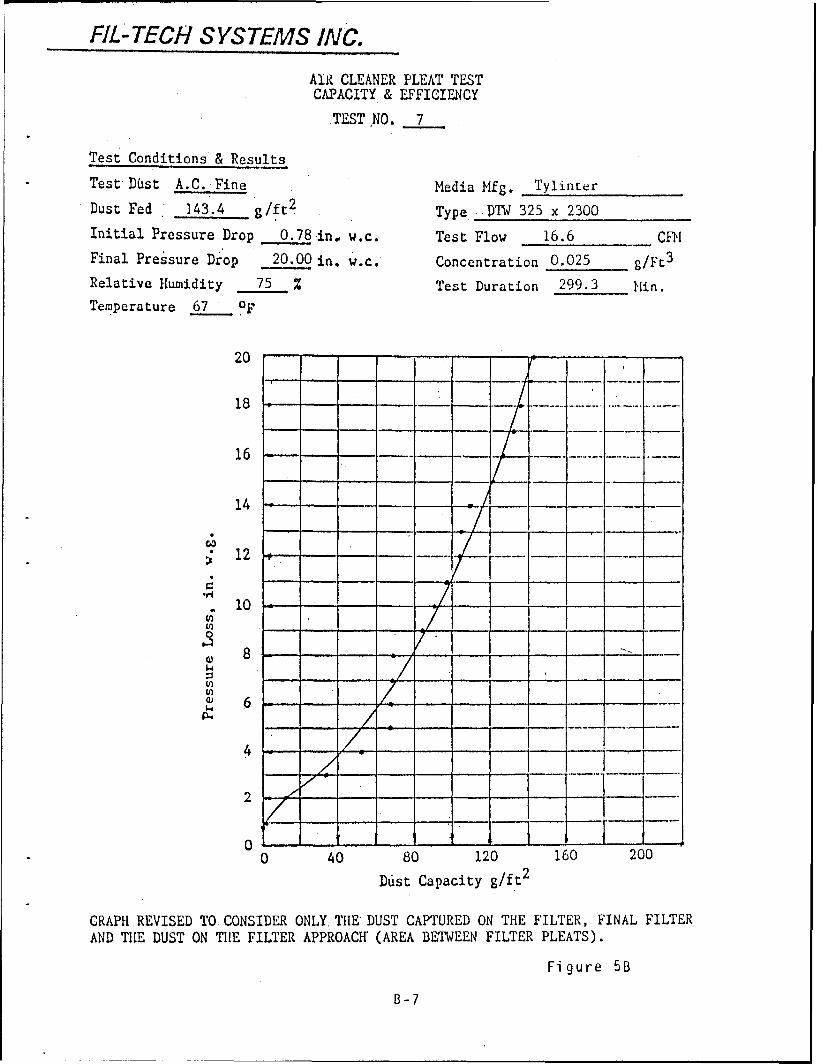
TEST NO. 7
Test Conditions & Results
Test DUist A.C. Fine Media Mfg. Tylinter
Dust Fed 143.4 g/ft 2 Type DTW 325 x 2300
Initial Pressure Drop 0. 78 in, w.c. Test Flow 16.6 CEiFinal Pressure Drop 20.00 in. w.c. Concentration 0.025 8/Ft3
Relative Humidity 75 % Test Duration 299.3 Hin.
Temperature 67 OF
20
18
1 6 .. . - .. .. . . .. . .
14 - -
(J. ---5...--'.-S12 • . . . . . . . . .
W 6' i0
0 40 80 120 160 200
Duist Capacity g/ft 2
GRAPH REVISED TO CONSIDER ONLY.TH1E DUST CAPTURED ON THE FILTER, FINAL FILTER
AND THE DUST ON T1lE FILTER APPROACH' (AREA BETWEEN FILTER PLEATS).
Figure 5B
B-7

FIL-TECH SYSTEMS INC.
AIR CLEANER PLEAT TESTCAPACITY & EFFICIENCY
TEST NO. 8
Test CondiLions & Results
Test Dtst A.C. Fine Media Mfg. Tylinter
Dust Fed 109.1 g/ft 2 Type DTW 325 x 2300
Initial Pressure Drop 0.53 in. w.c. Test Flow 13.4 CnH
Final Pressure Dr'op 20.00 in. w.c.' Concentration 0.0239 g/Ft 3
Relative Humidity 72 % Test Duration 294.9 Min.
Temperature 60__ OF
2 0 . .. . ..
* I
18 .... . -- .. .
14 S12 •
0 -
2-
0
0 40 80 120 160 200
Dust Capacity g/ft 2
GRAPH REVISED TO CONSIDER ONLY.THE DUST CAPTURED ON THE FILTER, FINAL FILTER
AND THE DUST ON THlE FILTER APPROACif (AREA BETWEEN FILTER PLEATS).
Figure 6B
B-8

FIL- TECH SYSTEMS INC.
AIR CLEANER PLEAT TESTCAPACITY & EFFICIENCY
TEST NO. .9
Test Conditions & Results
Test Dist A.C. Fine Media Mfg. Tylinter
Dust Fed 5.5 g/Ft 2 Type DTW 325 x 2300
Initial Pressure Drop 1.80 in. w.c. Test Flow 45.5 CGM
Final Pressure Drop 20.00 in. w.c. Concentration 0.025 g/Ft 3
Relative Humidity 88 , Test Duration 4.2 Min.
Temperature 68 OF
20 z z _iI_
16 .. - -
12 - --
710
_-U)) - _/2'8 _i .. ,1..
0 1 2 3. 4 5 6 7 8
Dust Capacity g/ft 2
GRAPH REVISED TO CONSIDE9 ONLY THE DUST COLLECTED ON THE FILTER, FINAL FILTER
.AND DUST ON THE FILTER APPROACI{ (AREA BETWEEN FILTER PLEATS).
Figure 7B
B-9

FIL -TECH S YS TEMS INC.
AIR CLEANER PLEAT TESTCAPACITY & EFFICIENCY
TEST NO. J0_
Test Conditions & Results
Test Db~st A.C. Fine Media Mfs. Tylinter
Dust Fed 50.7 g.ft Type DTW 260 x 1550Initial Pressure Drop 0.63 in., w.c. Test Flow 20.9 CFTFinal Pressure Drop 20.00 in. w.c.' Concentration 0.0255 g/Ft3
Relative Humidity 84 % Test Duration 84.0 Min.
Temperature 68 OF
20
1 8 .. ......
16 -- - -- -
1 4 . . .-. . .
S12 --
10 -
2-4
A, 4
2 -- ----- ----2
0 40 80 120 160 200
Dust Capacity g/ft 2
GRAPH REVISED TO.CONSIDER ONLY. THE'DUST CAPTURED ON THE FILTER, FINAL FILTERAND THE DUST ON THE FILTER APPROAC"(AR1REA BETWEEN FILTER PLEATS).
Figure 8B
B-10
FIL -TECH S YS TEMS INC.
AIR CLEANER PLEAT TESTCAPACITY & EFFICIENCY
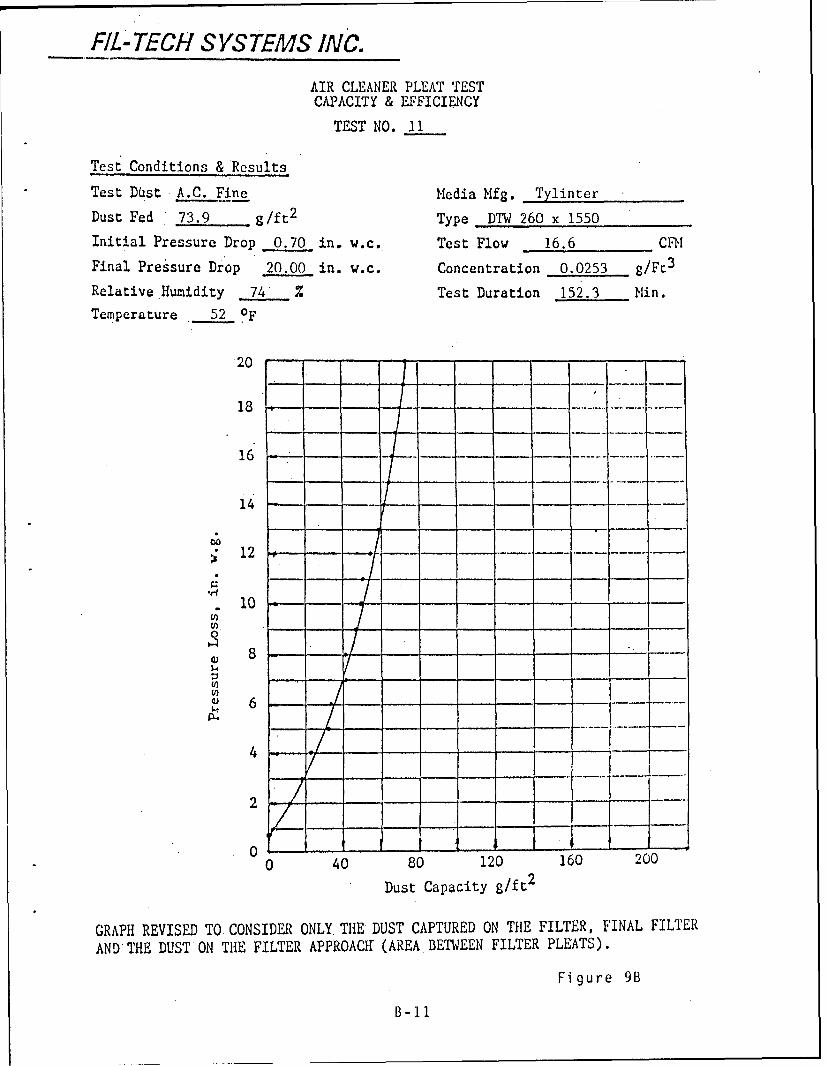
TEST NO. 11
Test Conditions & Results
Test Dist A.C. Fine Media Mfg. Tylinter
Dust Fed 73.9 g/ft 2 Type DTW 260 x 1550
Initial Pressure Drop 0.70 in. w.c. Test Flow 16.6 CFT
Final Pressure Drop 20.00 in. w.c. Concentration 0.0253 S/Ft3
Relative Humidity 74 % Test Duration 152.3 Min.
Temperature 52 OF
20 ---
18 - -',
16
14 - -
12 ........
- 10 ......-
843/-
0 6t.4
4
2
00 40 80 120 160 200
Dust Capacity g/ft 2
GRAPH REVISED TO CONSIDER ONLY. THE DUST CAPTURED ON THE FILTER, FINAL FILTER
AND THE DUST ON THE FILTER APPROACf (AREA BETWEEN FILTER PLEATS).
Figure 9B
B-1I

FIL-TECH SYSTEMS INC.
AIR CLEANER PLEAT TESTCAPACITY & EFFICIENCY
TEST NO. 12
Test Conditions & Results
Test DUst A.C. Fine Media Mfg. Tylillter
Dust Fed 123.8 g/ft 2 Type DTW 260 x 1550
Initial Pressure Drop 0.49 in. w.c. Test Flow 13.4 CM
Final Pressure Drop 20.00 in. w.c. Concentration 0.0242 g/Ft 3
Relative Humidity 72 % Test Duration 330.9 fin.
Temperature 46. OF
20 -
18 -
16 - - - - -
14 ~ -- - --
121
1 10 ....... -
6---
- .L.."-.. ......-
O 40 80 120 160 200
Dust Capacity gift 2
GRAPH{ REVISEU.TO CONSIDER ONLY TllE DUST CAPTURED ON THE FILTER, FINAL FILTERAND THE DUST ON THE FILTER APPROACH',(AREA BETIWEEN FILTER PLEATS).
Figure lOB
1-12
FIL- TECH SYSTEMS INC.
AIR CLEANER PLEAT TESTCAPACITY & EFFICIENCY
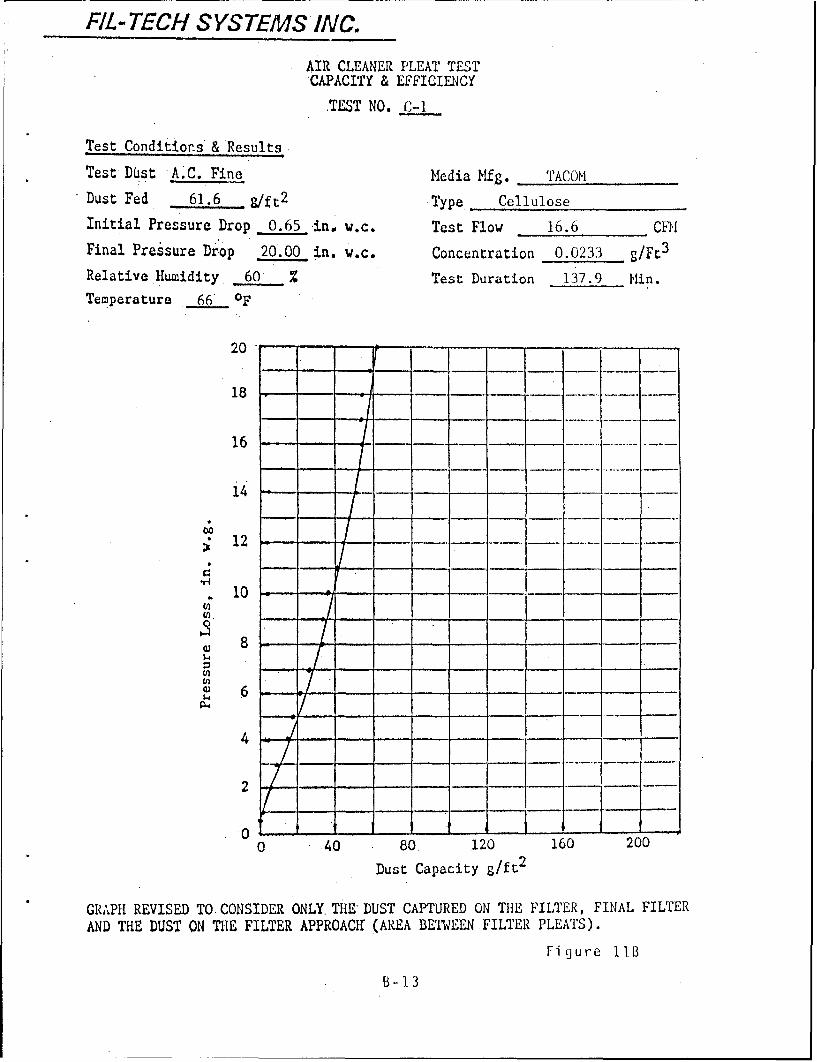
.TST NO. C-i
Test Conditions & Results
Test D(st A.C. Fine Media Mfg. TACOM
Dust Fed 61.6 g/ft 2 Type Cellulose
Initial Pressure Drop 0.6_5 in., w.c. Test Flow 16.6 C11
Final Pressure Drop 20.00 in. w.c. Concentration 0.0233 g/Ft3
Relative Humidity 60 % Test Duration 137.9 Hin.Temperature 66 OF
20 r
18
16
14
; 12
10c 0 - --....
2 .- I:0 - -. -!I-- - __
o 40 80 120 160 200
Dust Capacity g/ft2
GRAPH REVISED TO.CONSIDER ONLY. THE DUST CAPTURED ON TIHE FILTER, FINAL FILTERAND THE DUST ON THE FILTER APPROACIT (AREA BETWEEN FILTER PLEATS).
Fi gure liB
B- 13

FIL'TECH SYS TEMS INC.
AIR CLEANER PLEAT TESTCAPACITY & EFFICIENCY
TEST NO. C-2
Test Conditions & ResultsTest Dist A.C. Fine Media Mfg. TACONDust Fed 35.2 g/ft 2 Type CelluloseInitial Pressure Drop 0.80 in. w.c. Test Flow 21.7 COfIFinal Pressure Drop 20.00 in. w.c. Concentration 0.024 g/FO3
Relative Humidity 68 Test Duration 58.6 Min.Temperature 5_9OF
20
18
- --14
S12
U) O/.,
-4
4 -/ -. ..
2]
0 40 80 120 160 200
Dust Capacity g/ft 2
GRAPH REVISED TO. CONSIDER ONLY. THE'DUST CAPTURED ON TIHE FILTER, FINAL FILTER
AND THE DUST ON THE FILTER APPROACW'(AREA BETWEEN FILTER PLEATS).
F-iure 12B
B-14

FIL -TECH S YS TEMS IN C.
AIR CLEANER PLEAT TESTCAPACITY & EFFICIENCY
:TEST NO. C-3
Test Conditions &'Results
Test Dust A.C. Fine Media Mfg. TACON
Dust Fed .93.1 g/ft 2 Type .. Cellulose
Initial Pressure Drop 0.50 -in. w.c. Test Flow 13.4 CRi
Final Pressure Drop 20.00 in. w.c. Concentration 0.025 g/Ft 3
Relative Humidity 58 Test Duration 240.6 Min.
Temperature 69 oF
20 - - - - - - - - - - - -
18
16- -. - -
12 *..
"10 - - -
S, 8
4zI-i
00 40 .80 120 160 200
Dust Capacity g/ft 2
GRAPH REVISED TO-CONSIDER ONL Y.THE*DUST CAPTURED ON THE FILTER, FINAL FILTERAND THE DUST ON THE FILTER APPROACffAREA BETIWEEN FILTER PLEATS).
Fi ure 13B
B - 15

FIL -TECH S YS TEMS INC.
0
U-)-
E
Qi
~ 0
TTu- E- C
C-,;
B-4-J

FIL -TECH S YS TEMS INC.
-----------------------------------------------------
- -cc
CU
- - - - - - -- - - - - 1-
uo 4- *4-1
C4-------------------------------------------- o(j
U) 0
r-441- . >
U~a)
1-4 4E )
0 u
r-4 0)
4-1 co4) .
41 Cu 1-)
r1I
-- l -H Hl
Fi gure 15B
B -17
FIL- TECH SYSTEMS INC.
APPENDIX C
DUST SEPARATION AND FILTER EFFICIENCY
Dust filtration systems usually consist of inlet ductwork, to convey the
dust-laden air to a filter, an expansion or plenum to match the cross-sectional
area of the air flow to that of the filter and a filter. When dust-laden air is
decelerated or turned, the inertia and gravitational forces will separate some
of the dust from the flow. As a consequence, each of the elements of the
system conveying the dust-laden air to the filter will function as a separator.
Turns in the flow will function as inertial separators, and expansions will
function as settling chambers.
Inlet systems for operational appliations are designed to promote the
separation phenomena and thus prolong the service life of the filters. It is
common practice to design test systems so that the separation phenomena are
minimized. If the separation in the inlet is negligible, the efficiency of the
filter can conveniently be determined from the amount of dust injected and the
amount of dust downstream from the filter. Such systems are especially
useful when comparing similar filters as is required in quality for
manufacturing or comparing filters for a specific application. Inlet systems
can be designed to minimize dust separation but whenever dust-laden air is
ducted to the filter, separation cannot be completely eliminated in the inlet.
C-1

FIL- TECH S YS TEMS INC.
At Fil-Tech, we are studying the phenomena associated with air
filtration. To facilitate these studies, we designed our inlet system so that we
can measure the dust collected in each element of the system rather than
trying to eliminate dust separation. The test system is composed of an
injector section, hopper section, approach, filter and final filter. The dust is
removed from each of these elements and measured at the end of each test.
The air and test dust are brought into the system and mixed in the
injector section. The dust remaining in this section is the dust which has
failed to mix with the airstream. This is composed primarily of agglomerated
particles delivered from the dust feeder that are large enough to have a
ballistic coefficient sufficient to carry them across the airstream and prevent
reentrainment into the airstream. The flow leaving this section is analogous to
that leaving the ductwork leading to a fi Iter box in an operational system.
The hopper section approximates the plenum surrounding the filter in a
filter box of an operating system. It matches the air flow cross-sectional area
to that of the filter and functions as a settling chamber.
The approach is essentially the floor of the filter element on the
upstream side of the filter. Dust that falls off the filter media collects here.
This is a part of the filter element. In an operational system, the dust
collected here would remain in the element.
C-2

FIL- TECH S YS TEMS INC.
The dust that remains in the dust mat on the filter is measured
separately from that which drops off from the filter. The dust mat buildup
causes increasing pressure loss across the filter which ultimately limits the
capacity, or service life, of the filter.
An ultrahigh-efficiency final filter is placed downstream of the filter
whose properties are being measured. The dust collected on this filter is the
dust which has passed through the filter being measured. The mass of this dust
is a measure of the collection efficiency of the primary filter.
The mass of dust collected in each element of the system was measured
and recorded at the end of each test. These results are summarized on Table IC.
The precision of the data collected is more than adequate for the problem
being investigated. The measurement procedures, however, can readily be
refined to give more detailed insights into the phenomena associated with the
performance of pleated filters.
The injector section can be modified to reduce the amount of dust
separated. If the agglomerated particles are carried over into the hopper
section, they will contribute to erratic measurements for the hopper section.
Agglomeration can be eliminated by increasing the velocity of the airstream at
the point of dust injection and reducing the dust injection rate.
C-3

FIL- TECH SYSTEMS INC.
The dust mat pressure loss can be calibrated for a series of tests with
the filter oriented horizontally rather than vertically. In the horizontal
position, the dust cannot fall out of the pleats, so the mass of dust in the dust
mat is known precisely during the test. Dust that is dislodged from the mat
will just fall deeper into the pleat. The result will be a local deviation from a
catenary distribution. Because of the dust's inability to resist shear forces,
the dust will readjust to a catenary distribution. Using the calibration
obtained in the horizontal position, the amount of dust in the dust mat for
vertical tests can be estimated from the pressure drop across the filter.
A calibration of the hopper can be obtained from a series of tests in
which the system is configured so that dust in the hopper cannot intermingle
with that in the approach. The hopper behaves as a settling chamber. Then, as
long as the particles are sufficiently small for Stokes flow to occur,
D .50 9 BV()D. 5 0 = g L 'p~p- By(1
where:
D.50 = size particle that will fall a distance equal to half the
height of the chamber in passing through the chamber11 = viscosity of airp = density of airV = velocity of air flow through the chamberB = height of chamberL = length of chamberg = acceleration due to gravity
C-4

FIL- TECH S YS TEMS INC.
The separation efficiency of a separator which is separating an
exponentially distributed dust, on a statistical basis, from an airstream is
approximated by,
M 1 .6832 1M 2 . D. 50" 1
where:
M2 = moss of dust leaving the chamber
M1 = mass of dust entering the chamber
1 = exponential distribution constantof dust entering settling chamber
If Equation 1 is substituted into Equation 2, an equation of the form,
M, K - 12(3)
- 1 = -VM2 al
is obtained. K is a constant peculiar to the particular separator under
consideration. Equation 3 gives the form of the calibration curve for the
hopper.
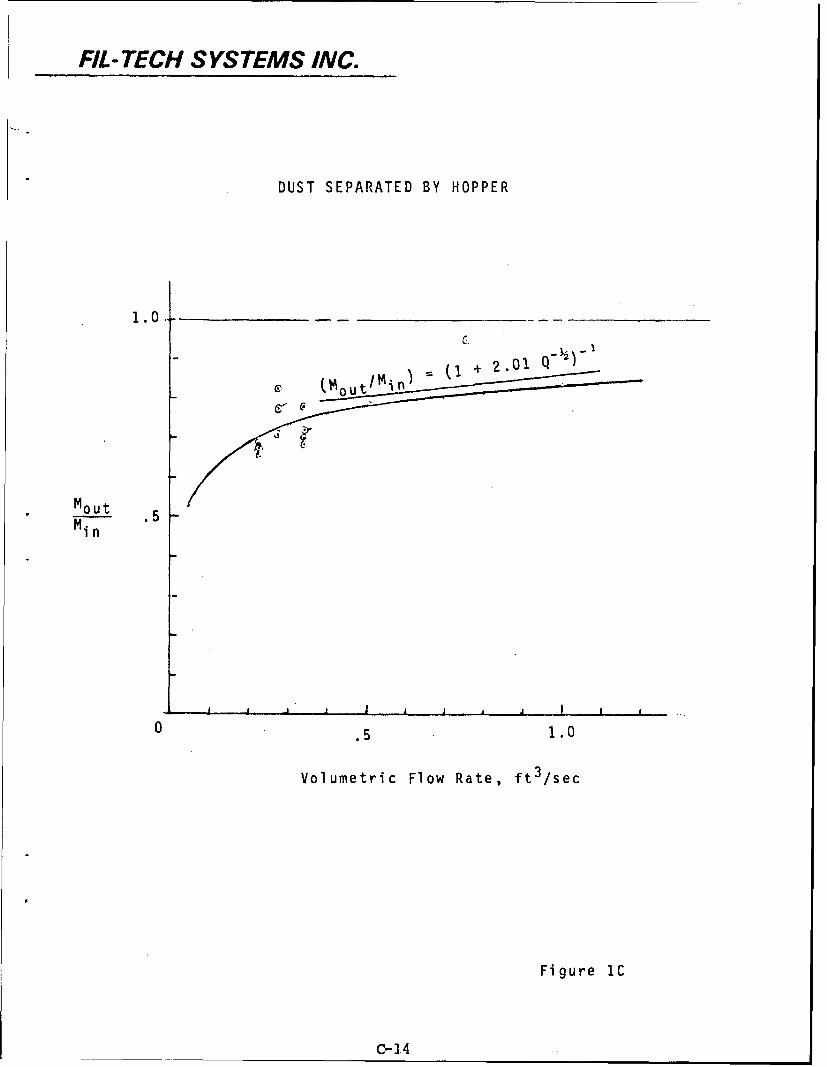
There was considerable intermingling of dust in the hopper with that in
the approach in the series of tests being reported. As a consequence, it is not
C-5
FIL- TECH SYSTEMS INC.
possible to obtain an accurate calibration from this data. Equation 3 was,
however, fit to this data. The results are shown in Figure 1C. It can be seen
that while the uncertainty in the curve fit is high, it is a reasonable represen-
tation and is indicative of the feasibility for the calibration process.
With the calibrations just described, it is possible to calculate the dust
distribution through the test system at any time during a test.
These refinements were not incorporated into the program being reported
because of their cost. The results are more than adequate for the present
program; however, they are not sufficiently precise to perform the
optimization analysis that will be required in the future. Information obtained
by the refined procedure will provide a basis for optimizations.
There are four filtration efficiencies that can be defined for the FiI-Tech
test system. They are:
1. test efficiency
2. system efficiency
3. filter efficiency
4. mat efficiency
The test efficiency is the ratio of the dust collected between the inlet to
the systems and the filter to the total dust injected into the system. This
C-6
FIL- TECH SYSTEMS INC.
efficiency is roughly comparable to the performance one would expect from a
complete system including its induction system. It's primary utility is in
gauging test system performance while conducting tests. Because of the
previously discussed variations in test systems, this efficiency should not be
used for comparison with tests performed on other test systems.
The system efficiency is defined as the ratio of dust collected between
the inlet to the hopper section and the filter to the total amount of dust
entering the hopper section. This efficiency is representative of that which
will be attained by the filter and its associated plenum.
The filter efficiency is defined as the ratio of the dust collected
between the entrance to the filter approach and the filter to the total amount
of dust entering the entrance to the filter approach. This efficiency is the
actual filter efficiency exclusive of its entrance plenum.
The mat efficiency is the ratio of the mass of the dust in the dust mat
formed on the filter to the sum of the dust mass in the mat and the dust mass
in the final filter. This efficiency is a measure of the rate of the dust mat's
buildup on the filter. It has no significance to the actual filter efficiency.
The four efficiencies were computed from the data collected. These
results are tabulated on Table IIC. It will be noted that all of the filters
exceed the filtration performance requirement of 99.7%. The amount of dust
C-?

FIL-TECH SYSTEMS INC.
collected on the final filters was exceedingly small and in most instances was
barely measurable on our balance. Rather than trying to put actual numbers on
them, it might better be said that there was something there, but it was
actually below the threshold of accurate measurement. If reasonably accurate
efficiency estimates are to be made of pleated filters at these high
efficiencies, they can be made by making measurements with media with open
weaves and then extrapolating to the tighter weaves as was done for the f lat
filters and reported in Reference 1*. The variations in efficiency measure-
ments at the high efficiencies measured probably reflects the variation in
distribution test dust particle size distribution at the fine end of its rated
distribution more than variations in performance of the filters. This
phenomena is discussed in some detail in Reference 1.
In addition to removing dust from the air, each dust separation process
also changes the dust size particle distribution in the flow. As was discussed
in Reference 1, the exponential distribution constant, • , will change inversely
with the dust mass in the flow. Then, for each dust removal process,
1M (4)M2
* The consistency of properties and uniform variations of these propertiesfrom weave to weave in metal mesh media makes it possible to make theseextrapolations accurately. Such extrapolations would be very difficult withthe common cellulose and polymeric filter materials.
C-8
FIL- TECH SYSTEMS INC.
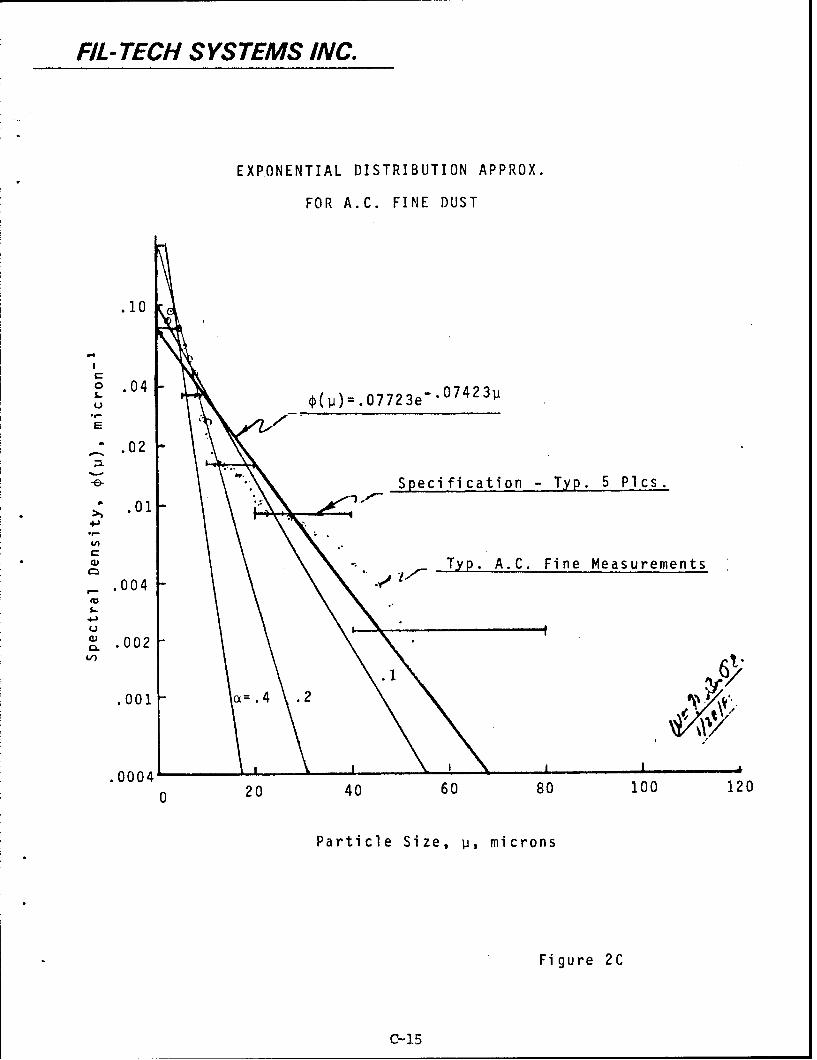
Using Equation 4 and a value of .07723 micron -1 for the exponential
distribution constant for A.C. fine dust, the exponential distribution constant
was estimated at the inlet to each section of the test system for each of the
tests. These results are tabulated on Table IIIC. The effects on distribution
can be assessed by comparison with Figure 2C where distribution is presented
with distribution constant as a parameter.
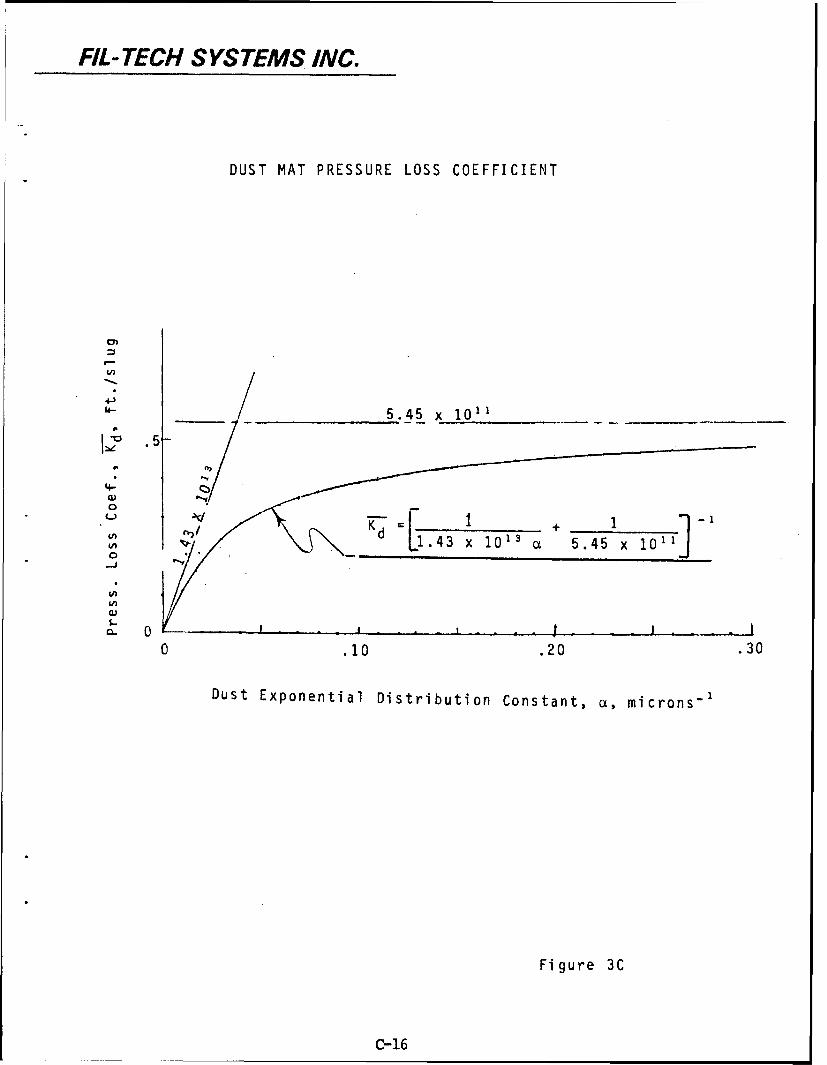
As the particle distribution becomes smaller, the dust mat pressure loss
coefficient increases. This increase asymptotically approaches a maximum
value which is believed to be caused by cracks and other imperfections which
will occur in a dust mat but are unrelated to particle size. An expression
which describes this behavior and has been used for design purposes with the
A.C. test dusts and simi lar granular dusts is,
-E-'KD [1.43x10¹³ a•) + (5.45x10 ) (1)
where:
K= effective dust mat pressure loss coefficient, ft/slug= exponential. dust distribution constant, micron -1
This expression was used to calculate the dust mat pressure
coefficients. This result is tabulated on Table IVC. The asymptotic value of
5.45 x 10" ft/slug was used in the pressure loss correlation.
C-9

FIL- TECH SYSTEMS INC.
TABLE IC
TEST SYSTEM DUST DISTRIBUTION
Face Velocity Dust Mass. Slug x 103Test No. Ft/ Sec 5_ystem Injector Hoper Approach Mat Passed
3 .258 11.606 .672 3.645 2.906 4.571 .014a .256 11.064 1.159 3.159 2.029 4.711 .007
12 .258 12.253 .740 3.961 2.090 5.462 N.D.4 .320 7.799 .350 1.700 1.994 3.749 .0077 .320 12.036 1.396 1.637 4.069 4.703 .014
11 .320 7.016 .644 1.650 1.377 3.146 N.D.5 .402 4.666 .459 1.323 .637 2.442 .0076 .402 3.631 .151 .766 .507 2.196 .007
10 .402 6.764 2.056 1.494 .507 2.707 N.D.9 .675 .421 .062 .014 N.D. .325 N.D.
NONDIMENI1ONALIZED TE-T 5YSTEM DUST DISTRIBUTION
Face Velocity Nondimenslonal Dust Mass, Mass/Sustem MassTest No. Ft!5ec 5 Injector HoDPer Auproach Mat Passed
3 .258 1 .0569 .3087 .2461 .3871 .00126 .250 1 .1048 .2655 .1634 .4256 .0006
12 .256 1 .0604 .3233 .1706 .4456 04 .320 1 .0449 .2160 .2557 .4607 .00097 .320 1 .1162 .1526 .3393 .3907 .0012
11 .320 1 .0918 .2636 .1962 .4463 05 .402 1 .0943 .2716 .1309 .5016 .00146 .402 1 .0416 .2115 .1396 .6053 .0019
10 .402 1 .3040 .2209 .0750 .4002 09 .675 1 .1946 .0333 0 .7720 0
C-10

FIL- TECH SYSTEMS INC.
TABLE IIC
MEASURED EFFICIENCIES
EfficienciesTest No. Face Velocity Test System Filter Mat
3 .2579 .99884 .99877 .99617 .9970o14 .3195 .99912 .99908 .99881 .998185 .4022 .99859 .99845 .99778 .99720
8 .2579 .99938 .99931 .99898 .998557 .3195 .99886 .99871 .99844 .997096 .4022 .99811 .99803 .99747 .99689
12 .257911 .3195 [No detectable dust passed10 .4022 in these tests]9 .8750
C-II

FIL -TECH S YS TEMS INC.
TABLE IIIC
EXPONENTIAL DUST DISTRIBUTION CONSTANTS
S, microns-Test No. System Hopper Aggroach Mat Passed
3 .07723 .06169 .12175 .19690 66.534 .07723 .08085 .10475 .16030 67.695 .07723 .08528 .12185 .15359 54.83
a .07723 .08626 .12666 .18112 124.687 .07723 .00736 .10561 .19706 67.626 .07723 .00058 .10336 .12715 40.96
12 .07723 .08181 .12531 .1732611 .07723 .08504 .11982 .1723010 .07723 .11095 .16253 .19298
9 .07723 .09600 .10004 .10004
C-12

FIL- TECH S YS TEMS INC.
TABLE IVC
DUST MAT PRESSURE LOSS COEFFICIENTS KD
Test No,. mcrons-1 KDLt_"
3 .19090 4.5?6 x 10¹¹
4 .16036 4.4065 .15359 4.369
a .10112 4.5057 .19706 4.5696 .12715 4.195
12 .17326 4.47011 .17230 4.46510 .19290 4.5549 .10004 3.949
FIL- TECH SYSTEMS INC.
DUST SEPARATED BY HOPPER
1.0
= I+ 2.01q>=.
Moutou
f22 .5 -5Min
I I II .1 I , ..
0 .5 .1.0
Volumetric Flow Rate, ft 3 /sec
Figure 1C
C-14
FIL -TECH S YS TEMS INC.
EXPONENTIAL DISTRIBUTION APPROX.
FOR A.C. FINE DUST
.10
o .04S. 07423p•. ((p)=.07723e" '
E
".02
.Specification Typ. 5 Plcs.
.01 -
"U,
S-a)Typ. A.C. Fine Measurements.004
U-
. 002 "
.001 c-.4 .2
.0004 '
0 20 40 60 80 100 120
Particle Size, i, microns
Figure 2C
C-15
FIL- TECH S YS TEMS INC.
DUST MAT PRESSURE LOSS COEFFICIENT
Li)
4 -J
'4- 5.45 x 10¹¹
.5-
4:0
1 x 10[ x 5. 45 x 1011
0J
0 .10 .20 .30
Dust Exponential Distribution Constant, cx, microns-'
Figure 3C
C-16

FIL- TECH SYSTEMS INC.
APPENDIX D
PRESSURE LOSS DATA CORRELATION FOR A PLEATED FILTER
A pleated filter, by virtue of its geometry, lends itself to a filtering
process which is rather complex to describe mathematically. Such a filter is
illustrated in Figure ID. If a mathematical model for a filter of this
configuration could be developed, it would most likely be too cumbersome to
manipulate. It is, therefore, desired to develop an analytic model which is
simplified and easily manipulated, yet still demonstrates a good approximation
of the filter and pressure loss characteristics as a dust mat builds up on a wall
of a filter pleat.
At any given time, the dust lying in the pleat will form a catenary at its
surface. The high velocity at the inlet to the pleat and the turning required of
the flow forces the dust particles to flow to the back of the pleat. The dust
can only carry compressive loads and a configuration that only has such loads
results in a catenary. As the air passes through the dust mat, it will
experience losses which follow the Darcy Low of Permeability, which states
that the losses will be proportional to the integral of the distance traveled
times the velocity along the streamlines through the mat. The velocity vectors
at the surface will be perpendicular to the surface. We would expect this
situation to remain as the dust mat builds up. Thus, the former catenary
surfaces become the velocity potential surfaces and the streamlines are the
orthogonal trajectories to these surfaces.
D•-1

ilL- TECH SYSTEMS INC.
It will be assumed for the simplified model that the surf ace of the dust
mat is a parabola and the streamlines are lines perpendicular to the filter
medium. Figure 2D contrasts the simple model with the actual situation.
From the Darcy Law of Permeability, the pressure losses through the
filter and the dust mat are given by,
Apf = (p/kf)Vf (a)
(DI)APd = KdPMmVf (b)
where:
Apf = total pressure loss through filter medium
APd = total pressure loss through dust mat
P = coefficient of viscosity of airkf = permeability of filter medium
Kd = dust mat pressure loss coefficient
Mm = mass per unit area of dust in mat
Vf = face velocity
The mass per unit area of the dust in the mat is given by,
Mm =Pdx (D2)
where:
Pd = density of dust
x = thickness of mat
rn_,)

FIL- TECH SYSTEMS INC.
Substituting Equation D2 into Equation DIb and then adding the results to
Equation DIa, we get the total pressure loss,
AP = (k'C + KdPdx)pVf (D3)
Equation D3 is valid for a flat filter with a uniform dust mat. In the
simplified case under consideration, there is a parabolic distribution of the
dust mat. In addition, the pressure across the mat at any given time will be
constant, so the velocity must vary along the surface of the mat. Taking into
account that,
Vf = dQ/dA (D4)
where:
Q = volumetric flow rateA = total filter area
Equation D3, when solved for d Q , becomes
(APp/p) d
dQ dA (D5)-K ÷ K dpdx)(kf'
where:
A p = pressure loss for a parabolic dust mat distribution
D-3
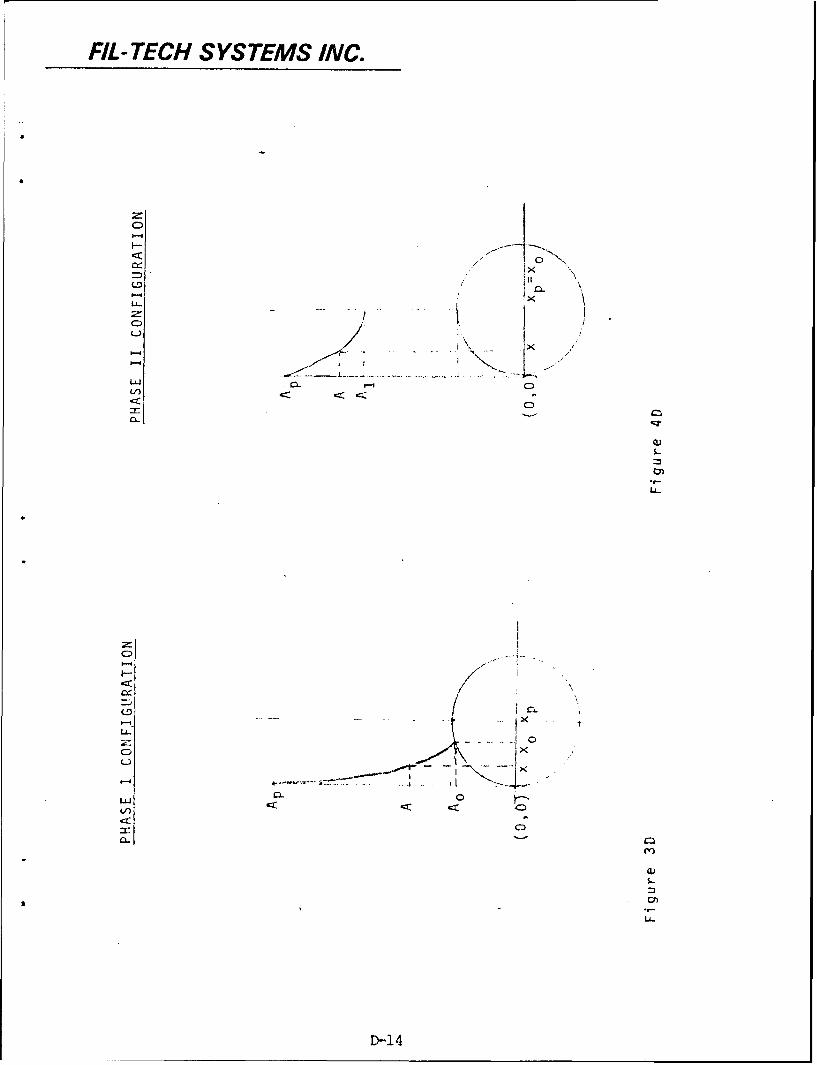
FIL- TECH SYSTEMS INC.
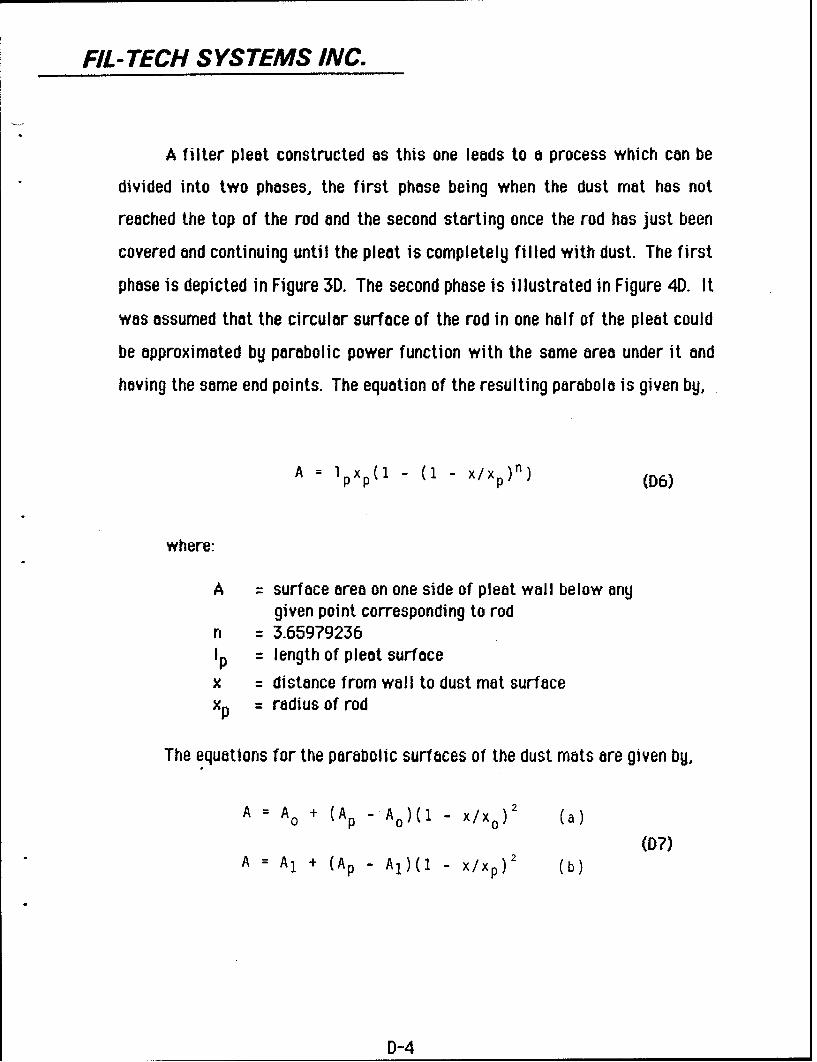
A filter pleat constructed as this one leads to a process which can be
divided into two phases, the first phase being when the dust mat has not
reached the top of the rod and the second starting once the rod has just been
covered and continuing until the pleat is completely filled with dust. The first
phase is depicted in Figure 3D. The second phase is illustrated in Figure 4D. It
was assumed that the circular surface of the rod in one half of the pleat could
be approximated by parabolic power function with the same area under it and
having the same end points. The equation of the resulting parabola is given by,
A = 1 px (1 - (I - X/Xp )) (D6)
where:
A = surface area on one side of pleat wall below anygiven point corresponding to rod
n = 3.659792361Ip = length of pleat surface
x = distance from wall to dust mat surfaceXp = radius of rod
The equations for the parabolic surfaces of the dust mats are given by,
A = Ao + (Ap - Ao)(1 - X/Xo)2 (a)
A = Al + (Ap - AI)(1 - X/Xp)2 (b)
D-4

FIL- TECH S YS TEMS INC.
where:
A = surface area on one wall of pleat at any given pointAo = surface area on one wall of pleat below point of
intersection of dust mat surface and rodA = surface area on one wall of pleat below vertex of
completed parabola of second phaseAp = total surface area on one wall of pleat
xo = distance from pleat wall to point of intersection
of filter surface with rodX p = halfway distance between pleat walls
With Equation Da for the first phase and Equation D7b for the second
phase. (It should be noted from henceforth any Equation a will be for the first
phase and any Equation b will be for the second phase unless otherwise noted.)
Solving each Equation D7 for its own x and substituting into Equation D5
results in
KdPdX°, dQ= fIkPdxY)- -AA -dA/ ½'- (a)KdPdpp o 1fA/A - Ao/A
Kd d dQ= kfKdPdXp).jA 1 aP Al/Ap) dA (b) (DO)Ap p/ AI1/A p
These equations can each be integrated on both sides, which results fn
the following equation for the pressure loss:
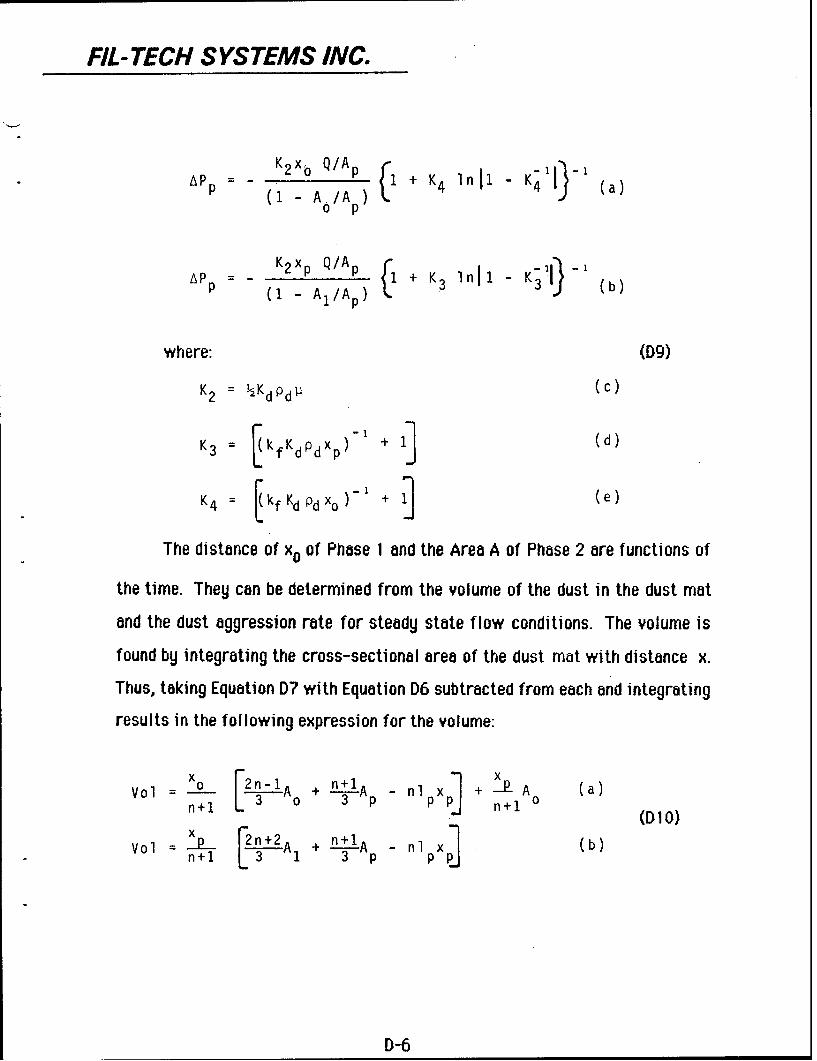
FIL- TECH SYSTEMS INC.
A K2 xb Q/Ap ( + K4 Injl - K4 11 (
(1 - A .6/A ) (a
K2 xp Q/AP (1 r1APp = - (1 - AI/Ap) + K3 P)1j - K•i -1 (b)
where: (D9)
K2 =-½KdPd1 p c)
K3 = kfKdPdxp) + (d)
K4 = [kfKdPdxo)1 + (e)
The distance of xo of Phase I and the Area A of Phase 2 are functions of
the time. They can be determined from the volume of the dust in the dust mat
and the dust aggression rate for steady state flow conditions. The volume is
found by integrating the cross-sectional area of the dust mat with distance x.
Thus, taking Equation D? with Equation D6 subtracted from each and integrating
results in the following expression for the volume:
x]Vol = -- oIA + n+lA - nl x + Xp A (a)
_p n+1 (DIO)
Vol = nP Lý+2A + n+l - nl pxp (b)n+I 3 1 -3---A
D-6

FIL- TECH S YS TEMS INC.
The mass of the dust, Md, is equal to the density of the dust times its
volume and is also equal to the rate at which the dust is carried into the dust
mat times the time over which it is carried into the dust mat.
M° = GQt = Pd IX 2nl[3 A0 + n+IA -nl x + n+- A (a)-'(Dli)d I n+1 A 3nnl1 - -DI
Md = GQt - nXP L + 1 + - nlpxp (b)d n 3 1 3 p
where:
G concentration of dust in the flowQ = volumetric flow ratet =time
Solving Equation DI le for x. and Equation Dl lb results in,
X (n+l)G(Q/Ap)t A [2n?1 Ao + n+1 -I x (a)
0Pd p p1 3 Ap
A 3[ G(Q/IA )t n (Db 2)
(1 1 AP) A- Pp + n+1 (b)Pdp Px
The time at which Phase I ends and Phase 2 begins, tp, is given by,
xtp =Ip ._ n+l)A - (n-2)1px (D13)
3p d 1 L ID-

FIL- TECH S YS TEMS INC.
At this time, x. = Xp and A. = A, and all Equations a are equal to
Equations b.
It would be convenient to have the pressure loss expressed as a ratio of
the pressure loss for a parabolic dust mat distribution and the pressure loss
for a uniform dust mat distribution of equal volume. Equation D3, the
expression for pressure loss over a uniform dust mat distribution, can be
written in the form,
APu (k fKdPdX)- + 1 KdPdxP(Q/AP) D14
where:
A;Pu = pressure loss for a uniform dust mat distribution
x = distance from wall for a uniform distributionQ/Ap = volumetric flow rate per unit area of filter = face
velocity
The term In brackets In Equation D14 is similar to the expression for K4,
as can be seen by comparing Equation D9d with the above term. For the uniform
mat,
x = Vol = GQtAp ppAp (D15)
D-8
FIL- TECH SYSTEMS INC.
Substituting x into Equation D12a and solving for x results in the
following expression for x in terms of xo-
lX o X 2n( - 1 A +' A- __A (D16)O/Ap + (n+1) - 3n+ n+1 o/Ap
From Equation D9c,
2K 2 = KdPdl (D17)
and from Equation D9e,
o(K4-1 = (kfKdPd)-' (DI8)
Substituting Equations D 17 and DI8 into Equation D14 results in,
Apu = 2K2 x(QIAp)((K4 _1)Xo/Ix+ 1 (D19)
Divide Equations D9a and b by Equation D19 and simplifying, we get the
following expressions for each phase:
D-9
FIL- TECH SYSTEMS INC.
---P- 2(1 - AolAp)LK4-1) + X/X K4*lnllK4 (aAP 0[
U
'2( /Ap pi " - (D20)AP IAI -K4 l)Xo/xp+x/xj -lK3 InhI-K 3U b
LPI P, 2 1- A / P)1 K 4 -1 ' / p X P1 -K 3 1 nI I -K3 b)A P
When Equations D9d and e are examined, it can be seen that K4 and K3 are
related as follows:
(K 4 "l)xO/x = (kfKdPdxp)' = K3 -1 (D21)
Substituting this into Equation D2Ob, the equation for pressure loss
during the second phase becomes,
= {2(1 - AI/Ap) K3-1) + x/x] K3 1n _1-K 3'I - (D22)AP u
With the relationship between K4 and K3 expressed in Equation D21 in
mind, it is desired to express K4 in terms of x instead of x.. Solving Equation
D 16 for xo and substituting into Equation D9e results in,
D-10
FIL- TECH SYSTEMS INC.
3 kfKdPd In+1)x- xp(Ao/A )](K4 -1) =
2n-l)AO/A + (n+l) - 3n (D23)
It was found that Equation D23 could be approximated quite closely by,
(K4 1)-i) 3kfKdPX = 3kf K dMd/A (D24)
Equations D2Oa, D22 and D24 were programmed for the TI-59. The
density of the dust was measured for two conditions, the first where the dust
was fluffed up and the second where the dust was compacted by vibration. Both
densities were used in the program, resulting in two APP/APu versus (K 4 - 1)
curves for each media. These curves are plotted on Figures 5D through ?D. The
ratio of the parabolic pressure loss (actual measured pressure loss) to the
uniform pressure loss and (K4 -1)-1 for each test were calculated and
plotted with the curves in Figures 5D through ?D. It can be seen that the curves
for the simple model roughly follow the data points. It was expected that there
would be some discrepancy because of the assumptions and approximations that
are inherent in the simple model. As the model becomes more refined, it is
expected that the gap between the curves and the data points will become
smaller.
D-11

FIL- TECH S YS TEMS INC.
CROSS-SECTIONAL VIEW OF PLEATED MEDIUM
2.0 inches
1.875 inches
7
S<•,,L.,5.67 inches
0.3125 inches 0.125 inches
Figure 1D
D-12
FIL- TECH SYSTEMS INC.
SIMPLE MODEL VERSUS ACTUAL SITUATION
(CROSS-SECTIONAL VIEW OF INFINITE PLEAT)
SI ' Surface, CatanarySurface, Parabola S a Ca
Streamlines, perpendicular Streamlinese perpendicularto Filter Medium -A, to Velocity Potential Surfaces
"I Velocity Potential Surfaces,Catanary
Filter Medium FilerMedumFilter Medium
SIMPLE MODEL ACTUAL SITUATION
Figure 2D
D-13
FIL -TECH S YS TEMS INC.
AZ
C)?-4
F- -
<x 0CiD
L-4
VQ.
LoL
CD
LC)
V))
D-1 4
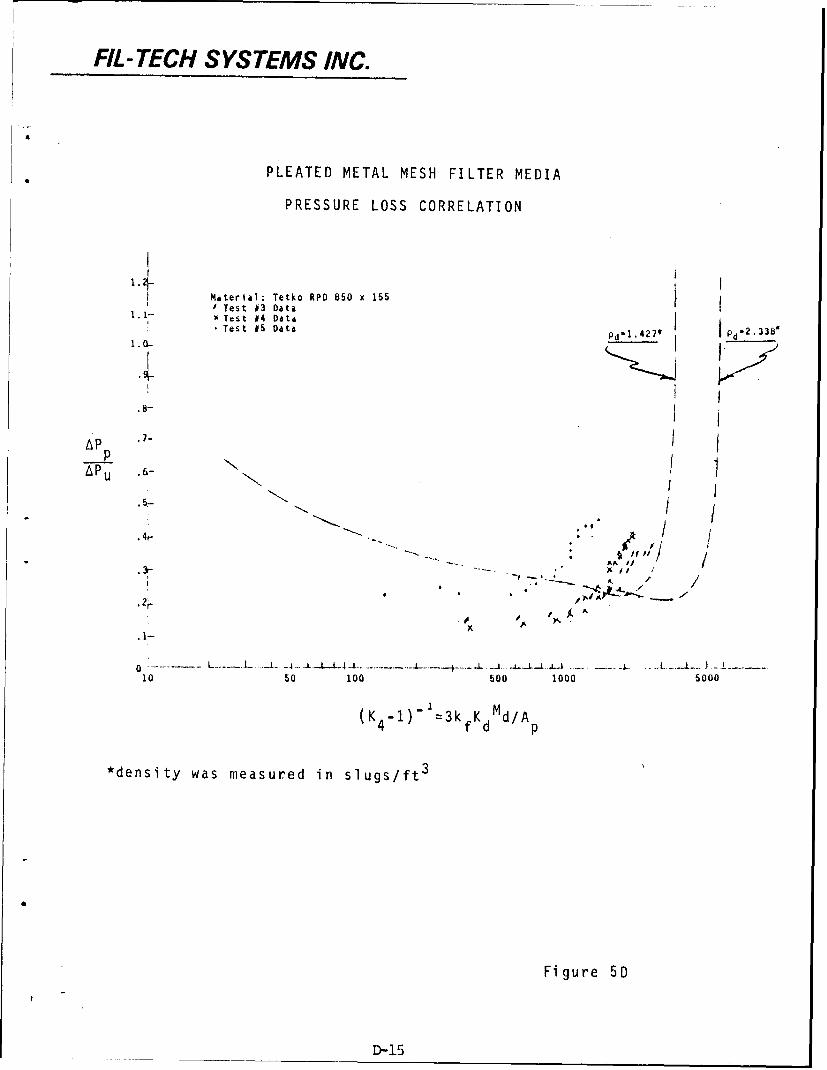
FIL-TECH SYSTEMS INC.
PLEATED METAL MESH FILTER MEDIA
PRESSURE LOSS CORRELATION
Material: Tetko RPD 850 x 155Test #3 Data
l~•,Test ,4 Data .2 33
Test :5 Data Pd-1.427* Pd__ .___
1.0- IJ j
AP .7-p
A. PU• //
X, f-1.
• 4r • .. .- ,J
010 50 100 500 1000 5000
(K 4 1) ..3k fK d Md/A 1
*density was measured in slugs/ft
Figure 5D
_KD-15

FIL- TECH SYSTEMS INC.
PLEATED METAL MESH FILTER MEDIA
PRESSURE LOSS CORRELATION
1 .4
1.3
APd
pd .2 338*
Tes X, ,at ,' N
.0
A P .8
-( p~
M r5 10 50 100 500
(K4 -1)" -1_•3kfKdtl4/Ap
*density was measured in slugs/ft 3
Figure 6D
D-16

FIL- TECH SYSTEMS INC.
PLEATED METAL MESH FILTER MEDIA
PRESSURE LOSS CORRELATION
1.4Material:
Tylinder Dtw 260-x 1550
1. - Test #10 Datax Test #11 Data
1 . 2 1 _ • T e s t # 1 2 D a t a p d - 1 . 4 2 7 ,
1.1- pd.2. 338*
-. 6. *
6Pu "7 " ...•. /p. .
.34- 1 / '- k f
5 10 50 100 500 1Q000
(K4-)-z:3kfKdMd/Ap
* density was measured in slugs/ft 3
Figure 7D
D-17

FIL -TECH S YS TEMS INC.
DISTRIBUTION LIST
Copies
Commander 5U.S. Army Tank-Automotive CommandATTN: DRSTA-RGTWarren, MI 48397-5000
Commander 2U.S. Army Tank-Automotive CommandATTN: DRSTA-TSEWarren, MI 48397-5000
Commander 14U.S. Army Tank-Automotive CommandATTN: DRSTA-TSLWarren, MI 48397-5000
Note: In accordance with DD Form 1423