u.s. biodiesel/renewable diesel market - usda · u.s. biodiesel/renewable diesel ... \_market...
TRANSCRIPT

Ernest Carter Senior Economist
Office of Global Analysis Foreign Agriculture Service, USDA
Washington, D.C. May 2016
Factors Driving Change
U.S. Biodiesel/Renewable Diesel Market
2008
2005
2011-12
2010
2013 2015
2000-04

USDA Interests in Biofuels Support the rural economy Impact on US & global supply/demand balances for grains & oilseeds
USDA Activities & Programs 2014 Farm Bill Energy Title IX includes $700 million for crop & biomass
research, biomass handling technologies, education programs, and biorefinery retooling/construction
Monthly forecasts on corn and soyoil used for biofuels, and annual long-term projections for world agricultural markets
Consultations with EPA and DOE on Renewable Fuel Standard (RFS) management issues
USDA’s Foreign Agricultural Service is involved in biofuels standard setting bodies, trade policy, ethanol market promotion, and foreign market intel reporting on the European Union and 14 other countries
USDA’s Interest in Biofuel Markets USDA Programs and Market Intel Support Industry

0
200
400
600
800
1,000
1,200
1,400
1,600
1,800
2,000MGals
US Biodiesel & Renewable Diesel Market 2000-15: Uneven Start Followed by Growing Demand
The Renewable Fuel Standard sets long-term policy to 2022, but EPA rulings, court cases, trade policy, and annual federal budget process create risk
7.6 BLtrs
3.8 BLtrs
Production
Exports Imports
Domestic Use
Supply Demand
BD
BD
BD
BD
RD RD
RD
BD = biodiesel (fatty acid methyl ester); RD = renewable diesel (only HVO is currently commercialized); MGals (million gallons); BLtrs (billion liters).

0
200
400
600
800
1,000
1,200
1,400
1,600
1,800
2,000MGals
The Early Years 2000-04: Limited Production and Use; No Trade
Production Domestic Use
federal support limited to feedstock subsidy shared with ethanol and education program no state mandates/incentives captive fleets create limited demand very limited production capacity
CCC Bioenergy Prog (2000-6)
Nat Biodiesel Ed. Prog (2003 – today)
Supply Demand
BD BD
BD = biodiesel (fatty acid methyl ester); RD = renewable diesel (only HVO is currently commercialized); MGals (million gallons); BLtrs (billion liters).
0
200
400
600
800
1,000
1,200
1,400
1,600
1,800
2,000MGals
Production
Exports Imports
Domestic Use
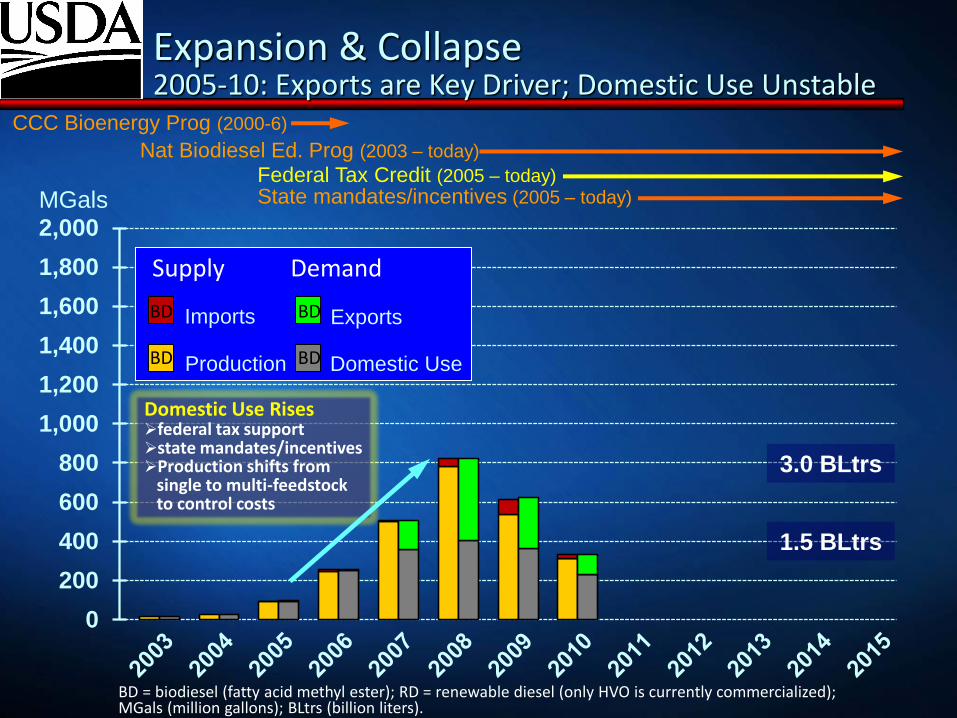
Expansion & Collapse 2005-10: Exports are Key Driver; Domestic Use Unstable
Domestic Use Rises federal tax support state mandates/incentives Production shifts from single to multi-feedstock to control costs
Federal Tax Credit (2005 – today) State mandates/incentives (2005 – today)
CCC Bioenergy Prog (2000-6)
Nat Biodiesel Ed. Prog (2003 – today)
3.0 BLtrs
1.5 BLtrs
Supply Demand
BD
BD
BD
BD
BD = biodiesel (fatty acid methyl ester); RD = renewable diesel (only HVO is currently commercialized); MGals (million gallons); BLtrs (billion liters).

0
200
400
600
800
1,000
1,200
1,400
1,600
1,800
2,000MGals
50% of production exported by 2008 (mostly Europe) production capacity swells to 2.5 BGals
Exports Drive Two-thirds of Production Expansion
Production
Exports Imports
Domestic Use
1.5 BLtrs
3.0 BLtrs
Supply Demand
BD
BD
BD
BD
Expansion & Collapse 2005-10: Exports are Key Driver; Domestic Use Unstable
Federal Tax Credit (2005 – today) State mandates/incentives (2005 – today)
CCC Bioenergy Prog (2000-6)
Nat Biodiesel Ed. Prog (2003 – today)
BD = biodiesel (fatty acid methyl ester); RD = renewable diesel (only HVO is currently commercialized); MGals (million gallons); BLtrs (billion liters).

0
200
400
600
800
1,000
1,200
1,400
1,600
1,800
2,000MGals
Production
Exports Imports
Domestic Use
Supply Demand Exports Collapse Europe imposes Cv/AD duties Domestic Use Collapses RFS2 ruling delayed 18 months to June 2010 12-month lapse in blenders credit (2009) Financial Crises of 2008 freezes credit markets, and ensuing severe recession causes on-road diesel use to drops 9% (2008 to 2009)
BD
BD
BD
BD
Expansion & Collapse 2005-10: Exports are Key Driver; Domestic Use Unstable
Federal Tax Credit (2005 – today) State mandates/incentives (2005 – today)
CCC Bioenergy Prog (2000-6)
Nat Biodiesel Ed. Prog (2003 – today)
BD = biodiesel (fatty acid methyl ester); RD = renewable diesel (only HVO is currently commercialized); MGals (million gallons); BLtrs (billion liters).

0
200
400
600
800
1,000
1,200
1,400
1,600
1,800
2,000MGals
Production
Exports Imports
Domestic Use
Expansion Resumes on Surer Footing 2011-12: RFS Builds Domestic Use; Limited Trade
long delayed RFS rulings impacting BD and RD demand are finalized in June 2010; BBD & UAB obligations (mandates) reach to 1 BGs + .99 BGs by 2012
BBD = biomass-based diesel (BD+RD); UAB = undifferentiated (non-cellulosic) advanced biofuels, ethanol vols.
3.8 BLtrs
Supply Demand
BD
BD
BD
BD
RD RD
RD
RFS2 Mandate/RINs (2009 – today)
Federal Tax Credit (2005 – today) State mandates/incentives (2005 – today)
CCC Bioenergy Prog (2000-6)
Nat Biodiesel Ed. Prog (2003 – today)

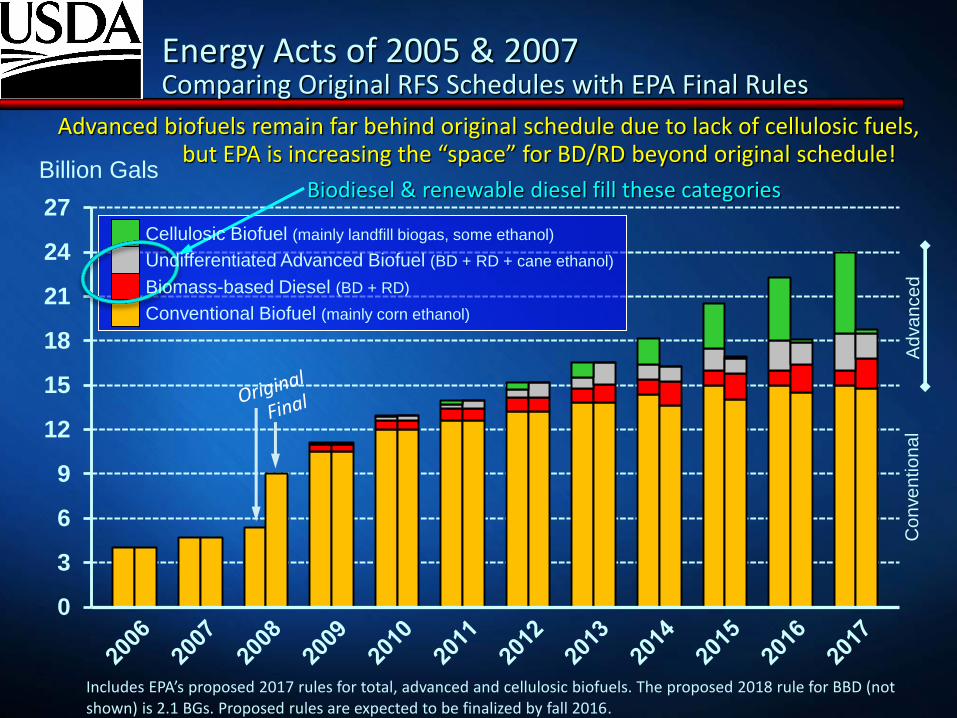
Energy Acts of 2005 & 2007 Comparing Original RFS Schedules with EPA Final Rules
Original
ScheduleFinal Rule
Original
ScheduleFinal Rule
Original
ScheduleFinal Rule
Original
ScheduleFinal Rule
Original
ScheduleFinal Rule
Original
ScheduleFinal Rule
2006 4.0 4.00 4.00 4.00
2007 4.7 4.70 4.70 4.70
2008 5/ 5.4 9.00 5.40 9.00
2009 10.5 10.50 n/a n/a 0.50 0.50 0.10 0.10000 0.60 0.60 11.10 11.10
2010 6/ 12.0 12.00 0.10 0.00500 0.65 0.65 0.20 0.29500 0.95 0.95 12.95 12.95
2011 12.6 12.60 0.25 0.00600 0.80 0.80 0.30 0.54400 1.35 1.35 13.95 13.95
2012 13.2 13.20 0.50 0.01045 1.00 1.00 0.50 0.98955 2.00 2.00 15.20 15.20
2013 13.8 13.80 1.00 0.00600 1.00 1.28 0.75 1.46400 2.75 2.75 16.55 16.55
2014 14.4 13.61 1.75 0.03300 1.00 1.63 1.00 1.00700 3.75 2.67 18.15 16.28
2015 15.0 14.05 3.00 0.12300 1.00 1.73 1.50 1.02700 5.50 2.88 20.50 16.93
2016 15.0 14.50 4.25 0.23000 1.00 1.90 2.00 1.48000 7.25 3.61 22.25 18.11
2017 15.0 14.80 5.50 0.31200 1.00 2.00 2.50 1.68800 9.00 4.00 24.00 18.80
2018 15.0 7.00 1.00 2.10 3.00 11.00 26.00
2019 15.0 8.50 1.00 3.50 13.00 28.00
2020 15.0 10.50 1.00 3.50 15.00 30.00
2021 15.0 13.50 1.00 3.50 18.00 33.00
2022 15.0 16.00 1.00 4.00 21.00 36.00
Red = final rulings differ from the original schedule. Purple = proposed rules.1/ Vols assume all cellulosic biofuel is ethanol. Actual vols blended will be lower if any portion has a volumetic energy content greater than ethanol.2/ BBD values are actual vols, not ethanol-equivalent vols. Multiply BBD (biodiesel & renewable diesel) values by 1.5 and 1.7 to find ethanol-equivalet vols.3/ BBD volumes starting 2012 (original schedule) are determined by EPA rule-making, but must be no less than 1 bilion actual volumes.4/ Not published by EPA. Known as "undifferentiated (non-cellulosic) advanced biofuel and equals total advanced minus cellulosic biofuel minus BBD5/ Original Schedule value was set by RFS1 (2005 Energy Policy Act 2005), while Final Rule value was set by RFS2 (EISA 2007).6/ Delay in EPA rule-making resulted in combining BBD 2009 & 2010 obligations into a single BBD obligation for 2010.File location: R:\_Market Intelligence\Commodity Analysis\Biofuels\2 US Mkt Sit & Policy\RFS2Updated: ECarter, OGA/FAS/USDA, May 2016.
Conventional
Biofuel Cellulosic Biofuel 1/Biomass-based
Diesel (BBD) 2/3/
Other Advanced
Biofuel 1/4/
Biofuel Obligations Under the Energy Acts of 2005 & 2007 by Fuel Category for RFS1 (2006-8) & RFS2 (2009-22)
Billions of Gallons (ethanol-equivalent)
YearTotal Advanced 1/
Total Renewable
Fuel 1/
Advanced Biofuel
Biodiesel & renewable diesel fill these categories
0
3
6
9
12
15
18
21
24
27
Advanced biofuels remain far behind original schedule due to lack of cellulosic fuels, but EPA is increasing the “space” for BD/RD beyond original schedule!
Billion Gals
Conventional Biofuel (mainly corn ethanol)
Co
nve
ntio
na
l A
dva
nce
d
Includes EPA’s proposed 2017 rules for total, advanced and cellulosic biofuels. The proposed 2018 rule for BBD (not shown) is 2.1 BGs. Proposed rules are expected to be finalized by fall 2016.
Biodiesel & renewable diesel fill these categories
Undifferentiated Advanced Biofuel (BD + RD + cane ethanol)
Cellulosic Biofuel (mainly landfill biogas, some ethanol)
Biomass-based Diesel (BD + RD)
Energy Acts of 2005 & 2007 Comparing Original RFS Schedules with EPA Final Rules

0
200
400
600
800
1,000
1,200
1,400
1,600
1,800
2,000MGals
Expansion Continues 2013-15: RFS Builds Domestic Use; Production & Imports Rise
RFS builds BBD & UAB to 1.73 BGs + 1.03 BGs by 2015 production & imports rise equally to cover growing demand renewable diesel arrives
7.6 BLtrs
3.8 BLtrs
Production
Exports Imports
Domestic Use
Supply Demand
BD
BD
BD
BD
RD RD
RD
RFS2 Mandate/RINs (2009 – today)
Federal Tax Credit (2005 – today) State mandates/incentives (2005 – today)
CCC Bioenergy Prog (2000-6)
Nat Biodiesel Ed. Prog (2003 – today)
BBD = biomass-based diesel (BD+RD); UAB = undifferentiated (non-cellulosic) advanced biofuels, ethanol vols.

US Biodiesel & Renewable Diesel Market Dataset Updated by USDA’s OEPNU and FAS
US Biomass-based Diesel (biodiesel + renewable diesel) Supply/Demand, MGals
SUPPLY DEMANDBEGIN STOCKS PRODUCTION Imp (FAME) IMPORTS DOMESTIC USE Exp (FAME) EXPORTS END STOCKS Exp Imp Exp Imp
Year FAME RD TOTAL FAME RD TOTAL Total Re-Exp FAME RD TOTAL FAME RD TOTAL Total For-Orig FAME RD TOTAL FAME RD TOTAL
2000 2.0 2.0 2.0 2.0
2001 8.1 8.1 8.1 8.1
2002 13.8 13.8 13.8 13.8
2003 17.6 17.6 17.6 17.6
2004 28.0 28.0 28.0 28.0
2005 91.2 91.2 4.5 0.3 4.2 4.2 95.0 95.0 0.8 0.3 0.5 0.5 0% 4% 0% 4%
2006 243.4 243.4 35.2 20.8 14.4 14.4 252.4 252.4 26.2 20.8 5.5 5.5 2% 6% 2% 6%
2007 499.7 499.7 124.4 119.4 5.0 5.0 357.3 357.3 266.7 119.4 147.3 147.3 29% 1% 29% 1%
2008 780.6 780.6 312.5 272.2 40.3 40.3 402.8 402.8 690.3 272.2 418.1 418.1 54% 10% 54% 10%
2009 44.0 0.0 44.01 536.3 0.0 536.3 74.8 0.0 74.8 74.8 360.9 360.9 264.2 0.0 264.2 264.2 29.9 0.0 29.9 49% 21% 49% 21%
2010 29.9 0.0 29.86 310.4 3.0 313.4 18.5 0.0 18.5 18.5 229.4 3.0 232.5 101.1 0.0 101.1 101.1 28.2 0.0 28.2 33% 8% 32% 8%
2011 28.2 0.0 28.22 967.5 34.2 1,001.6 37.5 0.0 37.5 37.5 873.3 33.9 907.2 75.7 0.0 75.7 75.7 84.2 0.3 84.5 8% 4% 8% 4%
2012 84.2 0.3 84.50 990.0 30.2 1,020.2 39.3 0.0 40.1 25.4 65.5 903.7 51.9 955.7 127.2 0.0 127.2 127.2 83.3 3.9 87.3 13% 4% 12% 7%
2013 83.3 3.9 87.28 1,358.0 54.4 1,412.4 346.1 0.0 347.4 212.9 560.2 1,438.7 242.2 1,680.9 190.0 0.0 190.0 190.0 160.0 29.0 189.0 14% 24% 13% 33%
2014 160.0 29.0 189.04 1,270.0 138.8 1,408.8 202.7 0.0 202.7 120.7 323.4 1,417.6 273.8 1,691.4 83.6 0.0 83.6 83.6 131.5 14.7 146.2 7% 14% 6% 19%
2015 131.5 14.7 146.20 1,269.0 172.6 1,441.6 360.8 0.0 360.8 203.7 564.5 1,512.4 368.6 1,881.0 88.7 0.0 88.7 88.7 160.2 22.3 182.6 7% 24% 6% 30%
2016 160.2 22.3 182.57
Sources: Fame Stocks: DOE/Energy Information Agency (EIA), Monthly Energy Review (MER), Table 10.4 RD Stocks: EIA Monthly Petroleum Supply Report (PSM) minus MER Export reliance = exports/production
Fame Production: 2000-05 (CCC Bioenegy Program, USDA); 2006-10 DOC Industry Survey (Rpt M311K); 2011-forward (DOE/EIA) Import reliance = imports/dom. use
RD Production: Quarterly reports from REG Geismar (previously Dynamic Fuels), Diamond Green (Darling Corp.), AltAir Fuels, and UOP Honeywell collected by PRX (ProExporter Network)
Fame Trade: DOC/US Census Bureau, B30-100 Chapt. 38 HTS codes (assume B100) plus Petroleum Oils Containing Biodiesel (>B30) Chapter. 27 HTS codes (assume average B5 content) beginning 2012
RD Imports: DOE/EIA "Company Level Imports" from Petroleum and Other Liquids, product code = 205 RD Exports: no reliabe data source due to code classification problems; assume no signicant exports to date
Fame and RD Domestic Use: derrived by balancing supply and demand
RelianceReliance
FAME FAME + HVO

0
10
20
30
40
50
60
70
*Other markets = residential/commercial heating + farm + off-road Total distillate projection from EIA ‘s April 2016 STEO (2015-17) + 2015 AEO (2018-25)
MGs
Small Growth Projected for Distillate Market
Total
On Highway
*Other markets with some biofuel use
avg +0.3%
Projection
On-Highway Use Flattens Market size = 40 MGs (2015) Demand is sensitive to general
economic activity Projected growth could eventually
level off due to proposed Phase II GHG Savings & Efficiency Standards for Heavy Duty Vehicles (2021-27)
Heating Oil Market in Decline US market = 6.3 MGs (5 yr/avg 2010-14) Long-term decline due to erosion from
competition with natural gas (market is 50% smaller today than it was in 1985)
88% of US 3.7-MG residential market is located in Northeast which has some mandates for “bio” heat
Distillate Market Flattens Dropping 3% or 1.95 MGs (2014-16) Annual growth of 0.3% (180 MGs),
currently projected for 2020-25, may drop due to rising fuel efficiency
National avg. blend rate only B3
US Distillate Market: Large Market But Limited Growth Growth Potential for Biodiesel Comes Mainly From Higher Blending

Biodiesel Production in 2015 Biodiesel production capacity = 2.1 BGs (RD adds 275 MGs) Biodiesel plant locations (94 plants) % = proportion of total US biodiesel production by PADD (green zones)
70%
5%
8%
>1%
17%
Source: Energy Information Agency
Regional Imbalance: Biodiesel Production is Centered in Midwest but Not Diesel Consumption

Biodiesel/Renewable Diesel Demand Created by Key State Mandates/Tax Policy in 2015 Identified states support half of US biodiesel/renewable diesel demand in 2015
Heating Oil Market
290 MGs road tax exempt
Sources: National Biodiesel Board and California Air Resource Board
290 MGs LCFS
25 MGs B5
60 MGs B5/B10
30 MGs taxes 150
MGs taxes
30 MGs B2 ? MGs
NYC B5 Bioheat + Captive Fleets
Regional Imbalance: State Policy Supports Partly Rebalance Midwest but Exacerbate Coastal Imbalance

0
25
50
75
100
125
150
175
BD UCOBD Corn OilBD CanolaBD TallowBD SoyRDBiogas
MGals
California Moves Towards Lower Carbon Fuels How Has the California Diesel Transport Market Changed?
Biogas : converted to diesel gallons equivalent; blend rate = biogas/total natural gas
Source: CARB LCFS Reports at http://www.arb.ca.gov/fuels/lcfs/lrtqsummaries.htm
Blend Rates BD 0.4% 0.6% 1.7% 1.9% 3.5% BD + RD 0.4% 0.8% 4.9% 5.0% 8.3% Biogas 2.1% 1.9% 10.3% 21.8% 50.1%
Calif’s Global Warming Solutions Act of 2008 requires GHG emissions rollback to 1990 level Lower the carbon intensity (CI) of the
transport fuel pool 10% by 2020 from 1990 level
reduce emission of other air pollutants (NOx, PM)
What Happened from 2011 to 2015? Renewable diesel use > biodiesel use Increased use of lowest CI biodiesels
made from UCO and technical corn oil byproduct of corn ethanol plants; demand for soyoil biodiesel almost gone
Biogas: rises from 2% to 50% of transport compressed gas market
Change Forced by… CI target for fuels is lowered each year fuels above/below target generate
credits/deficits exchange sets value for carbon credits
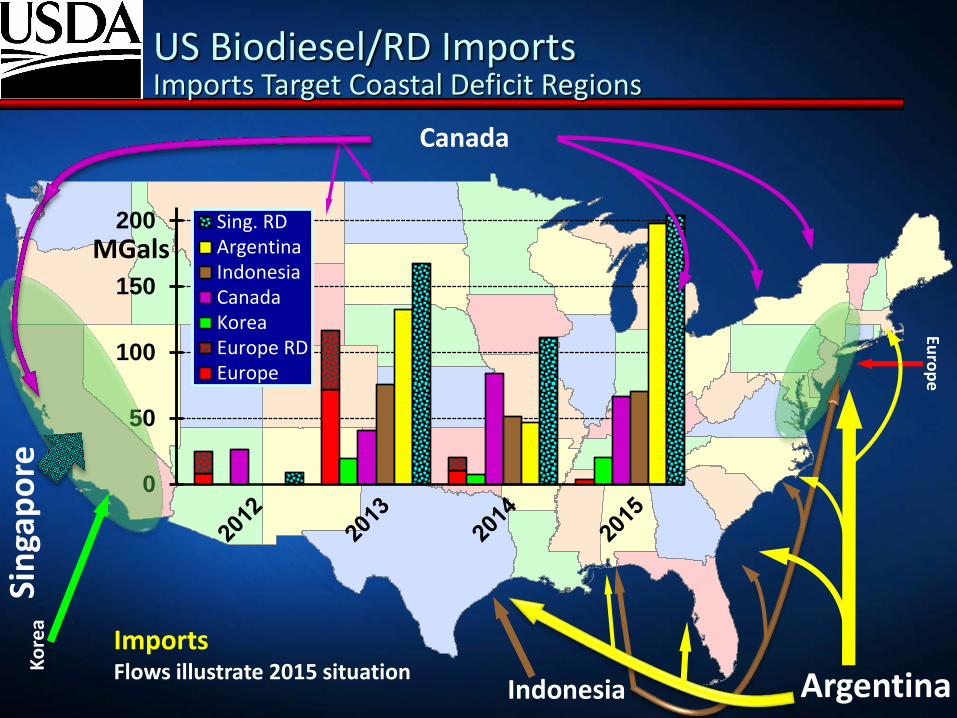
US Biodiesel/RD Imports Imports Target Coastal Deficit Regions
Euro
pe
0
50
100
150
200 Sing. RDArgentinaIndonesiaCanadaKoreaEurope RDEurope
Sin
gap
ore
K
ore
a
MGals
Canada
Indonesia Argentina
Imports Flows illustrate 2015 situation

US Biodiesel/Renewable Diesel Market Final Remarks
Market Expansion Through Higher Blending Current average blend rate is close to B3, while nearly all OEMs approve
B20 Blend level of B10 in transport plus bioheat mandates for residential
heating equals 5-6 BGs of biofuel; B20 would double this figure Biodiesel consumption was 1.5 BGs* in 2015, so there is lots of room to
expand from a technical engine standpoint, but delivery infrastructure must evolve further
Past EPA Rulings Are a Positive Sign for Future EPA continues to increase the ‘space’ for biodiesel/renewable diesel, but
US biodiesel industry is lobbying for larger increases RIN values are market responsive and will support expansion even if the
$1/gal tax credit is dropped US biodiesel industry is lobbying to change federal blenders tax credit to
a US producers tax credit to limit foreign supplier presence in US market
*Excludes 370 MGs of renewable diesel use in 2015, because there is no technical blending
limit on this fuel.