u.s. census bureau · concept what does decade to ... refined visual: standard bar chart versus...
TRANSCRIPT
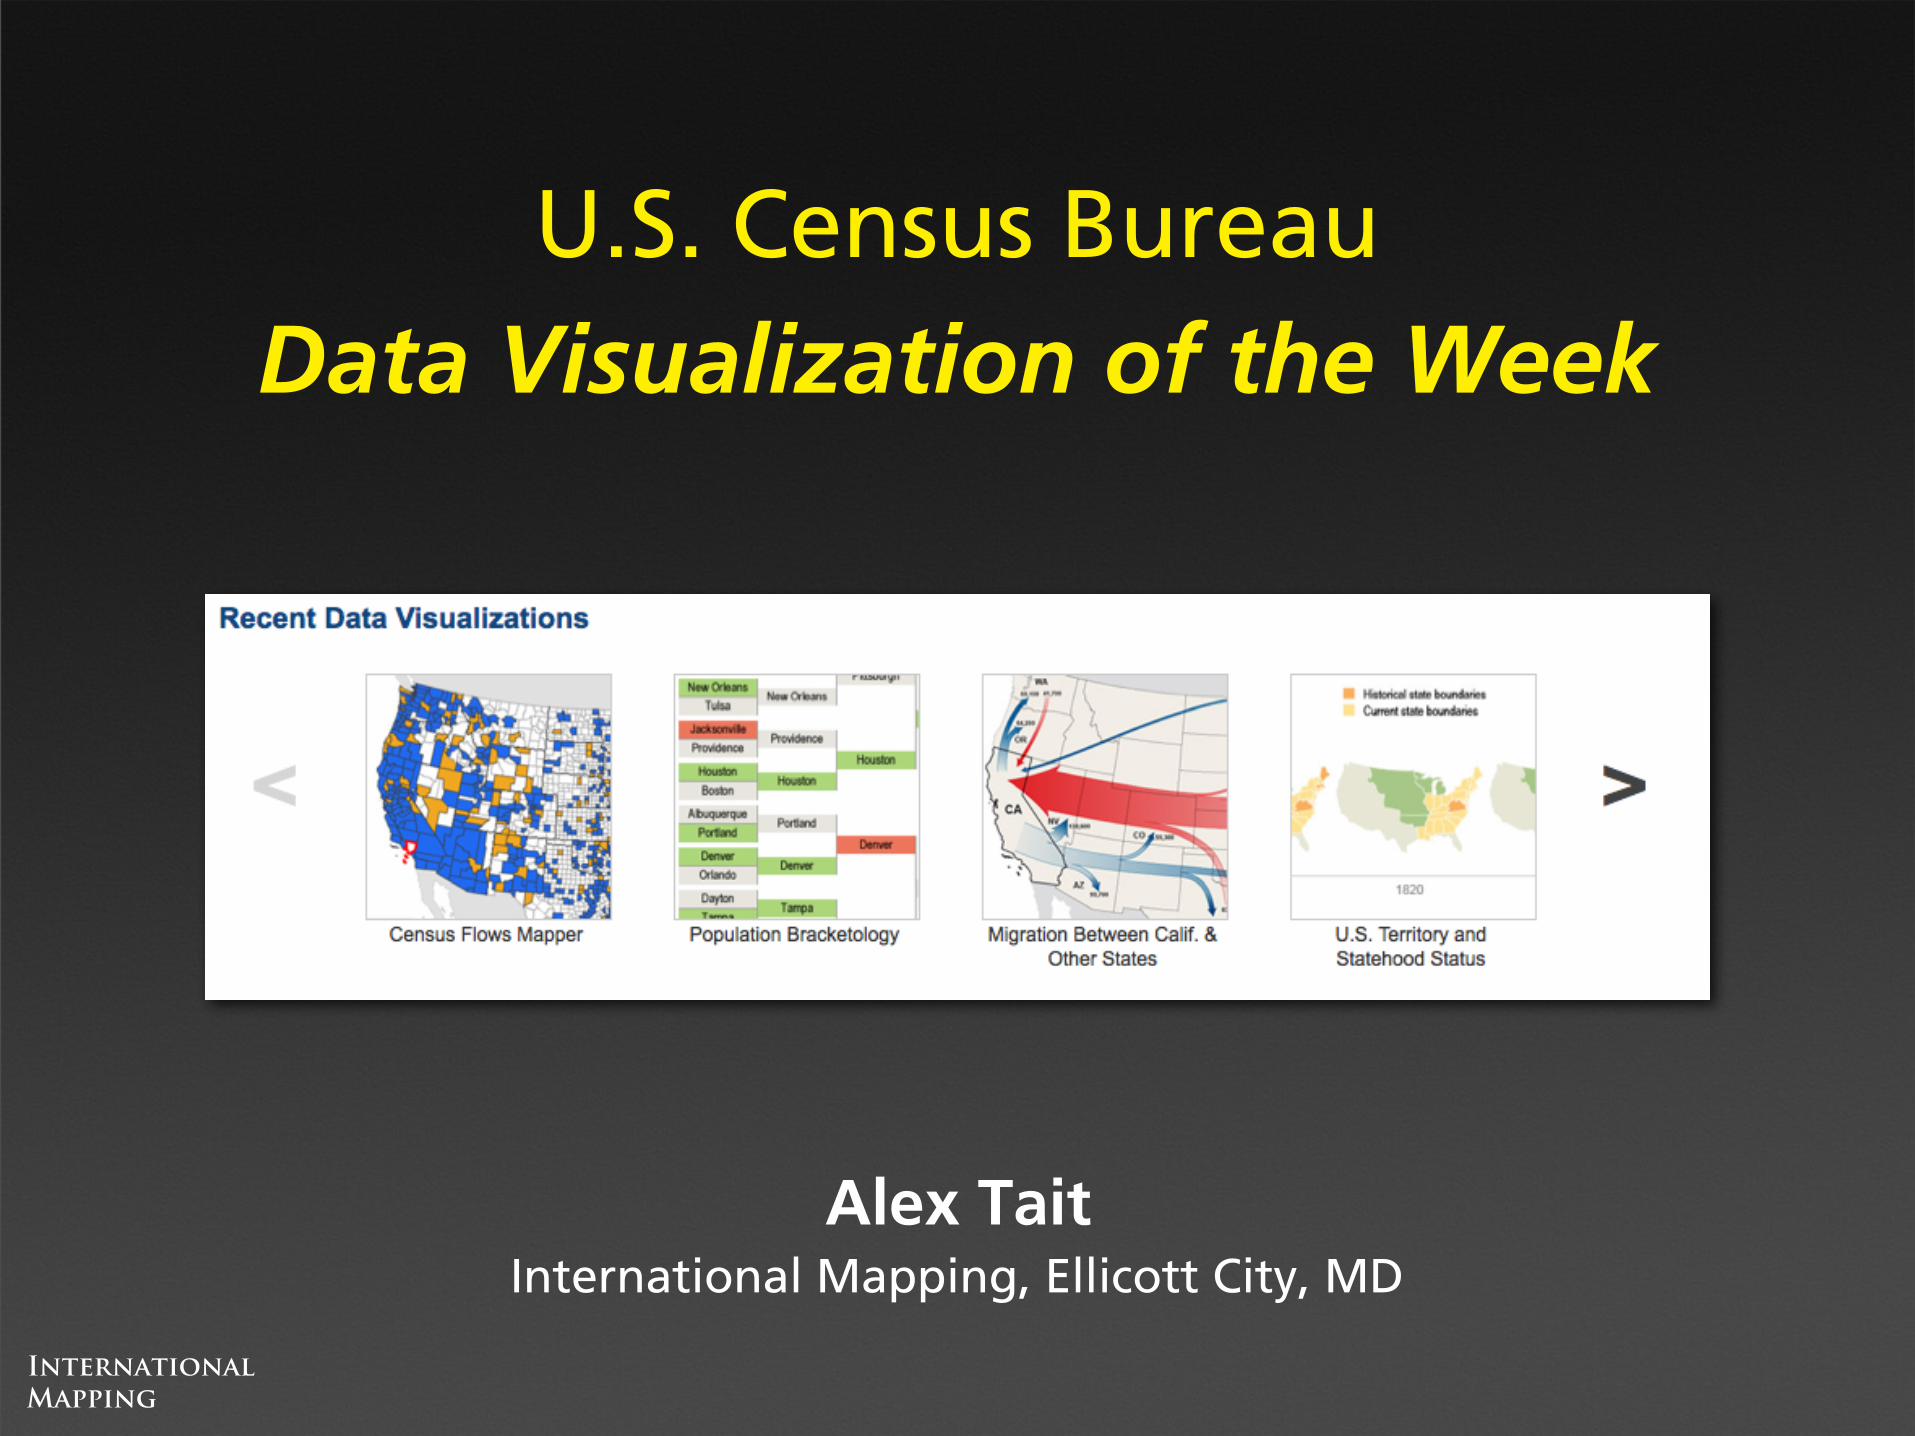
U.S. Census BureauData Visualization of the Week
InternationalMapping
Alex TaitInternational Mapping, Ellicott City, MD

InternationalMapping
http://www.census.gov/dataviz/

InternationalMapping
Data visualization parameters
• Census data
• General audience
• Canvas size = 880 px by 660 pixel
• Compatible with Internet Explorer 7
• Compatible with Apple iOS devices

InternationalMapping
Implications for production process
• No Adobe Flash
• Javascript / HTML / Images
• Learn to love image swapping!
• Simple (or no) interactivity
• Keep focus on good visual ideas not cutting edge interactivity

InternationalMapping
How do we put one of these together?• Stages • Tools
< explore 009 Blooming States >

InternationalMapping
1. Concept
What does decade to decade change in population look like for all the states?
Tools: QuestionsDatasetsImagesPencil & PaperVoicesExperience

InternationalMapping
Refined question: How do we show regional differences in state population growth?
InternationalMapping
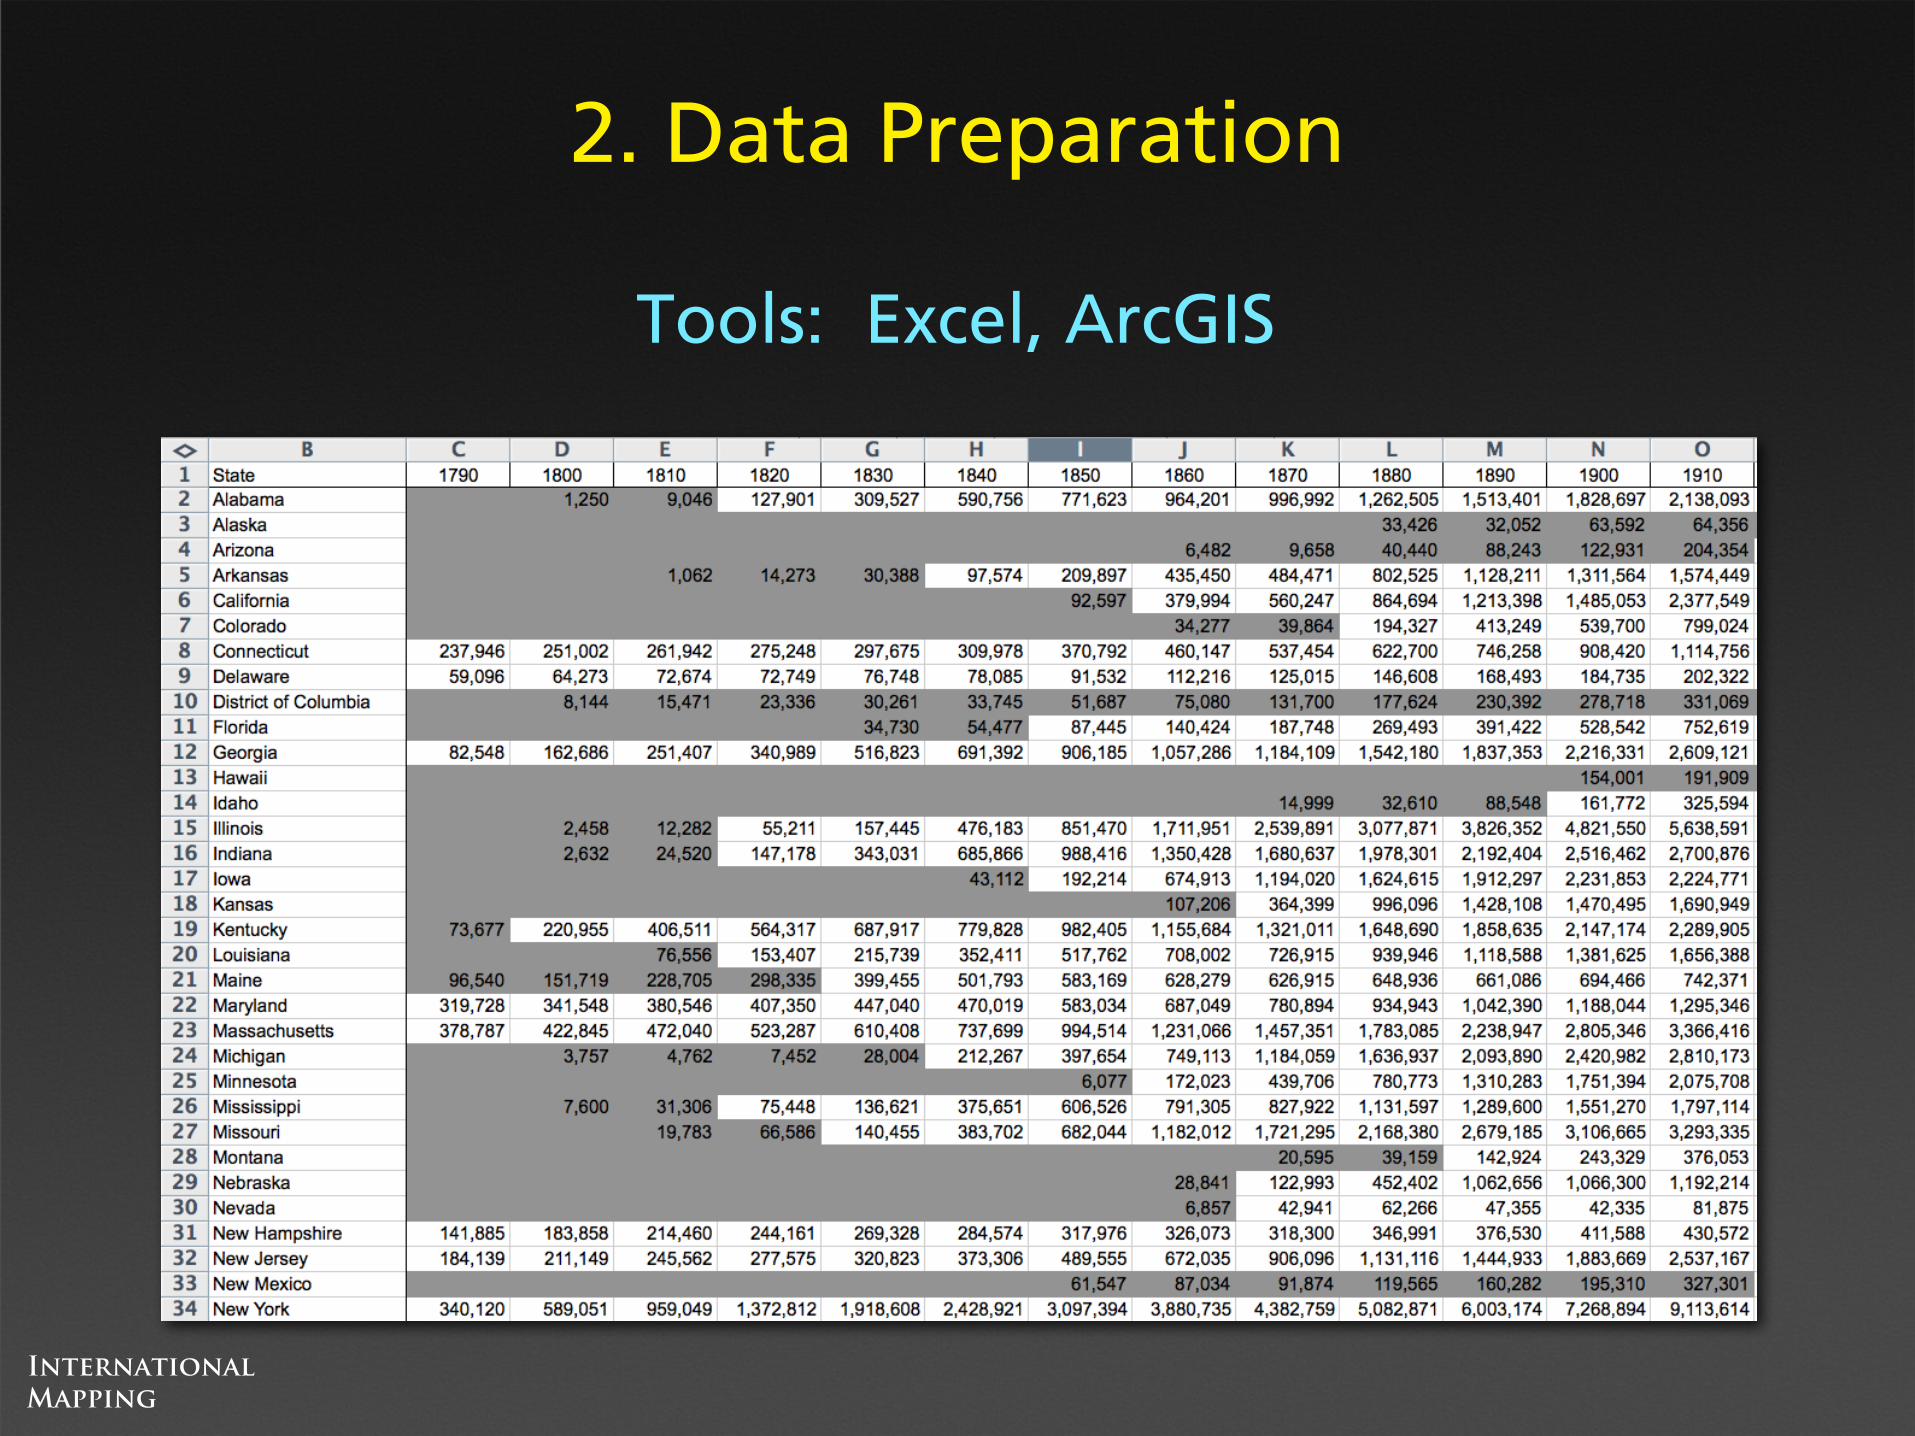
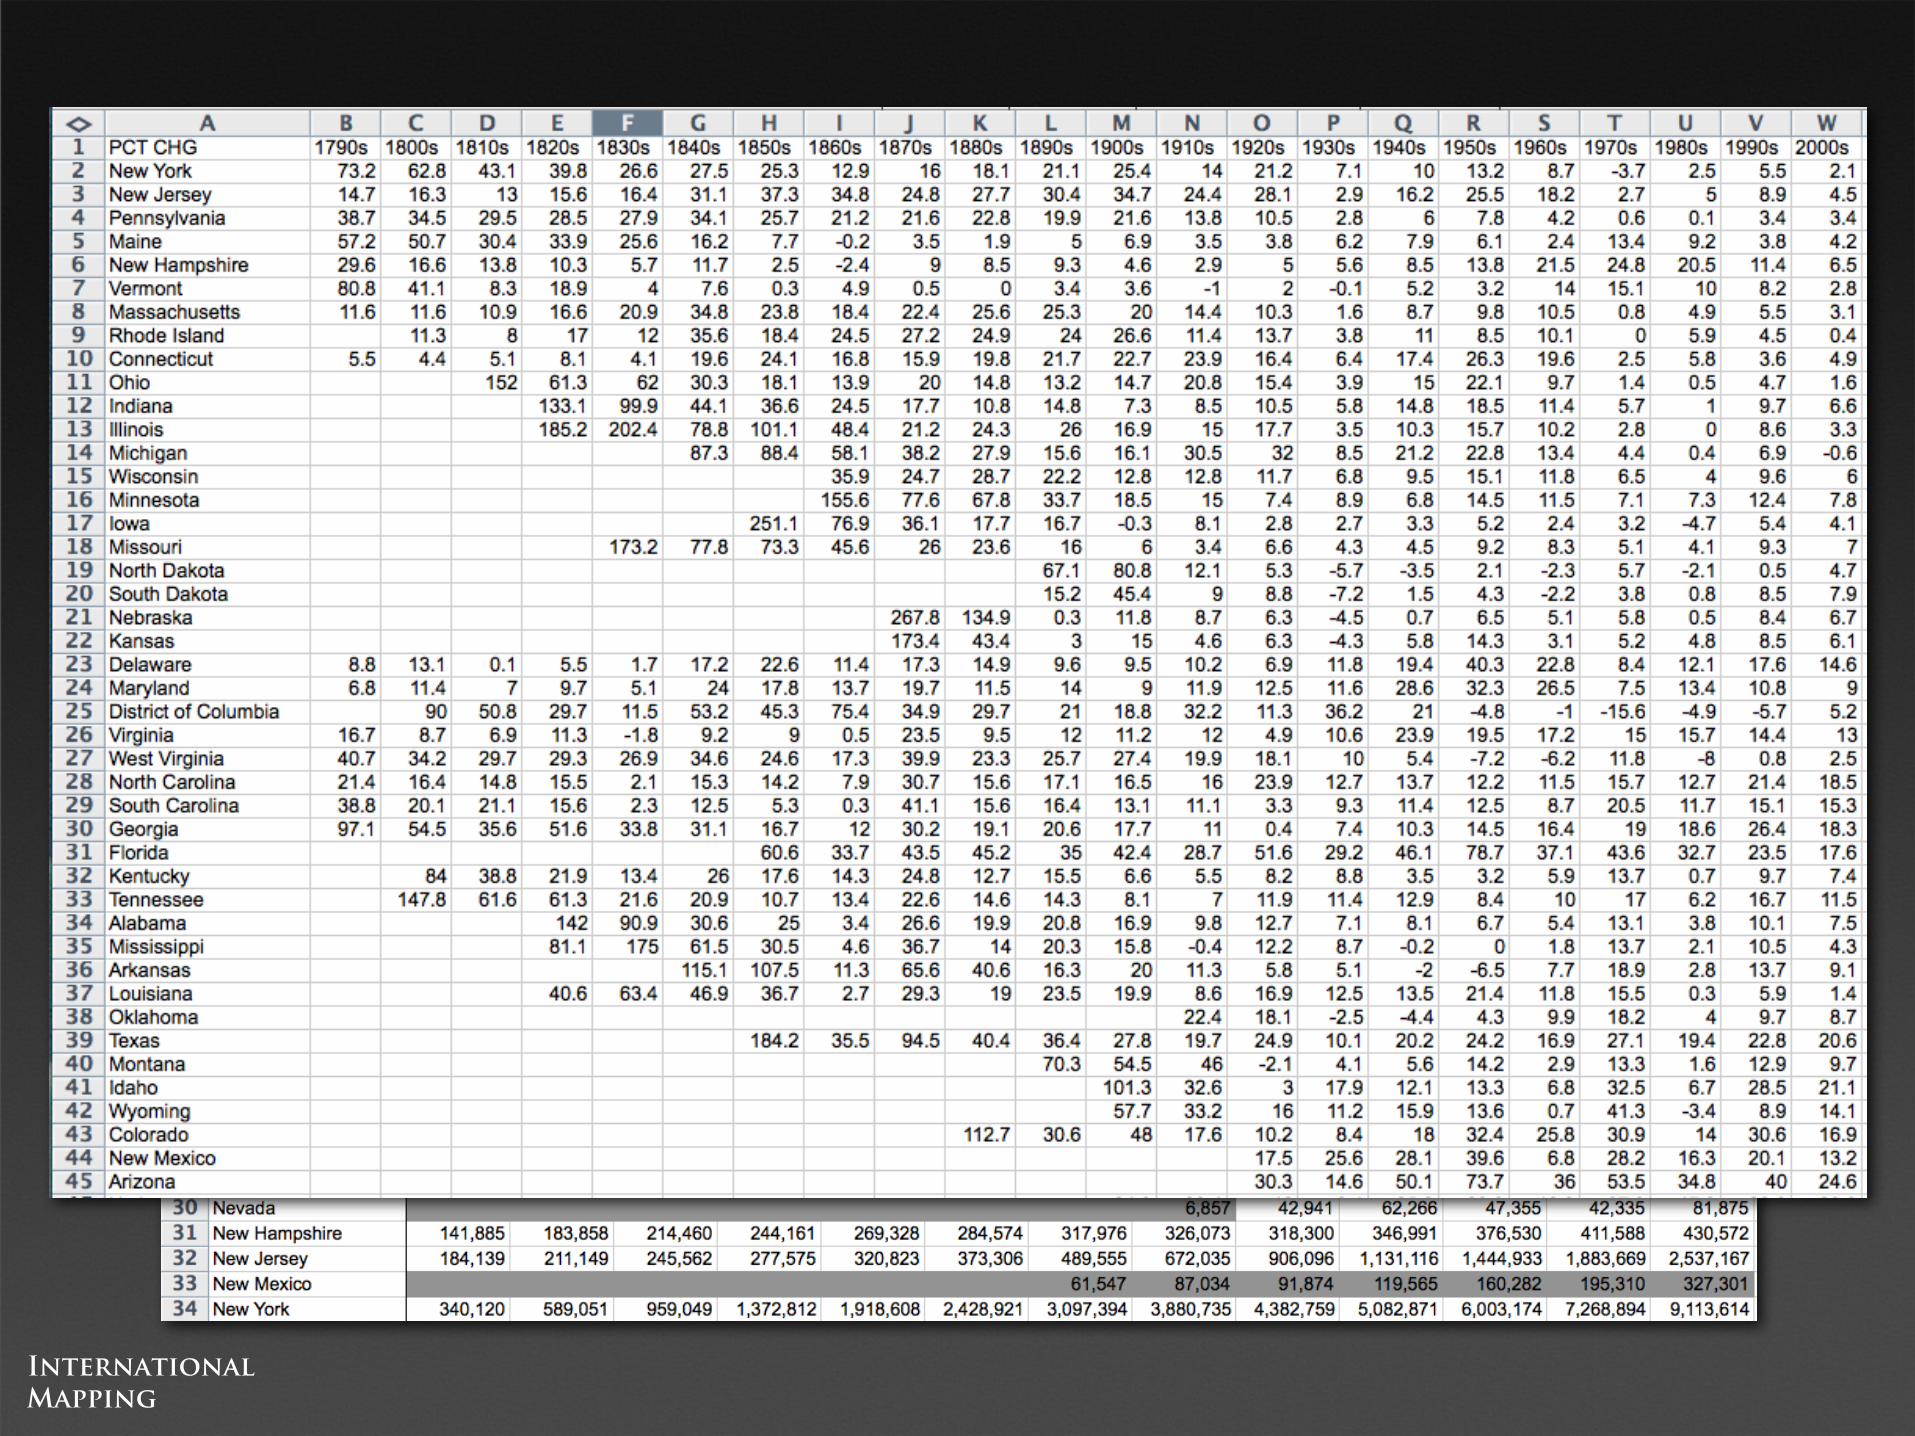
2. Data Preparation
Tools: Excel, ArcGIS
InternationalMapping

InternationalMapping
3. Rough Graphics
Tools: Excel, ArcGIS, Illustrator

InternationalMapping
Refined question: percent of maximum versus percentage change?

InternationalMapping
Refined visual: standard bar chart versus radial bar chart (direction = time period)

InternationalMapping
4. Storyboard
Tools: Illustrator, Acrobat
Opening map Mouseover Pop up box

InternationalMapping
5. Final Graphics
Tools: Illustrator, Photoshop

InternationalMapping
6. Code Development
Tools: Dreamweaver, Adobe Extendedscript Toolkit

InternationalMapping
InternationalMapping
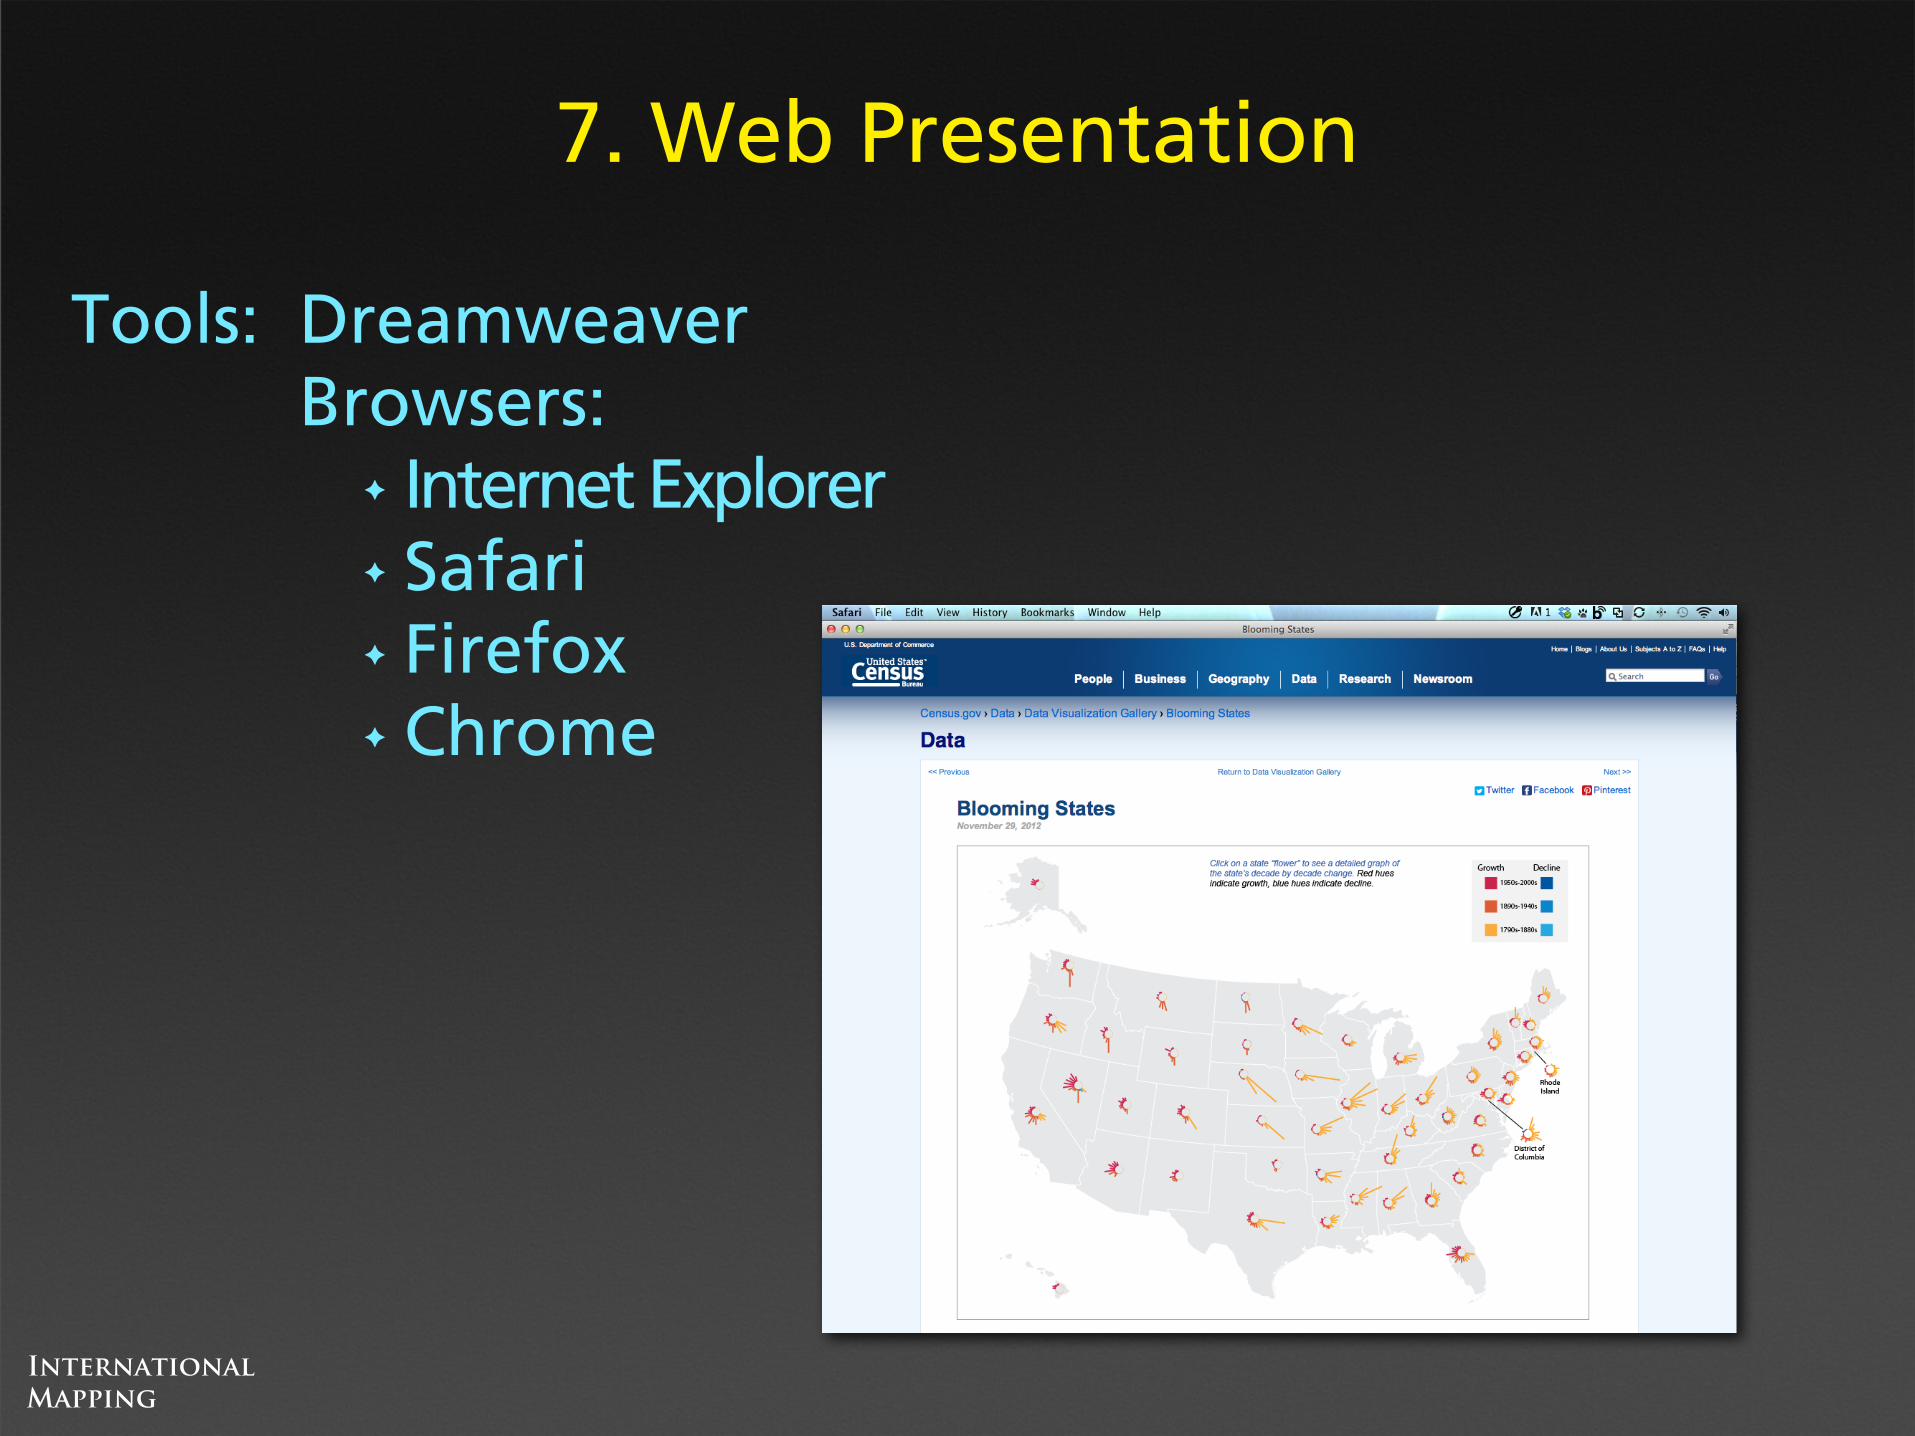
7. Web Presentation
Tools: DreamweaverBrowsers:
✦ Internet Explorer✦ Safari✦ Firefox✦ Chrome

InternationalMapping
Tips: CONCEPT
• Discuss concepts out loud with others
• Gather visual ideas• Include developer/programmer in
the early stages• Don’t shortcut brainstorming

InternationalMapping
Tips: PRODUCTION
• Copy and paste from Excel to Illustrator
• Create simple graphs in Illustrator• Create a library widgets• Don’t review digital products by
printing them out!

InternationalMapping
Tips: PROCESS
• Be sure you have an iterative creative process
• Create, review, revise, review, revise...• Generate lots of visual ideas because you
should probably kill at least 1/2 of them

InternationalMapping
Samples from the gallery
< explore: Top 20 Cities, Gaining and Losing Shares, I-95 Population Density Profile, Changing Ranks and States, Bracketology >

InternationalMapping
Alex Tait
443-367-0050 [email protected]
International Mapping, Ellicott City, MD
Questions?