u.s. coal supply and demand: 2007 review · page 1 of 15 u.s. coal supply and demand: 2007 review...
TRANSCRIPT
Page 1 of 15
U.S. Coal Supply and Demand: 2007 Review
by
Fred Freme
U.S. Energy Information Administration
Overview Coal production in the United States in 2007 totaled 1,145.6 million short tons according to preliminary data from the Energy Information Administration (Table 1), a decrease of 1.5 percent, or 17.2 million short tons from the 2006 record level of 1,162.7 million short tons. Although coal production declined in 2007, U.S. total coal consumption increased for the year. Coal consumption in 2007 in the electric power sector was higher by 1.9 percent, while coking coal consumption decreased by 1.1 percent and the other industrial sector declined by 5.0 percent. (Note: All percentage change calculations are done at the short-tons level.) U.S. coal exports were significantly higher in 2007, while coal imports remained at about the same level. Total coal stocks increased slightly during the year, as some consumers continued to rebuild their stockpiles that had been seriously depleted in 2005 due to transportation issues.
The growth in coal consumption during the year was primarily a result of the weather-related increases in the demand for electricity in 2007. Preliminary data show that total generation in the electric power sector (electric utilities and independent power producers) in the United States grew in 2007. Coal-based generation also increased, resulting in a 19.8-million-short-ton increase in coal consumed in the electric power sector. Coal use in the non-electricity sector decreased by 3.8 percent to a level of 82.4 million short tons.
In the international markets in 2007, U.S. coal exports increased to levels not seen in recent years while coal imports were mostly static. U.S. coal exports totaled 59.2 million short tons, an increase of 9.5 million short tons over 2006. Coal imports in
2007 ended the year at 36.3 million short tons, 0.1 million short tons higher than in 2006.
Coal prices in 2007 were split with most domestic prices higher for the year while the international prices were overall lower. Although the average delivered price of coal increased for most users in the United States in 2007, the increases were smaller than what had been experienced in 2006. In the domestic markets, the electric utility price-per-short-ton increase was 5.3 percent, while the increase was only 1.3 percent for independent power producers. Coking coal prices increased by 2.3 percent, while the price for the other industrial sector increased by 5.3 percent in 2007. Coal prices in the coal synfuel sector declined by 3.6 percent in 2007. In the international markets, where most coal prices fell, the average price per ton of export coal, measured in free alongside ship (f.a.s.) value, declined slightly by 1.0 percent in 2007, while the price of coal imported into the United States, measured by the customs import value (c.i.v.), dropped by 3.0 percent.
The coal synfuel industry in the United States processed more coal in 2007, increasing by 33.7 percent, making use of the available tax credits that expired on December 31, 2007. The amount of coal processed in 2007 was 146.5 million short tons.
Production U.S. coal production decreased in 2007 by 1.5 percent to a level of 1,145.6 million short tons (Figure 1 and Table 1), 17.2 million short tons lower than the 2006 production. Although total U.S. coal production was lower in 2007, only two of the three coal-producing regions had lower production while the other increased, but only marginally. Exclusive of refuse production, the Appalachian and Interior

Page 2 of 15
Table 1. U.S. Coal Supply, Disposition, and Prices, 2003 – 2007 (Million Short Tons and Nominal Dollars per Short Ton)
Item 2003 2004 2005 2006 2007 Production By Region Appalachia 376.1 389.9 396.7 391.2 377.1 Interior 146.0 146.0 149.2 151.4 146.6 Western 548.7 575.2 585.0 619.4 621.0 Refuse Recovery 1.0 1.0 0.7 0.8 0.8 Total 1,071.8 1,112.1 1,131.5 1,162.7 1,145.6 Consumption By Sector Electric Power 1,005.1 1,016.3 1,037.5 1,026.6 1,046.4 Coke Plants 24.2 23.7 23.4 23.0 22.7 Other Industrial Plants 61.3 62.2 60.3 59.5 56.5 Combined Heat and Power (CHP) 24.8 26.6 25.9 25.3 24.1 Non - CHP 36.4 35.6 34.5 34.2 32.4 Residential/Commercial Users 4.2 5.1 4.7 3.2 3.2 Residential 0.6 0.6 0.4 0.3 0.3 Commercial 3.7 4.6 4.3 2.9 2.9 Total 1,094.9 1,107.3 1,126.0 1,112.3 1,128.8 Year-End Coal Stocks Electric Power 121.6 106.7 101.1 141.0 151.1 Coke Plants 0.9 1.3 2.6 2.9 1.9 Other Industrial Plants 4.7 4.8 5.6 6.5 5.6 Producers/Distributors 38.3 41.2 35.0 36.5 30.8 Total 165.5 154.0 144.3 186.9 189.4 U.S. Coal Trade Exports 43.0 48.0 49.9 49.6 59.2 Steam Coal 20.9 21.2 21.3 22.1 27.0 Metallurgical Coal 22.1 26.8 28.7 27.5 32.2 Imports 25.0 27.3 30.5 36.2 36.3 Steam Coal 23.3 25.1 28.7 34.6 34.7 Metallurgical Coal 1.7 2.2 1.8 1.7 1.7 Net Exports 18.0 20.7 19.5 13.4 22.8
Average Prices Domestic Average Delivered Price Electric Utilities 1 $25.82 $27.30 $31.22 $34.26 $36.08 Independent Power Producers 1 $26.20 $27.27 $30.39 $33.04 $33.47 Coke Plants $50.63 $61.50 $83.79 $92.87 $94.97 Other Industrial Plants $34.70 $39.30 $47.63 $51.67 $54.42 International Average Free Alongside Ship (f.a.s.) Price 2 Exports $35.98 $54.11 $67.10 $70.93 $70.25 Steam Coal $26.94 $42.03 $47.64 $46.25 $47.90 Metallurgical Coal $44.55 $63.63 $81.56 $90.81 $88.99 Average Customs Import Value (c.i.v.) Price 3 Imports $31.45 $37.52 $46.71 $49.10 $47.64 Steam Coal $30.24 $36.06 $43.35 $46.15 $45.31 Metallurgical Coal $47.83 $54.27 $101.88 $109.36 $96.05
1 Average delivered price is through November 2007. 2 Free alongside ship (f.a.s.) is the value of a commodity at the port of exportation, generally including the purchase price plus all charges
incurred in placing the commodity alongside the carrier at the port of exportation. 3 Customs import value (c.i.v.) is the price of a commodity when sold for exportation to the U.S., excluding U.S. import duties, freight, and
insurance. Notes: Totals may not equal sum of components due to independent rounding. Sum of net exports, stock changes, and consumption may not equal production, primarily because the supply and disposition data are obtained from different surveys. Sources: Production, consumption, stocks, and prices: Energy Information Administration, Quarterly Coal Report, October-December 2007, DOE/EIA-0121(2007/Q4) (Washington, DC, March 2008); and Electric Power Monthly, March 2008, DOE/EIA-0226(2008/03) (Washington DC, March 2008). Exports and imports: U.S. Department of Commerce, Bureau of the Census, "Monthly Report EM 545" and "Monthly Report IM 145."

Page 3 of 15
Regions had a decrease in their production levels in 2007 of 3.6 percent and 3.2 percent respectively, while the Western Region had an increase in coal production of 0.3 percent (Figure 2 and Table 2). In the amount of tons of coal produced, the decrease in the Appalachian Region production was 14.0 million short tons, while the decrease in Interior Region production in 2007 was 4.8 million short tons. Coal production in the Western Region increased by 1.6 million short tons.
Appalachian Region Coal production in the Appalachian Region declined for the second consecutive year in 2007, decreasing by 14.0 million short tons, to end the year at 377.1 million short tons, a decline of 3.6 percent, a level only slightly greater than the 2003 production total. The decrease in 2007 in coal production in the Appalachian Region was primarily driven by two different issues. One issue was the production problems at a few of the larger mines in the region; and the other was ongoing lawsuits, principally in the
central portion of the Appalachian Region, concerning the issuing of Federal permits that regulate the excavation and discharge of dredged and fill material into the waters of the United States. As a consequence of these lawsuits, new permits have not been issued as quickly as they had in the past thereby limiting some possible additional production.
West Virginia, the largest coal-producing State in the Appalachian Region and the second largest in the United States, was one of the only two States in the region to have an increase in coal production in 2007. Total coal production increased slightly in West Virginia, by 0.6 percent, in 2007 to end the year with 153.2 million short tons of production, 0.8 million short tons above the 2006 level. Increases in coal production at Mettiki Coal’s Mountain View mine (a replacement mine for Mettiki’s depleted Maryland mine) of 2.2 million short tons and a full year’s production from Frasure Creek Mining’s new Mine No. 7 of 1.1 million short tons, helped to offset the declines in production experienced at Alpha Natural Resources’ Mountaineer Alma A mine of 1.0 million short tons and Consol Energy’s McElroy mine of 0.8 million short tons.
Figure 1. Coal Production by Coal-Producing Region, 2007 (Million Short Tons and Percent Change from 2006) Regional totals do not include refuse recovery
U.S. Total: 1,145.6 Million Short Tons (-1.5%)
Western621.0(0.3%)
Interior146.6
(-3.2%)
Appalachian377.1
(-3.6%)
Source: Energy Information Administration, Quarterly Coal Report, October-December 2007, DOE/EIA-0121(2007/Q4) (Washington, DC, March 2008).

Page 4 of 15
Eastern Kentucky produced 86.8 million short tons of coal in 2007, a decline of 7.3 percent or 6.8 million short tons, the largest tonnage decrease for any State in the Appalachian Region. Although the Locust Grove’s Elm Lick mine had an increase in 2007 of 1.3 million short tons in its first full year of production and three other mines had increases of over a half-a-million short tons, production decreases by numerous other mines, including the 2007 idling of ICG’s Blackberry and Nally & Hamilton Enterprises’ Colliers Creek mines resulting in drops of 1.2 and 0.6 million short tons respectively, lead to the lower annual production in Eastern Kentucky for the year.
Pennsylvania produced 65.0 million short tons, a decrease of 1.5 percent from 2006, or 1.0 million short tons. There was no single mine that accounted for the majority of the decline in coal production in Pennsylvania for the year, but the slight decreases of less than 0.3 million short tons experienced by Consol’s Bailey and Foundation’s Cumberland and Emerald mines were more than enough to offset the increases in coal production experienced by Consol’s Enlow Fork, Dana Mining’s 4 West, and Rosebud Mining’s Logansport mines.
Coal production in Virginia decreased in 2007 by 4.5 million short tons to a total of 25.3 million short tons, a decline of 15.0 percent. The decrease in coal production in Virginia was primarily a result of the lower production by Consol’s Buchanan mine that experienced a roof fall in July and was closed for the
remainder of the year thus resulting in a production level for the mine that was 43.7 percent below the 2006 level. Ohio’s coal production declined slightly in 2007 by 0.7 percent to end the year at 22.6 million short tons.
Besides West Virginia, Alabama was the only other State in the Appalachian Region to have increased coal production in 2007 with a total of 19.3 million short tons for the year. The increase of 0.5 million short tons, or 2.6 percent, was the result of higher coal production at the Jim Walter Resources’ No. 4 mine that helped replace the lost coal production from its No. 5 mine, which was abandoned due to the depletion of its reserves, and increased production from Drummond Company’s Shoal Creek mine. Tennessee had a slight decrease of 0.2 million short tons in coal production in 2007 from its prior year level, resulting in a total of 2.6 million short tons. With the closing of Mettiki Coal’s Mettiki mine (the largest mine in the State) due to the depletion of coal reserves in 2007, total coal production in Maryland in 2007 decreased by 54.6 percent to end the year at 2.3 million short tons, the lowest level of any State in the Appalachian Region.
Interior Region The Interior Region experienced a decrease in coal production in 2007 of 4.8 million short tons, or 3.2 percent, to end the year at a total of 146.6 million short tons. The decline in coal production in the Interior Region was primarily a result of the lower coal production in Texas, the largest coal-producing State in the region. In 2007 coal production in Texas was 41.9 million short tons, a decline of 3.6 million short tons from the 2006 level. Although there was an increase in coal production at Luminant Mining’s Tatum mine of 1.1 million short tons for the year, the decline of 2.6 million short tons at its Three Oaks mine and the suspension of coal production at its Winfield North mine resulted in lower coal production in Texas in 2007.
Of the two States to register increases in 2007 coal production in the Interior Region, Western Kentucky accounted for almost all of the regional increase. Coal production in Western Kentucky increased 0.9 million short tons in 2007 to end the year at 28.2 million short tons, an increase of 3.5 percent. Although Armstrong Coal’s Big Run mine was idled at the end of 2006 with a resulting loss of over 1 million short tons of coal production, expansions at KenAmerican Resources’ Paradise No. 9 mine of 0.6 million short tons and Hopkins County Coal’s Elk
Figure 2. Coal Production by Region, 1998-2007 (Million Short Tons)
Regional totals do not include refuse recovery
0
200
400
600
800
1000
1200
1400
1998 1999 2000 2001 2002 2003 2004 2005 2006 2007
U.S.
Western
Interior
Appalachian
U.S.
Sources: Energy Information Administration, Quarterly Coal Report, October-December 2007, DOE/EIA-0121(2007/Q4) (Washington, DC, March 2008); Coal Industry Annual, DOE/EIA-0584, various issues; Annual Coal Report 2003, DOE/EIA-0584(2003), (Washington, DC, November 2004); and Annual Coal Report 2005, DOE/EIA-0584(2005), (Washington, DC, November 2006).

Page 5 of 15
Table 2. U.S. Coal Production by Coal-Producing Region and State, 2003 - 2007 (Million Short Tons)
Coal-Producing Region and State 2003 2004 2005 2006 2007
Percent Change
2006 – 2007 Appalachia Total 376.1 389.9 396.7 391.2 377.1 -3.6 Alabama 20.1 22.3 21.3 18.8 19.3 2.6 Kentucky, Eastern 91.3 90.9 93.3 93.6 86.8 -7.3 Maryland 5.1 5.2 5.2 5.1 2.3 -54.6 Ohio 22.0 23.2 24.7 22.7 22.6 -0.7 Pennsylvania Total 63.7 66.0 67.5 66.0 65.0 -1.5 Anthracite 1.2 1.7 1.6 1.5 1.6 1.4 Bituminous 62.5 64.3 65.8 64.5 63.5 -1.6 Tennessee 2.6 2.9 3.2 2.8 2.6 -5.7 Virginia 31.6 31.4 27.7 29.7 25.3 -15.0 West Virginia Total 139.7 148.0 153.6 152.4 153.2 0.6 Northern 34.9 40.6 42.6 42.4 42.0 -1.0 Southern 104.8 107.3 111.0 110.0 111.3 1.2 Interior Total 146.0 146.0 149.2 151.4 146.6 -3.2 Arkansas * * * * 0.1 263.4 Illinois 31.6 31.9 32.0 32.7 32.4 -0.9 Indiana 35.4 35.1 34.5 35.1 35.0 -0.3 Kansas 0.2 0.1 0.2 0.4 0.4 -1.3 Kentucky, Western 21.5 23.4 26.4 27.2 28.2 3.5 Louisiana 4.0 3.8 4.2 4.1 3.1 -25.6 Mississippi 3.7 3.6 3.6 3.8 3.5 -6.6 Missouri 0.5 0.6 0.6 0.4 0.2 -40.1 Oklahoma 1.6 1.8 1.9 2.0 1.6 -17.5 Texas 47.5 45.9 45.9 45.5 41.9 -7.9 Western Total 548.7 575.2 585.0 619.4 621.0 0.3 Alaska 1.1 1.5 1.5 1.4 1.3 -7.1 Arizona 12.1 12.7 12.1 8.2 8.0 -2.8 Colorado 35.8 39.9 38.5 36.3 36.4 0.2 Montana 37.0 40.0 40.4 41.8 43.4 3.7 New Mexico 26.4 27.2 28.5 25.9 24.5 -5.6 North Dakota 30.8 29.9 30.0 30.4 29.6 -2.6 Utah 23.1 21.7 24.5 26.0 24.3 -6.6 Washington 6.2 5.7 5.3 2.6 0.0 -100.0 Wyoming 376.3 396.5 404.3 446.7 453.6 1.5 Refuse Recovery 1.0 1.0 0.7 0.8 0.8 11.2 U.S. Total 1,071.8 1,112.1 1,131.5 1,162.7 1,145.6 -1.5
* Less than 50 thousand short tons. Source: Energy Information Administration, Annual Coal Report 2004, DOE/EIA-0584(2004)(Washington, DC, November 2005); Energy Information Administration, Annual Coal Report 2006, DOE/EIA-0584(2006)(Washington, DC, November 2007); and Quarterly Coal Report, October-December 2007, DOE/EIA-0121(2007/Q4)(Washington, DC, March 2008).
Creek mine of 1.1 million short tons was more than enough to offset that loss. Arkansas, the Nation’s smallest coal producing State, was the only other State in the Interior Region to have higher production in 2007. Coal production in Arkansas increased to
reach a total of 83 thousand short tons, 60 thousand short tons higher than the 2006 level.
Indiana, the second-largest coal-producing State in the Interior Region, had a slight decrease of 0.3 percent in 2007 to end the year with a total of 35.0

Page 6 of 15
million short tons, a level that was 0.1 million short tons below 2006. Declines of almost a half million short tons each experienced at Vigo Coal Company’s Cypress Creek mine and Triad Mining’s Patoka mine were balanced by Sunrise Coal’s Carlisle mine, in its first year of coal production, which produced 1.0 million short tons in 2007. Coal production in Illinois also declined slightly by 0.9 percent to end the year at 32.4 million short tons, a decrease of 0.3 million short tons. Increases in coal production by Mach Mining’s No. 1 mine of 0.9 million short tons and Vigo Coal Company’s Friendsville mine of 0.6 million short tons in 2007 were negated by the lower production levels of several mines, including Foundation Coal’s Wabash mine which was abandoned early in 2007, and the idling of Monterey Coal‘s No. 1 mine and Springfield Coal’s Crown II mine. The other States in the Interior Region (Kansas, Louisiana, Mississippi, Missouri, and Oklahoma), which together produced 8.9 million short tons of coal and accounted for a total of 6.1 percent of the entire region’s production in 2007, all had lower coal production from their prior year levels.
Western Region The Western Region was the only one of the three regions to show an increase in coal production in 2007. Coal production rose by 0.3 percent to reach a total of 621.0 million short tons, over 54 percent of total U.S. coal production for the year. The slight increase of 1.6 million short tons resulted in another record level for the region, the fourth year in a row. Even though there was a record level of coal production in 2007, only three States in the Western Region had higher production levels from the previous year, Colorado, Montana, and Wyoming.
Wyoming is the largest coal-producing State in the Nation, a position it has held since 1988. In 2007, Wyoming produced 453.6 million short tons of coal, an increase of 1.5 percent, or 6.8 million short tons for the year. Although nine of the twenty-one mines in Wyoming had decreases in coal production in 2007, the increased production levels at the rest of the mines pushed the state to a new production record for the year. Wyoming has dominated U.S. coal production since 1995 when it first accounted for more than one-quarter of total U.S. production. Examples of how much Wyoming dominates the U.S. coal supply include that for 2007, its production accounted for 73 percent of the Western Region production total; was 76.4 million short tons more than the entire Appalachian Region production; was more than three times the Interior Region production;
and was only slightly less than 40 percent of the total U.S. coal production for the year. Also, if the 25 States that produced coal in 2007 were ranked by descending total production levels, Wyoming produced only 1.4 million short tons less than the sum of the next six largest coal-producing States (West Virginia, Kentucky, Pennsylvania, Montana, Texas, and Colorado) and 217.4 million short tons more coal than the summation of the States ranked 8th through 25th. Peabody’s North Antelope Rochelle mine was the largest coal mine in Wyoming and the United States in 2007, producing a total of 91.5 million short tons, an increase of 3.0 million short tons. This one mine produced more coal than 22 of the 24 other coal-producing States in 2007. However, the one mine in Wyoming that had the largest tonnage increase in 2007 was Arch Coal’s Coal Creek mine, which returned to production in mid-2006 after suspending coal production in 2000. Coal Creek increased production in 2007 by 7.1 million short tons to end the year at a total of 10.2 million short tons.
In 2007, Montana, the second largest coal-producing State in the Western Region, produced a total of 43.4 million short tons, an increase of 3.7 percent, displacing Texas as the fifth largest coal-producing State in the Nation. Although there were decreases in production at four of the six mines in Montana, the increase in coal production at Spring Creek Coal’s Spring Creek mine of 1.2 million short tons in 2007, to reach a total of 15.7 million short tons, more than offset the declines. Colorado had a slight increase in coal production in 2007, ending the year with a total of 36.4 million short tons, an increase of 0.2 percent, or 62 thousand short tons.
Total coal production in North Dakota declined in 2007 by 2.6 percent to end the year at 29.6 million short tons. Declines in production at three of the four mines, Center, Falkirk, and Freedom mines, negated the increase in coal production by the Beulah mine. New Mexico had a decrease of 1.5 million short tons in 2007 to end the year with a total of 24.5 million short tons, a decline of 5.6 percent, and the second year in a row that production declined in the State. The majority of the decrease in coal production for New Mexico was attributable to the decreased production level at Chevron Mining’s McKinley mine. Coal production in Utah in 2007 declined by 6.6 percent to a level of 24.3 million short tons. Although there was a 1-million-short-ton-plus increase in coal production at West Ridge Resources’ West Ridge mine, decreases of over 1 million short tons at Arch Coal’s Sufco mine and Andalex Resources’ Aberdeen mine more than offset the increase. In 2007 coal production in Arizona

Page 7 of 15
decreased by 2.8 percent to end the year at 8.0 million short tons, while coal production in Alaska was 1.3 million short tons, slightly below the prior year total. There was no coal production in Washington in 2007 due to the closing of the State’s only mine, TransAlta’s Centralia mine, in November of 2006.
Consumption Preliminary data show that total coal consumption rebounded in 2007 increasing by 1.5 percent over 2006 level. Total U.S. coal consumption was 1,128.8 million short tons, an increase of 16.5 million short tons. Almost 93 percent of all coal consumed in the United States is in the electric power sector (electric utilities and independent power producers), making it the powerhouse for total coal consumption. Two of the three other coal-consuming sectors, other industrial and coking coal, had declines in their consumption totals, while the residential and commercial sector, which is the smallest of all coal consuming sectors, accounting for less than one third of one percent of total consumption, was basically
unchanged. The other industrial sector had a decrease in coal consumption in 2007 of 5.0 percent, while the coking coal sector had a decline of 1.1 percent.
Coal consumption in the electric power sector increased by 1.9 percent or 19.8 million short tons to end 2007 at 1,046.4 million short tons (Figure 3). However, coal-based electricity generation increased at a slightly lower rate of 1.6 percent, reflecting increasing volumes of lower-Btu western coals (subbituminous and lignite) to generate electricity. Nationally, total generation in the electric power sector from all fuels increased in 2007 by 2.5 percent with gains in electricity generation by all sources except the hydroelectric sector in the United States. The decline of 14.6 percent in electricity generation by hydroelectric facilities in the United States was a direct result of the drought conditions experienced across most the country during the year and resulted in a decrease of its share of total generation to 6.0 percent (Figure 4). The increase in electric generation in 2007 by other fuel sources ranged from the aforementioned 1.6 percent for coal to 10.8 percent for natural gas. The large increase in electricity generation by natural gas for 2007 was due
Figure 3. Electric Power Sector Consumption of Coal by Census Division, 2007 (Million Short Tons and Percent Change from 2006)
U.S. Total = 1,046.4 (1.9%)Pacific
Contiguous9.2 (42.4%)
New England8.8 (0.0%)
Mountain115.2 (0.4%) West North Central
147.8 (0.8%)East
North Central237.5 (2.5%) Middle Atlantic
70.3 (0.4%)
South Atlantic186.4 (4.3%)
PacificNon-contiguous
1.1 (-2.0%)
West South Central154.6 (1.8%)
EastSouth Central115.6 (-1.0%)
Source: Energy Information Administration, Form EIA-906, “Power Plant Report.”

Page 8 of 15
in part to the numerous new generating facilities that came on-line during the year that were natural gas-fired. In 2007, 64 percent of the new capacity to come on-line during the year was natural-gas-fired, while new coal-fired capacity was 8 percent. However, the average cost of natural gas delivered to the electric utility portion of the electric power sector through November 2007 compared to 2006 had increased by only 1.1 percent, while the cost of coal had increased by 5.2 percent in the same time period.
Total electricity generation in the United States is primarily driven by two factors: economic growth and weather (measured by heating and cooling degree-days), with both factors having a positive effect on total generation. Economic growth continued throughout 2007, with the gross domestic product (GDP) of the United States increasing by 2.2 percent for the year. Also in 2007, warmer-than- normal summer weather occurred across most of the country. According to preliminary data from the National Weather Service Climate Prediction Center of the National Oceanic and Atmospheric Administration (NOAA), cooling degree-days in 2007 were higher for the country as a whole than the 30-year average, by 17.9 percent. The warmer summer weather resulted in more electricity generation to power air conditioners across the country. In contrast, the winter weather was somewhat warmer than normal, with the heating degree-days 5.3 percent below normal, lowering the need for electricity for heating, but not enough to offset the generation needed for summer for cooling.
Of the nine Census Divisions, coal is a minor component (less than 20 percent) in the fuel mix for electricity generation in two divisions, New England and Pacific, and a major component (more than 50
percent) in five divisions, East North Central, West North Central, South Atlantic, East South Central, and Mountain. In the other two divisions, coal is one of two main fuel sources for the electric power sector. In the Middle Atlantic, coal competes with nuclear power for dominance, while in the West South Central coal competes with natural gas.
Eight of the nine Census Divisions had increases in coal consumption in the electric power sector in 2007, with five of those eight having an increase of at least a million short tons. For 2007, two of the Census Divisions accounted for the majority of the increase in total coal consumption in the electric power sector. The South Atlantic Census Division accounted for 39 percent of the increase, while the East North Central accounted for another 29 percent. Total generation in the South Atlantic Census Division increased in 2007 by 3.5 percent (Table 3), while total generation in the East North Central Division increased by 2.9 percent. Coal is the primary fuel for electricity generation in both Census Divisions. Coal generated 53.9 percent of the electricity in the South Atlantic Division and 69.6 percent in the East North Central Division during 2007. The growth in generation from coal in the South Atlantic Division resulted in an increase in coal consumption of 7.7 million short tons, up 4.3 percent to end the year at 186.4 million short tons. Coal consumption in the electric power sector in the East North Central Division increased by 2.5 percent to 237.5 million short tons, an increase of 5.7 million short tons in 2007.
In the West South Central Census Division coal competes with natural gas as the primary source for electric power generation, both accounting for about 40 percent of the Division’s generation. Total generation in 2007 in the electric power sector in the West South Central Census Division grew by 2.5 percent, while coal-based generation grew by 1.2 percent. Total coal consumption in 2007 for the electric power sector in the West South Central Census Division increased by 2.8 million short tons, or 1.8 percent, ending the year at a total of 154.6 million short tons. Although the Pacific Census Division was the only division to have a decrease (1.1 percent) in total generation in the electric power sector in 2007, it had the fourth largest increase in coal consumption for the year. Even though coal is such a small part of the total generation for the division (usually less than 5 percent), the increase in coal consumption for electric power sector was 2.7 million short tons to a level of 10.3 million short tons. The substantial decrease in the generation by hydroelectric facilities, which generally account for about 40 percent of total generation, in the Pacific
Figure 4. Share of Electric Power Sector Net Generation by Energy Source, 2006 vs. 2007 (Percent)
7.2
20.1
50.4
18.8
3.5
20.320.1
50.0
3.66.0
0.0
10.0
20.0
30.0
40.0
50.0
60.0
Nuclear Hydro Gas Petroleum &Other
Coal
2006 2007
Source: Energy Information Administration, Form EIA-906, "Power Plant Report."
Page 9 of 15
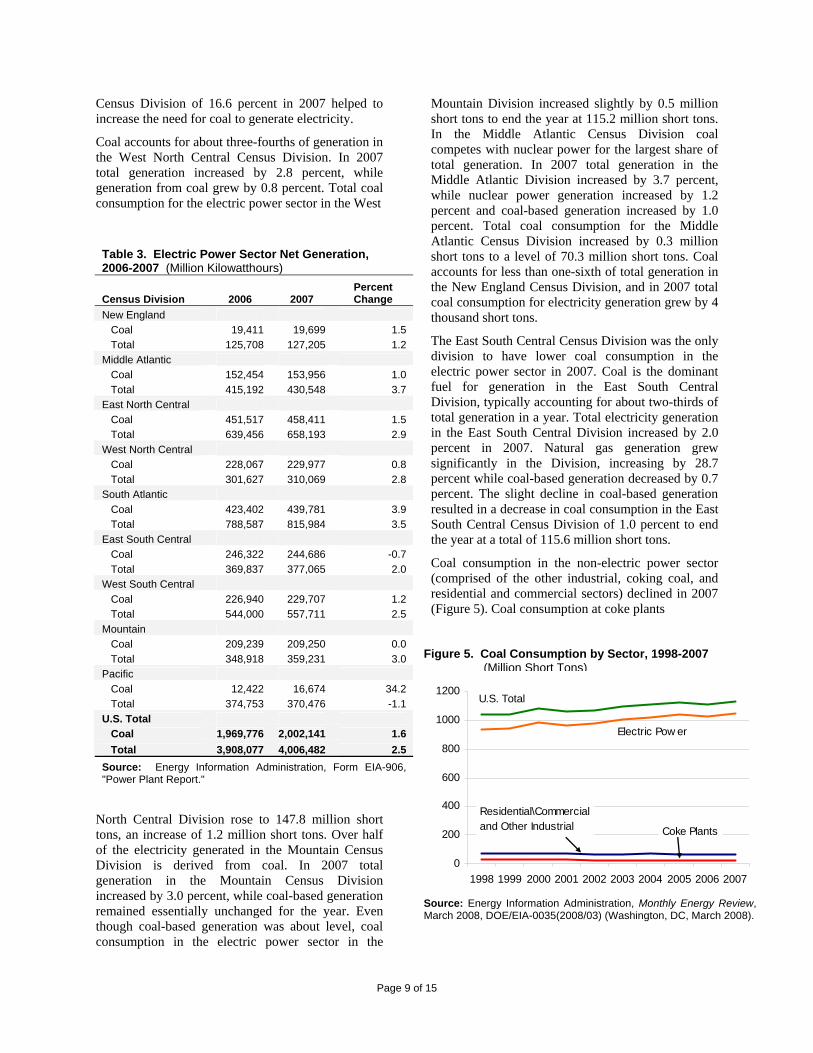
Census Division of 16.6 percent in 2007 helped to increase the need for coal to generate electricity.
Coal accounts for about three-fourths of generation in the West North Central Census Division. In 2007 total generation increased by 2.8 percent, while generation from coal grew by 0.8 percent. Total coal consumption for the electric power sector in the West
Table 3. Electric Power Sector Net Generation, 2006-2007 (Million Kilowatthours)
Census Division 2006 2007 Percent Change
New England Coal 19,411 19,699 1.5 Total 125,708 127,205 1.2 Middle Atlantic Coal 152,454 153,956 1.0 Total 415,192 430,548 3.7 East North Central Coal 451,517 458,411 1.5 Total 639,456 658,193 2.9 West North Central Coal 228,067 229,977 0.8 Total 301,627 310,069 2.8 South Atlantic Coal 423,402 439,781 3.9 Total 788,587 815,984 3.5 East South Central Coal 246,322 244,686 -0.7 Total 369,837 377,065 2.0 West South Central Coal 226,940 229,707 1.2 Total 544,000 557,711 2.5 Mountain Coal 209,239 209,250 0.0 Total 348,918 359,231 3.0 Pacific Coal 12,422 16,674 34.2 Total 374,753 370,476 -1.1 U.S. Total Coal 1,969,776 2,002,141 1.6 Total 3,908,077 4,006,482 2.5 Source: Energy Information Administration, Form EIA-906, "Power Plant Report."
North Central Division rose to 147.8 million short tons, an increase of 1.2 million short tons. Over half of the electricity generated in the Mountain Census Division is derived from coal. In 2007 total generation in the Mountain Census Division increased by 3.0 percent, while coal-based generation remained essentially unchanged for the year. Even though coal-based generation was about level, coal consumption in the electric power sector in the
Mountain Division increased slightly by 0.5 million short tons to end the year at 115.2 million short tons. In the Middle Atlantic Census Division coal competes with nuclear power for the largest share of total generation. In 2007 total generation in the Middle Atlantic Division increased by 3.7 percent, while nuclear power generation increased by 1.2 percent and coal-based generation increased by 1.0 percent. Total coal consumption for the Middle Atlantic Census Division increased by 0.3 million short tons to a level of 70.3 million short tons. Coal accounts for less than one-sixth of total generation in the New England Census Division, and in 2007 total coal consumption for electricity generation grew by 4 thousand short tons.
The East South Central Census Division was the only division to have lower coal consumption in the electric power sector in 2007. Coal is the dominant fuel for generation in the East South Central Division, typically accounting for about two-thirds of total generation in a year. Total electricity generation in the East South Central Division increased by 2.0 percent in 2007. Natural gas generation grew significantly in the Division, increasing by 28.7 percent while coal-based generation decreased by 0.7 percent. The slight decline in coal-based generation resulted in a decrease in coal consumption in the East South Central Census Division of 1.0 percent to end the year at a total of 115.6 million short tons.
Coal consumption in the non-electric power sector (comprised of the other industrial, coking coal, and residential and commercial sectors) declined in 2007 (Figure 5). Coal consumption at coke plants
Figure 5. Coal Consumption by Sector, 1998-2007 (Million Short Tons)
Source: Energy Information Administration, Monthly Energy Review, March 2008, DOE/EIA-0035(2008/03) (Washington, DC, March 2008).
0
200
400
600
800
1000
1200
1998 1999 2000 2001 2002 2003 2004 2005 2006 2007
Electric Pow er
Coke Plants
U.S. Total
Residential\Commercialand Other Industrial

Page 10 of 15
decreased by 0.2 million short tons to end the year at 22.7 million short tons, a decline of 1.1 percent. The decline in U.S. coke production in 2007 was a result of the decrease in pig iron production that occurred for the year combined with the slight drop in U.S. coke exports.
Although GDP grew by 2.2 percent, the economic growth did not extend into the entire manufacturing sector in 2007, and as a result, coal consumption in the other industrial sector declined by 3.0 million short tons to end the year at 56.5 million short tons. The broad range of products in the numerous North American Industry Classification System (NAICS) manufacturing plants showed varied changes in coal consumption for 2007. The nonmetallic minerals products and chemical manufacturing segments had no change in coal consumption for the year, while the food manufacturing segment had a slight increase in coal consumption. However, the decrease in coal consumption in 2007 in the other industrial sector was primarily a result of the large decrease in the primary metal manufacturing segment, a decline of 2.1 million short tons. The majority of the decrease in coal consumption in this segment was the result of the closing of a dedicated plant at a primary metals facility at the end of 2006. The plant closed the old facility after securing the necessary power to run a smelter from an independent power source that burns coal to generate electricity. In essence, this is a shift of coal consumption from the other industrial sector to the independent power producers’ portion of the electric power sector. Coal consumption in the residential and commercial sector remained basically steady in 2007.
Coal Prices Domestic coal prices continued their increasing trend in 2007 rising for the fourth consecutive year. Although the average delivered prices in the consuming sectors increased for the year, it was at a slower rate than was experienced in 2006. The majority of coal sold in the electric power sector is through long-term contracts, in conjunction with spot purchases to supplement the demand. According to preliminary data through November 2007, coal prices at electric utilities (a subset of the electric power sector) increased for a seventh consecutive year, to $36.08 per short ton ($1.78 per million Btu), an increase of 5.3 percent over the 2006 price. Coal prices at independent power producers through November 2007 increased to $33.47 per short ton ($1.73 per million Btu), an increase of 1.3 percent.
The average delivered price of coal to the other industrial sector increased by 5.3 percent to an average price of $54.42 per short ton in 2007. In 2007 the delivered price of coal to U.S. coke plants increased by 2.3 percent to reach an average price of $94.97 per short ton (Figure 6).
Coal Synfuel The coal synfuel industry in 2007 was not affected by the increases in oil prices that occurred during the year to the extent it was in 2006. In 2007 the amount of coal processed by coal synfuel plants in the United States reached a record level for the short time that EIA has been collecting data on this sector. The tax credits available to coal synfuel producers are subject to a ranged phase-out linked to the average annual domestic wellhead oil price. Most plants ran at full capacity during the year despite the fact that the expiration of those tax credits would occur at the end of the 2007. According to preliminary data, there were 59 coal synfuel plants in operation in the United States at the end of 2007 (Figure 7 and Table 4). The amount of coal processed by these plants in 2007 was 146.5 million short tons, an increase of 36.9 million short tons from the depressed level processed in 2006, which was held done due to the high oil prices. The average price of coal delivered to the coal
Figure 6. Delivered Coal Prices, 1998-2007 (Nominal Dollars)
Source: Energy Information Administration, Quarterly Coal Report, October-December 2007, DOE/EIA-0121(2007/Q4) (Washington, DC, March 2008); Coal Industry Annual, DOE/EIA-0584, various issues; Annual Coal Report 2003, DOE/EIA-0584(2003), (Washington, DC, November 2004); Annual Coal Report 2005, DOE/EIA-0584(2005), (Washington, DC, November 2006) and Electric Power Monthly, March 2008, DOE/EIA-0226 (2008/03) (Washington, DC, March 2008).
$0.00
$10.00
$20.00
$30.00
$40.00
$50.00
$60.00
$70.00
$80.00
$90.00
$100.00
1998 1999 2000 2001 2002 2003 2004 2005 2006 2007
Imports
Coke PlantsOther Industrials
Exports
Electric Utilities

Page 11 of 15
synfuel plants decreased in 2007 by 3.6 percent to $46.18 per short ton making it the only sector to experience lower delivered prices for the year. These plants process both run-of-mine and waste coal to produce their end product, typically referred to as coal synfuel, which enters into the supply chain and is consumed by various users in almost all sectors, including the export market. As in the traditional coal industry, more than 90 percent of coal synfuel is distributed to the electric power sector, while smaller amounts are sent to coke plants and other industrial plants, or are exported.
Exports and Imports Exports. U.S. coal exports were higher in 2007 by 9.5 million short tons or 19.2 percent, with the substantial increases in shipments in the second half of the year accounting for about 73 percent of the higher level. Total U.S. coal exports in 2007 were 59.2 million short tons, a level higher than any since 1998 (Figure 8). Although total coal exports were up for the year, the average price per ton decreased slightly by 1.0 percent to $70.25 per short ton.
Metallurgical coal exports increased in 2007 to end the year at 32.2 million short tons, an increase of 17.0
percent as the world metallurgical coal market tightened due to increasing world demand combined with transportation issues experienced during the year in other metallurgical coal-exporting countries. Although the tonnage was up from the prior year, the average price of U.S. metallurgical coal exports declined in 2007 to $88.99 per short ton, a decrease of $1.82 per short ton over the 2006 level.
Europe is the main destination of U.S. metallurgical coal, and the increase in shipments in 2007 accounted for two-thirds of the total increase in metallurgical coal exports. Metallurgical coal exports to Europe were 18.4 million short tons, an increase of 20.6 percent from 2006. In 2007, Italy was the primary European destination of U.S. metallurgical coal exports with a total of 3.4 million short tons, a slight increase of 0.1 million short tons over 2006. The average price of metallurgical coal exports to Italy was $94.65 per short ton in 2007, a decrease of 57 cents per short ton. The Netherlands received 2.0 million short tons of U.S. metallurgical coal in 2007 making it the second-largest European destination. The increase of 0.6 million short tons was 41.8 percent higher than the prior year, while the average price per short ton decreased 81 cents per ton, from $86.59 to $85.78. Both France and the United
Figure 7. Coal Shipments from Coal-Producing Regions to Coal Synfuel Plants, 2007 (Million Short Tons, Percent of U.S. Total, and Number of Plants)
West(2.3, 2%, 2)
Illinois Basin(23.4, 16%, 13)
Northern Appalachia(35.5, 24%, 18)
Central Appalachia(70.3, 48%, 35)
Southern Appalachia(13.4, 9% 5)
Imported(1.4, 1%, 1)
59 Coal Synfuel Plants
Coal Fields Otherthan Central AppalachiaCentral AppalachiaCoal Field
Note: The numbers of plants inside the parentheses add to 74 rather than 59 plants because seven synfuel plants received coal from two or more coal-producing regions. Source: Energy Information Administration, Form EIA-3, “Quarterly Coal Consumption and Quality Report – Manufacturing Plants.”

Page 12 of 15
Kingdom each received 1.7 million short tons of U.S. metallurgical coal in 2007; that total was an increase of 23.8 percent for France and an increase of 20.0 percent for the United Kingdom. The percentage decreases in the average price per short ton of those metallurgical coal exports were 5.8 and 8.1 percent, respectively, with the average price per short ton for metallurgical coal to France at $87.44 and the price for the United Kingdom at $90.19 in 2007. Other major European destinations for U.S. metallurgical coal in 2007 were Belgium, Spain, Turkey and Germany, with each receiving over 1 million short tons of coal. The average price of metallurgical coal exports to these major destinations ranged from $84.24 per short ton in Germany to $92.70 per short ton in Spain. In 2007, Poland received 0.4 million short tons of U.S. metallurgical coal, the first time any U.S. coal had been shipped to Poland since 1991,
in part as a response to production issues experienced in its mining industry during the year.
Total U.S. metallurgical coal exports to countries in North America decreased in 2007, while shipments to South America increased substantially, with the primary destination for each region being Canada and Brazil, respectively. Canada received 3.6 million short tons of metallurgical coal from the United States, a decrease of 20.2 percent over the 2006 level, while shipments to Brazil totaled 6.4 million short tons, an increase of 47.7 percent. The average price of metallurgical coal in 2007 decreased to both countries with the price to Canada at $76.96 per short ton, while the price to Brazil was $88.32 per short ton, representing declines of 1.0 and 7.2 percent, respectively.
Table 4. Coal Statistics for Synthetic Fuel Plants, 2003-2007 (Thousand Short Tons and Nominal Dollars per Short Ton)
Year and Quarter Coal Receipts Average Price
of Receipts Coal Used Coal Stocks 2003 January - March 26,558 $32.10 26,334 1,210 April - June 31,327 $32.71 31,077 1,455 July - September 27,911 $33.13 28,110 1,287 October - December 29,380 $33.52 29,787 1,132 115,177 $32.88 115,309 2004 January - March 31,633 $34.39 31,374 1,251 April - June 31,882 $35.99 31,968 1,023 July - September 32,006 $37.46 32,172 810 October - December 30,645 $37.63 30,297 1,072 126,165 $36.36 125,810 2005 January - March 33,510 $41.82 33,523 1,064 April - June 36,770 $42.60 36,123 1,774 July - September 37,259 $42.44 37,516 1,488 October - December 33,060 $44.33 32,580 1,728 140,598 $42.78 139,743 2006 January - March 33,677 $46.58 33,468 1,951 April - June 26,061 $47.85 25,492 2,426 July - September 16,847 $52.65 17,007 2,130 October - December 33,397 $46.87 33,636 1,701 109,982 $47.90 109,603 2007 January - March 36,531 $45.78 35,669 2,486 April - June 39,582 $45.27 39,022 2,764 July - September 39,590 $45.66 40,330 1,839 October - December 30,646 $48.50 31,482 387 146,350 $46.18 146,503 Note: Total may not equal sum of the components because of independent rounding.
Source: Energy Information Administration, Form EIA-3, "Quarterly Coal Consumption and Quality Report - Manufacturing Plants."

Page 13 of 15
The Asian market, which is supplied primarily by the major metallurgical coal mines of Australia, accounted for about 3 percent of U.S. metallurgical
coal exports in 2007. Total metallurgical coal exports to Asia were 1.0 million short tons in 2007, a decline of 29.6 percent from 2006. Both of the Asian countries that were the principal destination of U.S. metallurgical coal exports had decreases in their shipments in 2007, while Japan disappeared from the list of U.S. metallurgical coal destinations. India, the primary Asian destination of U.S. metallurgical coal exports, received less tonnage in 2007, declining 10.1
percent to end the year with a total of 0.9 million short tons. South Korea received 143 thousand short tons in 2007, a slight drop of 3 thousand short tons. The average price for India was $102.67 per ton, an increase of $4.77 per ton. The average price for metallurgical coal exports to South Korea dropped significantly in 2007 by $18.98 per ton to $73.26.
Metallurgical coal exports to countries in Africa increased in 2007 from 1.1 million short tons to 2.1 million short tons. The majority of the metallurgical coal exports to Africa went to Egypt. Total U.S. metallurgical coal exports to Egypt in 2007 were 1.5 million short tons, a level more than double the 2006 total, with an average price of $90.74 per short ton, a decline in price of 7.6 percent from 2006.
Total U.S. steam coal exports increased in 2007 for the fifth consecutive year. Steam coal exports rose by 21.8 percent to a level of 27.0 million short tons in 2007, while the average price per ton increased by 3.6 percent to $47.90 per ton.
Canada is the single largest market for all U.S. coal exports as well as the primary North American destination of steam coal exports. In 2007, Canada received 14.8 million short tons of steam coal exports, a slight decrease of 0.6 million short tons. U.S. steam coal exports to Canada account for 54.7 percent of all of 2007 steam coal exports. The average price of steam coal exports to Canada decreased by only 32 cents in 2007 to $40.63 per short ton. The second largest North American country to received U.S. steam coal exports in 2007 was Mexico, with a total of 201 thousand short tons, a slight increase from the 2006 level.
Europe is the second largest market for U.S. steam coal exports due to the declining coal production in many of the countries combined with the proximity of the major eastern U.S. coal ports. Total steam coal exports to Europe increased in 2007 to a total of 8.7 million short tons, an increase of 57.1 percent from 2006. The average price of steam coal to Europe rose in 2007 by 2.8 percent, increasing to a level of $59.81 per short ton. Over half of the increase in U.S. steam coal exports to Europe was accounted for by one country, the Netherlands. The increased shipments of steam coal to the Netherlands of 1.9 million short tons accounted for 58.6 percent of the total increase in steam coal exports to Europe. The average price of steam coal exports to the Netherlands in 2007 was $63.82 per short ton, an increase of 0.6 percent from 2006. Increases in steam coal exports over one-half million short tons each in 2007 occurred for Germany and the United Kingdom, resulting in total U.S. steam coal exports of 1.2 million short tons and 1.7 million short tons, respectively. The average price of steam coal exports for Germany and the United Kingdom dropped in 2007. The price for Germany in 2007 was $56.69 per short ton, a decrease of 10.6 percent, while the price for the United Kingdom was $46.85 per short ton, a decrease of 1.8 percent from 2006. Ireland, which did not receive U.S. steam coal exports in 2006, had a total of 81 thousand short tons in 2007.
U.S. steam coal exports to the African continent increased dramatically by 918.0 percent in 2007, increasing to a total of 2.5 million short tons. The increase in steam coal exports to Africa is attributable to one country, Morocco. Total steam coal exports to Morocco in 2007 were 2.4 million short tons, well above the 2006 total of 209 thousand short tons. The average price of steam coal exports to Morocco in 2007 was $47.32 per short ton, an increase of 5.6 percent from 2006.
Steam coal exports to South America, the primary source of coal imports for the United States, doubled in 2007 to a total of 497 thousand short tons, with the
Figure 8. U.S. Coal Export and Imports, 1998-2007 (Million Short Tons)
Sources: U.S. Department of Commerce, Bureau of the Census, "Monthly Report EM 545" and "Monthly Report IM 145."
Total Imports
Total Exports
Steam Coal Exports
Metallurgical Coal Exports
0.00
10.00
20.00
30.00
40.00
50.00
60.00
70.00
80.00
90.00
1998 1999 2000 2001 2002 2003 2004 2005 2006 2007

Page 14 of 15
majority of the exports going to Chile, a total of 329 thousand short tons. The average price of steam coal exports to South America fell substantially to $50.87 per short ton from the 2006 level of $73.42 per short ton.
Steam coal exports to Asia continued its declining trend in 2007, dropping by 68.0 percent for the year. Total steam coal exports to Asia were 0.2 million short tons for the year. Although there were slight tonnage increases in a few countries, the decline in U.S. steam coal exports to South Korea accounted for the majority of the drop in steam coal exports to Asia. In 2007, South Korea only received 80 thousand short tons of steam coal from the United States, a level 344 thousand short tons lower than the 2006 total. The average price of steam coal exports to Asia actually increased in 2007 to $53.24 per short ton, a 14.3-percent increase over the 2006 price of $46.58 per short ton, while the average price of steam coal exports to South Korea increased in 2007 by 35.3 percent to a level of $56.17 per short ton.
U.S. coke exports declined in 2007 by 10.7 percent to a total of 1.4 million short tons. Most of the coke exports went to Canada which accounted for 40.8 percent of all coke exports with 0.6 million short tons. The other major destination of U.S. coke exports was Mexico with 0.4 million short tons or 29.2 percent of the total coke exports.
Imports. Although 2007 was another record year for U.S. coal imports, the fifth in a row, the increase in tonnage was slight. Total coal imports were 36.3 million short tons, an increase of 0.3 percent, or 101 thousand short tons. Even though imports increased in 2007, they only represented about 3 percent of total U.S. coal consumption. The average price of imported coal declined in 2007, by 3.0 percent. The average price of U.S. coal imports was $47.64 per short ton, down from the 2006 level of $49.10 per short ton. Colombia, which dominates the U.S. coal import market, accounted for 73.9 percent of 2007 imports. The United States imported 26.9 million short tons of coal from Colombia in 2007, an increase of 1.5 million short tons from the 2006 level. The average price of Colombian coal into the United
States was $46.33 per ton, a decrease of 1.3 percent over 2006. In 2007, Indonesia surpassed Venezuela to become the second largest supplier of coal imports. Total coal imports from Indonesia in 2007 were 3.7 million short tons, an increase of 0.5 million short tons, while the average price increased by 14.4 percent to $26.10 per ton. Coal imports from Venezuela declined by 18.4 percent to 3.4 million short tons, while the price of the coal imports remained unchanged for the year. Canada was another major source of U.S. coal imports in 2007 with a total of 2.0 million short tons, a level just slightly below its 2006 total. These four countries accounted for about 99 percent of total U.S. coal imports. Although most coal imports are used for electric generation, metallurgical coal imports were 1.7 million short tons in 2007, almost all from Canada.
U.S. coke imports decreased in 2007 by 39.5 percent to end the year at 2.5 million short tons. Reduction in shipments of coke from China of 1.6 million short tons in 2007 accounted for most of the decline in coke imports. Although the level of coke imports decreased in 2007, the average price increased for the year by 24.3 percent to a level of $194.49 per short ton.
Coal Stocks Total coal stocks at the end of 2007 were 189.4 million short tons, an increase of 2.5 million short tons from the prior year (Figure 9). Estimated coal stocks held by producers and distributors were lower by 15.9 percent, as coal producers used stocks to supplement the increasing demand. Industrial users, including coke plants, held a total of 7.6 million short tons at the end of 2007, 1.9 million short tons less than the level at the start of the year. Coal stocks in the electric power sector continued to increase in 2007 as plants continued to rebuild stocks that had dropped substantially by the end of 2005 due to transportation problems. The electric power sector ended the year with a total of 151.1 million short tons, an increase of 10.2 million short tons, or 7.2 percent over the 2006 level.

Page 15 of 15
Summary 2007 was another mixed year for the U.S. coal industry. It experienced record consumption but lower coal production. Although coal imports increased slightly, coal exports grew, resulting in an increase in net exports for 2007. Delivered coal prices continued to increase, while coal export prices moderated. Coal stocks continued to recover from their low 2005 levels in the electric power sector.
The outlook for the U.S. coal industry in 2008 is good. Higher coal consumption due to increasing electricity demand and continued growth in U.S. coal exports as the world markets remain tight should combine to increase coal production for the year. (See Energy Information Administration’s Short-Term Energy Outlook.)
Figure 9. Year-End Coal Stocks, 1998-2007(Million Short Tons)
Sources: Energy Information Administration, Quarterly Coal Report, October-December 2007, DOE/EIA-0121(2007/Q4) (Washington, DC, March 2008); and Coal Industry Annual, DOE/EIA-0584, various issues.
0
50
100
150
200
250
1998 1999 2000 2001 2002 2003 2004 2005 2006 2007
Electric Power
Other Industrial Coke Plants
Producer/Distributor
Total