us dollar – pound sterling technical analysis charts
TRANSCRIPT
September 22, 2015
USDGBP: US Dollar – Pound Sterling technical analysis charts
On Monday, compared to Friday, price action opened lower (0.64, vs Friday’s
close of 0.64), saw a higher high (0.65, vs Friday’s high of 0.64) and higher low
(0.64, vs Friday’s low of 0.64); and closed higher (0.64, vs Friday’s close of 0.64).
The day’s range was 0 ticks.
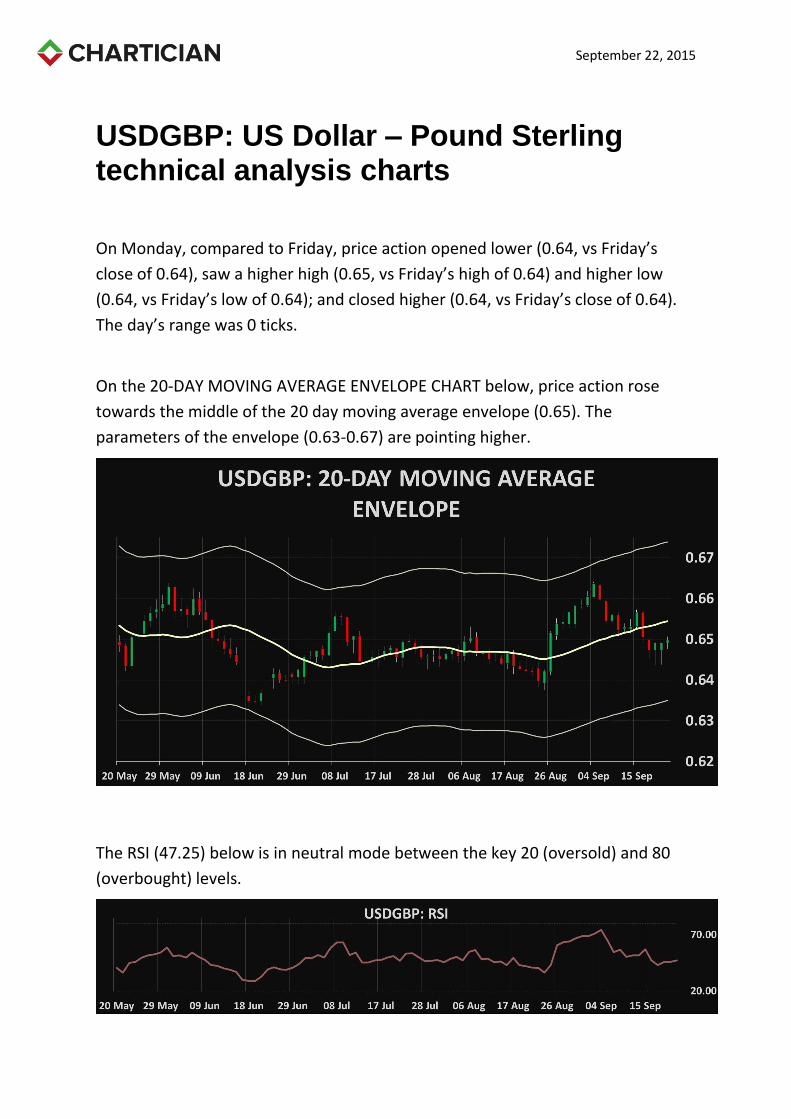
On the 20-DAY MOVING AVERAGE ENVELOPE CHART below, price action rose
towards the middle of the 20 day moving average envelope (0.65). The
parameters of the envelope (0.63-0.67) are pointing higher.
The RSI (47.25) below is in neutral mode between the key 20 (oversold) and 80
(overbought) levels.
September 22, 2015
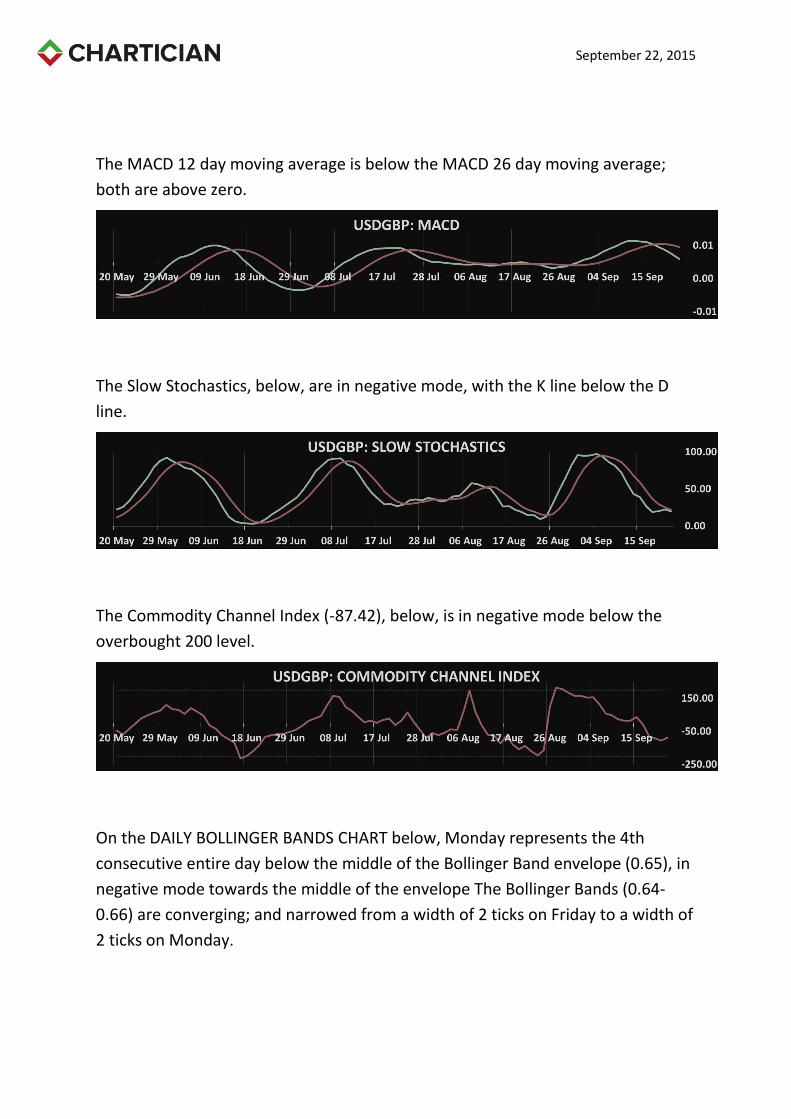
The MACD 12 day moving average is below the MACD 26 day moving average;
both are above zero.
The Slow Stochastics, below, are in negative mode, with the K line below the D
line.
The Commodity Channel Index (-87.42), below, is in negative mode below the
overbought 200 level.
On the DAILY BOLLINGER BANDS CHART below, Monday represents the 4th
consecutive entire day below the middle of the Bollinger Band envelope (0.65), in
negative mode towards the middle of the envelope The Bollinger Bands (0.64-
0.66) are converging; and narrowed from a width of 2 ticks on Friday to a width of
2 ticks on Monday.

September 22, 2015
On the 5 AND 20 DAY MOVING AVERAGES CHART below, the 5 day moving
average (0.64, moving down) is below the 20 day moving average (0.65, moving
up); in negative mode. The 3-50 day strip of moving averages ranges from the 5
day moving average (0.64) at the bottom of the range to the 20 day moving
average (0.65) at the top of the range.
September 22, 2015
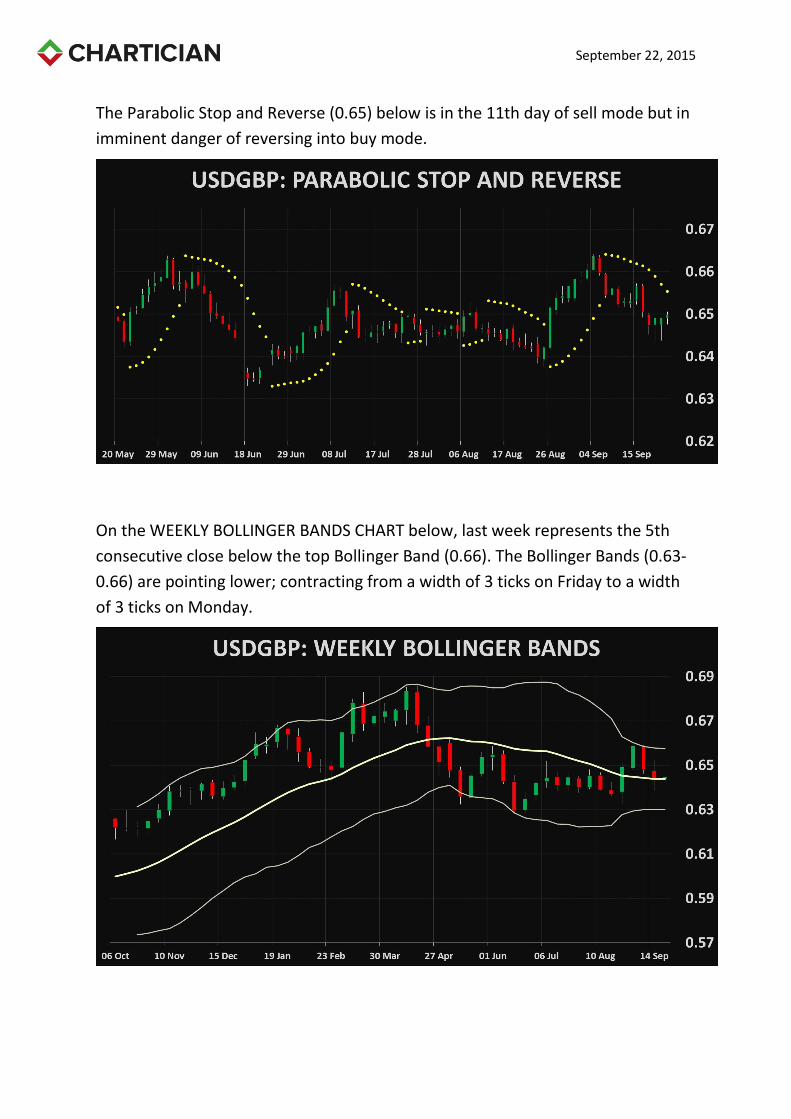
The Parabolic Stop and Reverse (0.65) below is in the 11th day of sell mode but in
imminent danger of reversing into buy mode.
On the WEEKLY BOLLINGER BANDS CHART below, last week represents the 5th
consecutive close below the top Bollinger Band (0.66). The Bollinger Bands (0.63-
0.66) are pointing lower; contracting from a width of 3 ticks on Friday to a width
of 3 ticks on Monday.