us etf compass synthetic equity & index strategy · flows of almost $0.3bn each. beta, smart...
TRANSCRIPT

18 May 2017
US ETF Compass
North America Synthetic Equity & Index Strategy
US ETF CompassDate18 May 2017
Deutsche BankMarkets Research
US ETPs continue on firm pace towards$3 trillion AUM milestoneInternational markets, particularly Europe, take center stageGlobal Equities were up by 1.61% during last month, mainly boosted by Intl DMand EM equities with returns of 2.42% and 1.70%, respectively; the Eurozone wasup by 4.4% after the first round of the French elections. Fixed Income registeredgains of 0.91%, led by EM Gov Debt USD and Convertible with returns of about1.70%. Commodities registered losses of 2.70%, dragged by Energy (-3.3%) andIndustrial Metals (-2.8%). On the currency side, the USD weakened against mostmajor foreign currencies.
US ETPs firmly approach $3.0 trillion mark in AprilApril flows were led by Equity (+$23bn), followed by Fixed Income (+$11bn). ETPsregistered $35.2bn in new cash, helping assets to rise 1.9% from the previousmonth, ending last month with a total of $2.85 trillion. Among the most relevantinflow trends, we saw US Equities with $10.3bn, DM ex-US Equities with $5.7bn,and Eurozone-focused ETFs with about $1.7bn.
A closer look at major EM ETF profiles, and EM rotationsEM ETFs have received almost $20bn in inflows following the last outflowsepisode right after the US presidential election in last November. Most of theinflows have been driven by allocations into Global regional vehicles as opposedto country-specific funds. In addition, we provide full profiles for the major globalEM regional ETFs, and we also highlight the recent reversal of the flow rotationout of Asia and into Latam along with relevant ETFs.
The ETF Industry gets its own ETFWe provide a detailed analysis of the first ETF providing exposure to the ETFindustry. The ETF Industry ETF (TETF) employs a custom subsector classificationand a tiered system with equal weighting in order to provide a tilt to companieswith substantial participation and direct financial benefits from the ETF industry.
House View Portfolio - adjusting the courseWe continue to favor equities over fixed income, and remain out of commodities.However, to adjust our portfolio to the current environment, we have takena more balanced approach to risk in developed equity markets, and a moretargeted approach in EM. While shortening duration, and adding credit risk indebt markets.
Sebastian Mercado, CFA
Strategist
+1-212-250-8690
Hallie Martin
Strategist
+1-212-250-7994
Srineel Jalagani, CFA
Strategist
+1-212-250-2060
Deutsche Bank Securities Inc.
Deutsche Bank does and seeks to do business with companies covered in its research reports. Thus, investors should beaware that the firm may have a conflict of interest that could affect the objectivity of this report. Investors should considerthis report as only a single factor in making their investment decision. DISCLOSURES AND ANALYST CERTIFICATIONSARE LOCATED IN APPENDIX 1.MCI (P) 083/04/2017.
Distributed on: 18/05/2017 07:12:09 GMT
0bed7b6cf11c
18 May 2017
US ETF Compass
Table Of Contents
ETF Monthly Insights ....................................................... 3International markets, particularly Europe, take center stage. ........................ 3US ETPs firmly approach $3.0 trillion mark in April ....................................... 4A closer look at major EM ETF profiles .......................................................... 4Launch Highlights: The ETF Industry ETF (TETF) ............................................ 9House View Portfolio - Adjusting the course ................................................ 14
Asset Allocation Heatmaps ............................................ 15Global Multi Asset Allocator heatmaps ........................................................ 15US Equity Allocator heatmaps ..................................................................... 17International Equity Allocator heatmaps ...................................................... 19Cross Asset Correlations .............................................................................. 2112-Month Relative Performance Monitor ..................................................... 22
Business Intelligence ...................................................... 23New Listing .................................................................................................. 23Delistings ...................................................................................................... 25Trends in products launched in the last 12 months ..................................... 26Popular Product Segments: Smart Beta & Currency Hedged ....................... 27Average Performance by Products Type and Size (Equity) ........................... 28Total Expense Ratio X-Ray ............................................................................ 30
ETF Statistics .................................................................. 31Global ETF Assets and Provider Ranking ..................................................... 31US Historical ETF Trends .............................................................................. 32ETF Issuer and Index Provider league tables ................................................ 33Monthly Snapshot ........................................................................................ 35Top 15 ETFs (includes ETNs) ........................................................................ 41
Appendix A: ETN Snapshot ............................................ 42
Appendix B: ETF List ...................................................... 43
Appendix C: Definitions ................................................. 46ETP Universe Definitions .............................................................................. 46Management Style or Product Strategy Definitions ..................................... 46Product Type Definitions .............................................................................. 47
Page 2 Deutsche Bank Securities Inc.

18 May 2017
US ETF Compass
ETF Monthly InsightsInternational markets, particularly Europe, take centerstage.
April recorded a positive month for risky and safe haven assets, most ofwhich registered favorable performances; meanwhile, Commodity ETPs postedmostly negative returns. Global Equities were up by 1.61% during last month,mainly boosted by Intl DM and EM equities with returns of 2.42% and 1.70%,respectively; similarly, US equities recorded total returns of 1.06%. Fixed Incomeregistered gains of 0.91%, led by EM Gov Debt USD (1.71%) and followed byConvertible with returns of 1.70%. Commodities registered losses of 2.70%,dragged by Energy commodity and Industrial Metals losses of 3.26% and 2.81%,respectively; meanwhile, Precious Metal recorded returns of 0.13%. On thecurrency side, the USD weakened against most major foreign currencies, assuggested by the -1.46% in UUP.
Returns and flows were mostly consistent for Global Equities and Fixed Incomeproducts; meanwhile, Commodity products were somewhat mixed. Flows andperformance were positive for Intl DM ETFs registering inflows of 2.8% of assets;meanwhile, the Eurozone and Europe recorded gains of 4.36% and 3.90% onthe back of strong positive flows, respectively. In the meantime, EM marketsgained 1.7% and received inflows of 2.0% of assets; however, EM Europerecorded outflows of 2.6% of assets despite a gain of 4.76% for the month; while,Frontier Market registered positive performance of 3.53% and inflows of 1.0%.Meanwhile, in the fixed income space, most of the sectors registered positivereturns; on the flow side, US Treasury long-term (13.8% of assets) took the lead,followed by EM Gov Debt USD (6.5%), and EM Gov Debt Local (6.0%). Meanwhile,Intl Inflation registered the largest outflows amounting to 9.5% of their assets.On the other hand, Natural Gas and Crude Oil WTI recorded outflows of 5.4%and 3.6% of their assets; while, Gold posted inflows of 2.6% of their assets andreturns of 1.73%.
Within US equities, performance was mainly positive with moderate inflowsacross most sectors and industries last month, except for Energy and FinancialsETFs which registered losses and outflows. Leading the inflows ranking amongsectors, Utilities and Materials registered inflows of 4.4% and 3.4% of theirassets, respectively; while on the other hand, Financials and Energy experiencedthe largest outflows losing 1.7% and 1.6% of their assets, respectively. Movingonto the industry level, Healthcare Eq. & Supplies, and Aerospace & Defenseexperienced the largest inflows amounting to 12.6% and 6.5% of their assets,respectively; meanwhile, Retail and Metals & Mining registered outflows of 21.9%and 10.8% of their assets, respectively.
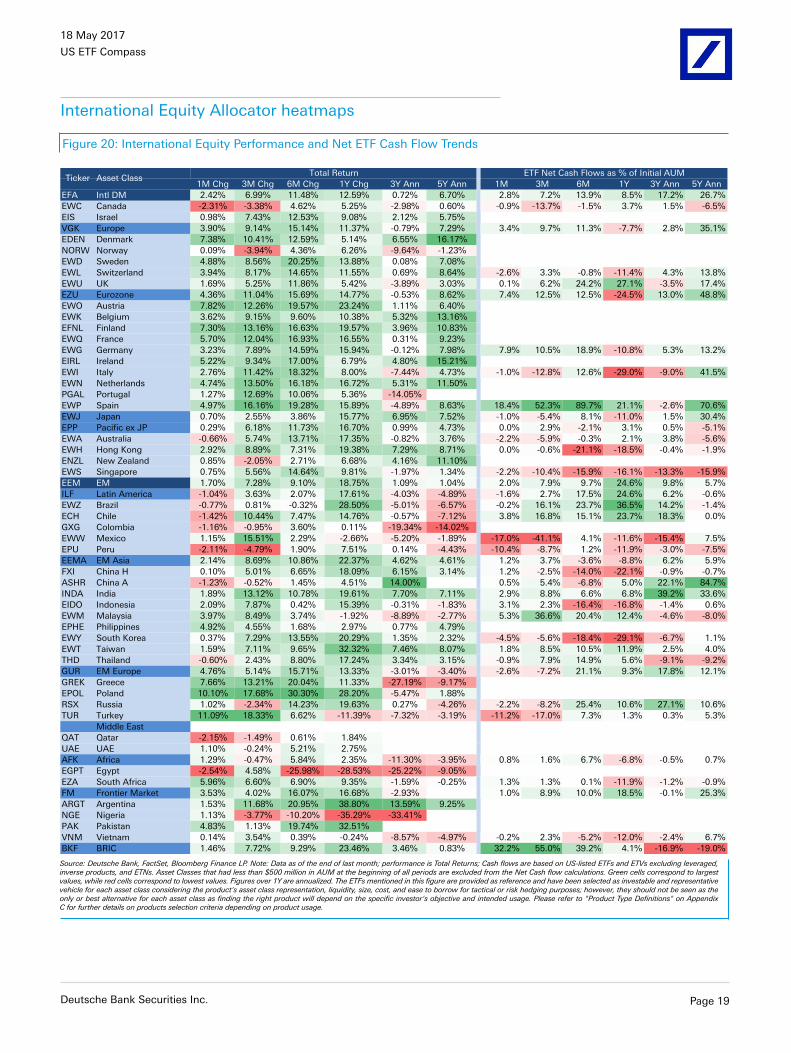
In international equity markets, we saw mixed flows and mainly gains across mostexposures, especially in European countries. The most negative performance wasEgypt (-2.54%), followed by Canada with a loss of 2.31%; while, on the other hand,Turkey registered the top performance (11.09%), followed by Poland (10.1%) andAustria (7.8%). On the flow side, Spain experienced the largest inflows with 18.4%of assets; meanwhile, Mexico saw the largest outflows (17.0% of assets).
Deutsche Bank Securities Inc. Page 3
18 May 2017
US ETF Compass
In terms of correlation trends, EM equities continued to decouple from US equitiesreaching the lowest level of correlation in 6 years.
US ETPs firmly approach $3.0 trillion mark in April
April flows were led by Equity leaving Fixed Income and Commodity ETPs insecond place and third place, respectively. ETPs registered $35.2bn in new cash,helping assets to rise 1.9% from one month earlier, ending with a total of $2.85trillion at the end of April. Equity, Fixed Income, and Commodity attracted inflowsof $23.5bn, $10.7bn, and $0.7bn, respectively.
Among the most relevant inflow trends, we saw US Equities with $10.3bn(53.5% of DM Equity total flows), DM ex-US Equities with $5.7bn, and Eurozone-focused ETPs with almost $1.7bn. Meanwhile, on the fixed income space,Corporates and Broad exposures recorded $3.2bn and $2.0bn in positive flows,respectively. On the outflow side, Japan and Mexico equities registered negativeflows of almost $0.3bn each. Beta, Smart Beta, Active, and Beta+ (leveraged andinverse) products experienced inflows of $28.9bn, $5.6bn, $0.7bn, and $0.1bn,respectively.
Within Equity Smart Beta products, Style and Multi-factor ETFs were the mostpopular categories in April, the first of them adding $2.5bn; while, the secondone received $0.8bn in fresh new cash. Currency Hedged ETFs experienced aweak, albeit positive, month registering only $0.6bn in fresh new cash. The largestnegative flows were experienced by ETFs offering FX hedged exposure to JPY (-$0.22bn); while, FX hedged exposure to Multiple Currencies experienced inflowsof $0.5bn during April. In term of products types, Asset Allocation and CashManagement registered inflows for about $19.3bn each; meanwhile, Leveraged &Inverse experienced inflows of $128mn and Pseudo Futures experienced outflowsof $3.5bn.
Total ETP turnover was $1.31 trillion last month, dropping 22% from the previousmonth. Furthermore, ETF turnover represented 25.2% of all cash equity traded inthe US during April, under its 12-month average of 25.5%.
A closer look at major EM ETF profiles
EM ETFs have received almost $20bn in inflows following the last outflowsepisode right after the US presidential election in last November. Most of theinflows have been driven by allocations into Global regional vehicles as opposedto country-specific funds. Furthermore, we have also seen interesting, albeitsmaller, trends among regions; for example, since the end of 2015 we haveseen consistent outflows from Asia Pacific along with inflows into Latin America,nevertheless this rotation seems to be fading with Asia Pacific ETFs receivingstrong inflows YTD, and Latin America-focused ETFs beginning to show somesigns of flow weakness. However, unlike inflows to Global funds which weredominated by regional exposure, flows within Asia and Latin America-focusedproducts have been dominated by country ETFs such as those tracking China,India, Mexico, and Brazil.
Page 4 Deutsche Bank Securities Inc.

18 May 2017
US ETF Compass
Figure 1: EM ETF flows - Regional vs. Country ETFs
-2,000
-1,000
0
1,000
2,000
3,000
4,000
5,000
6,000
7,000
8,000
-10,000
-5,000
0
5,000
10,000
15,000
20,000
25,000
30,000
35,000
40,000
Dec-1
5
Jan
-16
Feb
-16
Mar-
16
Ap
r-1
6
May-1
6
Ju
n-1
6
Ju
l-1
6
Au
g-1
6
Sep
-16
Oct-
16
No
v-1
6
Dec-1
6
Jan
-17
Feb
-17
Mar-
17
Ap
r-1
7
Cu
m. N
et
Cash
Flo
ws $
MM
Cu
m. N
et
Cash
Flo
ws $
MM
All Regional Country (rhs)
Source: Deutsche Bank, Bloomberg Finance LP. Data as of May 11, 2017
Figure 2: EM ETF Flows by Region (ex Global)
-5,000
-4,000
-3,000
-2,000
-1,000
0
1,000
2,000
3,000
4,000
5,000
Dec-1
5
Jan
-16
Feb
-16
Mar-
16
Ap
r-1
6
May-1
6
Ju
n-1
6
Ju
l-1
6
Au
g-1
6
Sep
-16
Oct-
16
No
v-1
6
Dec-1
6
Jan
-17
Feb
-17
Mar-
17
Ap
r-1
7
Cu
m. N
et
Cash
Flo
ws $
MM
Asia Pacific Middle East & Africa
Latin America Europe
Source: Deutsche Bank, Bloomberg Finance LP. Data as of May 11, 2017
On the performance front, Emerging Markets (EM) haven't completely recoveredfrom the deep sell-off that they experienced right after the November USelections, and are yet to catch up with other equity markets.
Figure 3: Equity market performance since Nov 8th 2016
90
95
100
105
110
115
120
Nov-16 Dec-16 Jan-17 Feb-17 Mar-17 Apr-17 May-17
No
rmalized
Pri
ce L
evels
(1
00
)
Global EM DM US
Source: Deutsche Bank, FactSet. Data as of May 12, 2017. EM (EEM), Global (ACWI), DM (EFA), US (SPY)
Select EM ETF profilesIn the following lines we review the largest seven ETFs by assets offering accessto broad sector-diversified EM markets.
■ VWO: this ETF is the largest one in terms of size with almost $55bn inassets. It is also among the cheapest EM funds charging 14bps. VWO isalso very liquid offering a dollar ADV of close to $500bn, tight spreads,and a deep pool of institutional owners. Such liquidity should make VWOvery apt for long strategic and tactical trades. This product also hassome level of options activity, and competitive borrow, but we would notrecommend this ETF as the main shorting vehicle for the space, unlessspecific financial conditions justify it. From an exposure perspective, VWOoffers access to the broadest sample of EM stocks (over 3,800), evenincluding about a 5% in China A-shares; however this ETF does not includeSouth Korea. Cost of ownership seems favorable to the investor givena positive performance difference; while tracking ability seems not as
Deutsche Bank Securities Inc. Page 5

18 May 2017
US ETF Compass
aligned as the other peers (maybe due to the transition index whichincludes China A-shares). Overall, we see VWO as a good cheap core,tactical long, or back up shorting vehicle; and as an alternative if exposureto EM with China A-Shares or without South Korea is desired.
■ EEM: this is still the second largest EM ETF in terms of size with over$30bn in assets; althought it may soon lose that title to fellow iSharesrange IEMG. However, the title it will not lose is the "most liquid" title,with over $2bn in ADV, razor thin bid/ask spreads, liquid short side, deepinstitutional ownership, and very active options contracts, EEM is by farthe liquidity tool by excellence in the broad EM space. Ideal as a riskhedging tool, and good for tactical long or short trades; but with anexpense ratio of 72bps definitely not a cheap core. Moreover, not sofavorable to the investor from a cost of ownership perspective given itsnegative 1Y avg. performance difference. EEM offers efficient tracking oflarge and mid cap companies in emerging markets including South Korea.Mostly an instrument for liquidity seekers.
■ IEMG: probably one of the fastest growing ETFs in the last five years,and the one with the largest organic growth in the last month. IEMGhas amassed just over $30bn in asssets, along with healthy liquidity,and efficient tracking. More specifically, IEMG trades about $350m onan average daily basis, offering penny-wide spreads. Cost of ownershipis favorable according to a positive 1Y avg. performance difference. Inaddition, consistent with its broad coverage which includes large, mid,and small cap EM companies, this low cost (14bps) ETF is an idealcheap core position for those investors seeking strategic exposure to EMincluding South Korea.
■ EEMV: This ETF offers access to a minimum volatility strategy offeringexposure to EM companies including those in South Korea. EEMV has agood size (~$4bn in assets), and enough liquidity (~$20million in dollarADV) to accommodate long strategic trades of institutional size via thesecondary market or a combination including primary market creation/redemption. This strategy has lagged other peers in terms of performanceover the last year, but as expected it has also generated lower volatilityduring the same period as well. Currently EEMV has an overweight in Asiarelative to its peers. Overall, we see this as a viable candidate for obtainingdefensive exposure in broad EM.
■ SCHE: charging 13bps this is the cheapest vehicle in the EM space.It offers enough liquidity ($21million in dollar ADV) for its size ($3.4bnin assets) and its common usage; which according to ownership, andaverage holding period is most likely strategic buy-and-hold. This cheapcore building block offers exposure to mainly Large and Mid capcompanies in EM excluding South Korea.
■ DEM: this ETF offers unique exposure to high-dividend yieldingcompanies in EM weighted by annual dividends paid. As a consequenceit exhibits the most different exposure mix relative to the other peers.For example, DEM has significant underweights in Asia, and Latam, andoverweight in Europe; furthermore at a country level, it has zero allocationto India, underweight to China, and overweights to Taiwan, and Russia.And from a sector perspective, it has overweights to Energy, Materials,and Telecom, and underweights to Technology,Consumer Discretionary,and Consumer Staples. This product comes with a TER on the high end at
Page 6 Deutsche Bank Securities Inc.

18 May 2017
US ETF Compass
63bps, and the least favorable cost of ownership among the group givena negative 1Y avg. performance difference of 96bps. Mostly suitable if EMexposure with dividend bias is desired.
■ GEM: mostly a buy-and-hold asset allocation product as suggested by it'saverage holding period of over 450 days. GEM provides access to MSCIEM (similar to EEM), but with a tilt resulting from a multi-factor strategyfocusing on Value, Momentum, Quality, and Volatility. With an expenseratio of 45bps. With just enough liquidity for its strategic asset allocationneeds, GEM offers a factor-driven methodology for those investing inMSCI EM.
Figure 4: Select EM ETF profiles - Characteristics and metrics
Ticker VWO EEM IEMG EEMV SCHE DEM GEM
General Characteristics
This ETF in a few words
Cheap Core +
Tactical Long +
China A + No
S.Korea
Most liquid +
Tactical Long or
Short + Options +
S.Korea
Cheap Core +
S.Korea
Min Vol +
S.Korea
Cheap Core +
Large & Mid caps
+ No S.Korea
High Dividend
Yield + Dividend
Paid Weighted
Multi Factor
(Value,
Momentum,
Quality, Volatility)
Issuer Vanguard iShares iShares iShares Charles Schwab WisdomTree GSAM
Index Family FTSE MSCI MSCI MSCI FTSE WisdomTree GSAM
TER 0.14% 0.72% 0.14% 0.25% 0.13% 0.63% 0.45%
AUM $MM 54,900 31,606 30,751 3,839 3,396 1,787 1,314
1M Cash Flow $MM 1,102 73 1,990 - 216 25 207
Liquidity Profile VWO EEM IEMG EEMV SCHE DEM GEM
20D ADV $MM 477.1 2,123.0 350.9 18.6 21.1 9.2 5.5
Implied Liquidity $MM 0 648 103 39 190 24 77
Total Liquidity $MM 477 2,771 454 58 211 33 83
Avg. Holding Period* (days) 118 17 83 146 200 193 468
5D Bid/Ask Spread $ 0.01 0.01 0.01 0.02 0.01 0.03 0.05
5D Bid/Ask Spread bps 2.5 2.4 2.0 3.7 4.4 7.6 14.7
20D Avg. Borrow Rate 0.23% 0.23% 0.23% N/A N/A N/A N/A
Short Int as % Shr. Out 0.9% 12.5% 0.7% 1.1% 0.1% 0.5% 0.3%
Option Not. Volume $MM 2.0 1,179.6 0.3 0.1 - 0.1 -
Option Not. Open Int. $MM 279.4 36,861.9 14.1 4.0 0.1 4.0 -
Tracking Efficiency VWO EEM IEMG EEMV SCHE DEM GEM
Replication Strategy Full Optimized Optimized Full Optimized Optimized Optimized
1Y Avg. Annual Perf. Dif.** 0.78% -0.59% 0.18% -0.06% -0.20% -0.96% -0.33%
1Y Ann. Tracking Error (NAV) 6.98% 0.21% 0.20% 0.18% 1.36% 0.23% 1.27%
NAV Total Return Perf. VWO EEM IEMG EEMV SCHE DEM GEM
YTD 13.9% 16.6% 16.6% 11.7% 14.3% 8.7% 16.5%
1 Month 2.3% 4.7% 4.4% 2.8% 3.0% 1.1% 4.9%
3 Months 5.5% 8.1% 8.0% 6.5% 6.3% 2.9% 7.9%
6 Months 15.0% 18.7% 18.5% 10.9% 16.7% 13.9% 18.4%
1 Year 24.7% 26.4% 26.0% 12.9% 25.7% 24.8% 25.4%
Ann. NAV Volatility VWO EEM IEMG EEMV SCHE DEM GEM
YTD 8.6% 8.8% 8.5% 6.5% 8.8% 9.3% 8.8%
1 Month 9.0% 8.1% 7.7% 5.8% 8.3% 8.9% 7.8%
3 Months 9.1% 9.4% 9.0% 6.6% 9.5% 10.0% 9.5%
6 Months 9.2% 9.5% 9.2% 7.2% 9.4% 9.5% 9.4%
1 Year 12.8% 13.2% 12.8% 10.0% 12.8% 12.6% 13.0%
Ownership VWO EEM IEMG EEMV SCHE DEM GEM
# of Institutional Owners 1047 992 446 273 248 210 40
Institutional 62% 75% 77% 59% 42% 48% 79%
Retail 38% 25% 23% 41% 58% 52% 21%
Top 5 Inst. Investor Types VWO EEM IEMG EEMV SCHE DEM GEM
1 Inv. Adv. (29%) Inv. Adv. (29%) Inv. Adv. (49%) Inv. Adv. (28%) Inv. Adv. (34%) PB/WM (25%) PB/WM (51%)
2 PB/WM (17%) PF (15%) PB/WM (18%) PB/WM (24%) PB/WM (8%) Inv. Adv. (18%) Inv. Adv. (27%)
3 HF (8%) HF (14%) MF (4%) PF (2%) Broker (1%) Broker (2%) Broker (1%)
4 MF (4%) PB/WM (11%) PF (2%) MF (2%) MF (0%) PF (1%)
5 Ins. Co. (1%) Broker (4%) HF (2%) Broker (2%) Ins. Co. (0%) Ins. Co. (1%)
Source: Deutsche Bank, Bloomberg Finance LP, FactSet. Data as of May 12, 2017 or latest available. *Average Holding Period is calculated over a 252-day window. **1Y Avg. Annual PerformanceDifference is calculated over 252 days based on rolling 252-day total returns between the ETF NAV and it's underlying index level.
Deutsche Bank Securities Inc. Page 7

18 May 2017
US ETF Compass
Figure 5: Select EM ETF profiles - Exposure
Exposure by Market Cap VWO EEM IEMG EEMV SCHE DEM GEM
Large Cap 73.3% 88.6% 77.2% 82.8% 85.6% 75.6% 76.3%
Mid Cap 13.4% 10.0% 11.1% 13.8% 11.8% 13.0% 13.2%
Small Cap 10.7% 1.2% 11.5% 3.3% 2.0% 11.3% 1.1%
Exposure by EM Region VWO EEM IEMG EEMV SCHE DEM GEM
Asia 65.5% 71.2% 72.3% 78.2% 63.0% 60.9% 70.0%
Latam 14.8% 13.3% 12.7% 10.8% 16.3% 7.9% 14.7%
Middle East & Africa 9.6% 8.3% 8.0% 6.6% 10.9% 9.2% 7.4%
Europe 7.5% 6.8% 6.5% 4.1% 8.5% 21.9% 7.4%
Exposure by Country VWO EEM IEMG EEMV SCHE DEM GEM
China 26.2% 26.2% 24.9% 20.7% 24.2% 18.7% 25.9%
Taiwan 15.4% 12.2% 12.8% 17.8% 14.5% 26.4% 11.1%
South Korea 15.3% 15.6% 10.2% 3.6% 16.2%
India 11.9% 8.7% 9.4% 6.2% 12.4% 9.4%
Brazil 8.8% 7.7% 7.3% 2.4% 9.5% 5.5% 9.2%
South Africa 7.5% 6.7% 6.5% 1.5% 8.6% 9.2% 6.3%
Russia 3.8% 3.5% 3.2% 0.5% 4.5% 14.8% 4.4%
Thailand 3.6% 2.1% 2.3% 6.6% 3.5% 6.3% 1.5%
Malaysia 3.4% 2.4% 2.6% 7.2% 3.4% 3.5% 1.9%
Mexico 4.0% 3.6% 3.5% 3.4% 4.4% 0.2% 3.3%
Other 15.5% 11.5% 11.9% 23.6% 14.9% 12.0% 10.8%
Exposure by Sectors VWO EEM IEMG EEMV SCHE DEM GEM
Consumer Discretionary 9.5% 10.7% 11.6% 7.4% 8.8% 4.9% 10.8%
Consumer Staples 7.0% 7.0% 7.0% 11.7% 7.2% 1.4% 12.0%
Energy 8.1% 7.1% 6.3% 3.3% 9.2% 13.5% 7.9%
Financials 24.9% 23.9% 22.0% 21.9% 27.7% 22.0% 22.1%
Health Care 3.2% 2.4% 3.2% 7.1% 2.5% 0.5% 3.1%
Industrials 7.5% 5.8% 7.0% 7.4% 6.4% 4.7% 3.2%
Information Technology 16.1% 25.4% 24.3% 19.8% 15.9% 12.9% 22.8%
Materials 8.2% 7.1% 7.5% 2.2% 8.1% 12.6% 6.0%
Real Estate 3.9% 2.5% 3.4% 1.5% 3.3% 3.7% 1.8%
Telecommunication Services 5.4% 5.5% 4.9% 10.5% 6.3% 15.2% 7.3%
Utilities 3.5% 2.7% 2.8% 7.2% 3.4% 8.5% 3.1%
Concentration VWO EEM IEMG EEMV SCHE DEM GEM
Total # of Holdings 3,854 844 1,889 255 851 332 370
Top 1 3.5% 4.4% 3.8% 1.8% 4.7% 4.2% 4.8%
Top 5 10.1% 17.0% 14.8% 7.5% 14.7% 16.2% 18.7%
Top 10 15.1% 23.3% 20.2% 13.8% 20.2% 26.0% 27.0%
Top 10 Holdings VWO EEM IEMG EEMV SCHE DEM GEM
1 700 HK (3.5%) 005930 KS (4.4%) 005930 KS (3.8%) 700 HK (1.8%) 700 HK (4.7%) OGZD LI (4.2%) INDA US (4.8%)
2 2330 TT (2.1%) 700 HK (4.1%) 700 HK (3.6%) 2330 TT (1.6%) TSM US (4.3%) 2317 TT (3.5%) 005930 KS (4.3%)
3 NPN SJ (1.6%) 2330 TT (3.7%) 2330 TT (3.2%) 2412 TT (1.4%) NPN SJ (2.3%) LKOD LI (3.2%) 700 HK (3.8%)
4 939 HK (1.6%) BABA US (2.9%) BABA US (2.6%) 3045 TT (1.4%) 939 HK (2.0%) 939 HK (3.0%) 2330 TT (3.4%)
5 TSM US (1.3%) NPN SJ (1.9%) NPN SJ (1.7%) CHILE CI (1.3%) 941 HK (1.5%) 883 HK (2.3%) BABA US (2.5%)
6 941 HK (1.3%) 939 HK (1.5%) 939 HK (1.3%) IHH MK (1.3%) 2317 TT (1.3%) MTN SJ (2.2%) EPI US (2.2%)
7 1398 HK (1.1%) 941 HK (1.5%) 941 HK (1.3%) 5880 TT (1.3%) 1398 HK (1.2%) 015760 KS (2.1%) INDY US (1.9%)
8 2317 TT (1.0%) 2317 TT (1.2%) 2317 TT (1.0%) PBK MK (1.2%) ITUB US (1.1%) 1398 HK (1.9%) 939 HK (1.6%)
9 3988 HK (0.8%) BIDU US (1.1%) BIDU US (1.0%) 4904 TT (1.2%) HDFC IN (1.0%) 6505 TT (1.8%) 941 HK (1.5%)
10 HDFC IN (0.8%) 1398 HK (1.0%) 1398 HK (0.9%) BBCA IJ (1.2%) 3988 HK (1.0%) 2412 TT (1.8%) NPN SJ (1.2%)
Source: Deutsche Bank, Bloomberg Finance LP, FactSet. Data as of May 12, 2017 or latest available.
Other EM ETFs to keep at handIn addition to the previously featured broad EM ETFs, we also provide a quickreference list of liquid ETFs to access other relevant EM regions and countries.This could be particularly useful for implementing rotation trades.
Page 8 Deutsche Bank Securities Inc.
18 May 2017
US ETF Compass
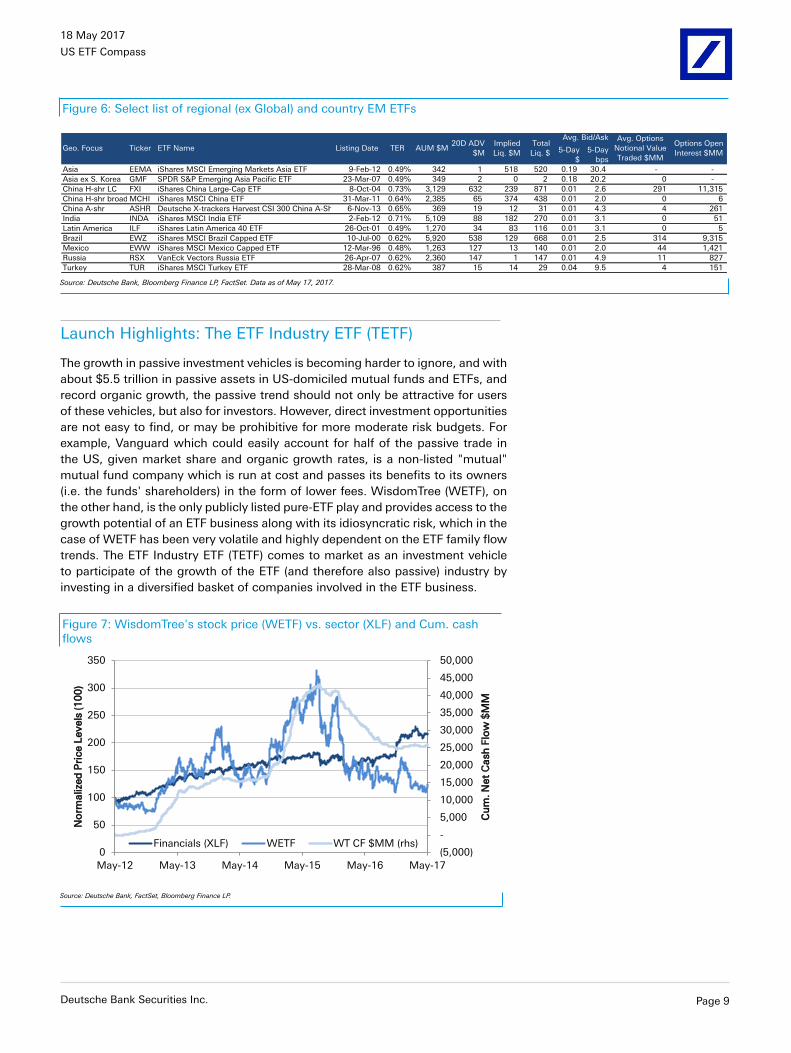
Figure 6: Select list of regional (ex Global) and country EM ETFs
5-Day
$
5-Day
bps
Asia EEMA iShares MSCI Emerging Markets Asia ETF 9-Feb-12 0.49% 342 1 518 520 0.19 30.4 - -
Asia ex S. Korea GMF SPDR S&P Emerging Asia Pacific ETF 23-Mar-07 0.49% 349 2 0 2 0.18 20.2 0 -
China H-shr LC FXI iShares China Large-Cap ETF 8-Oct-04 0.73% 3,129 632 239 871 0.01 2.6 291 11,315
China H-shr broad MCHI iShares MSCI China ETF 31-Mar-11 0.64% 2,385 65 374 438 0.01 2.0 0 6
China A-shr ASHR Deutsche X-trackers Harvest CSI 300 China A-Sh 6-Nov-13 0.65% 369 19 12 31 0.01 4.3 4 261
India INDA iShares MSCI India ETF 2-Feb-12 0.71% 5,109 88 182 270 0.01 3.1 0 51
Latin America ILF iShares Latin America 40 ETF 26-Oct-01 0.49% 1,270 34 83 116 0.01 3.1 0 5
Brazil EWZ iShares MSCI Brazil Capped ETF 10-Jul-00 0.62% 5,920 538 129 668 0.01 2.5 314 9,315
Mexico EWW iShares MSCI Mexico Capped ETF 12-Mar-96 0.48% 1,263 127 13 140 0.01 2.0 44 1,421
Russia RSX VanEck Vectors Russia ETF 26-Apr-07 0.62% 2,360 147 1 147 0.01 4.9 11 827
Turkey TUR iShares MSCI Turkey ETF 28-Mar-08 0.62% 387 15 14 29 0.04 9.5 4 151
TERGeo. Focus Ticker ETF Name Listing DateOptions Open
Interest $MMAUM $M
20D ADV
$M
Implied
Liq. $M
Total
Liq. $
Avg. Bid/Ask
SpreadsAvg. Options
Notional Value
Traded $MM
Source: Deutsche Bank, Bloomberg Finance LP, FactSet. Data as of May 17, 2017.
Launch Highlights: The ETF Industry ETF (TETF)
The growth in passive investment vehicles is becoming harder to ignore, and withabout $5.5 trillion in passive assets in US-domiciled mutual funds and ETFs, andrecord organic growth, the passive trend should not only be attractive for usersof these vehicles, but also for investors. However, direct investment opportunitiesare not easy to find, or may be prohibitive for more moderate risk budgets. Forexample, Vanguard which could easily account for half of the passive trade inthe US, given market share and organic growth rates, is a non-listed "mutual"mutual fund company which is run at cost and passes its benefits to its owners(i.e. the funds' shareholders) in the form of lower fees. WisdomTree (WETF), onthe other hand, is the only publicly listed pure-ETF play and provides access to thegrowth potential of an ETF business along with its idiosyncratic risk, which in thecase of WETF has been very volatile and highly dependent on the ETF family flowtrends. The ETF Industry ETF (TETF) comes to market as an investment vehicleto participate of the growth of the ETF (and therefore also passive) industry byinvesting in a diversified basket of companies involved in the ETF business.
Figure 7: WisdomTree's stock price (WETF) vs. sector (XLF) and Cum. cashflows
(5,000)
-
5,000
10,000
15,000
20,000
25,000
30,000
35,000
40,000
45,000
50,000
0
50
100
150
200
250
300
350
May-12 May-13 May-14 May-15 May-16 May-17
Cu
m. N
et
Cash
Flo
w $
MM
No
rmalize
d P
rice L
evels
(1
00
)
Financials (XLF) WETF WT CF $MM (rhs)
Source: Deutsche Bank, FactSet, Bloomberg Finance LP.
Deutsche Bank Securities Inc. Page 9
18 May 2017
US ETF Compass
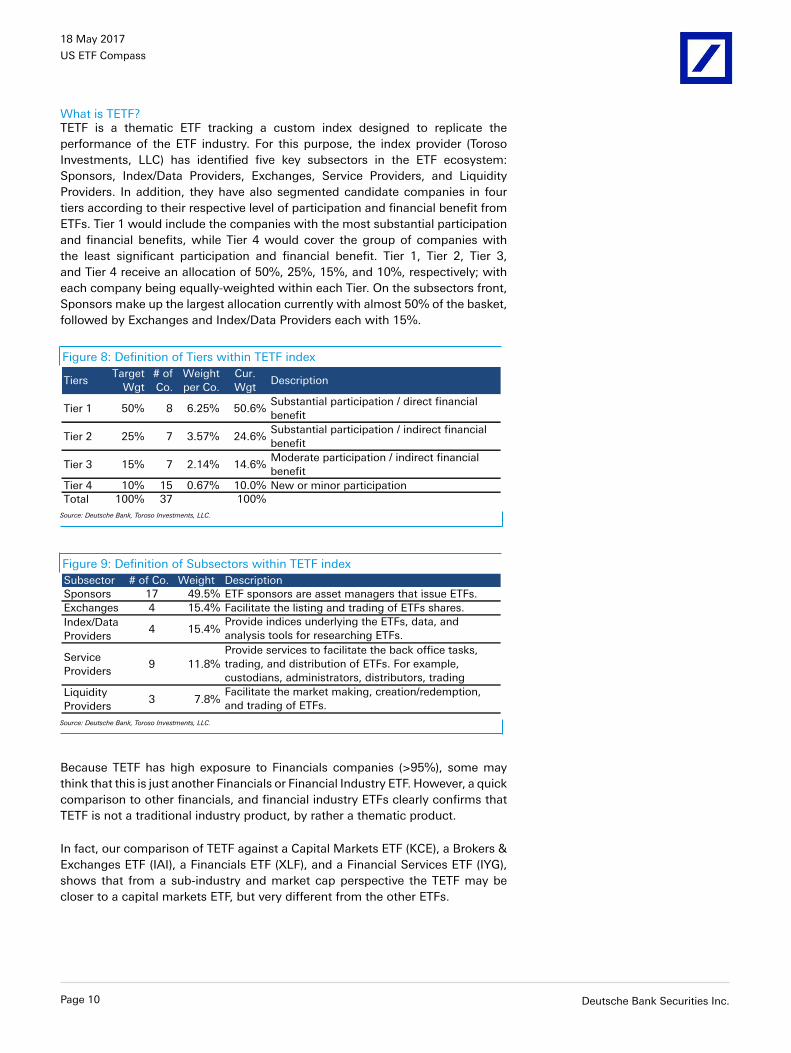
What is TETF?TETF is a thematic ETF tracking a custom index designed to replicate theperformance of the ETF industry. For this purpose, the index provider (TorosoInvestments, LLC) has identified five key subsectors in the ETF ecosystem:Sponsors, Index/Data Providers, Exchanges, Service Providers, and LiquidityProviders. In addition, they have also segmented candidate companies in fourtiers according to their respective level of participation and financial benefit fromETFs. Tier 1 would include the companies with the most substantial participationand financial benefits, while Tier 4 would cover the group of companies withthe least significant participation and financial benefit. Tier 1, Tier 2, Tier 3,and Tier 4 receive an allocation of 50%, 25%, 15%, and 10%, respectively; witheach company being equally-weighted within each Tier. On the subsectors front,Sponsors make up the largest allocation currently with almost 50% of the basket,followed by Exchanges and Index/Data Providers each with 15%.
Figure 8: Definition of Tiers within TETF index
TiersTarget
Wgt
# of
Co.
Weight
per Co.
Cur.
WgtDescription
Tier 1 50% 8 6.25% 50.6%Substantial participation / direct financial
benefit
Tier 2 25% 7 3.57% 24.6%Substantial participation / indirect financial
benefit
Tier 3 15% 7 2.14% 14.6%Moderate participation / indirect financial
benefit
Tier 4 10% 15 0.67% 10.0% New or minor participation
Total 100% 37 100%
Source: Deutsche Bank, Toroso Investments, LLC.
Figure 9: Definition of Subsectors within TETF indexSubsector # of Co. Weight Description
Sponsors 17 49.5% ETF sponsors are asset managers that issue ETFs.
Exchanges 4 15.4% Facilitate the listing and trading of ETFs shares.
Index/Data
Providers4 15.4%
Provide indices underlying the ETFs, data, and
analysis tools for researching ETFs.
Service
Providers9 11.8%
Provide services to facilitate the back office tasks,
trading, and distribution of ETFs. For example,
custodians, administrators, distributors, trading
Liquidity
Providers3 7.8%
Facilitate the market making, creation/redemption,
and trading of ETFs.
Source: Deutsche Bank, Toroso Investments, LLC.
Because TETF has high exposure to Financials companies (>95%), some maythink that this is just another Financials or Financial Industry ETF. However, a quickcomparison to other financials, and financial industry ETFs clearly confirms thatTETF is not a traditional industry product, by rather a thematic product.
In fact, our comparison of TETF against a Capital Markets ETF (KCE), a Brokers &Exchanges ETF (IAI), a Financials ETF (XLF), and a Financial Services ETF (IYG),shows that from a sub-industry and market cap perspective the TETF may becloser to a capital markets ETF, but very different from the other ETFs.
Page 10 Deutsche Bank Securities Inc.

18 May 2017
US ETF Compass
Figure 10: ETF comparisons by sub-industry
0%
10%
20%
30%
40%
50%
60%
70%
80%
90%
100%
TETF KCE IAI XLF IYG
Other
Regional Banks
Data Processing &
Outsourced Serv.
Diversified Banks
Investment Banking &
Brokerage
Financial Exchanges & Data
Source: Deutsche Bank, Bloomberg Finance LP. Data as of May 12, 2017.
Figure 11: ETF comparisons by Market Cap Size
0
20
40
60
80
100
120
140
160
180
0%
10%
20%
30%
40%
50%
60%
70%
80%
90%
100%
TETF KCE IAI XLF IYG
Avg
. W
gtd
. M
kt
Cap
$B
illio
n
Small Cap
Mid Cap
Large Cap
Avg. Wgtd. Mkt Cap (rhs)
Source: Deutsche Bank, Bloomberg Finance LP. Data as of May 12, 2017.
However, further analysis of holdings overlap between TETF and the other ETFsreveal that the differences in terms of allocations to ETF ecosystem subsectors,and Tiers are significant. Thus we confirm the thematic nature of TETF, as it wouldbe unlikely that investors could obtain a similar exposure with another financialssector or industry ETF.
Figure 12: Analysis of holdings overlap between TETF and Financials sector & industry ETFs
TETF Sponsor Index/Data Exchange Liquidity Service Total
Tier 1 31.5% 12.7% 6.4% 0.0% 0.0% 50.6%
Tier 2 7.0% 0.0% 6.9% 7.1% 3.6% 24.6%
Tier 3 6.2% 2.1% 2.1% 0.0% 4.2% 14.6%
Tier 4 4.7% 0.6% 0.0% 0.7% 4.0% 10.0%
Total 49.5% 15.4% 15.4% 7.8% 11.8% 99.8%
KCE Sponsor Index/Data Exchange Liquidity Service Total IYG Sponsor Index/Data Exchange Liquidity Service Total
Tier 1 11.0% 4.5% 2.3% 0.0% 0.0% 17.7% Tier 1 5.3% 1.7% 0.3% 0.0% 0.0% 7.3%
Tier 2 0.0% 0.0% 4.1% 2.9% 2.1% 9.2% Tier 2 11.9% 0.0% 1.6% 0.0% 0.3% 13.8%
Tier 3 5.9% 1.9% 2.0% 0.0% 2.1% 12.0% Tier 3 1.5% 0.2% 1.5% 0.0% 5.0% 8.3%
Tier 4 10.9% 0.9% 0.0% 2.1% 6.3% 20.2% Tier 4 4.3% 0.0% 0.0% 0.3% 9.7% 14.3%
Total 27.8% 7.4% 8.4% 5.0% 10.5% 59.1% Total 23.0% 1.9% 3.5% 0.3% 15.0% 43.6%
IAI Sponsor Index/Data Exchange Liquidity Service Total XLF Sponsor Index/Data Exchange Liquidity Service Total
Tier 1 8.6% 0.0% 4.2% 0.0% 0.0% 12.8% Tier 1 4.8% 1.2% 0.3% 0.0% 0.0% 6.3%
Tier 2 0.0% 0.0% 11.5% 3.5% 0.0% 15.0% Tier 2 10.7% 0.0% 1.5% 0.0% 0.0% 12.2%
Tier 3 0.0% 0.0% 7.8% 0.0% 0.0% 7.8% Tier 3 1.4% 0.0% 1.4% 0.0% 4.5% 7.2%
Tier 4 10.3% 0.0% 0.0% 3.9% 18.0% 32.1% Tier 4 4.0% 0.0% 0.0% 0.0% 8.4% 12.4%
Total 18.8% 0.0% 23.5% 7.4% 18.0% 67.7% Total 20.9% 1.2% 3.1% 0.0% 12.9% 38.1%
Source: Deutsche Bank, Bloomberg Finance LP. Data as of May 12, 2017
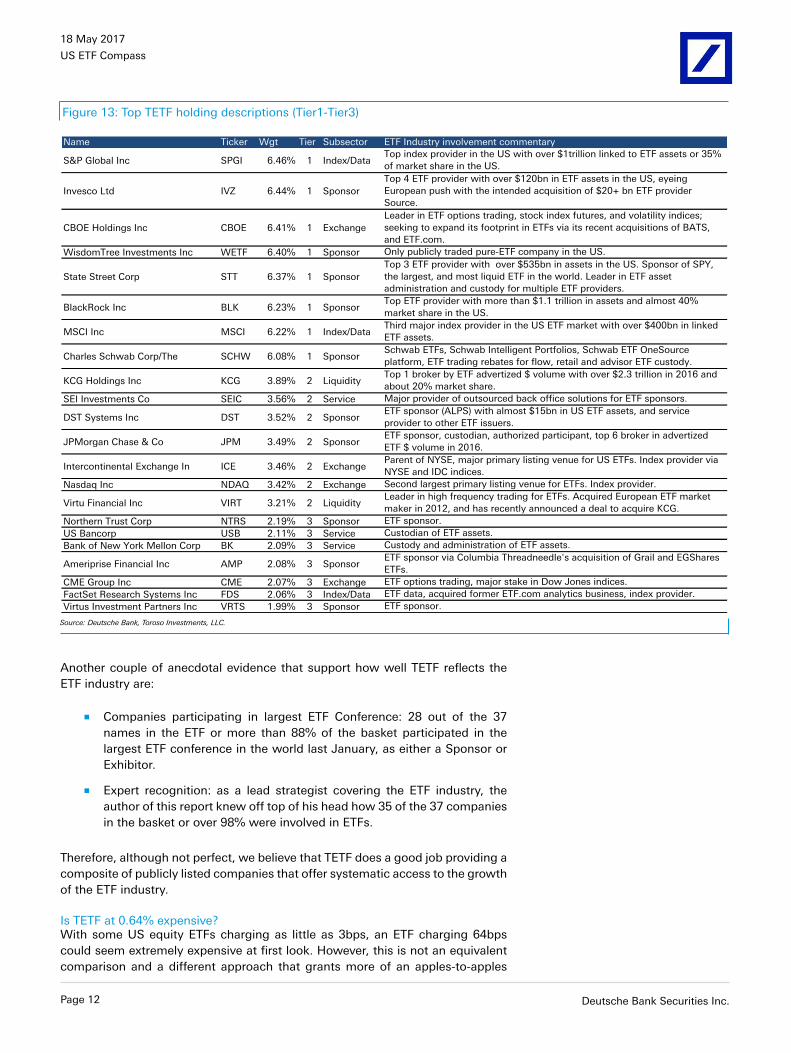
How well does it represent the ETF industry?Top holdings in TETF include some of the leaders in the ETF industry from amongETF Sponsors, index providers, and Exchanges. Furthermore, companies in thetop 3 tiers have clear organized ETF efforts which we discuss in detail in the nextfigure.
Deutsche Bank Securities Inc. Page 11
18 May 2017
US ETF Compass
Figure 13: Top TETF holding descriptions (Tier1-Tier3)
Name Ticker Wgt Tier Subsector ETF Industry involvement commentary
S&P Global Inc SPGI 6.46% 1 Index/DataTop index provider in the US with over $1trillion linked to ETF assets or 35%
of market share in the US.
Invesco Ltd IVZ 6.44% 1 Sponsor
Top 4 ETF provider with over $120bn in ETF assets in the US, eyeing
European push with the intended acquisition of $20+ bn ETF provider
Source.
CBOE Holdings Inc CBOE 6.41% 1 Exchange
Leader in ETF options trading, stock index futures, and volatility indices;
seeking to expand its footprint in ETFs via its recent acquisitions of BATS,
and ETF.com.
WisdomTree Investments Inc WETF 6.40% 1 Sponsor Only publicly traded pure-ETF company in the US.
State Street Corp STT 6.37% 1 Sponsor
Top 3 ETF provider with over $535bn in assets in the US. Sponsor of SPY,
the largest, and most liquid ETF in the world. Leader in ETF asset
administration and custody for multiple ETF providers.
BlackRock Inc BLK 6.23% 1 SponsorTop ETF provider with more than $1.1 trillion in assets and almost 40%
market share in the US.
MSCI Inc MSCI 6.22% 1 Index/DataThird major index provider in the US ETF market with over $400bn in linked
ETF assets.
Charles Schwab Corp/The SCHW 6.08% 1 SponsorSchwab ETFs, Schwab Intelligent Portfolios, Schwab ETF OneSource
platform, ETF trading rebates for flow, retail and advisor ETF custody.
KCG Holdings Inc KCG 3.89% 2 LiquidityTop 1 broker by ETF advertized $ volume with over $2.3 trillion in 2016 and
about 20% market share.
SEI Investments Co SEIC 3.56% 2 Service Major provider of outsourced back office solutions for ETF sponsors.
DST Systems Inc DST 3.52% 2 SponsorETF sponsor (ALPS) with almost $15bn in US ETF assets, and service
provider to other ETF issuers.
JPMorgan Chase & Co JPM 3.49% 2 SponsorETF sponsor, custodian, authorized participant, top 6 broker in advertized
ETF $ volume in 2016.
Intercontinental Exchange In ICE 3.46% 2 ExchangeParent of NYSE, major primary listing venue for US ETFs. Index provider via
NYSE and IDC indices.
Nasdaq Inc NDAQ 3.42% 2 Exchange Second largest primary listing venue for ETFs. Index provider.
Virtu Financial Inc VIRT 3.21% 2 LiquidityLeader in high frequency trading for ETFs. Acquired European ETF market
maker in 2012, and has recently announced a deal to acquire KCG.
Northern Trust Corp NTRS 2.19% 3 Sponsor ETF sponsor.
US Bancorp USB 2.11% 3 Service Custodian of ETF assets.
Bank of New York Mellon Corp BK 2.09% 3 Service Custody and administration of ETF assets.
Ameriprise Financial Inc AMP 2.08% 3 SponsorETF sponsor via Columbia Threadneedle's acquisition of Grail and EGShares
ETFs.
CME Group Inc CME 2.07% 3 Exchange ETF options trading, major stake in Dow Jones indices.
FactSet Research Systems Inc FDS 2.06% 3 Index/Data ETF data, acquired former ETF.com analytics business, index provider.
Virtus Investment Partners Inc VRTS 1.99% 3 Sponsor ETF sponsor.
Source: Deutsche Bank, Toroso Investments, LLC.
Another couple of anecdotal evidence that support how well TETF reflects theETF industry are:
■ Companies participating in largest ETF Conference: 28 out of the 37names in the ETF or more than 88% of the basket participated in thelargest ETF conference in the world last January, as either a Sponsor orExhibitor.
■ Expert recognition: as a lead strategist covering the ETF industry, theauthor of this report knew off top of his head how 35 of the 37 companiesin the basket or over 98% were involved in ETFs.
Therefore, although not perfect, we believe that TETF does a good job providing acomposite of publicly listed companies that offer systematic access to the growthof the ETF industry.
Is TETF at 0.64% expensive?With some US equity ETFs charging as little as 3bps, an ETF charging 64bpscould seem extremely expensive at first look. However, this is not an equivalentcomparison and a different approach that grants more of an apples-to-apples
Page 12 Deutsche Bank Securities Inc.

18 May 2017
US ETF Compass
comparison is required. As we have mentioned, TETF is a thematic ETF, not justa US equity or sector or industry ETF.
In fact, compared to other US Equity Thematic ETFs, TETF is priced just 1bpsabove average. While compared to other industry ETFs, TETF is priced aboveaverage, or closer to the costlier smart beta industry ETF families. However,comparing TETF against industry ETFs would be a mistake due to the fact thatindustry ETFs usually employ standard sector/industry classifications as opposedto custom ones as it is the case for Thematic ETFs. In conclusion, our opinion isthat TETF is neither cheap nor expensive, but rather just about average when itcomes to cost.
Figure 14: TETF cost comparisons
0.00%
0.10%
0.20%
0.30%
0.40%
0.50%
0.60%
0.70%
TE
TF
Th
em
ati
c E
TFs
All In
du
str
y E
TFs
Sta
te S
treet
GA
iSh
are
s
Fir
st
Tru
st
Po
werS
hare
s
Van
Eck
Aggregates Industry ETFs per Issuer
To
tal E
xp
en
se R
ati
o Average TER
Source: Deutsche Bank, Bloomberg Finance LP, Issuer websites. Thematic ETFs exclude ESG funds
Deutsche Bank Securities Inc. Page 13
18 May 2017
US ETF Compass
House View Portfolio - Adjusting the course
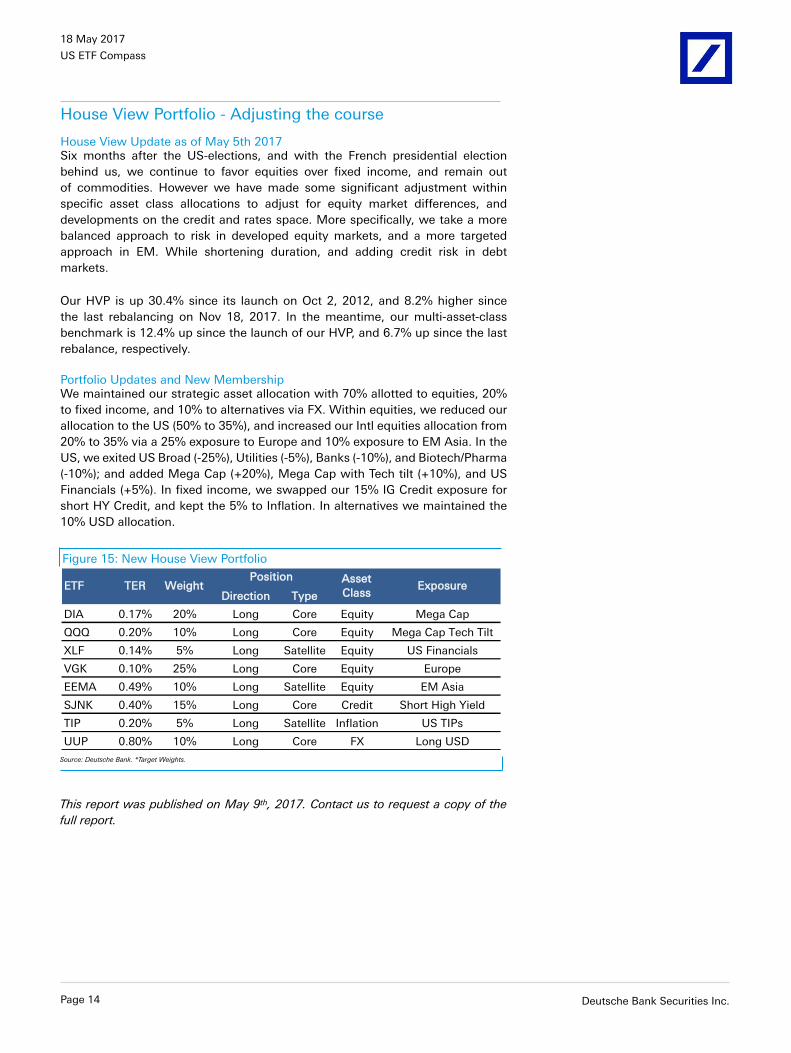
House View Update as of May 5th 2017Six months after the US-elections, and with the French presidential electionbehind us, we continue to favor equities over fixed income, and remain outof commodities. However we have made some significant adjustment withinspecific asset class allocations to adjust for equity market differences, anddevelopments on the credit and rates space. More specifically, we take a morebalanced approach to risk in developed equity markets, and a more targetedapproach in EM. While shortening duration, and adding credit risk in debtmarkets.
Our HVP is up 30.4% since its launch on Oct 2, 2012, and 8.2% higher sincethe last rebalancing on Nov 18, 2017. In the meantime, our multi-asset-classbenchmark is 12.4% up since the launch of our HVP, and 6.7% up since the lastrebalance, respectively.
Portfolio Updates and New MembershipWe maintained our strategic asset allocation with 70% allotted to equities, 20%to fixed income, and 10% to alternatives via FX. Within equities, we reduced ourallocation to the US (50% to 35%), and increased our Intl equities allocation from20% to 35% via a 25% exposure to Europe and 10% exposure to EM Asia. In theUS, we exited US Broad (-25%), Utilities (-5%), Banks (-10%), and Biotech/Pharma(-10%); and added Mega Cap (+20%), Mega Cap with Tech tilt (+10%), and USFinancials (+5%). In fixed income, we swapped our 15% IG Credit exposure forshort HY Credit, and kept the 5% to Inflation. In alternatives we maintained the10% USD allocation.
Figure 15: New House View Portfolio
Direction Type
DIA 0.17% 20% Long Core Equity Mega Cap
QQQ 0.20% 10% Long Core Equity Mega Cap Tech Tilt
XLF 0.14% 5% Long Satellite Equity US Financials
VGK 0.10% 25% Long Core Equity Europe
EEMA 0.49% 10% Long Satellite Equity EM Asia
SJNK 0.40% 15% Long Core Credit Short High Yield
TIP 0.20% 5% Long Satellite Inflation US TIPs
UUP 0.80% 10% Long Core FX Long USD
WeightPosition Asset
ClassExposure
Source: Deutsche Bank. *Target Weights.
This report was published on May 9th, 2017. Contact us to request a copy of thefull report.
Page 14 Deutsche Bank Securities Inc.

18 May 2017
US ETF Compass
Asset Allocation HeatmapsGlobal Multi Asset Allocator heatmaps
Figure 16: Global Multi Asset Performance and Net Cash flow Trends
1M Chg 3M Chg 6M Chg 1Y Chg 3Y Ann 5Y Ann 1M 3M 6M 1Y 3Y Ann 5Y Ann
ACWI Global Equities 1.61% 5.57% 11.92% 15.71% 5.40% 9.07% 1.1% 4.4% 12.6% 17.8% 13.6% 16.3%
VTI US Total Market 1.06% 4.86% 13.81% 18.56% 10.05% 13.53% 0.6% 3.4% 12.5% 18.4% 12.9% 16.0%
SPY S&P 500 (Large Cap) 0.99% 5.09% 13.16% 17.78% 10.36% 13.54% 0.7% 3.7% 13.3% 18.2% 11.6% 13.5%
MDY S&P 400 (Mid Cap) 0.78% 2.93% 15.33% 20.06% 9.87% 13.23% -0.1% 2.6% 12.7% 20.1% 14.5% 17.1%
IWM Russell 2000 (SM Cap) 1.15% 3.13% 18.18% 25.53% 9.05% 13.01% 1.0% 3.1% 22.2% 32.7% 15.4% 18.2%
EFA Intl DM 2.42% 6.99% 11.48% 12.59% 0.72% 6.70% 2.8% 7.2% 13.9% 8.5% 17.2% 26.7%
VGK Europe 3.90% 9.14% 15.14% 11.37% -0.79% 7.29% 3.4% 9.7% 11.3% -7.7% 2.8% 35.1%
EZU Eurozone 4.36% 11.04% 15.69% 14.77% -0.53% 8.62% 7.4% 12.5% 12.5% -24.5% 13.0% 48.8%
EWJ Japan 0.70% 2.55% 3.86% 15.77% 6.95% 7.52% -1.0% -5.4% 8.1% -11.0% 1.5% 30.4%
EPP Pacific ex JP 0.29% 6.18% 11.73% 16.70% 0.99% 4.73% 0.0% 2.9% -2.1% 3.1% 0.5% -5.1%
EEM EM 1.70% 7.28% 9.10% 18.75% 1.09% 1.04% 2.0% 7.9% 9.7% 24.6% 9.8% 5.7%
ILF Latin America -1.04% 3.63% 2.07% 17.61% -4.03% -4.89% -1.6% 2.7% 17.5% 24.6% 6.2% -0.6%
EEMA EM Asia 2.14% 8.69% 10.86% 22.37% 4.62% 4.61% 1.2% 3.7% -3.6% -8.8% 6.2% 5.9%
GUR EM Europe 4.76% 5.14% 15.71% 13.33% -3.01% -3.40% -2.6% -7.2% 21.1% 9.3% 17.8% 12.1%
AFK Africa 1.29% -0.47% 5.84% 2.35% -11.30% -3.95% 0.8% 1.6% 6.7% -6.8% -0.5% 0.7%
FM Frontier Market 3.53% 4.02% 16.07% 16.68% -2.93% 1.0% 8.9% 10.0% 18.5% -0.1% 25.3%
BKF BRIC 1.46% 7.72% 9.29% 23.46% 3.46% 0.83% 32.2% 55.0% 39.2% 4.1% -16.9% -19.0%
AGG Fixed Income (Broad) 0.91% 1.50% -0.64% 0.85% 2.64% 2.23% 2.2% 7.0% 12.3% 25.0% 23.4% 18.9%
GOVT US Treasury 0.72% 1.09% -1.57% -0.66% 1.98% 1.39% 3.6% 7.4% 10.6% 7.0% 26.0% 14.5%
SHV Very Short 0.00% 0.06% 0.12% 0.32% 0.17% 0.12% -4.3% 3.9% 27.6% 20.1% 25.9% 13.9%
SHY Short 0.19% 0.29% -0.01% 0.28% 0.62% 0.50% 0.6% 2.8% 10.6% 17.2% 18.1% 6.4%
IEI Intermediate 0.66% 1.03% -0.86% -0.23% 2.04% 1.34% 4.0% 7.5% 3.3% 3.7% 28.2% 18.2%
TLT Long 1.57% 2.51% -5.58% -3.12% 5.96% 3.58% 13.8% 20.3% 4.0% -20.5% 21.3% 17.6%
TIP US Inflation 0.45% 0.86% -0.38% 1.70% 1.61% 0.57% 0.2% 6.0% 20.5% 35.4% 22.0% 6.6%
MUB Municipal 0.54% 1.40% -0.83% -0.41% 2.84% 2.51% 2.4% 3.6% 9.7% 26.1% 28.8% 20.7%
MBB Securitized 0.63% 1.11% -0.81% 0.36% 2.40% 1.78% 1.7% 9.1% 16.3% 41.0% 35.0% 23.8%
LQD IG Corporates 1.19% 2.22% -0.04% 2.13% 3.63% 4.01% 2.1% 9.8% 12.8% 26.2% 21.3% 19.7%
HYG HY Corporates 0.82% 2.21% 5.06% 10.76% 3.18% 5.20% 2.1% 1.2% 14.6% 11.0% 10.4% 10.6%
FLOT Corp. Floater 0.09% 0.47% 0.83% 1.81% 0.81% 1.10% 4.1% 26.0% 69.9% 78.2% 18.0%
BKLN Senior Loans 0.36% 0.76% 2.25% 5.19% 2.13% 3.22% 4.6% 11.5% 51.3% 129.1% 16.5%
PFF Preferred 1.30% 3.93% 3.19% 5.34% 5.53% 6.26% 2.4% 4.8% 2.3% 24.1% 27.9% 19.1%
CWB Convertible 1.70% 4.68% 9.58% 17.41% 6.75% 10.37% 1.8% 14.7% 18.5% 55.5% 12.8% 31.8%
BWX Intl DM Debt 1.43% 2.50% -2.21% -4.51% -2.92% -1.22% 6.3% -4.7% -9.6% 12.1% -1.6% 7.8%
WIP Intl Inflation 0.95% 3.85% 1.42% 2.05% -1.81% 0.08% -9.5% -14.6% -25.1% -33.3% -19.2% -13.5%
EMB EM Gov Debt USD 1.71% 3.95% 2.69% 8.19% 5.67% 4.84% 6.5% 21.6% 10.4% 57.4% 34.5% 20.5%
EMLC EM Gov Debt Local 1.30% 5.19% 2.13% 3.71% -2.63% -1.82% 6.0% 18.6% 21.4% 69.5% 18.1% 13.8%
EMCB EM Corp USD 0.93% 3.43% 3.36% 9.34% 3.23% 3.85% 2.4% 1.5% 8.8% 31.8% 4.7%
HYEM EM HY Corp USD 1.49% 3.07% 5.06% 13.55% 5.54%
DBC Commodities -2.70% -6.03% -1.07% 1.51% -17.55% -12.23% 1.4% 3.7% -8.1% 5.1% 5.7% -2.4%
DBE Energy Cmdty -3.26% -7.31% -0.41% 3.40% -25.58% -16.44% -3.4% 2.6% -8.8% -21.1% 49.0% 13.1%
USO Crude Oil WTI -3.76% -9.54% -2.75% -9.38% -34.43% -23.73% -3.6% 3.7% -5.7% -21.0% 74.9% 19.2%
UNG Natural Gas 0.00% -3.69% -6.31% 9.24% -34.18% -14.34% -5.4% 0.1% -22.3% -37.0% 14.5% -8.7%
DBA Agriculture -0.20% -3.24% -3.80% -6.36% -12.31% -6.27% -0.9% -4.1% -5.9% 10.0% -7.4% -7.5%
DBB Industrial Metals -2.81% -2.51% 10.49% 20.17% -0.17% -4.62%
DBP Precious Metals 0.13% 2.89% -2.31% -4.37% -2.66% -7.95% 2.2% 5.1% -8.5% 7.4% 3.9% -3.5%
GLD Gold Physical 1.73% 4.52% -0.96% -2.33% -0.93% -5.69% 2.6% 6.1% -8.8% 8.2% 4.6% -4.4%
SLV Silver Physical -5.51% -1.98% -3.95% -4.00% -4.06% -11.55% 0.0% -1.6% -7.8% 0.5% 1.2% 1.9%
PPLT Platinum Physical -0.22% -5.01% -3.56% -12.48% -13.24% -10.11% 0.9% 7.3% 6.6% 11.5% 1.6% 3.0%
PALL Palladium Physical 3.58% 9.58% 33.22% 31.62% 0.09% 3.27% 2.2% 2.3% -13.5% -18.9% -21.6% -20.6%
UUP Bull USD -1.46% -0.62% 0.59% 6.10% 6.31% 3.23% -2.5% -9.0% -17.4% -14.4% 0.7% -9.5%
FXY JPYUSD -0.15% 1.15% -6.13% -4.99% -3.27% -6.85%
FXE EURUSD 2.04% 0.68% -1.15% -5.65% -8.32% -4.34%
Ticker Asset ClassTotal Return ETF Net Cash Flows as % of Initial AUM
Source: Deutsche Bank, FactSet, Bloomberg Finance LP. Note: Data as of the end of last month; performance is Total Returns; Cash flows are based on US-listed ETFs and ETVs excluding leveraged,inverse products, and ETNs. Asset Classes that had less than $500 million in AUM at the beginning of all periods are excluded from the Net Cash flow calculations. Green cells correspond to largestvalues, while red cells correspond to lowest values. Figures over 1Y are annualized. The ETFs mentioned in this figure are provided as reference and have been selected as investable and representativevehicle for each asset class considering the product's asset class representation, liquidity, size, cost, and ease to borrow for tactical or risk hedging purposes; however, they should not be seen as theonly or best alternative for each asset class as finding the right product will depend on the specific investor's objective and intended usage. Please refer to "Product Type Definitions" on AppendixC for further details on products selection criteria depending on product usage.
Deutsche Bank Securities Inc. Page 15

18 May 2017
US ETF Compass
Figure 17: Global Multi Asset Risk and Risk-adjusted Performance Measures
1M 3M 6M 1Y 3Y 5Y 1Y 3Y 5Y 1Y 3Y 5Y
ACWI Global Equities 8.3% 7.1% 7.9% 11.5% 13.7% 13.4% -7.1% -19.4% -19.4% 1.4 0.4 0.7
VTI US Total Market 7.7% 7.4% 8.1% 10.2% 13.1% 12.8% -5.9% -15.1% -15.1% 1.8 0.8 1.1
SPY S&P 500 (Large Cap) 7.5% 7.1% 7.8% 9.8% 13.0% 12.6% -5.5% -13.0% -13.0% 1.8 0.8 1.1
MDY S&P 400 (Mid Cap) 12.0% 11.0% 11.5% 13.1% 14.3% 14.4% -7.1% -19.3% -19.3% 1.5 0.7 0.9
IWM Russell 2000 (SM Cap) 14.2% 13.6% 14.8% 15.5% 16.6% 16.2% -8.3% -25.7% -25.7% 1.6 0.5 0.8
EFA Intl DM 11.3% 8.7% 9.2% 15.0% 15.6% 15.4% -10.3% -23.1% -23.1% 0.8 0.0 0.4
VGK Europe 15.1% 10.7% 10.9% 18.3% 17.4% 17.2% -13.6% -24.9% -24.9% 0.6 (0.0) 0.4
EZU Eurozone 20.5% 14.2% 13.4% 19.8% 19.1% 19.4% -13.4% -27.1% -27.1% 0.7 (0.0) 0.4
EWJ Japan 8.3% 8.0% 10.0% 13.0% 16.7% 17.3% -5.3% -21.6% -21.6% 1.2 0.4 0.4
EPP Pacific ex JP 9.3% 10.8% 11.2% 14.6% 17.5% 17.0% -7.2% -30.4% -30.4% 1.1 0.1 0.3
EEM EM 10.9% 12.6% 15.7% 18.1% 19.4% 19.1% -10.2% -36.1% -36.1% 1.0 0.1 0.1
ILF Latin America 19.9% 22.8% 26.3% 27.1% 28.1% 25.1% -15.4% -56.1% -56.8% 0.7 (0.1) (0.2)
EEMA EM Asia 9.8% 10.1% 13.1% 16.1% 18.3% 18.1% -10.5% -31.5% -31.5% 1.4 0.3 0.3
GUR EM Europe 19.5% 17.4% 16.8% 20.5% 24.8% 23.8% -11.9% -48.9% -52.3% 0.6 (0.1) (0.1)
Middle East
AFK Africa 13.4% 16.3% 19.3% 22.4% 20.2% 18.4% -12.5% -54.0% -54.0% 0.1 (0.6) (0.2)
FM Frontier Market 8.9% 10.2% 11.8% 13.1% 14.6% -7.3% -36.6% 1.3 (0.2)
BKF BRIC 12.2% 13.4% 15.5% 17.3% 21.3% 20.5% -11.0% -39.4% -39.4% 1.4 0.2 0.0
AGG Fixed Income (Broad) 3.2% 3.3% 3.7% 3.3% 3.3% 3.2% -4.5% -4.5% -5.1% 0.3 0.8 0.7
GOVT US Treasury 3.4% 3.4% 3.9% 3.8% 3.8% 3.6% -5.9% -5.9% -5.9% (0.2) 0.5 0.4
SHV Very Short 0.3% 0.3% 0.3% 0.3% 0.2% 0.2% -0.1% -0.1% -0.1% 1.1 0.8 0.7
SHY Short 1.1% 1.0% 1.0% 0.9% 0.9% 0.8% -1.0% -1.0% -1.0% 0.3 0.7 0.6
IEI Intermediate 3.0% 3.0% 3.2% 3.1% 3.1% 3.0% -4.3% -4.3% -4.3% (0.1) 0.6 0.5
TLT Long 10.1% 10.3% 12.6% 12.4% 13.3% 13.1% -17.9% -17.9% -20.5% (0.3) 0.4 0.3
TIP US Inflation 3.2% 3.9% 4.2% 4.2% 4.9% 5.0% -4.6% -5.3% -11.1% 0.4 0.3 0.1
MUB Municipal 2.1% 2.3% 3.7% 3.3% 2.9% 3.9% -6.7% -6.7% -9.7% (0.1) 1.0 0.6
MBB Securitized 3.0% 3.5% 3.6% 2.7% 2.6% 2.7% -3.4% -3.4% -4.8% 0.1 0.9 0.7
LQD IG Corporates 4.5% 4.6% 5.3% 5.0% 5.2% 5.2% -5.9% -6.0% -8.6% 0.4 0.7 0.8
HYG HY Corporates 2.8% 4.9% 6.1% 6.6% 7.0% 6.6% -4.1% -13.4% -13.4% 1.6 0.5 0.8
FLOT Floater 0.8% 0.6% 0.8% 0.8% 0.8% 0.9% -0.2% -0.6% -0.6% 2.3 1.0 1.2
BKLN Senior Loans 1.7% 2.1% 2.1% 2.4% 3.3% 3.1% -1.4% -7.1% -7.1% 2.1 0.6 1.0
PFF Preferred 3.9% 4.4% 7.0% 6.1% 5.5% 5.4% -7.5% -7.5% -8.7% 0.9 1.0 1.2
CWB Convertible 5.6% 5.4% 7.2% 8.1% 9.7% 9.2% -4.4% -15.9% -15.9% 2.1 0.7 1.1
BWX Intl DM Debt 5.4% 6.8% 8.5% 8.0% 7.6% 7.3% -12.7% -15.4% -15.4% (0.6) (0.4) (0.2)
WIP Intl Inflation 6.3% 7.5% 8.5% 8.5% 8.0% 7.5% -10.1% -19.1% -19.1% 0.2 (0.2) 0.0
EMB EM Gov Debt USD 3.2% 4.9% 8.2% 7.2% 6.7% 7.1% -7.6% -7.6% -14.5% 1.1 0.8 0.7
EMLC EM Gov Debt Local 6.2% 8.0% 12.0% 11.9% 10.5% 10.1% -9.9% -27.6% -32.0% 0.3 (0.2) (0.2)
EMCB EM Corp USD 7.1% 5.5% 8.9% 8.2% 8.0% 7.4% -4.6% -13.3% -13.3% 1.1 0.4 0.5
HYEM EM HY Corp USD 4.1% 4.3% 6.3% 5.7% 6.8% -4.8% -14.0% 2.4 0.8
DBC Commodities 10.1% 10.4% 13.2% 15.0% 16.2% 14.8% -10.1% -55.9% -60.0% 0.1 (1.1) (0.8)
DBE Energy Cmdty 16.6% 15.2% 20.8% 24.5% 28.0% 24.1% -15.7% -71.4% -71.4% 0.1 (0.9) (0.7)
USO Crude Oil WTI 21.0% 21.5% 28.5% 31.8% 37.3% 31.9% -24.9% -79.8% -80.2% (0.3) (0.9) (0.7)
UNG Natural Gas 26.9% 33.1% 43.2% 40.5% 39.9% 39.4% -32.2% -78.3% -79.1% 0.2 (0.9) (0.4)
DBA Agriculture 11.2% 8.8% 9.3% 10.9% 11.3% 11.2% -16.4% -34.4% -37.6% (0.6) (1.1) (0.6)
DBB Industrial Metals 19.1% 17.4% 19.4% 17.0% 17.5% 17.0% -8.4% -39.0% -45.7% 1.2 (0.0) (0.3)
DBP Precious Metals 10.0% 10.4% 12.7% 14.7% 16.1% 17.8% -19.6% -26.3% -48.7% (0.3) (0.2) (0.4)
GLD Gold Physical 9.4% 9.5% 11.7% 13.4% 14.7% 16.2% -17.8% -22.0% -42.1% (0.2) (0.1) (0.4)
SLV Silver Physical 13.0% 16.0% 20.1% 22.4% 23.0% 25.2% -23.9% -36.5% -61.5% (0.2) (0.2) (0.5)
PPLT Platinum Physical 16.2% 15.3% 19.3% 20.2% 19.6% 19.3% -24.4% -46.2% -53.6% (0.6) (0.7) (0.5)
PALL Palladium Physical 20.1% 19.8% 26.1% 26.2% 26.9% 25.6% -15.6% -48.4% -48.4% 1.2 0.0 0.1
UUP Bull USD 6.1% 6.3% 7.3% 7.4% 8.0% 7.3% -4.5% -9.4% -9.4% 0.8 0.8 0.4
FXY JPYUSD 8.1% 8.3% 10.8% 12.0% 10.1% 10.1% -15.5% -19.8% -39.0% (0.4) (0.3) (0.7)
FXE EURUSD 8.0% 7.6% 8.5% 8.1% 9.4% 8.7% -10.3% -26.6% -26.7% (0.7) (0.9) (0.5)
Sharpe (TR / Vol)Ticker Asset Class
Annualized Volatility Max Drawdown
Source: Deutsche Bank FactSet. Note: Data as of the end of last month; Calculations based on total returns; Volatility based on daily total returns annualized using a 252 day factor; Sharpe ratiocalculation assumes Risk free equal to zero. For Max DD and Sharpe calculation, green cells correspond to largest value, while red cells correspond to lowest values. For Volatility calculations, greencells are the least volatile (lowest values), while red cells are the most volatile (highest values). The ETFs mentioned in this figure are provided as reference and have been selected as investable andrepresentative vehicle for each asset class considering the product's asset class representation, liquidity, size, cost, and ease to borrow for tactical or risk hedging purpose; however, they should notbe seen as the only or best alternative for each asset class as finding the right product will depend on the specific investor's objective and intended usage. Please refer to "Product Type Definitions"on Appendix C for further details on product selection criteria depending on product usage.
Page 16 Deutsche Bank Securities Inc.

18 May 2017
US ETF Compass
US Equity Allocator heatmaps
Figure 18: US Equity Performance and Net Cash Flow Trends
1M Chg 3M Chg 6M Chg 1Y Chg 3Y Ann 5Y Ann 1M 3M 6M 1Y 3Y Ann 5Y Ann
VTI US Total Market 1.06% 4.86% 13.81% 18.56% 10.05% 13.53% 0.6% 3.4% 12.5% 18.4% 12.9% 16.0%
SPY S&P 500 (Large Cap) 0.99% 5.09% 13.16% 17.78% 10.36% 13.54% 0.7% 3.7% 13.3% 18.2% 11.6% 13.5%
DIA DJI 1.42% 5.99% 16.74% 20.62% 10.66% 12.27% 0.7% 3.7% 13.3% 18.2% 11.6% 13.5%
QQQ NASDAQ-100 2.73% 9.39% 16.83% 29.96% 17.13% 16.70% 0.7% 3.7% 13.3% 18.2% 11.6% 13.5%
IWF Russell 1000 Growth 2.22% 7.68% 15.13% 19.32% 11.89% 13.66% 1.4% 4.9% 8.5% 10.8% 11.5% 12.0%
IWD Russell 1000 Value -0.19% 2.30% 11.58% 16.34% 8.07% 13.12% 0.4% 3.5% 15.9% 29.1% 18.0% 21.6%
MDY S&P 400 (Mid Cap) 0.78% 2.93% 15.33% 20.06% 9.87% 13.23% -0.1% 2.6% 12.7% 20.1% 14.5% 17.1%
IWM Russell 2000 (SM Cap) 1.15% 3.13% 18.18% 25.53% 9.05% 13.01% 1.0% 3.1% 22.2% 32.7% 15.4% 18.2%
VIG Div. Growth 1.72% 6.05% 12.43% 15.44% 8.74% 11.83% 0.5% 1.3% 5.8% 20.1% 14.0% 16.5%
DVY Div. Yield 0.44% 2.73% 10.56% 15.11% 10.44% 13.77% 0.5% 1.3% 5.8% 20.1% 14.0% 16.5%
VYM Div. Yield -0.08% 3.18% 10.69% 15.07% 9.71% 13.32% 0.5% 1.3% 5.8% 20.1% 14.0% 16.5%
SDY Div. Yield & Growth 0.59% 3.38% 11.16% 13.55% 11.02% 14.16% 0.5% 1.3% 5.8% 20.1% 14.0% 16.5%
XLY Cons. Discretionary 2.40% 6.48% 16.35% 15.58% 13.87% 16.31% -1.1% -3.3% 0.2% -10.2% 8.3% 7.2%
PEJ Hotels, Rest & Leisure 1.94% 3.86% 15.52% 18.64% 9.79% 14.24%
XHB Home Builders 1.56% 9.79% 20.04% 13.11% 7.49% 12.65% 2.7% 2.8% 8.7% -11.1% -11.1% -10.7%
ITB Household Durables 1.09% 11.91% 25.68% 22.09% 11.83% 16.35% 2.7% 2.8% 8.7% -11.1% -11.1% -10.7%
PBS Media 0.90% 1.60% 13.70% 11.65% 6.15% 14.17%
XRT Retail 1.59% -0.42% 2.20% -1.67% 2.07% 8.05% -21.9% -37.0% -41.0% -38.7% -23.3% -40.7%
XLP Cons. Staples 1.10% 5.48% 5.84% 8.16% 10.42% 13.00% 0.0% 2.1% -7.6% -18.2% 6.8% 4.9%
PBJ Food Products 0.81% 2.84% 4.20% 6.04% 9.20% 12.75%
XLE Energy -2.95% -6.38% -0.02% 2.92% -7.89% 1.32% -1.6% 0.9% 11.1% 14.4% 19.2% 20.9%
OIH Energy Eq. & Serv. -9.54% -16.46% 0.66% -5.94% -17.16% -5.79% -1.5% 3.6% 35.7% 19.5% 8.1% 1.8%
XES Energy Eq. & Serv. -11.65% -20.88% 0.73% -8.52% -26.64% -11.97% -1.5% 3.6% 35.7% 19.5% 8.1% 1.8%
IEZ Energy Eq. & Serv. -9.41% -16.34% 1.28% -4.50% -17.38% -5.44% -1.5% 3.6% 35.7% 19.5% 8.1% 1.8%
XOP Energy E&P -6.65% -12.62% -0.75% -1.41% -22.41% -8.06% -5.3% 12.4% 19.3% -1.5% 34.2% 17.1%
IEO Energy E&P -4.55% -8.37% 0.76% 1.29% -12.46% -0.87% -5.3% 12.4% 19.3% -1.5% 34.2% 17.1%
AMLP MLPs -0.87% -1.47% 6.89% 11.34% -4.17% 1.40% 0.7% 8.7% 21.7% 36.2% 20.4% 36.2%
XLF Financials -0.84% 1.31% 20.17% 26.61% 11.76% 15.52% -1.7% 4.9% 46.9% 44.0% 10.6% 24.3%
KBWB Large Banks -0.91% 0.15% 23.42% 34.46% 12.04% 15.53% -0.5% 15.7% 56.5% 57.4% 13.9% 19.4%
KRE Regional Banks -1.03% -2.14% 24.28% 36.21% 13.96% 16.02% -0.5% 15.7% 56.5% 57.4% 13.9% 19.4%
KCE Capital Markets 0.35% 2.79% 21.02% 20.74% 2.02% 10.11% -3.6% -7.2% 30.9% 7.9% -16.5% 16.2%
KIE Insurance 0.56% 4.03% 17.33% 25.85% 13.63% 17.57% -0.2% 5.8% 39.2% 95.4% 34.3% 36.1%
XLV Healthcare 1.53% 7.45% 12.99% 9.92% 10.75% 16.89% 0.0% 2.7% 10.7% 9.2% 8.0% 20.3%
IBB Biotech & Pharma 1.49% 7.15% 16.12% 11.34% 9.11% 19.11% -1.1% -1.7% 3.5% 15.5% 13.9% 24.7%
BBH Large Biotech 2.47% 7.04% 19.01% 15.14% 11.98% 21.77% -1.1% -1.7% 3.5% 15.5% 13.9% 24.7%
IHI HC Eq. & Supplies 4.17% 11.04% 17.38% 23.42% 19.40% 19.48% 12.6% -1.9% -15.1% 15.8% 6.6% 16.6%
IHF HC Providers & Serv 2.50% 6.11% 17.37% 9.12% 13.43% 16.86% -2.1% -4.5% -16.2% -41.2% -2.8% 2.3%
PPH Large Pharma 0.96% 6.40% 7.75% -3.32% -0.82% 9.95% -3.0% -5.1% 1.5% -11.4% -9.0% 0.9%
XLI Industrials 1.97% 5.14% 17.20% 20.71% 10.02% 14.76% 1.4% 4.0% 50.2% 61.0% 8.4% 25.2%
ITA Aerospace & Def 3.39% 8.22% 18.72% 27.57% 13.57% 19.76% 6.5% 27.1% 153.1% 208.7% 86.9% 80.2%
IYT Transportation -0.07% -0.66% 13.68% 17.44% 7.18% 13.12% -7.9% -14.6% 23.0% 32.6% 1.1% 7.1%
XLB Materials 1.26% 2.46% 14.63% 14.94% 5.75% 10.00% 3.4% -2.1% 30.0% 34.0% -5.7% 8.5%
XME Metals & Mining -2.04% -10.64% 17.41% 22.23% -9.22% -7.80% -10.8% -7.5% 8.9% 11.1% 8.1% 5.8%
VNQ Real Estate 0.24% 1.24% 4.15% 5.73% 8.82% 9.16% -0.1% 1.1% 2.4% 16.5% 12.6% 15.2%
VGT Technology 2.34% 9.81% 16.66% 34.66% 16.81% 15.27% 0.8% 4.7% 12.6% 15.5% 4.4% 10.9%
IGN Comm. Equipment -1.12% 1.92% 12.21% 27.28% 11.35% 10.11%
FDN Int. Software & Serv. 4.77% 8.09% 13.39% 32.80% 18.90% 20.17% 3.8% 2.0% 0.2% 4.5% 16.3% 35.9%
SMH Semiconductors -0.01% 7.07% 17.67% 53.13% 22.93% 20.02% 2.4% 16.5% 51.7% 77.5% 20.8% 14.3%
IGV Software 3.31% 11.55% 16.29% 30.35% 18.64% 15.50% 6.3% 13.2% -1.2% -1.3% -26.2% -10.0%
VOX Telecom 2.19% -2.74% 8.32% 8.10% 8.25% 12.21% -0.6% -9.7% -0.4% -8.6% 14.2% 14.6%
XLU Utilities 0.76% 5.92% 6.39% 10.42% 9.91% 11.71% 4.4% 9.7% -1.3% -14.2% 7.0% 3.1%
Ticker Asset ClassTotal Return ETF Net Cash Flows as % of Initial AUM
Source: Deutsche Bank, FactSet, Bloomberg Finance LP. Note: Data as of the end of last month; performance is Total Returns; Cash flows are based on US-listed ETFs and ETVs excluding leveraged,inverse products, and ETNs. Asset Classes that had less than $500 million in AUM at the beginning of all periods are excluded from the Net Cash flow calculations. Green cells correspond to largestvalues, while red cells correspond to lowest values. Figures over 1Y are annualized. The ETFs mentioned in this figure are provided as reference and have been selected as investable and representativevehicle for each asset class considering the product's asset class representation, liquidity, size, cost, and ease to borrow for tactical or risk hedging purposes; however, they should not be seen as theonly or best alternative for each asset class as finding the right product will depend on the specific investor's objective and intended usage. Please refer to "Product Type Definitions" on AppendixC for further details on products selection criteria depending on product usage.
Deutsche Bank Securities Inc. Page 17

18 May 2017
US ETF Compass
Figure 19: US Equity Risk and Risk-adjusted Performance Measure
1M 3M 6M 1Y 3Y 5Y 1Y 3Y 5Y 1Y 3Y 5Y
VTI US Total Market 7.7% 7.4% 8.1% 10.2% 13.1% 12.8% -5.9% -15.1% -15.1% 1.8 0.8 1.1
SPY S&P 500 (Large Cap) 7.5% 7.1% 7.8% 9.8% 13.0% 12.6% -5.5% -13.0% -13.0% 1.8 0.8 1.1
DIA DJI 8.5% 7.4% 7.7% 9.5% 12.7% 12.1% -4.8% -13.9% -13.9% 2.2 0.8 1.0
QQQ NASDAQ-100 7.6% 6.9% 9.6% 11.5% 15.3% 14.9% -7.3% -16.1% -16.1% 2.6 1.1 1.1
IWF Russell 1000 Growth 6.7% 6.4% 7.7% 9.7% 13.1% 12.9% -5.7% -13.8% -13.8% 2.0 0.9 1.1
IWD Russell 1000 Value 8.6% 8.3% 8.8% 10.7% 13.3% 12.9% -5.8% -16.2% -16.2% 1.5 0.6 1.0
MDY S&P 400 (Mid Cap) 12.0% 11.0% 11.5% 13.1% 14.3% 14.4% -7.1% -19.3% -19.3% 1.5 0.7 0.9
IWM Russell 2000 (SM Cap) 14.2% 13.6% 14.8% 15.5% 16.6% 16.2% -8.3% -25.7% -25.7% 1.6 0.5 0.8
VIG Div. Growth 7.5% 6.8% 6.9% 8.9% 11.9% 11.6% -5.2% -12.1% -12.1% 1.7 0.7 1.0
DVY Div. Yield 7.7% 7.6% 8.8% 10.1% 11.8% 11.4% -5.6% -12.0% -12.0% 1.5 0.9 1.2
VYM Div. Yield 7.0% 6.8% 7.6% 9.3% 12.3% 11.7% -4.5% -13.0% -13.0% 1.6 0.8 1.1
SDY Div. Yield & Growth 7.7% 7.3% 8.0% 9.7% 11.8% 11.6% -6.7% -10.8% -10.8% 1.4 0.9 1.2
XLY Cons. Discretionary 8.2% 7.5% 9.0% 11.1% 14.1% 14.0% -6.8% -15.8% -15.8% 1.4 1.0 1.2
PEJ Hotels, Rest & Leisure 10.2% 10.8% 12.1% 13.8% 16.6% 16.4% -11.0% -21.7% -21.7% 1.3 0.6 0.9
XHB Home Builders 10.5% 11.5% 14.2% 16.4% 18.1% 20.0% -15.2% -28.2% -28.2% 0.8 0.4 0.6
ITB Household Durables 11.6% 13.1% 16.2% 17.3% 20.4% 23.5% -15.1% -26.4% -26.4% 1.3 0.6 0.7
PBS Media 10.1% 9.4% 10.7% 12.8% 15.3% 15.7% -8.5% -23.2% -23.2% 0.9 0.4 0.9
XRT Retail 17.3% 18.0% 18.6% 18.2% 17.7% 16.9% -14.8% -24.2% -24.2% (0.1) 0.1 0.5
XLP Cons. Staples 6.7% 6.6% 9.3% 10.1% 11.6% 11.3% -9.2% -10.1% -10.1% 0.8 0.9 1.2
PBJ Food Products 6.6% 7.9% 10.9% 12.0% 13.2% 13.0% -7.9% -11.0% -11.0% 0.5 0.7 1.0
XLE Energy 12.4% 14.4% 16.4% 18.3% 22.9% 20.4% -11.9% -46.7% -46.7% 0.2 (0.3) 0.1
OIH Energy Eq. & Serv. 21.4% 22.0% 27.2% 30.6% 31.9% 27.9% -20.4% -61.3% -61.3% (0.2) (0.5) (0.2)
XES Energy Eq. & Serv. 27.9% 28.6% 33.6% 37.1% 38.8% 33.1% -25.1% -72.8% -72.8% (0.2) (0.7) (0.4)
IEZ Energy Eq. & Serv. 21.7% 22.2% 26.5% 30.3% 31.9% 28.0% -19.9% -61.8% -61.8% (0.1) (0.5) (0.2)
XOP Energy E&P 23.0% 24.6% 29.4% 31.1% 38.4% 33.5% -19.2% -71.0% -71.0% (0.0) (0.6) (0.2)
IEO Energy E&P 17.7% 20.2% 23.8% 25.6% 29.6% 26.3% -15.0% -56.8% -56.8% 0.1 (0.4) (0.0)
AMLP MLPs 7.5% 8.8% 12.7% 15.3% 27.8% 22.3% -7.4% -53.1% -53.1% 0.7 (0.2) 0.1
XLF Financials 16.1% 15.4% 17.0% 16.4% 16.6% 16.1% -9.6% -22.3% -22.3% 1.6 0.7 1.0
KBWB Large Banks 17.8% 18.4% 20.5% 21.3% 21.0% 19.8% -15.5% -29.1% -29.1% 1.6 0.6 0.8
KRE Regional Banks 21.2% 22.3% 23.4% 23.5% 22.1% 20.3% -15.0% -28.0% -28.0% 1.5 0.6 0.8
KCE Capital Markets 9.8% 13.1% 15.5% 20.2% 20.8% 20.0% -17.1% -36.4% -36.4% 1.0 0.1 0.5
KIE Insurance 11.8% 9.8% 10.4% 12.9% 13.7% 13.6% -8.8% -15.2% -15.2% 2.0 1.0 1.3
XLV Healthcare 7.4% 7.7% 11.2% 12.1% 15.5% 14.4% -12.4% -17.1% -17.1% 0.8 0.7 1.2
IBB Biotech & Pharma 12.0% 14.8% 22.8% 23.8% 26.8% 25.2% -17.7% -39.2% -39.2% 0.5 0.3 0.8
BBH Large Biotech 10.2% 12.8% 20.4% 21.4% 24.8% 24.1% -16.3% -33.8% -33.8% 0.7 0.5 0.9
IHI HC Eq. & Supplies 9.7% 8.7% 12.2% 13.7% 15.2% 14.7% -11.6% -14.2% -14.2% 1.7 1.3 1.3
IHF HC Providers & Serv 7.0% 10.4% 13.0% 14.2% 17.2% 16.1% -14.1% -26.3% -26.3% 0.6 0.8 1.0
PPH Large Pharma 10.7% 10.1% 14.6% 15.4% 16.2% 14.7% -17.8% -29.9% -29.9% (0.2) (0.1) 0.7
XLI Industrials 10.5% 10.0% 11.0% 12.3% 14.4% 14.3% -6.6% -15.7% -15.7% 1.7 0.7 1.0
ITA Aerospace & Def 11.3% 11.1% 12.6% 13.1% 14.8% 14.8% -6.3% -17.2% -17.2% 2.1 0.9 1.3
IYT Transportation 14.6% 14.4% 14.6% 15.6% 17.4% 17.1% -10.2% -27.3% -27.3% 1.1 0.4 0.8
XLB Materials 11.5% 10.9% 11.4% 13.7% 16.7% 16.3% -7.8% -26.9% -26.9% 1.1 0.3 0.6
XME Metals & Mining 26.8% 26.9% 29.4% 33.7% 33.8% 30.8% -16.8% -71.8% -73.8% 0.7 (0.3) (0.3)
VNQ Real Estate 9.3% 10.8% 13.8% 14.5% 15.2% 14.8% -15.2% -17.2% -18.0% 0.4 0.6 0.6
VGT Technology 8.4% 7.7% 10.6% 12.2% 15.6% 15.2% -7.5% -16.4% -16.4% 2.8 1.1 1.0
IGN Comm. Equipment 11.9% 11.6% 12.8% 15.7% 17.4% 18.3% -10.3% -24.9% -24.9% 1.7 0.7 0.6
FDN Int. Software & Serv. 8.7% 9.1% 11.7% 13.5% 18.2% 18.4% -7.3% -25.8% -25.8% 2.4 1.0 1.1
SMH Semiconductors 15.1% 12.2% 16.7% 18.3% 20.3% 19.5% -8.7% -23.7% -23.7% 2.9 1.1 1.0
IGV Software 7.2% 9.3% 12.7% 14.3% 17.3% 17.3% -7.9% -21.5% -21.5% 2.1 1.1 0.9
VOX Telecom 11.5% 12.3% 14.2% 14.3% 14.5% 13.9% -13.3% -13.3% -13.3% 0.6 0.6 0.9
XLU Utilities 6.7% 11.0% 14.6% 14.6% 15.5% 14.0% -12.4% -15.7% -15.7% 0.7 0.6 0.8
Ticker Asset ClassMax DrawdownAnnualized Volatility Sharpe (TR / Vol)
Source: Deutsche Bank, FactSet. Note: Data as of the end of last month; Calculations based on total returns; Volatility based on daily total returns annualized using a 252 day factor; Sharpe ratiocalculation assumes Risk free equal to zero. For Max DD and Sharpe calculation, green cells correspond to largest value, while red cells correspond to lowest values. For Volatility calculations, greencells are the least volatile (lowest values), while red cells are the most volatile (highest values). The ETFs mentioned in this figure are provided as reference and have been selected as investable andrepresentative vehicle for each asset class considering the product's asset class representation, liquidity, size, cost, and ease to borrow for tactical or risk hedging purpose; however, they should notbe seen as the only or best alternative for each asset class as finding the right product will depend on the specific investor's objective and intended usage. Please refer to "Product Type Definitions"on Appendix C for further details on product selection criteria depending on product usage.
Page 18 Deutsche Bank Securities Inc.
18 May 2017
US ETF Compass
International Equity Allocator heatmaps
Figure 20: International Equity Performance and Net ETF Cash Flow Trends
1M Chg 3M Chg 6M Chg 1Y Chg 3Y Ann 5Y Ann 1M 3M 6M 1Y 3Y Ann 5Y Ann
EFA Intl DM 2.42% 6.99% 11.48% 12.59% 0.72% 6.70% 2.8% 7.2% 13.9% 8.5% 17.2% 26.7%
EWC Canada -2.31% -3.38% 4.62% 5.25% -2.98% 0.60% -0.9% -13.7% -1.5% 3.7% 1.5% -6.5%
EIS Israel 0.98% 7.43% 12.53% 9.08% 2.12% 5.75%
VGK Europe 3.90% 9.14% 15.14% 11.37% -0.79% 7.29% 3.4% 9.7% 11.3% -7.7% 2.8% 35.1%
EDEN Denmark 7.38% 10.41% 12.59% 5.14% 6.55% 16.17%
NORW Norway 0.09% -3.94% 4.36% 6.26% -9.64% -1.23%
EWD Sweden 4.88% 8.56% 20.25% 13.88% 0.08% 7.08%
EWL Switzerland 3.94% 8.17% 14.65% 11.55% 0.69% 8.64% -2.6% 3.3% -0.8% -11.4% 4.3% 13.8%
EWU UK 1.69% 5.25% 11.86% 5.42% -3.89% 3.03% 0.1% 6.2% 24.2% 27.1% -3.5% 17.4%
EZU Eurozone 4.36% 11.04% 15.69% 14.77% -0.53% 8.62% 7.4% 12.5% 12.5% -24.5% 13.0% 48.8%
EWO Austria 7.82% 12.26% 19.57% 23.24% 1.11% 6.40%
EWK Belgium 3.62% 9.15% 9.60% 10.38% 5.32% 13.16%
EFNL Finland 7.30% 13.16% 16.63% 19.57% 3.96% 10.83%
EWQ France 5.70% 12.04% 16.93% 16.55% 0.31% 9.23%
EWG Germany 3.23% 7.89% 14.59% 15.94% -0.12% 7.98% 7.9% 10.5% 18.9% -10.8% 5.3% 13.2%
EIRL Ireland 5.22% 9.34% 17.00% 6.79% 4.80% 15.21%
EWI Italy 2.76% 11.42% 18.32% 8.00% -7.44% 4.73% -1.0% -12.8% 12.6% -29.0% -9.0% 41.5%
EWN Netherlands 4.74% 13.50% 16.18% 16.72% 5.31% 11.50%
PGAL Portugal 1.27% 12.69% 10.06% 5.36% -14.05%
EWP Spain 4.97% 16.16% 19.28% 15.89% -4.89% 8.63% 18.4% 52.3% 89.7% 21.1% -2.6% 70.6%
EWJ Japan 0.70% 2.55% 3.86% 15.77% 6.95% 7.52% -1.0% -5.4% 8.1% -11.0% 1.5% 30.4%
EPP Pacific ex JP 0.29% 6.18% 11.73% 16.70% 0.99% 4.73% 0.0% 2.9% -2.1% 3.1% 0.5% -5.1%
EWA Australia -0.66% 5.74% 13.71% 17.35% -0.82% 3.76% -2.2% -5.9% -0.3% 2.1% 3.8% -5.6%
EWH Hong Kong 2.92% 8.89% 7.31% 19.38% 7.29% 8.71% 0.0% -0.6% -21.1% -18.5% -0.4% -1.9%
ENZL New Zealand 0.85% -2.05% 2.71% 6.68% 4.16% 11.10%
EWS Singapore 0.75% 5.56% 14.64% 9.81% -1.97% 1.34% -2.2% -10.4% -15.9% -16.1% -13.3% -15.9%
EEM EM 1.70% 7.28% 9.10% 18.75% 1.09% 1.04% 2.0% 7.9% 9.7% 24.6% 9.8% 5.7%
ILF Latin America -1.04% 3.63% 2.07% 17.61% -4.03% -4.89% -1.6% 2.7% 17.5% 24.6% 6.2% -0.6%
EWZ Brazil -0.77% 0.81% -0.32% 28.50% -5.01% -6.57% -0.2% 16.1% 23.7% 36.5% 14.2% -1.4%
ECH Chile -1.42% 10.44% 7.47% 14.76% -0.57% -7.12% 3.8% 16.8% 15.1% 23.7% 18.3% 0.0%
GXG Colombia -1.16% -0.95% 3.60% 0.11% -19.34% -14.02%
EWW Mexico 1.15% 15.51% 2.29% -2.66% -5.20% -1.89% -17.0% -41.1% 4.1% -11.6% -15.4% 7.5%
EPU Peru -2.11% -4.79% 1.90% 7.51% 0.14% -4.43% -10.4% -8.7% 1.2% -11.9% -3.0% -7.5%
EEMA EM Asia 2.14% 8.69% 10.86% 22.37% 4.62% 4.61% 1.2% 3.7% -3.6% -8.8% 6.2% 5.9%
FXI China H 0.10% 5.01% 6.65% 18.09% 6.15% 3.14% 1.2% -2.5% -14.0% -22.1% -0.9% -0.7%
ASHR China A -1.23% -0.52% 1.45% 4.51% 14.00% 0.5% 5.4% -6.8% 5.0% 22.1% 84.7%
INDA India 1.89% 13.12% 10.78% 19.61% 7.70% 7.11% 2.9% 8.8% 6.6% 6.8% 39.2% 33.6%
EIDO Indonesia 2.09% 7.87% 0.42% 15.39% -0.31% -1.83% 3.1% 2.3% -16.4% -16.8% -1.4% 0.6%
EWM Malaysia 3.97% 8.49% 3.74% -1.92% -8.89% -2.77% 5.3% 36.6% 20.4% 12.4% -4.6% -8.0%
EPHE Philippines 4.92% 4.55% 1.68% 2.97% 0.77% 4.79%
EWY South Korea 0.37% 7.29% 13.55% 20.29% 1.35% 2.32% -4.5% -5.6% -18.4% -29.1% -6.7% 1.1%
EWT Taiwan 1.59% 7.11% 9.65% 32.32% 7.46% 8.07% 1.8% 8.5% 10.5% 11.9% 2.5% 4.0%
THD Thailand -0.60% 2.43% 8.80% 17.24% 3.34% 3.15% -0.9% 7.9% 14.9% 5.6% -9.1% -9.2%
GUR EM Europe 4.76% 5.14% 15.71% 13.33% -3.01% -3.40% -2.6% -7.2% 21.1% 9.3% 17.8% 12.1%
GREK Greece 7.66% 13.21% 20.04% 11.33% -27.19% -9.17%
EPOL Poland 10.10% 17.68% 30.30% 28.20% -5.47% 1.88%
RSX Russia 1.02% -2.34% 14.23% 19.63% 0.27% -4.26% -2.2% -8.2% 25.4% 10.6% 27.1% 10.6%
TUR Turkey 11.09% 18.33% 6.62% -11.39% -7.32% -3.19% -11.2% -17.0% 7.3% 1.3% 0.3% 5.3%
Middle East
QAT Qatar -2.15% -1.49% 0.61% 1.84%
UAE UAE 1.10% -0.24% 5.21% 2.75%
AFK Africa 1.29% -0.47% 5.84% 2.35% -11.30% -3.95% 0.8% 1.6% 6.7% -6.8% -0.5% 0.7%
EGPT Egypt -2.54% 4.58% -25.98% -28.53% -25.22% -9.05%
EZA South Africa 5.96% 6.60% 6.90% 9.35% -1.59% -0.25% 1.3% 1.3% 0.1% -11.9% -1.2% -0.9%
FM Frontier Market 3.53% 4.02% 16.07% 16.68% -2.93% 1.0% 8.9% 10.0% 18.5% -0.1% 25.3%
ARGT Argentina 1.53% 11.68% 20.95% 38.80% 13.59% 9.25%
NGE Nigeria 1.13% -3.77% -10.20% -35.29% -33.41%
PAK Pakistan 4.83% 1.13% 19.74% 32.51%
VNM Vietnam 0.14% 3.54% 0.39% -0.24% -8.57% -4.97% -0.2% 2.3% -5.2% -12.0% -2.4% 6.7%
BKF BRIC 1.46% 7.72% 9.29% 23.46% 3.46% 0.83% 32.2% 55.0% 39.2% 4.1% -16.9% -19.0%
Ticker Asset ClassTotal Return ETF Net Cash Flows as % of Initial AUM
Source: Deutsche Bank, FactSet, Bloomberg Finance LP. Note: Data as of the end of last month; performance is Total Returns; Cash flows are based on US-listed ETFs and ETVs excluding leveraged,inverse products, and ETNs. Asset Classes that had less than $500 million in AUM at the beginning of all periods are excluded from the Net Cash flow calculations. Green cells correspond to largestvalues, while red cells correspond to lowest values. Figures over 1Y are annualized. The ETFs mentioned in this figure are provided as reference and have been selected as investable and representativevehicle for each asset class considering the product's asset class representation, liquidity, size, cost, and ease to borrow for tactical or risk hedging purposes; however, they should not be seen as theonly or best alternative for each asset class as finding the right product will depend on the specific investor's objective and intended usage. Please refer to "Product Type Definitions" on AppendixC for further details on products selection criteria depending on product usage.
Deutsche Bank Securities Inc. Page 19
18 May 2017
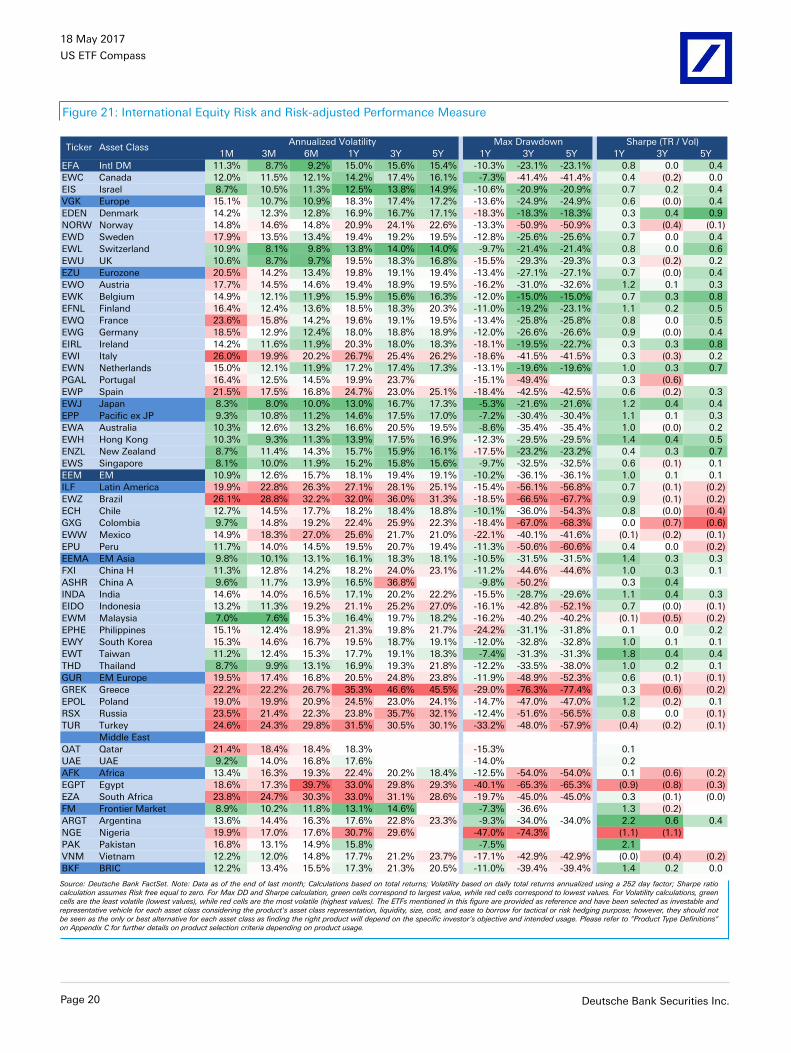
US ETF Compass
Figure 21: International Equity Risk and Risk-adjusted Performance Measure
1M 3M 6M 1Y 3Y 5Y 1Y 3Y 5Y 1Y 3Y 5Y
EFA Intl DM 11.3% 8.7% 9.2% 15.0% 15.6% 15.4% -10.3% -23.1% -23.1% 0.8 0.0 0.4
EWC Canada 12.0% 11.5% 12.1% 14.2% 17.4% 16.1% -7.3% -41.4% -41.4% 0.4 (0.2) 0.0
EIS Israel 8.7% 10.5% 11.3% 12.5% 13.8% 14.9% -10.6% -20.9% -20.9% 0.7 0.2 0.4
VGK Europe 15.1% 10.7% 10.9% 18.3% 17.4% 17.2% -13.6% -24.9% -24.9% 0.6 (0.0) 0.4
EDEN Denmark 14.2% 12.3% 12.8% 16.9% 16.7% 17.1% -18.3% -18.3% -18.3% 0.3 0.4 0.9
NORW Norway 14.8% 14.6% 14.8% 20.9% 24.1% 22.6% -13.3% -50.9% -50.9% 0.3 (0.4) (0.1)
EWD Sweden 17.9% 13.5% 13.4% 19.4% 19.2% 19.5% -12.8% -25.6% -25.6% 0.7 0.0 0.4
EWL Switzerland 10.9% 8.1% 9.8% 13.8% 14.0% 14.0% -9.7% -21.4% -21.4% 0.8 0.0 0.6
EWU UK 10.6% 8.7% 9.7% 19.5% 18.3% 16.8% -15.5% -29.3% -29.3% 0.3 (0.2) 0.2
EZU Eurozone 20.5% 14.2% 13.4% 19.8% 19.1% 19.4% -13.4% -27.1% -27.1% 0.7 (0.0) 0.4
EWO Austria 17.7% 14.5% 14.6% 19.4% 18.9% 19.5% -16.2% -31.0% -32.6% 1.2 0.1 0.3
EWK Belgium 14.9% 12.1% 11.9% 15.9% 15.6% 16.3% -12.0% -15.0% -15.0% 0.7 0.3 0.8
EFNL Finland 16.4% 12.4% 13.6% 18.5% 18.3% 20.3% -11.0% -19.2% -23.1% 1.1 0.2 0.5
EWQ France 23.6% 15.8% 14.2% 19.6% 19.1% 19.5% -13.4% -25.8% -25.8% 0.8 0.0 0.5
EWG Germany 18.5% 12.9% 12.4% 18.0% 18.8% 18.9% -12.0% -26.6% -26.6% 0.9 (0.0) 0.4
EIRL Ireland 14.2% 11.6% 11.9% 20.3% 18.0% 18.3% -18.1% -19.5% -22.7% 0.3 0.3 0.8
EWI Italy 26.0% 19.9% 20.2% 26.7% 25.4% 26.2% -18.6% -41.5% -41.5% 0.3 (0.3) 0.2
EWN Netherlands 15.0% 12.1% 11.9% 17.2% 17.4% 17.3% -13.1% -19.6% -19.6% 1.0 0.3 0.7
PGAL Portugal 16.4% 12.5% 14.5% 19.9% 23.7% -15.1% -49.4% 0.3 (0.6)
EWP Spain 21.5% 17.5% 16.8% 24.7% 23.0% 25.1% -18.4% -42.5% -42.5% 0.6 (0.2) 0.3
EWJ Japan 8.3% 8.0% 10.0% 13.0% 16.7% 17.3% -5.3% -21.6% -21.6% 1.2 0.4 0.4
EPP Pacific ex JP 9.3% 10.8% 11.2% 14.6% 17.5% 17.0% -7.2% -30.4% -30.4% 1.1 0.1 0.3
EWA Australia 10.3% 12.6% 13.2% 16.6% 20.5% 19.5% -8.6% -35.4% -35.4% 1.0 (0.0) 0.2
EWH Hong Kong 10.3% 9.3% 11.3% 13.9% 17.5% 16.9% -12.3% -29.5% -29.5% 1.4 0.4 0.5
ENZL New Zealand 8.7% 11.4% 14.3% 15.7% 15.9% 16.1% -17.5% -23.2% -23.2% 0.4 0.3 0.7
EWS Singapore 8.1% 10.0% 11.9% 15.2% 15.8% 15.6% -9.7% -32.5% -32.5% 0.6 (0.1) 0.1
EEM EM 10.9% 12.6% 15.7% 18.1% 19.4% 19.1% -10.2% -36.1% -36.1% 1.0 0.1 0.1
ILF Latin America 19.9% 22.8% 26.3% 27.1% 28.1% 25.1% -15.4% -56.1% -56.8% 0.7 (0.1) (0.2)
EWZ Brazil 26.1% 28.8% 32.2% 32.0% 36.0% 31.3% -18.5% -66.5% -67.7% 0.9 (0.1) (0.2)
ECH Chile 12.7% 14.5% 17.7% 18.2% 18.4% 18.8% -10.1% -36.0% -54.3% 0.8 (0.0) (0.4)
GXG Colombia 9.7% 14.8% 19.2% 22.4% 25.9% 22.3% -18.4% -67.0% -68.3% 0.0 (0.7) (0.6)
EWW Mexico 14.9% 18.3% 27.0% 25.6% 21.7% 21.0% -22.1% -40.1% -41.6% (0.1) (0.2) (0.1)
EPU Peru 11.7% 14.0% 14.5% 19.5% 20.7% 19.4% -11.3% -50.6% -60.6% 0.4 0.0 (0.2)
EEMA EM Asia 9.8% 10.1% 13.1% 16.1% 18.3% 18.1% -10.5% -31.5% -31.5% 1.4 0.3 0.3
FXI China H 11.3% 12.8% 14.2% 18.2% 24.0% 23.1% -11.2% -44.6% -44.6% 1.0 0.3 0.1
ASHR China A 9.6% 11.7% 13.9% 16.5% 36.8% -9.8% -50.2% 0.3 0.4
INDA India 14.6% 14.0% 16.5% 17.1% 20.2% 22.2% -15.5% -28.7% -29.6% 1.1 0.4 0.3
EIDO Indonesia 13.2% 11.3% 19.2% 21.1% 25.2% 27.0% -16.1% -42.8% -52.1% 0.7 (0.0) (0.1)
EWM Malaysia 7.0% 7.6% 15.3% 16.4% 19.7% 18.2% -16.2% -40.2% -40.2% (0.1) (0.5) (0.2)
EPHE Philippines 15.1% 12.4% 18.9% 21.3% 19.8% 21.7% -24.2% -31.1% -31.8% 0.1 0.0 0.2
EWY South Korea 15.3% 14.6% 16.7% 19.5% 18.7% 19.1% -12.0% -32.8% -32.8% 1.0 0.1 0.1
EWT Taiwan 11.2% 12.4% 15.3% 17.7% 19.1% 18.3% -7.4% -31.3% -31.3% 1.8 0.4 0.4
THD Thailand 8.7% 9.9% 13.1% 16.9% 19.3% 21.8% -12.2% -33.5% -38.0% 1.0 0.2 0.1
GUR EM Europe 19.5% 17.4% 16.8% 20.5% 24.8% 23.8% -11.9% -48.9% -52.3% 0.6 (0.1) (0.1)
GREK Greece 22.2% 22.2% 26.7% 35.3% 46.6% 45.5% -29.0% -76.3% -77.4% 0.3 (0.6) (0.2)
EPOL Poland 19.0% 19.9% 20.9% 24.5% 23.0% 24.1% -14.7% -47.0% -47.0% 1.2 (0.2) 0.1
RSX Russia 23.5% 21.4% 22.3% 23.8% 35.7% 32.1% -12.4% -51.6% -56.5% 0.8 0.0 (0.1)
TUR Turkey 24.6% 24.3% 29.8% 31.5% 30.5% 30.1% -33.2% -48.0% -57.9% (0.4) (0.2) (0.1)
Middle East
QAT Qatar 21.4% 18.4% 18.4% 18.3% -15.3% 0.1
UAE UAE 9.2% 14.0% 16.8% 17.6% -14.0% 0.2
AFK Africa 13.4% 16.3% 19.3% 22.4% 20.2% 18.4% -12.5% -54.0% -54.0% 0.1 (0.6) (0.2)
EGPT Egypt 18.6% 17.3% 39.7% 33.0% 29.8% 29.3% -40.1% -65.3% -65.3% (0.9) (0.8) (0.3)
EZA South Africa 23.8% 24.7% 30.3% 33.0% 31.1% 28.6% -19.7% -45.0% -45.0% 0.3 (0.1) (0.0)
FM Frontier Market 8.9% 10.2% 11.8% 13.1% 14.6% -7.3% -36.6% 1.3 (0.2)
ARGT Argentina 13.6% 14.4% 16.3% 17.6% 22.8% 23.3% -9.3% -34.0% -34.0% 2.2 0.6 0.4
NGE Nigeria 19.9% 17.0% 17.6% 30.7% 29.6% -47.0% -74.3% (1.1) (1.1)
PAK Pakistan 16.8% 13.1% 14.9% 15.8% -7.5% 2.1
VNM Vietnam 12.2% 12.0% 14.8% 17.7% 21.2% 23.7% -17.1% -42.9% -42.9% (0.0) (0.4) (0.2)
BKF BRIC 12.2% 13.4% 15.5% 17.3% 21.3% 20.5% -11.0% -39.4% -39.4% 1.4 0.2 0.0
Ticker Asset ClassAnnualized Volatility Max Drawdown Sharpe (TR / Vol)
Source: Deutsche Bank FactSet. Note: Data as of the end of last month; Calculations based on total returns; Volatility based on daily total returns annualized using a 252 day factor; Sharpe ratiocalculation assumes Risk free equal to zero. For Max DD and Sharpe calculation, green cells correspond to largest value, while red cells correspond to lowest values. For Volatility calculations, greencells are the least volatile (lowest values), while red cells are the most volatile (highest values). The ETFs mentioned in this figure are provided as reference and have been selected as investable andrepresentative vehicle for each asset class considering the product's asset class representation, liquidity, size, cost, and ease to borrow for tactical or risk hedging purpose; however, they should notbe seen as the only or best alternative for each asset class as finding the right product will depend on the specific investor's objective and intended usage. Please refer to "Product Type Definitions"on Appendix C for further details on product selection criteria depending on product usage.
Page 20 Deutsche Bank Securities Inc.

Deu
tsche B
ank S
ecurities In
c.Pag
e 21
Cross Asset Correlations
Figure 22: 3-Year Cross Asset Class Correlations of Weekly Total Returns3Y - Cross Asset Class Correlation of Weekly Total Returns
Category Ticker ACWI VTI EFA EEM AGG GOVT TIP MUB MBB LQD HYG FLOT BKLN PFF CWB BWX WIP EMB EMLC EMCB DBC DBE DBA DBB DBP UUP FXY FXE
Global Equities ACWI 0.95 0.95 0.86 -0.21 -0.32 -0.02 -0.22 -0.19 0.00 0.67 0.09 0.60 0.46 0.89 -0.05 0.22 0.53 0.52 0.45 0.43 0.40 0.29 0.43 -0.11 0.08 -0.35 -0.11
US Total Market VTI 0.95 0.84 0.73 -0.26 -0.37 -0.08 -0.28 -0.24 -0.05 0.65 0.08 0.59 0.41 0.90 -0.16 0.07 0.43 0.37 0.38 0.35 0.33 0.23 0.38 -0.20 0.19 -0.41 -0.20
Intl DM EFA 0.95 0.84 0.82 -0.18 -0.28 0.00 -0.17 -0.18 0.00 0.60 0.08 0.55 0.45 0.81 0.03 0.28 0.52 0.53 0.41 0.42 0.39 0.28 0.41 -0.06 -0.02 -0.31 0.00
EM EEM 0.86 0.73 0.82 -0.01 -0.11 0.17 -0.06 0.02 0.15 0.62 0.11 0.52 0.41 0.72 0.15 0.41 0.67 0.74 0.55 0.49 0.39 0.34 0.47 0.12 -0.03 -0.13 -0.02
US Agg Bond IG AGG -0.21 -0.26 -0.18 -0.01 0.96 0.84 0.79 0.88 0.90 -0.01 -0.09 -0.10 0.24 -0.18 0.66 0.56 0.36 0.30 0.16 -0.13 -0.19 -0.06 -0.11 0.48 -0.30 0.57 0.22
US Treasury GOVT -0.32 -0.37 -0.28 -0.11 0.96 0.80 0.79 0.85 0.83 -0.14 -0.12 -0.24 0.16 -0.29 0.64 0.51 0.26 0.22 0.07 -0.22 -0.27 -0.11 -0.17 0.50 -0.31 0.58 0.24
US Inflation TIP -0.02 -0.08 0.00 0.17 0.84 0.80 0.65 0.78 0.82 0.13 -0.05 0.03 0.27 -0.03 0.63 0.61 0.43 0.43 0.25 0.09 0.02 0.02 0.11 0.47 -0.32 0.47 0.24
Municipal MUB -0.22 -0.28 -0.17 -0.06 0.79 0.79 0.65 0.72 0.69 -0.09 -0.13 -0.20 0.19 -0.21 0.51 0.47 0.28 0.26 0.01 -0.16 -0.23 -0.03 -0.12 0.40 -0.22 0.50 0.14
MBS MBB -0.19 -0.24 -0.18 0.02 0.88 0.85 0.78 0.72 0.76 -0.03 -0.14 -0.14 0.23 -0.17 0.59 0.53 0.32 0.29 0.15 -0.11 -0.15 -0.11 -0.09 0.44 -0.27 0.52 0.19
IG Corporates LQD 0.00 -0.05 0.00 0.15 0.90 0.83 0.82 0.69 0.76 0.25 -0.06 0.15 0.40 0.05 0.56 0.56 0.51 0.39 0.29 0.00 -0.04 0.00 -0.05 0.40 -0.22 0.46 0.14
HY Corporates HYG 0.67 0.65 0.60 0.62 -0.01 -0.14 0.13 -0.09 -0.03 0.25 0.10 0.76 0.54 0.70 0.02 0.22 0.70 0.55 0.58 0.51 0.50 0.22 0.32 0.03 0.08 -0.15 -0.11
Floater FLOT 0.09 0.08 0.08 0.11 -0.09 -0.12 -0.05 -0.13 -0.14 -0.06 0.10 0.14 -0.08 0.02 0.05 0.07 0.01 0.10 0.16 0.14 0.11 0.16 0.07 0.06 -0.09 0.01 0.07
Senior Loans BKLN 0.60 0.59 0.55 0.52 -0.10 -0.24 0.03 -0.20 -0.14 0.15 0.76 0.14 0.44 0.62 -0.06 0.12 0.48 0.41 0.47 0.44 0.42 0.21 0.31 -0.04 0.13 -0.22 -0.15
Preferred PFF 0.46 0.41 0.45 0.41 0.24 0.16 0.27 0.19 0.23 0.40 0.54 -0.08 0.44 0.52 0.13 0.30 0.55 0.37 0.41 0.23 0.21 0.20 0.22 0.04 0.04 -0.02 -0.08
Convertible CWB 0.89 0.90 0.81 0.72 -0.18 -0.29 -0.03 -0.21 -0.17 0.05 0.70 0.02 0.62 0.52 -0.12 0.11 0.51 0.40 0.44 0.35 0.34 0.20 0.35 -0.18 0.17 -0.34 -0.18
Intl DM Debt BWX -0.05 -0.16 0.03 0.15 0.66 0.64 0.63 0.51 0.59 0.56 0.02 0.05 -0.06 0.13 -0.12 0.85 0.34 0.53 0.18 0.14 0.03 0.15 0.14 0.63 -0.85 0.74 0.77
Intl Inflation WIP 0.22 0.07 0.28 0.41 0.56 0.51 0.61 0.47 0.53 0.56 0.22 0.07 0.12 0.30 0.11 0.85 0.52 0.72 0.33 0.30 0.19 0.20 0.24 0.57 -0.72 0.52 0.63
EM Gov Debt USD EMB 0.53 0.43 0.52 0.67 0.36 0.26 0.43 0.28 0.32 0.51 0.70 0.01 0.48 0.55 0.51 0.34 0.52 0.75 0.72 0.37 0.32 0.20 0.18 0.24 -0.09 0.13 0.02
EM Gov Debt Local EMLC 0.52 0.37 0.53 0.74 0.30 0.22 0.43 0.26 0.29 0.39 0.55 0.10 0.41 0.37 0.40 0.53 0.72 0.75 0.57 0.46 0.34 0.33 0.32 0.42 -0.37 0.25 0.31
EM Corp USD EMCB 0.45 0.38 0.41 0.55 0.16 0.07 0.25 0.01 0.15 0.29 0.58 0.16 0.47 0.41 0.44 0.18 0.33 0.72 0.57 0.37 0.36 0.16 0.15 0.05 0.00 0.03 -0.05
Commodities DBC 0.43 0.35 0.42 0.49 -0.13 -0.22 0.09 -0.16 -0.11 0.00 0.51 0.14 0.44 0.23 0.35 0.14 0.30 0.37 0.46 0.37 0.94 0.48 0.47 0.16 -0.18 -0.03 0.12
Energy Cmdty DBE 0.40 0.33 0.39 0.39 -0.19 -0.27 0.02 -0.23 -0.15 -0.04 0.50 0.11 0.42 0.21 0.34 0.03 0.19 0.32 0.34 0.36 0.94 0.28 0.32 -0.02 -0.08 -0.11 0.03
Agriculture DBA 0.29 0.23 0.28 0.34 -0.06 -0.11 0.02 -0.03 -0.11 0.00 0.22 0.16 0.21 0.20 0.20 0.15 0.20 0.20 0.33 0.16 0.48 0.28 0.29 0.14 -0.22 0.02 0.20
Industrial Metals DBB 0.43 0.38 0.41 0.47 -0.11 -0.17 0.11 -0.12 -0.09 -0.05 0.32 0.07 0.31 0.22 0.35 0.14 0.24 0.18 0.32 0.15 0.47 0.32 0.29 0.12 -0.18 -0.10 0.17
Precious Metals DBP -0.11 -0.20 -0.06 0.12 0.48 0.50 0.47 0.40 0.44 0.40 0.03 0.06 -0.04 0.04 -0.18 0.63 0.57 0.24 0.42 0.05 0.16 -0.02 0.14 0.12 -0.50 0.59 0.39
Bull USD UUP 0.08 0.19 -0.02 -0.03 -0.30 -0.31 -0.32 -0.22 -0.27 -0.22 0.08 -0.09 0.13 0.04 0.17 -0.85 -0.72 -0.09 -0.37 0.00 -0.18 -0.08 -0.22 -0.18 -0.50 -0.58 -0.97
JPYUSD FXY -0.35 -0.41 -0.31 -0.13 0.57 0.58 0.47 0.50 0.52 0.46 -0.15 0.01 -0.22 -0.02 -0.34 0.74 0.52 0.13 0.25 0.03 -0.03 -0.11 0.02 -0.10 0.59 -0.58 0.45
EURUSD FXE -0.11 -0.20 0.00 -0.02 0.22 0.24 0.24 0.14 0.19 0.14 -0.11 0.07 -0.15 -0.08 -0.18 0.77 0.63 0.02 0.31 -0.05 0.12 0.03 0.20 0.17 0.39 -0.97 0.45
Source: Deutsche Bank, FactSet. Data as of the end of last month. Green cells denote highest correlations, while red cells denote lowest correlations.
Figure 23: 26W Rolling Correlation for selected asset class pairs (5Y)
-1
-0.8
-0.6
-0.4
-0.2
0
0.2
0.4
0.6
0.8
1
Apr-11 Apr-12 Apr-13 Apr-14 Apr-15 Apr-16 Apr-17
Global Equities - 26W Rolling Correlation
US Agg Bond IG Commodities Real Estate Bull USD Gold
0
0.1
0.2
0.3
0.4
0.5
0.6
0.7
0.8
0.9
1
Apr-11 Apr-12 Apr-13 Apr-14 Apr-15 Apr-16 Apr-17
US Equities - 26W Rolling Correlation
DM Intl EM Japan Pacific ex JP Europe
-1
-0.8
-0.6
-0.4
-0.2
0
0.2
0.4
0.6
0.8
1
Apr-11 Apr-12 Apr-13 Apr-14 Apr-15 Apr-16 Apr-17
US Fixed Income - 26W Rolling Correlation
US Treasury IG Corp HY Corp Sr Loans
Source: Deutsche Bank, FactSet. Correlations based on weekly total returns of US-listed ETFs: Global Equities (ACWI), US Agg Bond IG (AGG), Commodities (DBC), Real Estate (VNQ) and Gold (GLD). US Equity (VTI), DM Intl (EFA), EM (EEM), Japan (EWJ), Pacific ex JP (EPP), andEurope (VGK). US Fixed Income (AGG), US Treasury (GOVT), IG Corp (LQD), HY Corp (HYG), and Sr Loans (BKLN).
18
May 2
017
US
ETF C
om
pass
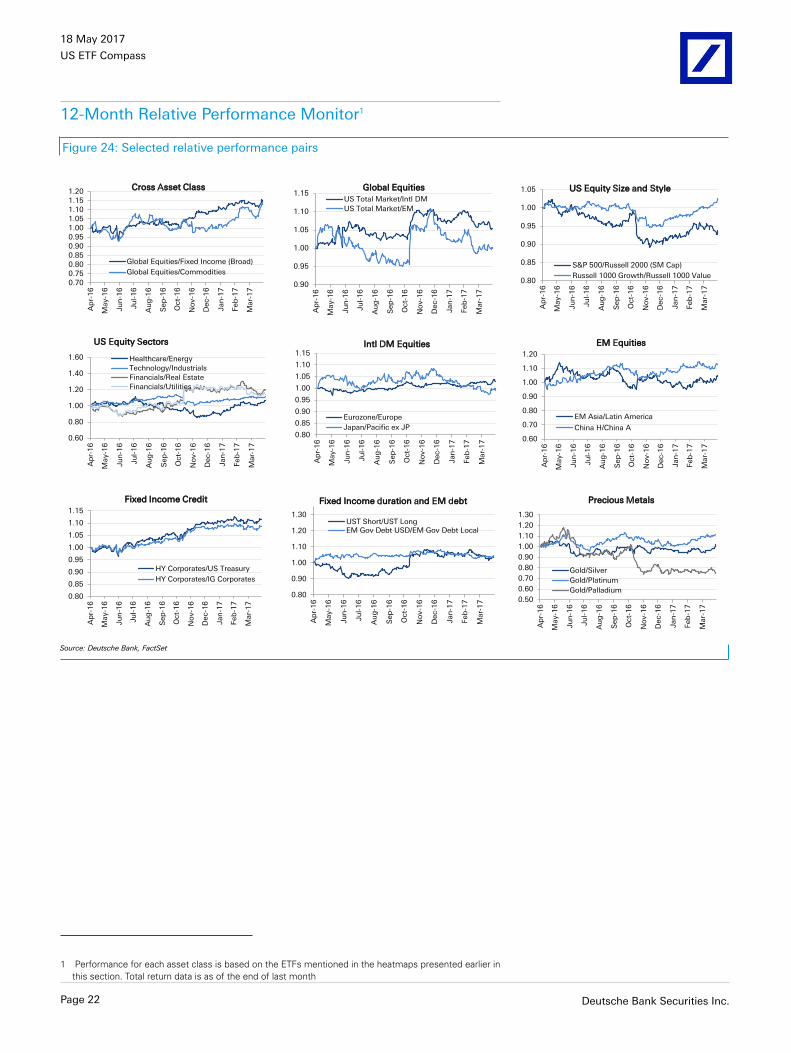
18 May 2017
US ETF Compass
12-Month Relative Performance Monitor1
Figure 24: Selected relative performance pairs
0.60
0.80
1.00
1.20
1.40
1.60
Ap
r-1
6
May-1
6
Ju
n-1
6
Ju
l-1
6
Au
g-1
6
Sep
-16
Oct-
16
No
v-1
6
Dec-1
6
Jan
-17
Feb
-17
Mar-
17
US Equity Sectors
Healthcare/Energy
Technology/Industrials
Financials/Real Estate
Financials/Utilities
0.90
0.95
1.00
1.05
1.10
1.15
Ap
r-1
6
May-1
6
Ju
n-1
6
Ju
l-1
6
Au
g-1
6
Sep
-16
Oct-
16
No
v-1
6
Dec-1
6
Jan
-17
Feb
-17
Mar-
17
Global Equities
US Total Market/Intl DM
US Total Market/EM
0.80
0.85
0.90
0.95
1.00
1.05
1.10
1.15
Ap
r-1
6
May-1
6
Ju
n-1
6
Ju
l-1
6
Au
g-1
6
Sep
-16
Oct-
16
No
v-1
6
Dec-1
6
Jan
-17
Feb
-17
Mar-
17
Intl DM Equities
Eurozone/Europe
Japan/Pacific ex JP
0.80
0.85
0.90
0.95
1.00
1.05
Ap
r-1
6
May-1
6
Ju
n-1
6
Ju
l-1
6
Au
g-1
6
Sep
-16
Oct-
16
No
v-1
6
Dec-1
6
Jan
-17
Feb
-17
Mar-
17
US Equity Size and Style
S&P 500/Russell 2000 (SM Cap)
Russell 1000 Growth/Russell 1000 Value
0.60
0.70
0.80
0.90
1.00
1.10
1.20
Ap
r-1
6
May-1
6
Ju
n-1
6
Ju
l-1
6
Au
g-1
6
Sep
-16
Oct-
16
No
v-1
6
Dec-1
6
Jan
-17
Feb
-17
Mar-
17
EM Equities
EM Asia/Latin America
China H/China A
0.70
0.75
0.80
0.85
0.90
0.95
1.00
1.05
1.10
1.15
1.20
Ap
r-1
6
May-1
6
Ju
n-1
6
Ju
l-1
6
Au
g-1
6
Sep
-16
Oct-
16
No
v-1
6
Dec-1
6
Jan
-17
Feb
-17
Mar-
17
Cross Asset Class
Global Equities/Fixed Income (Broad)
Global Equities/Commodities
0.80
0.85
0.90
0.95
1.00
1.05
1.10
1.15
Ap
r-1
6
May-1
6
Ju
n-1
6
Ju
l-1
6
Au
g-1
6
Sep
-16
Oct-
16
No
v-1
6
Dec-1
6
Jan
-17
Feb
-17
Mar-
17
Fixed Income Credit
HY Corporates/US Treasury
HY Corporates/IG Corporates
0.50
0.60
0.70
0.80
0.90
1.00
1.10
1.20
1.30
Ap
r-1
6
May-1
6
Ju
n-1
6
Ju
l-1
6
Au
g-1
6
Sep
-16
Oct-
16
No
v-1
6
Dec-1
6
Jan
-17
Feb
-17
Mar-
17
Precious Metals
Gold/Silver
Gold/Platinum
Gold/Palladium 0.80
0.90
1.00
1.10
1.20
1.30
Ap
r-1
6
May-1
6
Ju
n-1
6
Ju
l-1
6
Au
g-1
6
Sep
-16
Oct-
16
No
v-1
6
Dec-1
6
Jan
-17
Feb
-17
Mar-
17
Fixed Income duration and EM debt
UST Short/UST Long
EM Gov Debt USD/EM Gov Debt Local
Source: Deutsche Bank, FactSet
1 Performance for each asset class is based on the ETFs mentioned in the heatmaps presented earlier inthis section. Total return data is as of the end of last month
Page 22 Deutsche Bank Securities Inc.

18 May 2017
US ETF Compass
Business IntelligenceNew Listing
There were fifteen new ETFs and one new ETN listed during the previous month;nine were listed in the BATS; five in the NYSE Arca; while the remaining twoproducts were listed in the Nasdaq. The new funds offer exposure to Large-cap US equities, Mid-cap US equity stocks, Small-cap US companies, Large-cap US companies focused on value and momentum factors, Small-cap UScompanies focused on quality, high dividend-paying US equity stocks, Argentina,US Aggregate IG debt with maturity of 1-5 years, Global Aggregate debt, andMunicipal bonds that mature in 2023; actively managed exposure to US Large-cap equities covering tail risk, broad Global bonds; thematic exposure to UScompanies involved in ESG themes, US ETF industry; exposure to two multi-assettactical strategies, and one note offering exposure to a covered call strategy onoil crude prices.
Figure 25: Products listed during last month
Ticker NameAsset Class &
StructureListing Date TER
AUM
$MM
NUSA NuShares Enhanced Yield 1-5 Year US Aggregate Bond ETF Fixed Income ETF 3-Apr-17 0.20% 30
SPVM PowerShares S&P 500 Value with Momentum Portfolio Equity ETF 6-Apr-17 0.30% 3
XSHQ PowerShares S&P SmallCap Quality Portfolio Equity ETF 6-Apr-17 0.29% 3
TAIL Cambria Tail Risk ETF Equity ETF 6-Apr-17 0.59% 2
JPGB JPMorgan Global Bond Opportunities ETF Fixed Income ETF 7-Apr-17 0.55% 25
ERM EquityCompass Risk Manager ETF Multi Asset ETF 11-Apr-17 0.65% 2
TERM EquityCompass Tactical Risk Manager ETF Multi Asset ETF 11-Apr-17 0.65% 4
IBML iBonds Dec 2023 Term Muni Bond ETF Fixed Income ETF 13-Apr-17 0.18% 3
ICAN SerenityShares Impact ETF Equity ETF 13-Apr-17 0.50% 3
VSDA VictoryShares Dividend Accelerator ETF Equity ETF 18-Apr-17 0.35% 4
TETF ETF Industry Exposure & Financial Services ETF Equity ETF 20-Apr-17 0.64% 2
USOI Credit Suisse X-Links Crude Oil Shares Covered Call ETN Commodity ETN 26-Apr-17 0.85% 5
AGT iShares MSCI Argentina and Global Exposure ETF Equity ETF 27-Apr-17 0.59% 2
FLQL Franklin LibertyQ US Equity ETF Equity ETF 28-Apr-17 0.25% 4
FLQM Franklin LibertyQ US Mid Cap Equity ETF Equity ETF 28-Apr-17 0.30% 4
FLQS Franklin LibertyQ US Small Cap Equity ETF Equity ETF 28-Apr-17 0.35% 4
Source: Deutsche Bank, Bloomberg Finance LP.
Equity■ SerenityShares Investments made its debut in the ETF market listing
one new ETF during April. The fund (ICAN) offers exposure to UScompanies which businesses are supportive of ESG initiatives, including:sustainable water supply, education infrastructure, energy efficiency,green transportation, organic & healthy food, pollution control, andknowledge access; while, excluding companies involved in tobacco,weapons, oil, gas, and exploration. ICAN tracks the SPADE Impact Indexand comes with an annual expense ratio of 0.50%.
■ Victory Capital Management listed another ETF during April. The fund(VSDA) offers exposure to dividend-paying US Large- and Mid-cap equitystocks with a focus on those exhibiting high dividend growth. VSDAtracks the NADSAQ Victory Dividend Accelerator Index and comes withannual expense ratio of 0.35%.
Deutsche Bank Securities Inc. Page 23

18 May 2017
US ETF Compass
■ Franklin Templeton Investments listed three new ETFs during April. Thefunds are designed to provide exposure to US Large-cap (FLQL), Mid-cap (FLQM), and Small-cap (FLQS) companies. The new products trackFranklin Templeton indexes; while, stocks are selected and weightedbased on factors as quality, momentum, value, and low-volatility. FLQL,FLQM, and FLQS come with an annual expense ratio of 0.25%, 0.30%,and 0.35%, respectively.
■ PowerShares listed two new ETFs during last month. The first fund (SPVM)offers exposure to US Large-Cap companies in the S&P 500 universefocused on Value and Momentum factors. SPVM tracks the S&P 500High Momentum Value Index and comes with annual expense ratio of0.30%. The second one (XSHQ) offers exposure to US Small-cap equitiesin the S&P SmallCap 600 Quality Index. The stocks are selected viaquality scores based on three factors: return on equity, accruals ratio,and financial leveraged ratio. XSHQ comes with annual expense ratio of0.29%.
■ BlackRock listed one new ETF (AGT) during April, providing exposure toArgentina broad market. AGT tracks the MSCI All Argentina 25-50 Indexand comes with an annual expense ratio of 0.59%.
■ Cambria Funds listed one new ETF (TAIL), which offers actively managedexposure to the US Large-cap market while seeking to mitigate significantdownside risk. The fund invests a portion of its holdings in “out of themoney” put options on the S&P 500 Index, having the potential advantageof buying more puts if volatility is low and fewer puts if volatility is high.Meanwhile, a portion of the fund holds cash and US Treasury bonds. TAILcomes with annual expense ratio of 0.59%.
■ Exchange Traded Concepts listed one new ETF (TETF) which offersthematic exposure to the US ETF industry, including: ETF sponsors, indexproviders, exchanges, and traders. TETF tracks the Toroso ETF IndustryIndex and comes with annual expense ratio of 0.64%.
Fixed Income■ Nuveen listed one new fixed income ETF (NUSA) which offers exposure to
USD-denominated investment grade US bonds with maturity of 1-5 years.NUSA tracks the rules-based BofA Merrill Lynch Enhanced Yield 1-5 YearUS Broad Bond Index and comes with an annual expense ratio of 0.20%.
■ JPMorgan listed one new ETF (JPGB) offering actively managed exposureto a portfolio of Global bonds with broad maturity. JPGB invest in debtfrom developed and emerging markets around the world, and comes withannual expense ratio of 0.55%.
■ BlackRock listed one new fixed income ETF (IBML) which offers exposureto investment grade AMT-free municipal bonds with set maturity betweenJanuary and December 2023. IBML tracks the S&P AMT-Free MunicipalSeries Dec 2023 Index and comes with an annual expense ratio of 0.18%.
Commoditiy■ Credit Suisse listed one new ETN (USOI) which offers exposure to a
“covered call” strategy on USO shares. The oil futures-focused ETN tracksthe Credit Suisse Nasdaq WTI Crude Oil FLOWS 106 Index and comeswith an annual expense ratio of 0.85%.
Page 24 Deutsche Bank Securities Inc.

18 May 2017
US ETF Compass
Multi-Asset■ First Trust listed two new multi-asset ETFs during April. The funds (ERM/
TERM) offers actively managed exposure to US equity stocks, with theability of switching to cash and short-term debt during unfavorable marketconditions as a primary objective. In addition, TERM has been designedto provide short exposure to broad US market indexes to take advantageof downside risk. Both products come with an annual expense ratio of0.65%.
Delistings
Figure 26: Delisted products during last month
Ticker NameAsset Class &
Structure
Delisting
dateTER
AUM at
Delisting $MM
ILB PIMCO Global Advantage Inflation-Linked Bond Exchange-Traded FundFixed Income ETF 3-Apr-17 0.60% 82
DI PIMCO Diversified Income ETF Fixed Income ETF 3-Apr-17 0.85% 43
DIVI AdvisorShares Athena High Dividend ETF Equity ETF 4-Apr-17 0.99% 4
HAKD Direxion Daily Cyber Security & IT Bear 2X Shares Equity ETF 3-Apr-17 0.80% 1
PILS Direxion Daily Pharmaceutical & Medical Bear 2X Shares Equity ETF 3-Apr-17 0.80% 2
PILL Direxion Daily Pharmaceutical & Medical Bull 2X Shares Equity ETF 3-Apr-17 0.80% 1
Source: Deutsche Bank, Bloomberg Finance LP.
Deutsche Bank Securities Inc. Page 25
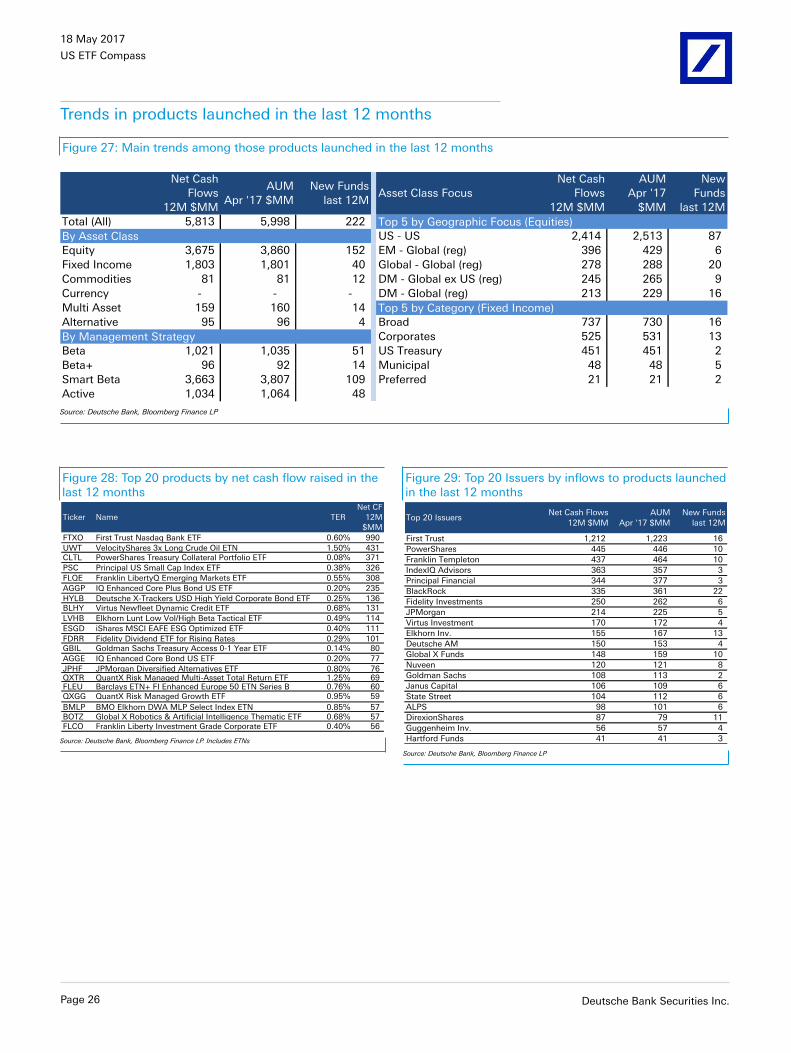
18 May 2017
US ETF Compass
Trends in products launched in the last 12 months
Figure 27: Main trends among those products launched in the last 12 months
Net Cash
Flows
12M $MM
AUM
Apr '17 $MM
New Funds
last 12MAsset Class Focus
Net Cash
Flows
12M $MM
AUM
Apr '17
$MM
New
Funds
last 12M
Total (All) 5,813 5,998 222 Top 5 by Geographic Focus (Equities)
By Asset Class US - US 2,414 2,513 87
Equity 3,675 3,860 152 EM - Global (reg) 396 429 6
Fixed Income 1,803 1,801 40 Global - Global (reg) 278 288 20
Commodities 81 81 12 DM - Global ex US (reg) 245 265 9
Currency - - - DM - Global (reg) 213 229 16
Multi Asset 159 160 14 Top 5 by Category (Fixed Income)
Alternative 95 96 4 Broad 737 730 16
By Management Strategy Corporates 525 531 13
Beta 1,021 1,035 51 US Treasury 451 451 2
Beta+ 96 92 14 Municipal 48 48 5
Smart Beta 3,663 3,807 109 Preferred 21 21 2
Active 1,034 1,064 48
Source: Deutsche Bank, Bloomberg Finance LP
Figure 28: Top 20 products by net cash flow raised in thelast 12 months
Ticker Name TER
Net CF
12M
$MM
FTXO First Trust Nasdaq Bank ETF 0.60% 990
UWT VelocityShares 3x Long Crude Oil ETN 1.50% 431 CLTL PowerShares Treasury Collateral Portfolio ETF 0.08% 371
PSC Principal US Small Cap Index ETF 0.38% 326
FLQE Franklin LibertyQ Emerging Markets ETF 0.55% 308
AGGP IQ Enhanced Core Plus Bond US ETF 0.20% 235
HYLB Deutsche X-Trackers USD High Yield Corporate Bond ETF 0.25% 136 BLHY Virtus Newfleet Dynamic Credit ETF 0.68% 131
LVHB Elkhorn Lunt Low Vol/High Beta Tactical ETF 0.49% 114
ESGD iShares MSCI EAFE ESG Optimized ETF 0.40% 111
FDRR Fidelity Dividend ETF for Rising Rates 0.29% 101 GBIL Goldman Sachs Treasury Access 0-1 Year ETF 0.14% 80
AGGE IQ Enhanced Core Bond US ETF 0.20% 77
JPHF JPMorgan Diversified Alternatives ETF 0.80% 76 QXTR QuantX Risk Managed Multi-Asset Total Return ETF 1.25% 69 FLEU Barclays ETN+ FI Enhanced Europe 50 ETN Series B 0.76% 60 QXGG QuantX Risk Managed Growth ETF 0.95% 59
BMLP BMO Elkhorn DWA MLP Select Index ETN 0.85% 57 BOTZ Global X Robotics & Artificial Intelligence Thematic ETF 0.68% 57 FLCO Franklin Liberty Investment Grade Corporate ETF 0.40% 56
Source: Deutsche Bank, Bloomberg Finance LP. Includes ETNs
Figure 29: Top 20 Issuers by inflows to products launchedin the last 12 months
Top 20 IssuersNet Cash Flows
12M $MM
AUM
Apr '17 $MM
New Funds
last 12M
First Trust 1,212 1,223 16
PowerShares 445 446 10
Franklin Templeton 437 464 10
IndexIQ Advisors 363 357 3
Principal Financial 344 377 3
BlackRock 335 361 22
Fidelity Investments 250 262 6
JPMorgan 214 225 5
Virtus Investment 170 172 4
Elkhorn Inv. 155 167 13
Deutsche AM 150 153 4
Global X Funds 148 159 10
Nuveen 120 121 8
Goldman Sachs 108 113 2
Janus Capital 106 109 6
State Street 104 112 6
ALPS 98 101 6
DirexionShares 87 79 11
Guggenheim Inv. 56 57 4
Hartford Funds 41 41 3
Source: Deutsche Bank, Bloomberg Finance LP
Page 26 Deutsche Bank Securities Inc.

18 May 2017
US ETF Compass
Popular Product Segments: Smart Beta & CurrencyHedged
Figure 30: Summary statistics for Smart Beta Equity ETFs
Smart Beta
(Equities)
Apr '17
$MM
YTD
$MM
Apr '17
$MM
MoM
Chg %
Mkt
Shr
Apr '17
$MM
MoM
Chg %
Mkt
Shr
Apr '17
All
Mkt
Shr
YTD
New
Dividend 639 3,349 16,140 -20% 16% 154,510 1% 25% 124 19% 2
Equal (37) 2,434 38,857 -26% 38% 43,835 0% 7% 78 12% 3
ESG 60 146 204 -32% 0% 3,503 4% 1% 28 4% 1
Fundamental 640 2,798 3,005 -26% 3% 26,548 3% 4% 56 9% 1
Low Risk 668 149 5,660 -28% 6% 42,407 3% 7% 56 9% 2
Multi-factor 820 1,913 4,641 -37% 5% 35,142 3% 6% 163 26% 5
Single-factor (73) 766 1,619 -27% 2% 15,376 1% 3% 49 8% 1
Style 2,460 12,696 31,198 -16% 31% 286,282 2% 47% 67 11% -
Other 27 109 73 -42% 0% 887 4% 0% 15 2% 1
Total 5,204 24,360 101,402 -23% 100% 608,503 2% 100% 637 100% 16
Net Cash Flows Turnover AUM # of Funds
Source: Deutsche Bank, Bloomberg Finance LP
Figure 31: Summary statistics for Currency-Hedged Equity ETFs
Currency Hedged
(Equities)
Apr '17
$MM
YTD
$MM
Apr '17
$MM
MoM
Chg %
Mkt
Shr
Apr '17
$MM
MoM
Chg %
Mkt
Shr
Apr '17
All
Mkt
Shr
YTD
New
Multiple 501 1,390 3,452 5% 30% 18,842 4% 46% 47 51% -
AUD - - 0 -12% 0% 8 1% 0% 2 2% -
BRL - - 0 26% 0% 4 0% 0% 1 1% -
CAD - - 0 -52% 0% 3 0% 0% 1 1% -
CHF - 0 0 -44% 0% 4 3% 0% 1 1% -
CNY - 1 0 36% 0% 4 -1% 0% 2 2% -
EUR 292 (573) 2,525 -9% 22% 10,912 6% 26% 15 16% -
GBP 2 17 13 -35% 0% 109 0% 0% 3 3% -
JPY (225) (152) 5,653 3% 49% 11,301 -1% 27% 16 17% -
KRW (3) (23) 5 -86% 0% 28 -7% 0% 2 2% -
MXN - (0) 0 -71% 0% 6 1% 0% 2 2% -
Total 568 661 11,650 0% 100% 41,222 3% 100% 92 100% -
Net Cash Flows Turnover AUM # of Funds
Source: Deutsche Bank, Bloomberg Finance LP
Figure 32: Top 10 Issuers in Equity Smart Beta
Top 10 Issuers
(Equity Smart Beta)
AUM
Apr '17
$MM
Net Cash
Flows
12M $MM
# of Funds
Apr '17
BlackRock 242,421 29,325 80
Vanguard 138,867 22,266 22
State Street 43,728 5,327 56
WisdomTree 41,096 (5,891) 57
PowerShares 36,508 2,379 87
First Trust 30,909 (327) 77
Guggenheim Inv. 21,716 2,683 30
Charles Schwab 21,669 7,083 9
FlexShares 5,505 1,115 16
ProShares 3,912 1,720 6
Source: Deutsche Bank, Bloomberg Finance LP
Figure 33: Top 10 Issuers in Equity Currency hedged
Top 10 Issuers
(Equity Currency Hedged)
AUM
Apr '17
$MM
Net Cash
Flows
12M $MM
# of Funds
Apr '17
WisdomTree 19,265 (7,612) 20
Deutsche AM 13,202 (5,399) 25
BlackRock 8,023 (248) 25
IndexIQ Advisors 318 147 3
First Trust 207 111 4
JPMorgan 70 15 2
FlexShares 62 26 2
State Street 28 5 2
O'Shares Investments 17 10 2
Franklin Templeton 10 10 1
Source: Deutsche Bank, Bloomberg Finance LP
Deutsche Bank Securities Inc. Page 27

18 May 2017
US ETF Compass
Average Performance by Products Type and Size (Equity)
1 Month Comparisons
Figure 34: US Equity ETFs - 1 Month Total Returns
BetaSmart
BetaActive All
Large Cap 1.1% 0.9% 0.4% 0.9%
Mid Cap 0.8% 0.7% 0.7%
Small Cap 1.1% 1.3% 0.4% 1.2%
Broad 1.1% 0.7% 1.3% 0.8%
All 1.1% 0.9% 0.9% 0.9%
US Equity, Broad sector,
non levered, 1M Total
Return by
Product Type
Siz
e
Source: Deutsche Bank, FactSet. Total Return corresponds to last month.
Figure 35: US Equity ETFs - # of Funds in 1M sample
BetaSmart
BetaActive All
Large Cap 19 90 8 117
Mid Cap 7 30 - 37
Small Cap 11 45 2 58
Broad 10 71 15 96
All 47 236 25 308
US Equity, Broad sector,
non levered, # of funds by
Product Type
Siz
e
Source: Deutsche Bank.
Figure 36: DM Equity ETFs - 1 Month Total Returns
BetaSmart
BetaActive All
Large Cap 2.3% 2.3% 2.3%
Mid Cap 3.1% 3.1%
Small Cap 4.0% 3.9% 3.9%
Broad 2.2% 2.1% 2.7% 2.1%
All 2.6% 2.3% 2.7% 2.4%
DM Equity, Broad sector,
regional, non levered, 1M
Total Return by
Product Type
Siz
e
Source: Deutsche Bank, FactSet. Total Return corresponds to last month.
Figure 37: DM Equity ETFs - # of Funds in 1M sample
BetaSmart
BetaActive All
Large Cap 6 9 - 15
Mid Cap - 2 - 2
Small Cap 8 7 - 15
Broad 27 75 5 107
All 41 93 5 139
DM Equity, Broad sector,
regional, non levered, # of
funds by
Product Type
Siz
e
Source: Deutsche Bank.
Figure 38: EM Equity ETFs - 1 Month Total Returns
BetaSmart
BetaActive All
Large Cap 1.1% 1.5% 1.4%
Mid Cap
Small Cap 1.3% 0.5% 0.9%
Broad 1.8% 1.2% 0.7% 1.4%
All 1.7% 1.2% 0.7% 1.4%
EM Equity, Broad sector,
regional, non levered, 1M
Total Return by
Product Type
Siz
e
Source: Deutsche Bank, FactSet. Total Return corresponds to last month.
Figure 39: EM Equity ETFs - # of Funds in 1M sample
BetaSmart
BetaActive All
Large Cap 2 3 - 5
Mid Cap - - - -
Small Cap 2 2 - 4
Broad 25 38 1 64
All 29 43 1 73
EM Equity, Broad sector,
regional, non levered, # of
funds by
Product Type
Siz
e
Source: Deutsche Bank.
Page 28 Deutsche Bank Securities Inc.

18 May 2017
US ETF Compass
1 Year Comparisons
Figure 40: US Equity ETFs - 1 Year Total Returns
BetaSmart
BetaActive All
Large Cap 18.8% 17.0% 15.6% 17.2%
Mid Cap 18.4% 18.4% 18.4%
Small Cap 24.1% 23.5% 11.9% 23.4%
Broad 20.3% 16.3% 17.3% 16.9%
All 20.3% 18.2% 16.3% 18.4%
Product Type
Siz
e
US Equity, Broad sector,
non levered, 1Y Total
Return by
Source: Deutsche Bank, FactSet. Total Return corresponds to last month.
Figure 41: US Equity ETFs - # of Funds in 1Y sample
BetaSmart
BetaActive All
Large Cap 19 84 7 110
Mid Cap 7 29 - 36
Small Cap 11 39 1 51
Broad 10 62 9 81
All 47 214 17 278
US Equity, Broad sector,
non levered, # of funds by
Product Type
Siz
e
Source: Deutsche Bank.
Figure 42: DM Equity ETFs - 1 Year Total Returns
BetaSmart
BetaActive All
Large Cap 13.9% 9.8% 11.6%
Mid Cap 14.5% 14.5%
Small Cap 17.0% 18.1% 17.5%
Broad 15.7% 11.8% 13.4% 12.9%
All 15.7% 12.2% 13.3%
DM Equity, Broad sector,
regional, non levered, 1Y
Total Return by
Product Type
Siz
e
Source: Deutsche Bank, FactSet. Total Return corresponds to last month.
Figure 43: DM Equity ETFs - # of Funds in 1Y sample
BetaSmart
BetaActive All
Large Cap 6 8 - 14
Mid Cap - 2 - 2
Small Cap 8 7 - 15
Broad 26 69 4 99
All 40 86 4 130
DM Equity, Broad sector,
regional, non levered, # of
funds by
Product Type
Siz
e
Source: Deutsche Bank.
Figure 44: EM Equity ETFs - 1 Year Total Returns
BetaSmart
BetaActive All
Large Cap 15.4% 13.4% 14.2%
Mid Cap
Small Cap 17.9% 24.0% 20.9%
Broad 15.6% 14.9% 15.2%
All 15.7% 15.3% 15.5%
EM Equity, Broad sector,
regional, non levered, 1Y
Total Return by
Product Type
Siz
e
Source: Deutsche Bank, FactSet. Total Return corresponds to last month.
Figure 45: EM Equity ETFs - # of Funds in 1Y sample
BetaSmart
BetaActive All
Large Cap 2 3 - 5
Mid Cap - - - -
Small Cap 2 2 - 4
Broad 25 34 - 59
All 29 39 - 68
EM Equity, Broad sector,
regional, non levered, # of
funds by
Product Type
Siz
e
Source: Deutsche Bank.
Deutsche Bank Securities Inc. Page 29
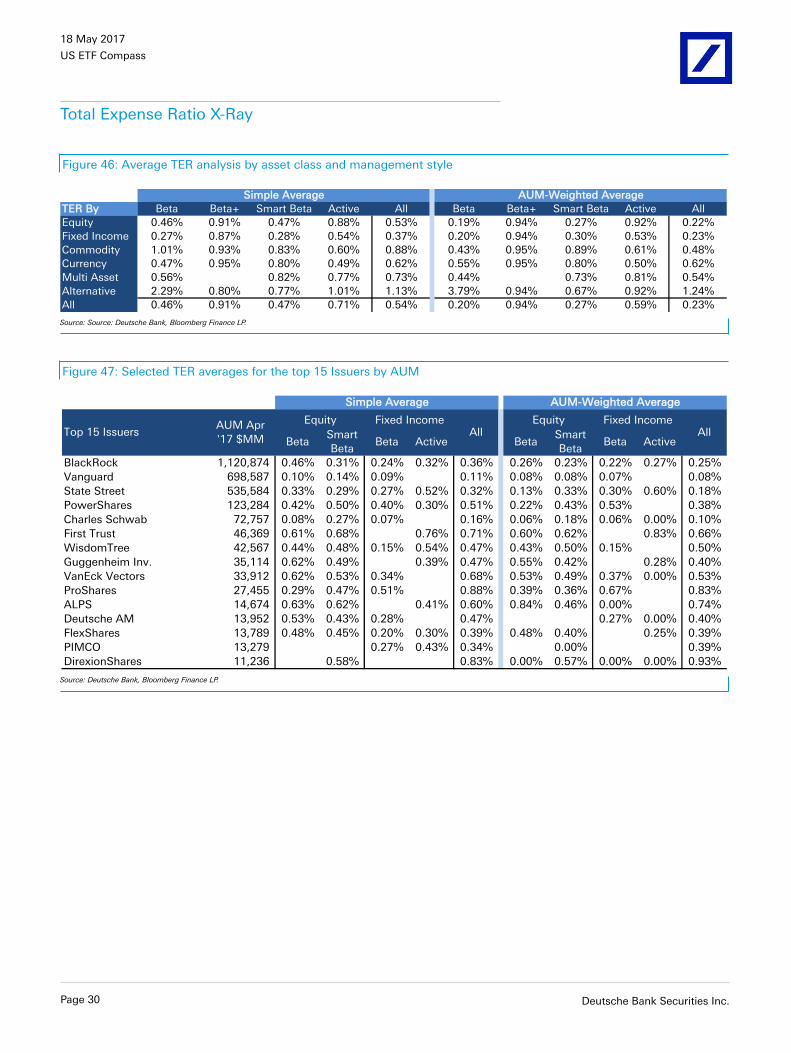
18 May 2017
US ETF Compass
Total Expense Ratio X-Ray
Figure 46: Average TER analysis by asset class and management style
TER By Beta Beta+ Smart Beta Active All Beta Beta+ Smart Beta Active All
Equity 0.46% 0.91% 0.47% 0.88% 0.53% 0.19% 0.94% 0.27% 0.92% 0.22%
Fixed Income 0.27% 0.87% 0.28% 0.54% 0.37% 0.20% 0.94% 0.30% 0.53% 0.23%
Commodity 1.01% 0.93% 0.83% 0.60% 0.88% 0.43% 0.95% 0.89% 0.61% 0.48%
Currency 0.47% 0.95% 0.80% 0.49% 0.62% 0.55% 0.95% 0.80% 0.50% 0.62%
Multi Asset 0.56% 0.82% 0.77% 0.73% 0.44% 0.73% 0.81% 0.54%
Alternative 2.29% 0.80% 0.77% 1.01% 1.13% 3.79% 0.94% 0.67% 0.92% 1.24%
All 0.46% 0.91% 0.47% 0.71% 0.54% 0.20% 0.94% 0.27% 0.59% 0.23%
Simple Average AUM-Weighted Average
Source: Source: Deutsche Bank, Bloomberg Finance LP.
Figure 47: Selected TER averages for the top 15 Issuers by AUM
BetaSmart
BetaBeta Active Beta
Smart
BetaBeta Active
BlackRock 1,120,874 0.46% 0.31% 0.24% 0.32% 0.36% 0.26% 0.23% 0.22% 0.27% 0.25%
Vanguard 698,587 0.10% 0.14% 0.09% 0.11% 0.08% 0.08% 0.07% 0.08%
State Street 535,584 0.33% 0.29% 0.27% 0.52% 0.32% 0.13% 0.33% 0.30% 0.60% 0.18%
PowerShares 123,284 0.42% 0.50% 0.40% 0.30% 0.51% 0.22% 0.43% 0.53% 0.38%
Charles Schwab 72,757 0.08% 0.27% 0.07% 0.16% 0.06% 0.18% 0.06% 0.00% 0.10%
First Trust 46,369 0.61% 0.68% 0.76% 0.71% 0.60% 0.62% 0.83% 0.66%
WisdomTree 42,567 0.44% 0.48% 0.15% 0.54% 0.47% 0.43% 0.50% 0.15% 0.50%
Guggenheim Inv. 35,114 0.62% 0.49% 0.39% 0.47% 0.55% 0.42% 0.28% 0.40%
VanEck Vectors 33,912 0.62% 0.53% 0.34% 0.68% 0.53% 0.49% 0.37% 0.00% 0.53%
ProShares 27,455 0.29% 0.47% 0.51% 0.88% 0.39% 0.36% 0.67% 0.83%
ALPS 14,674 0.63% 0.62% 0.41% 0.60% 0.84% 0.46% 0.00% 0.74%
Deutsche AM 13,952 0.53% 0.43% 0.28% 0.47% 0.27% 0.00% 0.40%
FlexShares 13,789 0.48% 0.45% 0.20% 0.30% 0.39% 0.48% 0.40% 0.25% 0.39%
PIMCO 13,279 0.27% 0.43% 0.34% 0.00% 0.39%
DirexionShares 11,236 0.58% 0.83% 0.00% 0.57% 0.00% 0.00% 0.93%
AllEquity Fixed IncomeAUM Apr
'17 $MMTop 15 Issuers
Equity Fixed IncomeAll
Simple Average AUM-Weighted Average
Source: Deutsche Bank, Bloomberg Finance LP.
Page 30 Deutsche Bank Securities Inc.

18 May 2017
US ETF Compass
ETF StatisticsGlobal ETF Assets and Provider Ranking
Figure 48: Historical Growth of Global ETP Asset*
'07 '08 '09 '10 '11 '12 '13 '14 '15 '16 '17*
Asia Pacific ($) 62 53 67 84 91 136 169 202 284 314 356
Europe ($) 132 145 244 309 297 368 416 459 506 570 653
US ($) 612 535 783 997 1,046 1,333 1,678 1,979 2,113 2,533 2,848
US, Europe & Asia Pacific ($) 804 733 1,094 1,390 1,435 1,838 2,262 2,640 2,904 3,417 3,857
Europe (€) 90 104 170 231 229 279 302 379 466 541 600
Number of ETPs** 1,213 1,666 2,041 2,580 3,124 3,492 3,711 4,019 4,454 4,737 4,863
0
1,000
2,000
3,000
4,000
5,000
6,000
0
500
1,000
1,500
2,000
2,500
3,000
3,500
4,000
4,500
Nu
mb
er
of
ET
Ps
AU
M $
billio
n
Source: Deutsche Bank, Bloomberg Finance LP. *These figures don't include the ETF markets in the Americas ex US and in the Middle East and Africa regions. data as of the end of last month.
Figure 49: Top 10 Global ETP Provider Ranking and Summary Statics
IssuerCurrent
AUM
Mkt.
Share2016 AUM
2016 Mkt.
Share
Current
Month CF
Current
Month TOYTD CF
BlackRock 1,430,103 37.1% 1,262,390 36.9% 678 24,279 416,282 88,472
Vanguard 730,922 19.0% 639,873 18.7% 112 9,595 77,733 51,434
State Street 577,025 15.0% 538,567 15.8% 268 -5,297 586,989 7,213
PowerShares 125,871 3.3% 112,834 3.3% 166 760 62,933 4,468
Nomura Asset Management 95,108 2.5% 79,904 2.3% 51 -271 23,933 10,364
Deutsche AM 80,353 2.1% 72,241 2.1% 245 858 7,208 2,802
Charles Schwab 72,757 1.9% 59,750 1.7% 21 2,689 7,805 9,452
Lyxor 63,798 1.7% 53,664 1.6% 224 895 10,356 5,471
First Trust 46,644 1.2% 41,230 1.2% 129 722 6,633 2,966
Nikko Asset Management 43,731 1.1% 35,341 1.0% 28 15 421 6,227
Total Top 10 3,266,313 84.7% 2,895,793 84.7% 1,922 34,245 1,200,293 188,870
Others 590,266 15.3% 521,616 15.3% 2,941 -1,334 334,771 31,702
Global Total 3,856,579 100.0% 3,417,409 100.0% 4,863 32,911 1,535,064 220,572
Source: Deutsche Bank, Bloomberg Finance LP, FactSet. data as of the end of last month.
Deutsche Bank Securities Inc. Page 31

18 May 2017
US ETF Compass
US Historical ETF Trends
Figure 50: Annual ETP historical growth in AUM and # offunds
-
200
400
600
800
1,000
1,200
1,400
1,600
1,800
2,000
- 200 400 600 800
1,000 1,200 1,400 1,600 1,800 2,000 2,200 2,400 2,600 2,800 3,000
2007 2008 2009 2010 2011 2012 2013 2014 2015 2016 2017*
Nu
mb
er
of
ET
Ps
AU
M $
billio
n
Others
Fixed Income
Equity
# Funds
Source: Deutsche Bank, Bloomberg Finance LP. ETPs include ETFs and ETVs; ETVs represent about 2%of ETP assets and track mostly non-Equity and non-Fixed Income exposures. *YTD data as of the endof last month.
Figure 51: Monthly ETF Volume $ growth vs. VIX and ETFVolume
0%
10%
20%
30%
40%
50%
60%
70%
-
500
1,000
1,500
2,000
2,500
3,000
3,500
Jan
-05
Au
g-0
5
Mar-
06
Oct-
06
May-0
7
Dec-0
7
Ju
l-0
8
Feb
-09
Sep
-09
Ap
r-1
0
No
v-1
0
Ju
n-1
1
Jan
-12
Au
g-1
2
Mar-
13
Oct-
13
May-1
4
Dec-1
4
Ju
l-1
5
Feb
-16
Sep
-16
Ap
r-1
7
ET
F t
rad
ing
as %
of
all U
S C
ash
E
qu
ity t
rad
ing
an
d V
IX L
evel (
en
d o
f m
on
th)
Mo
nth
ly E
TF T
urn
over
$b
illio
n ETF Turnover ETF % Cash Eqty VIX
Source: Deutsche Bank, Bloomberg Finance LP. ETF Turnover excludes ETVs and ETNs. Data as of theend of last month.
Figure 52: Net Cash Flows and AUM historicalcomparison between Mutual Funds and ETFs*
0%
2%
4%
6%
8%
10%
12%
14%
16%
18%
20%
-300,000
-200,000
-100,000
0
100,000
200,000
300,000
400,000
500,000
ET
F A
UM
as %
of
Mu
tual Fu
nd
AU
M
Net
Cash
Flo
ws $
millio
n
MF CF ETF CF ETF/MF % AUM
Source: Deutsche Bank, ICI, Bloomberg Finance LP. *Data as of the end of March 2017. Mutual Fundsonly include Long Term Mutual Funds.
Figure 53: Net Cash Flows and AUM historicalcomparison between Active and Passive mgmt style*
0%
10%
20%
30%
40%
50%
60%
-500,000
-400,000
-300,000
-200,000
-100,000
0
100,000
200,000
300,000
400,000
500,000
600,000
Passiv
e A
UM
as %
of
Acti
ve A
UM
Net
Cash
Flo
ws $
millio
n
Active MF+ETF Passive MF+ETF
Passive / Active %
Source: Deutsche Bank, ICI, Bloomberg Finance LP. *Data as of the end of March 2017. Mutual Fundsonly include Long Term Mutual Funds.
Page 32 Deutsche Bank Securities Inc.

18 May 2017
US ETF Compass
ETF Issuer and Index Provider league tables
Figure 54: ETP Issuer league table (excludes ETN assets)
Top 50 Issuers TotalMkt
Shr EquityFixed
IncomeCmdty Other
Apr '17
$MM
YTD
$MMApr '17
$MM
Mkt
Shr Apr '17YTD
New
BlackRock 1,120,874 39.4% 849,491 253,191 15,332 2,859 24,801 77,936 387,212 29.5% 337 3
Vanguard 698,587 24.5% 574,454 124,133 - - 9,712 50,039 74,533 5.7% 70 0
State Street 535,584 18.8% 456,054 44,356 34,764 411 (5,234) 5,178 578,090 44.0% 150 1
PowerShares 123,284 4.3% 90,414 26,431 4,556 1,883 820 4,504 62,738 4.8% 150 7
Charles Schwab 72,757 2.6% 64,482 8,276 - - 2,689 9,452 7,805 0.6% 21 0
First Trust 46,369 1.6% 38,853 5,947 121 1,448 720 2,932 6,597 0.5% 117 3
WisdomTree 42,567 1.5% 41,151 599 179 638 (108) (208) 8,943 0.7% 88 1
Guggenheim Inv. 35,114 1.2% 24,106 9,397 - 1,611 212 2,125 5,811 0.4% 76 0
VanEck Vectors 33,912 1.2% 23,905 9,695 130 183 (990) 3,102 55,673 4.2% 60 1
ProShares 27,455 1.0% 19,761 3,854 1,470 2,370 101 1,262 55,415 4.2% 144 2
ALPS 14,674 0.5% 14,302 340 - 32 152 1,502 2,217 0.2% 24 1
Deutsche AM 13,952 0.5% 13,723 229 - - 97 (78) 2,759 0.2% 40 0
FlexShares 13,789 0.5% 10,742 3,047 - - 309 1,611 859 0.1% 25 0
PIMCO 13,279 0.5% - 13,279 - - 157 547 2,716 0.2% 12 0
DirexionShares 11,236 0.4% 10,645 576 15 - 159 773 49,809 3.8% 80 3
Fidelity Investments 6,394 0.2% 5,993 401 - - 147 911 1,048 0.1% 21 0
Global X Funds 4,842 0.2% 4,575 237 - 31 108 877 840 0.1% 57 2
US Commodity Funds 4,120 0.1% 6 - 4,114 - (132) (33) 6,380 0.5% 13 0
Goldman Sachs 3,935 0.1% 3,854 80 - - 692 945 467 0.0% 7 0
ETC 2,696 0.1% 1,894 521 - 281 71 376 258 0.0% 19 1
ETF Securities 2,435 0.1% - - 2,435 - 11 84 287 0.0% 8 3
IndexIQ Advisors 2,342 0.1% 646 357 - 1,339 (30) 60 334 0.0% 20 1
OppenheimerFunds 2,085 0.1% 2,085 - - - 87 467 219 0.0% 7 0
JPMorgan 1,540 0.1% 1,406 56 - 78 86 311 164 0.0% 12 1
Victory Capital Mgt. 1,394 0.0% 1,394 - - - 116 431 170 0.0% 12 1
ETFMG 1,182 0.0% 1,163 20 - - 4 210 202 0.0% 13 0
Columbia Mgmt 1,091 0.0% 1,078 13 - - 20 24 113 0.0% 14 0
AdvisorShares Trust 1,084 0.0% 451 570 33 31 (9) 2 137 0.0% 21 0
Millington Securities 1,005 0.0% 569 - - 436 (18) (67) 63 0.0% 12 0
Pacer Advisors 919 0.0% 919 - - - 35 129 79 0.0% 6 0
Virtus Investment 889 0.0% 514 353 - 22 41 295 187 0.0% 11 2
John Hancock Inv. 786 0.0% 786 - - - 35 84 44 0.0% 12 0
Principal Financial 675 0.0% 391 - - 283 111 113 4 0.0% 6 0
Franklin Templeton 628 0.0% 408 221 - - 1 64 27 0.0% 11 4
Highland Capital 516 0.0% - 516 - - 32 41 71 0.0% 1 0
O'Shares Investments 488 0.0% 488 - - - 6 49 66 0.0% 7 1
KraneShares 407 0.0% 397 10 - - 36 97 128 0.0% 5 0
Cambria Funds 407 0.0% 303 10 - 94 (7) 55 42 0.0% 9 1
Blue Sky Asset Management 186 0.0% 97 - - 89 1 185 4 0.0% 5 5
Hartford Funds 184 0.0% 148 35 - - 12 69 20 0.0% 7 2
Empowered Funds 183 0.0% 183 - - - - 36 8 0.0% 4 0
Elkhorn Inv. 167 0.0% 140 16 11 - 7 27 19 0.0% 13 0
Legg Mason 165 0.0% 165 - - - 12 29 31 0.0% 6 0
Horizons Management 159 0.0% 159 - - - 5 9 16 0.0% 5 0
ArrowShares 154 0.0% 4 38 - 112 36 42 42 0.0% 4 1
Teucrium Trading 152 0.0% - - 152 - 8 (0) 50 0.0% 5 0
Janus Capital 134 0.0% 84 50 - - 15 52 34 0.0% 8 0
Nuveen 121 0.0% 44 77 - - 25 31 19 0.0% 8 1
Davis Advisors 117 0.0% 117 - - - 18 115 20 0.0% 3 3
ARK Inv. Mgmt 107 0.0% 107 - - - 11 27 30 0.0% 5 0Other 615 0.0% 561 - - 54 31 147 87 0.0% 39 7
Total 2,847,735 100% 2,263,209 506,929 63,311 14,286 35,218 166,972 1,312,890 100% 1,810 58
Assets Under Management Apr '17 $MM Net Cash Flows Turnover # of Funds
Source: Deutsche Bank, Bloomberg Finance LP, FactSet. Data as of the end of last month.
Deutsche Bank Securities Inc. Page 33

18 May 2017
US ETF Compass
Figure 55: Index Provider league table (excludes ETN assets)
Turnover
Top 20 Index Providers TotalMkt
Shr EquityFixed
IncomeCmdty Other
Apr '17
$MM
YTD
$MMApr '17
$MM
Mkt
Shr Apr '17YTD
New
S&P Dow Jones 1,002,574 35.2% 955,360 41,294 2,044 3,876 5,645 44,172 677,664 51.6% 401 7
FTSE Russell 417,453 14.7% 416,251 1,163 - 39 8,457 20,656 155,905 11.9% 136 1
MSCI 409,357 14.4% 409,357 - - - 8,236 32,895 148,493 11.3% 250 2
Bloomberg Barclays 294,710 10.3% - 294,710 - - 4,407 25,879 40,216 3.1% 104 -
CRSP 215,201 7.6% 215,201 - - - 1,624 11,923 15,455 1.2% 13 -
Nasdaq OMX 100,605 3.5% 99,492 214 - 899 519 2,998 69,126 5.3% 61 1
Markit iBoxx 57,322 2.0% - 57,322 - - 1,266 5,312 23,647 1.8% 14 -
Commodity - Physical 55,278 1.9% - - 55,278 - 919 1,522 32,333 2.5% 20 -
WisdomTree 41,218 1.4% 41,151 20 - 46 (159) (221) 8,686 0.7% 69 1
ICE 37,835 1.3% - 37,835 - - 1,421 3,488 28,024 2.1% 7 1
Active 33,793 1.2% 4,316 26,534 1,002 1,942 779 3,958 4,546 0.3% 174 24
NYSE Euronext 25,346 0.9% 24,746 568 - 32 (1,205) (1,232) 44,490 3.4% 40 -
Morningstar 23,466 0.8% 22,788 346 - 331 348 1,944 2,066 0.2% 27 -
J.P. Morgan 14,215 0.5% - 14,202 - 14 1,076 3,373 4,614 0.4% 4 -
BofA Merrill Lynch 13,544 0.5% 161 13,346 - 36 487 938 2,827 0.2% 23 1
Market Vectors 13,288 0.5% 12,937 168 - 183 (611) 1,807 36,507 2.8% 32 -
Alerian 10,765 0.4% 10,765 - - - 16 928 1,721 0.1% 2 -
Deutsche Bank 9,260 0.3% - 4,504 3,968 788 83 (129) 2,677 0.2% 15 -
Accretive AM 8,324 0.3% 3 8,321 - - 141 1,125 821 0.1% 19 -
Other 64,181 2.3% 50,681 6,381 1,019 6,099 1,767 5,634 13,075 44.4% 399 20
Total 2,847,735 100% 2,263,209 506,929 63,311 14,286 35,218 166,972 1,312,890 100% 1,810 58
Assets Under Management Apr '17 $MM Net Cash Flows # of Funds
Source: Deutsche Bank, Bloomberg Finance LP, FactSet. Data as of the end of last month.
Page 34 Deutsche Bank Securities Inc.

18 May 2017
US ETF Compass
Monthly Snapshot
Figure 56: ETP Summary Statistics by Asset Class
Asset ClassApr '17
$MM
YTD
$MMApr '17
$MM
MoM
Chg %
Mkt
ShrApr '17 $MM
MoM
Chg %
Mkt
ShrApr '17
All
Mkt
Shr
YTD
New
Equity 23,535 119,031 1,138,538 -22% 87% 2,263,209 2% 79% 1,330 73% 28
Fixed Income 10,660 46,563 111,904 -29% 9% 506,929 3% 18% 310 17% 12
Commodities 747 1,231 37,840 -8% 3% 63,311 2% 2% 59 3% 7
Currency 42 (271) 2,717 -30% 0% 2,855 1% 0% 22 1% -
Multi Asset 99 (76) 533 -27% 0% 7,223 2% 0% 50 3% 11
Alternative 135 494 21,357 1% 2% 4,208 5% 0% 39 2% -
Total 35,218 166,972 1,312,890 -22% 100% 2,847,735 2.3% 100% 1,810 100% 58
# of FundsAUMTurnover Net Cash Flows
Source: Deutsche Bank, Bloomberg Finance LP, FactSet. Data as of the end of last month.
Figure 57: ETP Summary Statistics by Management Style (Active-Passive)
Passive-->ActiveApr '17
$MM
YTD
$MMApr '17
$MM
MoM
Chg %
Mkt
ShrApr '17 $MM
MoM
Chg %
Mkt
ShrApr '17
All
Mkt
Shr
YTD
New
Beta 28,922 135,553 1,099,547 -22% 84% 2,149,752 2% 75% 693 38% 11
Beta+ 128 1,381 103,991 -19% 8% 33,054 -1% 1% 193 11% 4
Smart Beta 5,419 26,213 104,826 -23% 8% 631,186 2% 22% 753 42% 21
Active 749 3,825 4,525 -27% 0% 33,743 2% 1% 171 9% 22
Total 35,218 166,972 1,312,890 -22% 100% 2,847,735 2.3% 100% 1,810 100% 58
# of FundsTurnover AUMNet Cash Flows
Source: Deutsche Bank, Bloomberg Finance LP, FactSet. Data as of the end of last month.
Figure 58: ETP Summary Statistics by Product Type
Product TypeApr '17
$MM
YTD
$MMApr '17
$MM
MoM
Chg %
Mkt
ShrApr '17 $MM
MoM
Chg %
Mkt
ShrApr '17
All
Mkt
Shr
YTD
New
Asset Allocation 19,297 82,608 149,642 -20% 11% 989,843 3% 35% 1,514 84% 54
Cash Management 19,266 74,988 194,123 -23% 15% 1,120,468 3% 39% 64 4% -
Pseudo Futures (3,473) 7,996 865,136 -22% 66% 704,376 0% 25% 41 2% -
Leveraged & Inverse 127.8 1,380 103,988 -19% 8% 33,049 -1% 1% 191 11% 4
Total 35,218 166,972 1,312,890 -22% 100% 2,847,735 2.3% 100% 1,810 100% 58
# of FundsTurnover AUMNet Cash Flows
Source: Deutsche Bank, Bloomberg Finance LP, FactSet. Data as of the end of last month.
Deutsche Bank Securities Inc. Page 35
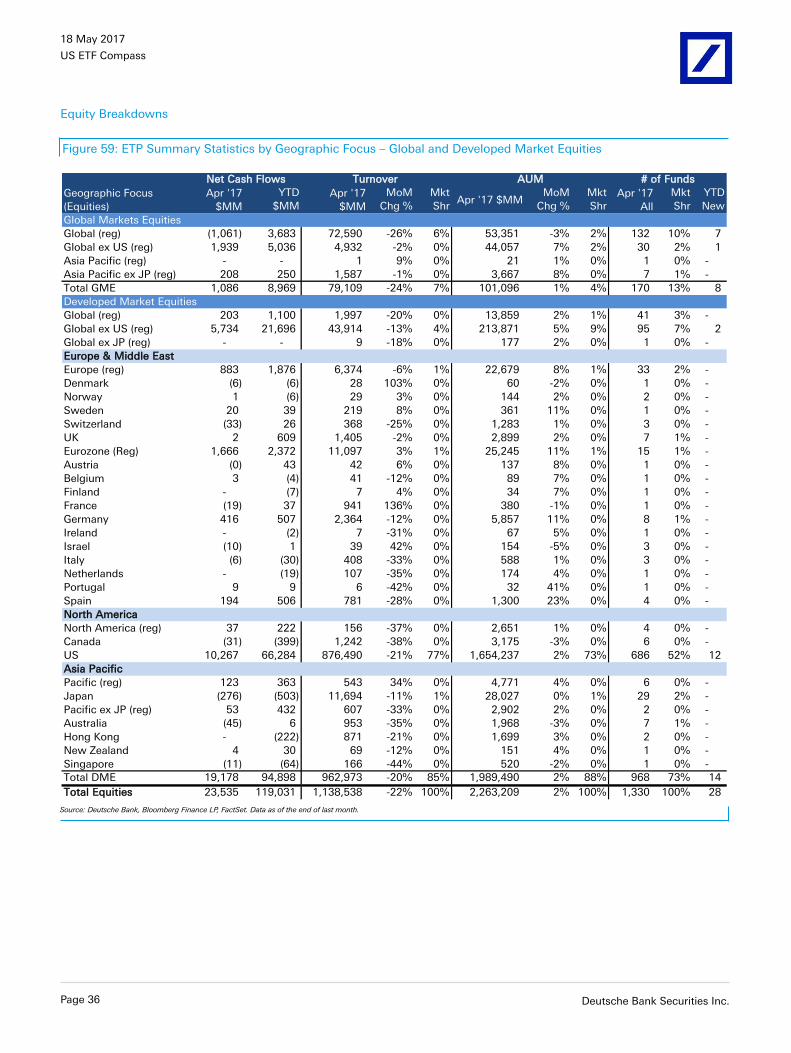
18 May 2017
US ETF Compass
Equity Breakdowns
Figure 59: ETP Summary Statistics by Geographic Focus – Global and Developed Market Equities
Geographic Focus
(Equities)
Apr '17
$MM
YTD
$MMApr '17
$MM
MoM
Chg %
Mkt
ShrApr '17 $MM
MoM
Chg %
Mkt
ShrApr '17
All
Mkt
Shr
YTD
New
Global Markets Equities
Global (reg) (1,061) 3,683 72,590 -26% 6% 53,351 -3% 2% 132 10% 7
Global ex US (reg) 1,939 5,036 4,932 -2% 0% 44,057 7% 2% 30 2% 1
Asia Pacific (reg) - - 1 9% 0% 21 1% 0% 1 0% -
Asia Pacific ex JP (reg) 208 250 1,587 -1% 0% 3,667 8% 0% 7 1% -
Total GME 1,086 8,969 79,109 -24% 7% 101,096 1% 4% 170 13% 8
Developed Market Equities
Global (reg) 203 1,100 1,997 -20% 0% 13,859 2% 1% 41 3% -
Global ex US (reg) 5,734 21,696 43,914 -13% 4% 213,871 5% 9% 95 7% 2
Global ex JP (reg) - - 9 -18% 0% 177 2% 0% 1 0% -
Europe & Middle East
Europe (reg) 883 1,876 6,374 -6% 1% 22,679 8% 1% 33 2% -
Denmark (6) (6) 28 103% 0% 60 -2% 0% 1 0% -
Norway 1 (6) 29 3% 0% 144 2% 0% 2 0% -
Sweden 20 39 219 8% 0% 361 11% 0% 1 0% -
Switzerland (33) 26 368 -25% 0% 1,283 1% 0% 3 0% -
UK 2 609 1,405 -2% 0% 2,899 2% 0% 7 1% -
Eurozone (Reg) 1,666 2,372 11,097 3% 1% 25,245 11% 1% 15 1% -
Austria (0) 43 42 6% 0% 137 8% 0% 1 0% -
Belgium 3 (4) 41 -12% 0% 89 7% 0% 1 0% -
Finland - (7) 7 4% 0% 34 7% 0% 1 0% -
France (19) 37 941 136% 0% 380 -1% 0% 1 0% -
Germany 416 507 2,364 -12% 0% 5,857 11% 0% 8 1% -
Ireland - (2) 7 -31% 0% 67 5% 0% 1 0% -
Israel (10) 1 39 42% 0% 154 -5% 0% 3 0% -
Italy (6) (30) 408 -33% 0% 588 1% 0% 3 0% -
Netherlands - (19) 107 -35% 0% 174 4% 0% 1 0% -
Portugal 9 9 6 -42% 0% 32 41% 0% 1 0% -
Spain 194 506 781 -28% 0% 1,300 23% 0% 4 0% -
North America
North America (reg) 37 222 156 -37% 0% 2,651 1% 0% 4 0% -
Canada (31) (399) 1,242 -38% 0% 3,175 -3% 0% 6 0% -
US 10,267 66,284 876,490 -21% 77% 1,654,237 2% 73% 686 52% 12
Asia Pacific
Pacific (reg) 123 363 543 34% 0% 4,771 4% 0% 6 0% -
Japan (276) (503) 11,694 -11% 1% 28,027 0% 1% 29 2% -
Pacific ex JP (reg) 53 432 607 -33% 0% 2,902 2% 0% 2 0% -
Australia (45) 6 953 -35% 0% 1,968 -3% 0% 7 1% -
Hong Kong - (222) 871 -21% 0% 1,699 3% 0% 2 0% -
New Zealand 4 30 69 -12% 0% 151 4% 0% 1 0% -
Singapore (11) (64) 166 -44% 0% 520 -2% 0% 1 0% -
Total DME 19,178 94,898 962,973 -20% 85% 1,989,490 2% 88% 968 73% 14
Total Equities 23,535 119,031 1,138,538 -22% 100% 2,263,209 2% 100% 1,330 100% 28
# of FundsNet Cash Flows Turnover AUM
Source: Deutsche Bank, Bloomberg Finance LP, FactSet. Data as of the end of last month.
Page 36 Deutsche Bank Securities Inc.

18 May 2017
US ETF Compass
Figure 60: ETP Summary Statistics by Geographic Focus – Emerging Market Equities
Geographic Focus
(Equities)
Apr '17
$MM
YTD
$MMApr '17
$MM
MoM
Chg %
Mkt
ShrApr '17 $MM
MoM
Chg %
Mkt
ShrApr '17
All
Mkt
Shr
YTD
New
Emerging Market Equities
Global (reg) 3,087 13,701 53,203 -38% 5% 130,853 4% 6% 66 5% -
BRIC (reg) 93 132 168 339% 0% 386 34% 0% 2 0% -
Asia
Asia (reg) 19 201 81 -22% 0% 905 4% 0% 4 0% -
China 107 (278) 12,304 -27% 1% 7,400 3% 0% 27 2% -
China A 10 48 372 7% 0% 751 0% 0% 12 1% -
India 234 608 3,531 -22% 0% 8,438 5% 0% 10 1% -
Indonesia 18 (2) 396 -19% 0% 620 6% 0% 2 0% -
Malaysia 18 95 339 -31% 0% 375 9% 0% 1 0% -
Philippines 20 32 150 -6% 0% 191 18% 0% 1 0% -
South Korea (152) (181) 2,854 -16% 0% 3,203 -4% 0% 6 0% -
Taiwan 59 244 2,725 -18% 0% 3,360 4% 0% 2 0% -
Thailand (4) 34 243 -32% 0% 430 -1% 0% 1 0% -
Europe
Europe (reg) - 11 5 -40% 0% 51 5% 0% 1 0% -
Poland 9 33 110 -38% 0% 304 14% 0% 2 0% -
Russia (66) (89) 4,270 -19% 0% 3,240 -1% 0% 6 0% -
Turkey (46) (2) 303 -4% 0% 404 -1% 0% 1 0% -
Greece (1) 1 57 23% 0% 295 7% 0% 1 0% -
Middle East & Africa
ME & Africa (reg) - (3) 1 39% 0% 28 3% 0% 1 0% -
Middle East (reg) - (2) 1 -67% 0% 18 0% 0% 1 0% -
Africa (reg) - (1) 4 -11% 0% 68 1% 0% 1 0% -
Egypt (1) 8 15 -22% 0% 52 -6% 0% 1 0% -
South Africa 5 (6) 473 -32% 0% 430 7% 0% 1 0% -
Qatar (1) (3) 6 170% 0% 45 -4% 0% 1 0% -
UAE (1) (3) 2 91% 0% 42 -1% 0% 1 0% -
Latin America
Latin America (reg) 124 183 938 -33% 0% 1,415 8% 0% 7 1% -
Brazil (7) 887 10,317 -25% 1% 5,936 0% 0% 10 1% -
Chile 18 42 403 8% 0% 488 3% 0% 1 0% -
Colombia 1 12 27 -21% 0% 118 0% 0% 2 0% -
Mexico (265) (745) 2,893 -26% 0% 1,306 -16% 0% 5 0% -
Peru (25) (2) 80 -42% 0% 214 -12% 0% 1 0% -
Frontier Markets
Frontier (reg) - 39 81 -38% 0% 656 1% 0% 3 0% -
Argentina 10 39 38 -12% 0% 147 9% 0% 2 0% 1
Nigeria - 12 8 -19% 0% 41 5% 0% 1 0% -
Pakistan - 21 9 -33% 0% 33 3% 0% 1 0% -
Saudi Arabia 2 2 2 -29% 0% 9 40% 0% 1 0% -
Vietnam (1) 11 40 -30% 0% 291 0% 0% 1 0% -
Total EME 3,266 15,083 96,450 -32% 8% 172,542 4% 8% 187 14% 1
Total Equities 23,535 119,031 1,138,538 -22% 100% 2,263,209 2% 100% 1,330 100% 28
# of FundsNet Cash Flows Turnover AUM
Source: Deutsche Bank, Bloomberg Finance LP, FactSet. Data as of the end of last month.
Deutsche Bank Securities Inc. Page 37

18 May 2017
US ETF Compass
Figure 61: ETP Summary Statistics by Size and Market – Equities
Market Cap Segment
(Equities)
Apr '17
$MM
YTD
$MM
Apr '17
$MM
MoM
Chg %
Mkt
ShrApr '17 $MM
MoM
Chg %
Mkt
Shr
Apr '17
All
Mkt
Shr
YTD
New
US Equities
Large Cap 5,897 30,640 629,066 -20% 55% 847,611 2% 37% 185 14% 4
Mid Cap (232) 7,881 20,758 -13% 2% 150,354 1% 7% 56 4% 1
Small Cap 1,513 8,787 110,505 -19% 10% 156,629 2% 7% 84 6% 2
Broad 3,089 18,980 116,161 -27% 10% 499,638 1% 22% 360 27% 5
Total US Equities 10,267 66,287 876,490 -21% 77% 1,654,231 2% 73% 685 52% 12
DM Intl Equities
Large Cap 583 1,157 3,842 44% 0% 8,173 10% 0% 24 2% 1
Mid Cap - 16 27 -40% 0% 369 3% 0% 2 0% -
Small Cap 88 1,004 1,736 -7% 0% 13,863 5% 1% 22 2% -
Broad 8,242 26,478 80,880 -13% 7% 312,890 5% 14% 236 18% 3
Total DM Intl Equities 8,912 28,655 86,485 -11% 8% 335,295 5% 15% 284 21% 4
EM Equities
Large Cap 123 245 10,816 -27% 1% 5,676 3% 0% 15 1% -
Mid Cap - - 0 -81% 0% 4 0% 0% 1 0% -
Small Cap 193 242 602 3% 0% 2,786 10% 0% 13 1% -
Broad 2,950 14,596 85,032 -33% 7% 164,075 4% 7% 158 12% 1
Total EM Equities 3,266 15,083 96,450 -32% 8% 172,542 4% 8% 187 14% 1
Total Equities 23,535 119,031 1,138,538 -22% 100% 2,263,209 2% 100% 1,330 100% 28
# of FundsNet Cash Flows Turnover AUM
Source: Deutsche Bank, Bloomberg Finance LP, FactSet. Data as of the end of last month.
Figure 62: ETP Summary Statistics by Style and Market – Equities
Style
(Equities)
Apr '17
$MM
YTD
$MMApr '17
$MM
MoM
Chg %
Mkt
ShrApr '17 $MM
MoM
Chg %
Mkt
ShrApr '17
All
Mkt
Shr
YTD
New
US Equities
Growth 1,797 4,452 13,770 -11% 1% 136,918 3% 6% 40 3% -
Value 627 8,089 17,407 -17% 2% 146,220 0% 6% 45 3% 1
Dividend 630 2,663 8,602 -28% 1% 121,085 1% 5% 55 4% 1
Blend 7,213 51,083 836,711 -21% 73% 1,250,009 1% 55% 545 41% 10
Total US Equities 10,267 66,287 876,490 -21% 77% 1,654,231 2% 73% 685 52% 12
DM Intl Equities
Growth 55 (28) 198 -24% 0% 2,685 5% 0% 1 0% -
Value - 207 304 -66% 0% 4,904 2% 0% 1 0% -
Dividend (59) 449 7,388 -5% 1% 31,008 2% 1% 49 4% 1
Blend 8,920 28,067 78,599 -11% 7% 296,737 6% 13% 236 18% 6
Total DM Intl Equities 8,916 28,695 86,489 -11% 8% 335,335 5% 15% 287 22% 7
EM Equities
Dividend 60 213 338 -43% 0% 3,709 2% 0% 15 1% -
Blend 3,206 14,870 96,112 -32% 8% 168,833 4% 7% 172 13% 1
Total EM Equities 3,266 15,083 96,450 -32% 8% 172,542 4% 8% 187 14% 1
Total Equities 23,535 119,031 1,138,538 -22% 100% 2,263,209 2% 100% 1,330 100% 28
# of FundsNet Cash Flows Turnover AUM
Source: Deutsche Bank, Bloomberg Finance LP, FactSet. Data as of the end of last month.
Page 38 Deutsche Bank Securities Inc.
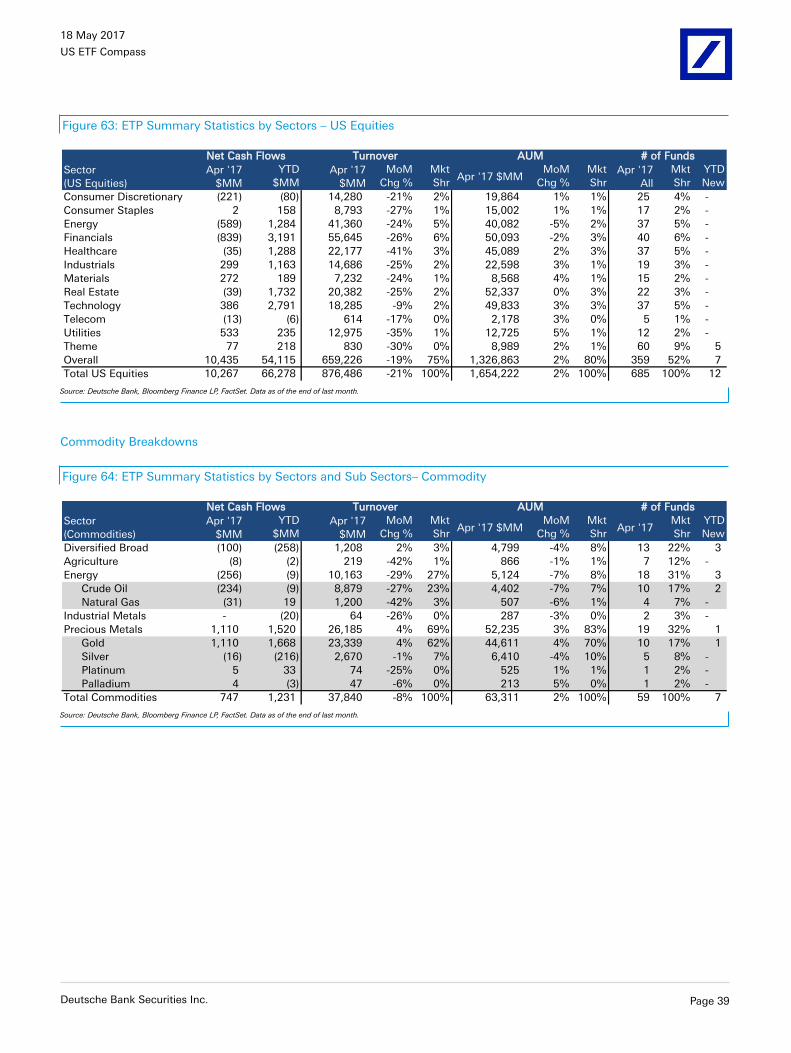
18 May 2017
US ETF Compass
Figure 63: ETP Summary Statistics by Sectors – US Equities
Sector
(US Equities)
Apr '17
$MM
YTD
$MMApr '17
$MM
MoM
Chg %
Mkt
ShrApr '17 $MM
MoM
Chg %
Mkt
ShrApr '17
All
Mkt
Shr
YTD
New
Consumer Discretionary (221) (80) 14,280 -21% 2% 19,864 1% 1% 25 4% -
Consumer Staples 2 158 8,793 -27% 1% 15,002 1% 1% 17 2% -
Energy (589) 1,284 41,360 -24% 5% 40,082 -5% 2% 37 5% -
Financials (839) 3,191 55,645 -26% 6% 50,093 -2% 3% 40 6% -
Healthcare (35) 1,288 22,177 -41% 3% 45,089 2% 3% 37 5% -
Industrials 299 1,163 14,686 -25% 2% 22,598 3% 1% 19 3% -
Materials 272 189 7,232 -24% 1% 8,568 4% 1% 15 2% -
Real Estate (39) 1,732 20,382 -25% 2% 52,337 0% 3% 22 3% -
Technology 386 2,791 18,285 -9% 2% 49,833 3% 3% 37 5% -
Telecom (13) (6) 614 -17% 0% 2,178 3% 0% 5 1% -
Utilities 533 235 12,975 -35% 1% 12,725 5% 1% 12 2% -
Theme 77 218 830 -30% 0% 8,989 2% 1% 60 9% 5
Overall 10,435 54,115 659,226 -19% 75% 1,326,863 2% 80% 359 52% 7
Total US Equities 10,267 66,278 876,486 -21% 100% 1,654,222 2% 100% 685 100% 12
# of FundsNet Cash Flows Turnover AUM
Source: Deutsche Bank, Bloomberg Finance LP, FactSet. Data as of the end of last month.
Commodity Breakdowns
Figure 64: ETP Summary Statistics by Sectors and Sub Sectors– Commodity
Sector
(Commodities)
Apr '17
$MM
YTD
$MMApr '17
$MM
MoM
Chg %
Mkt
ShrApr '17 $MM
MoM
Chg %
Mkt
ShrApr '17
Mkt
Shr
YTD
New
Diversified Broad (100) (258) 1,208 2% 3% 4,799 -4% 8% 13 22% 3
Agriculture (8) (2) 219 -42% 1% 866 -1% 1% 7 12% -
Energy (256) (9) 10,163 -29% 27% 5,124 -7% 8% 18 31% 3
Crude Oil (234) (9) 8,879 -27% 23% 4,402 -7% 7% 10 17% 2
Natural Gas (31) 19 1,200 -42% 3% 507 -6% 1% 4 7% -
Industrial Metals - (20) 64 -26% 0% 287 -3% 0% 2 3% -
Precious Metals 1,110 1,520 26,185 4% 69% 52,235 3% 83% 19 32% 1
Gold 1,110 1,668 23,339 4% 62% 44,611 4% 70% 10 17% 1
Silver (16) (216) 2,670 -1% 7% 6,410 -4% 10% 5 8% -
Platinum 5 33 74 -25% 0% 525 1% 1% 1 2% -
Palladium 4 (3) 47 -6% 0% 213 5% 0% 1 2% -
Total Commodities 747 1,231 37,840 -8% 100% 63,311 2% 100% 59 100% 7
# of FundsNet Cash Flows Turnover AUM
Source: Deutsche Bank, Bloomberg Finance LP, FactSet. Data as of the end of last month.
Deutsche Bank Securities Inc. Page 39

18 May 2017
US ETF Compass
Fixed Income Breakdowns
Figure 65: ETP Summary Statistics by Category – Fixed Income
Categories
(Fixed Income)
Apr '17
$MM
YTD
$MMApr '17
$MM
MoM
Chg %
Mkt
ShrApr '17 $MM
MoM
Chg %
Mkt
ShrApr '17
All
Mkt
Shr
YTD
New
Broad 2,007 10,976 14,843 -28% 13% 148,009 2% 29% 59 19% 6
Convertible 66 418 607 -24% 1% 3,790 3% 1% 3 1% -
Corporates 3,229 15,064 41,097 -42% 37% 156,631 3% 31% 97 31% 2
EM debt 1,230 3,920 5,955 -25% 5% 21,023 7% 4% 23 7% -
Inflation 28 2,957 4,186 -25% 4% 35,458 0% 7% 14 5% -
International 161 (239) 683 30% 1% 2,748 8% 1% 11 4% -
Municipal 621 1,344 3,822 -6% 3% 26,479 3% 5% 37 12% 2
Preferred 666 1,352 2,893 -19% 3% 28,690 3% 6% 11 4% 1
Securitized 272 2,163 2,106 -1% 2% 16,137 2% 3% 9 3% -
Senior Loans 562 2,414 2,348 -34% 2% 12,678 5% 3% 4 1% -
US Treasury 1,819 6,193 33,364 -14% 30% 55,286 4% 11% 41 13% 1
Total Fixed Income 10,660 46,563 111,904 -29% 100% 506,928 3% 100% 309 100% 12
# of FundsNet Cash Flows Turnover AUM
Source: Deutsche Bank, Bloomberg Finance LP, FactSet. Data as of the end of last month.
Figure 66: ETP Summary Statistics by Credit Quality – Fixed Income
Credit Quality
(Fixed Income)
Apr '17
$MM
YTD
$MMApr '17
$MM
MoM
Chg %
Mkt
ShrApr '17 $MM
MoM
Chg %
Mkt
ShrApr '17
All
Mkt
Shr
YTD
New
Investment Grade 7,011 37,043 74,735 -20% 67% 385,468 2% 76% 205 66% 8
High Yield 1,780 3,954 27,726 -47% 25% 63,469 3% 13% 52 17% 1
Mixed 1,869 5,567 9,442 -25% 8% 57,992 4% 11% 53 17% 3
Total Fixed Income 10,660 46,563 111,904 -29% 100% 506,929 3% 100% 310 100% 12
# of FundsNet Cash Flows Turnover AUM
Source: Deutsche Bank, Bloomberg Finance LP, FactSet. Data as of the end of last month.
Figure 67: ETP Summary Statistics by Duration – Fixed Income
Duration
(Fixed Income)
Apr '17
$MM
YTD
$MMApr '17
$MM
MoM
Chg %
Mkt
ShrApr '17 $MM
MoM
Chg %
Mkt
ShrApr '17
All
Mkt
Shr
YTD
New
Short 2,159 14,795 18,400 -28% 16% 130,406 2% 26% 79 25% 3
Intermediate 2,145 6,939 32,164 -41% 29% 100,010 3% 20% 41 13% -
Long 1,279 2,538 24,222 -14% 22% 21,037 7% 4% 29 9% -
Broad 4,836 20,367 35,948 -25% 32% 243,592 3% 48% 120 39% 8
Set Maturity 240 1,924 1,170 -33% 1% 11,882 2% 2% 41 13% 1
Total Fixed Income 10,660 46,563 111,904 -29% 100% 506,929 3% 100% 310 100% 12
# of FundsNet Cash Flows Turnover AUM
Source: Deutsche Bank, Bloomberg Finance LP, FactSet. Data as of the end of last month.
Page 40 Deutsche Bank Securities Inc.

18 May 2017
US ETF Compass
Top 15 ETFs (includes ETNs)
Figure 68: Top 15 by 1M Total Return Gain (non-levered)
Ticker Name TERTotal
Return
TUR iShares MSCI Turkey ETF 0.62% 11.1%
EPOL iShares MSCI Poland Capped ETF 0.62% 10.1%
LSTK iPath Pure Beta Livestock ETN 0.75% 8.9%
PLND VanEck Vectors Poland ETF 0.60% 8.9%
SCIF VanEck Vectors India Small-Cap Index ETF 0.85% 8.6%
COW iPath Dow Jones-UBS Livestock Subindex Total 0.75% 8.5%
EWO iShares MSCI Austria Capped ETF 0.48% 7.8%
SLIM The Obesity ETF 0.50% 7.7%
GREK Global X MSCI Greece 20 ETF 0.65% 7.7%
ARKQ ARK Industrial Innovation ETF 0.95% 7.4%
EWUS iShares MSCI United Kingdom Small-Cap ETF 0.59% 7.4%
EDEN iShares MSCI Denmark Capped ETF 0.53% 7.4%
EFNL iShares MSCI Finland Capped ETF 0.53% 7.3%
SCIN Columbia India Small Cap ETF 0.85% 7.2%
SOCL Global X Social Media ETF 0.65% 7.1%
Source: Deutsche Bank, FactSet. Total Return corresponds to last month.
Figure 69: Top 15 by 1M Total Return Loss (non-levered)
Ticker Name TERTotal
Return
NIB iPath Dow Jones-UBS Cocoa Subindex Total Return 0.75% -14.5%
URA Global X Uranium ETF 0.69% -14.3%
PSCE PowerShares S&P SmallCap Energy Portfolio 0.29% -12.5%
CHOC iPath Pure Beta Cocoa ETN 0.75% -12.4%
XES SPDR S&P Oil & Gas Equipment & Services ETF 0.35% -11.6%
AGF DB Agriculture Long ETN 0.75% -11.1%
GDXJ VanEck Vectors Junior Gold Miners ETF 0.54% -10.4%
VMAX REX VolMAXX Long VIX Weekly Futures Strategy ETF 0.95% -10.1%
UGA United States Gasoline Fund 0.75% -9.8%
OIH VanEck Vectors Oil Services ETF 0.35% -9.5%
IEZ iShares U.S. Oil Equipment & Services ETF 0.43% -9.4%
XE Elkhorn S&P MidCap Energy Portfolio 0.29% -8.8%
PXJ PowerShares Dynamic Oil & Gas Services Portfolio 0.62% -8.4%
NINI iPath Pure Beta Nickel ETN 0.75% -7.4%
GOEX Global X Gold Explorers ETF 0.65% -7.3%
Source: Deutsche Bank, FactSet. Total Return corresponds to last month.
Figure 70: Top 15 by 1M Inflows
Ticker Name TERInflows
$MM
IVV iShares Core S&P 500 ETF 0.04% 6,243
IEFA iShares Core MSCI EAFE ETF 0.08% 2,213
IWM iShares Russell 2000 ETF 0.20% 1,804
VEA Vanguard FTSE Developed Markets ETF 0.07% 1,553
VOO Vanguard S&P 500 ETF 0.04% 1,506
IEMG iShares Core MSCI Emerging Markets ETF 0.14% 1,215
EZU iShares MSCI Eurozone ETF 0.48% 998
VWO Vanguard FTSE Emerging Markets ETF 0.14% 954
TLT iShares 20+ Year Treasury Bond ETF 0.15% 905
GLD SPDR Gold Shares 0.40% 870
IXUS iShares Core MSCI Total International Stock ETF 0.11% 839
EMB iShares J.P. Morgan USD Emerging Markets Bond 0.40% 785
SCHF Schwab International Equity ETF 0.07% 707
IWD iShares Russell 1000 Value ETF 0.20% 656
IVW iShares S&P 500 Growth ETF 0.18% 613
Source: Deutsche Bank, Bloomberg Finance LP. Inflows correspond to last month.
Figure 71: Top 15 by 1M Outflows
Ticker Name TEROutflows
$MM
SPY SPDR S&P 500 ETF 0.09% (5,504)
GDX VanEck Vectors Gold Miners ETF 0.52% (1,066)
XLF Financial Select Sector SPDR Fund 0.14% (753)
GDXJ VanEck Vectors Junior Gold Miners ETF 0.54% (548)
MDY SPDR S&P MidCap 400 ETF 0.25% (541)
VNQ Vanguard REIT ETF 0.12% (425)
XLE Energy Select Sector SPDR Fund 0.14% (316)
BIL SPDR Bloomberg Barclays 1-3 Month T-Bill ETF 0.14% (306)
IJJ iShares S&P Mid-Cap 400 Value ETF 0.25% (301)
DXJ WisdomTree Japan Hedged Equity Fund 0.48% (279)
EWW iShares MSCI Mexico Capped ETF 0.48% (263)
IBB iShares Nasdaq Biotechnology ETF 0.47% (231) IJT iShares S&P Small-Cap 600 Growth ETF 0.25% (211)
IJR iShares Core S&P Small-Cap ETF 0.07% (203)
IJS iShares S&P Small-Cap 600 Value ETF 0.25% (197)
Source: Deutsche Bank, Bloomberg Finance LP. Outflows correspond to last month.
Figure 72: Top 15 by AUM
Ticker Name TERAUM
$MM
SPY SPDR S&P 500 ETF 0.09% 236,832
IVV iShares Core S&P 500 ETF 0.04% 109,144
VTI Vanguard Total Stock Market ETF 0.04% 77,415
EFA iShares MSCI EAFE ETF 0.33% 69,413
VOO Vanguard S&P 500 ETF 0.04% 65,934
VWO Vanguard FTSE Emerging Markets ETF 0.14% 52,684
VEA Vanguard FTSE Developed Markets ETF 0.07% 50,254
QQQ PowerShares QQQ 0.20% 49,226
AGG iShares Core U.S. Aggregate Bond ETF 0.05% 44,206
IWM iShares Russell 2000 ETF 0.20% 40,239
IJH iShares Core S&P Mid-Cap ETF 0.07% 39,732
IWD iShares Russell 1000 Value ETF 0.20% 37,093
IWF iShares Russell 1000 Growth ETF 0.20% 35,356
GLD SPDR Gold Shares 0.40% 34,736
VNQ Vanguard REIT ETF 0.12% 33,893
Source: Deutsche Bank, Bloomberg Finance LP. AUM as of the end of last month.
Figure 73: Top 15 by $ Volume traded last month
Ticker Name TERVolume
$MM
SPY SPDR S&P 500 ETF 0.09% 364,930
IWM iShares Russell 2000 ETF 0.20% 80,386
QQQ PowerShares QQQ 0.20% 51,524
XLF Financial Select Sector SPDR Fund 0.14% 36,492
EEM iShares MSCI Emerging Markets ETF 0.69% 35,423
GDX VanEck Vectors Gold Miners ETF 0.52% 28,498
EFA iShares MSCI EAFE ETF 0.33% 24,034
GLD SPDR Gold Shares 0.40% 21,338
TLT iShares 20+ Year Treasury Bond ETF 0.15% 19,790
XIV VelocityShares Daily Inverse VIX Short-Term ETN 1.35% 19,661
VXX iPath S&P 500 VIX Short-Term Futures ETN 0.89% 19,569
XLE Energy Select Sector SPDR Fund 0.14% 19,520
IVV iShares Core S&P 500 ETF 0.04% 16,154
HYG iShares iBoxx $ High Yield Corporate Bond ETF 0.50% 15,343
GDXJ VanEck Vectors Junior Gold Miners ETF 0.54% 14,255
Source: Deutsche Bank, Bloomberg Finance LP. Volume $ corresponds to total traded last month.
Deutsche Bank Securities Inc. Page 41

18 May 2017
US ETF Compass
Appendix A: ETN Snapshot
Figure 74: ETN Summary by Asset Class
Asset Class Apr-17End of
%Chg Apr-17 Mar-17 YTDYTD Chg %
AUMApr-17 Mar-17 %Chg Apr-17
End of %Chg AUM Turnover
# of
ETNsEquity 14,767 13,649 8.2% 114 65 132 1.0% 1,180 2,007 -41.2% 53 55 -3.6% 64.4% 2.2% 27.5%Fixed income 121 131 -7.7% (0) 1 1 1.1% 18 38 -51.5% 11 11 0.0% 0.5% 0.0% 5.7%Commodity 5,015 4,673 7.3% (59) (60) 564 12.1% 9,484 12,295 -22.9% 94 90 4.4% 21.9% 17.4% 48.7%Currency 46 64 -28.3% (4) (0) (15) -22.8% 19 30 -37.4% 11 11 0.0% 0.2% 0.0% 5.7%Multi Asset 372 455 -18.3% (31) (98) (119) -26.0% 143 220 -34.9% 5 5 0.0% 1.6% 0.3% 2.6%Alternative 2,605 2,687 -3.0% 115 (111) 350 13.0% 43,750 40,203 8.8% 19 19 0.0% 11.4% 80.1% 9.8%Total 22,927 21,660 5.9% 134 (203) 914 4.2% 54,594 54,793 -0.4% 193 191 1.0% 100.0% 100.0% 100.0%
AUM ($ MM) Cash Flow ($ MM) Turnover ($ MM) # of ETNs Market Share %
Source: Deutsche Bank, Bloomberg Finance LP, FactSet. Data as of the end of last month.
Figure 75: ETN Summary by Issuer
Issuer Mar-17End of
%Chg Apr-17 Mar-17 YTDYTD Chg %
AUMApr-17 Mar-17 %Chg Mar-17
End of %Chg AUM Turn-over
# of
ETNs
Barclays Bank 6,542 6,833 -4.3% (13) (320) 204 3.0% 20,499 20,733 -1.1% 83 82 1.2% 28.5% 37.5% 43.0%UBS 7,184 6,528 10.1% 129 31 195 3.0% 620 709 -12.6% 44 42 4.8% 31.3% 1.1% 22.8%Credit Suisse 3,724 3,105 19.9% 69 (72) 300 9.7% 29,485 27,704 6.4% 25 24 4.2% 16.2% 54.0% 13.0%JPMorgan 3,794 3,758 0.9% - - - 0.0% 626 1,308 -52.1% 1 1 0.0% 16.5% 1.1% 0.5%Citigroup 738 409 80.4% (43) 173 280 68.5% 3,247 4,199 -22.7% 5 5 0.0% 3.2% 5.9% 2.6%Deutsche Bank 333 315 5.7% (0) (2) (11) -3.6% 82 89 -8.4% 20 20 0.0% 1.5% 0.1% 10.4%Swedish Export CC 362 396 -8.6% (5) (12) (21) -5.3% 28 39 -29.5% 7 7 0.0% 1.6% 0.1% 3.6%Goldman Sachs 111 122 -8.4% - - - 0.0% 0 1 -73.0% 1 1 0.0% 0.5% 0.0% 0.5%Morgan Stanley 47 64 -27.7% - - - 0.0% 0 1 -68.4% 1 1 0.0% 0.2% 0.0% 0.5%BMO Capital Markets 52 52 -0.6% - - - 0.0% 0 0 -77.7% 1 1 0.0% 0.2% 0.0% 0.5%VanEck Vectors 32 50 -34.9% (3) - (13) -27.0% 7 8 -18.6% 4 4 0.0% 0.1% 0.0% 2.1%Guggenheim 8 8 5.0% - - - 0.0% 0 0 -59.4% 1 1 0.0% 0.0% 0.0% 0.5%RBC GAM - 20 -100.0% - - (20) -102.2% - - n.a. 0 2 -100.0% 0.0% 0.0% 0.0%Total 22,927 21,660 5.9% 134 (203) 914 4.2% 54,594 54,793 -0.4% 193 191 1.0% 100.0% 100.0% 100.0%
AUM ($ MM) Cash Flow ($ MM) Turnover ($ MM) # of ETNs Market Share %
Source: Deutsche Bank, Bloomberg Finance LP, FactSet. Data as of the end of last month.
Page 42 Deutsche Bank Securities Inc.

18 May 2017
US ETF Compass
Appendix B: ETF ListFigure 76: Global and US Equities Reference list
5-Day $ 5-Day bps
Global Equities ACWI iShares MSCI ACWI ETF CM 28-Mar-08 0.33% 6,696 99 25 124 0.01 1.6
US Total Market VTI Vanguard Total Stock Market ETF CM 31-May-01 0.04% 78,047 271 4,866 5,137 0.01 0.9
S&P 500 (Large Cap) SPY SPDR S&P 500 ETF PF 29-Jan-93 0.09% 232,316 17,841 9,784 27,625 0.01 0.4
DJI DIA SPDR Dow Jones Industrial Average ETF PF 14-Jan-98 0.17% 16,159 532 1,058 1,590 0.01 0.6
NASDAQ-100 QQQ PowerShares QQQ PF 10-Mar-99 0.20% 50,987 2,761 3,240 6,001 0.01 0.7
Russell 1000 Growth IWF iShares Russell 1000 Growth ETF PF 22-May-00 0.20% 35,565 174 1,180 1,354 0.01 0.9
Russell 1000 Value IWD iShares Russell 1000 Value ETF PF 22-May-00 0.20% 36,955 268 5,577 5,845 0.01 0.9
S&P 400 (Mid Cap) MDY SPDR S&P MidCap 400 ETF PF 4-May-95 0.25% 18,920 362 1,030 1,392 0.04 1.1
Russell 2000 (SM Cap) IWM iShares Russell 2000 ETF PF 22-May-00 0.20% 38,298 3,764 320 4,084 0.01 0.8
Div. Growth VIG Vanguard Dividend Appreciation ETF CM 27-Apr-06 0.09% 23,967 56 736 792 0.01 1.5
Div. Yield DVY iShares Select Dividend ETF CM 7-Nov-03 0.39% 17,127 51 940 991 0.01 1.3
Div. Yield VYM Vanguard High Dividend Yield ETF CM 16-Nov-06 0.08% 17,789 54 3,823 3,878 0.01 1.5
Div. Yield & Growth SDY SPDR S&P Dividend ETF CM 15-Nov-05 0.35% 15,408 50 355 405 0.02 1.8
Cons. Discretionary XLY Consumer Discretionary Select Sector SPDR Fund PF 22-Dec-98 0.14% 12,944 388 1,958 2,346 0.01 1.1
Hotels, Rest & Leisure PEJ PowerShares Dynamic Leisure and Entertainment Portf AA 23-Jun-05 0.63% 125 1 21 22 0.06 15.3
Home Builders XHB SPDR S&P Homebuilders ETF PF 2-Feb-06 0.35% 1,088 44 284 328 0.01 2.7
Household Durables ITB iShares U.S. Home Construction ETF CM 5-May-06 0.43% 1,502 90 51 141 0.01 3.2
Media PBS PowerShares Dynamic Media Portfolio AA 23-Jun-05 0.63% 139 1 39 40 0.09 32.4
Retail XRT SPDR S&P Retail ETF PF 22-Jun-06 0.35% 350 180 206 386 0.01 2.5
Cons. Staples XLP Consumer Staples Select Sector SPDR Fund PF 22-Dec-98 0.14% 8,856 455 1,296 1,751 0.01 1.8
Food Products PBJ PowerShares Dynamic Food & Beverage Portfolio AA 23-Jun-05 0.63% 143 1 49 50 0.07 21.9
Energy XLE Energy Select Sector SPDR Fund PF 22-Dec-98 0.14% 16,297 1,097 936 2,033 0.01 1.5
Energy Eq. & Serv. OIH Market Vectors Oil Services ETF PF 7-Feb-01 0.35% 1,052 170 175 345 0.01 3.7
Energy Eq. & Serv. XES SPDR S&P Oil & Gas Equipment & Services ETF AA 22-Jun-06 0.35% 284 14 68 82 0.01 8.4
Energy Eq. & Serv. IEZ iShares U.S. Oil Equipment & Services ETF AA 5-May-06 0.43% 218 2 45 47 0.05 13.1
Energy E&P XOP SPDR S&P Oil & Gas Exploration & Production ETF PF 22-Jun-06 0.35% 2,057 618 307 925 0.01 2.9
Energy E&P IEO iShares U.S. Oil & Gas Exploration & Production ETF AA 5-May-06 0.43% 406 5 729 734 0.04 7.3
MLPs AMLP Alerian MLP ETF CM 25-Aug-10 0.85% 10,557 93 106 199 0.01 8.1
Financials XLF Financial Select Sector SPDR Fund PF 22-Dec-98 0.14% 22,907 1,765 1,443 3,208 0.01 4.2
Large Banks KBWB PowerShares KBW Bank Portfolio AA 1-Nov-11 0.35% 871 16 294 310 0.02 4.4
Regional Banks KRE SPDR S&P Regional Banking ETF PF 22-Jun-06 0.35% 3,725 382 261 643 0.01 1.9
Capital Markets KCE SPDR S&P Capital Markets ETF AA 15-Nov-05 0.35% 96 0 91 91 0.14 29.8
Insurance KIE SPDR S&P Insurance ETF AA 15-Nov-05 0.35% 1,015 20 211 231 0.04 4.3
Healthcare XLV Health Care Select Sector SPDR Fund PF 22-Dec-98 0.14% 16,190 460 1,359 1,819 0.01 1.3
Biotech & Pharma IBB iShares Nasdaq Biotechnology ETF PF 5-Feb-01 0.47% 8,044 244 207 451 0.17 5.8
Large Biotech BBH Market Vectors Biotech ETF AA 23-Nov-99 0.35% 673 3 211 213 0.09 7.2
HC Eq. & Supplies IHI iShares U.S. Medical Devices ETF AA 5-May-06 0.43% 1,305 17 243 260 0.07 4.4
HC Providers & Serv IHF iShares U.S. Healthcare Providers ETF AA 5-May-06 0.43% 543 2 74 76 0.13 9.0
Large Pharma PPH Market Vectors Pharmaceutical ETF AA 1-Feb-00 0.35% 306 4 356 359 0.02 3.9
Industrials XLI Industrial Select Sector SPDR Fund PF 22-Dec-98 0.14% 11,334 616 1,673 2,289 0.01 1.5
Aerospace & Def ITA iShares U.S. Aerospace & Defense ETF AA 5-May-06 0.43% 2,871 28 81 109 0.08 5.0
Transportation IYT iShares Transportation Average ETF AA 10-Oct-03 0.43% 963 48 68 116 0.06 3.6
Materials XLB Materials Select Sector SPDR Fund PF 22-Dec-98 0.14% 3,658 231 479 710 0.01 1.9
Metals & Mining XME SPDR S&P Metals and Mining ETF PF 22-Jun-06 0.35% 722 127 119 246 0.01 3.6
Real Estate VNQ Vanguard REIT ETF CM 29-Sep-04 0.12% 33,377 384 602 987 0.01 1.3
Technology VGT Vanguard Information Technology ETF AA 30-Jan-04 0.10% 12,953 60 2,598 2,658 0.03 2.1
Comm. Equipment IGN iShares North American Tech-Multimedia Networking E AA 10-Jul-01 0.47% 80 0 95 95 0.04 8.1
Int. Software & Serv. FDN First Trust Dow Jones Internet Index Fund AA 23-Jun-06 0.60% 4,366 25 151 176 0.04 4.1
Semiconductors SMH Market Vectors Semiconductor ETF PF 5-May-00 0.35% 677 221 370 591 0.01 1.3
Software IGV iShares North American Tech-Software ETF AA 10-Jul-01 0.47% 938 14 275 289 0.05 3.8
Telecom VOX Vanguard Telecommunication Services ETF AA 29-Sep-04 0.10% 1,352 14 8 22 0.07 7.9
Utilities XLU Utilities Select Sector SPDR Fund PF 22-Dec-98 0.14% 7,048 573 547 1,120 0.01 2.0
AUM $M20D ADV
$M
Implied
Liq. $M
Total
Liq. $M
Avg. Bid/Ask SpreadsListing Date TER
Product
TypeAsset Class Ticker ETF Name
Source: Deutsche Bank, Bloomberg Finance LP, FactSet. Data as of 10-May-17. Bid/Ask Spreads are provided only as reference, actual spreads are trade-specific. Product Type: Asset Allocation (AA),Cash Management (CM), Pseudo Futures (PF).
Deutsche Bank Securities Inc. Page 43
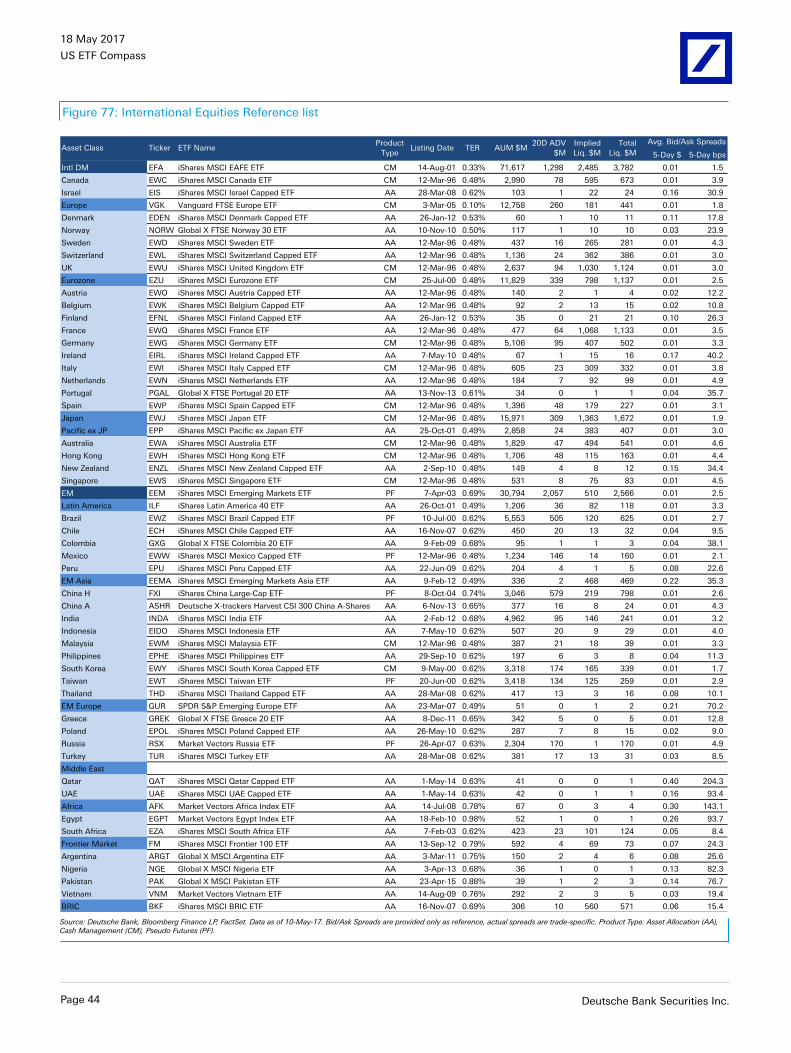
18 May 2017
US ETF Compass
Figure 77: International Equities Reference list
5-Day $ 5-Day bps
Intl DM EFA iShares MSCI EAFE ETF CM 14-Aug-01 0.33% 71,617 1,298 2,485 3,782 0.01 1.5
Canada EWC iShares MSCI Canada ETF CM 12-Mar-96 0.48% 2,990 78 595 673 0.01 3.9
Israel EIS iShares MSCI Israel Capped ETF AA 28-Mar-08 0.62% 103 1 22 24 0.16 30.9
Europe VGK Vanguard FTSE Europe ETF CM 3-Mar-05 0.10% 12,758 260 181 441 0.01 1.8
Denmark EDEN iShares MSCI Denmark Capped ETF AA 26-Jan-12 0.53% 60 1 10 11 0.11 17.8
Norway NORW Global X FTSE Norway 30 ETF AA 10-Nov-10 0.50% 117 1 10 10 0.03 23.9
Sweden EWD iShares MSCI Sweden ETF AA 12-Mar-96 0.48% 437 16 265 281 0.01 4.3
Switzerland EWL iShares MSCI Switzerland Capped ETF AA 12-Mar-96 0.48% 1,136 24 362 386 0.01 3.0
UK EWU iShares MSCI United Kingdom ETF CM 12-Mar-96 0.48% 2,637 94 1,030 1,124 0.01 3.0
Eurozone EZU iShares MSCI Eurozone ETF CM 25-Jul-00 0.48% 11,829 339 798 1,137 0.01 2.5
Austria EWO iShares MSCI Austria Capped ETF AA 12-Mar-96 0.48% 140 2 1 4 0.02 12.2
Belgium EWK iShares MSCI Belgium Capped ETF AA 12-Mar-96 0.48% 92 2 13 15 0.02 10.8
Finland EFNL iShares MSCI Finland Capped ETF AA 26-Jan-12 0.53% 35 0 21 21 0.10 26.3
France EWQ iShares MSCI France ETF AA 12-Mar-96 0.48% 477 64 1,068 1,133 0.01 3.5
Germany EWG iShares MSCI Germany ETF CM 12-Mar-96 0.48% 5,106 95 407 502 0.01 3.3
Ireland EIRL iShares MSCI Ireland Capped ETF AA 7-May-10 0.48% 67 1 15 16 0.17 40.2
Italy EWI iShares MSCI Italy Capped ETF CM 12-Mar-96 0.48% 605 23 309 332 0.01 3.8
Netherlands EWN iShares MSCI Netherlands ETF AA 12-Mar-96 0.48% 184 7 92 99 0.01 4.9
Portugal PGAL Global X FTSE Portugal 20 ETF AA 13-Nov-13 0.61% 34 0 1 1 0.04 35.7
Spain EWP iShares MSCI Spain Capped ETF CM 12-Mar-96 0.48% 1,396 48 179 227 0.01 3.1
Japan EWJ iShares MSCI Japan ETF CM 12-Mar-96 0.48% 15,971 309 1,363 1,672 0.01 1.9
Pacific ex JP EPP iShares MSCI Pacific ex Japan ETF AA 25-Oct-01 0.49% 2,858 24 383 407 0.01 3.0
Australia EWA iShares MSCI Australia ETF CM 12-Mar-96 0.48% 1,829 47 494 541 0.01 4.6
Hong Kong EWH iShares MSCI Hong Kong ETF CM 12-Mar-96 0.48% 1,706 48 115 163 0.01 4.4
New Zealand ENZL iShares MSCI New Zealand Capped ETF AA 2-Sep-10 0.48% 149 4 8 12 0.15 34.4
Singapore EWS iShares MSCI Singapore ETF CM 12-Mar-96 0.48% 531 8 75 83 0.01 4.5
EM EEM iShares MSCI Emerging Markets ETF PF 7-Apr-03 0.69% 30,794 2,057 510 2,566 0.01 2.5
Latin America ILF iShares Latin America 40 ETF AA 26-Oct-01 0.49% 1,206 36 82 118 0.01 3.3
Brazil EWZ iShares MSCI Brazil Capped ETF PF 10-Jul-00 0.62% 5,553 505 120 625 0.01 2.7
Chile ECH iShares MSCI Chile Capped ETF AA 16-Nov-07 0.62% 450 20 13 32 0.04 9.5
Colombia GXG Global X FTSE Colombia 20 ETF AA 9-Feb-09 0.68% 95 1 1 3 0.04 38.1
Mexico EWW iShares MSCI Mexico Capped ETF PF 12-Mar-96 0.48% 1,234 146 14 160 0.01 2.1
Peru EPU iShares MSCI Peru Capped ETF AA 22-Jun-09 0.62% 204 4 1 5 0.08 22.6
EM Asia EEMA iShares MSCI Emerging Markets Asia ETF AA 9-Feb-12 0.49% 336 2 468 469 0.22 35.3
China H FXI iShares China Large-Cap ETF PF 8-Oct-04 0.74% 3,046 579 219 798 0.01 2.6
China A ASHR Deutsche X-trackers Harvest CSI 300 China A-Shares ET AA 6-Nov-13 0.65% 377 16 8 24 0.01 4.3
India INDA iShares MSCI India ETF AA 2-Feb-12 0.68% 4,962 95 146 241 0.01 3.2
Indonesia EIDO iShares MSCI Indonesia ETF AA 7-May-10 0.62% 507 20 9 29 0.01 4.0
Malaysia EWM iShares MSCI Malaysia ETF CM 12-Mar-96 0.48% 387 21 18 39 0.01 3.3
Philippines EPHE iShares MSCI Philippines ETF AA 29-Sep-10 0.62% 197 6 3 8 0.04 11.3
South Korea EWY iShares MSCI South Korea Capped ETF CM 9-May-00 0.62% 3,318 174 165 339 0.01 1.7
Taiwan EWT iShares MSCI Taiwan ETF PF 20-Jun-00 0.62% 3,418 134 125 259 0.01 2.9
Thailand THD iShares MSCI Thailand Capped ETF AA 28-Mar-08 0.62% 417 13 3 16 0.08 10.1
EM Europe GUR SPDR S&P Emerging Europe ETF AA 23-Mar-07 0.49% 51 0 1 2 0.21 70.2
Greece GREK Global X FTSE Greece 20 ETF AA 8-Dec-11 0.65% 342 5 0 5 0.01 12.8
Poland EPOL iShares MSCI Poland Capped ETF AA 26-May-10 0.62% 287 7 8 15 0.02 9.0
Russia RSX Market Vectors Russia ETF PF 26-Apr-07 0.63% 2,304 170 1 170 0.01 4.9
Turkey TUR iShares MSCI Turkey ETF AA 28-Mar-08 0.62% 381 17 13 31 0.03 8.5
Middle East
Qatar QAT iShares MSCI Qatar Capped ETF AA 1-May-14 0.63% 41 0 0 1 0.40 204.3
UAE UAE iShares MSCI UAE Capped ETF AA 1-May-14 0.63% 42 0 1 1 0.16 93.4
Africa AFK Market Vectors Africa Index ETF AA 14-Jul-08 0.78% 67 0 3 4 0.30 143.1
Egypt EGPT Market Vectors Egypt Index ETF AA 18-Feb-10 0.98% 52 1 0 1 0.26 93.7
South Africa EZA iShares MSCI South Africa ETF AA 7-Feb-03 0.62% 423 23 101 124 0.05 8.4
Frontier Market FM iShares MSCI Frontier 100 ETF AA 13-Sep-12 0.79% 592 4 69 73 0.07 24.3
Argentina ARGT Global X MSCI Argentina ETF AA 3-Mar-11 0.75% 150 2 4 6 0.08 25.6
Nigeria NGE Global X MSCI Nigeria ETF AA 3-Apr-13 0.68% 36 1 0 1 0.13 82.3
Pakistan PAK Global X MSCI Pakistan ETF AA 23-Apr-15 0.88% 39 1 2 3 0.14 76.7
Vietnam VNM Market Vectors Vietnam ETF AA 14-Aug-09 0.76% 292 2 3 5 0.03 19.4
BRIC BKF iShares MSCI BRIC ETF AA 16-Nov-07 0.69% 306 10 560 571 0.06 15.4
Total
Liq. $MAsset Class Ticker ETF Name
Product
TypeListing Date
Avg. Bid/Ask SpreadsTER AUM $M
20D ADV
$M
Implied
Liq. $M
Source: Deutsche Bank, Bloomberg Finance LP, FactSet. Data as of 10-May-17. Bid/Ask Spreads are provided only as reference, actual spreads are trade-specific. Product Type: Asset Allocation (AA),Cash Management (CM), Pseudo Futures (PF).
Page 44 Deutsche Bank Securities Inc.

18 May 2017
US ETF Compass
Figure 78: Non-Equity Reference list
5-Day $ 5-Day bps
Fixed Income (Broad) AGG iShares Core U.S. Aggregate Bond ETF CM 26-Sep-03 0.05% 44,154 266 n.a. n.a. 0.01 0.9
US Treasury GOVT iShares Core U.S. Treasury Bond ETF AA 16-Feb-12 0.15% 4,016 25 n.a. n.a. 0.01 4.6
Very Short SHV iShares Short Treasury Bond ETF CM 12-Jan-07 0.15% 4,719 54 n.a. n.a. 0.01 1.0
Short SHY iShares 1-3 Year Treasury Bond ETF CM 26-Jul-02 0.15% 10,923 79 n.a. n.a. 0.01 1.2
Intermediate IEI iShares 3-7 Year Treasury Bond ETF CM 12-Jan-07 0.15% 6,666 39 n.a. n.a. 0.02 1.4
Long TLT iShares 20+ Year Treasury Bond ETF PF 26-Jul-02 0.15% 6,568 1,008 n.a. n.a. 0.01 0.9
US Inflation TIP iShares TIPS Bond ETF CM 12-Apr-03 0.20% 22,651 149 n.a. n.a. 0.01 1.0
Municipal MUB iShares National AMT-Free Muni Bond ETF AA 9-Sep-07 0.25% 8,003 56 n.a. n.a. 0.02 1.7
Securitized MBB iShares MBS ETF AA 15-Mar-07 0.29% 10,502 58 n.a. n.a. 0.03 2.7
IG Corporates LQD iShares iBoxx $ Investment Grade Corporate Bond ETF CM 26-Jul-02 0.15% 31,530 384 n.a. n.a. 0.01 0.9
HY Corporates HYG iShares iBoxx $ High Yield Corporate Bond ETF PF 10-Apr-07 0.50% 17,426 867 n.a. n.a. 0.01 1.2
Floater FLOT iShares Floating Rate Bond ETF AA 17-Jun-11 0.20% 5,527 51 n.a. n.a. 0.01 2.0
Senior Loans BKLN PowerShares Senior Loan Portfolio CM 3-Mar-11 0.65% 9,327 89 n.a. n.a. 0.01 4.3
Preferred PFF iShares U.S. Preferred Stock ETF CM 30-Mar-07 0.47% 17,737 91 n.a. n.a. 0.01 2.6
Convertible CWB SPDR Barclays Convertible Securities ETF AA 16-Apr-09 0.40% 3,608 31 n.a. n.a. 0.01 3.0
Intl DM Debt BWX SPDR Barclays International Treasury Bond ETF AA 5-Oct-07 0.50% 1,416 13 n.a. n.a. 0.03 12.0
Intl Inflation WIP SPDR DB International Government Inflation-Protected AA 19-Mar-08 0.50% 520 5 n.a. n.a. 0.33 60.4
EM Gov Debt USD EMB iShares J.P. Morgan USD Emerging Markets Bond ETF CM 12-Dec-07 0.40% 10,829 220 n.a. n.a. 0.02 1.4
EM Gov Debt Local EMLC Market Vectors Emerging Markets Local Currency Bon AA 23-Jul-10 0.47% 3,337 32 n.a. n.a. 0.01 5.6
EM Corp USD EMCB WisdomTree Emerging Markets Corporate Bond Fund AA 8-Mar-12 0.60% 50 0 n.a. n.a. 0.86 119.1
EM HY Corp USD HYEM Market Vectors Emerging Markets High Yield Bond ET AA 9-May-12 0.40% 372 3 n.a. n.a. 0.05 19.2
Commodities DBC PowerShares DB Commodity Index Tracking Fund CM 3-Feb-06 0.89% 1,930 32 n.a. n.a. 0.01 7.0
Energy Cmdty DBE PowerShares DB Energy Fund AA 5-Jan-07 0.78% 135 3 n.a. n.a. 0.02 17.6
Crude Oil WTI USO United States Oil Fund LP PF 3-Apr-06 0.72% 3,048 306 n.a. n.a. 0.01 10.4
Natural Gas UNG United States Natural Gas Fund LP PF 18-Apr-07 1.27% 444 59 n.a. n.a. 0.01 13.5
Agriculture DBA PowerShares DB Agriculture Fund CM 5-Jan-07 0.89% 711 10 n.a. n.a. 0.01 5.1
Industrial Metals DBB PowerShares DB Base Metals Fund AA 5-Jan-07 0.82% 261 3 n.a. n.a. 0.01 7.2
Precious Metals DBP PowerShares DB Precious Metals Fund AA 5-Jan-07 0.78% 138 1 n.a. n.a. 0.04 11.9
Gold Physical GLD SPDR Gold Shares PF 18-Nov-04 0.40% 33,492 1,160 n.a. n.a. 0.01 0.9
Silver Physical SLV iShares Silver Trust PF 27-Apr-06 0.50% 5,515 145 n.a. n.a. 0.01 6.5
Platinum Physical PPLT ETFS Physical Platinum Shares AA 8-Jan-10 0.60% 494 7 n.a. n.a. 0.11 12.2
Palladium Physical PALL ETFS Physical Palladium Shares AA 8-Jan-10 0.60% 207 3 n.a. n.a. 0.12 15.5
Bull USD UUP PowerShares DB US Dollar Index Bullish Fund CM 20-Feb-07 0.80% 695 24 n.a. n.a. 0.01 3.9
JPYUSD FXY CurrencyShares Japanese Yen Trust PF 13-Feb-07 0.40% 110 12 n.a. n.a. 0.01 1.5
EURUSD FXE CurrencyShares Euro Currency Trust PF 12-Dec-05 0.40% 289 72 n.a. n.a. 0.01 1.0
Asset Class Ticker ETF NameProduct
TypeListing Date TER AUM $M
20D ADV
$M
Implied
Liq. $M
Total
Liq. $M
Avg. Bid/Ask Spreads
Source: Deutsche Bank, Bloomberg Finance LP, FactSet. Data as of 10-May-17. Bid/Ask Spreads are provided only as reference, actual spreads are trade-specific. Product Type: Asset Allocation (AA),Cash Management (CM), Pseudo Futures (PF).
Deutsche Bank Securities Inc. Page 45
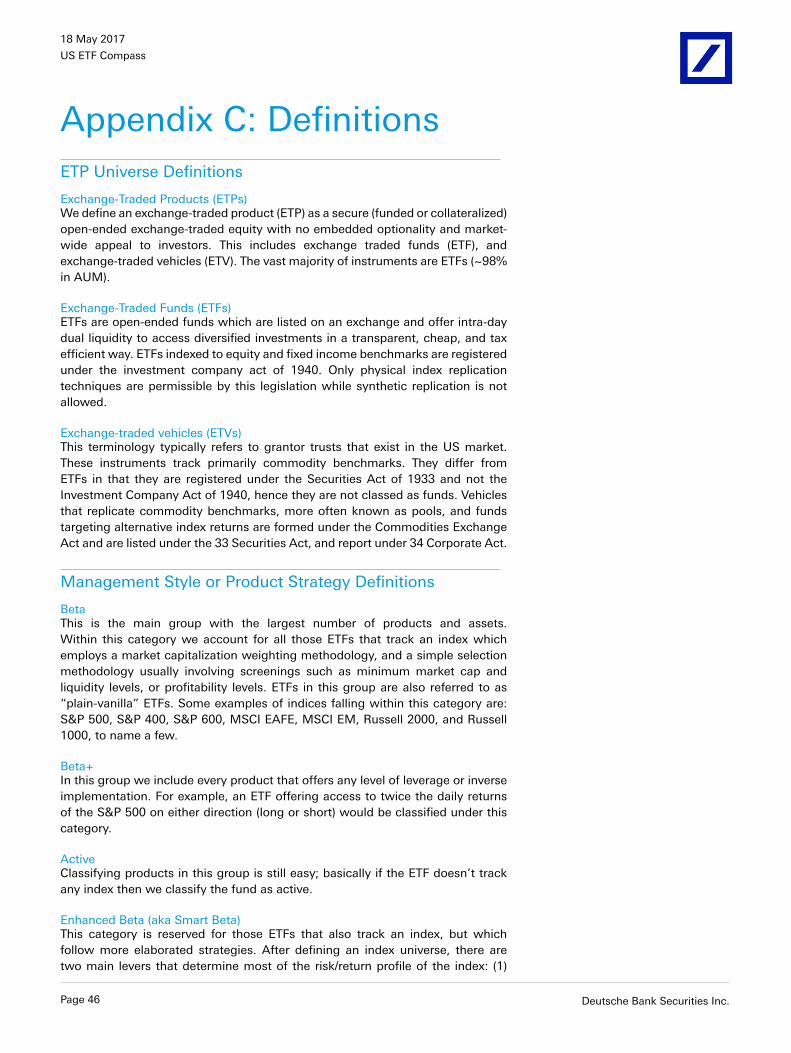
18 May 2017
US ETF Compass
Appendix C: DefinitionsETP Universe Definitions
Exchange-Traded Products (ETPs)We define an exchange-traded product (ETP) as a secure (funded or collateralized)open-ended exchange-traded equity with no embedded optionality and market-wide appeal to investors. This includes exchange traded funds (ETF), andexchange-traded vehicles (ETV). The vast majority of instruments are ETFs (~98%in AUM).
Exchange-Traded Funds (ETFs)ETFs are open-ended funds which are listed on an exchange and offer intra-daydual liquidity to access diversified investments in a transparent, cheap, and taxefficient way. ETFs indexed to equity and fixed income benchmarks are registeredunder the investment company act of 1940. Only physical index replicationtechniques are permissible by this legislation while synthetic replication is notallowed.
Exchange-traded vehicles (ETVs)This terminology typically refers to grantor trusts that exist in the US market.These instruments track primarily commodity benchmarks. They differ fromETFs in that they are registered under the Securities Act of 1933 and not theInvestment Company Act of 1940, hence they are not classed as funds. Vehiclesthat replicate commodity benchmarks, more often known as pools, and fundstargeting alternative index returns are formed under the Commodities ExchangeAct and are listed under the 33 Securities Act, and report under 34 Corporate Act.
Management Style or Product Strategy Definitions
BetaThis is the main group with the largest number of products and assets.Within this category we account for all those ETFs that track an index whichemploys a market capitalization weighting methodology, and a simple selectionmethodology usually involving screenings such as minimum market cap andliquidity levels, or profitability levels. ETFs in this group are also referred to as“plain-vanilla” ETFs. Some examples of indices falling within this category are:S&P 500, S&P 400, S&P 600, MSCI EAFE, MSCI EM, Russell 2000, and Russell1000, to name a few.
Beta+In this group we include every product that offers any level of leverage or inverseimplementation. For example, an ETF offering access to twice the daily returnsof the S&P 500 on either direction (long or short) would be classified under thiscategory.
ActiveClassifying products in this group is still easy; basically if the ETF doesn’t trackany index then we classify the fund as active.
Enhanced Beta (aka Smart Beta)This category is reserved for those ETFs that also track an index, but whichfollow more elaborated strategies. After defining an index universe, there aretwo main levers that determine most of the risk/return profile of the index: (1)
Page 46 Deutsche Bank Securities Inc.

18 May 2017
US ETF Compass
the selection criteria, and (2) the weighting criteria. In their selection process,enhanced beta ETFs usually employ additional screening processes and scoringsystems involving multiple factors beyond just minimum market cap and liquiditylevels. For example, they could include growth or value scores, dividends paidor dividend yield, earnings, volatility, or momentum screens, to name a few. Theweighting methodology of enhanced beta ETFs is usually anything but marketcap weighted, it can include simple equal weighting or variations of it, optimizedweights, and other metric-specific weights such as those based on dividendspaid, inverse volatility, dividend yield, fundamental multi factor scores, earnings,and revenues, to name a few. An enhanced beta ETF will either have a non-traditional selection methodology, a non-traditional weighting methodology, or acombination of both.
Product Type Definitions
Asset Allocation ETFsThis group covers all ETFs with exception of levered and inverse products. Theseare usually good products for market access strategies, portfolio completion, andcore positions. They are also efficient building blocks for multi asset strategies.When selecting these products, major emphasis should be set on the desiredexposure, tracking efficiency, primary liquidity (i.e. the liquidity of the underlyingbasket), and cost.
Cash Management ETFsThis group covers a more selected group of ETFs which in addition to beinggood asset allocation tools, also serves a series of cash management portfolioneeds. For example, these products are very good for equitizing cash betweentransitions, around reporting periods (window dressing), and during tax lossharvesting. These ETFs usually have good liquidity, large fund size, and lowcost, all of which makes it easier to execute sizeable short-term transactions,therefore secondary market liquidity and fund size tend to be a more relevantfactor compared to asset allocation ETFs. The most popular asset allocation usageof these funds is as core building blocks.
Pseudo Futures ETFsThis group covers an even more selected sample of ETFs which in additionto being good asset allocation and cash management tools can also be usedfor fulfilling risk management functions such as risk hedging, portable alphastrategies, or tactical shorts. Many times they also trade at a cheaper level thantheir underlying basket, and offer large amounts of liquidity which can make themattractive for market making activities as well. Secondary and short liquidity (easeto borrow), and fund size tend to be more relevant characteristics at the momentof selecting this type of ETFs. There is usually no more than one pseudo futuresETF per asset class. The most popular asset allocation usage of these fundsis among portfolios that require more liquidity given their size or more tacticalnature.
Deutsche Bank Securities Inc. Page 47
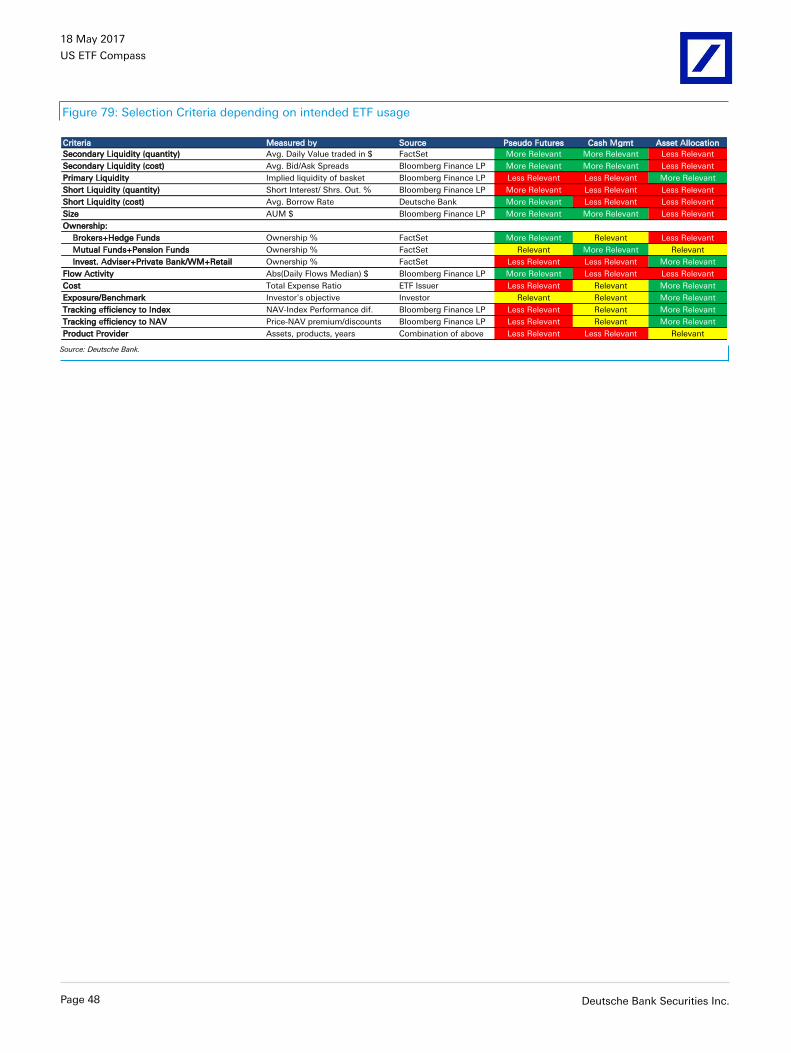
18 May 2017
US ETF Compass
Figure 79: Selection Criteria depending on intended ETF usage
Criteria Measured by Source Pseudo Futures Cash Mgmt Asset Allocation
Secondary Liquidity (quantity) Avg. Daily Value traded in $ FactSet More Relevant More Relevant Less Relevant
Secondary Liquidity (cost) Avg. Bid/Ask Spreads Bloomberg Finance LP More Relevant More Relevant Less Relevant
Primary Liquidity Implied liquidity of basket Bloomberg Finance LP Less Relevant Less Relevant More Relevant
Short Liquidity (quantity) Short Interest/ Shrs. Out. % Bloomberg Finance LP More Relevant Less Relevant Less Relevant
Short Liquidity (cost) Avg. Borrow Rate Deutsche Bank More Relevant Less Relevant Less Relevant
Size AUM $ Bloomberg Finance LP More Relevant More Relevant Less Relevant
Ownership:
Brokers+Hedge Funds Ownership % FactSet More Relevant Relevant Less Relevant
Mutual Funds+Pension Funds Ownership % FactSet Relevant More Relevant Relevant
Invest. Adviser+Private Bank/WM+Retail Ownership % FactSet Less Relevant Less Relevant More Relevant
Flow Activity Abs(Daily Flows Median) $ Bloomberg Finance LP More Relevant Less Relevant Less Relevant
Cost Total Expense Ratio ETF Issuer Less Relevant Relevant More Relevant
Exposure/Benchmark Investor's objective Investor Relevant Relevant More Relevant
Tracking efficiency to Index NAV-Index Performance dif. Bloomberg Finance LP Less Relevant Relevant More Relevant
Tracking efficiency to NAV Price-NAV premium/discounts Bloomberg Finance LP Less Relevant Relevant More Relevant
Product Provider Assets, products, years Combination of above Less Relevant Less Relevant Relevant
Source: Deutsche Bank.
Page 48 Deutsche Bank Securities Inc.

18 May 2017
US ETF Compass
The authors of this report wish to acknowledge the contribution made by AlfonsoDelgado Valdivia, employee of Evalueserve, a third-party provider of offshoreresearch support services to Deutsche Bank.
Deutsche Bank Securities Inc. Page 49
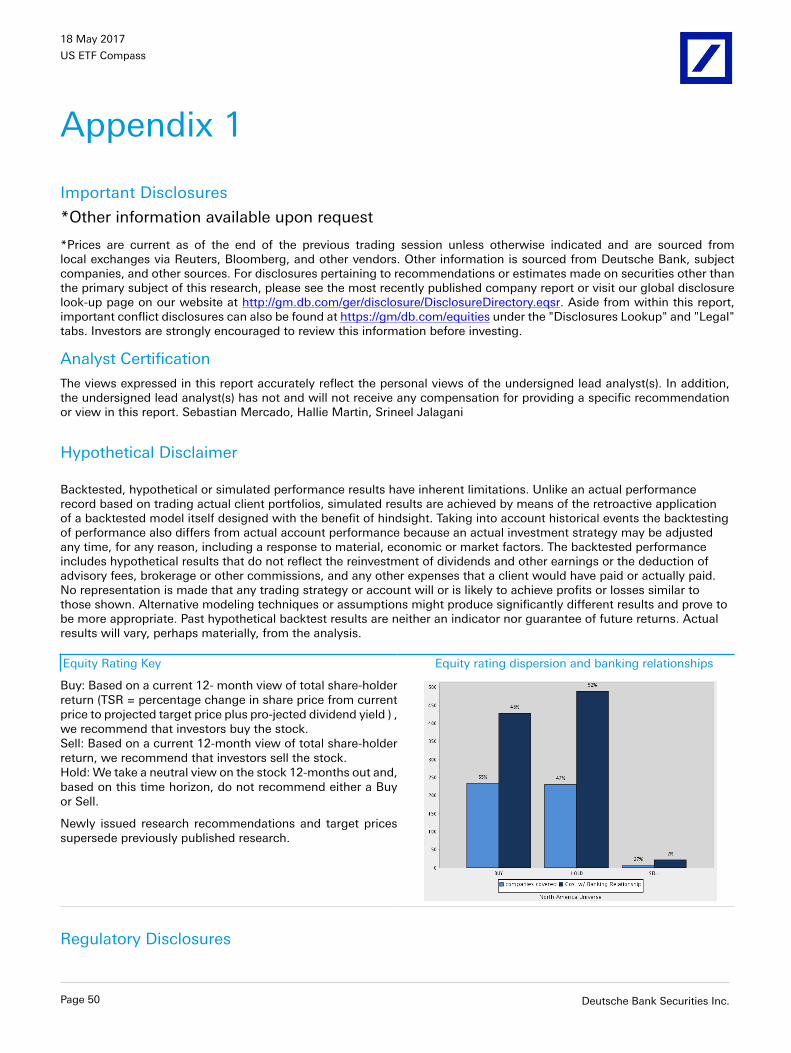
18 May 2017
US ETF Compass
Appendix 1
Important Disclosures
*Other information available upon request
*Prices are current as of the end of the previous trading session unless otherwise indicated and are sourced fromlocal exchanges via Reuters, Bloomberg, and other vendors. Other information is sourced from Deutsche Bank, subjectcompanies, and other sources. For disclosures pertaining to recommendations or estimates made on securities other thanthe primary subject of this research, please see the most recently published company report or visit our global disclosurelook-up page on our website at http://gm.db.com/ger/disclosure/DisclosureDirectory.eqsr. Aside from within this report,important conflict disclosures can also be found at https://gm/db.com/equities under the "Disclosures Lookup" and "Legal"tabs. Investors are strongly encouraged to review this information before investing.
Analyst Certification
The views expressed in this report accurately reflect the personal views of the undersigned lead analyst(s). In addition,the undersigned lead analyst(s) has not and will not receive any compensation for providing a specific recommendationor view in this report. Sebastian Mercado, Hallie Martin, Srineel Jalagani
Hypothetical Disclaimer
Backtested, hypothetical or simulated performance results have inherent limitations. Unlike an actual performancerecord based on trading actual client portfolios, simulated results are achieved by means of the retroactive applicationof a backtested model itself designed with the benefit of hindsight. Taking into account historical events the backtestingof performance also differs from actual account performance because an actual investment strategy may be adjustedany time, for any reason, including a response to material, economic or market factors. The backtested performanceincludes hypothetical results that do not reflect the reinvestment of dividends and other earnings or the deduction ofadvisory fees, brokerage or other commissions, and any other expenses that a client would have paid or actually paid.No representation is made that any trading strategy or account will or is likely to achieve profits or losses similar tothose shown. Alternative modeling techniques or assumptions might produce significantly different results and prove tobe more appropriate. Past hypothetical backtest results are neither an indicator nor guarantee of future returns. Actualresults will vary, perhaps materially, from the analysis.
Equity Rating Key Equity rating dispersion and banking relationships
Buy: Based on a current 12- month view of total share-holderreturn (TSR = percentage change in share price from currentprice to projected target price plus pro-jected dividend yield ) ,we recommend that investors buy the stock.Sell: Based on a current 12-month view of total share-holderreturn, we recommend that investors sell the stock.Hold: We take a neutral view on the stock 12-months out and,based on this time horizon, do not recommend either a Buyor Sell.
Newly issued research recommendations and target pricessupersede previously published research.
Regulatory Disclosures
Page 50 Deutsche Bank Securities Inc.

18 May 2017
US ETF Compass
1.Additional InformationInformation on ETFs is provided strictly for illustrative purposes and should not be deemed an offer to sell or asolicitation of an offer to buy shares of any fund that is described in this document. Consider carefully any fund'sinvestment objectives, risk factors, and charges and expenses before investing. This and other information can be foundin the fund's prospectus. Prospectuses about db X-trackers funds and Powershares DB funds can be obtained by calling1-877-369-4617 or by visiting www.DBXUS.com. Read prospectuses carefully before investing. Past performance is notnecessarily indicative of future results. Investing involves risk, including possible loss of principal. To better understandthe similarities and differences between investments, including investment objectives, risks, fees and expenses, it isimportant to read the products' prospectuses. Shares of ETFs may be sold throughout the day on an exchange throughany brokerage account. However, shares may only be redeemed directly from an ETF by authorized participants, in verylarge creation/redemption units. Transactions in shares of ETFs will result in brokerage commissions and will generatetax consequences. ETFs are obliged to distribute portfolio gains to shareholders. Deutsche Bank may be an issuer,advisor, manager, distributor or administrator of, or provide other services to, an ETF included in this report, for which itreceives compensation. db X-trackers and Powershares DB funds are distributed by ALPS Distributors, Inc. The opinionsexpressed are those of the authors and do not necessarily reflect the views of DB, ALPS or their affiliates.
Aside from within this report, important conflict disclosures can also be found at https://gm.db.com/equities under the"Disclosures Lookup" and "Legal" tabs. Investors are strongly encouraged to review this information before investing.
Deutsche Bank Securities Inc. Page 51

18 May 2017
US ETF Compass
Additional Information?The information and opinions in this report were prepared by Deutsche Bank AG or one of its affiliates (collectively"Deutsche Bank"). Though the information herein is believed to be reliable and has been obtained from public sourcesbelieved to be reliable, Deutsche Bank makes no representation as to its accuracy or completeness.
If you use the services of Deutsche Bank in connection with a purchase or sale of a security that is discussed in this report,or is included or discussed in another communication (oral or written) from a Deutsche Bank analyst, Deutsche Bank mayact as principal for its own account or as agent for another person.
Deutsche Bank may consider this report in deciding to trade as principal. It may also engage in transactions, for itsown account or with customers, in a manner inconsistent with the views taken in this research report. Others withinDeutsche Bank, including strategists, sales staff and other analysts, may take views that are inconsistent with those takenin this research report. Deutsche Bank issues a variety of research products, including fundamental analysis, equity-linkedanalysis, quantitative analysis and trade ideas. Recommendations contained in one type of communication may differfrom recommendations contained in others, whether as a result of differing time horizons, methodologies or otherwise.Deutsche Bank and/or its affiliates may also be holding debt or equity securities of the issuers it writes on. Analysts arepaid in part based on the profitability of Deutsche Bank AG and its affiliates, which includes investment banking, tradingand principal trading revenues.
Opinions, estimates and projections constitute the current judgment of the author as of the date of this report. They donot necessarily reflect the opinions of Deutsche Bank and are subject to change without notice. Deutsche Bank providesliquidity for buyers and sellers of securities issued by the companies it covers. Deutsche Bank research analysts sometimeshave shorter-term trade ideas that are consistent or inconsistent with Deutsche Bank's existing longer term ratings. Tradeideas for equities can be found at the SOLAR link at http://gm.db.com. A SOLAR idea represents a high conviction beliefby an analyst that a stock will outperform or underperform the market and/or sector delineated over a time frame of noless than two weeks. In addition to SOLAR ideas, the analysts named in this report may from time to time discuss withour clients, Deutsche Bank salespersons and Deutsche Bank traders, trading strategies or ideas that reference catalystsor events that may have a near-term or medium-term impact on the market price of the securities discussed in this report,which impact may be directionally counter to the analysts' current 12-month view of total return or investment return asdescribed herein. Deutsche Bank has no obligation to update, modify or amend this report or to otherwise notify a recipientthereof if any opinion, forecast or estimate contained herein changes or subsequently becomes inaccurate. Coverage andthe frequency of changes in market conditions and in both general and company specific economic prospects make itdifficult to update research at defined intervals. Updates are at the sole discretion of the coverage analyst concerned or ofthe Research Department Management and as such the majority of reports are published at irregular intervals. This reportis provided for informational purposes only and does not take into account the particular investment objectives, financialsituations, or needs of individual clients. It is not an offer or a solicitation of an offer to buy or sell any financial instrumentsor to participate in any particular trading strategy. Target prices are inherently imprecise and a product of the analyst’sjudgment. The financial instruments discussed in this report may not be suitable for all investors and investors must maketheir own informed investment decisions. Prices and availability of financial instruments are subject to change withoutnotice and investment transactions can lead to losses as a result of price fluctuations and other factors. If a financialinstrument is denominated in a currency other than an investor's currency, a change in exchange rates may adverselyaffect the investment. Past performance is not necessarily indicative of future results. Unless otherwise indicated, pricesare current as of the end of the previous trading session, and are sourced from local exchanges via Reuters, Bloombergand other vendors. Data is sourced from Deutsche Bank, subject companies, and in some cases, other parties.
The Deutsche Bank Research Department is independent of other business areas divisions of the Bank. Details regardingour organizational arrangements and information barriers we have to prevent and avoid conflicts of interest with respectto our research is available on our website under Disclaimer found on the Legal tab.??Macroeconomic fluctuations often account for most of the risks associated with exposures to instruments that promiseto pay fixed or variable interest rates. For an investor who is long fixed rate instruments (thus receiving these cash flows),increases in interest rates naturally lift the discount factors applied to the expected cash flows and thus cause a loss.
Page 52 Deutsche Bank Securities Inc.
18 May 2017
US ETF Compass
The longer the maturity of a certain cash flow and the higher the move in the discount factor, the higher will be theloss. Upside surprises in inflation, fiscal funding needs, and FX depreciation rates are among the most common adversemacroeconomic shocks to receivers. But counterparty exposure, issuer creditworthiness, client segmentation, regulation(including changes in assets holding limits for different types of investors), changes in tax policies, currency convertibility(which may constrain currency conversion, repatriation of profits and/or the liquidation of positions), and settlement issuesrelated to local clearing houses are also important risk factors to be considered. The sensitivity of fixed income instrumentsto macroeconomic shocks may be mitigated by indexing the contracted cash flows to inflation, to FX depreciation, or tospecified interest rates – these are common in emerging markets. It is important to note that the index fixings may -- byconstruction -- lag or mis-measure the actual move in the underlying variables they are intended to track. The choice of theproper fixing (or metric) is particularly important in swaps markets, where floating coupon rates (i.e., coupons indexed toa typically short-dated interest rate reference index) are exchanged for fixed coupons. It is also important to acknowledgethat funding in a currency that differs from the currency in which coupons are denominated carries FX risk. Naturally,options on swaps (swaptions) also bear the risks typical to options in addition to the risks related to rates movements.??Derivative transactions involve numerous risks including, among others, market, counterparty default and illiquidity risk.The appropriateness or otherwise of these products for use by investors is dependent on the investors' own circumstancesincluding their tax position, their regulatory environment and the nature of their other assets and liabilities, and as such,investors should take expert legal and financial advice before entering into any transaction similar to or inspired by thecontents of this publication. The risk of loss in futures trading and options, foreign or domestic, can be substantial. As aresult of the high degree of leverage obtainable in futures and options trading, losses may be incurred that are greaterthan the amount of funds initially deposited. Trading in options involves risk and is not suitable for all investors. Priorto buying or selling an option investors must review the "Characteristics and Risks of Standardized Options”, at http://www.optionsclearing.com/about/publications/character-risks.jsp. If you are unable to access the website please contactyour Deutsche Bank representative for a copy of this important document.?
Participants in foreign exchange transactions may incur risks arising from several factors, including the following: ( i)exchange rates can be volatile and are subject to large fluctuations; ( ii) the value of currencies may be affected bynumerous market factors, including world and national economic, political and regulatory events, events in equity anddebt markets and changes in interest rates; and (iii) currencies may be subject to devaluation or government imposedexchange controls which could affect the value of the currency. Investors in securities such as ADRs, whose values areaffected by the currency of an underlying security, effectively assume currency risk.?
Unless governing law provides otherwise, all transactions should be executed through the Deutsche Bank entity in theinvestor's home jurisdiction. Aside from within this report, important conflict disclosures can also be found at https://gm.db.com/equities under the "Disclosures Lookup" and "Legal" tabs. Investors are strongly encouraged to review thisinformation before investing.??United States: Approved and/or distributed by Deutsche Bank Securities Incorporated, a member of FINRA, NFA and SIPC.Analysts located outside of the United States are employed by non-US affiliates that are not subject to FINRA regulations.
Germany: Approved and/or distributed by Deutsche Bank AG, a joint stock corporation with limited liability incorporatedin the Federal Republic of Germany with its principal office in Frankfurt am Main. Deutsche Bank AG is authorized underGerman Banking Law and is subject to supervision by the European Central Bank and by BaFin, Germany’s FederalFinancial Supervisory Authority.
United Kingdom: Approved and/or distributed by Deutsche Bank AG acting through its London Branch at WinchesterHouse, 1 Great Winchester Street, London EC2N 2DB. Deutsche Bank AG in the United Kingdom is authorised by thePrudential Regulation Authority and is subject to limited regulation by the Prudential Regulation Authority and FinancialConduct Authority. Details about the extent of our authorisation and regulation are available on request.??Hong Kong: Distributed by Deutsche Bank AG, Hong Kong Branch.??
Deutsche Bank Securities Inc. Page 53
18 May 2017
US ETF Compass
India: Prepared by Deutsche Equities India Pvt Ltd, which is registered by the Securities and Exchange Board of India (SEBI)as a stock broker. Research Analyst SEBI Registration Number is INH000001741. DEIPL may have received administrativewarnings from the SEBI for breaches of Indian regulations.
Japan: Approved and/or distributed by Deutsche Securities Inc.(DSI). Registration number - Registered as a financialinstruments dealer by the Head of the Kanto Local Finance Bureau (Kinsho) No. 117. Member of associations: JSDA, TypeII Financial Instruments Firms Association and The Financial Futures Association of Japan. Commissions and risks involvedin stock transactions - for stock transactions, we charge stock commissions and consumption tax by multiplying thetransaction amount by the commission rate agreed with each customer. Stock transactions can lead to losses as a resultof share price fluctuations and other factors. Transactions in foreign stocks can lead to additional losses stemming fromforeign exchange fluctuations. We may also charge commissions and fees for certain categories of investment advice,products and services. Recommended investment strategies, products and services carry the risk of losses to principaland other losses as a result of changes in market and/or economic trends, and/or fluctuations in market value. Beforedeciding on the purchase of financial products and/or services, customers should carefully read the relevant disclosures,prospectuses and other documentation. "Moody's", "Standard & Poor's", and "Fitch" mentioned in this report are notregistered credit rating agencies in Japan unless Japan or "Nippon" is specifically designated in the name of the entity.Reports on Japanese listed companies not written by analysts of DSI are written by Deutsche Bank Group's analysts withthe coverage companies specified by DSI. Some of the foreign securities stated on this report are not disclosed accordingto the Financial Instruments and Exchange Law of Japan. Target prices set by Deutsche Bank's equity analysts are basedon a 12-month forecast period.
Korea: Distributed by Deutsche Securities Korea Co.?
South Africa: Deutsche Bank AG Johannesburg is incorporated in the Federal Republic of Germany (Branch RegisterNumber in South Africa: 1998/003298/10).??Singapore: by Deutsche Bank AG, Singapore Branch or Deutsche Securities Asia Limited, Singapore Branch (One RafflesQuay #18-00 South Tower Singapore 048583, +65 6423 8001), which may be contacted in respect of any matters arisingfrom, or in connection with, this report. Where this report is issued or promulgated in Singapore to a person who is not anaccredited investor, expert investor or institutional investor (as defined in the applicable Singapore laws and regulations),they accept legal responsibility to such person for its contents.
Taiwan: Information on securities/investments that trade in Taiwan is for your reference only. Readers shouldindependently evaluate investment risks and are solely responsible for their investment decisions. Deutsche Bank researchmay not be distributed to the Taiwan public media or quoted or used by the Taiwan public media without written consent.Information on securities/instruments that do not trade in Taiwan is for informational purposes only and is not to beconstrued as a recommendation to trade in such securities/instruments. Deutsche Securities Asia Limited, Taipei Branchmay not execute transactions for clients in these securities/instruments.??Qatar: Deutsche Bank AG in the Qatar Financial Centre (registered no. 00032) is regulated by the Qatar Financial CentreRegulatory Authority. Deutsche Bank AG - QFC Branch may only undertake the financial services activities that fall withinthe scope of its existing QFCRA license. Principal place of business in the QFC: Qatar Financial Centre, Tower, WestBay, Level 5, PO Box 14928, Doha, Qatar. This information has been distributed by Deutsche Bank AG. Related financialproducts or services are only available to Business Customers, as defined by the Qatar Financial Centre RegulatoryAuthority.
Russia: This information, interpretation and opinions submitted herein are not in the context of, and do not constitute,any appraisal or evaluation activity requiring a license in the Russian Federation.
?Kingdom of Saudi Arabia: Deutsche Securities Saudi Arabia LLC Company, (registered no. 07073-37) is regulated bythe Capital Market Authority. Deutsche Securities Saudi Arabia may only undertake the financial services activities thatfall within the scope of its existing CMA license. Principal place of business in Saudi Arabia: King Fahad Road, Al OlayaDistrict, P.O. Box 301809, Faisaliah Tower - 17th Floor, 11372 Riyadh, Saudi Arabia.??
Page 54 Deutsche Bank Securities Inc.

18 May 2017
US ETF Compass
United Arab Emirates: Deutsche Bank AG in the Dubai International Financial Centre (registered no. 00045) is regulatedby the Dubai Financial Services Authority. Deutsche Bank AG - DIFC Branch may only undertake the financial servicesactivities that fall within the scope of its existing DFSA license. Principal place of business in the DIFC: Dubai InternationalFinancial Centre, The Gate Village, Building 5, PO Box 504902, Dubai, U.A.E. This information has been distributed byDeutsche Bank AG. Related financial products or services are only available to Professional Clients, as defined by theDubai Financial Services Authority.
Australia: Retail clients should obtain a copy of a Product Disclosure Statement (PDS) relating to any financial productreferred to in this report and consider the PDS before making any decision about whether to acquire the product. Pleaserefer to Australian specific research disclosures and related information at https://australia.db.com/australia/content/research-information.html??Australia and New Zealand: This research is intended only for "wholesale clients" within the meaning of the AustralianCorporations Act and New Zealand Financial Advisors Act respectively.?
Additional information relative to securities, other financial products or issuers discussed in this report is available uponrequest. This report may not be reproduced, distributed or published without Deutsche Bank's prior written consent.??Copyright © 2017 Deutsche Bank AG
Deutsche Bank Securities Inc. Page 55

David Folkerts-LandauGroup Chief Economist and Global Head of Research
Raj HindochaGlobal Chief Operating Officer
Research
Michael SpencerHead of APAC Research
Global Head of Economics
Steve PollardHead of Americas Research
Global Head of Equity Research
Anthony KlarmanGlobal Head ofDebt Research
Paul ReynoldsHead of EMEA
Equity Research
Dave ClarkHead of APAC
Equity Research
Pam FinelliGlobal Head of
Equity Derivatives Research
Andreas NeubauerHead of Research - Germany
Stuart KirkHead of Thematic Research
International locations
Deutsche Bank AGDeutsche Bank PlaceLevel 16Corner of Hunter & Phillip StreetsSydney, NSW 2000AustraliaTel: (61) 2 8258 1234
Deutsche Bank AGGroße Gallusstraße 10-1460272 Frankfurt am MainGermanyTel: (49) 69 910 00
Deutsche Bank AGFiliale HongkongInternational Commerce Centre,1 Austin Road West,Kowloon,Hong KongTel: (852) 2203 8888
Deutsche Securities Inc.2-11-1 NagatachoSanno Park TowerChiyoda-ku, Tokyo 100-6171JapanTel: (81) 3 5156 6770
Deutsche Bank AG London1 Great Winchester StreetLondon EC2N 2EQUnited KingdomTel: (44) 20 7545 8000
Deutsche Bank Securities Inc.60 Wall StreetNew York, NY 10005United States of AmericaTel: (1) 212 250 2500