u.s. fish and wildlife service columbia river … eagle...u.s. fish and wildlife service columbia...
TRANSCRIPT
U.S. Fish and Wildlife Service
Columbia River Fisheries Program Office
Eagle Creek Hatchery-Wild Steelhead Ecological Interactions:
Comparative abundance, growth, migration behavior and survival of
winter steelhead in upper Eagle and North Fork Eagle Creeks
2010-2015 Final Report
Maureen Kavanagh, Doug Olson, Brian Davis, Jen Poirier, and Steve Haeseker
U.S. Fish and Wildlife Service
Columbia River Fisheries Program Office
Vancouver, WA 98683
January 20, 2016

On the cover:
Juvenile winter steelhead in Eagle Creek, in the Clackamas River drainage of Oregon.
Photograph by Maureen Kavanagh.
Disclaimers:
The findings and conclusions in this report are those of the authors and do not necessarily
represent the views of the U.S. Fish and Wildlife Service.
The mention of trade names or commercial products in this report does not constitute
endorsement or recommendation for use by the federal government.
The correct citation for this report is:
Kavanagh, M., D. Olson, B. Davis, J. Poirier, and S. Haeseker. 2016. Eagle Creek hatchery-wild
steelhead ecological interactions: Comparative abundance, growth, migration behavior and
survival of winter steelhead in upper Eagle and North Fork Eagle Creeks, 2010-2015 Final
Report. U.S. Fish and Wildlife Service, Columbia River Fisheries Program Office, Vancouver,
WA. www.fws.gov/columbiariver/publications.html

i
Eagle Creek Hatchery-Wild Steelhead Ecological Interactions:
Comparative abundance, growth, migration behavior, and survival of winter steelhead in
upper Eagle and North Fork Eagle Creeks, 2010-2015 Final Report
Maureen Kavanagh, Doug Olson1, Brian Davis, Jen Poirier, and Steve Haeseker
U.S. Fish and Wildlife Service, Columbia River Fishery Program Office
1211 SE Cardinal Court, Suite 100 Vancouver, WA 98683
Abstract. Eagle Creek National Fish Hatchery spawns and rears juvenile coho salmon (Oncorhynchus
kisutch) and winter steelhead trout (O. mykiss) that are released into Eagle Creek within the Clackamas
River basin, Oregon. Previous investigations on the ecological and genetic impacts of hatchery winter
steelhead in Eagle Creek during 2005-09 indicated that in some years natural production was influenced
by naturally spawning hatchery fish. Using Passive Integrated Transponder (PIT) tag technology, we
initiated a follow-up study to compare the abundance, growth, survival, and migration behavior of
hatchery and wild winter steelhead in Eagle Creek, 2010-15. We compared an area of natural
production most influenced by hatchery fish (upper Eagle Creek) to an area with less hatchery influence
(North Fork Eagle Creek). Our hypotheses were that abundance, growth, and survival of naturally
produced winter steelhead in upper Eagle Creek would be negatively impacted by naturally spawning
hatchery fish. We were also interested in whether the migratory behavior of naturally produced fish in
the two streams were similar to each other or exhibited patterns similar to hatchery fish. Problems were
encountered with some of our sampling techniques and sample sizes were often low; nevertheless, we
could not conclude that freshwater abundance, growth, survival, and migration behavior of naturally
produced winter steelhead in upper Eagle Creek were negatively impacted by naturally spawning
hatchery winter steelhead when compared to North Fork Eagle Creek. Juvenile and adult winter
steelhead from upper Eagle Creek performed as well as, or better than, fish from North Fork Eagle
Creek. Even though juvenile hatchery winter steelhead were found residualizing in upper Eagle Creek
but not in North Fork Eagle Creek, relative growth and abundance of juvenile winter steelhead were
higher in upper Eagle Creek. No significant differences were found in over-summer survival of
juveniles or in survival to adult. A greater proportion of migratory juveniles from upper Eagle Creek
were detected in the lower Columbia River compared to North Fork Eagle Creek. The migration
behavior for naturally produced winter steelhead from upper Eagle Creek and North Fork Eagle Creek
were more similar to each other than to hatchery fish. Genetic samples from 2005, 2006, and 2007 were
examined by Abernathy Fish Technology Center along with samples collected in 2010 and 2011 in order
to estimate the contribution of hatchery and wild steelhead to natural production in each of the study
sites. While both streams had evidence of hatchery-wild admixture, in three out of five years studied,
the North Fork Eagle Creek had less hatchery influence than upper Eagle Creek. When making
conclusions about genetic data, it was important to interpret the genetic impact of the hatchery in the
context of the timeframe it was sampled. The hatchery influence from genetic samples collected in 2007,
2010 and 2011 was significantly higher in upper Eagle Creek than in North Fork Eagle Creek; however,
in 2005 the hatchery influence was higher in North Fork Eagle Creek (no difference in 2006). Our
findings support the need for periodic evaluation of the hatchery program in Eagle Creek to ensure
parameters in the Hatchery and Genetic Management Plans and Section 7 Endangered Species Act
Biological Opinion are met.
1 Email address of corresponding author: [email protected]

ii
Page is intentionally left blank
Eagle Creek Hatchery-Wild Steelhead Ecological Interactions
iii
Table of Contents Abstract ............................................................................................................................................ i
List of Tables ................................................................................................................................. iv
List of Figures ................................................................................................................................ iv
Introduction ..................................................................................................................................... 1
Study Area ...................................................................................................................................... 2
Methods........................................................................................................................................... 3
Fish Sampling and PIT Tagging.................................................................................................. 3
Stationary PIT Tag Antennas in Eagle Creek and Lower Columbia River Detection Sites ....... 5
Data Analysis .............................................................................................................................. 9
Results ........................................................................................................................................... 11
Marking- .................................................................................................................................... 11
Juvenile Age Classification-...................................................................................................... 12
Juvenile Abundance by Age Class- ........................................................................................... 14
CPUE of Winter Steelhead by Age Class- ................................................................................ 16
Growth- ..................................................................................................................................... 17
PIT Antenna Operations in Eagle Creek- .................................................................................. 18
PIT Tagged Fish Detections and Migration Behavior in Eagle Creek- .................................... 18
PIT Tagged Fish Detections, Migration, and Relative Survival to the Lower Columbia River-
................................................................................................................................................... 21
PIT Tag Detection History, Probabilities, and Estimated Juvenile Survival- ........................... 21
Length-at-Tagging in Eagle Creek -.......................................................................................... 24
Juvenile-to-Adult Survival- ....................................................................................................... 25
Genetics-.................................................................................................................................... 25
Discussion ..................................................................................................................................... 25
Acknowledgements ....................................................................................................................... 31
Literature Cited ............................................................................................................................. 32
Appendix A: .................................................................................................................................. 35
Appendix B: .................................................................................................................................. 48
Eagle Creek Hatchery-Wild Steelhead Ecological Interactions
iv
List of Tables
Table 1. Total number of juvenile winter steelhead PIT tagged and released in upper Eagle and
North Fork Eagle Creeks, 2010-2012 ……………………………………………………………11
Table 2. Number of fish, excluding winter steelhead, incidentally caught in upper Eagle and
North Fork Eagle Creeks, 2010-2012 ……………………………………………………….…...12
Table 3. Mark-recapture data collected during electrofishing in upper Eagle and North Fork
Eagle Creeks 2010-12 by age/size class………………………………………………………....15
Table 4. Detection histories for wild winter steelhead tagged and released into North Fork Eagle
Creek and upper Eagle Creek, 2010-2012………………………………………………..….…..22
Table 5. Alternative model structures with apparent survival (Phi) and detection probability (p)
either constant or allowed to vary by reach (upper Eagle Creek versus North Fork Eagle Creek),
year (2010, 2011, and 2012), or both reach and year, along with associated Akaike’s Information
Criterion for small sample sizes (AICc), AICc differences, number of model parameters, and
deviance………………………………………………………………………………………….23
Table 6. Akaike’s Information Criterion (AIC) values and AIC differences for models of July-
early August length at tagging as a function of reach (North Fork Eagle Creek versus upper
Eagle Creek), year (2010, 2011, and 2012), and an interaction between reach and year
(Reach*Year)………………………………………………………………………………….....24
Table 7. Observed age class structure of PIT tagged winter steelhead from upper Eagle Creek,
North Fork Eagle Creek, and Eagle Creek National Fish Hatchery returning to the lower ladder
and relative percent survival from juvenile tagging (2010-12) to adult detection (2011-15)..…..25
List of Figures
Figure 1. Map of Eagle and North Fork Eagle Creek study area. The lower and upper boundaries
of the Eagle Creek study area extended from the middle ladder (rkm 14) to the upper falls above
Eagle Creek National Fish Hatchery (rkm 20). The lower and upper boundaries of the North
Fork study area extend from the confluence of North Fork Eagle Creek and Eagle Creek, just
above the lower fish ladder on Eagle Creek, to just below the headwaters of North Fork Eagle
Creek (rkm 12)…………………………………………………………………….…………….. 3
Figure 2. Electrofishing a sample reach in Eagle Creek………………………………………… 4
Figure 3. Eagle Creek Mouth (ECM) detection array and stream bottom anchoring system during
base flows………………………………………………………………………………………... 6
Figure 4. Eagle Creek Mouth (ECM) site during fall 2011 flood……………………………….. 7
Figure 5. PIT antenna inside the lower fish ladder on Eagle Creek ............................................... 7

Eagle Creek Hatchery-Wild Steelhead Ecological Interactions
v
Figure 6. PIT antenna inside the hatchery fish ladder on Eagle Creek ........................................... 8
Figure 7. Cormack-Jolly-Seber model parameters for apparent survival from Period 1 (July-
early August tagging) to Period 2 (August-September) recapture sampling (φ), the probability of
detecting fish that are alive during the August-September sampling (ρ), and the joint probability
of survival and detection for all subsequent detections (λ)………………………………………10
Figure 8. Fork length frequency distribution of fish used for age classification of winter steelhead
in upper Eagle and North Fork Eagle Creeks. .............................................................................. 12
Figure 9. Length frequency distribution of PIT tagged winter steelhead in upper Eagle Creek,
2010-2012.. ................................................................................................................................... 13
Figure 10. Length frequency distribution of PIT tagged winter steelhead in North Fork Eagle
Creeks, 2010-2012 ........................................................................................................................ 13
Figure 11. CPUE of age-0 and age-1 winter steelhead captured in upper Eagle and North Fork
Eagle Creeks during electrofishing, 2010-2012……………………………………………..…. 16
Figure 12. Average growth per day of PIT tagged juvenile winter steelhead in upper Eagle and
North Fork Eagle Creeks………………………………………………………………………...17
Figure 13. Monthly detections of PIT tagged juvenile winter steelhead at mouth antenna……..18
Figure 14. Monthly detections of PIT tagged juvenile winter steelhead at the lower ladder in
Eagle Creek ................................................................................................................................... 20
Figure 15. Monthly detections of PIT tagged adult winter steelhead at the lower ladder in Eagle
Creek.. ........................................................................................................................................... 20
Figure 16. Monthly detections of PIT tagged juvenile winter steelhead in the NOAA Fisheries
lower Columbia River trawl survey……………………………………………………………. 21
Figure 17. Predicted survival between sampling period one (July-early August) and sampling
period two (mid-August through September) as a function of fork length at tagging for Eagle
Creek winter steelhead, 2010-2012………………………………………………………….…. 23
Figure 18. Model estimates for mean July to early August fork length at PIT tagging for North
Fork Eagle Creek and upper Eagle Creek juvenile winter steelhead, 2010-2012…..…………. 24
Eagle Creek Hatchery-Wild Steelhead Ecological Interactions
1
Introduction
The U.S. Fish and Wildlife Service operate Eagle Creek National Fish Hatchery, with
reimbursable funding provided by NOAA Fisheries through the Mitchell Act. The hatchery
began operations in 1956 and production has changed over time depending on available funding,
evaluation results, and co-manager agreements (USFWS 2007). The hatchery has a history of
producing fall and spring Chinook salmon (Oncorhynchus tshawytscha), coho salmon (O.
kisutch), and steelhead trout (O. mykiss). During the period 1990-2007, the number of juvenile
hatchery fish annually released into Eagle Creek averaged 836,325 coho salmon and 176,000
winter steelhead. For brood years 2009-13 the planned juvenile hatchery production was
350,000 coho salmon and 100,000 winter steelhead for release into Eagle Creek. Coho salmon
are also produced at the hatchery for transfer to Tribal fish restoration programs upstream of
Bonneville Dam, but within Eagle Creek the hatchery has been classified as a segregated brood
stock for harvest (USFWS 2007). Naturally produced juvenile coho salmon and winter steelhead
are also found in Eagle and North Fork Eagle Creeks (Kavanagh et al. 2009).
Naturally produced “wild” winter steelhead in Eagle Creek of the Clackamas River watershed in
northwestern Oregon, are a population component of a Distinct Population Segment having
Threatened status under the Endangered Species Act (ESA; 63 FR 13347, March 1998). To
partially address ecological and genetic interactions between hatchery and wild winter steelhead
in Eagle Creek, a five-year evaluation was completed by the U.S. Fish and Wildlife Service in
July, 2009 (Kavanagh et al. 2009). The results from that study identified the North Fork Eagle
Creek as having the least amount of hatchery influence (based on radio telemetry, genetic
analyses, snorkel/electrofishing surveys, and spawning ground surveys), whereas upper Eagle
Creek (Figure 1), in particular, the section of stream between the middle ladder and hatchery
(rkm 14-21), was identified as the area having the greatest hatchery influence. Other interesting
findings from Kavanagh et al. (2009) and Brignon et al. (2012) pertain to juvenile rearing
densities (fish/m2). The authors found that age-1 juvenile winter steelhead were distributed
throughout Eagle Creek and North Fork Eagle Creek but at lower densities than age-0 fish. For
age-0 juvenile winter steelhead, upper Eagle Creek had the highest density and abundance
compared to other areas in Eagle Creek and North Fork Eagle Creek. The authors also found the
highest density of residual hatchery juvenile steelhead in upper Eagle Creek and none were
found in North Fork Eagle Creek.
One of the recommendations in Kavanagh et al. (2009) was to compare the productivity in North
Fork Eagle Creek to that in upper Eagle Creek using spawner-recruitment and smolt-to-adult
recovery rates to assess the impact of naturally spawning hatchery fish on the fitness and
productivity of the natural population. A difference between wild spawner-recruitment rates in
upper Eagle Creek and North Fork Eagle Creek could indicate that there are negative effects of
naturally spawning hatchery fish on the wild population in upper Eagle Creek. Chilcote (2003)
found that naturally spawning hatchery fish negatively impacted population productivity, overall
fitness of wild fish, and reduced the number of recruits by one-third when hatchery fish
comprised 30% or greater of the spawning population. Other studies (Araki et al. 2007; Lynch
and O’Hely 2001) have shown that the progeny of naturally spawning hatchery fish are less fit
and have lower adult survival than wild fish. Based on these findings, we hypothesize that

Eagle Creek Hatchery-Wild Steelhead Ecological Interactions
2
freshwater productivity, survival, and spawner-recruitment rates in upper Eagle Creek are
negatively impacted by naturally spawning hatchery fish.
To investigate our hypothesis, we compared several indices of productivity, including growth,
relative abundance, young-of-year to yearling smolt survival, and smolt-to-adult survival in
North Fork Eagle Creek and upper Eagle Creek. Unfortunately, the number of wild steelhead
smolts could not be estimated because of problems with our lower Eagle Creek detection site
(see Methods). We therefore modified our sampling plan to address the following objectives: 1)
Estimate the relative abundance, growth, and survival of juvenile winter steelhead in upper Eagle
Creek and North Fork Eagle Creek, 2) Estimate juvenile-to-adult survival of hatchery and wild
winter steelhead in upper Eagle Creek and North Fork Eagle Creek, 3) Determine juvenile
downstream and adult upstream migration behavior of hatchery and wild winter steelhead in the
Eagle Creek basin, and 4) Determine the genetic contribution to natural production of hatchery
and wild winter steelhead in Upper Eagle Creek and North Fork Eagle Creek. This final report
summarizes our 2010-2015 field investigation of assessing the ecological and genetic impacts of
a segregated hatchery program on the productivity, behavior, and survival of naturally produced
winter steelhead in upper Eagle and North Fork Eagle Creeks.
Study Area
Study Site- Eagle Creek, one of the major tributaries to the lower Clackamas River, originates in
the Mount Hood National Forest and flows northwest to its confluence with the Clackamas River
at river kilometer 26 (Figure 1). The main-stem of Eagle Creek is managed for both natural and
hatchery production of salmon and winter steelhead. Eagle Creek National Fish Hatchery (NFH)
is located at river kilometer 20 of Eagle Creek, approximately 1 kilometer below the upper falls
which are an impassable fish barrier. The hatchery operates three fish ladders to facilitate
upstream adult fish passage. One ladder is located at the lower falls (rkm9) below the confluence
of Eagle Creek and North Fork Eagle Creek, and one is located at the middle falls (rkm 14). A
third ladder is located at the entrance to the hatchery (rkm 20) and is used to collect brood stock
and surplus hatchery fish. In addition to the planned hatchery production and release of
approximately 100,000 juvenile winter steelhead and 350,000 juvenile coho salmon into Eagle
Creek, a spring Chinook salmon program of 240,000 fish was initiated with Oregon Department
of Fish and Wildlife in 2013 for release in 2015. Kavanagh et al. (2009) and USFWS (2007)
provide additional information on the hatchery program.
North Fork Eagle Creek flows into Eagle Creek at river kilometer 11, just upstream of the lower
fish ladder (Figure 1). No juvenile hatchery fish are released into the North Fork Eagle Creek.
North Fork Eagle Creek is managed as a natural production area for salmon and winter steelhead
in the Eagle Creek basin.
Our study objectives were to compare the growth, behavior, and survival of winter steelhead in
two study sites, upper Eagle Creek and North Fork Eagle Creek (Figure 1). The lower boundary
of the upper Eagle Creek study site was approximately 100 meters upstream of the middle falls
fish ladder located at rkm 14. The upper boundary of the study site was at the upper falls (rkm
21). The total distance between the lower and upper boundaries was approximately 6 kilometers.

Eagle Creek Hatchery-Wild Steelhead Ecological Interactions
3
The upper Eagle Creek study site was sub-divided into 30, 200-m reaches for sampling. The
lower boundary of the North Fork Eagle Creek study site was at the confluence with Eagle
Creek, and the upper boundary was 12 rkm upstream, approximately 3 rkm downstream from the
headwaters of the North Fork. The North Fork Eagle Creek study site was sub-divided into 58,
200-m reaches for sampling.
Figure 1. Map of Eagle and North Fork Eagle Creek study area. The lower and upper boundaries of the
Eagle Creek study area extended from the middle ladder (rkm 14) to the upper falls above Eagle Creek
National Fish Hatchery (rkm 20). The lower and upper boundaries of the North Fork study area extend
from the confluence of North Fork Eagle Creek and Eagle Creek, just above the lower fish ladder on
Eagle Creek, to just below the headwaters of North Fork Eagle Creek (rkm 12).
Methods
Fish Sampling and PIT Tagging
Marking- To achieve our objectives, juvenile fish from each of the study sites were marked
using Passive Integrated Transponder (PIT) tags. Our goal was to PIT tag 1,500 juvenile
steelhead in upper Eagle Creek and 1,500 in North Fork Eagle Creek each year for three years.
This tagging level was chosen as a balance between maximizing the number of fish to tag each
Eagle Creek Hatchery-Wild Steelhead Ecological Interactions
4
year in order to achieve our objectives, being logistically feasible, and minimizing impact to wild
fish. To reach the tagging goal, upper Eagle Creek (30 reaches) and North Fork Eagle Creek (58
reaches) study areas were sampled throughout July to early August 2010-12. Sampling began
each year in the North Fork reaches, and then sampling efforts were alternated between the two
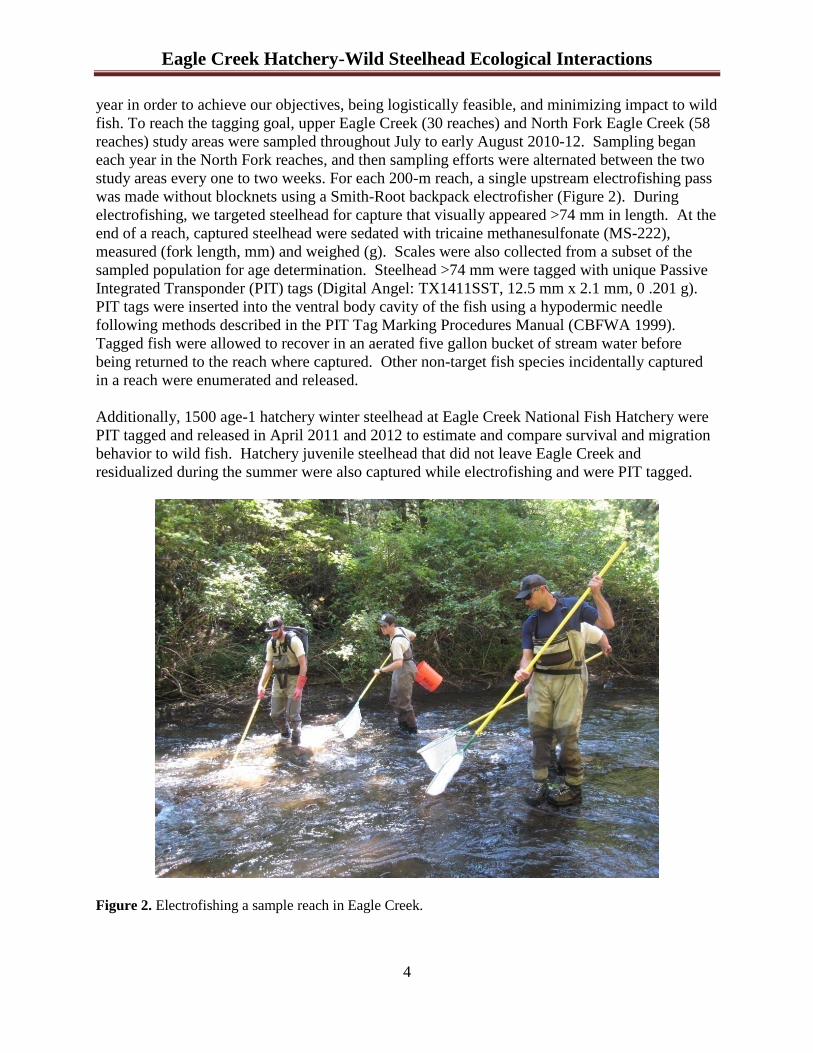
study areas every one to two weeks. For each 200-m reach, a single upstream electrofishing pass
was made without blocknets using a Smith-Root backpack electrofisher (Figure 2). During
electrofishing, we targeted steelhead for capture that visually appeared >74 mm in length. At the
end of a reach, captured steelhead were sedated with tricaine methanesulfonate (MS-222),
measured (fork length, mm) and weighed (g). Scales were also collected from a subset of the
sampled population for age determination. Steelhead >74 mm were tagged with unique Passive
Integrated Transponder (PIT) tags (Digital Angel: TX1411SST, 12.5 mm x 2.1 mm, 0 .201 g).
PIT tags were inserted into the ventral body cavity of the fish using a hypodermic needle
following methods described in the PIT Tag Marking Procedures Manual (CBFWA 1999).
Tagged fish were allowed to recover in an aerated five gallon bucket of stream water before
being returned to the reach where captured. Other non-target fish species incidentally captured
in a reach were enumerated and released.
Additionally, 1500 age-1 hatchery winter steelhead at Eagle Creek National Fish Hatchery were
PIT tagged and released in April 2011 and 2012 to estimate and compare survival and migration
behavior to wild fish. Hatchery juvenile steelhead that did not leave Eagle Creek and
residualized during the summer were also captured while electrofishing and were PIT tagged.
Figure 2. Electrofishing a sample reach in Eagle Creek.
Eagle Creek Hatchery-Wild Steelhead Ecological Interactions
5
Recapture- Recaptures of tagged fish were used to estimate relative abundance, growth, and
summer survival of juvenile steelhead. For sample years 2010-12, we began recapturing fish in
upper Eagle and North Fork Eagle Creeks in mid-August to early September, approximately one
month after initial tagging. For all years, 15 reaches in upper Eagle Creek and 13 reaches in
North Fork Eagle Creek were randomly selected for recapture. A single upstream electrofishing
pass, without blocknets, was made in the selected 200-m units to capture fish. Captured
steelhead were anaesthetized, physically examined for the presence of a mark or tagging scar,
and scanned for a PIT tag using a portable PIT tag detector (i.e. FS 2001-ISO, or Oregon RFID
GES3S). If a PIT tag was present, the tag information was stored electronically in a data file on
the PIT tag reader and/or manually recorded on a data sheet. Recaptured fish were measured and
weighed to collect information on growth rate between sampling periods.
In years where we were unable to meet our goal of PIT tagging 1500 steelhead in both upper
Eagle and North Fork Eagle Creeks (2011 & 2012), untagged fish captured during the recapture
period were measured, weighed and implanted with PIT tags.
Stationary PIT Tag Antennas in Eagle Creek and Lower Columbia River Detection Sites
Eagle Creek Mouth Detection Array– A PIT tag antenna array was installed at the mouth of
Eagle Creek to detect out-migrating tagged juvenile winter steelhead (Figure 1). Detections were
used in juvenile survival analyses as well as to monitor the migration behavior of juvenile fish.
The Eagle Creek Mouth (ECM) detection array was installed in July 2010 and was located in
Eagle Creek on private property approximately one kilometer upstream from the confluence of
Eagle Creek and the Clackamas River. The site consisted of four antennas operated with a single
FS1001M multiplexing transceiver (MUX). The four antennas were positioned in line spanning
perpendicular to the stream channel. The ECM detection array spanned approximately 95% of
the stream width profile during base flow. PIT antennas were constructed out of 10.2 cm (4”)
schedule 80 PVC with 1.9 cm (¾”) schedule 40 PVC and insulation foam internally supporting
14-gauge, 8-strand ribbon cable. The final inductance values of the antennas ranged from 224 to
260 µH, and the final capacitance values ranged from 5.56 to 6.25 nF depending on antenna type
and location. The Eagle Creek MUX, stored in an aluminum lockbox, was powered off grid
using an AC to DC power adapter and was configured to upload daily interrogation files to a
laptop computer using PTAGIS Minimon software. Site checkups including debris removal,
manual tuning, and data downloads were conducted year round on a weekly basis while the site
was operational.
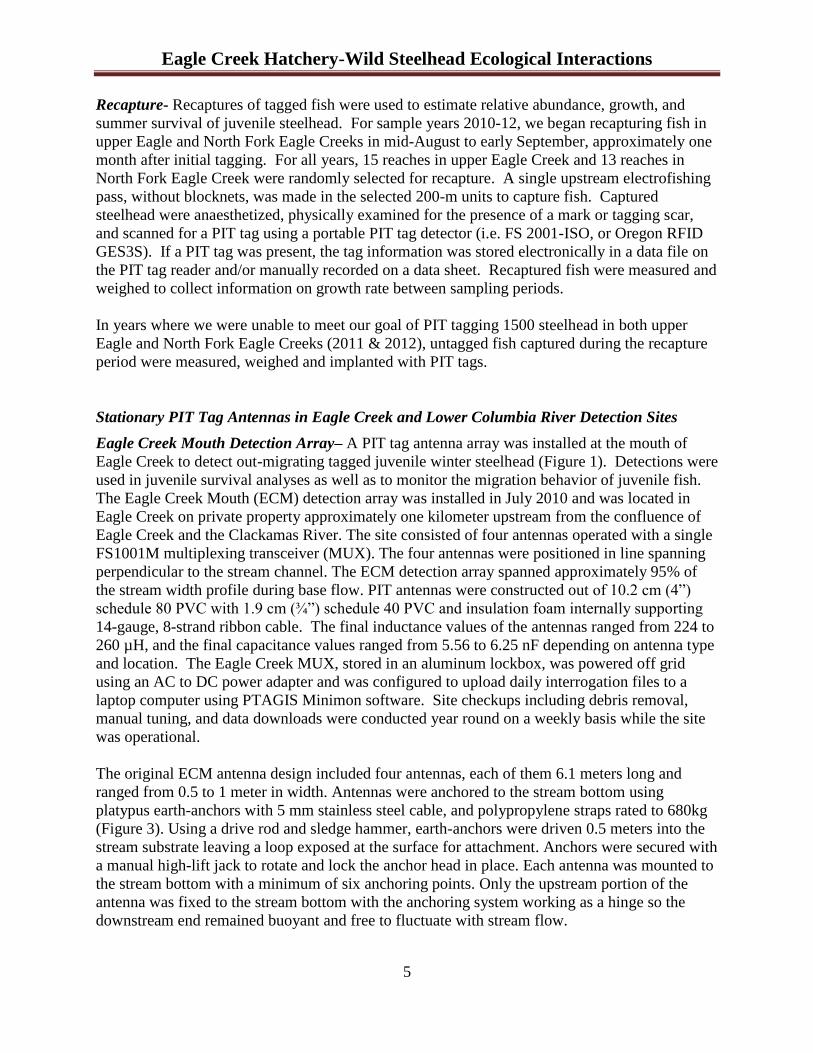
The original ECM antenna design included four antennas, each of them 6.1 meters long and
ranged from 0.5 to 1 meter in width. Antennas were anchored to the stream bottom using
platypus earth-anchors with 5 mm stainless steel cable, and polypropylene straps rated to 680kg
(Figure 3). Using a drive rod and sledge hammer, earth-anchors were driven 0.5 meters into the
stream substrate leaving a loop exposed at the surface for attachment. Anchors were secured with
a manual high-lift jack to rotate and lock the anchor head in place. Each antenna was mounted to
the stream bottom with a minimum of six anchoring points. Only the upstream portion of the
antenna was fixed to the stream bottom with the anchoring system working as a hinge so the
downstream end remained buoyant and free to fluctuate with stream flow.
Eagle Creek Hatchery-Wild Steelhead Ecological Interactions
6
Figure 3. Eagle Creek Mouth (ECM) detection array and stream bottom anchoring system during base
flows.
After a flood event in late January 2011, the original ECM antennas were destroyed. Four new
antennas were built and installed in early March 2011 at the same location. The new antennas
were shorter in length (3.1 meters) and width (0.6 meters) and were securely anchored to the
stream bottom on both the upstream and downstream ends (i.e. pass over configuration). A flood
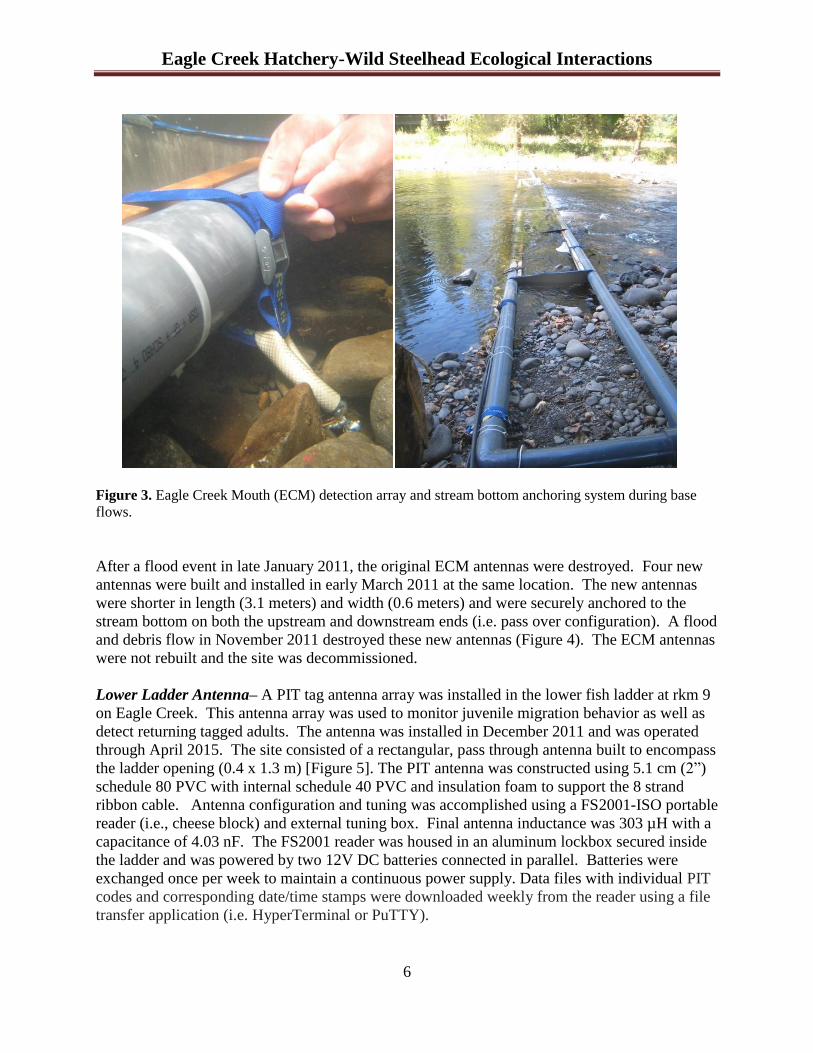
and debris flow in November 2011 destroyed these new antennas (Figure 4). The ECM antennas
were not rebuilt and the site was decommissioned.
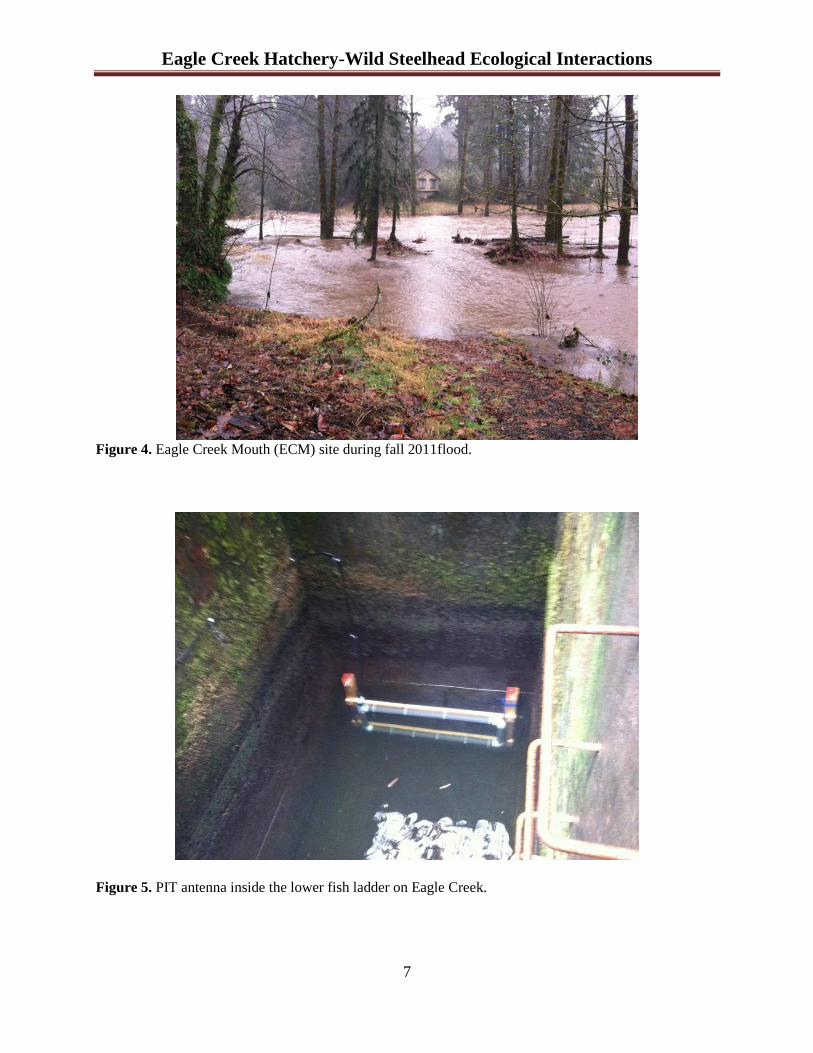
Lower Ladder Antenna– A PIT tag antenna array was installed in the lower fish ladder at rkm 9
on Eagle Creek. This antenna array was used to monitor juvenile migration behavior as well as
detect returning tagged adults. The antenna was installed in December 2011 and was operated
through April 2015. The site consisted of a rectangular, pass through antenna built to encompass
the ladder opening (0.4 x 1.3 m) [Figure 5]. The PIT antenna was constructed using 5.1 cm (2”)
schedule 80 PVC with internal schedule 40 PVC and insulation foam to support the 8 strand
ribbon cable. Antenna configuration and tuning was accomplished using a FS2001-ISO portable
reader (i.e., cheese block) and external tuning box. Final antenna inductance was 303 µH with a
capacitance of 4.03 nF. The FS2001 reader was housed in an aluminum lockbox secured inside
the ladder and was powered by two 12V DC batteries connected in parallel. Batteries were
exchanged once per week to maintain a continuous power supply. Data files with individual PIT
codes and corresponding date/time stamps were downloaded weekly from the reader using a file
transfer application (i.e. HyperTerminal or PuTTY).
Eagle Creek Hatchery-Wild Steelhead Ecological Interactions
7
Figure 4. Eagle Creek Mouth (ECM) site during fall 2011flood.
Figure 5. PIT antenna inside the lower fish ladder on Eagle Creek.
Eagle Creek Hatchery-Wild Steelhead Ecological Interactions
8
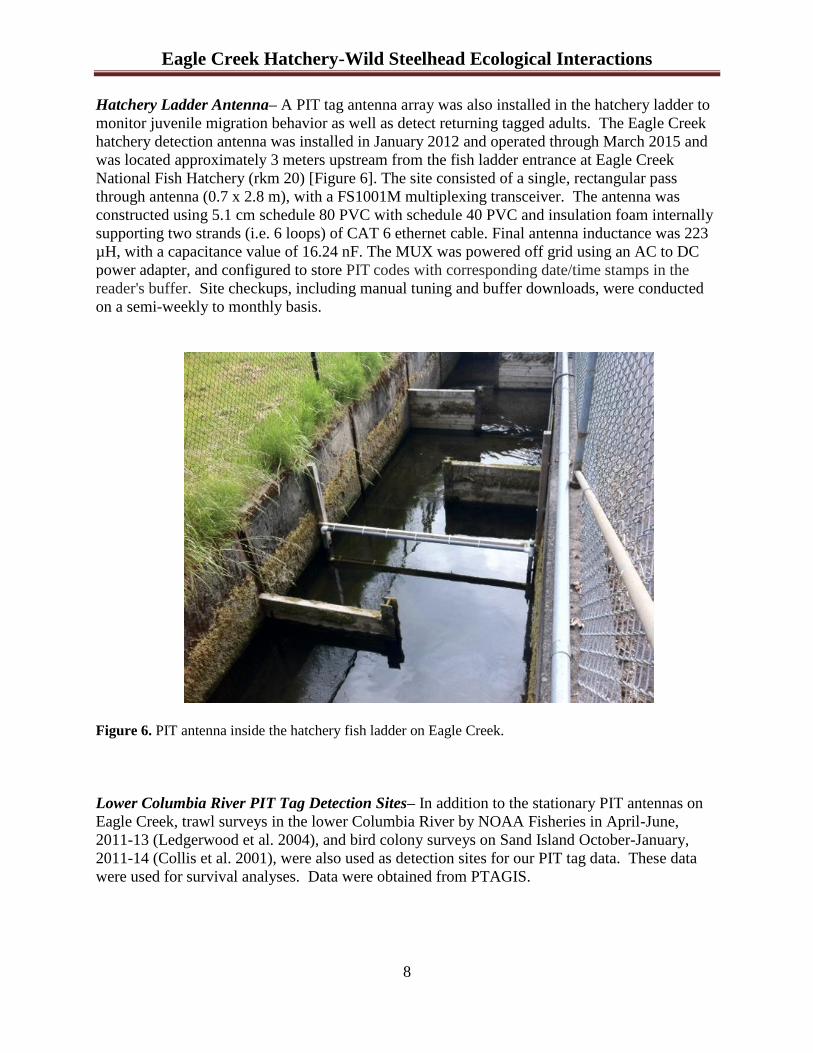
Hatchery Ladder Antenna– A PIT tag antenna array was also installed in the hatchery ladder to
monitor juvenile migration behavior as well as detect returning tagged adults. The Eagle Creek
hatchery detection antenna was installed in January 2012 and operated through March 2015 and
was located approximately 3 meters upstream from the fish ladder entrance at Eagle Creek
National Fish Hatchery (rkm 20) [Figure 6]. The site consisted of a single, rectangular pass
through antenna (0.7 x 2.8 m), with a FS1001M multiplexing transceiver. The antenna was
constructed using 5.1 cm schedule 80 PVC with schedule 40 PVC and insulation foam internally
supporting two strands (i.e. 6 loops) of CAT 6 ethernet cable. Final antenna inductance was 223
µH, with a capacitance value of 16.24 nF. The MUX was powered off grid using an AC to DC
power adapter, and configured to store PIT codes with corresponding date/time stamps in the
reader's buffer. Site checkups, including manual tuning and buffer downloads, were conducted
on a semi-weekly to monthly basis.
Figure 6. PIT antenna inside the hatchery fish ladder on Eagle Creek.
Lower Columbia River PIT Tag Detection Sites– In addition to the stationary PIT antennas on
Eagle Creek, trawl surveys in the lower Columbia River by NOAA Fisheries in April-June,
2011-13 (Ledgerwood et al. 2004), and bird colony surveys on Sand Island October-January,
2011-14 (Collis et al. 2001), were also used as detection sites for our PIT tag data. These data
were used for survival analyses. Data were obtained from PTAGIS.
Eagle Creek Hatchery-Wild Steelhead Ecological Interactions
9
Data Analysis
Juvenile Age Classification- Scale samples were gently scraped off of a gum-card with a dull
scalpel, pressed between two microscope slides, secured with adhesive tape and inserted into a
properly labeled (e.g., species, stream, length) coin envelope. Scales were viewed through a
Microfiche reader (47X magnification) without knowledge of the fish’s length or weight.
Steelhead ages were determined via counting scale annuli (Davis and Light 1985). For example,
if two annuli were counted on a scale, the fish was presumed to be two years old. Occasionally,
rainbow trout do not lay down an annulus during their first year of life (Minard and Dye 1997).
To address this potential problem, circuli between the focus and first annulus were counted in
thirty-eight samples; a range of seven to twelve circuli was determined. Indistinguishable annuli
between the seventh and twelfth circuli were assumed to be present. Unreadable scales (i.e.,
damaged or regenerated) were not incorporated into the age analysis.
Juvenile Abundance by Age Class- Using the mark-recapture data, the Chapman modification
for the Lincoln-Peterson estimate was used to estimate relative abundance of winter steelhead by
age class for each sample year, using the following equation:
𝑁 = (𝑀 + 1)(𝐶 + 1)
(𝑅 + 1)− 1
where “N” is the population estimate, “M” is the number of marked fish in period 1 (July to
early August), “C” is the total number of fish recaptured (tagged and non-tagged) in period 2
(mid-August to early September), and “R” is the number of recaptured fish in period 2 with a
PIT tag. Confidence intervals were calculated from the variance of N (population estimate).
Catch Per Unit Effort (CPUE) by Age Class- CPUE was used as another method to compare
relative juvenile fish abundance and was calculated as the number of juvenile steelhead caught in
a stream reach divided by the effort (minutes of electrofishing). A two-way ANOVA was
performed to compare CPUE data for each age class by stream and year.
Juvenile Fish Growth- Growth data for juvenile steelhead was obtained from fish that were
tagged and subsequently recaptured. Growth rate was calculated as the difference in fork length
between time at capture and recapture. Differences in growth rate for fish in Eagle and North
Fork Eagle Creek were tested using a two-sample Mann-Whitney test.
Migration Behavior and Relative Survival to the Lower Columbia River- PIT tag detections of
fish at stationary antennas within Eagle Creek and at detections sites in the lower Columbia
River were downloaded and summarized by month and year to describe the migration behavior
of study groups. The proportion of juveniles observed in the lower Columbia River trawl survey
(and Sand Island detections) to total juveniles PIT tagged in the three study sites (upper Eagle
Creek, North Fork Eagle Creek, and the hatchery) were analyzed by chi square contingency
tables to compare relative survival of juvenile fish from Eagle Creek to the lower Columbia
River.

Eagle Creek Hatchery-Wild Steelhead Ecological Interactions
10
PIT Tag Detection History, Probabilities and Estimated Juvenile Survival- We applied the
Cormack-Jolly-Seber (CJS) model implemented within the software program MARK to estimate
summer survival, between the July to early August marking event (Period 1) and the mid-August
to September recapture event (Period 2), for juvenile steelhead in upper Eagle Creek and North
Fork Eagle Creek. The CJS model uses data on the number of fish that were and were not
detected on multiple sampling occasions to estimate the apparent survival rate (φ) and the
probability of detection (ρ) on each sampling occasion (Figure 7). The July to early August
tagging, mid-August to September recapture sampling (approximately one month after initial
tagging), and subsequent detection data allow for a three-digit, binary, tabulation of the data that
is termed a “detection history”. Each fish is coded with a one to represent detection, and a zero
to represent non-detection, during a sampling period. With three sampling periods for this study
(July to early August tagging, mid-August to September sampling, and all subsequent
detections), the CJS model can estimate the apparent survival rate from the July-August tagging
until the August-September sampling period (φ), the probability of sampling fish that are alive
during the August-September sampling (ρ), and the joint probability of survival and detection for
all subsequent detections (λ).
Figure 7. Cormack-Jolly-Seber model parameters for apparent survival from Period 1 (July-August
tagging) to Period 2 (August-September) recapture sampling (φ), the probability of detecting fish that are
alive during the August-September sampling (ρ), and the joint probability of survival and detection for all
subsequent detections (λ).
Within the software program MARK, a variety of hypotheses about survival and detection
probability can be evaluated using Akaike’s Information Criterion (AIC), with lower AIC values
indicating a better degree of fit to the data. We were interested in evaluating whether survival
and detection probabilities varied by reach (upper Eagle Creek versus North Fork Eagle Creek),
tagging year (2010, 2011, or 2012), or by both reach and tagging year. Alternatively, survival
and/or detection probabilities may be similar or “constant” across reaches or tagging years. Each
of these hypotheses was evaluated within the MARK program, using AIC to determine which
hypothesis resulted in the best fit to the data. To evaluate whether length-at-tagging influenced
survival, we included length as an individual covariate for modeling survival, and examined the
AIC scores to determine whether length improved the degree of model fit.
Juvenile to Adult Survival- Fish detected at the lower ladder Eagle Creek antenna site two or
more years after tagging (through spring of 2015) were presumed to be returning adult fish.
Percent adult return was estimated from juvenile tagging to recovery, by age at return. Adult
return estimates should be considered minimum estimates because adult fish may have been able
to traverse the lower falls without swimming up the fish ladder during some high streamflow
conditions. Differences in observed adult detections at the lower ladder for fish PIT tagged in
July-August August-September

Eagle Creek Hatchery-Wild Steelhead Ecological Interactions
11
upper Eagle Creek, North Fork Eagle Creek, and at the hatchery were analyzed by chi-square
contingency table.
Genetics- Genetic samples from juvenile winter steelhead were collected in order to estimate the
contribution of hatchery and wild steelhead to natural production in each of the study sites.
Samples were collected in conjunction with sampling and PIT tagging in Eagle and North Fork
Eagle Creeks. A small, 3 mm fin tissue sample was taken from100 natural origin winter
steelhead in each creek, each year (2010-2012). Fin clips were placed in uniquely numbered
vials containing 100% ethanol and provided to the U.S. Fish and Wildlife Service, Abernathy
Fish Technology Center for genetic analysis (Appendix A).
Results
Marking- The total number of winter steelhead PIT tagged in upper Eagle Creek, including fish
tagged during the recapture events, was 1,531 in 2010, 1,235 in 2011, and 920 in 2012. The total
number of PIT tagged winter steelhead in North Fork Eagle Creek, including fish tagged during
the recapture events, was 1,385 in 2010, 1,303 in 2011, and 1,087 in 2012 (Table 1). The
number of residualized hatchery steelhead captured each summer in upper Eagle Creek and
subsequently inserted with PIT tags was 364 in 2010, 30 in 2011, and 41 in 2012. At the
hatchery, 1500 yearling hatchery winter steelhead were PIT tagged and released in April 2011
and 2012. While targeting our catch for juvenile winter steelhead, other fish were also present
and incidentally captured, including cutthroat trout (O. clarki), coho salmon, and lamprey
(Entosphenus tridentatus and Lampetra sp.). Two juvenile and one adult spring Chinook salmon
were also caught in upper Eagle Creek (Table 2).
Table 1. Total number of juvenile winter steelhead PIT tagged and released in upper Eagle and North
Fork Eagle Creeks (NFEC), 2010-2012 during both the initial sampling event and subsequent recapture
events. The number of hatchery winter steelhead tagged at the hatchery as well as those hatchery residuals
captured in upper Eagle Creek and PIT tagged is also included. Mortalities (Morts) are the total number
of mortalities during sampling. PIT tagged mortalities are not included in the total number of PIT tagged
fish. Three of the steelhead mortalities were directly related to PIT tagging while the remaining
mortalities were likely due to electrofishing or handling stress.
Stream Year
2010 2011 2012
# PIT tagged # Morts # PIT tagged # Morts # PIT tagged # Morts
Upper
Eagle Cr.
1531 24 1235 16 920 18
NFEC
1385 9
1303 8
1087 5
Upper
Eagle Cr.
(Hatchery
Residuals)
364 0
30 0
41 0
Hatchery 1500 1500
Eagle Creek Hatchery-Wild Steelhead Ecological Interactions
12
Table 2. Number of fish, excluding winter steelhead, incidentally caught in upper Eagle (UEC) and North
Fork Eagle Creeks (NFEC), 2010-2012.
2010 2011 2012
UEC NFEC UEC NFEC UEC NFEC
Coho salmon 21 57 10 110 104 118
Cutthroat trout 78 335 26 266 75 169
Spr. Chinook salmon 3 0 0 0 0 0
Lamprey 0 9 0 6 1 5
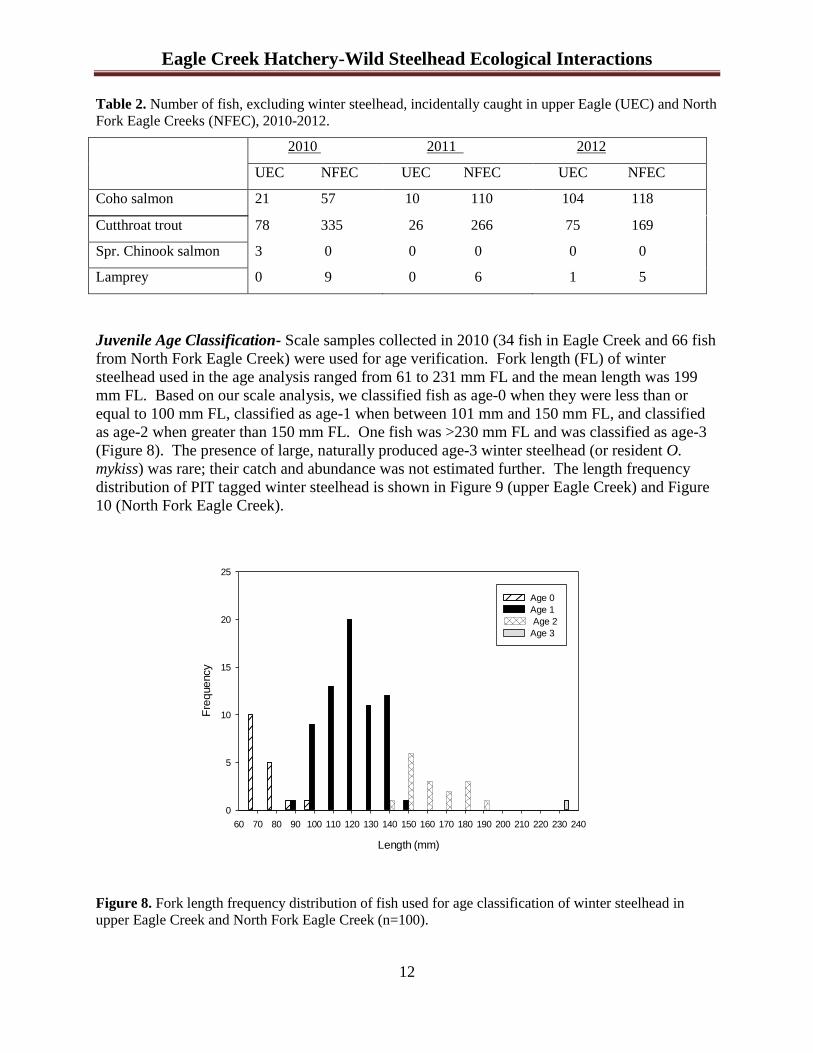
Juvenile Age Classification- Scale samples collected in 2010 (34 fish in Eagle Creek and 66 fish
from North Fork Eagle Creek) were used for age verification. Fork length (FL) of winter
steelhead used in the age analysis ranged from 61 to 231 mm FL and the mean length was 199
mm FL. Based on our scale analysis, we classified fish as age-0 when they were less than or
equal to 100 mm FL, classified as age-1 when between 101 mm and 150 mm FL, and classified
as age-2 when greater than 150 mm FL. One fish was >230 mm FL and was classified as age-3
(Figure 8). The presence of large, naturally produced age-3 winter steelhead (or resident O.
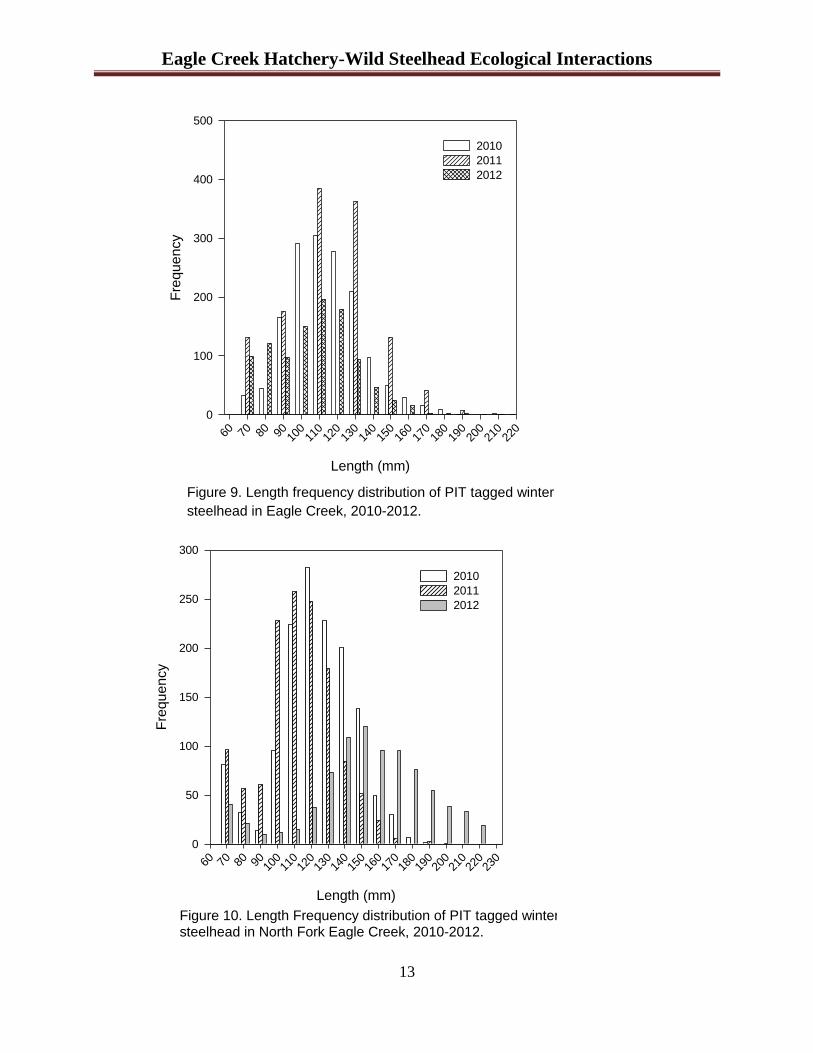
mykiss) was rare; their catch and abundance was not estimated further. The length frequency
distribution of PIT tagged winter steelhead is shown in Figure 9 (upper Eagle Creek) and Figure
10 (North Fork Eagle Creek).
Figure 8. Fork length frequency distribution of fish used for age classification of winter steelhead in
upper Eagle Creek and North Fork Eagle Creek (n=100).
Length (mm)
60 70 80 90 100 110 120 130 140 150 160 170 180 190 200 210 220 230 240
Fre
que
ncy
0
5
10
15
20
25
Age 0
Age 1
Age 2
Age 3
Eagle Creek Hatchery-Wild Steelhead Ecological Interactions
13
Figure 9. Length frequency distribution of PIT tagged winter
steelhead in Eagle Creek, 2010-2012.
Length (mm)
60 70 80 90 100
110
120
130
140
150
160
170
180
190
200
210
220
Fre
quency
0
100
200
300
400
500
2010
2011
2012
Length (mm)
60 70 80 90 100
110
120
130
140
150
160
170
180
190
200
210
220
230
Fre
quency
0
50
100
150
200
250
300
2010
2011
2012
Figure 10. Length Frequency distribution of PIT tagged winter steelhead in North Fork Eagle Creek, 2010-2012.

Eagle Creek Hatchery-Wild Steelhead Ecological Interactions
14
Juvenile Abundance by Age Class-
Mark recapture data and abundance estimates are shown in Table 3. In 2010, relative abundance
of winter steelhead in upper Eagle Creek was 6,203 (± 3,362 95% CI) age-0, 8,372 (± 1,562 95%
CI) age-1, and 560 (± 259 95% CI) age-2 fish. Relative abundance of fish in North Fork Eagle
Creek was 1,201 (± 767 95% CI) age-0, 4,896 (± 1,094 95% CI) age-1, and 245 (± 116 95% CI)
age-2 fish. The estimated abundance of hatchery fish in upper Eagle Creek was 8 (± 8 95% CI)
age-0, 1,959 (± 765 95% CI) age-1, and 319 (± 201 95% CI) age-2 fish. No juvenile hatchery
fish were caught in North Fork Eagle Creek.
In 2011, relative abundance of winter steelhead in upper Eagle Creek was 9,051 (± 10,059 95%
CI) age-0, 5,865 (± 1,883 95% CI) age-1, and 223 (± 98 95% CI) age-2 fish. Relative abundance
of fish in North Fork Eagle Creek was 2,216 (± 1,447 95% CI) age-0, 4,247 (± 994 95% CI) age-
1, and 210 (± 96 95% CI) age-2 fish. The estimated abundance of hatchery fish in upper Eagle
Creek was 50 (± 56 95% CI) age-1 and 134 (± 170 95% CI) age-2 fish. No age-0 hatchery
steelhead were caught in upper Eagle Creek in 2011. No juvenile hatchery fish were caught in
North Fork Eagle Creek.
In 2012, relative abundance of winter steelhead in upper Eagle Creek was 5,580 (± 4,327 95%
CI) age-0, 4,303 (± 1,522 95% CI) age-1, and 139 (± 80 95% CI) age-2 fish. Relative abundance
of fish in North Fork Eagle Creek was 1,539 (± 1,678 95% CI) age-0, 4,584 (± 1,527 95% CI)
age-1, and 215 (± 113 95% CI) age-2 fish. The estimated abundance of hatchery fish in upper
Eagle Creek was 214 (± 184 95% CI) age-2 fish. No age-0 or age-1 hatchery steelhead were
caught in upper Eagle Creek in 2012. No juvenile hatchery fish were caught in North Fork Eagle
Creek.
Eagle Creek Hatchery-Wild Steelhead Ecological Interactions
15
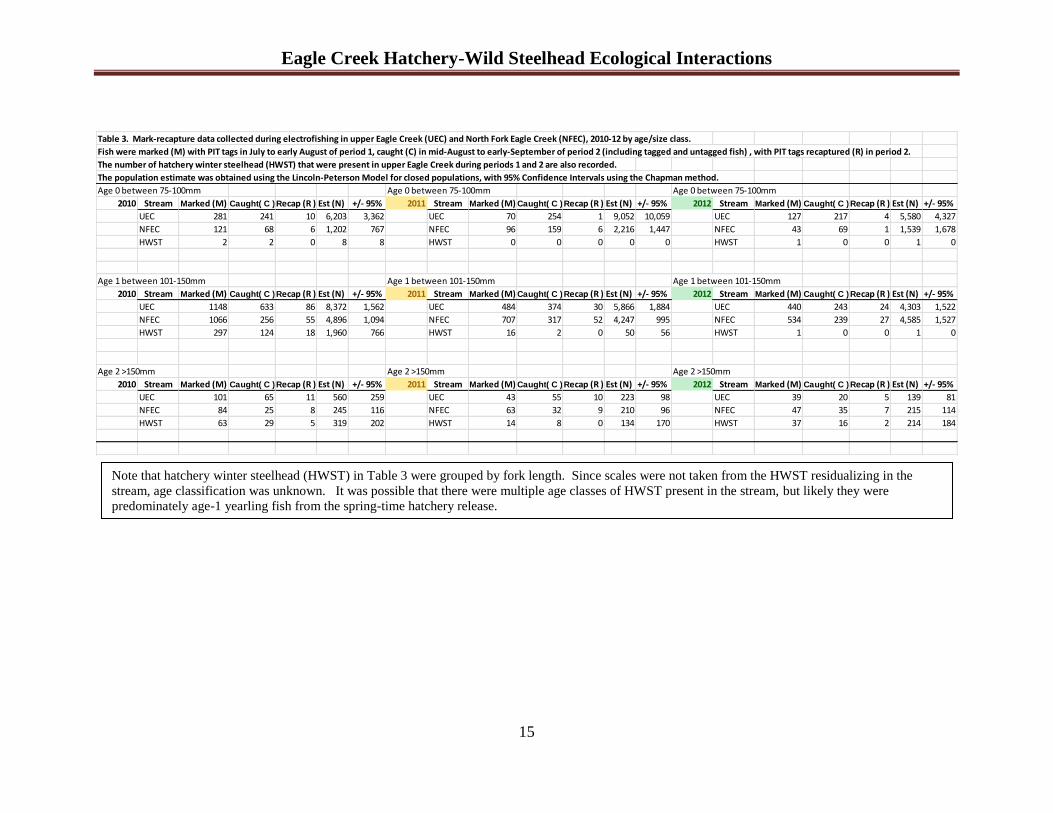
Table 3. Mark-recapture data collected during electrofishing in upper Eagle Creek (UEC) and North Fork Eagle Creek (NFEC), 2010-12 by age/size class.
Fish were marked (M) with PIT tags in July to early August of period 1, caught (C) in mid-August to early-September of period 2 (including tagged and untagged fish) , with PIT tags recaptured (R) in period 2.
The number of hatchery winter steelhead (HWST) that were present in upper Eagle Creek during periods 1 and 2 are also recorded.
The population estimate was obtained using the Lincoln-Peterson Model for closed populations, with 95% Confidence Intervals using the Chapman method.
Age 0 between 75-100mm Age 0 between 75-100mm Age 0 between 75-100mm
2010 Stream Marked (M) Caught( C )Recap (R ) Est (N) +/- 95% 2011 Stream Marked (M) Caught( C )Recap (R ) Est (N) +/- 95% 2012 Stream Marked (M) Caught( C )Recap (R ) Est (N) +/- 95%
UEC 281 241 10 6,203 3,362 UEC 70 254 1 9,052 10,059 UEC 127 217 4 5,580 4,327
NFEC 121 68 6 1,202 767 NFEC 96 159 6 2,216 1,447 NFEC 43 69 1 1,539 1,678
HWST 2 2 0 8 8 HWST 0 0 0 0 0 HWST 1 0 0 1 0
Age 1 between 101-150mm Age 1 between 101-150mm Age 1 between 101-150mm
2010 Stream Marked (M) Caught( C )Recap (R ) Est (N) +/- 95% 2011 Stream Marked (M) Caught( C )Recap (R ) Est (N) +/- 95% 2012 Stream Marked (M) Caught( C )Recap (R ) Est (N) +/- 95%
UEC 1148 633 86 8,372 1,562 UEC 484 374 30 5,866 1,884 UEC 440 243 24 4,303 1,522
NFEC 1066 256 55 4,896 1,094 NFEC 707 317 52 4,247 995 NFEC 534 239 27 4,585 1,527
HWST 297 124 18 1,960 766 HWST 16 2 0 50 56 HWST 1 0 0 1 0
Age 2 >150mm Age 2 >150mm Age 2 >150mm
2010 Stream Marked (M) Caught( C )Recap (R ) Est (N) +/- 95% 2011 Stream Marked (M) Caught( C )Recap (R ) Est (N) +/- 95% 2012 Stream Marked (M) Caught( C )Recap (R ) Est (N) +/- 95%
UEC 101 65 11 560 259 UEC 43 55 10 223 98 UEC 39 20 5 139 81
NFEC 84 25 8 245 116 NFEC 63 32 9 210 96 NFEC 47 35 7 215 114
HWST 63 29 5 319 202 HWST 14 8 0 134 170 HWST 37 16 2 214 184
Note that hatchery winter steelhead (HWST) in Table 3 were grouped by fork length. Since scales were not taken from the HWST residualizing in the
stream, age classification was unknown. It was possible that there were multiple age classes of HWST present in the stream, but likely they were
predominately age-1 yearling fish from the spring-time hatchery release.
Eagle Creek Hatchery-Wild Steelhead Ecological Interactions
16
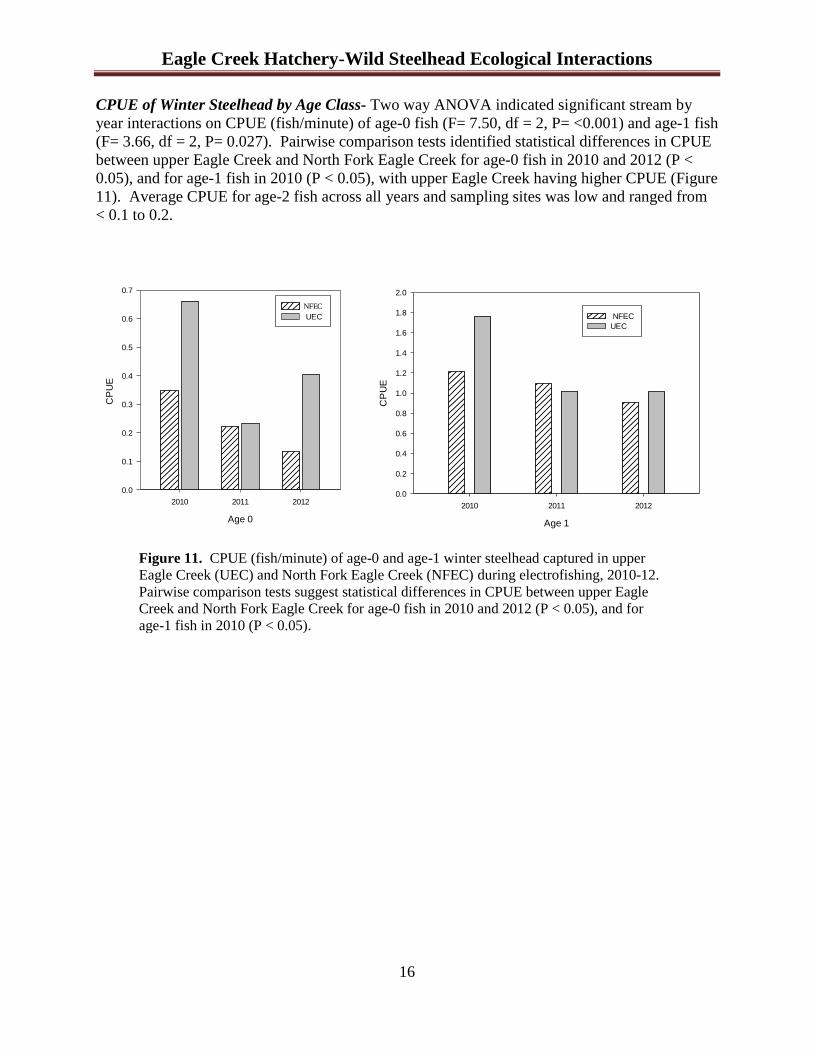
CPUE of Winter Steelhead by Age Class- Two way ANOVA indicated significant stream by
year interactions on CPUE (fish/minute) of age-0 fish (F= 7.50, df = 2, P= <0.001) and age-1 fish
(F= 3.66, df = 2, P= 0.027). Pairwise comparison tests identified statistical differences in CPUE
between upper Eagle Creek and North Fork Eagle Creek for age-0 fish in 2010 and 2012 (P <
0.05), and for age-1 fish in 2010 (P < 0.05), with upper Eagle Creek having higher CPUE (Figure
11). Average CPUE for age-2 fish across all years and sampling sites was low and ranged from
< 0.1 to 0.2.
Age 0
2010 2011 2012
CP
UE
0.0
0.1
0.2
0.3
0.4
0.5
0.6
0.7
NFEC
UEC
Age 1
2010 2011 2012
CP
UE
0.0
0.2
0.4
0.6
0.8
1.0
1.2
1.4
1.6
1.8
2.0
NFEC
UEC
Figure 11. CPUE (fish/minute) of age-0 and age-1 winter steelhead captured in upper
Eagle Creek (UEC) and North Fork Eagle Creek (NFEC) during electrofishing, 2010-12.
Pairwise comparison tests suggest statistical differences in CPUE between upper Eagle
Creek and North Fork Eagle Creek for age-0 fish in 2010 and 2012 (P < 0.05), and for
age-1 fish in 2010 (P < 0.05).
Eagle Creek Hatchery-Wild Steelhead Ecological Interactions
17
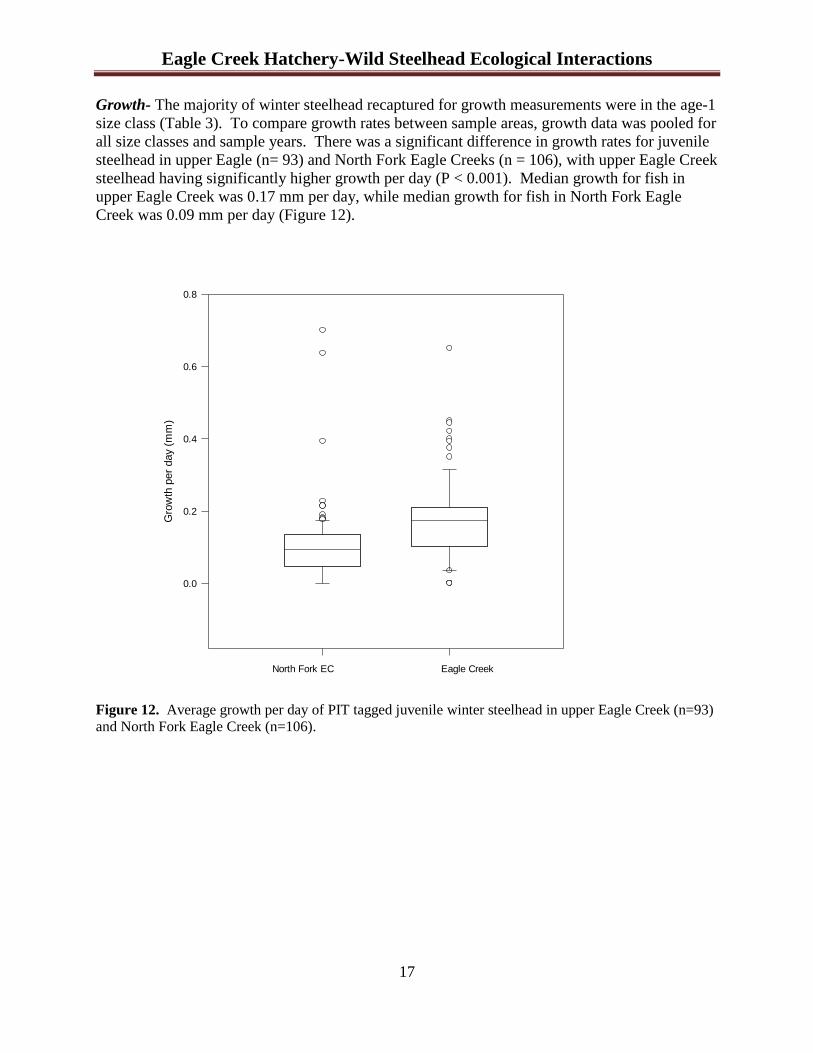
Growth- The majority of winter steelhead recaptured for growth measurements were in the age-1
size class (Table 3). To compare growth rates between sample areas, growth data was pooled for
all size classes and sample years. There was a significant difference in growth rates for juvenile
steelhead in upper Eagle (n= 93) and North Fork Eagle Creeks (n = 106), with upper Eagle Creek
steelhead having significantly higher growth per day (P < 0.001). Median growth for fish in
upper Eagle Creek was 0.17 mm per day, while median growth for fish in North Fork Eagle
Creek was 0.09 mm per day (Figure 12).
Figure 12. Average growth per day of PIT tagged juvenile winter steelhead in upper Eagle Creek (n=93)
and North Fork Eagle Creek (n=106).
Gro
wth
per
day (
mm
)
0.0
0.2
0.4
0.6
0.8
North Fork EC Eagle Creek
Eagle Creek Hatchery-Wild Steelhead Ecological Interactions
18
PIT Antenna Operations in Eagle Creek- The PIT array site near the mouth of Eagle Creek was
logging consistent, continuous, and quantifiable data from July 2010 to January 2011 and
between March and November 2011. Due to continual flood damage, the detection site at the
mouth was decommissioned in late November 2011.
The lower fish ladder antenna was installed in December, 2011 and the hatchery ladder antenna
was installed in January, 2012. The lower ladder antenna worked continuously through spring
2015, with the exception of a two week period in October 2013 during the Federal government
shut down. The batteries that power the antenna were not recharged and subsequently died
during this time period. In 2012, the hatchery antenna experienced periods of detection failure in
all months except July and September through November. In 2013, the hatchery antenna was not
operational from June through December. The hatchery operates an electric weir approximately
100 feet from the antenna site and noise interference from the weir reduced the detection
efficiency of the antenna. Both the lower ladder and hatchery antennae were removed in June
2015.
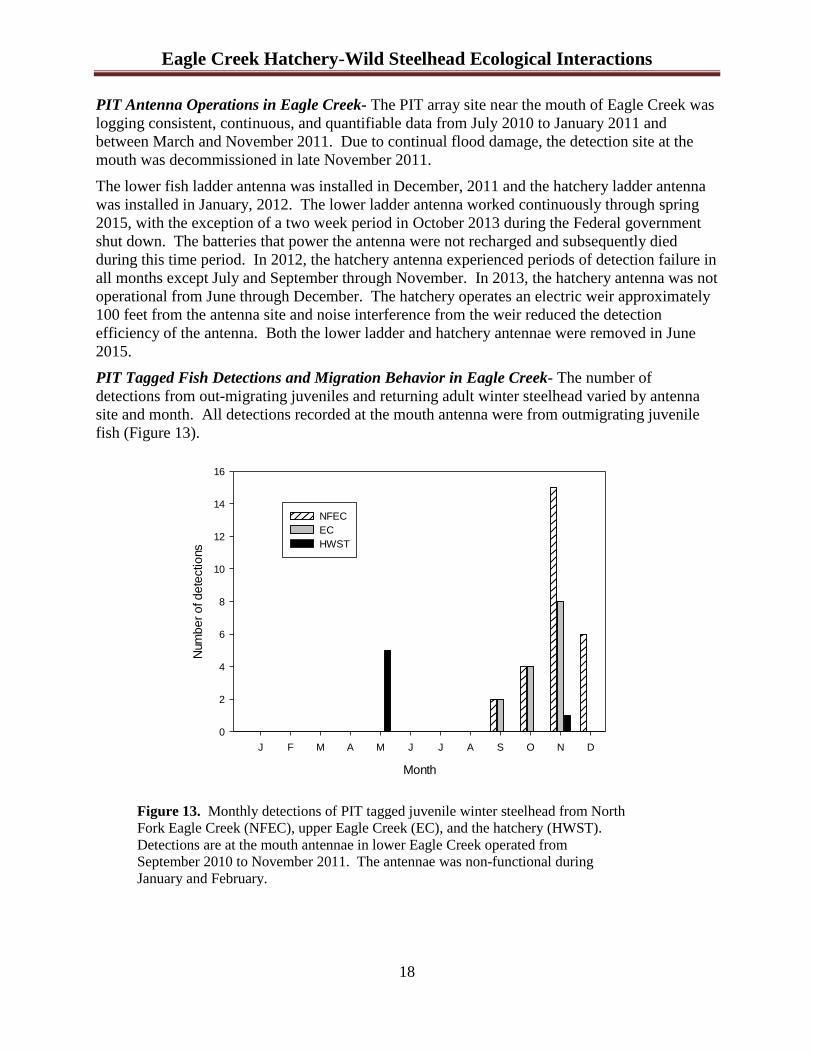
PIT Tagged Fish Detections and Migration Behavior in Eagle Creek- The number of
detections from out-migrating juveniles and returning adult winter steelhead varied by antenna
site and month. All detections recorded at the mouth antenna were from outmigrating juvenile
fish (Figure 13).
Month
J F M A M J J A S O N D
Num
be
r o
f d
ete
ctio
ns
0
2
4
6
8
10
12
14
16
NFEC
EC
HWST
Figure 13. Monthly detections of PIT tagged juvenile winter steelhead from North
Fork Eagle Creek (NFEC), upper Eagle Creek (EC), and the hatchery (HWST).
Detections are at the mouth antennae in lower Eagle Creek operated from
September 2010 to November 2011. The antennae was non-functional during
January and February.
Eagle Creek Hatchery-Wild Steelhead Ecological Interactions
19
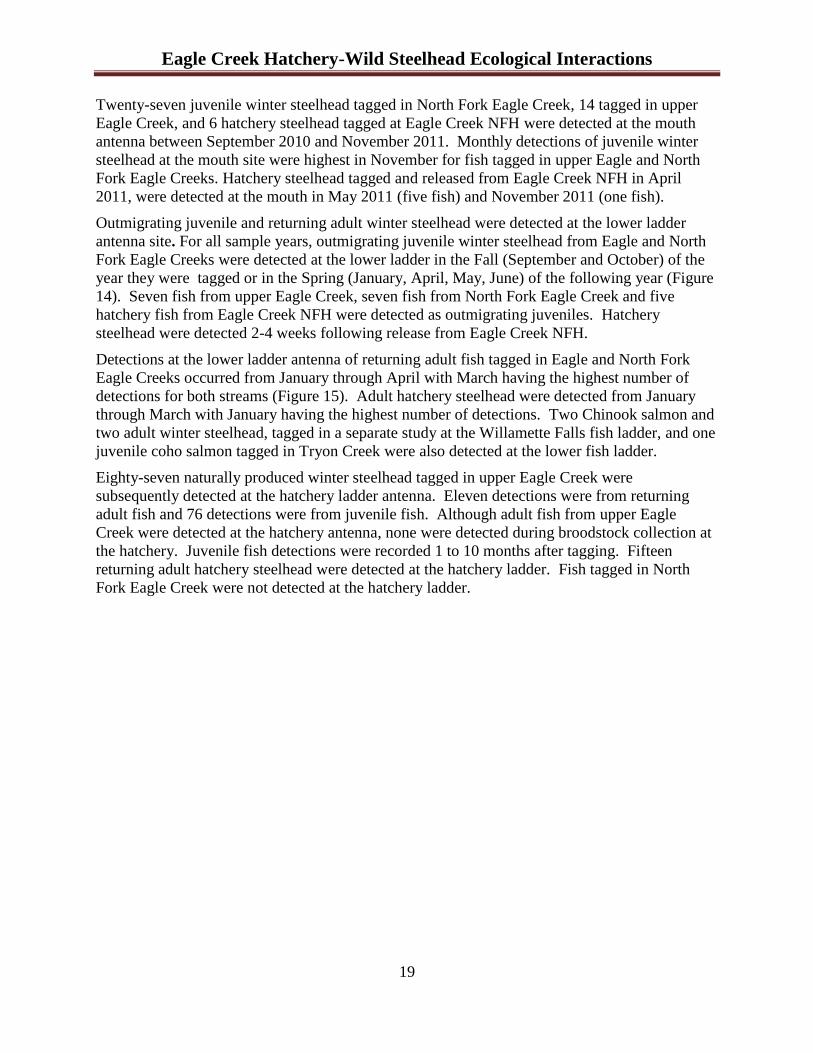
Twenty-seven juvenile winter steelhead tagged in North Fork Eagle Creek, 14 tagged in upper
Eagle Creek, and 6 hatchery steelhead tagged at Eagle Creek NFH were detected at the mouth
antenna between September 2010 and November 2011. Monthly detections of juvenile winter
steelhead at the mouth site were highest in November for fish tagged in upper Eagle and North
Fork Eagle Creeks. Hatchery steelhead tagged and released from Eagle Creek NFH in April
2011, were detected at the mouth in May 2011 (five fish) and November 2011 (one fish).
Outmigrating juvenile and returning adult winter steelhead were detected at the lower ladder
antenna site. For all sample years, outmigrating juvenile winter steelhead from Eagle and North
Fork Eagle Creeks were detected at the lower ladder in the Fall (September and October) of the
year they were tagged or in the Spring (January, April, May, June) of the following year (Figure
14). Seven fish from upper Eagle Creek, seven fish from North Fork Eagle Creek and five
hatchery fish from Eagle Creek NFH were detected as outmigrating juveniles. Hatchery
steelhead were detected 2-4 weeks following release from Eagle Creek NFH.
Detections at the lower ladder antenna of returning adult fish tagged in Eagle and North Fork
Eagle Creeks occurred from January through April with March having the highest number of
detections for both streams (Figure 15). Adult hatchery steelhead were detected from January
through March with January having the highest number of detections. Two Chinook salmon and
two adult winter steelhead, tagged in a separate study at the Willamette Falls fish ladder, and one
juvenile coho salmon tagged in Tryon Creek were also detected at the lower fish ladder.
Eighty-seven naturally produced winter steelhead tagged in upper Eagle Creek were
subsequently detected at the hatchery ladder antenna. Eleven detections were from returning
adult fish and 76 detections were from juvenile fish. Although adult fish from upper Eagle
Creek were detected at the hatchery antenna, none were detected during broodstock collection at
the hatchery. Juvenile fish detections were recorded 1 to 10 months after tagging. Fifteen
returning adult hatchery steelhead were detected at the hatchery ladder. Fish tagged in North
Fork Eagle Creek were not detected at the hatchery ladder.
Eagle Creek Hatchery-Wild Steelhead Ecological Interactions
20
Month
J F M A M J J A S O N D
Num
be
r o
f d
ete
ctio
ns
0
1
2
3
4
5
EC
NFEC
HWST
Month
J F M A M J J A S O N D
Num
be
r o
f d
ete
ctio
ns
0
2
4
6
8
10
12
EC
NFEC
HWST
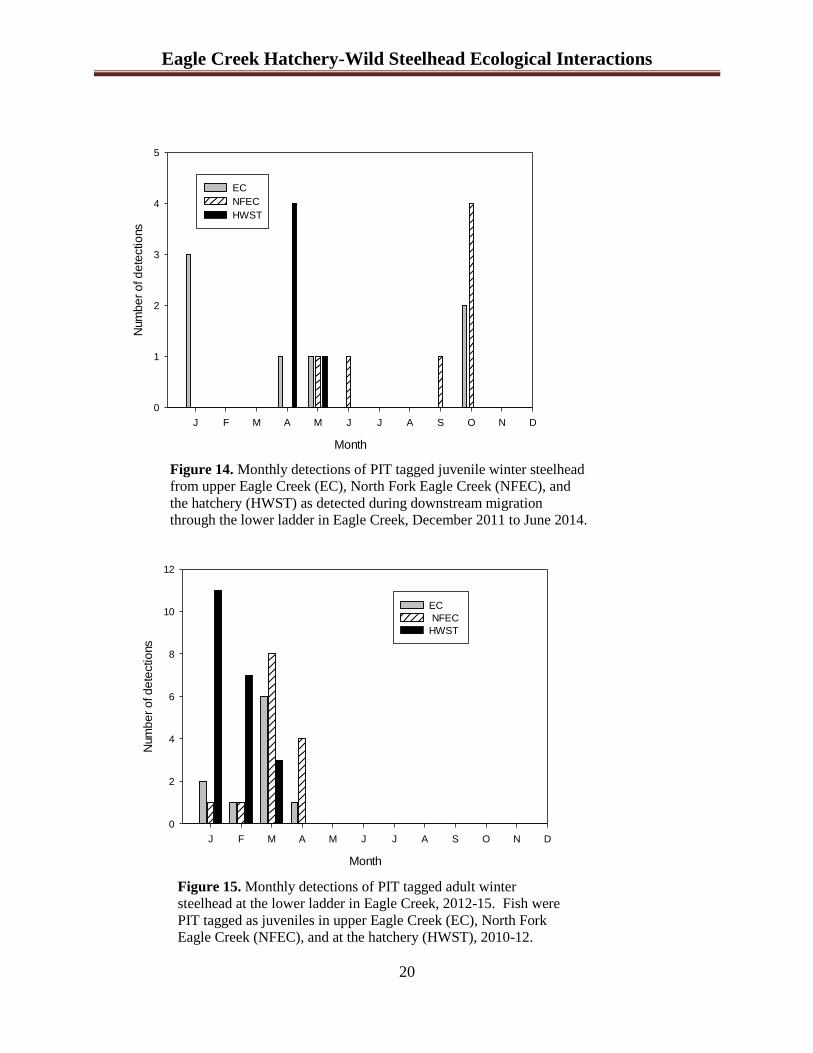
Figure 14. Monthly detections of PIT tagged juvenile winter steelhead
from upper Eagle Creek (EC), North Fork Eagle Creek (NFEC), and
the hatchery (HWST) as detected during downstream migration
through the lower ladder in Eagle Creek, December 2011 to June 2014.
Figure 15. Monthly detections of PIT tagged adult winter
steelhead at the lower ladder in Eagle Creek, 2012-15. Fish were
PIT tagged as juveniles in upper Eagle Creek (EC), North Fork
Eagle Creek (NFEC), and at the hatchery (HWST), 2010-12.
Eagle Creek Hatchery-Wild Steelhead Ecological Interactions
21
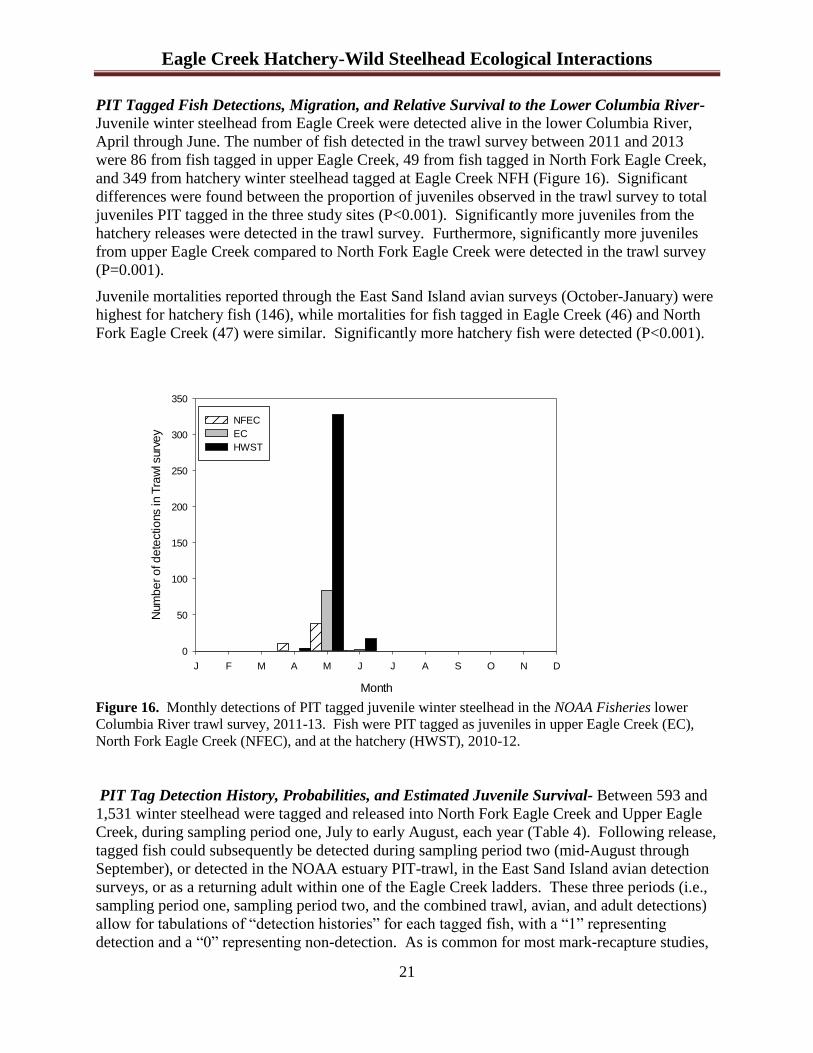
PIT Tagged Fish Detections, Migration, and Relative Survival to the Lower Columbia River- Juvenile winter steelhead from Eagle Creek were detected alive in the lower Columbia River,
April through June. The number of fish detected in the trawl survey between 2011 and 2013
were 86 from fish tagged in upper Eagle Creek, 49 from fish tagged in North Fork Eagle Creek,
and 349 from hatchery winter steelhead tagged at Eagle Creek NFH (Figure 16). Significant
differences were found between the proportion of juveniles observed in the trawl survey to total
juveniles PIT tagged in the three study sites (P<0.001). Significantly more juveniles from the
hatchery releases were detected in the trawl survey. Furthermore, significantly more juveniles
from upper Eagle Creek compared to North Fork Eagle Creek were detected in the trawl survey
(P=0.001).
Juvenile mortalities reported through the East Sand Island avian surveys (October-January) were
highest for hatchery fish (146), while mortalities for fish tagged in Eagle Creek (46) and North
Fork Eagle Creek (47) were similar. Significantly more hatchery fish were detected (P<0.001).
Figure 16. Monthly detections of PIT tagged juvenile winter steelhead in the NOAA Fisheries lower
Columbia River trawl survey, 2011-13. Fish were PIT tagged as juveniles in upper Eagle Creek (EC),
North Fork Eagle Creek (NFEC), and at the hatchery (HWST), 2010-12.
PIT Tag Detection History, Probabilities, and Estimated Juvenile Survival- Between 593 and
1,531 winter steelhead were tagged and released into North Fork Eagle Creek and Upper Eagle
Creek, during sampling period one, July to early August, each year (Table 4). Following release,
tagged fish could subsequently be detected during sampling period two (mid-August through
September), or detected in the NOAA estuary PIT-trawl, in the East Sand Island avian detection
surveys, or as a returning adult within one of the Eagle Creek ladders. These three periods (i.e.,
sampling period one, sampling period two, and the combined trawl, avian, and adult detections)
allow for tabulations of “detection histories” for each tagged fish, with a “1” representing
detection and a “0” representing non-detection. As is common for most mark-recapture studies,
Month
J F M A M J J A S O N D
Num
be
r o
f d
ete
ctio
ns in T
raw
l surv
ey
0
50
100
150
200
250
300
350
NFEC
EC
HWST

Eagle Creek Hatchery-Wild Steelhead Ecological Interactions
22
the majority of individuals were never detected again (i.e., having a “100” detection history).
However, a sufficient number of fish were detected on the second and third sampling occasions
to allow for estimation of apparent survival between sampling period one (July to early August)
and sampling period two (mid-August through September), as well as detection probabilities
during sampling period two. We use the term “summer survival” to represent apparent survival
probability between sampling periods one and two.
Table 4. Detection histories for wild winter steelhead tagged and released into North Fork Eagle Creek
(NFEC) and Upper Eagle Creek (UEC), 2010-2012.
A total of eleven alternative model structures were evaluated (Table 5). Each model represented
an alternative hypothesis on whether there was variability in summer survival or detection
probabilities across years or reaches, or whether the data indicated that summer survival or
detection probabilities were relatively similar or “constant” across years and reaches. Based on
Akaike’s Information Criterion corrected for small sample sizes (AICc), the best fitting model
without length as a covariate was one that assumed that both summer survival and detection
probabilities were constant across years and reaches. The estimated summer survival probability
for this model was 0.90 with a profile-likelihood confidence interval of (0.56, 1.00). The
estimated detection probability for the second sampling period (mid-August through September)
was 0.06 with a profile-likelihood confidence interval of (0.05, 0.11). Including length at
tagging as an individual covariate for summer survival resulted in an improved model fit,
reducing the AICc by 3.4 units.
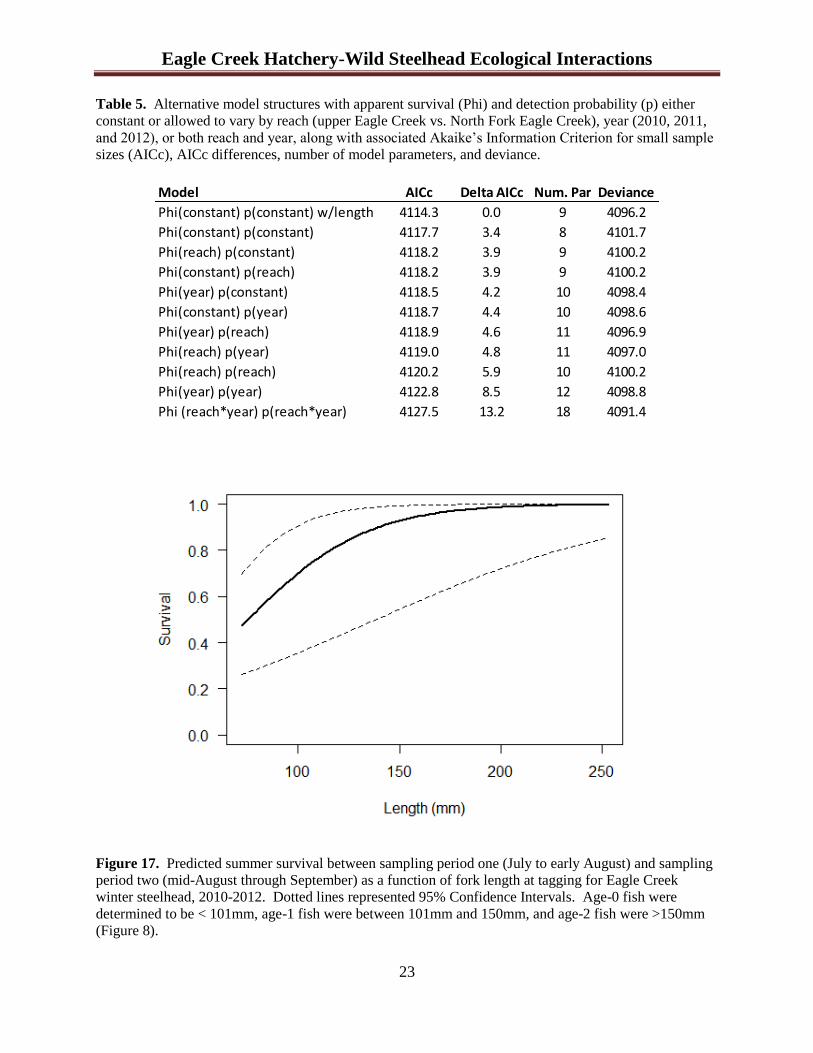
Based on a likelihood ratio test, the constant survival and detection model with length
significantly improved the model fit compared to the same model without length (P = 0.02). As
hypothesized, increasing length at tagging was associated with higher summer survival, with
predicted summer survival increasing from 50% to 70% for 70mm to100mm (age-0)
individuals, 70% to 90% survival for 101mm to150mm (age-1) individuals, and greater than
90% survival for >150mm (age-2 and older) individuals (Figure 8: Age Classification and
Figure 17: Predicted Survival).
History NFEC UEC NFEC UEC NFEC UEC
100 1259 1400 788 528 575 534
110 70 102 52 34 28 27
101 55 27 22 34 11 29
111 2 2 4 1 0 3
Total 1386 1531 866 597 614 593
2010 2011 2012
Eagle Creek Hatchery-Wild Steelhead Ecological Interactions
23
Table 5. Alternative model structures with apparent survival (Phi) and detection probability (p) either
constant or allowed to vary by reach (upper Eagle Creek vs. North Fork Eagle Creek), year (2010, 2011,
and 2012), or both reach and year, along with associated Akaike’s Information Criterion for small sample
sizes (AICc), AICc differences, number of model parameters, and deviance.
Figure 17. Predicted summer survival between sampling period one (July to early August) and sampling
period two (mid-August through September) as a function of fork length at tagging for Eagle Creek
winter steelhead, 2010-2012. Dotted lines represented 95% Confidence Intervals. Age-0 fish were
determined to be < 101mm, age-1 fish were between 101mm and 150mm, and age-2 fish were >150mm
(Figure 8).
Model AICc Delta AICc Num. Par Deviance
Phi(constant) p(constant) w/length 4114.3 0.0 9 4096.2
Phi(constant) p(constant) 4117.7 3.4 8 4101.7
Phi(reach) p(constant) 4118.2 3.9 9 4100.2
Phi(constant) p(reach) 4118.2 3.9 9 4100.2
Phi(year) p(constant) 4118.5 4.2 10 4098.4
Phi(constant) p(year) 4118.7 4.4 10 4098.6
Phi(year) p(reach) 4118.9 4.6 11 4096.9
Phi(reach) p(year) 4119.0 4.8 11 4097.0
Phi(reach) p(reach) 4120.2 5.9 10 4100.2
Phi(year) p(year) 4122.8 8.5 12 4098.8
Phi (reach*year) p(reach*year) 4127.5 13.2 18 4091.4
Eagle Creek Hatchery-Wild Steelhead Ecological Interactions
24
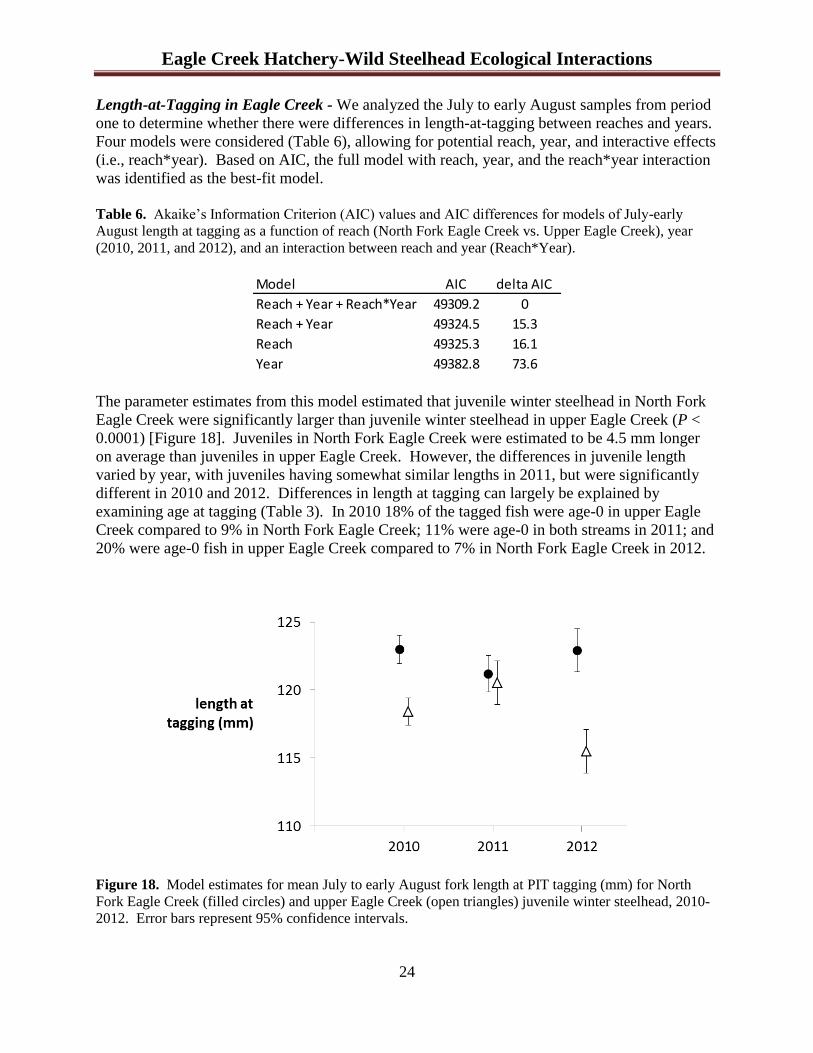
Length-at-Tagging in Eagle Creek - We analyzed the July to early August samples from period
one to determine whether there were differences in length-at-tagging between reaches and years.
Four models were considered (Table 6), allowing for potential reach, year, and interactive effects
(i.e., reach*year). Based on AIC, the full model with reach, year, and the reach*year interaction
was identified as the best-fit model.
Table 6. Akaike’s Information Criterion (AIC) values and AIC differences for models of July-early
August length at tagging as a function of reach (North Fork Eagle Creek vs. Upper Eagle Creek), year
(2010, 2011, and 2012), and an interaction between reach and year (Reach*Year).
The parameter estimates from this model estimated that juvenile winter steelhead in North Fork
Eagle Creek were significantly larger than juvenile winter steelhead in upper Eagle Creek (P <
0.0001) [Figure 18]. Juveniles in North Fork Eagle Creek were estimated to be 4.5 mm longer
on average than juveniles in upper Eagle Creek. However, the differences in juvenile length
varied by year, with juveniles having somewhat similar lengths in 2011, but were significantly
different in 2010 and 2012. Differences in length at tagging can largely be explained by
examining age at tagging (Table 3). In 2010 18% of the tagged fish were age-0 in upper Eagle
Creek compared to 9% in North Fork Eagle Creek; 11% were age-0 in both streams in 2011; and
20% were age-0 fish in upper Eagle Creek compared to 7% in North Fork Eagle Creek in 2012.
Figure 18. Model estimates for mean July to early August fork length at PIT tagging (mm) for North
Fork Eagle Creek (filled circles) and upper Eagle Creek (open triangles) juvenile winter steelhead, 2010-
2012. Error bars represent 95% confidence intervals.
Model AIC delta AIC
Reach + Year + Reach*Year 49309.2 0
Reach + Year 49324.5 15.3
Reach 49325.3 16.1
Year 49382.8 73.6
Eagle Creek Hatchery-Wild Steelhead Ecological Interactions
25
Juvenile-to-Adult Survival- The number of adult detections of winter steelhead at the lower
ladder antenna for fish tagged in upper Eagle Creek, North Fork Eagle Creek, and at Eagle Creek
NFH was 11, 15, and 21, respectively. The differences in adults observed between study sites
were not significant (P= 0.12). Age class structure of returning adults ranged from 3-5 years old,
with juvenile-to-adult survival ranging from 0.3% to 0.6% (Table 7). These are conservative
survival estimates (i.e., they likely underestimate survival) since an unknown number may have
passed through the lower ladder during high flow conditions.
Table 7. Observed age class structure of PIT tagged winter steelhead from upper Eagle Creek, North Fork
(NF) Eagle Creek, and Eagle Creek National Fish Hatchery (NFH) returning to the lower ladder and
relative percent survival from juvenile tagging (2010-12) to adult detection (2011-15).
Study Site Age-3 Age-4 Age-5 Total
Adults
Observed
Total
Juveniles
Tagged
Relative
Percent
Survival
Upper Eagle Creek 6 5 0 11 3,686 0.3%
NF Eagle Creek 9 5 1 15 3,775 0.4%
Eagle Creek NFH 14 7 0 21 3,435 0.6%
Genetics- Abernathy Fish Technology Center analyzed 200 samples of juvenile winter steelhead
collected in 2010 and 2011 (Appendix A). Bingham (2013) found that hatchery influence in
naturally produced juvenile winter steelhead was significantly higher in upper Eagle Creek than
in North Fork Eagle Creek in 2010 and 2011; however, because of the low number of loci
analyzed and the low genetic divergence between the hatchery and wild baseline, it was difficult
to determine the level and occurrence of introgression. The wild baseline appeared to contain
evidence for hatchery introgression as well.
Discussion
While less than our initial target of tagging 4,500 juvenile winter steelhead in each stream, we
successfully PIT tagged 3,686 juvenile winter steelhead in upper Eagle Creek and 3,775 juvenile
winter steelhead in North Fork Eagle Creek. We constructed and maintained PIT antennas at
three locations in Eagle Creek; however, the instream antenna near the mouth of Eagle Creek
was blown out during two fall/winter floods and was ultimately not as effective as originally
planned. This affected our ability to detect and estimate the number of downstream migrating
juvenile fish and smolts. Even with this limitation, we were able to collect comparative
information on fish movement, relative abundance, growth, survival, and genetics of juvenile
winter steelhead from both streams.
Our estimates of population abundance of juvenile winter steelhead in upper Eagle Creek and
North Fork Eagle Creek varied considerably between sample years and study sites. Overall,
relative abundance of juvenile winter steelhead, in particular age-0 fish, was greater in upper
Eagle Creek. The annual differences in our estimates were also influenced by sampling effort,
stream conditions, and electrofishing experience of the sampling crew. Even so, it is not unusual

Eagle Creek Hatchery-Wild Steelhead Ecological Interactions
26
for salmonid population numbers to fluctuate in response to habitat conditions, adult returns, and
changes in abundance of other species (Lichatowich 1999). Additionally, our estimates do not
consider possible recruitment that occurred between the mark and recapture sampling periods
(Boughton 2010). For example, we avoided capturing and handling fish less than 75 mm. It is
likely that additional fish recruited between sampling periods and their contribution was not
reflected in our estimates.
Limiting our sampling effort to steelhead > 74 mm for the purpose of PIT tagging likely
excluded a large percentage of fish < 75 mm from our population estimate of age-0 fish. In an
earlier study in Eagle Creek during summer 2007, approximately one-third of the age-0 winter
steelhead sampled were between 75 and 100 mm, with the other two-thirds of age-0 winter
steelhead between 50 and 70 mm (Figure 3 of Kavanagh et al. 2009). Because of this sampling
limitation for age-0 winter steelhead in 2010-12, another useful metric for examining relative
abundance is the ratio of estimated abundance between upper Eagle Creek and North Fork Eagle
Creek. Examining this ratio, an average of 4.3 times more age-0 winter steelhead between 75
and 100 mm were found in upper Eagle Creek during 2010-12 as compared to North Fork Eagle
Creek. This ratio can be used for age-1 and age-2 fish as well. An average of 1.3 times more
age-1 and age-2 fish were found in upper Eagle Creek during our sampling in 2010-12.
Based on available habitat area, one would expect more juvenile fish in upper Eagle Creek. As
described in Kavanagh et al. (2009), both creeks have a similar percentage of pools, riffles and
glides; however, upper Eagle Creek is on average a wider stream (14.6m) compared to North
Fork Eagle Creek (7.5m). Upper Eagle Creek has approximately 178,302 m2 total habitat area
and North Fork Eagle Creek has approximately 115,664 m2 total habitat area. Kavanagh et al.
(2009) also found significantly higher rearing densities (fish/m2) for age-0 winter steelhead (50 -
109 mm) in upper Eagle Creek, with no significant differences in rearing densities for age-1 fish
(>109 mm). Utilizing the habitat area estimates from Kavanagh et al. (2009), our estimate of
rearing density in 2010-12 was approximately 3 times higher in upper Eagle Creek for age-0
winter steelhead (75 - 100 mm), and similar for age-1and age-2 steelhead ( > 100 mm).
Comparative rearing density estimates in 2010-12 were consistent with Kavanagh et al. (2009).
Also consistent with Kavanagh et al. (2009), hatchery juvenile fish were found residualizing in
upper Eagle Creek but not in the North Fork Eagle Creek during 2010-12.
The estimated number of hatchery residuals found over-summering in upper Eagle Creek was
much lower in 2011(184) and 2012 (216), compared to 2,287 estimated during 2010. This can
partially be explained by the number of winter steelhead released from the hatchery each year.
Hatchery yearling steelhead releases were 111,606 in 2010, 67,560 in 2011, and 49,000 in 2012.
The current hatchery release goal is 95,000 yearling steelhead smolts.
Large numbers of hatchery juvenile steelhead that residualize in a stream can negatively affect
growth rates of wild O. mykiss (McMichael et al. 1997). Because hatchery residual juveniles are
present in upper Eagle Creek and not found in North Fork Eagle Creek, we hypothesized that
juvenile winter steelhead growth rates would be negatively affected by hatchery influence in
upper Eagle Creek. Our data did not support our hypothesis, with average growth per day being
significantly greater for juvenile winter steelhead in upper Eagle Creek compared to North Fork
Eagle Creek. A number of environmental and genetic factors can influence growth rates.
Eagle Creek Hatchery-Wild Steelhead Ecological Interactions
27
Stream temperature can influence growth rates of juvenile steelhead (Doctor et al. 2014). While
temperature was not measured consistently year-round, a previous study found that the two study
sites had similar summer water temperature, with North Fork Eagle Creek averaging 15.3 C and
upper Eagle Creek 15.6 C (June – August 2007 data in Kavanagh et al. 2009). Another
possibility is that increased hatchery introgression from naturally spawning hatchery steelhead in
upper Eagle Creek resulted in faster growing juvenile fish, as was found in a study with
domesticated coho salmon (Tymchuk et al. 2006) and with hatchery by wild crosses of steelhead
(Reisenbichler and McIntyre 1977). Alternatively, the larger, more complex habitat area and
possibly increased food availability in upper Eagle Creek may have contributed to the higher
abundance and growth rates that were observed in this study (Cederholm et al. 1999; Fausch and
Northcote 1992; and Nielson 1992).
Reisenbichler and McIntyre (1977) found significantly higher survival of juvenile steelhead in a
stream when wild x wild crosses were mated as compared to hatchery x wild and hatchery x
hatchery crosses. The hatchery influence from genetic samples collected in 2010 and 2011 was
significantly higher in upper Eagle Creek than in North Fork Eagle Creek (Bingham 2013 in
Appendix A). Based on those results, our hypothesis was that North Fork Eagle Creek winter
steelhead would have higher over-summer survival. We did not find differences in over-summer
survival of juvenile winter steelhead in upper Eagle and North Fork Eagle Creeks. It is possible
that a difference in survival between the two streams did not exist; however, the statistical power
in our study, which is a function of the number of fish that were tagged and later detected, may
have been too low to detect differences in survival if they did exist. In addition, the time period
that we estimated over-summer survival was between July/early-August and mid-
August/September, a two to six week time period which may have not been long enough for
survival differences to become evident.
While we did not find differences in over-summer survival between upper Eagle Creek and
North Fork Eagle Creek, we found significant differences in survival based on length, which
provided an estimate of over-summer survival of the different age classes. Larger fish had a
higher probability of survival. Based on length, over-summer survival of age-0 fish was
estimated to be between 50% and 70%, age-1 fish survival was estimated to be between 70% to
90%, and age-2 and older fish survived at a rate greater than 90%.
The majority of juvenile winter steelhead from upper Eagle and North Fork Eagle Creeks were
detected emigrating in the fall, whereas most hatchery fish were detected emigrating in the
spring. It was not unexpected to detect hatchery fish in May 2011 shortly after release, but we
also expected to see some wild juveniles (age-1 fish tagged in 2010) to be detected in that time
period as well. Detection probability was likely low with low numbers of juvenile fish being
detected as they migrated past the lower ladder and mouth antennas in Eagle Creek. Spring
outmigration of age-0 and age-1 juvenile steelhead in Clackamas River tributaries, including
North Fork Eagle Creek and upper Eagle Creek, has been documented in other studies (Hansen
et al. 2009; Kavanagh et al. 2009) and year-round emigration of juvenile salmon and steelhead is
documented from dam counts in the upper Clackamas River (Wyatt 2009). In another northwest
stream, Leider et al. (1986) described the seasonal migratory behavior of parr and presmolt
steelhead. They found that the movement of pre-smolt parr downstream from a smaller order

Eagle Creek Hatchery-Wild Steelhead Ecological Interactions
28
creek to a larger river area was a successful survival strategy for becoming smolts in the
subsequent year. The success of this migratory behavior in the Clackamas basin is unknown.
The proportion of juvenile winter steelhead from initial PIT tagging in Eagle Creek to later
detection in the lower Columbia River during spring time trawl surveys (Ledgerwood et al.
2004) provided an indication of comparative survival between the hatchery release, upper Eagle
Creek, and North Fork Eagle Creek. We presumed that juvenile fish sampled in the lower
Columbia River were smolts and were transitioning to life in a marine environment. We found
significantly higher detections in the trawl survey from the hatchery release compared to
naturally produced fish from Eagle Creek. Naturally produced juveniles from upper Eagle Creek
had significantly higher detections than from North Fork Eagle Creek. Hatchery fish were all
tagged as yearling fish just prior to release while naturally produced fish were tagged in the
summer 5-7 months prior to the trawl surveys, so the larger number of hatchery fish detected in
the trawl survey was not unexpected. The higher proportional detection of fish from upper Eagle
Creek suggests that those fish had higher survival from tagging to the lower Columbia River as
compared to the North Fork Eagle Creek winter steelhead.
The proportional detection of PIT tags from avian predation in the lower Columbia River was
significantly greater for hatchery steelhead released from Eagle Creek NFH compared to the
number of natural origin juvenile winter steelhead from upper Eagle and North Fork Eagle
Creeks. The higher mortality of hatchery smolts from avian predation may be due to their
relative abundance, their relative vulnerability to avian predation because of their tendency
towards surface orientation compared to their wild counterpart (Collis et al. 2001), or some
combination of these factors.
There is evidence that higher growth rates and/or larger smolt size in freshwater can result in
higher survival in the marine environment (Ward and Slaney 1988; Thompson and Beauchamp
2014). We did not find that the higher growth rates observed for upper Eagle Creek steelhead
was associated with higher juvenile-to-adult return rates compared to North Fork Eagle Creek.
While we estimated the growth rates of mixed age groups of juvenile steelhead (the growth rate
of juvenile winter steelhead in upper Eagle Creek was greater than in North Fork Eagle Creek),
the actual size during the time of smoltification was unknown. The size of fish we sampled and
tagged was largely influenced by the higher relative abundance of age-0 winter steelhead
collected and tagged in upper Eagle Creek as compared to North Fork Eagle Creek. We found
that differences in juvenile length at tagging varied by year, with juveniles in upper Eagle Creek
and North Fork Eagle Creek having similar lengths in 2011, but in 2010 and 2012 fish tagged in
the North Fork Eagle Creek were significantly larger.
Because the number of winter steelhead smolts from upper Eagle Creek and North Fork Eagle
Creek were not quantified in our study, we could not estimate smolt-to-adult survival. We were
able to estimate the relative survival of adult fish from juvenile tagging to adult detection at the
lower ladder in Eagle Creek. Since the ladder detections most likely did not detect 100% of the
fish passing the falls, survival estimates should be considered conservative, and we assumed that
both upper Eagle Creek and North Fork Eagle Creek had equal detection probabilities. From
tagging to adult detection, upper Eagle Creek survival was estimated at 0.3% and North Fork
Eagle Creek was estimated at 0.4%. These differences were not significant.

Eagle Creek Hatchery-Wild Steelhead Ecological Interactions
29
Survival of hatchery steelhead from tagging to adult detection at the lower ladder was estimated
at 0.6%, and from tagging to detection at the hatchery ladder was 0.4%. While more adult
hatchery fish were detected in Eagle Creek, the difference between hatchery and wild (upper
Eagle and North Fork Eagle creeks combined) was not significant. At our tagging levels and at
the estimated survival rates, the difference in detections between the two groups would have to
be greater than 100% before statistically significant differences would be found. While not
statistically significant, hatchery steelhead from Eagle Creek NFH had the highest percent
survival from juvenile tagging to adult detection, which was not surprising since these fish were
tagged as yearling smolts just prior to release.
The age of PIT tagged adult winter steelhead detected at the lower ladder ranged from three to
five years old. Hatchery adult steelhead in Eagle Creek tend to return earlier in the season than
naturally produced fish (Kavanagh et al. 2009). In our study we also observed temporal
segregation in return timing of hatchery and natural origin adult winter steelhead in Eagle Creek.
Although natural origin adult winter steelhead were detected in January and February at the
lower ladder, peak migration of returning adults occurred in March. The peak migration for
returning hatchery steelhead was in January. Although based on few fish, upper Eagle Creek and
North Fork Eagle Creek had similar adult return timing.
Including genetic collections from Kavanagh et al. (2009), Bingham (2013) found that the wild,
Eagle Creek genetic baseline appears to contain evidence for hatchery introgression (Appendix
A: Table 1, Figure 2). Only a few of the pairwise locus comparisons were significant, suggesting
that introgression from the hatchery has occurred for many generations (e.g., Allendorf et al.
2001). Bingham (2013) also concluded that the hatchery admixture in wild winter steelhead
populations in the Eagle Creek basin appears dynamic. The hatchery influence from samples
collected in 2007, 2010 and 2011 was significantly higher in upper Eagle Creek than in North
Fork Eagle Creek; however, in 2005 the hatchery influence was significantly higher in North
Fork Eagle Creek (no difference in 2006). Thus, it is important to interpret the genetic impact of
the hatchery in the context of the timeframe in which it was sampled.
Based on the information collected and analyzed to date as part of this project, we cannot
conclude that freshwater growth, migration behavior, or survival in upper Eagle Creek was
negatively impacted by naturally spawning hatchery steelhead when compared to North Fork
Eagle Creek. It is also important to note that the North Fork Eagle Creek is not a pristine,
production area for wild winter steelhead, but typically does have less hatchery influence than in
upper Eagle Creek. Both upper Eagle Creek and North Fork Eagle Creek naturally produce
juvenile and adult salmon and steelhead. Brignon et al. (2012) also suggested that the habitat
conditions in upper Eagle Creek may be best for producing age-0 winter steelhead while the
habitat conditions in North Fork Eagle Creek may be better for coho salmon.
Starting with brood year 2015, the winter steelhead hatchery program was switched from a
segregated, early-run stock to an integrated broodstock with the late-run winter steelhead from
the Oregon Department of Fish and Wildlife’s Clackamas hatchery. After this new hatchery
steelhead program becomes established in a few years, it is recommended that additional
evaluations occur to monitor for changes in stream ecology, including hatchery residualism, the

Eagle Creek Hatchery-Wild Steelhead Ecological Interactions
30
proportion of hatchery fish spawning (pHOS) in the stream, and associated genetic influence.
Berejikian et al. (2012) describe case studies that could serve as a model for evaluation of an
integrated steelhead hatchery program. Starting in brood year 2013, Oregon Department of Fish
and Wildlife also initiated a 240,000 spring Chinook smolt program at Eagle Creek NFH. Eagle
Creek NFH also continues to rear coho salmon for release into Eagle Creek and for transfer to
upper Columbia and Snake River reintroduction programs run by Tribal governments (USFWS
2007). All programs at Eagle Creek NFH should be evaluated periodically to ensure parameters
in the Hatchery and Genetic Management Plans and ESA Biological Opinion are met.
While not an objective of the study, it is important to recognize the significant contributions
made by students employed during summer field work through the Student Temporary
Employment Program (STEP). An article documenting some of these contributions was
published in the U.S. Fish and Wildlife Service Eddies Spring 2011 edition that highlighted the
students’ work on the Eagle Creek project (Attachment B).
Eagle Creek Hatchery-Wild Steelhead Ecological Interactions
31
Acknowledgements
We extend our gratitude to the staff at Eagle Creek National Fish Hatchery, especially Caroline
Peterschmidt and Steve Semon, for their help with hatchery and field support during this study.
Rich Johnson, Regional Office, provided administrative support to the hatchery and CRFPO.
We thank land owners for allowing access through their private property. We are indebted to the
CRFPO marking crew for supervision of marking and tagging of hatchery steelhead and
assistance with adult biosampling. We also thank Julie Harris, from the USFWS-Columbia River
Fisheries Program Office (CRFPO), for providing statistical support, Steve Pastor for providing
database management support for hatchery records, and those from CRFPO that provided field
and technical support including Bill Brignon, Trevor Conder, Rod Engle, David Hand, James
Archibald, Darren Gallion, Sheila Davis, and Howard Schaller. Numerous student temporary
employees helped during summer time sampling including Jesse Roper, Megan McKim, Zoey
Johnson, Sarah Smith, Carolyn Henry, Chee Xiong, and Casey Callahan. We would also like to
thank Abernathy Fish Technology Center, especially Dan Bingham, Matt Smith, and Denise
Hawkins for their cooperation in analyzing genetic samples collected in this study. This project
was supported through funding by the U.S. Fish and Wildlife Service, FIS Accomplishment A-
197. Any mention of trade names is for reference purposes only and does not imply endorsement
by the U. S. Government. The findings and conclusions in this report are those of the authors and
do not necessarily represent the views and policy of the U.S. Fish and Wildlife Service.
Eagle Creek Hatchery-Wild Steelhead Ecological Interactions
32
Literature Cited
Allendorf, F.W., R.F. Leary, P. Spruell, and J.K. Wenburg. 2001. The problems with hybrids:
settting conservation guidelines. Trends in Ecology & Evolution 16(11):613-622.
Araki, H., W. R. Ardren, E. Olsen, B. Cooper, and M. S. Blouin. 2007. Reproductive success of
captive-bred steelhead trout in the wild: Evaluation of three hatchery programs in the Hood
River. Conservation Biology 21(1):181-190.
Berejikian, B.A., D.A. Larsen, P. Swanson, M.E. Moore, C.P. Tatara, W. L. Gale, C.R. Pasley,
and B.R. Beckman. 2012. Development of natural growth regimes for hatchery-reared steelhead
to reduce residualism, fitness loss, and negative ecological interactions. Environmental Biology
of Fishes 94:29-44.
Bingham, D. 2013. Genetic analysis of juvenile steelhead (Oncorhynchus mykiss) samples
collected in upper Eagle Creek and North Fork Eagle Creek, OR. U.S. Fish and Wildlife
Service, Abernathy Fish Technology Center, Longview, WA (as provided in Appendix A).
Boughton, D.A. 2010. Estimating the size of steelhead runs by tagging and monitoring migrants.
North American Journal of Fisheries Management 30:89-101.
Brignon, W.R., D.E. Olson, H.A. Schaller, and C.B. Schreck. 2012. Factors influencing density,
distribution, and mesohabitat selection of juvenile wild salmonids and residual hatchery winter
steelhead. Aquaculture 362-363 (2012) 137-147.
Cederholm, C.J., M.D. Kunze, T. Murota, and A. Sibatani. 1999. Pacific salmon carcasses:
Essential contributions of nutrients and energy for aquatic and terrestrial ecosystems. Fisheries
24(10):6-15.
Chilcote,M.W. 2003. Relationship between natural productivity and the frequency of wild fish in
mixed spawning populations of wild and hatchery steelhead (Oncorhynchus mykiss), Canadian
Journal of Fisheries and Aquatic Sciences 60: 1057–1067.
Collis, K., D.D. Roby, D.P. Craig, B.A. Ryan, and R.D. Ledgerwood. 2001. Colonial waterbird
predation on juvenile salmonids tagged with passive integrated transponders in the Columbia
River esturary: Vulnerability of different salmonid species, stocks, and rearing types.
Transactions of the American Fisheries Society 130:385-396.
Columbia Basin Fish and Wildlife Authority (CBFWA). 1999. PIT Tag Marking
ProceduresManual. PITTag Steering Committee, Version 2.0, Portland, Oregon.
Davis, N. D. and J. T. Light. 1985. Steelhead age determination techniques. (Document
submitted to annual meeting of the INPFC, Tokyo, Japan, November 1985.) 41 pp. University of
Washington, Fisheries Research Institute, FRI—UW—85O6. Seattle.

Eagle Creek Hatchery-Wild Steelhead Ecological Interactions
33
Doctor, K., B. Berejikian, J.J. Hard, and D. VanDoornik. 2014. Growth mediated life history
traits of steelhead reveal phenotypic divergence and plastic response to temperature.
Transactions of the American Fisheries Society 143(2):317-333.
Fausch, K.D. and T.G. Northcote. 1992. Large woody debris and salmonid habitat in a small
coastal British Columbia stream. Canadian Journal Fisheries and Aquatic Sciences 49:682-693.
Hansen, B., B. Strobel, and B. Wymore. 2009. Steelhead and coho salmon smolt production,
length distributions, and emigration patterns in the Clackamas River Basin, 2006-2007. USDA
Forest Service, Pacific Northwest Research Station and the Portland Water Bureau. In July 2009
Fisheries Partnerships in Action, Accomplishment Report for the Clackamas River Fisheries
Working Group, 2006-2008: USDA Forest Service, U.S. Fish and Wildlife Service, Oregon
Department of Fish and Wildlife, U.S. Bureau of Land Management, and Portland General
Electric.
Kavanagh M., W.R. Brignon, D. Olson, S. Gutenberger, A. Matala, and W. Ardren. 2009.
Ecological and Genetic Interactions between Hatchery and Wild Steelhead in Eagle Creek,
Oregon. Final Report. U.S. Fish and Wildlife Service, Columbia River Fisheries Program Office,
Vancouver, WA.
Ledgerwood, R.D., B.A. Ryan, E.M. Dawley, E.P. Nunnallee, and J.W. Ferguson. 2004. A
surface trawl to detect migrating juvenile salmonids tagged with passive integrated transponder
tags. North American Journal of Fisheries Management 24(2):440-451.
Leider, S.A., M.W. Chilcote, and J.J. Looch. 1986. Movement and survival of presmolt
steelhead in a tributary and the main stem of a Washington river. North American Journal of
Fisheries Management 6(4):526-531.
Lichatowich, J.A. 1999. Salmon without rivers: a history of the Pacific salmon. Island Press,
Washington, D.C.
Lynch, M., and M. O'Hely. 2001. Captive breeding and the genetic fitness of natural populations.
Conservation Genetics 2(4):363-37.
McMichael, G.A., C.S. Sharpe, and T.N. Pearsons. 1997. Effects of residual hatchery-reared
steelhead on growth of wild rainbow trout and spring Chinook salmon. Transactions of the
American Fisheries Society 126:230-239.
Minard, R.E. and J.E. Dye. 1997. Rainbow trout sampling and aging protocol. Alaska
Department of Fish and Game, Special Publication No. 98-2, Anchorage.
Nielson, J.L. 1992. Microhabitat-specific foraging behavior, diet, and growth of juvenile coho
salmon. Transactions of the American Fisheries Society 121(5):617-634.

Eagle Creek Hatchery-Wild Steelhead Ecological Interactions
34
Reisenbichler, R.R. and J.D. McIntyre. 1977. Genetic differences in growth and survival of
juvenile hatchery and wild steelhead trout, Salmo gairdneri. Journal of the Fisheries Research
Board of Canada 34(1):123-128.
Thompson, J.N. and D.A. Beauchamp. 2014. Size-selective mortality of steelhead during
freshwater and marine life stages related to freshwater growth in the Skagit River, Washington.
Transactions of the American Fisheries Society 143:910-925.
Tymchuk, W.E., C. Biagi, R. Withler, and R.H. Devlin. 2006. Growth and behavioral
consequences of introgression of a domesticated aquaculture genotype into a native strain of
coho salmon. Transactions of the American Fisheries Society 135(2):442-455.
U.S. Fish and Wildlife Service (USFWS). 2007. Eagle Creek National Fish Hatchery
assessments and recommendations, final report July 2007. Pacific Region, Portland, Oregon.
http://www.fws.gov/pacific/fisheries/Hatcheryreview
Ward, B.R. and P.A. Slaney. 1988. Life history and smolt-to-adult survival of Keogh River
steelhead trout (Salmo gairdneri) and the relationship to smolt size. Canadian Journal of
Fisheries and Aquatic Sciences 45:110-1122.
Wyatt, G.J. 2009. Abundance and run timing of salmonids collected at North Fork juvenile
bypass facility, 2006-2008. Portland General Electric. In July 2009 Fisheries Partnerships in
Action, Accomplishment Report for the Clackamas River Fisheries Working Group, 2006-2008:
USDA Forest Service, U.S. Fish and Wildlife Service, Oregon Department of Fish and Wildlife,
U.S. Bureau of Land Management, and Portland General Electric.

Eagle Creek Hatchery-Wild Steelhead Ecological Interactions
35
Appendix A:
Bingham, D. 2013. Genetic analysis of juvenile steelhead (Oncorhynchus mykiss) samples
collected in upper Eagle Creek and North Fork Eagle Creek, OR. U.S. Fish and Wildlife
Service, Abernathy Fish Technology Center (AFTC), 1440 Abernathy Creek Road, Longview,
WA 98632

Eagle Creek Hatchery-Wild Steelhead Ecological Interactions
36
Genetic analysis of juvenile steelhead
(Oncorhynchus mykiss) samples collected in upper
Eagle Creek and North Fork Eagle Creek, OR
Prepared by:
Dan Bingham
Abernathy Fish Technology Center (AFTC)
1440 Abernathy Creek Road
Longview, WA 98632
In cooperation with:
Doug Olson and Maureen Kavanagh
Hatchery Assessment Team
Columbia River Fisheries Program Office (CRFPO)
U.S. Fish and Wildlife Service
Vancouver, WA 98683
July 2013
Eagle Creek Hatchery-Wild Steelhead Ecological Interactions
37
Introduction
Eagle Creek is located within the Clackamas River Basin, OR, and contains a wild population of
steelhead (Oncorhynchus mykiss) (wild referring to fish born in the natural environment
regardless of ancestry). Wild steelhead in Eagle Creek are included in the lower Columbia River
Evolutionarily Significant Unit (ESU) and are listed as “threatened” under the Endangered
Species Act (ESA; Lower Columbia River ESU, 63 FR 13347; March 19, 1998).
Hatchery propagation of steelhead at Eagle Creek National Fish Hatchery (ECNFH) was
implemented as mitigation for loss of fishery resources in the Columbia River basin. The
original ECNFH winter-run broodstock was largely derived from out-of-basin Big Creek
Hatchery stock from the Lower Columbia River with a smaller component of local wild stocks.
Hatchery steelhead return to spawn in Eagle Creek from December through March, whereas wild
late-run steelhead return from February to June. This temporal distinction has been viewed as
beneficial because it allows for a targeted fishery on early returning hatchery steelhead.
Managers have assumed little hybridization occurs between wild and hatchery fish because of
distinct spawning locations and differences in spawning time.
Little is known about the genetic contribution of wild and hatchery fish in the Eagle Creek
system. Genetic analysis of 16 microsatellites showed that divergence between the hatchery and
wild populations in Eagle Creek is small (FST = 0.018; 95% CI 0.012-0.025) (Matala et al. 2007).
With such small divergence 16 microsatellites provide little power to assign individuals as
hatchery, wild, or hybrid (Vaha and Primmer 2006). Nevertheless, analysis of wild juvenile
steelhead from upper Eagle Creek has indicated hatchery ancestry in wild born fish, suggesting
successful reproduction of hatchery fish in the wild (Kavanagh et al. 2009).
Our objective was to evaluate the resolution provided by the available genetic baseline (Matala
2007) for distinguishing hatchery from wild O. mykiss in Eagle Creek. We then analyzed
samples of 200 juvenile steelhead sampled from upper Eagle Creek and North Fork Eagle Creek
in 2010 and 2011 to determine whether accurate assignment to the wild and hatchery baselines is
possible. Finally, to identify trends in the genetic data, we reexamined samples from the Eagle
Creek basin that were analyzed in the Matala et al. (2007). Sampling information, laboratory
analysis, and genetic summary statistics for the 15 microsatellites in the hatchery and wild
genetic baselines and in samples collected prior to 2010 can be found in Matala et al. (2007).
Methods
To detect genetic patterns and obtain a multivariate analysis of the hatchery and wild baselines,
we performed an individual-based principal coordinate analysis (PCoA) of a covariance-
standardized genetic distance matrix in GENALEX v6.0 (Peakall and Smouse 2006).
If the wild and hatchery baselines show extensive admixture with each other they may not be
appropriate for determining the ancestry of wild-born O. mykiss. We used the Bayesian
clustering model in STRUCTURE Ver. 2.3.3 (Pritchard et al. 2000) to identify admixture
between the hatchery and wild baselines. STRUCTURE gives a qi-value for each individual,
Eagle Creek Hatchery-Wild Steelhead Ecological Interactions
38
which represents the estimated proportion of an individual’s genotype that was derived from the
hatchery (i.e., an individual of hatchery ancestry should exhibit qi = 1.00). We performed 10
independent runs using a burn-in period of 10,000, 50,000 batches, and the admixture and
‘independent allele frequency’ models. We forced the model to recognize only two populations
(k = 2; i.e., hatchery and wild) and included the 163 hatchery and 100 wild fish from the baseline
as priors.
We used linkage disequilibrium (i.e., nonrandom association of genotypes between loci) to gain
inference on the ‘age’ of hybridization between hatchery and wild fish in sites that appeared to
contain hatchery introgression. When genetically distinct populations interbreed, linkage will
initially be high because populations will contain parental types and many early generation
hybrids (Allendorf et al. 2001). In contrast, the absence of linkage disequilibrium suggests low
power of detection (i.e., due to similar allele frequencies between populations or recent
introgression by later-generation hybrids) or that hybridization has progressed to a ‘hybrid
swarm’ in which all individuals are hybrids. We used exact tests in ARLEQUIN (Excoffier et al.
2005) to test for significant linkage disequilibrium between all possible pairwise locus
comparisons and determined statistical significance at α=0.05.
Results and Discussion
Analysis of 15 microsatellite loci showed that the hatchery and wild genetic baseline collections
of O. mykiss in the Eagle Creek system contain similar allele frequencies (FST ≤ 0.02; Figure 1).
The small number of loci and low genetic divergence makes accurate genetic assignment and
descriptions of introgression and shared ancestry problematic (Allendorf et al. 2001; Vaha and
Primmer 2006).
The wild baseline appears to contain evidence for hatchery introgression (Table 1, Figure 2). It
had an estimated proportion of hatchery admixture (i.e., mean STRUCTURE-based qi) of 0.35,
and 25% of the individuals had qi estimates greater than 0.50 (i.e., they are estimated to have
more hatchery ancestry than wild). In addition, variance in qi values among individuals was high
in comparison to the hatchery baseline, lending further support to the presence of introgression.
Only 4 and 14% of pairwise locus comparisons were significant (P<0.05) in the three collections,
suggesting that introgression from the hatchery has occurred for many generations (e.g.,
Allendorf et al. 2001). Nevertheless, low genetic divergence between the hatchery and wild
makes it difficult to discern introgression from shared ancestry.
Estimated proportions of hatchery admixture in the juvenile samples from upper and NF Eagle
Creek ranged from 0.33 to 0.70 (Figure 3). Upper Eagle Creek had the highest proportion of
admixture with mean qi=0.68(SD=0.33) and 0.70(SD=0.33) in 2010 and 2011, respectively.
Mean qi in NF Eagle Creek was 0.56(SD=0.36) and 0.33(SD=0.34) in both years, respectively.
Linkage disequilibrium was relatively low in NF Eagle Creek in 2011 and in upper Eagle Creek
in 2010 and 2011; proportions of loci in significant linkage disequilibrium ranged from 0.06 to
0.09. Low linkage disequilibrium may indicate the presence of a ‘hybrid swarm’ between wild
and hatchery fish. In contrast, 34% of pairwise locus comparisons were significant in NF Eagle
Creek in 2010, possibly indicating ‘recent’ or ongoing hatchery influence and admixture.

Eagle Creek Hatchery-Wild Steelhead Ecological Interactions
39
Hatchery admixture in wild populations in the Eagle Creek basin appears dynamic. In particular,
qi distributions appear to fluctuate within creeks substantially through time (Table 1, Figure 3).
For example, hatchery influence is significantly higher in upper Eagle Creek than in NF Eagle
Creek in 2010 and 2011; however, in 2005 the influence was higher in NF Eagle Creek. Thus, it
is important to interpret the genetic impact of the hatchery in the context of the timeframe in
which it was sampled.
Acknowledgements
We thank the CRFPO for funding and samples.
Disclaimer
The findings and conclusions in this report are those of the authors and do not necessarily
represent the views of the U.S. Fish and Wildlife Service.
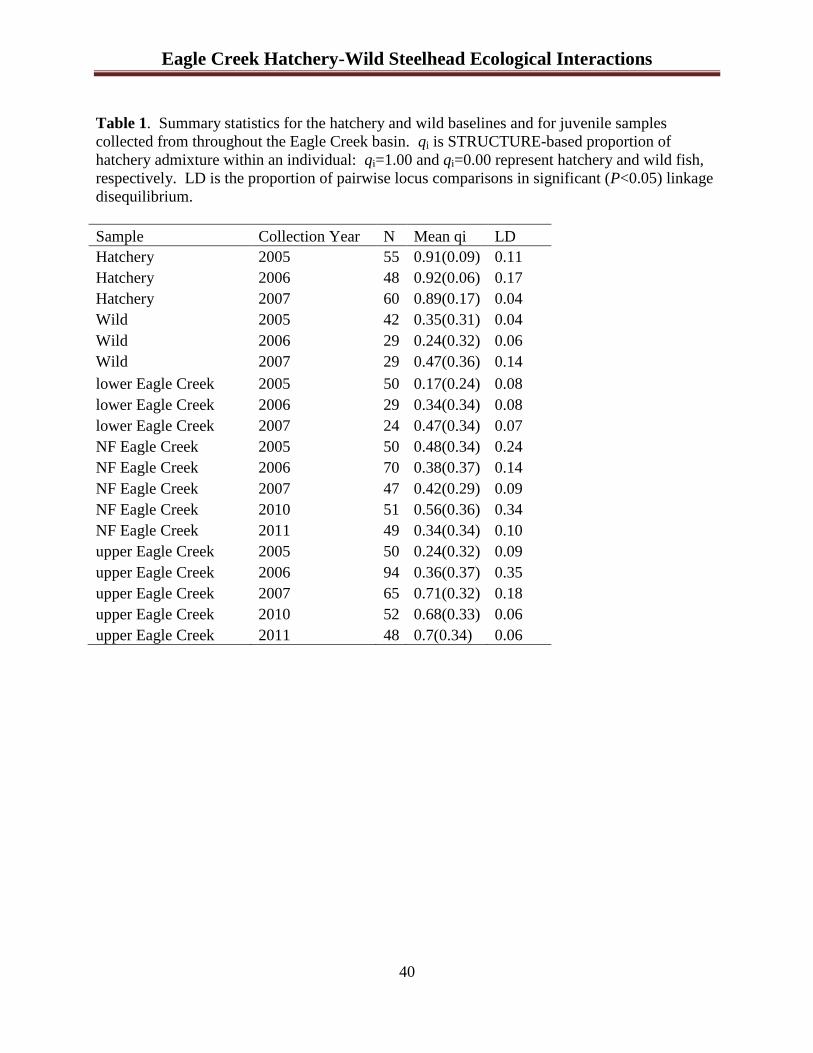
Eagle Creek Hatchery-Wild Steelhead Ecological Interactions
40
Table 1. Summary statistics for the hatchery and wild baselines and for juvenile samples
collected from throughout the Eagle Creek basin. qi is STRUCTURE-based proportion of
hatchery admixture within an individual: qi=1.00 and qi=0.00 represent hatchery and wild fish,
respectively. LD is the proportion of pairwise locus comparisons in significant (P<0.05) linkage
disequilibrium.
Sample Collection Year N Mean qi LD
Hatchery 2005 55 0.91(0.09) 0.11
Hatchery 2006 48 0.92(0.06) 0.17
Hatchery 2007 60 0.89(0.17) 0.04
Wild 2005 42 0.35(0.31) 0.04
Wild 2006 29 0.24(0.32) 0.06
Wild 2007 29 0.47(0.36) 0.14
lower Eagle Creek 2005 50 0.17(0.24) 0.08
lower Eagle Creek 2006 29 0.34(0.34) 0.08
lower Eagle Creek 2007 24 0.47(0.34) 0.07
NF Eagle Creek 2005 50 0.48(0.34) 0.24
NF Eagle Creek 2006 70 0.38(0.37) 0.14
NF Eagle Creek 2007 47 0.42(0.29) 0.09
NF Eagle Creek 2010 51 0.56(0.36) 0.34
NF Eagle Creek 2011 49 0.34(0.34) 0.10
upper Eagle Creek 2005 50 0.24(0.32) 0.09
upper Eagle Creek 2006 94 0.36(0.37) 0.35
upper Eagle Creek 2007 65 0.71(0.32) 0.18
upper Eagle Creek 2010 52 0.68(0.33) 0.06
upper Eagle Creek 2011 48 0.7(0.34) 0.06
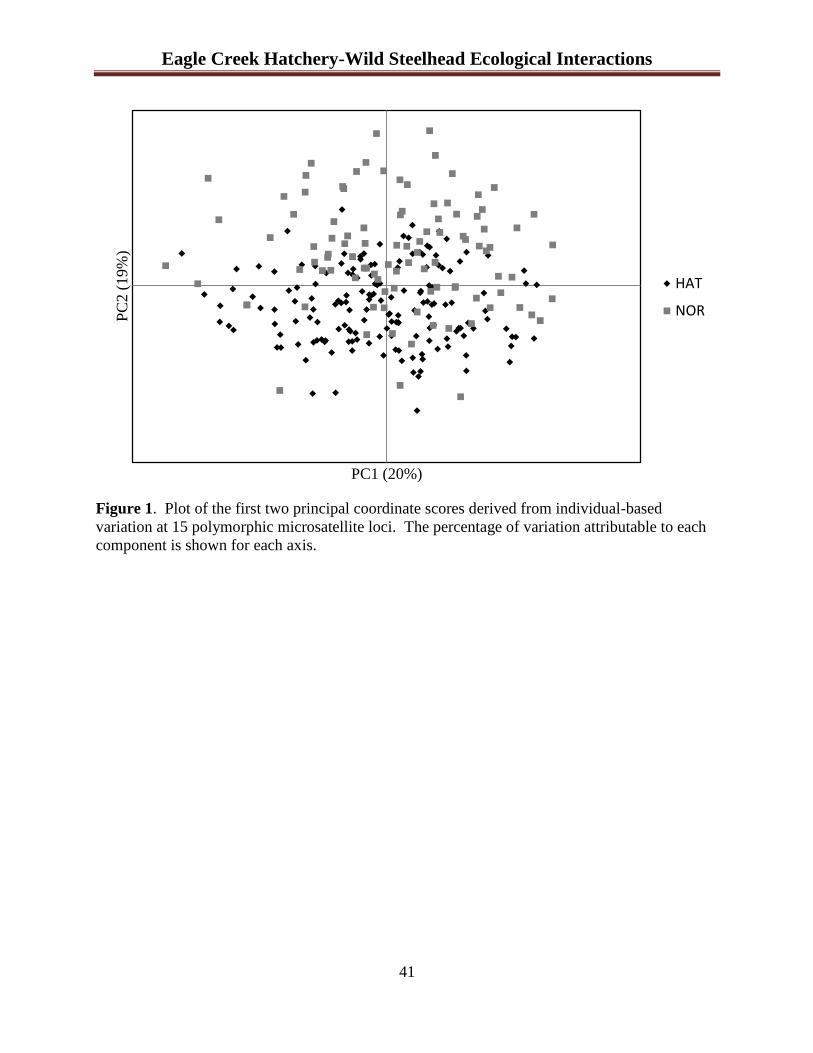
Eagle Creek Hatchery-Wild Steelhead Ecological Interactions
41
Figure 1. Plot of the first two principal coordinate scores derived from individual-based
variation at 15 polymorphic microsatellite loci. The percentage of variation attributable to each
component is shown for each axis.
PC
2 (
19%
)
PC1 (20%)
HAT
NOR
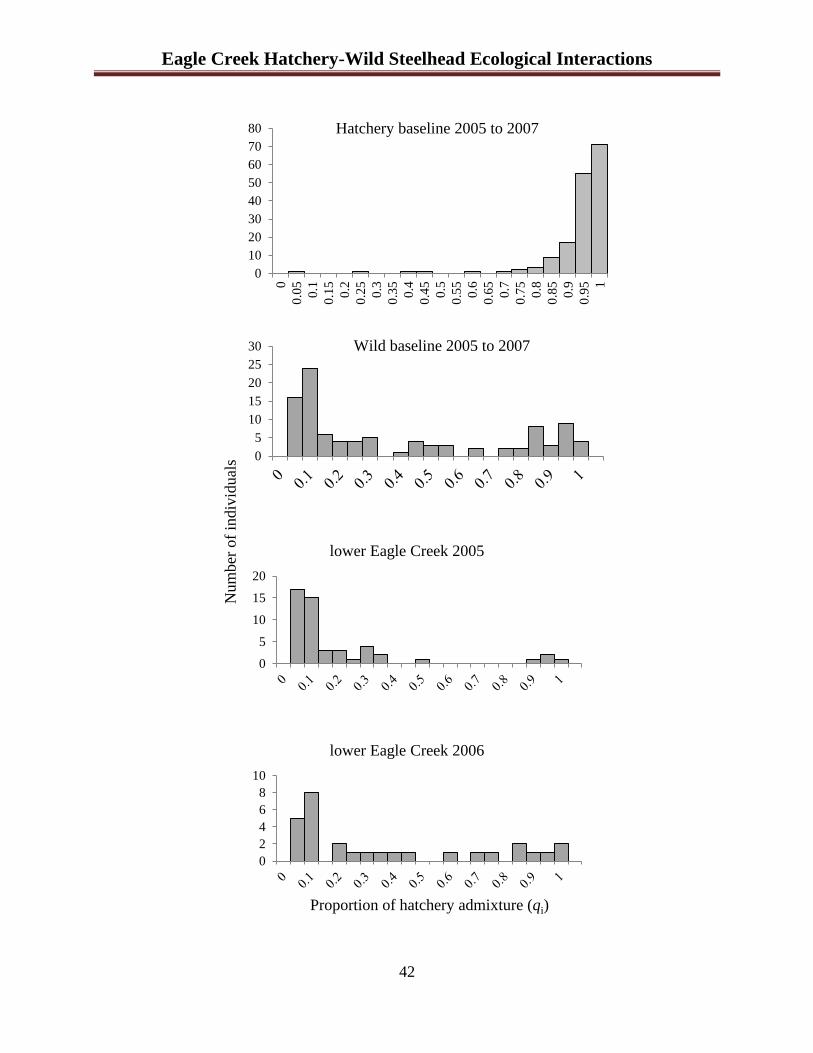
Eagle Creek Hatchery-Wild Steelhead Ecological Interactions
42
0
10
20
30
40
50
60
70
80
0
0.0
5
0.1
0.1
5
0.2
0.2
5
0.3
0.3
5
0.4
0.4
5
0.5
0.5
5
0.6
0.6
5
0.7
0.7
5
0.8
0.8
5
0.9
0.9
5 1
Hatchery baseline 2005 to 2007
0
5
10
15
20
25
30
Proportion of hatchery admixture (qi)
0
5
10
15
20
Fre
qu
en
cy
Proportion of Admixture
lower Eagle Creek 2005
0
2
4
6
8
10
Fre
qu
en
cy
Proportion of hatchery admixture (qi)
lower Eagle Creek 2006
Num
ber
of
indiv
idual
s
Wild baseline 2005 to 2007
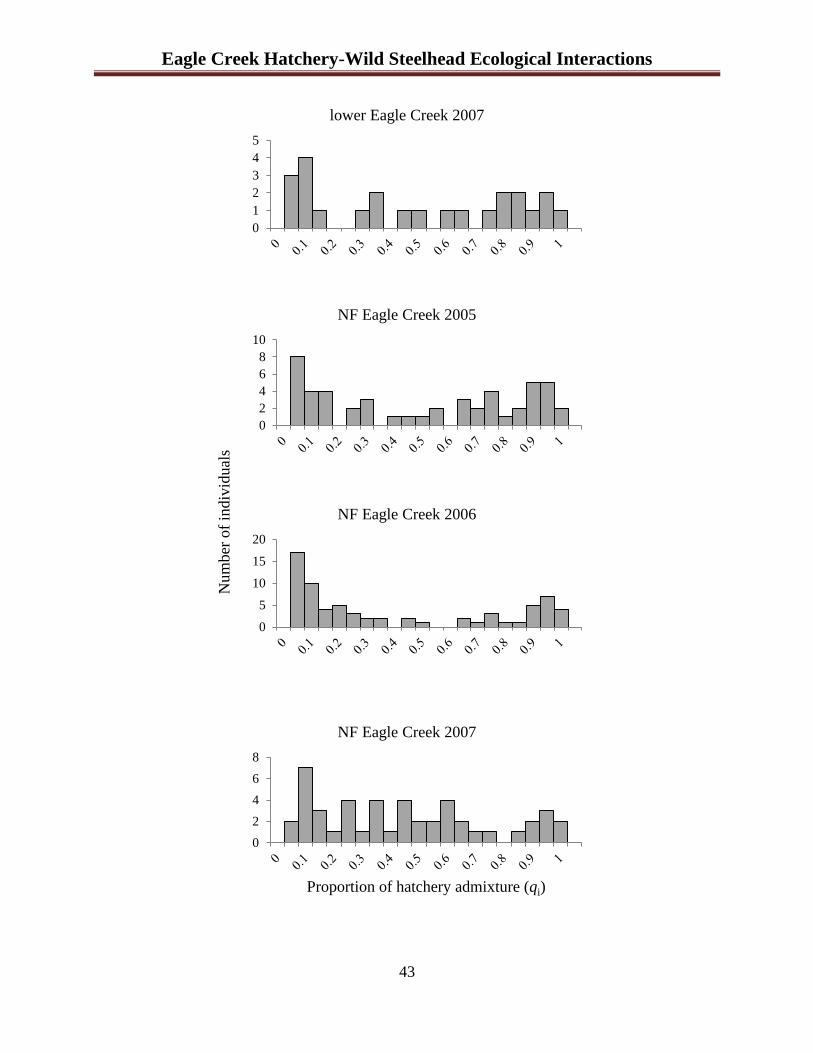
Eagle Creek Hatchery-Wild Steelhead Ecological Interactions
43
0
1
2
3
4
5
Nu
mb
er
Proportion of Admixture
lower Eagle Creek 2007
0
2
4
6
8
10
Fre
qu
en
cy
Proportion of hatchery admixture (qi)
NF Eagle Creek 2005
0
5
10
15
20
Fre
qu
en
cy
Proportion of Admixture
NF Eagle Creek 2006
0
2
4
6
8
Fre
qu
en
cy
Proportion of hatchery admixture (qi)
NF Eagle Creek 2007
Num
ber
of
indiv
idual
s
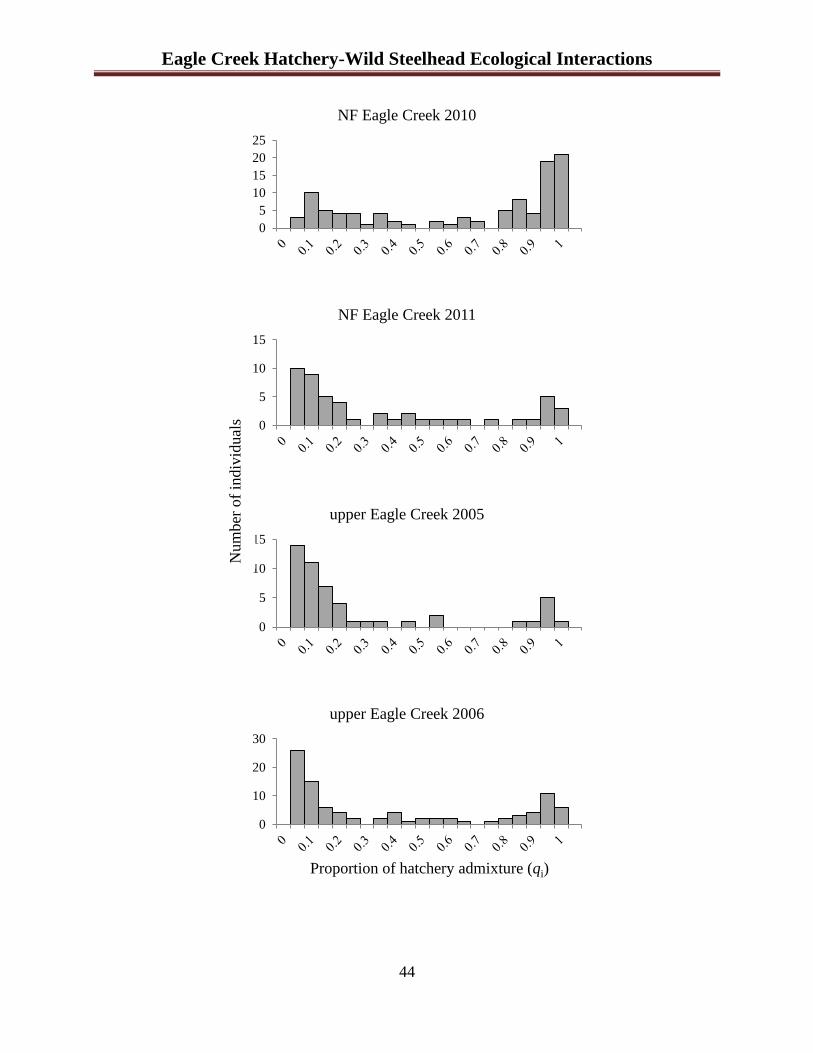
Eagle Creek Hatchery-Wild Steelhead Ecological Interactions
44
0
5
10
15
20
25
Fre
qu
en
cy
Proportion of Admixture
NF Eagle Creek 2010
0
5
10
15
Fre
qu
en
cy
Proportion of hatchery admixture (qi)
NF Eagle Creek 2011
0
5
10
15
Fre
qu
en
cy
Proportion of Admixture
upper Eagle Creek 2005
0
10
20
30
Fre
qu
en
cy
Proportion of hatchery admixture (qi)
upper Eagle Creek 2006
Num
ber
of
indiv
idual
s
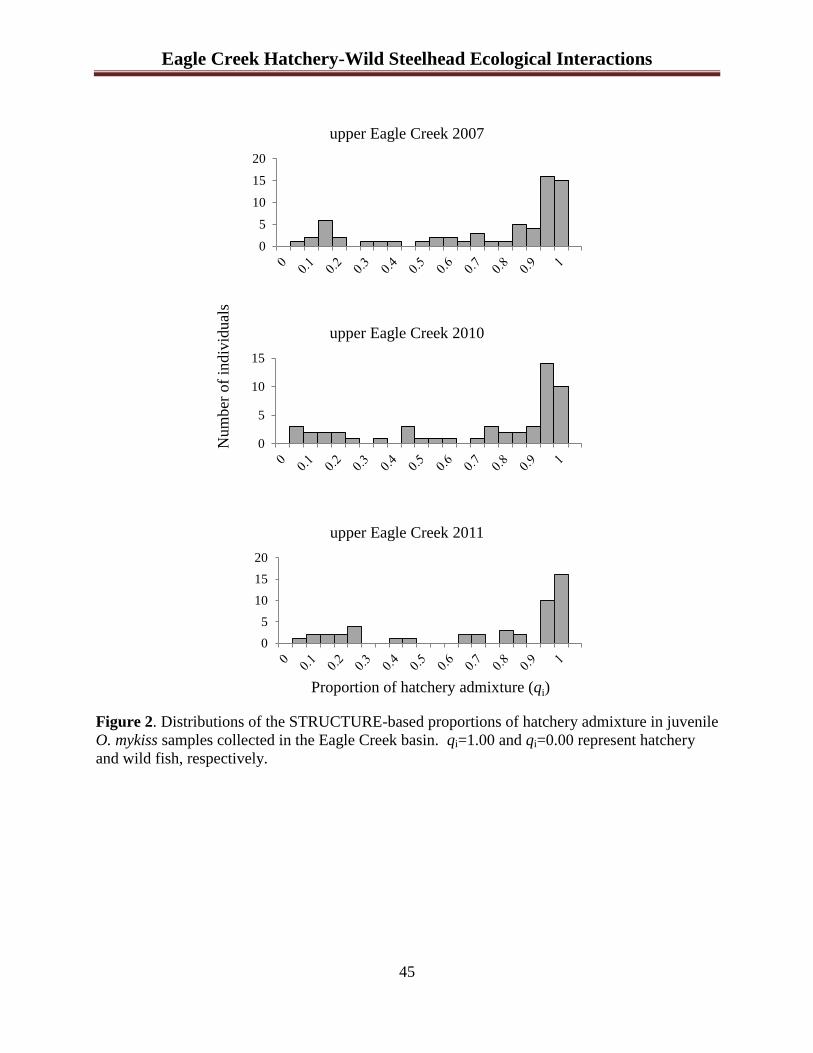
Eagle Creek Hatchery-Wild Steelhead Ecological Interactions
45
Figure 2. Distributions of the STRUCTURE-based proportions of hatchery admixture in juvenile
O. mykiss samples collected in the Eagle Creek basin. qi=1.00 and qi=0.00 represent hatchery
and wild fish, respectively.
0
5
10
15
20
Fre
qu
en
cy
Proportion of Admixture
upper Eagle Creek 2007
0
5
10
15
Fre
qu
ency
Proportion of admixture (qi)
upper Eagle Creek 2010
0
5
10
15
20
Nu
mb
er o
f in
div
id
Proportion of hatchery admixture (qi)
upper Eagle Creek 2011
Num
ber
of
indiv
idual
s
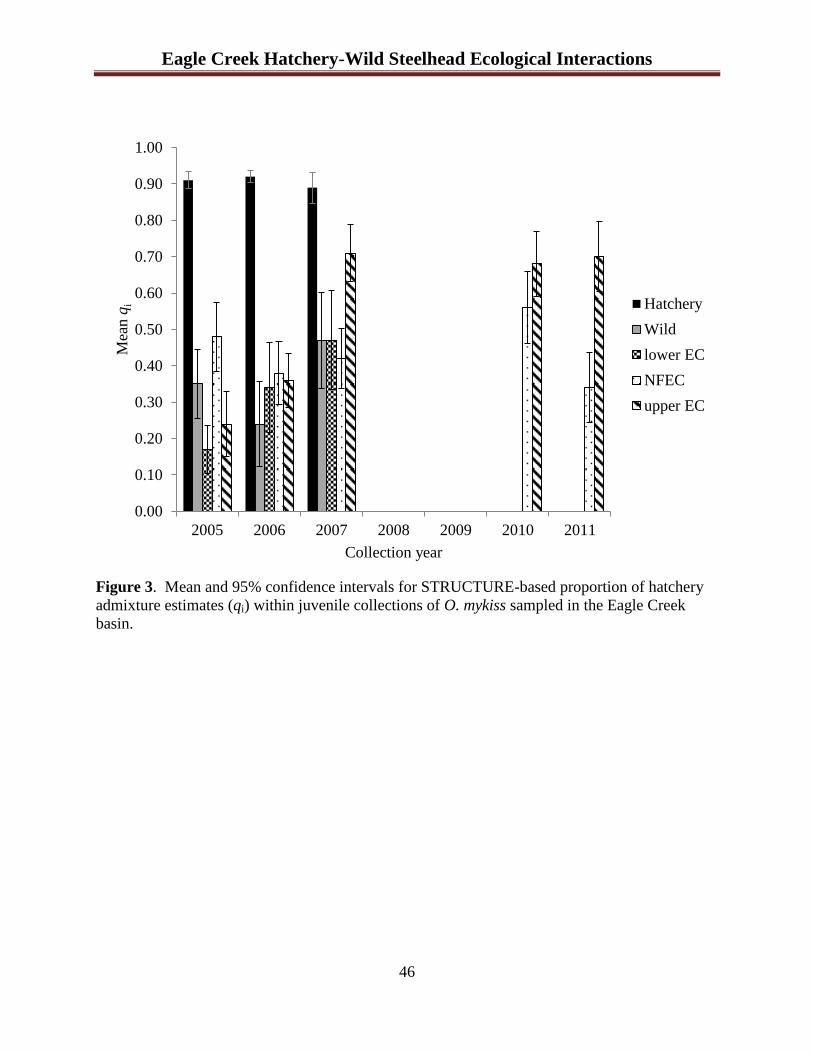
Eagle Creek Hatchery-Wild Steelhead Ecological Interactions
46
Figure 3. Mean and 95% confidence intervals for STRUCTURE-based proportion of hatchery
admixture estimates (qi) within juvenile collections of O. mykiss sampled in the Eagle Creek
basin.
0.00
0.10
0.20
0.30
0.40
0.50
0.60
0.70
0.80
0.90
1.00
2005 2006 2007 2008 2009 2010 2011
Mea
n q
i
Collection year
Hatchery
Wild
lower EC
NFEC
upper EC

Eagle Creek Hatchery-Wild Steelhead Ecological Interactions
47
Literature cited
Allendorf, F. W., R. F. Leary, P. Spruell, and J. K. Wenburg. 2001. The problems with hybrids:
setting conservation guidelines. Trends in Ecology & Evolution 16(11):613-622.
Excoffier, L., G. Laval, and S. Schneider. 2005. Arlequin (version 3.0): An integrated software
package for population genetics data analysis. Evolutionary Bioinformatics 1:47-50.
Kavanagh, M., and coauthors. 2009. Ecological and Genetic Interactions between Hatchery and
Wild Steelhead in Eagle Creek, Oregon. CRFPO Final Report.
Matala, A., Ardren, W., Kavanagh, M., Brignon, W., Hogle, J., and Olson, D. 2007. An
evaluation of natural productivity and genetic interactions between a segregated hatchery
stock and wild steelhead trout (Oncorhynchus mykiss) in Eagle Creek, Oregon. AFTC
Final Report.
Peakall, R. O. D., and P. E. Smouse. 2006. genalex 6: genetic analysis in Excel. Population
genetic software for teaching and research. Molecular Ecology Notes 6(1):288-295.
Pritchard, J. K., M. Stephens, and P. Donnelly. 2000. Inference of population structure using
multilocus genotype data. Genetics 155(2):945-959.
Vaha, J.-P., and C. R. Primmer. 2006. Efficiency of model-based Bayesian methods for detecting
hybrid individuals under different hybridization scenarios and with different numbers of
loci. Molecular Ecology 15(1):63-72.

48
Appendix B:
Double Rainbow by Tess McBride, U.S. Fish and Wildlife Service, Reflections on Fisheries
Conservation, Eddies, Spring 2011, Volume 4 (1) 22-23.

49
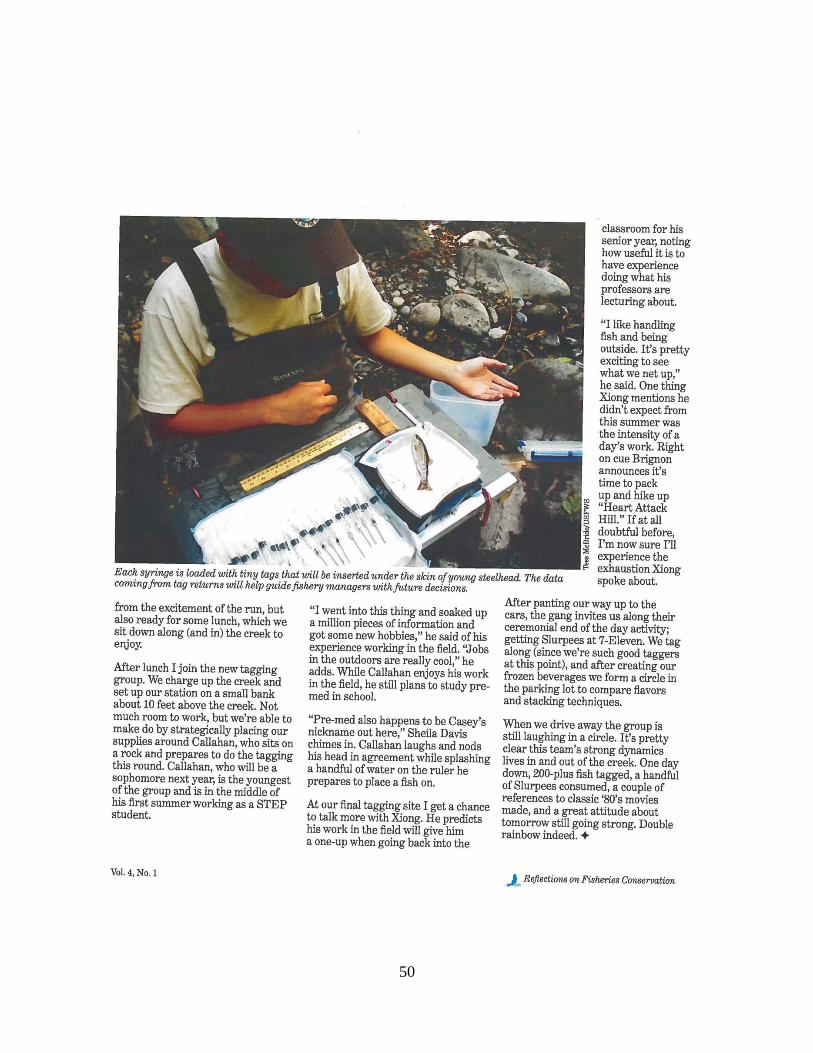
50

51
U.S. Fish and Wildlife Service
Columbia River Fisheries Program Office
1211 SE Cardinal Court, Suite 100
Vancouver, WA 98683
January 2016
www.fws.gov/columbiariver