u.s. fish & wildlife service birding in the united …. fish & wildlife service birding in...
TRANSCRIPT
U.S. Fish & Wildlife Service
Birding in the United States: A Demographic and Economic AnalysisAddendum to the 2006 National Survey of Fishing, Hunting, and Wildlife-Associated RecreationReport 2006-4

U.S. Fish & Wildlife Service
June 2009, Amended July 2009
Erin Carver U.S. Fish and Wildlife Service Division of Economics Arlington VA
This report is intended to complement the National and State reports from the 2006 National Survey of Fishing, Hunting, and Wildlife-Associated Recreation. The conclusions are the author’s and do not represent official positions of the U.S. Fish and Wildlife Service.
The author thanks Sylvia Cabrera and Richard Aiken for their input into this report.
Birding in the United States: A Demographic and Economic AnalysisAddendum to the 2006 National Survey of Fishing, Hunting, and Wildlife-Associated RecreationReport 2006-4
2 Birding in the United States: A Demographic and Economic Analysis
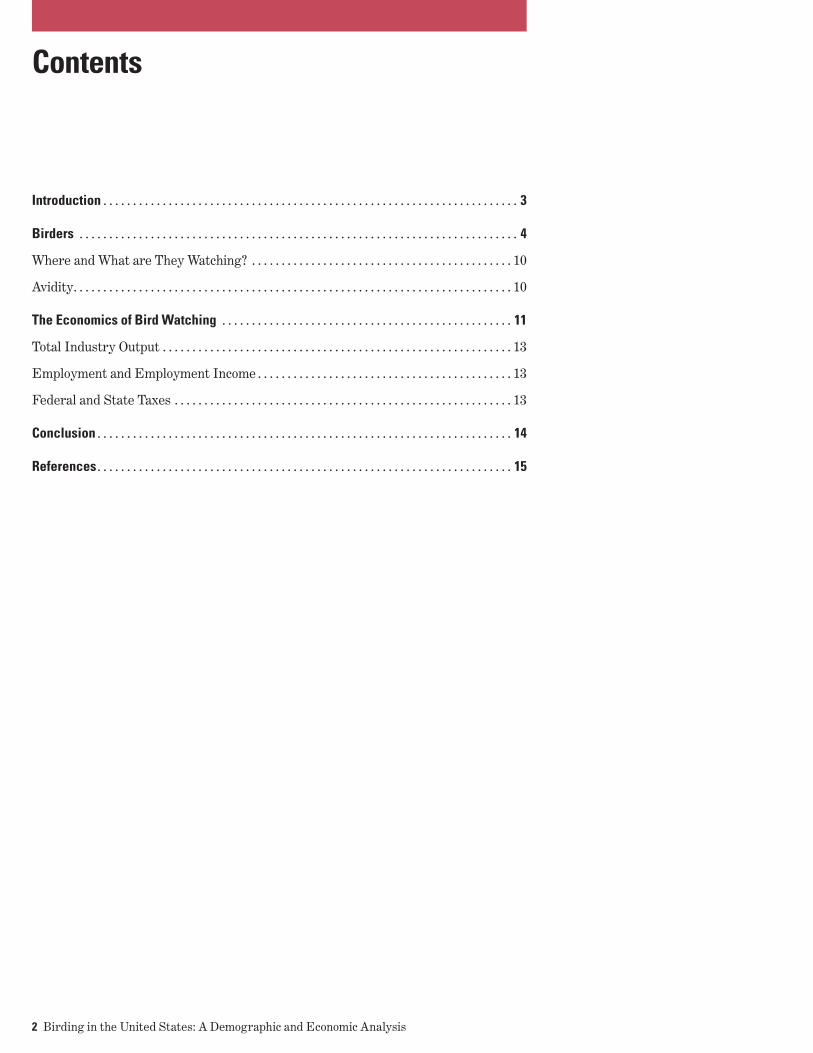
Contents
Introduction . . . . . . . . . . . . . . . . . . . . . . . . . . . . . . . . . . . . . . . . . . . . . . . . . . . . . . . . . . . . . . . . . . . . . . 3
Birders . . . . . . . . . . . . . . . . . . . . . . . . . . . . . . . . . . . . . . . . . . . . . . . . . . . . . . . . . . . . . . . . . . . . . . . . . . 4
Where and What are They Watching? . . . . . . . . . . . . . . . . . . . . . . . . . . . . . . . . . . . . . . . . . . . . 10
Avidity . . . . . . . . . . . . . . . . . . . . . . . . . . . . . . . . . . . . . . . . . . . . . . . . . . . . . . . . . . . . . . . . . . . . . . . . . . 10
The Economics of Bird Watching . . . . . . . . . . . . . . . . . . . . . . . . . . . . . . . . . . . . . . . . . . . . . . . . . 11
Total Industry Output . . . . . . . . . . . . . . . . . . . . . . . . . . . . . . . . . . . . . . . . . . . . . . . . . . . . . . . . . . . 13
Employment and Employment Income . . . . . . . . . . . . . . . . . . . . . . . . . . . . . . . . . . . . . . . . . . . 13
Federal and State Taxes . . . . . . . . . . . . . . . . . . . . . . . . . . . . . . . . . . . . . . . . . . . . . . . . . . . . . . . . . 13
Conclusion . . . . . . . . . . . . . . . . . . . . . . . . . . . . . . . . . . . . . . . . . . . . . . . . . . . . . . . . . . . . . . . . . . . . . . 14
References . . . . . . . . . . . . . . . . . . . . . . . . . . . . . . . . . . . . . . . . . . . . . . . . . . . . . . . . . . . . . . . . . . . . . . 15

Birding in the United States: A Demographic and Economic Analysis 3
Introduction
Eri
n C
arve
r/U
SFW
S
The following report provides up-to-date information so birders and policy makers can make informed decisions regarding the management of birds and their habitats. This report identifies who birders are, where they live, how avid they are, and what kinds of birds they watch. In addition to demographic information, this report also provides an economic measure of birding. It estimates how much birders spend on their hobby and the economic impact of these expenditures.
By understanding who birders are, they can be more easily reached and informed about pressures facing birds and bird habitats. Conversely, by knowing who is likely not a birder, or who is potentially a birder, information can be more effectively tailored. The economic impact estimates presented here can be used by resource managers and policy makers to demonstrate the economic might of birders and, by extension, the economic impact of birds.
All data presented here are from the wildlife-watching section of the 2006 National Survey of Fishing, Hunting, and Wildlife-Associated Recreation (FHWAR). It is the most comprehensive survey of wildlife recreation in the United States. Overall, 11,300 detailed wildlife-watching interviews were completed with a response rate of 78 percent. The Survey focused on 2006 participation and expenditures by U.S. residents 16 years of age and older.
4 Birding in the United States: A Demographic and Economic Analysis
Birders
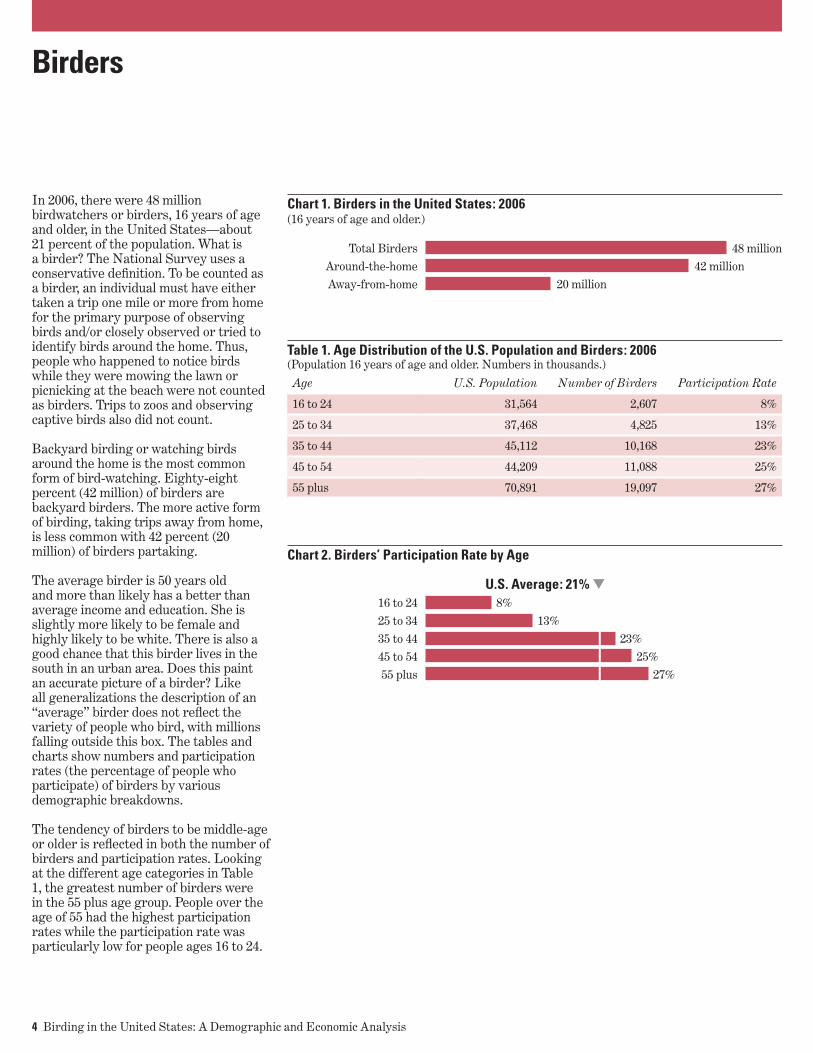
In 2006, there were 48 million birdwatchers or birders, 16 years of age and older, in the United States—about 21 percent of the population. What is a birder? The National Survey uses a conservative definition. To be counted as a birder, an individual must have either taken a trip one mile or more from home for the primary purpose of observing birds and/or closely observed or tried to identify birds around the home. Thus, people who happened to notice birds while they were mowing the lawn or picnicking at the beach were not counted as birders. Trips to zoos and observing captive birds also did not count.
Backyard birding or watching birds around the home is the most common form of bird-watching. Eighty-eight percent (42 million) of birders are backyard birders. The more active form of birding, taking trips away from home, is less common with 42 percent (20 million) of birders partaking.
The average birder is 50 years old and more than likely has a better than average income and education. She is slightly more likely to be female and highly likely to be white. There is also a good chance that this birder lives in the south in an urban area. Does this paint an accurate picture of a birder? Like all generalizations the description of an “average” birder does not reflect the variety of people who bird, with millions falling outside this box. The tables and charts show numbers and participation rates (the percentage of people who participate) of birders by various demographic breakdowns.
The tendency of birders to be middle-age or older is reflected in both the number of birders and participation rates. Looking at the different age categories in Table 1, the greatest number of birders were in the 55 plus age group. People over the age of 55 had the highest participation rates while the participation rate was particularly low for people ages 16 to 24.
Chart 1. Birders in the United States: 2006(16 years of age and older.)
Total Birders 48 million Around-the-home 42 million Away-from-home 20 million
Table 1. Age Distribution of the U.S. Population and Birders: 2006(Population 16 years of age and older. Numbers in thousands.)
Age U.S. Population Number of Birders Participation Rate
16 to 24 31,564 2,607 8%
25 to 34 37,468 4,825 13%
35 to 44 45,112 10,168 23%
45 to 54 44,209 11,088 25%
55 plus 70,891 19,097 27%
Chart 2. Birders’ Participation Rate by Age
U.S. Average: 21% ▼ 16 to 24 8% 25 to 34 13% 35 to 44 23% 45 to 54 25% 55 plus 27%
Birding in the United States: A Demographic and Economic Analysis 5
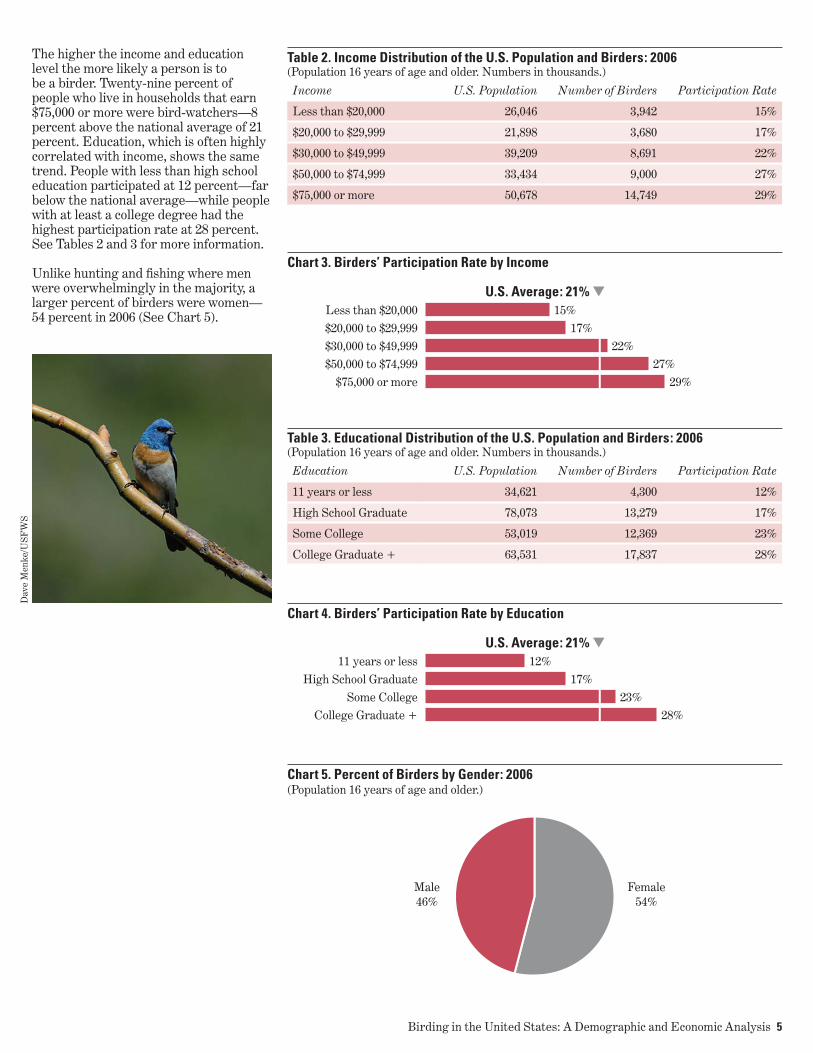
The higher the income and education level the more likely a person is to be a birder. Twenty-nine percent of people who live in households that earn $75,000 or more were bird-watchers—8 percent above the national average of 21 percent. Education, which is often highly correlated with income, shows the same trend. People with less than high school education participated at 12 percent—far below the national average—while people with at least a college degree had the highest participation rate at 28 percent. See Tables 2 and 3 for more information.
Unlike hunting and fishing where men were overwhelmingly in the majority, a larger percent of birders were women—54 percent in 2006 (See Chart 5).
Chart 3. Birders’ Participation Rate by Income
U.S. Average: 21% ▼ Less than $20,000 15% $20,000 to $29,999 17% $30,000 to $49,999 22% $50,000 to $74,999 27% $75,000 or more 29%
Chart 4. Birders’ Participation Rate by Education
U.S. Average: 21% ▼ 11 years or less 12% High School Graduate 17% Some College 23% College Graduate + 28%
Chart 5. Percent of Birders by Gender: 2006(Population 16 years of age and older.)
Table 2. Income Distribution of the U.S. Population and Birders: 2006(Population 16 years of age and older. Numbers in thousands.)
Income U.S. Population Number of Birders Participation Rate
Less than $20,000 26,046 3,942 15%
$20,000 to $29,999 21,898 3,680 17%
$30,000 to $49,999 39,209 8,691 22%
$50,000 to $74,999 33,434 9,000 27%
$75,000 or more 50,678 14,749 29%
Table 3. Educational Distribution of the U.S. Population and Birders: 2006(Population 16 years of age and older. Numbers in thousands.)
Education U.S. Population Number of Birders Participation Rate
11 years or less 34,621 4,300 12%
High School Graduate 78,073 13,279 17%
Some College 53,019 12,369 23%
College Graduate + 63,531 17,837 28%
Male 46%
Female 54%
Dav
e M
enke
/USF
WS
6 Birding in the United States: A Demographic and Economic Analysis
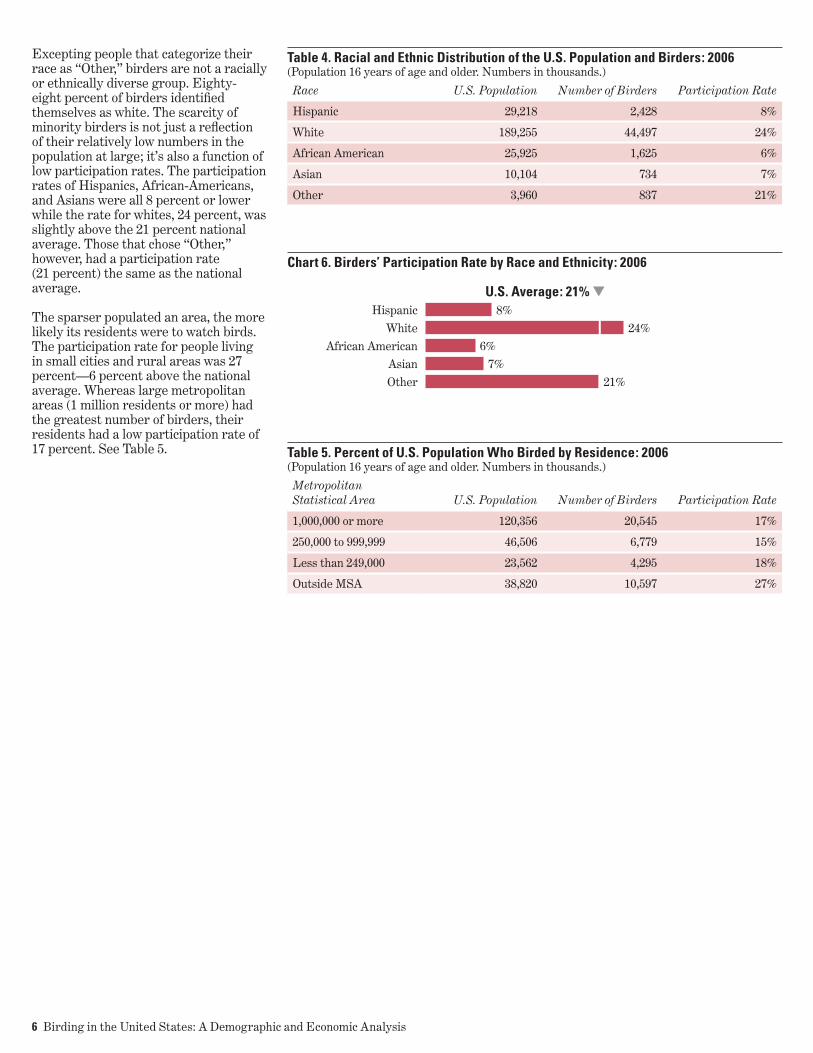
Excepting people that categorize their race as “Other,” birders are not a racially or ethnically diverse group. Eighty-eight percent of birders identified themselves as white. The scarcity of minority birders is not just a reflection of their relatively low numbers in the population at large; it’s also a function of low participation rates. The participation rates of Hispanics, African-Americans, and Asians were all 8 percent or lower while the rate for whites, 24 percent, was slightly above the 21 percent national average. Those that chose “Other,” however, had a participation rate (21 percent) the same as the national average.
The sparser populated an area, the more likely its residents were to watch birds. The participation rate for people living in small cities and rural areas was 27 percent—6 percent above the national average. Whereas large metropolitan areas (1 million residents or more) had the greatest number of birders, their residents had a low participation rate of 17 percent. See Table 5.
Chart 6. Birders’ Participation Rate by Race and Ethnicity: 2006
U.S. Average: 21% ▼ Hispanic 8% White 24% African American 6% Asian 7% Other 21%
Table 4. Racial and Ethnic Distribution of the U.S. Population and Birders: 2006(Population 16 years of age and older. Numbers in thousands.)
Race U.S. Population Number of Birders Participation Rate
Hispanic 29,218 2,428 8%
White 189,255 44,497 24%
African American 25,925 1,625 6%
Asian 10,104 734 7%
Other 3,960 837 21%
Table 5. Percent of U.S. Population Who Birded by Residence: 2006(Population 16 years of age and older. Numbers in thousands.)
Metropolitan Statistical Area U.S. Population Number of Birders Participation Rate
1,000,000 or more 120,356 20,545 17%
250,000 to 999,999 46,506 6,779 15%
Less than 249,000 23,562 4,295 18%
Outside MSA 38,820 10,597 27%
Birding in the United States: A Demographic and Economic Analysis 7
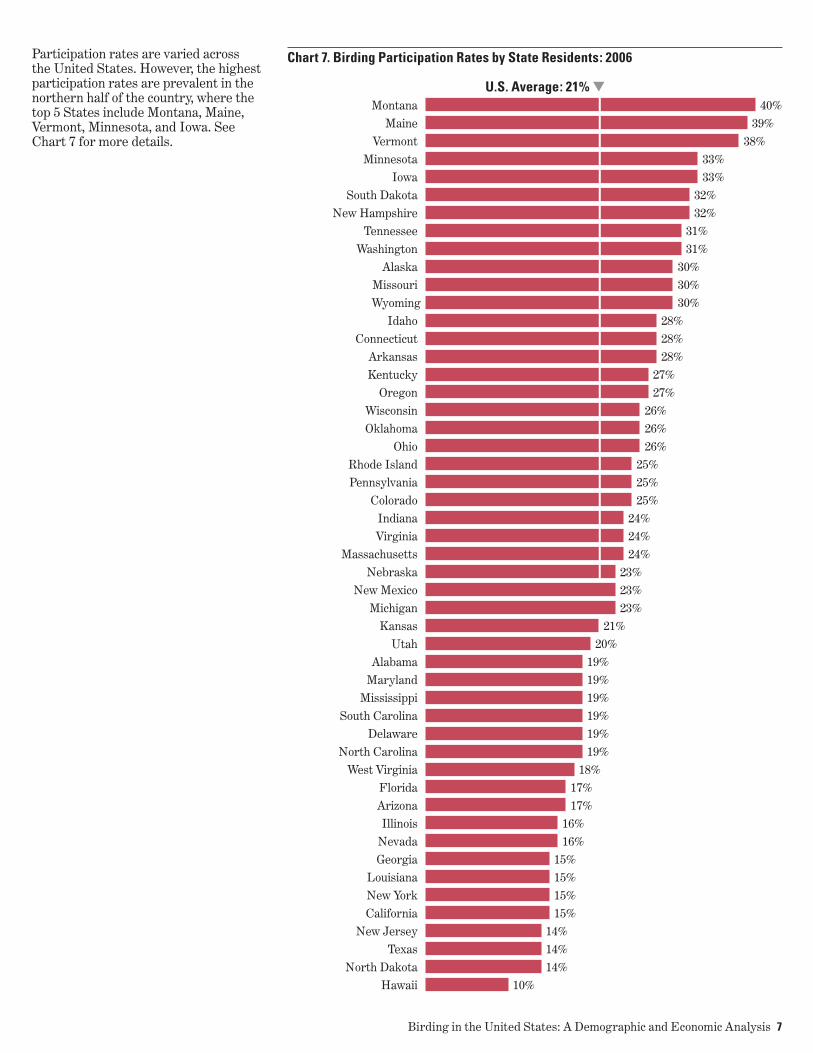
Participation rates are varied across the United States. However, the highest participation rates are prevalent in the northern half of the country, where the top 5 States include Montana, Maine, Vermont, Minnesota, and Iowa. See Chart 7 for more details.
Chart 7. Birding Participation Rates by State Residents: 2006
U.S. Average: 21% ▼ Montana 40% Maine 39% Vermont 38% Minnesota 33% Iowa 33% South Dakota 32% New Hampshire 32% Tennessee 31% Washington 31% Alaska 30% Missouri 30% Wyoming 30% Idaho 28% Connecticut 28% Arkansas 28% Kentucky 27% Oregon 27% Wisconsin 26% Oklahoma 26% Ohio 26% Rhode Island 25% Pennsylvania 25% Colorado 25% Indiana 24% Virginia 24% Massachusetts 24% Nebraska 23% New Mexico 23% Michigan 23% Kansas 21% Utah 20% Alabama 19% Maryland 19% Mississippi 19% South Carolina 19% Delaware 19% North Carolina 19% West Virginia 18% Florida 17% Arizona 17% Illinois 16% Nevada 16% Georgia 15% Louisiana 15% New York 15% California 15% New Jersey 14% Texas 14% North Dakota 14% Hawaii 10%
8 Birding in the United States: A Demographic and Economic Analysis
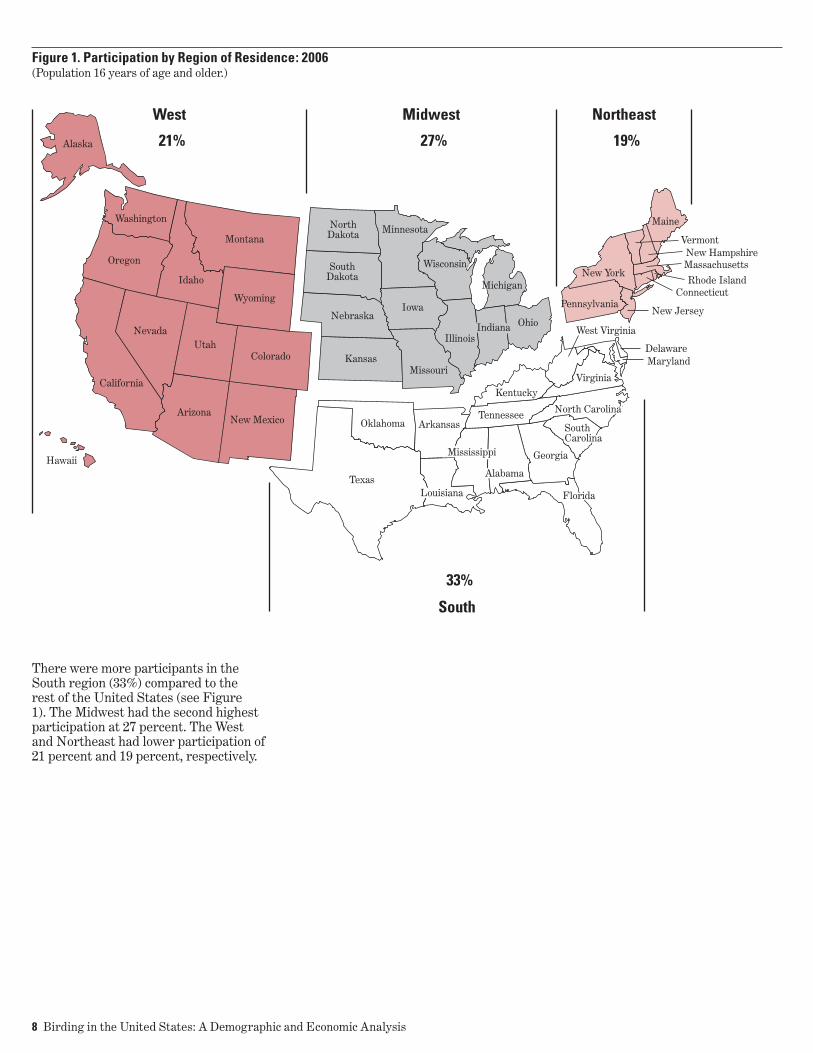
There were more participants in the South region (33%) compared to the rest of the United States (see Figure 1). The Midwest had the second highest participation at 27 percent. The West and Northeast had lower participation of 21 percent and 19 percent, respectively.
Figure 1. Participation by Region of Residence: 2006(Population 16 years of age and older.)
West
21%
33%
27% 19%
Midwest
South
Northeast
Alaska
Washington
Idaho
Oregon
California
Hawaii
NevadaUtah
ArizonaNew Mexico
Colorado
Wyoming
MontanaNorth
Dakota Minnesota
Iowa
Wisconsin
Ohio
KentuckyVirginia
Tennessee
Georgia
Illinois
Missouri
SouthDakota
Nebraska
Kansas
Oklahoma Arkansas
TexasAlabama
Indiana
Louisiana
Mississippi
SouthCarolina
North Carolina
Florida
West Virginia
Delaware
New Jersey
ConnecticutRhode Island
MassachusettsNew Hampshire
Vermont
Maryland
Pennsylvania
Maine
New York Michigan
Birding in the United States: A Demographic and Economic Analysis 9
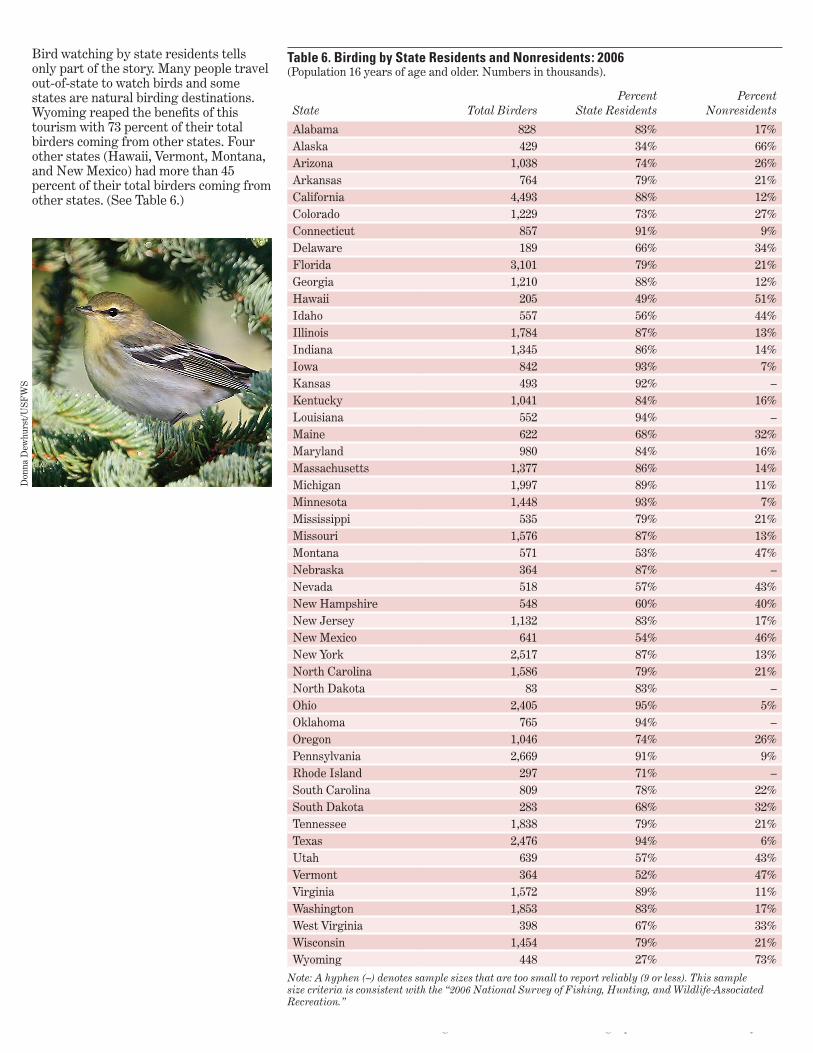
Bird watching by state residents tells only part of the story. Many people travel out-of-state to watch birds and some states are natural birding destinations. Wyoming reaped the benefits of this tourism with 73 percent of their total birders coming from other states. Four other states (Hawaii, Vermont, Montana, and New Mexico) had more than 45 percent of their total birders coming from other states. (See Table 6.)
Table 6. Birding by State Residents and Nonresidents: 2006(Population 16 years of age and older. Numbers in thousands).
State Total BirdersPercent
State ResidentsPercent
Nonresidents
Alabama 828 83% 17%Alaska 429 34% 66%Arizona 1,038 74% 26%Arkansas 764 79% 21%California 4,493 88% 12%Colorado 1,229 73% 27%Connecticut 857 91% 9%Delaware 189 66% 34%Florida 3,101 79% 21%Georgia 1,210 88% 12%Hawaii 205 49% 51%Idaho 557 56% 44%Illinois 1,784 87% 13%Indiana 1,345 86% 14%Iowa 842 93% 7%Kansas 493 92% –Kentucky 1,041 84% 16%Louisiana 552 94% –Maine 622 68% 32%Maryland 980 84% 16%Massachusetts 1,377 86% 14%Michigan 1,997 89% 11%Minnesota 1,448 93% 7%Mississippi 535 79% 21%Missouri 1,576 87% 13%Montana 571 53% 47%Nebraska 364 87% –Nevada 518 57% 43%New Hampshire 548 60% 40%New Jersey 1,132 83% 17%New Mexico 641 54% 46%New York 2,517 87% 13%North Carolina 1,586 79% 21%North Dakota 83 83% –Ohio 2,405 95% 5%Oklahoma 765 94% –Oregon 1,046 74% 26%Pennsylvania 2,669 91% 9%Rhode Island 297 71% –South Carolina 809 78% 22%South Dakota 283 68% 32%Tennessee 1,838 79% 21%Texas 2,476 94% 6%Utah 639 57% 43%Vermont 364 52% 47%Virginia 1,572 89% 11%Washington 1,853 83% 17%West Virginia 398 67% 33%Wisconsin 1,454 79% 21%Wyoming 448 27% 73%
Note: A hyphen (–) denotes sample sizes that are too small to report reliably (9 or less). This sample size criteria is consistent with the “2006 National Survey of Fishing, Hunting, and Wildlife-Associated Recreation.”
Don
na D
ewhu
rst/
USF
WS
10 Birding in the United States: A Demographic and Economic Analysis
Where and What are They Watching?Backyard birding is the most prevalent form of birding with 88 percent of participants watching birds from the comfort of their homes. Forty-two percent of birders travel more than a mile from home to bird watch, visiting both private and public lands.
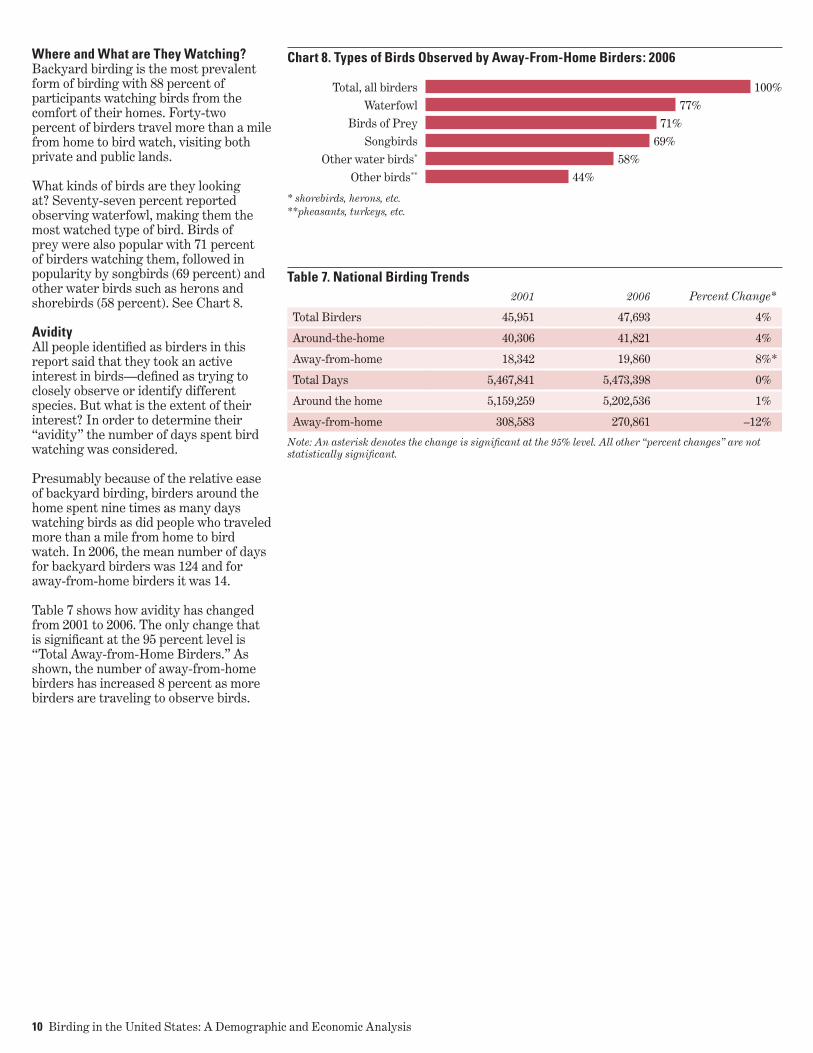
What kinds of birds are they looking at? Seventy-seven percent reported observing waterfowl, making them the most watched type of bird. Birds of prey were also popular with 71 percent of birders watching them, followed in popularity by songbirds (69 percent) and other water birds such as herons and shorebirds (58 percent). See Chart 8.
AvidityAll people identified as birders in this report said that they took an active interest in birds—defined as trying to closely observe or identify different species. But what is the extent of their interest? In order to determine their “avidity” the number of days spent bird watching was considered.
Presumably because of the relative ease of backyard birding, birders around the home spent nine times as many days watching birds as did people who traveled more than a mile from home to bird watch. In 2006, the mean number of days for backyard birders was 124 and for away-from-home birders it was 14.
Table 7 shows how avidity has changed from 2001 to 2006. The only change that is significant at the 95 percent level is “Total Away-from-Home Birders.” As shown, the number of away-from-home birders has increased 8 percent as more birders are traveling to observe birds.
Chart 8. Types of Birds Observed by Away-From-Home Birders: 2006
Total, all birders 100% Waterfowl 77% Birds of Prey 71% Songbirds 69% Other water birds* 58% Other birds** 44%
* shorebirds, herons, etc.**pheasants, turkeys, etc.
Table 7. National Birding Trends2001 2006 Percent Change*
Total Birders 45,951 47,693 4%
Around-the-home 40,306 41,821 4%
Away-from-home 18,342 19,860 8%*
Total Days 5,467,841 5,473,398 0%
Around the home 5,159,259 5,202,536 1%
Away-from-home 308,583 270,861 –12%
Note: An asterisk denotes the change is significant at the 95% level. All other “percent changes” are not statistically significant.
Birding in the United States: A Demographic and Economic Analysis 11
The Economics of Bird Watching
Birders spend money on a variety of goods and services for trip-related and equipment-related purchases. Trip-related expenditures include food, lodging, transportation, and other incidental expenses. Equipment expenditures consist of binoculars, cameras, camping equipment, and other costs. By having ripple effects throughout the economy, these direct expenditures are only part of the economic impact of birding. The effect on the economy in excess of direct expenditures is known as the multiplier effect. For example, an individual may purchase a bird house to enhance birding at home. Part of the purchase price will stay with the local retailer. The local retailer, in turn, pays a wholesaler who in turn pays the manufacturer of the bird houses. The manufacturer then spends a portion of this income to pay businesses supplying the manufacturer. In this sense, each dollar of local retail expenditures can affect a variety of businesses. Thus, expenditures associated with birding can ripple through the economy by impacting economic activity, employment, and household income. To measure these effects, a regional input-output modeling method1 is utilized to derive estimates for total industry output, employment, employment income, and tax revenue associated with birding.
1 The estimates for total industry output, employment, employment income, and federal and state taxes were derived using IMPLAN, a regional input-output model and software system.
Mas
low
ski/U
SFW
S
12 Birding in the United States: A Demographic and Economic Analysis
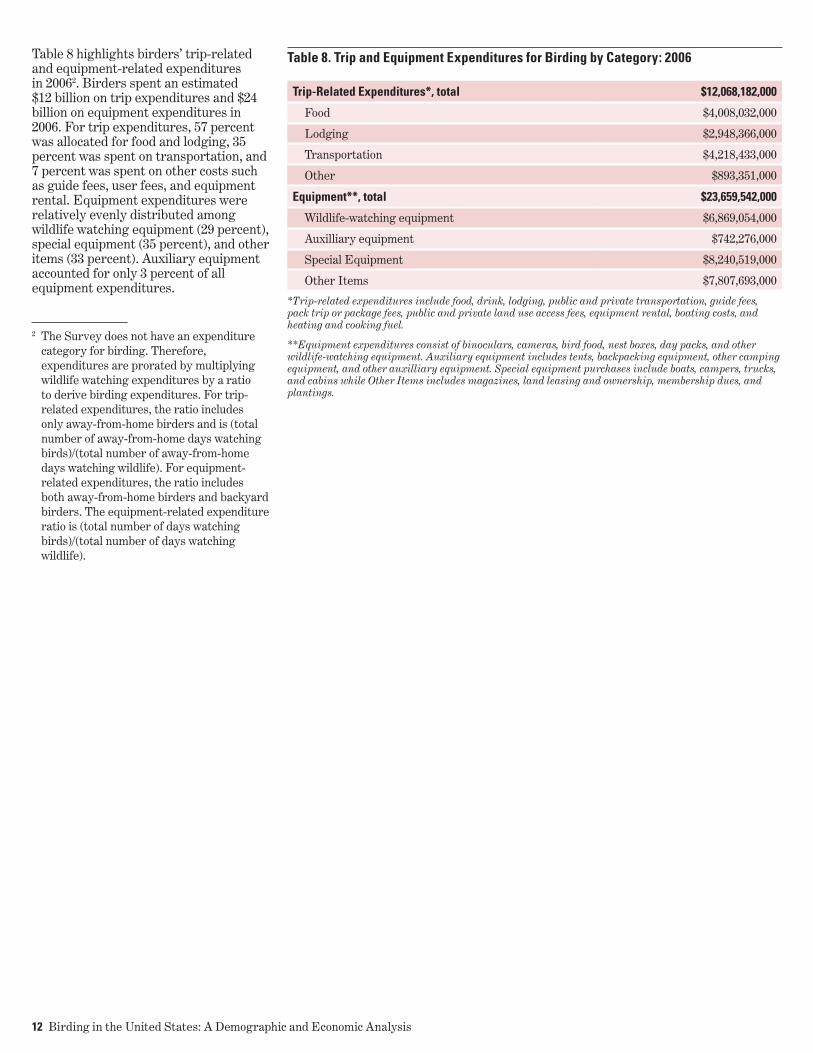
Table 8 highlights birders’ trip-related and equipment-related expenditures in 20062. Birders spent an estimated $12 billion on trip expenditures and $24 billion on equipment expenditures in 2006. For trip expenditures, 57 percent was allocated for food and lodging, 35 percent was spent on transportation, and 7 percent was spent on other costs such as guide fees, user fees, and equipment rental. Equipment expenditures were relatively evenly distributed among wildlife watching equipment (29 percent), special equipment (35 percent), and other items (33 percent). Auxiliary equipment accounted for only 3 percent of all equipment expenditures.
2 The Survey does not have an expenditure category for birding. Therefore, expenditures are prorated by multiplying wildlife watching expenditures by a ratio to derive birding expenditures. For trip-related expenditures, the ratio includes only away-from-home birders and is (total number of away-from-home days watching birds)/(total number of away-from-home days watching wildlife). For equipment-related expenditures, the ratio includes both away-from-home birders and backyard birders. The equipment-related expenditure ratio is (total number of days watching birds)/(total number of days watching wildlife).
Table 8. Trip and Equipment Expenditures for Birding by Category: 2006
Trip-Related Expenditures*, total $12,068,182,000
Food $4,008,032,000
Lodging $2,948,366,000
Transportation $4,218,433,000
Other $893,351,000
Equipment**, total $23,659,542,000
Wildlife-watching equipment $6,869,054,000
Auxilliary equipment $742,276,000
Special Equipment $8,240,519,000
Other Items $7,807,693,000
*Trip-related expenditures include food, drink, lodging, public and private transportation, guide fees, pack trip or package fees, public and private land use access fees, equipment rental, boating costs, and heating and cooking fuel.
**Equipment expenditures consist of binoculars, cameras, bird food, nest boxes, day packs, and other wildlife-watching equipment. Auxiliary equipment includes tents, backpacking equipment, other camping equipment, and other auxilliary equipment. Special equipment purchases include boats, campers, trucks, and cabins while Other Items includes magazines, land leasing and ownership, membership dues, and plantings.
Birding in the United States: A Demographic and Economic Analysis 13
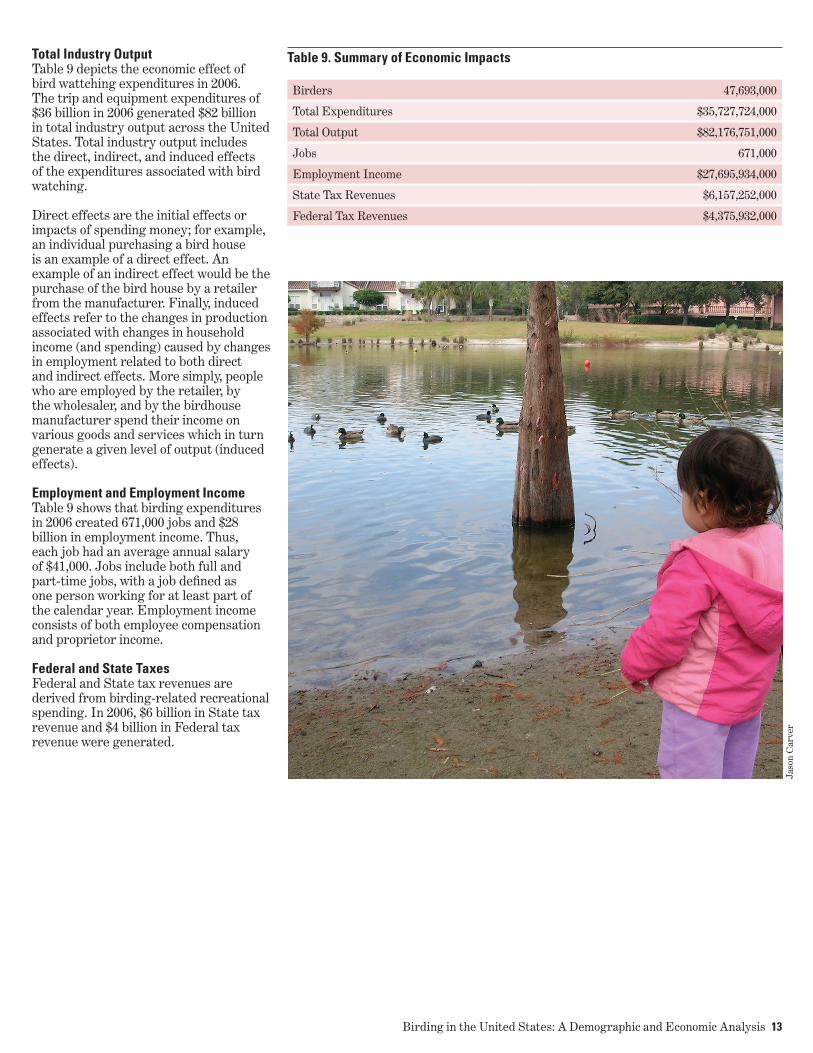
Total Industry OutputTable 9 depicts the economic effect of bird wattching expenditures in 2006. The trip and equipment expenditures of $36 billion in 2006 generated $82 billion in total industry output across the United States. Total industry output includes the direct, indirect, and induced effects of the expenditures associated with bird watching.
Direct effects are the initial effects or impacts of spending money; for example, an individual purchasing a bird house is an example of a direct effect. An example of an indirect effect would be the purchase of the bird house by a retailer from the manufacturer. Finally, induced effects refer to the changes in production associated with changes in household income (and spending) caused by changes in employment related to both direct and indirect effects. More simply, people who are employed by the retailer, by the wholesaler, and by the birdhouse manufacturer spend their income on various goods and services which in turn generate a given level of output (induced effects).
Employment and Employment IncomeTable 9 shows that birding expenditures in 2006 created 671,000 jobs and $28 billion in employment income. Thus, each job had an average annual salary of $41,000. Jobs include both full and part-time jobs, with a job defined as one person working for at least part of the calendar year. Employment income consists of both employee compensation and proprietor income.
Federal and State TaxesFederal and State tax revenues are derived from birding-related recreational spending. In 2006, $6 billion in State tax revenue and $4 billion in Federal tax revenue were generated.
Jaso
n C
arve
r
Table 9. Summary of Economic Impacts
Birders 47,693,000
Total Expenditures $35,727,724,000
Total Output $82,176,751,000
Jobs 671,000
Employment Income $27,695,934,000
State Tax Revenues $6,157,252,000
Federal Tax Revenues $4,375,932,000
14 Birding in the United States: A Demographic and Economic Analysis
Conclusion
This report presented information on the participation and expenditure patterns of 48 million birders in 2006. Trip-related and equipment-related expenditures associated with birding generated over $82 billion in total industry output, 671,000 jobs, and $11 billion in local, state, and federal tax revenue. This impact was distributed across local, state, and national economies.
John
and
Kar
en H
ollin
gsw
orth
/USF
WS
Birding in the United States: A Demographic and Economic Analysis 15
References
MIG, Inc. IMPLAN System (2004 Data and Software). 1940 South Greeley Street, Suite 101, Stillwater, MN 55082. 2004.
U.S. Department of the Interior, Fish and Wildlife Service and U.S. Department of Commerce, Bureau of the Census. 2006 National Survey of Fishing, Hunting, and Wildlife-Associated Recreation. Washington DC: U.S. Government Printing Office, October 2007.
Vern
on B
yrd/
USF
WS

16 Birding in the United States: A Demographic and Economic Analysis


U.S. Department of the InteriorU.S. Fish & Wildlife Servicehttp://wsfrprograms.fws.gov
Cove
r pho
to: A
rt S
owis
/USF
WS