u.s. gdp growth - milken institute › assets › events › ... · 2014-08-20 · u.s. gdp growth...
TRANSCRIPT
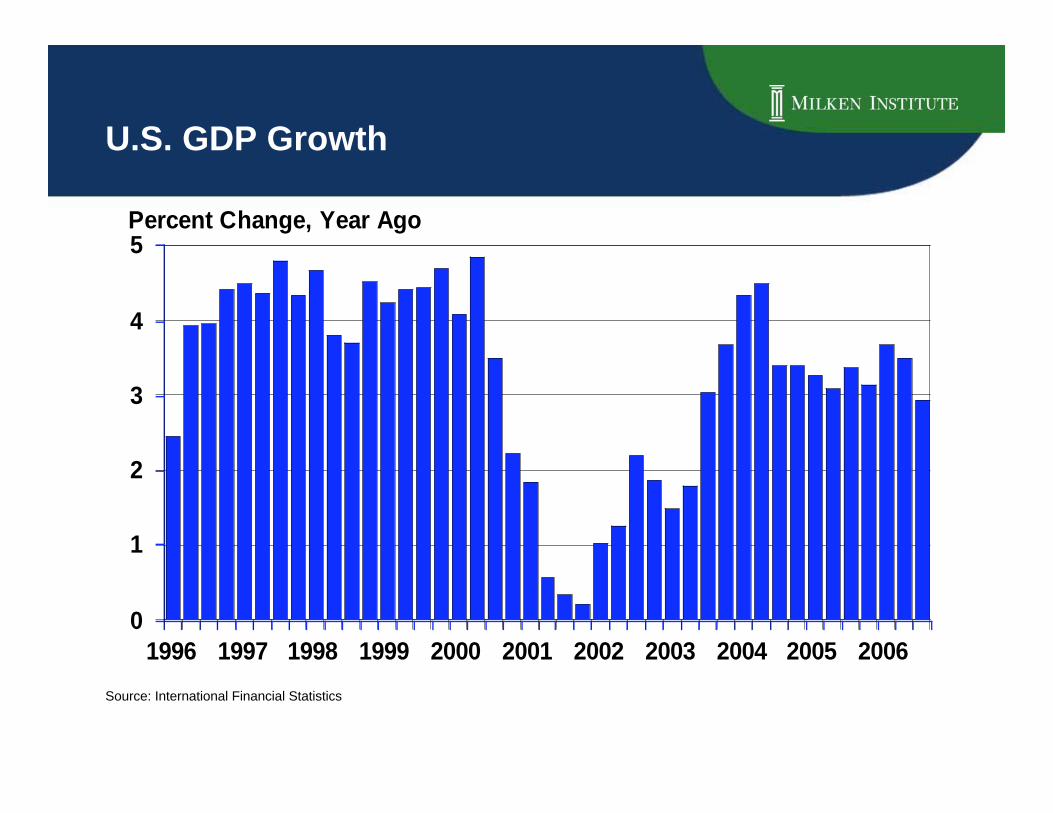
U.S. GDP Growth
Source: International Financial Statistics
0
1
2
3
4
5
1996 1997 1998 1999 2000 2001 2002 2003 2004 2005 2006
Percent Change, Year Ago

200620011996199119861981
4
2
0
-2
-4
-6
-8
% of GDP
A Brief Period of U.S. Budget Surplus
Surplus
Deficit
Source: U.S. Department of the Treasury, Bureau of the Public Debt

Where the U.S. Budget Money Goes Spending, 2008 Budget, % of Total
Total = $2.9 Trillion
Social
security
21%
Medicare and
Medicaid
20%
Other non-
discretionary
11%
Non-security
discretionary
16%Net interest
9%
Defense
17%Other
security
6%
Source: Office of Management and Budget
2006200420022000199819961994199219901988
450
400
350
300
250
200
10
8
6
4
2
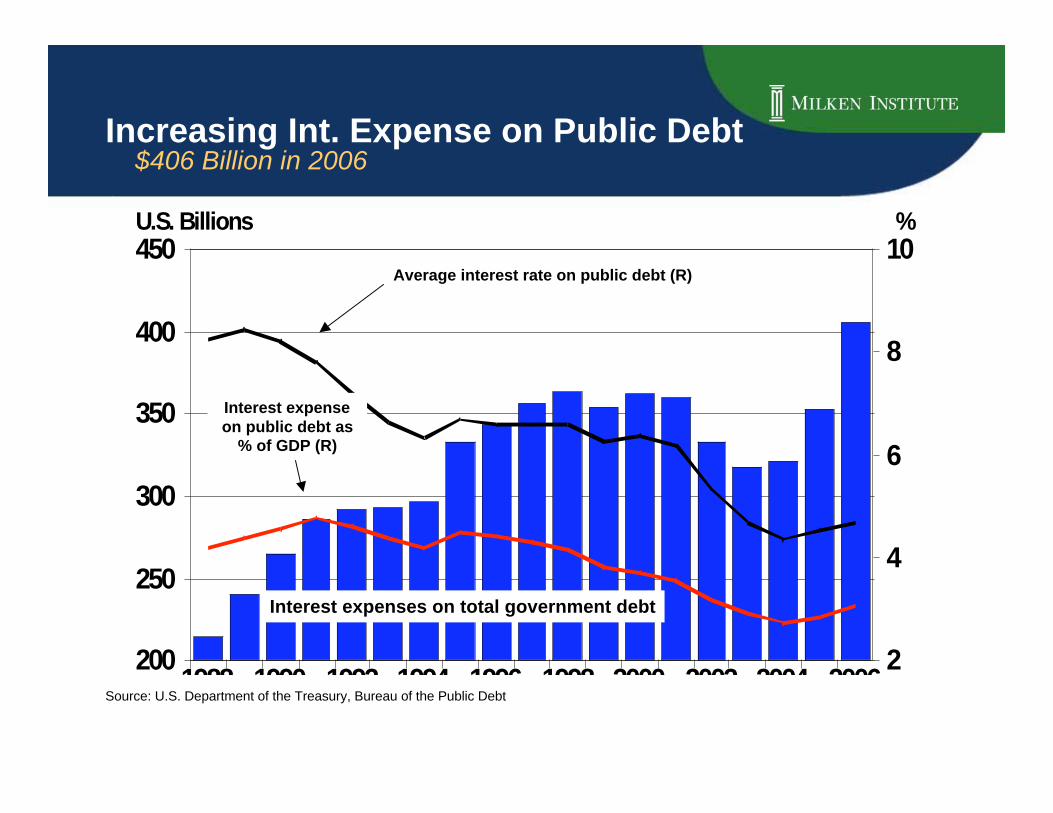
U.S. Billions %
Increasing Int. Expense on Public Debt $406 Billion in 2006
Average interest rate on public debt (R)
Interest expenseon public debt as
% of GDP (R)
Interest expenses on total government debt
Source: U.S. Department of the Treasury, Bureau of the Public Debt

Declining U.S. Dollar Role Currency Denomination of International Debt Outstanding
U.S.
dollar
37%
Pound
sterling
8%
Euro
47%
Japanese
yen
3%
Other
5%
U.S.
dollar
47%
Other
6%
Pound
sterling
8%
Euro
29%
Japanese
yen
10%
1999US$ 4,999 Billions
2006Q3US$ 16,267 Billions

Decline of the Dollar
Yen (L)
Euro (R)
100
105
110
115
120
125
130
135
0.6
0.7
0.8
0.9
1.0
1.1
1.2
1.3
2001 2002 2003 2004 2005 2006
Yen/USD Euro/USD
Source: Bloomberg

0
50
100
150
200
250
300
80
90
100
110
120
130
140
January 2000 = 100 January 2000 = 100
2000 2001 2002 2003 2004 2005 2006
Lower Dollar, Higher Oil Price
Crude oil (L)
Trade-weighted dollar (R)
Source: Bloomberg, International Financial Statistics
12.0
12.5
13.0
13.5
14.0
14.5
15.0
2000 2001 2002 2003 2004 2005 2006
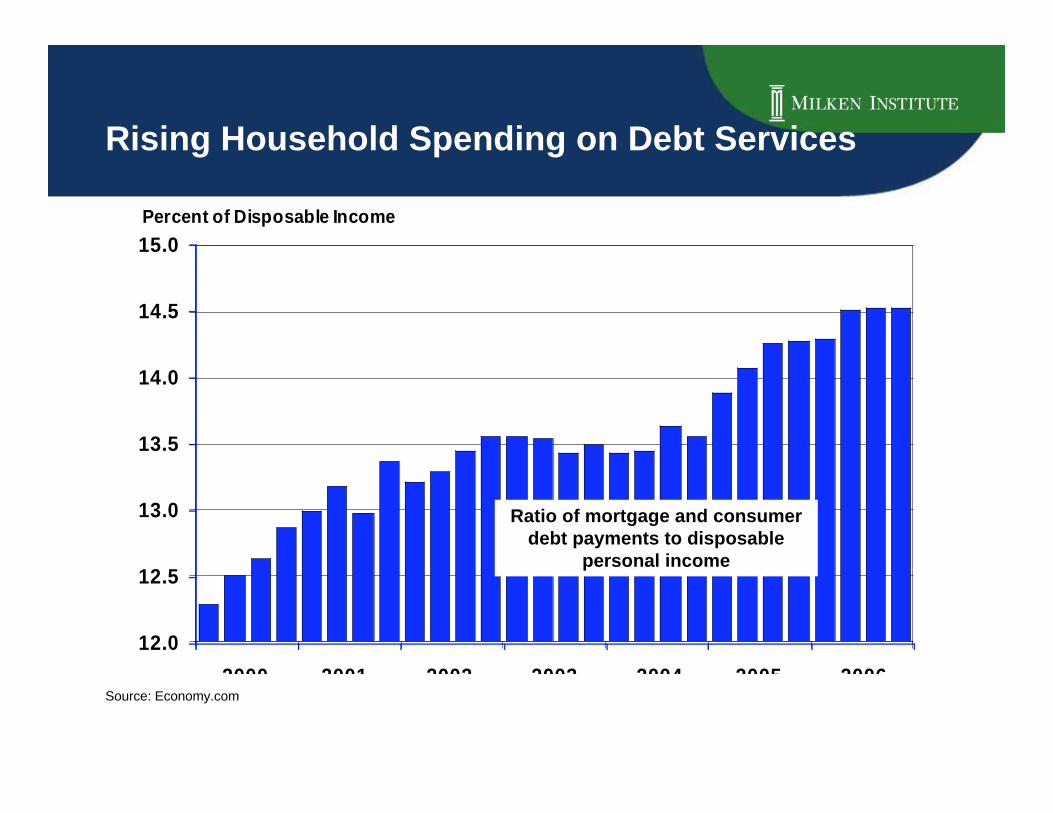
Percent of Disposable Income
Ratio of mortgage and consumerdebt payments to disposable
personal income
Source: Economy.com
Rising Household Spending on Debt Services

20062005200420032002200120001999199819971996
10
8
6
4
2
0
3.5
3.0
2.5
2.0
1.5
1.0
0.5
0.0
Percent Percent
ML Corp AAA 1-3 Yr (L)
ML Corp BBB 1-3 Yr (L)
Spread (R)
Source: Bloomberg
Corporate Bond Credit Spread Yield to Maturity

Step by Step 17 Fed Fund Rate Hikes Since 2004
200620052004
6
5
4
3
2
1
0
Percent
Source: Federal Reserve

Mortgage Rates United States
Sources: Freddie Mac, Economy.com
3
4
5
6
7
8
930-Year Fixed
15-Year Fixed
1-Year ARM
1997 1998 1999 2000 2001 2002 2003 2004 2005 2006
Percent
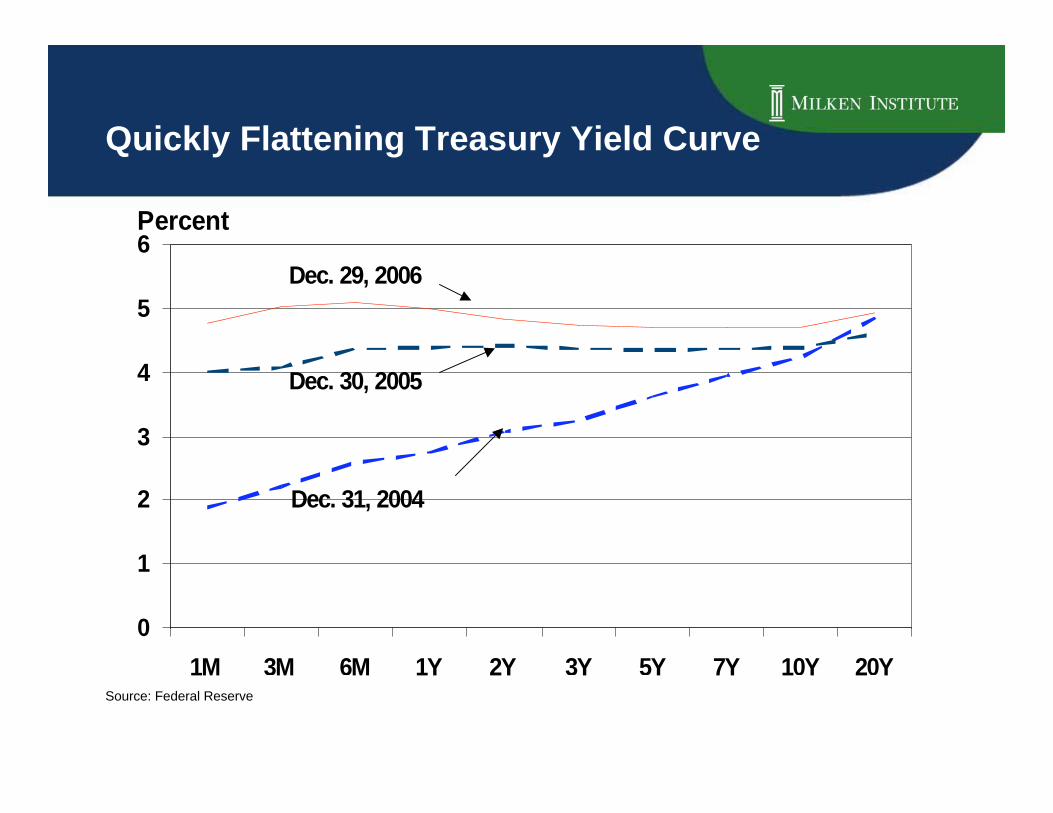
Dec. 31, 2004
Dec. 30, 2005
Dec. 29, 2006
0
1
2
3
4
5
6
1M 3M 6M 1Y 2Y 3Y 5Y 7Y 10Y 20Y
Percent
Quickly Flattening Treasury Yield Curve
Source: Federal Reserve
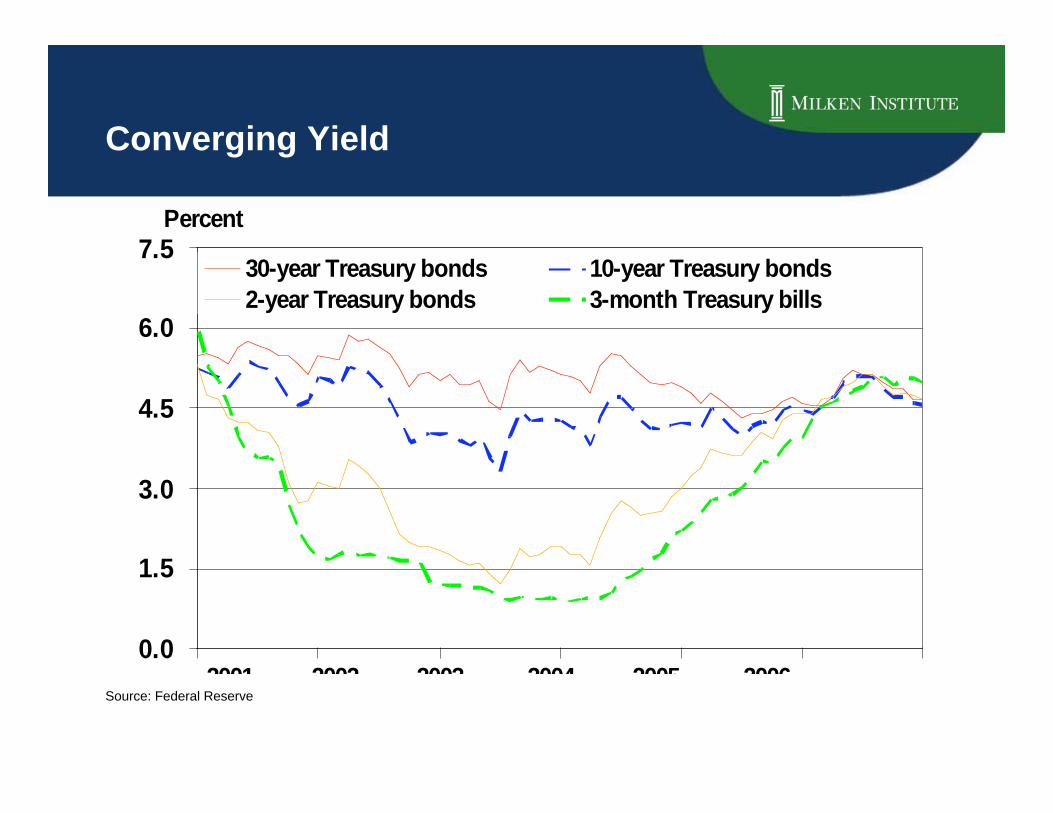
Converging Yield
0.0
1.5
3.0
4.5
6.0
7.530-year Treasury bonds 10-year Treasury bonds
2-year Treasury bonds 3-month Treasury bills
Percent
2001 2002 2003 2004 2005 2006Source: Federal Reserve
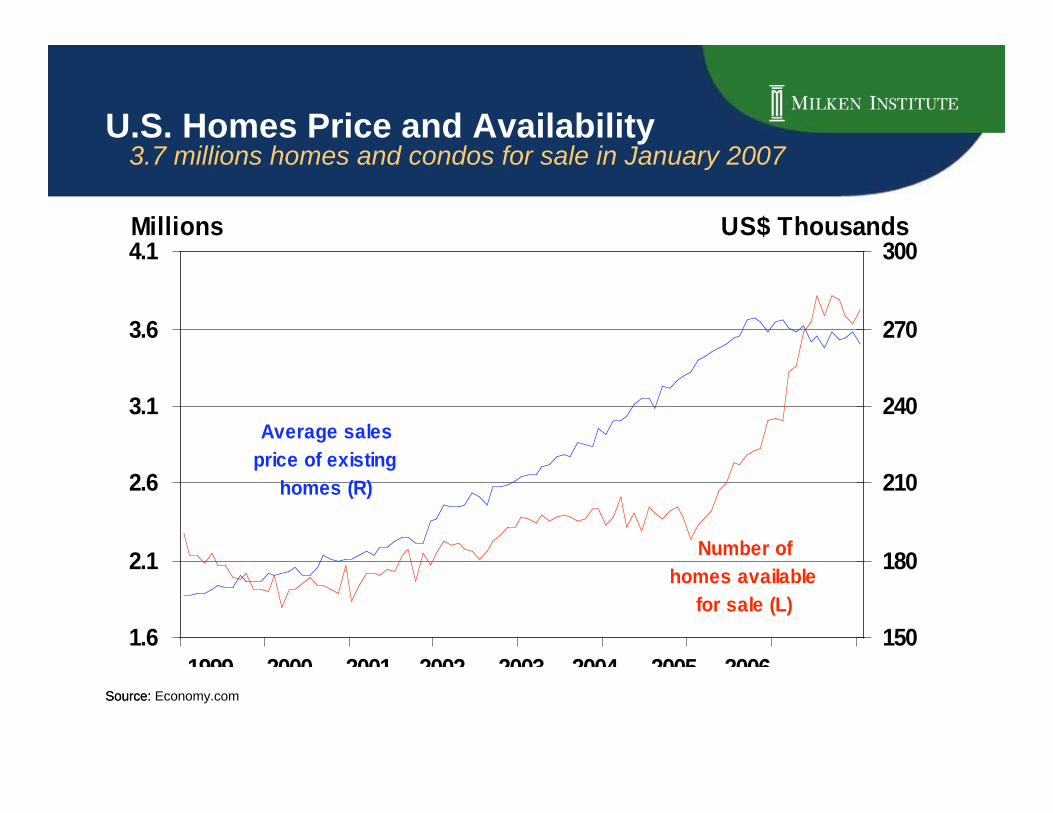
U.S. Homes Price and Availability3.7 millions homes and condos for sale in January 2007
Source:Source: Economy.com
Number of
homes available
for sale (L)
Average sales
price of existing
homes (R)
1.6
2.1
2.6
3.1
3.6
4.1
150
180
210
240
270
300Millions US$ Thousands
1999 2000 2001 2002 2003 2004 2005 2006
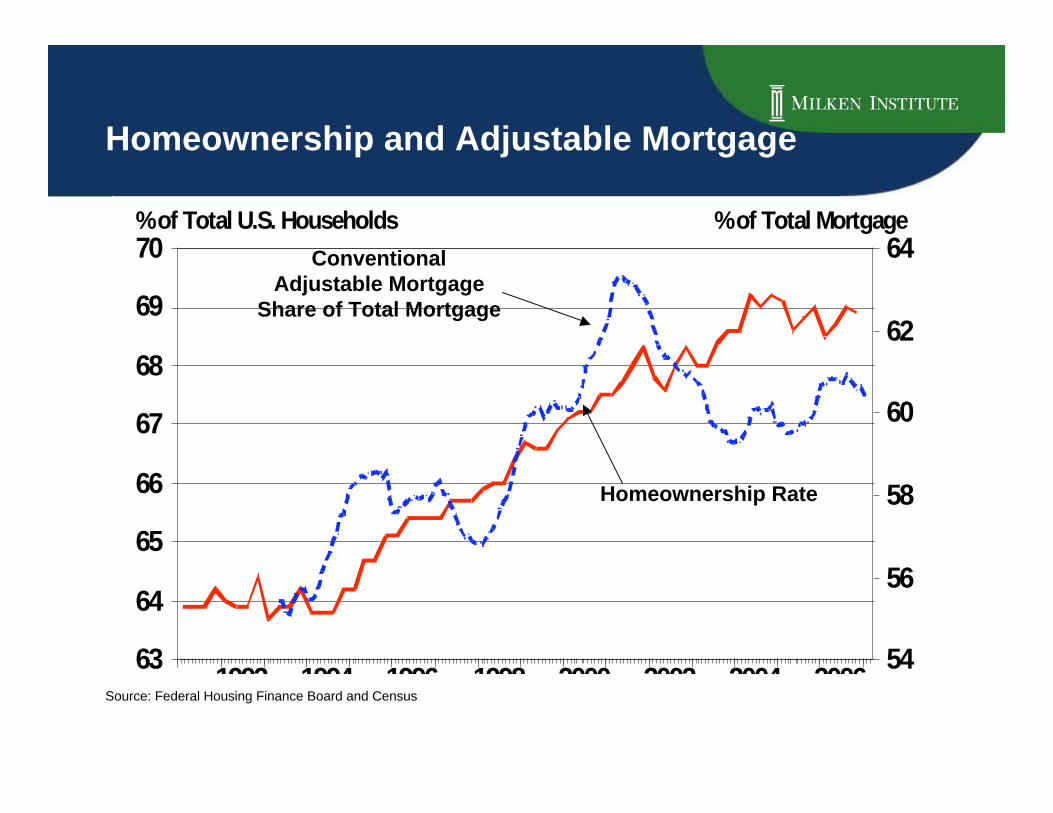
Homeownership and Adjustable Mortgage
20062004200220001998199619941992
70
69
68
67
66
65
64
63
64
62
60
58
56
54
% of Total U.S. Households % of Total Mortgage
Source: Federal Housing Finance Board and Census
ConventionalAdjustable Mortgage
Share of Total Mortgage
Homeownership Rate

0605040302010099989796
14
12
10
8
6
4
9
8
7
6
5
4
US$ Billions Percent
Mortgage Rate and Mortgages Outstanding
$13.3 trilliontotal mortgages
outstanding
30-years fixedmortgage rate
Source: Economy.com
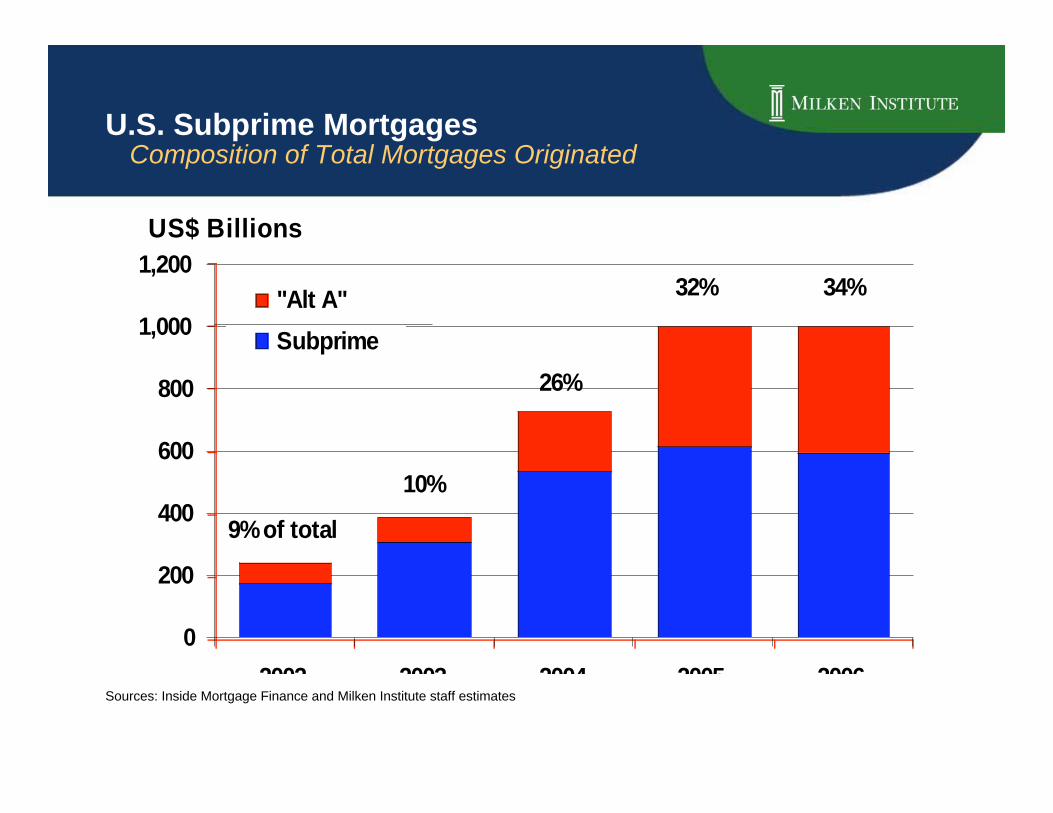
U.S. Subprime Mortgages Composition of Total Mortgages Originated
Sources: Inside Mortgage Finance and Milken Institute staff estimates
0
200
400
600
800
1,000
1,200
2002 2003 2004 2005 2006
"Alt A"
Subprime
9% of total
10%
26%
32% 34%
US$ Billions
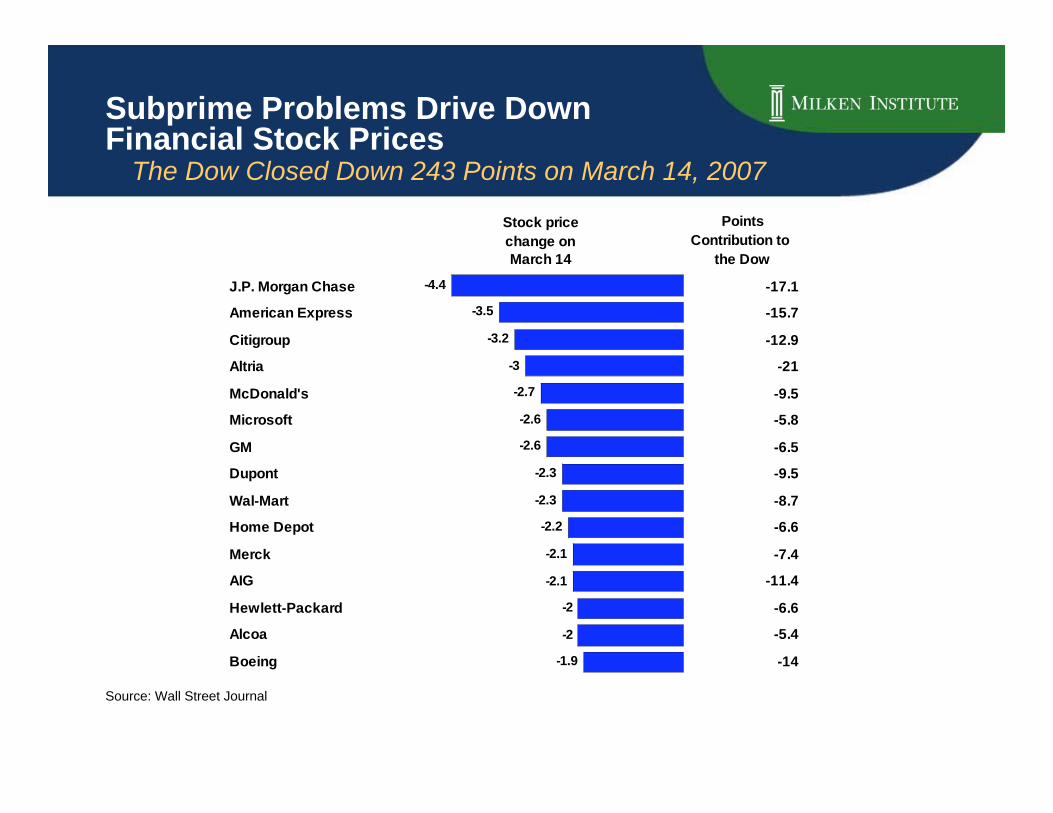
Subprime Problems Drive DownFinancial Stock Prices The Dow Closed Down 243 Points on March 14, 2007
Points
Contribution to
the Dow
J.P. Morgan Chase -17.1
American Express -15.7
Citigroup -12.9
Altria -21
McDonald's -9.5
Microsoft -5.8
GM -6.5
Dupont -9.5
Wal-Mart -8.7
Home Depot -6.6
Merck -7.4
AIG -11.4
Hewlett-Packard -6.6
Alcoa -5.4
Boeing -14
Stock price
change on
March 14
-4.4
-3.5
-3.2
-3
-2.7
-2.6
-2.6
-2.3
-2.3
-2.2
-2.1
-2.1
-2
-2
-1.9
Source: Wall Street Journal

Riskier in Mortgage? By Type of Mortgage Loan
58
34
8.4
98
2
0.4
0
20
40
60
80
100
2001 2005
Negative
Amortization
Normal (positive)
Amortization
Interest Only (zero)
Amortization
Percent

U.S. Energy Supply and Consumption Quadrillion BTU, 2005
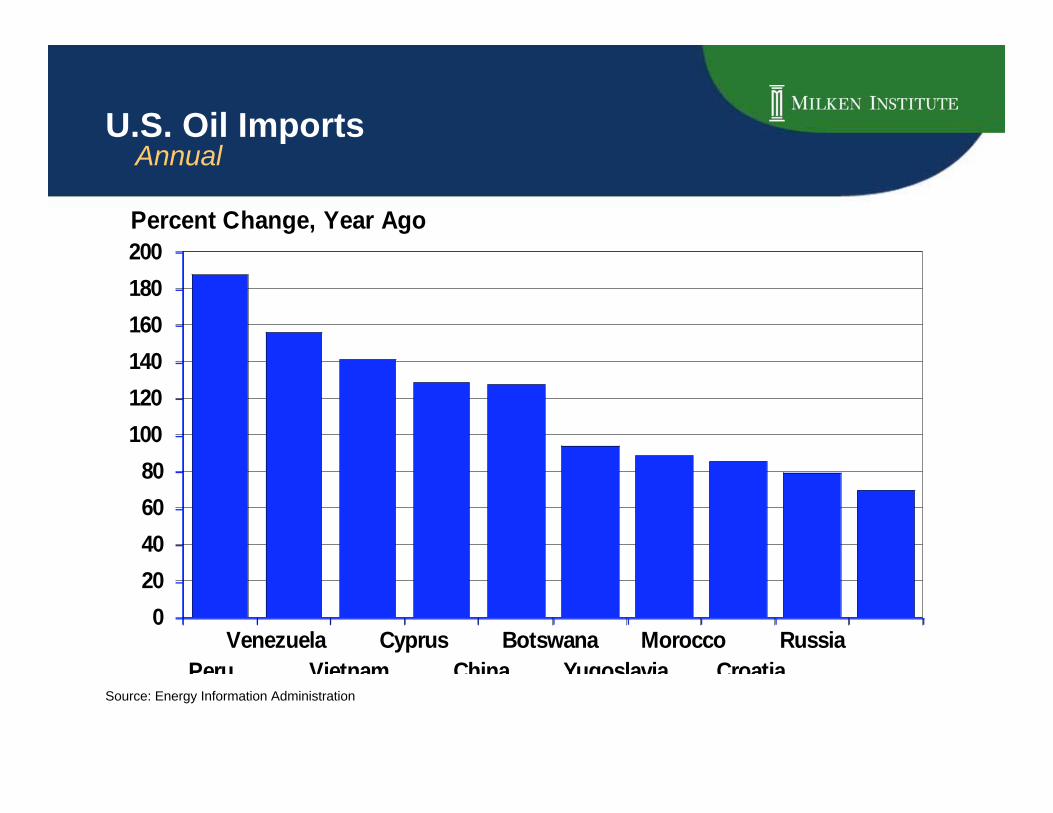
U.S. Oil ImportsAnnual
Source: Energy Information Administration
0
20
40
60
80
100
120
140
160
180
200
Percent Change, Year Ago
Venezuela Cyprus Botswana Morocco Russia
Peru Vietnam China Yugoslavia Croatia

Foreign Holdings of U.S. Securities
S. Korea
2%
Taiwan
2%
Singapore
2%
Russia
1%
HK
1%Australia
1%
Switzerland
3%
Canada
5%
Middle East
3%
Others
11%
U.K.
8%
China
9%
Offshore
Financial
Centers
11%
Japan
15%
Euro Area
26%
$15.5 Trillion, June 2006
Source: U.S. Treasury
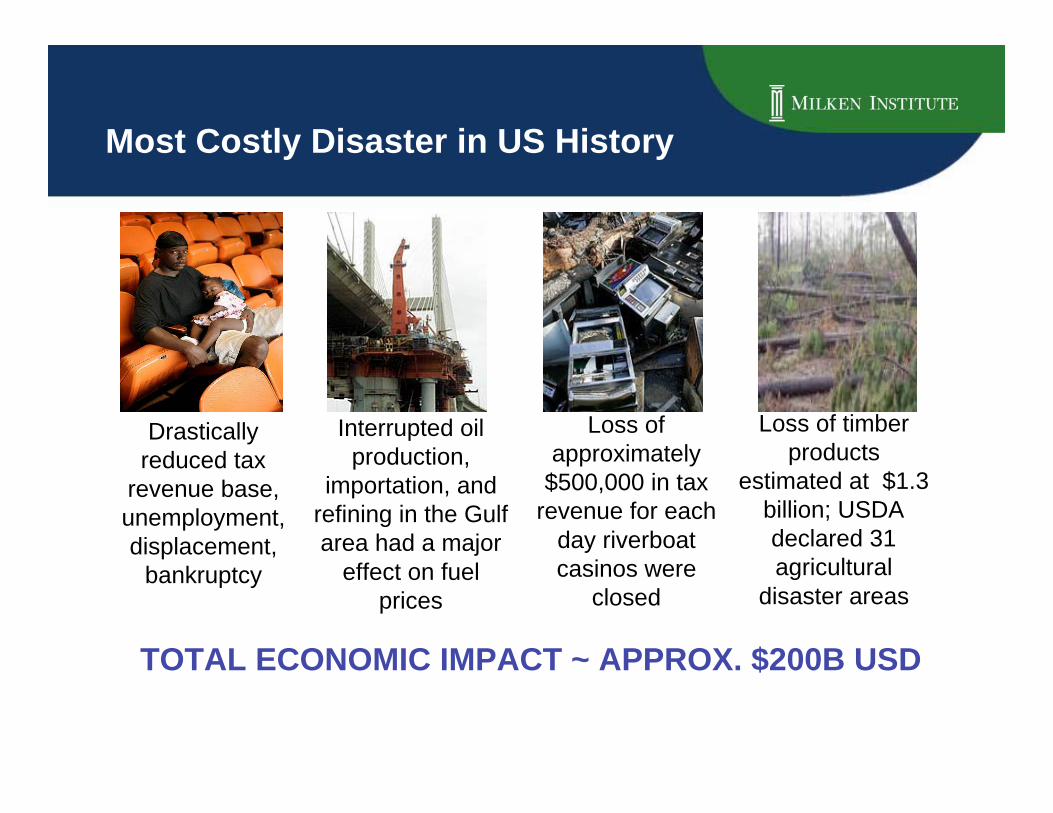
Most Costly Disaster in US History
TOTAL ECONOMIC IMPACT ~ APPROX. $200B USD
Drasticallyreduced tax
revenue base,unemployment,displacement,
bankruptcy
Loss ofapproximately
$500,000 in taxrevenue for each
day riverboatcasinos were
closed
Loss of timberproducts
estimated at $1.3billion; USDAdeclared 31agricultural
disaster areas
Interrupted oilproduction,
importation, andrefining in the Gulfarea had a major
effect on fuelprices
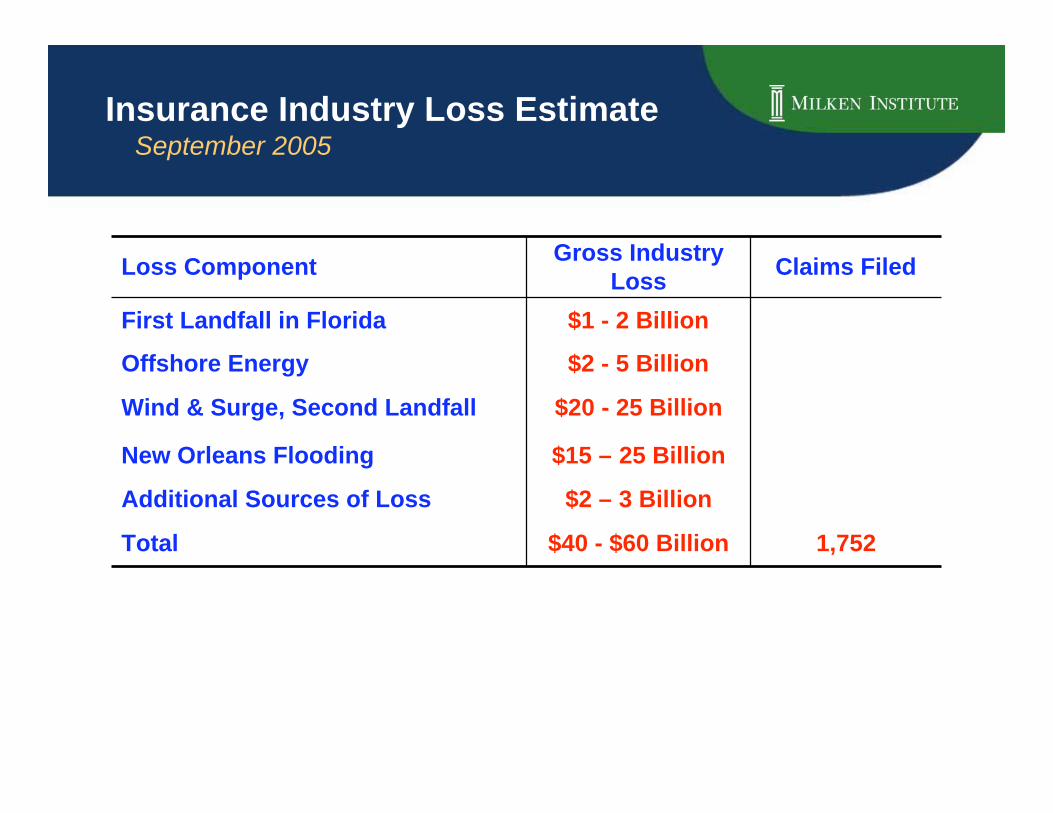
$40 - $60 Billion
$2 – 3 Billion
$15 – 25 Billion
$20 - 25 Billion
$2 - 5 Billion
$1 - 2 Billion
Gross IndustryLoss
1,752
Claims Filed
Additional Sources of Loss
Total
Wind & Surge, Second Landfall
New Orleans Flooding
First Landfall in Florida
Offshore Energy
Loss Component
Insurance Industry Loss Estimate September 2005

104
44
18 16
0
20
40
60
80
100
120
Hurricane Katrina
(2005)
Sept. 11 Attacks
(2001)
Hurricane Andrew
(1992)
Hurricanes
Charley, Frances,
Ivan & Jeanne
(2004)
Billions USD
Within 3 weeks of Katrina’s landfall, thefederal govn’t authorized $75B in aid --more than all the federal aid for 9/11,
2004’s hurricanes and Hurricane Andrewcombined
Government Aid After Disasters 2005 Billion USD
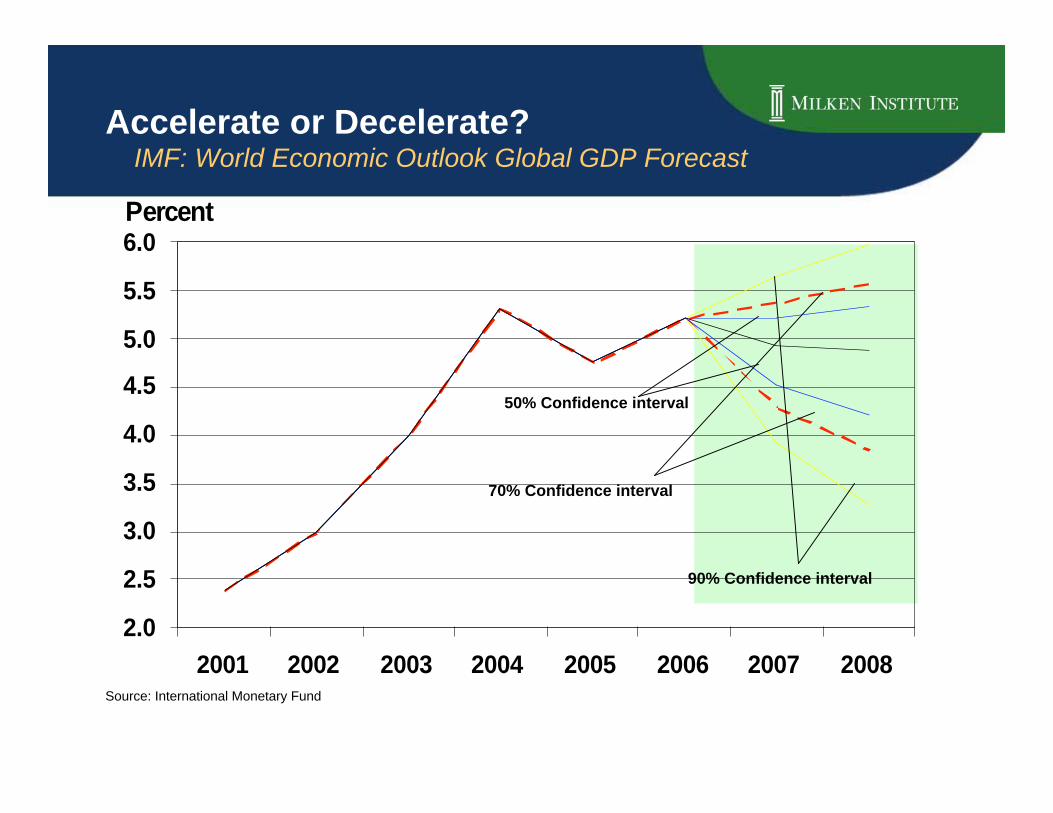
Accelerate or Decelerate? IMF: World Economic Outlook Global GDP Forecast
2.0
2.5
3.0
3.5
4.0
4.5
5.0
5.5
6.0
2001 2002 2003 2004 2005 2006 2007 2008
Percent
Source: International Monetary Fund
90% Confidence interval
50% Confidence interval
70% Confidence interval
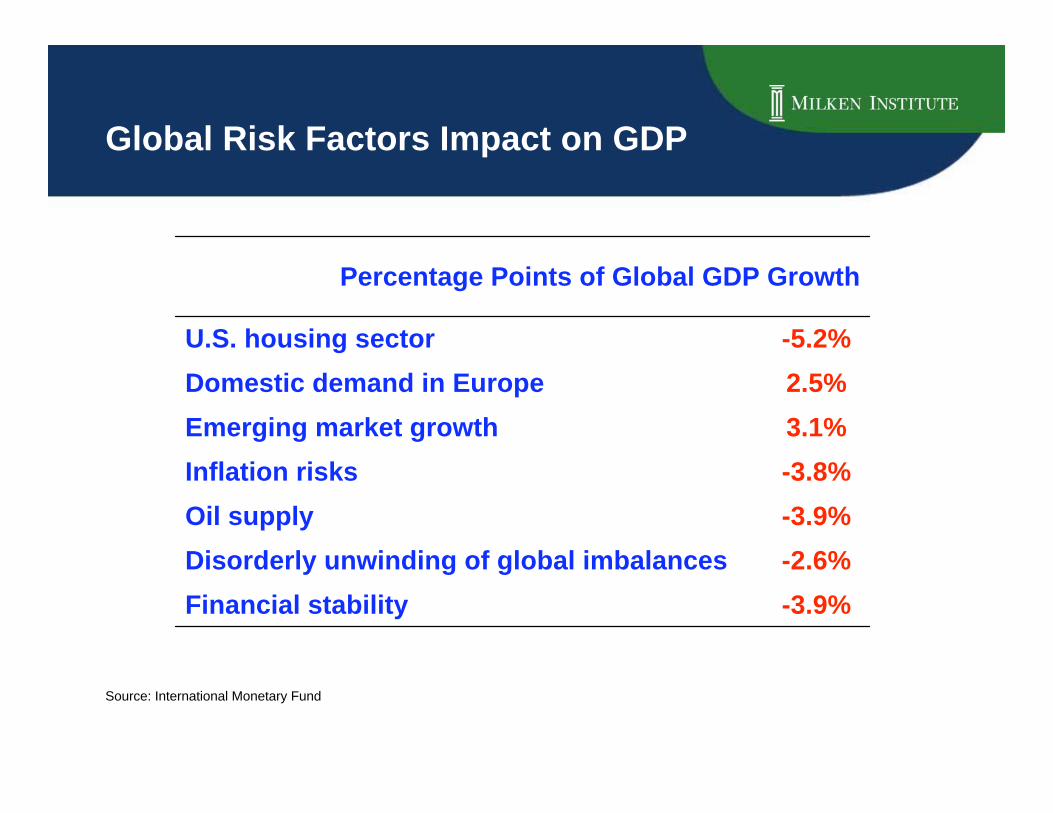
Global Risk Factors Impact on GDP
-3.9%Financial stability
-2.6%Disorderly unwinding of global imbalances
-3.9%Oil supply
-3.8%Inflation risks
3.1%Emerging market growth
2.5%Domestic demand in Europe
-5.2%U.S. housing sector
Percentage Points of Global GDP Growth
Source: International Monetary Fund
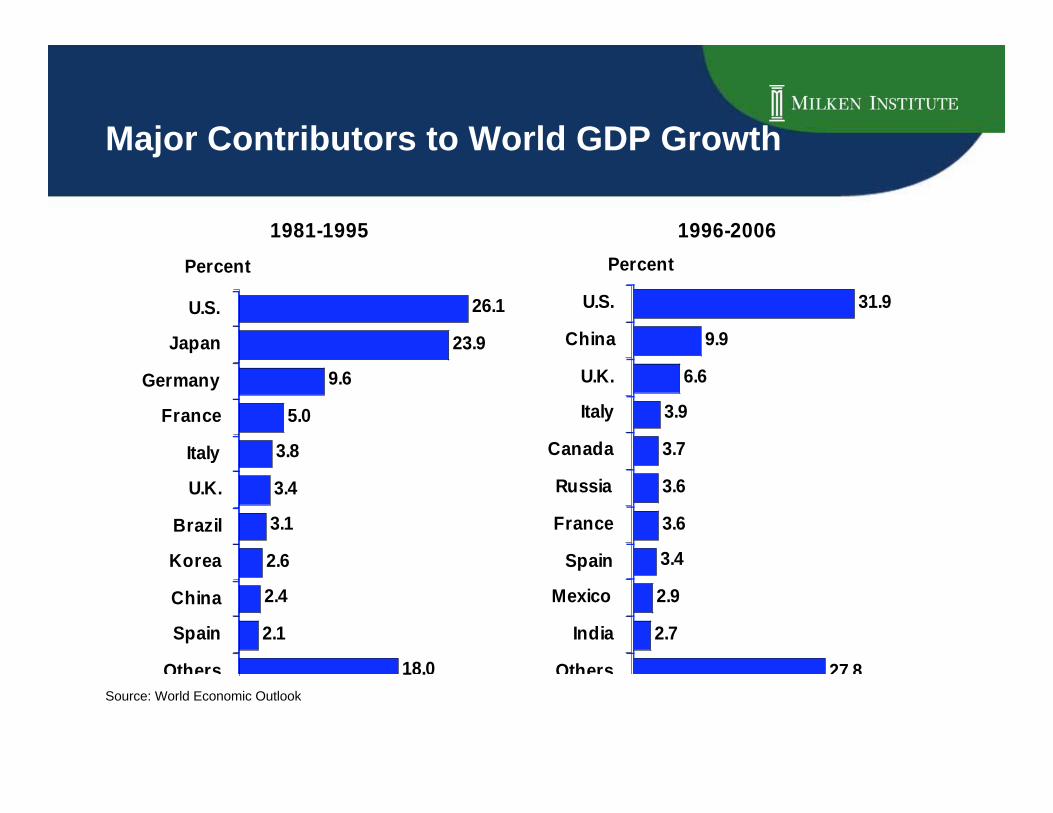
Major Contributors to World GDP Growth
1981-1995
26.1
23.9
9.6
5.0
3.8
3.4
3.1
2.6
2.4
2.1
18.0
U.S.
Japan
Germany
France
Italy
U.K.
Brazil
Korea
China
Spain
Others
Percent
1996-2006
31.9
9.9
6.6
3.9
3.7
3.6
3.6
3.4
2.9
2.7
27.8
U.S.
China
U.K.
Italy
Canada
Russia
France
Spain
Mexico
India
Others
Percent
Source: World Economic Outlook
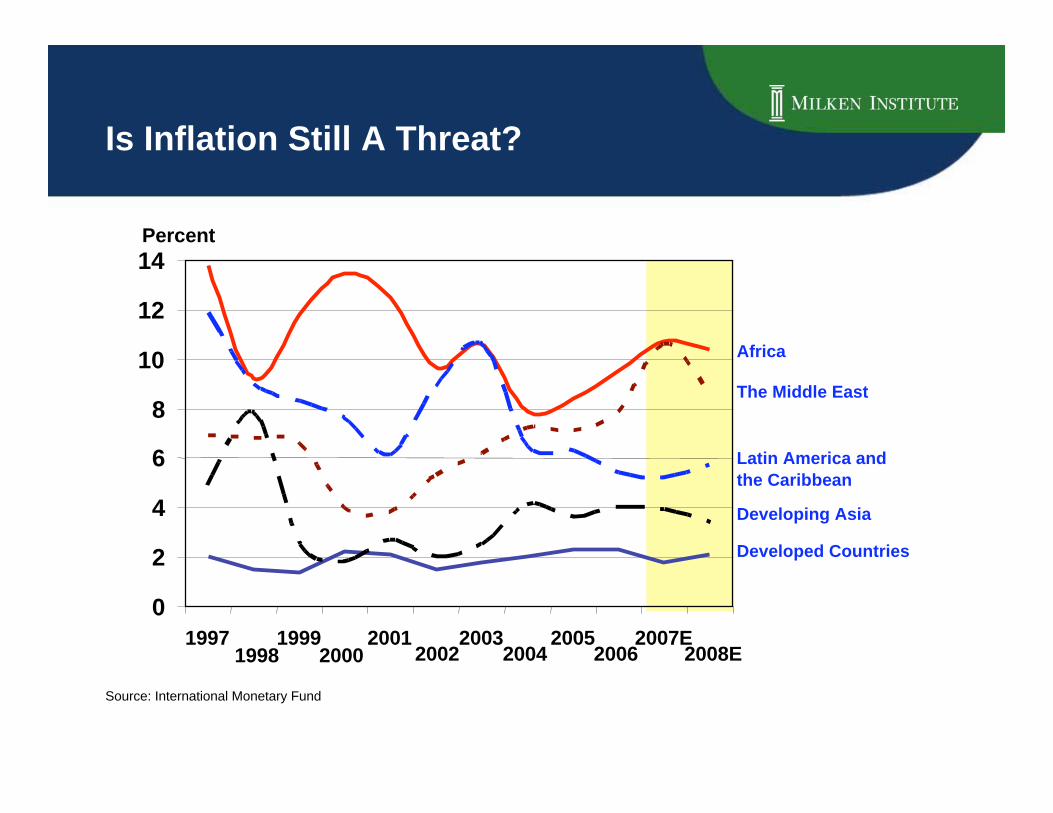
Is Inflation Still A Threat?
0
2
4
6
8
10
12
14
1997 1999 2001 2003 2005 2007E
Developed Countries
Developing Asia
Latin America and
the Caribbean
The Middle East
Africa
Percent
2008E20062004200220001998
Source: International Monetary Fund

GDP Growth: Is Europe Left Behind?
Est. Est.Source: World Economic Outlook
-3
0
3
6
9
12
1997 1998 1999 2000 2001 2002 2003 2004 2005 2006 2007 2008
WorldEuro area
Newly Industrialized AsiaUnited States
Percent

Europe’s Energy Reliance on FormerSoviet Union Countries Percent of Total Oil Imports, 2005
Source: BP
Former Soviet
Union
45%
Middle East
24%
Unidentified*
5%
North America
3%
South & Central
America
2%
Sub-Saharan
Africa
5%
North Africa
15%
Asia
1%
* Includes changes in the quantity of oil in transit,movements not otherwise shown, unidentifiedmilitary use etc.

World’s Equity Market Share December 1950 vs. December 2006
Market Capitalization
1950
Other
6%
Europe
26%
U.S.
59%Japan
9%
Market Capitalization
2006
Other
23%
Europe
26%
U.S.
39%
Japan
9%
Source: World Exchanges Federation

World’s Equity Market Share December 1988 vs. December 2006
Market Capitalization
1988
Other
14%
Europe
26%
U.S.
29%
Japan
Market Capitalization
2006
Other
23%
Europe
26%
U.S.
39%
Japan
9%Source: World Exchanges Federation
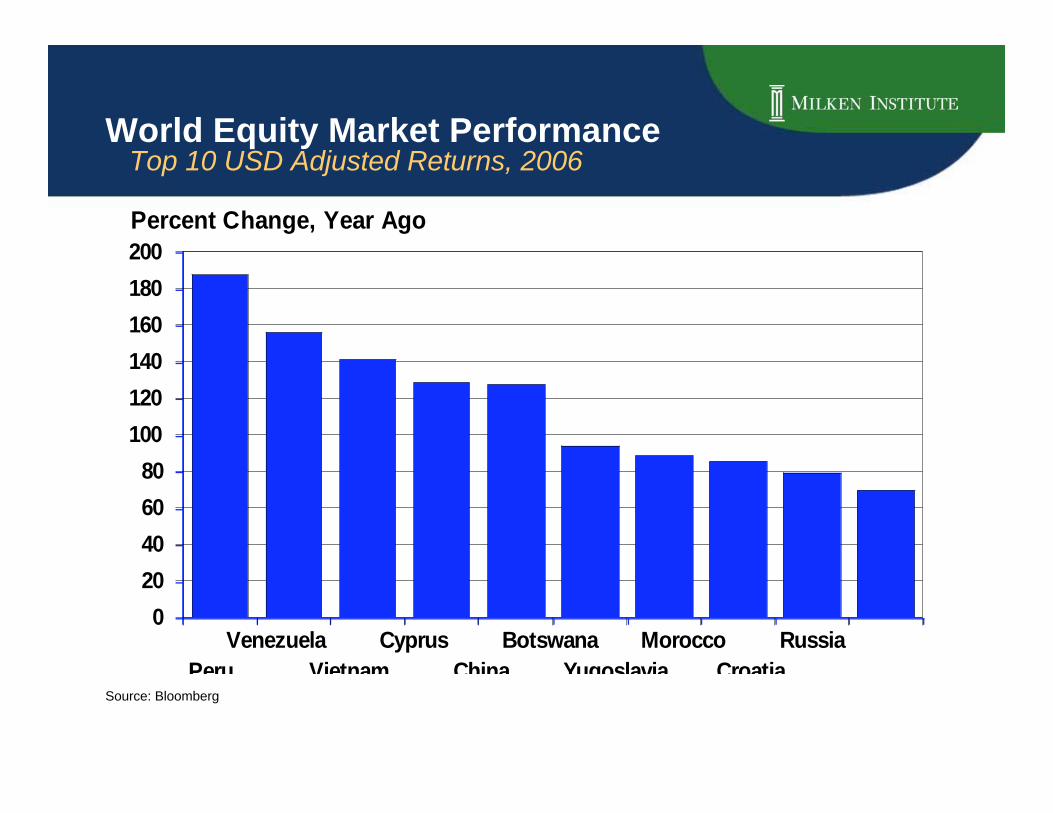
World Equity Market PerformanceTop 10 USD Adjusted Returns, 2006
Source: Bloomberg
0
20
40
60
80
100
120
140
160
180
200
Percent Change, Year Ago
Venezuela Cyprus Botswana Morocco Russia
Peru Vietnam China Yugoslavia Croatia
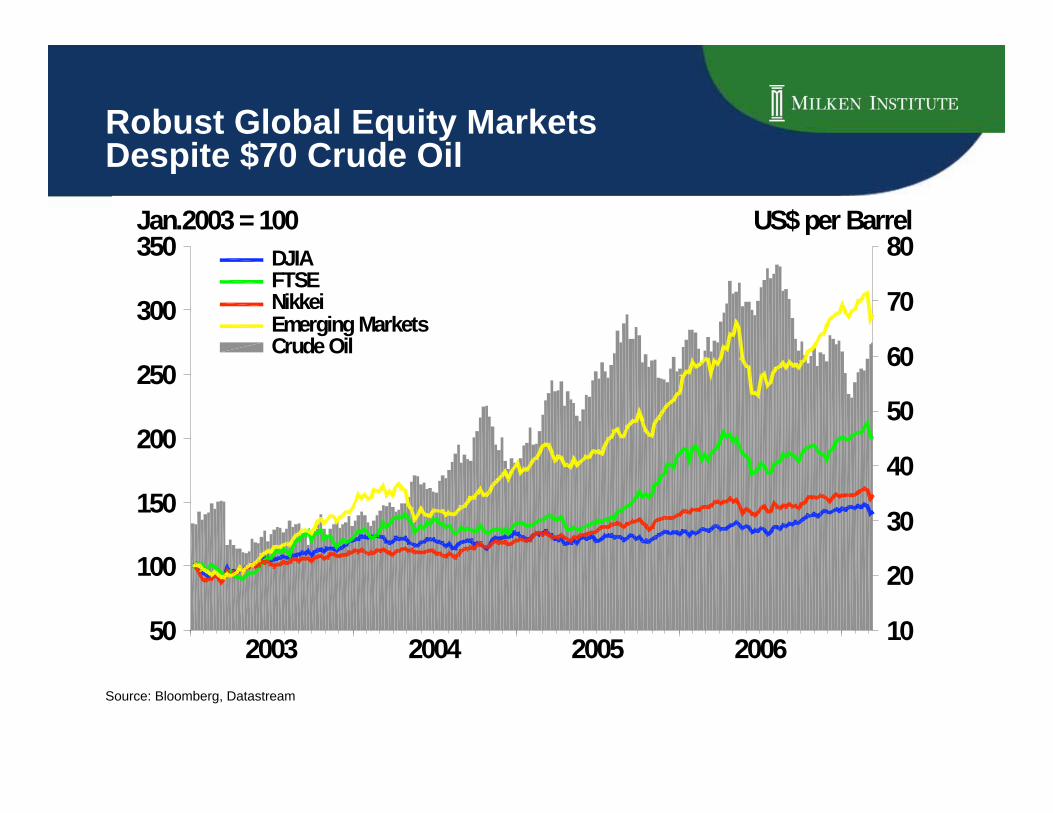
Robust Global Equity MarketsDespite $70 Crude Oil
2006200520042003
350
300
250
200
150
100
50
80
70
60
50
40
30
20
10
Jan.2003 = 100 US$ per Barrel
DJIAFTSENikkeiEmerging MarketsCrude Oil
Source: Bloomberg, Datastream

Countries That Export Capital 2006
China
13.5%
Japan
12.2%
Germany
8.8%
Russia
8.8%Saudi ArabiaNorwaySwitzerland
3 7%
Netherlands
3.7%
Kuwait
3.6%
Singapore
2.8%
Other countries
22.2%
U.A.E.
2.7%
Algeria
2.3%
Venezuela
2.1%
Source: IMF
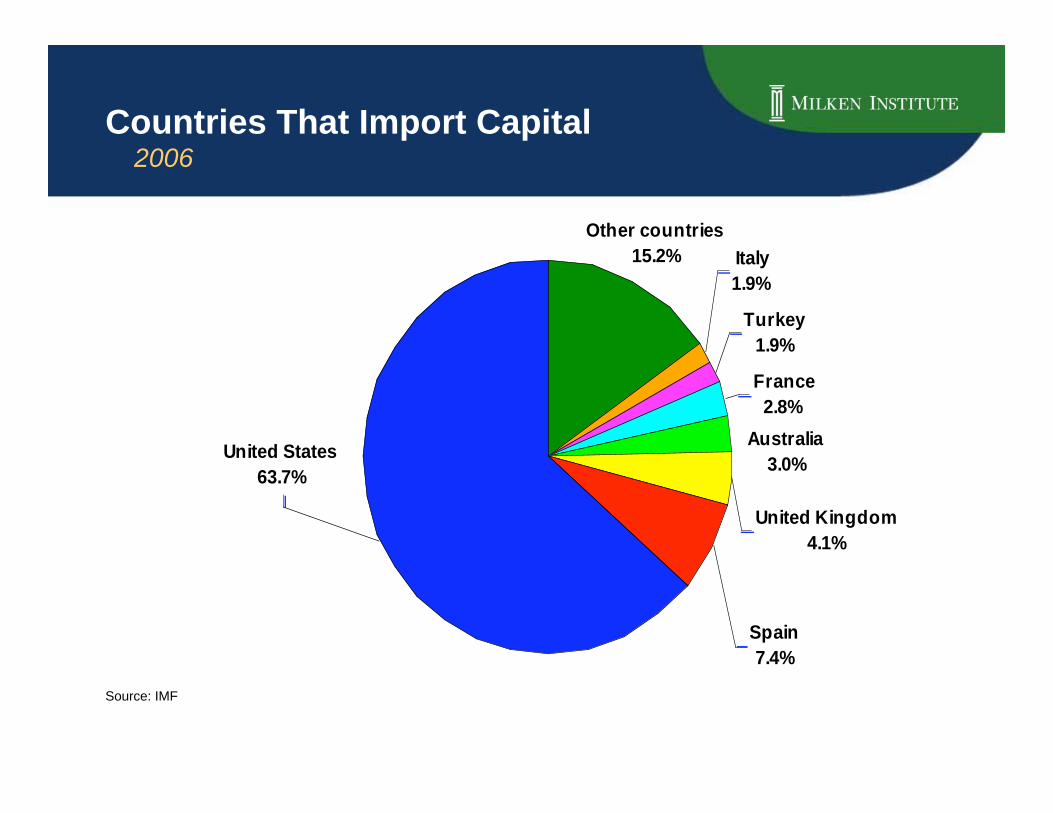
Countries That Import Capital 2006
Italy
1.9%
Turkey
1.9%
France
2.8%
Other countries
15.2%
Australia
3.0%United States
63.7%
Spain
7.4%
United Kingdom
4.1%
Source: IMF

Net Direct InvestmentDeveloping Countries, 1997-2006
Source: World Economic Outlook
0
20
40
60
80
100
120
1997 1998 1999 2000 2001 2002 2003 2004 2005 2006
Africa Developing AsiaMiddle East Western Hemisphere
US$ Billions
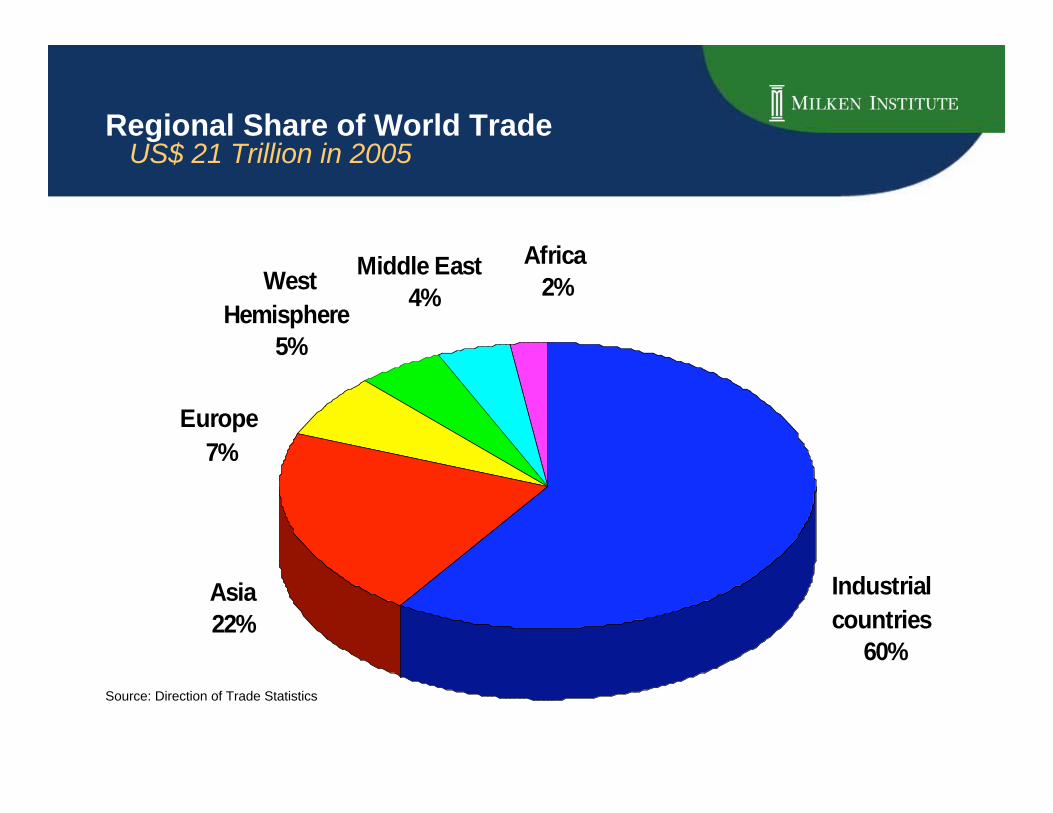
Regional Share of World TradeUS$ 21 Trillion in 2005
Asia
22%
West
Hemisphere
5%
Industrial
countries
60%
Middle East
4%
Africa
2%
Europe
7%
Source: Direction of Trade Statistics
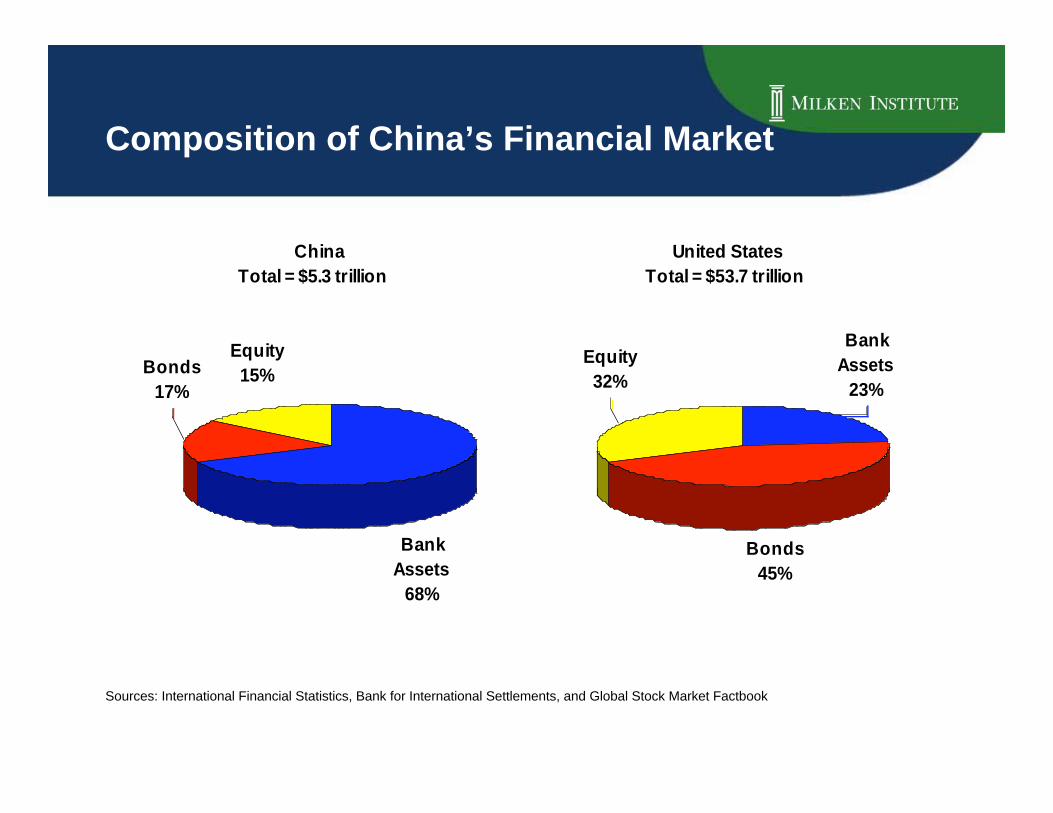
Composition of China’s Financial Market
China
Total = $5.3 trillion
Bank
Assets
68%
Bonds
17%
Equity
15%
United States
Total = $53.7 trillion
Equity
32%
Bonds
45%
Bank
Assets
23%
Sources: International Financial Statistics, Bank for International Settlements, and Global Stock Market Factbook

Fixed Investments ContributeMore than 40% to China’s GDP Growth
Sources: International Financial Statistics and Bureau of Statistics (China)
0
5
10
15
20
25
30
35
40
45
50
1980
1982
1984
1986
1988
1990
1992
1994
1996
1998
2000
2002
2004
2006
Percent of GDP Growth
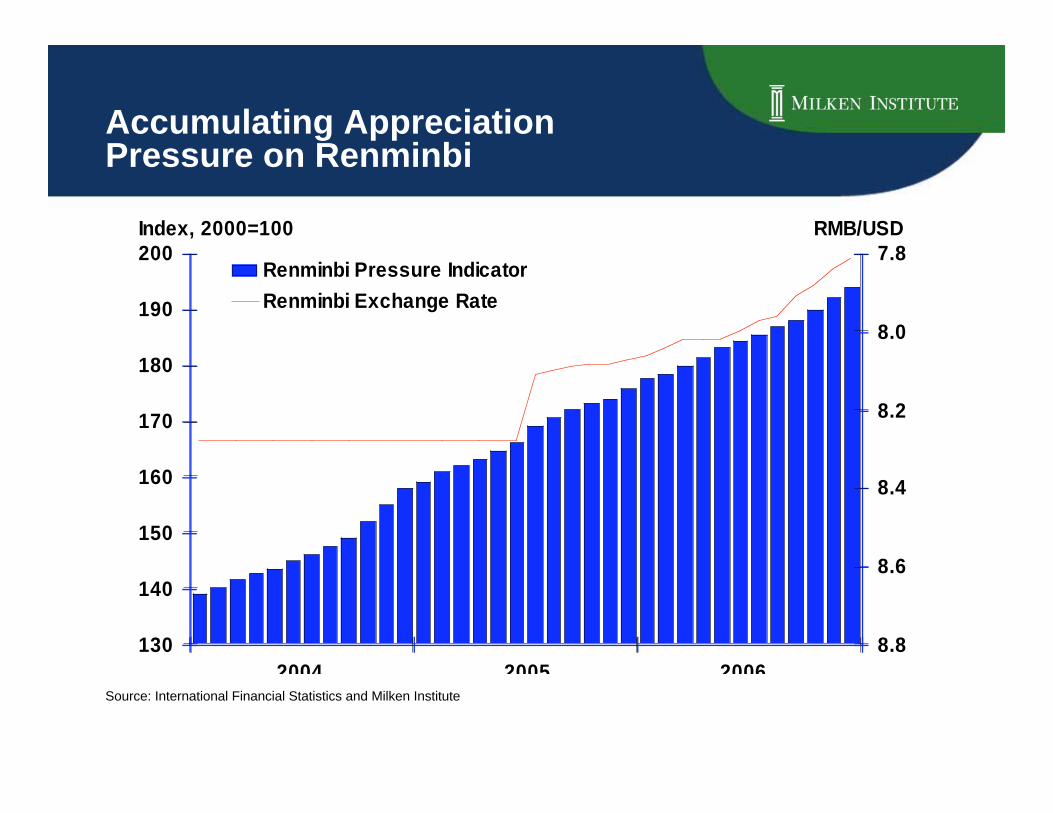
Accumulating AppreciationPressure on Renminbi
130
140
150
160
170
180
190
200 7.8
8.0
8.2
8.4
8.6
8.8
Renminbi Pressure Indicator
Renminbi Exchange Rate
2004 2005 2006
Index, 2000=100 RMB/USD
Source: International Financial Statistics and Milken Institute

100 Most Underfunded S&P 500Defined-Benefit Plans
$26
-$141
-$114
-$137 -$138
-$94
-160
-140
-120
-100
-80
-60
-40
-20
0
20
40
2001 2002 2003 2004 2005 2006
US$ Billions
Source: Bloomberg

2054204620382030202220142006
4000
3000
2000
1000
0
-1000
-2000
Percent
Payments from G-10 Government Bonds OutstandingProjected Payments Out of G-10 Pension Fund LiabilitiesCash Flows
Cash Flows from G-10 GovernmentBonds and Projected Pension Payments
Assumption: 75 percent oftotal pension fund assetsare allocated to bonds
Source: OECD, Global Pension Statistics, Insurance Statistics and other administrative sources.
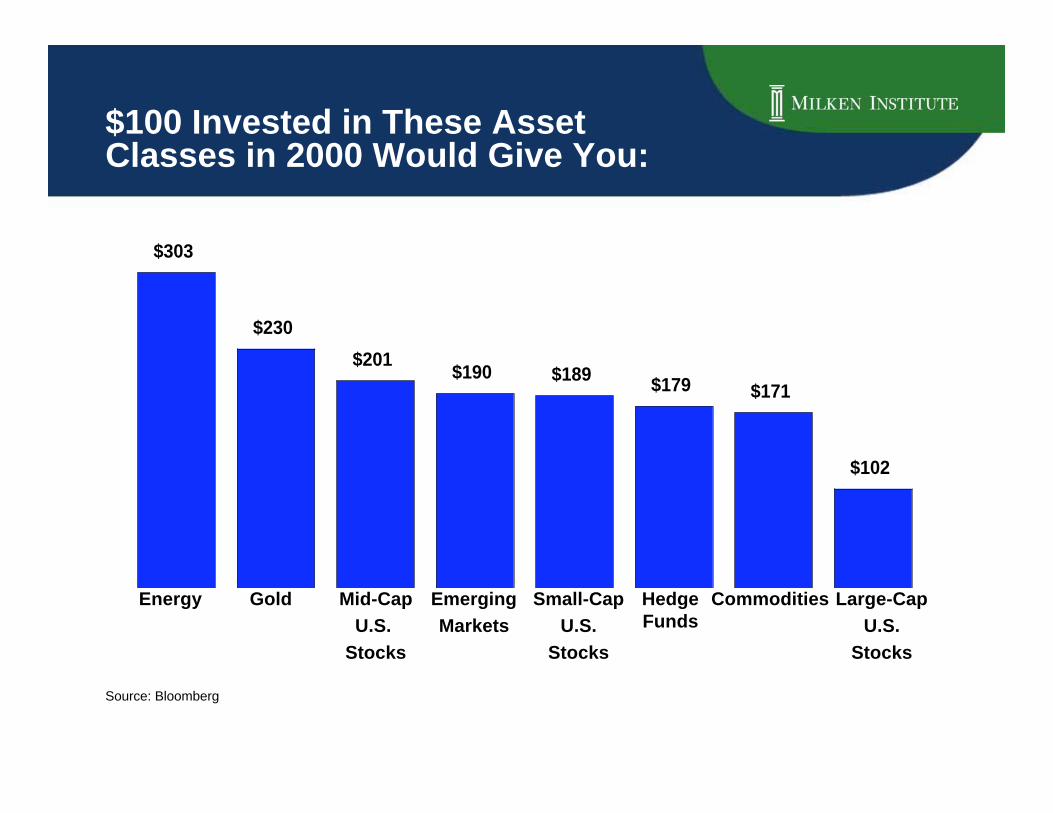
$100 Invested in These AssetClasses in 2000 Would Give You:
Large-Cap
U.S.
Stocks
CommoditiesHedgeFunds
Small-Cap
U.S.
Stocks
Emerging
Markets
Mid-Cap
U.S.
Stocks
GoldEnergy
$303
$230
$201$190 $189
$179 $171
$102
Source: Bloomberg

The Dow dropped 241points in 3 minutes
Source: Bloomberg
U.S. Stock Market Plummeted onFebruary 27, 2007:A Market Correction “Made in China”
12,050
12,100
12,150
12,200
12,250
12,300
12,350
12,400
12,450
11:00 11:15 11:30 11:45 12:00 12:15 12:30 12:45 13:00
Dow Jones Index

Higher Degree of IntegrationBetween NYSE and Shanghai Stock Exchange
Correlation = 0.8773
January 2006 – March 2007
Source: Bloomberg
Dow Jones
Industrial
Average (L)
Shanghai
Stock
Exchange
Composite ®
90
95
100
105
110
115
120
0
50
100
150
200
250
300
2006Q1 2006Q2 2006Q3 2006Q4 2007Q1
Index, Jan. 2006 = 100
(R)
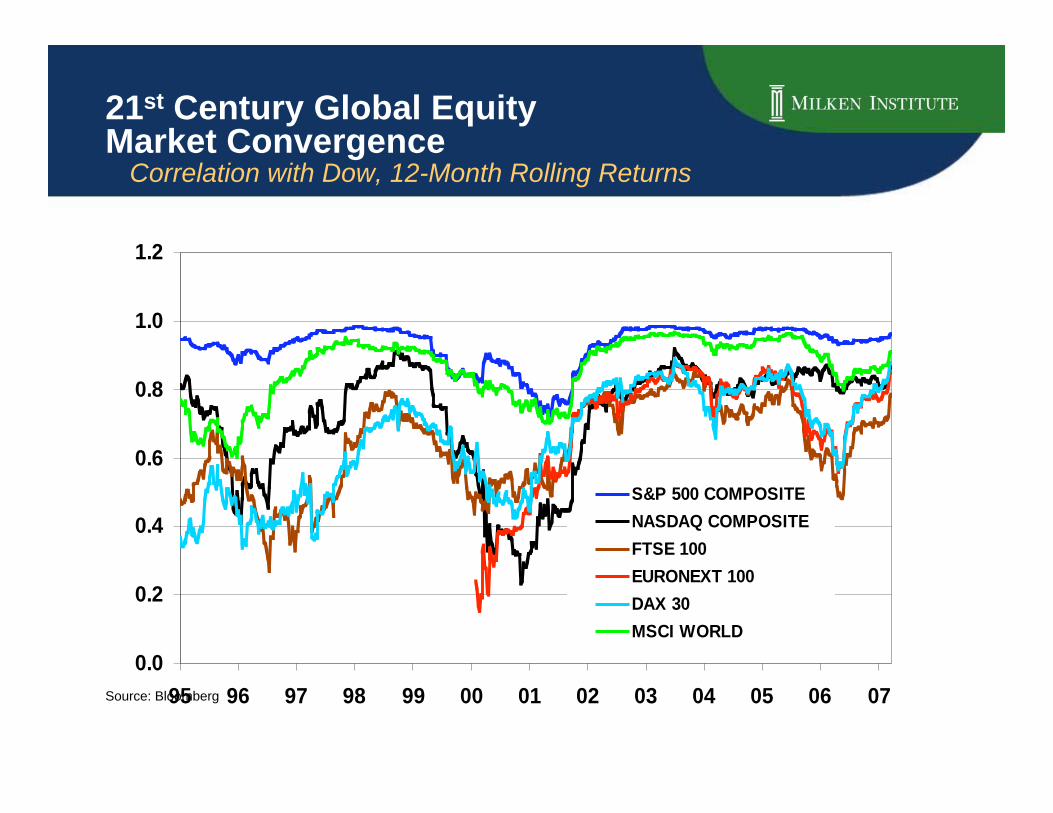
21st Century Global EquityMarket Convergence Correlation with Dow, 12-Month Rolling Returns
0.0
0.2
0.4
0.6
0.8
1.0
1.2
95 96 97 98 99 00 01 02 03 04 05 06 07
S&P 500 COMPOSITE
NASDAQ COMPOSITE
FTSE 100
EURONEXT 100
DAX 30
MSCI WORLD
Source: Bloomberg

20062005200420032002200120001999
16
14
12
10
8
6
4
2
Percent
Converging Yield to Maturity
Source: Merrill Lynch
Emerging Markets Sovereign Plus Index
U.S. Government Index
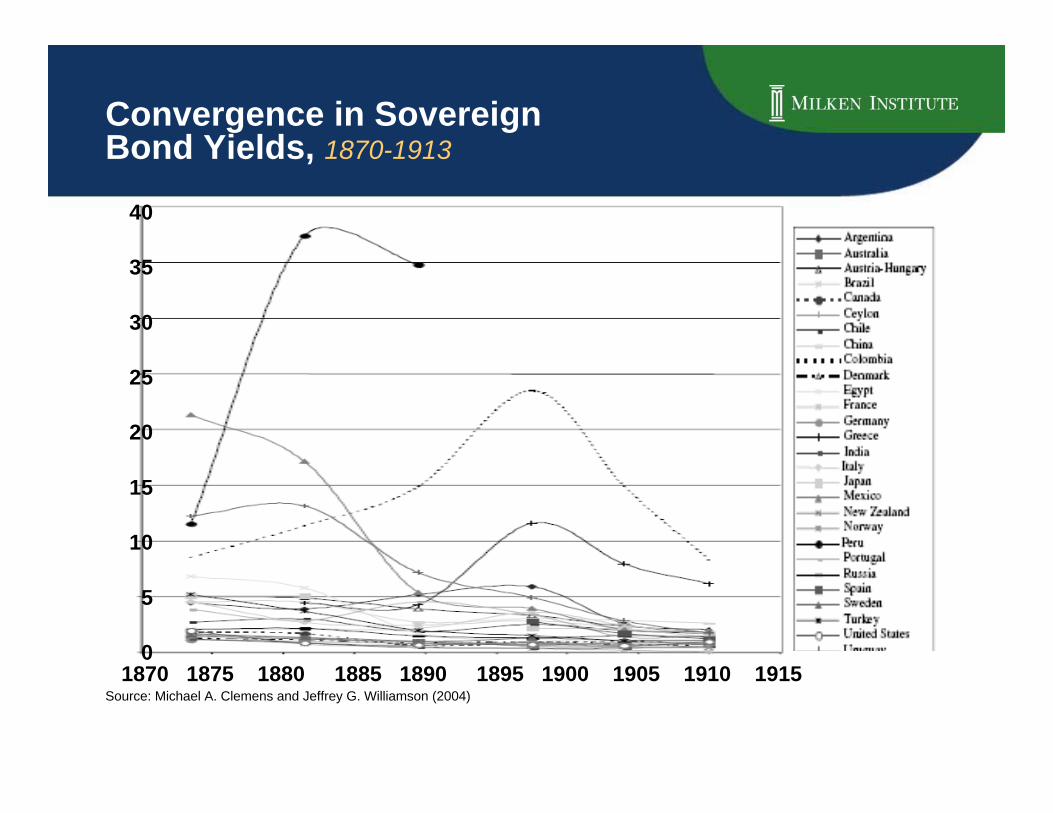
Convergence in SovereignBond Yields, 1870-1913
40
35
30
25
20
15
10
5
01870 1875 1880 1885 1890 1895 1900 1905 1910 1915
Source: Michael A. Clemens and Jeffrey G. Williamson (2004)

Narrowing Spread Between Hedge FundReturn and One-Year Treasury Yield
0
2
4
6
8
10
12
14
16
1981 1986 1991 1996 2001 2006
Percent
Spread between averagehedge funds return and1-year Treasury yield
Sources: Hedgefund.net, Bloomberg and MI staff
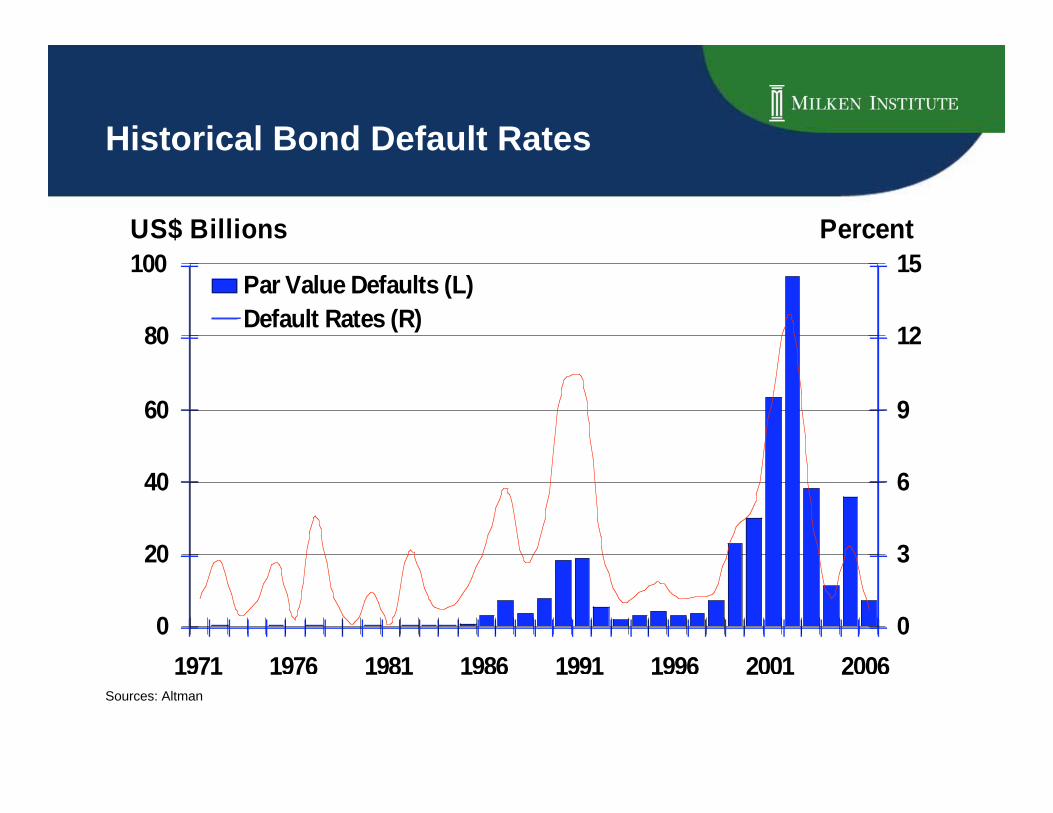
Historical Bond Default Rates
0
20
40
60
80
100
1971 1976 1981 1986 1991 1996 2001 2006
0
3
6
9
12
15Par Value Defaults (L)
Default Rates (R)
US$ Billions Percent
Sources: Altman
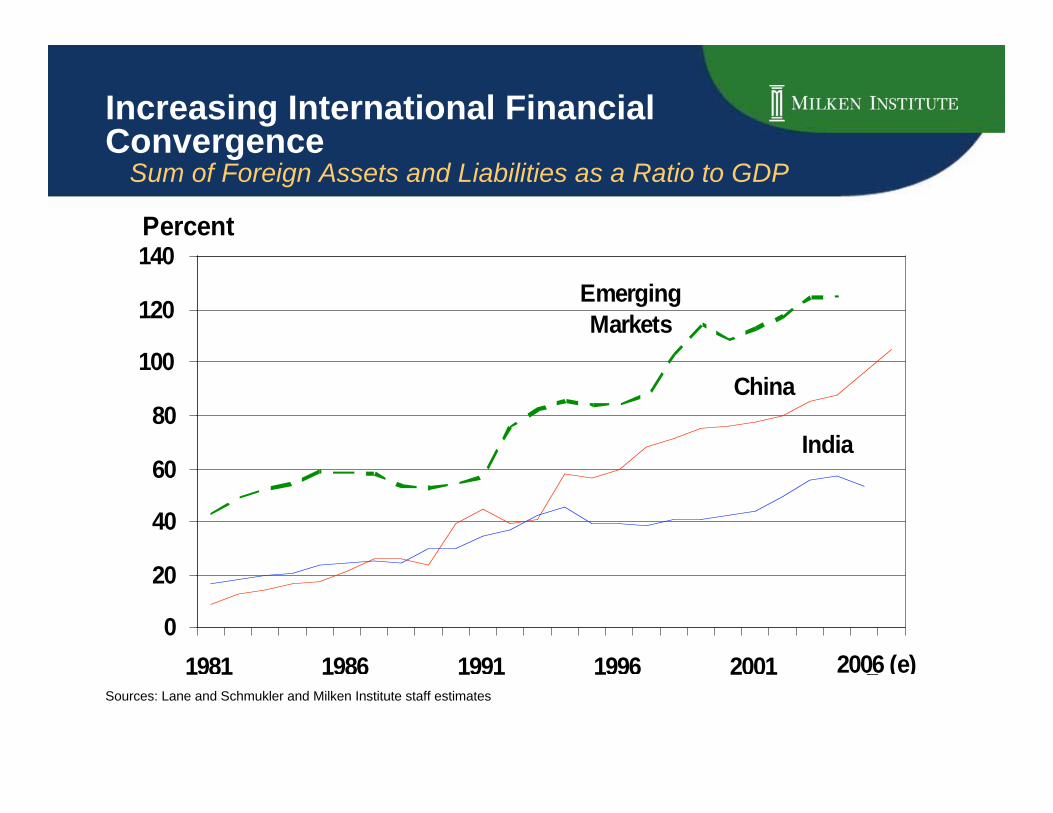
Increasing International FinancialConvergence Sum of Foreign Assets and Liabilities as a Ratio to GDP
Sources: Lane and Schmukler and Milken Institute staff estimates
China
India
Emerging
Markets
0
20
40
60
80
100
120
140
1981 1986 1991 1996 2001 2006
Percent
2006 (e)
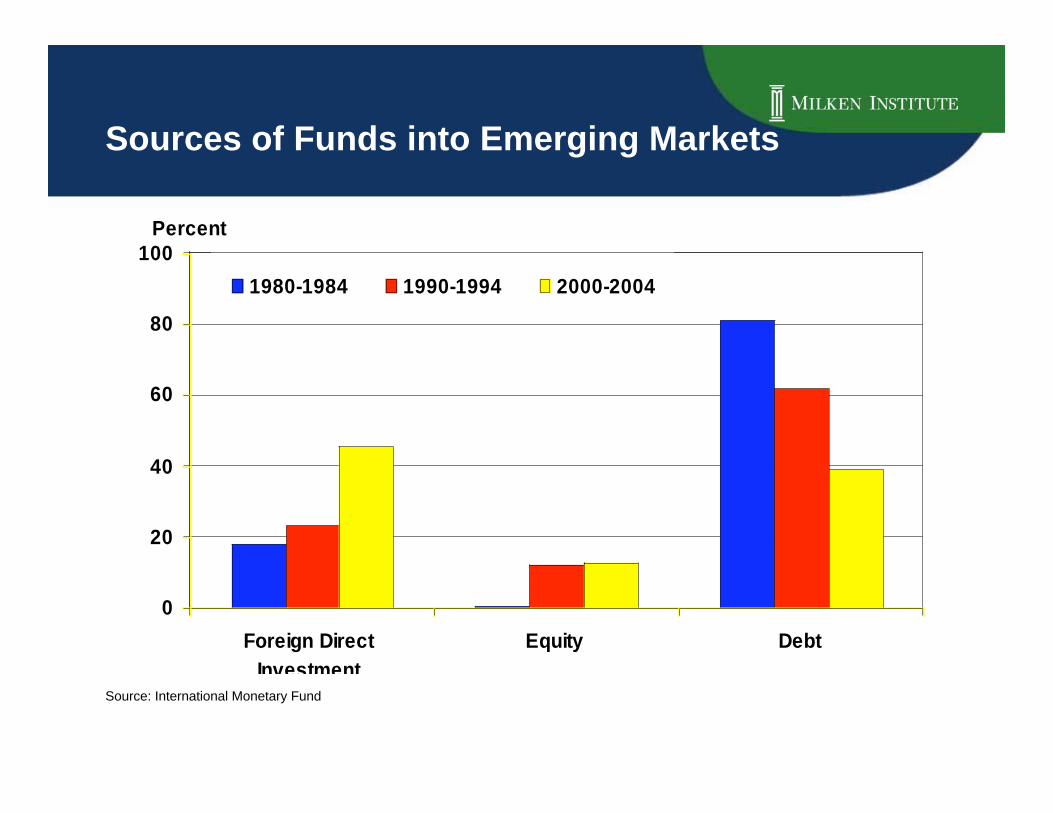
Sources of Funds into Emerging Markets
Source: International Monetary Fund
0
20
40
60
80
100
Foreign Direct
Investment
Equity Debt
1980-1984 1990-1994 2000-2004
Percent

Global Futures Market Notional Amounts
Source: Bank for International Settlements
Currency (R)
Equity index
(R)
Interest rate
(L)
0.0
0.3
0.5
0.8
1.0
1.3
1.5
0
5
10
15
20
25
30US$ Trillions
94 95 96 97 98 99 00 01 02 03 04 05 06
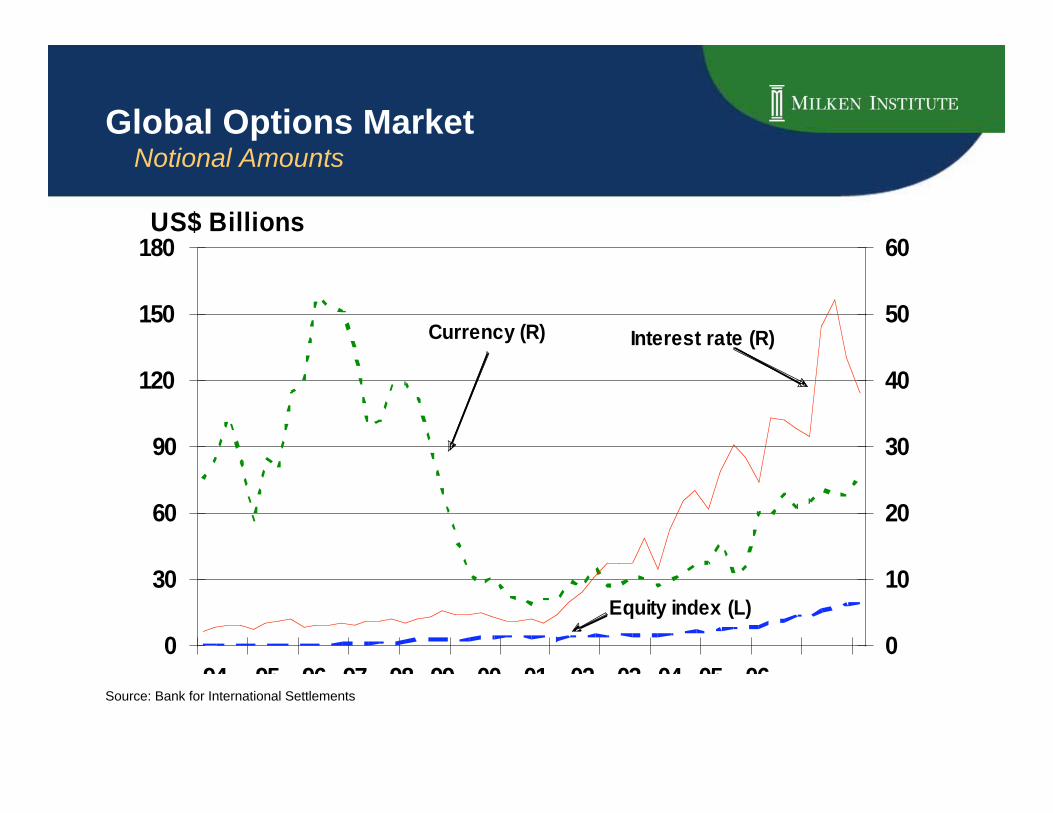
Global Options Market Notional Amounts
Source: Bank for International Settlements
Currency (R) Interest rate (R)
Equity index (L)
0
30
60
90
120
150
180
0
10
20
30
40
50
60US$ Billions
94 95 96 97 98 99 00 01 02 03 04 05 06

Global Credit Derivatives Market
0.2 0.3 0.4 0.6 0.9 1.2 2.03.5
5.0
20.2
33.1
0
5
10
15
20
25
30
35
1996 1997 1998 1999 2000 2001 2002 2003 2004 2006 2008
(est.)
US$ Trillions
Source: British Bankers’ Association

Global Derivative Markets:Rating of Underlying Assets
0%
10%
20%
30%
40%
50%
60%
70%
80%
90%
100%
99-00 01-02 03-04 05-06 07-08 (Est.)
Below B BB B A BBB AAA AASource: British Bankers’ Association

Banking Crises Since Late 1970s 168 Crises in 138 Countries
117 Systemic in 93 Countries
51 Nonsystemic in 45 Countries
Information not AvailableSource:Caprio, Gerard and Daniela Klingebiel (2003)

Argentina (1980-1982)Indonesia (1997-ongoing)
Chile (1981-1983)Thailand (1997-ongoing)
Uruguay (1981-1984)South Korea (1997-ongoing)
Côte d'Ivoire (1988-1991)Venezuela (1994-1997)
Japan (1992-ongoing)Mexico (1994-ongoing)
Malaysia (1997-ongoing)Slovenia (1992-1994)
Brazil (1994-1996)Philippines (1983-1987)Bulgaria (1996-1997)Ecuador (1996-ongoing)
Czech Republic (1991-present)Finland (1991-1994)
Hungary (1991-1995)Senegal (1988-1991)
Norway (1987-1993)Spain (1977-1985)
Paraguay (1995-ongoing)Colombia (1982-1987)Sri Lanka (1989-1993)
Malaysia (1985-1988)Sweden (1991-1994)Indonesia (1992-1994)
Poland (1992-1995)United States (1984-1991)Ghana (1982-1989)
Turkey (1982-1985)Thailand (1983-1987)Australia (1989-1992)
Turkey (1994)New Zealand (1987-1990)
France (1994-1995)Argentina (1995)Egypt (1991-1995)Philippines (1998-ongoing)
0 10 20 30 40 50 60
Percent of GDP
Indonesia50%
Thailand33%
S. Korea27%
UnitedStates
3%
Cost of Resolving Bank Problems

Share of World Oil Production 2005
Total: 81.1 million Barrels per Day
Rest of World
31%
Nigeria
3%
U.A.E.
3%
Kuwait
3%
Norway
4%Venezuela
4%
Saudi Arabia
14%
Iran
5%
Russia
12%
United States
8%
Mexico
5%
Canada
4%China
4%Source: BP

Share of World Oil Consumption 2005
Total: 82.5 million Barrels per Day
Rest of World
45%
Canada
3%
United States
25%
Russia
3%
China
8%
Japan
7%
Germany
3%
South Korea
3%
India
3%Source: BP

Oil Reserves Concentrated inUnstable Regions
Sources: Energy Information Administration
Middle East
60%
Africa
10%
Venezuela
6%
Russia
5%
Other
3%
Canada
14%
United States
2%

Global Demand for Oil ExceedsRefinery Capacity
Source: EIA
50
60
70
80
90
1980 1985 1990 1995 2000 2005
Oil Demand
Refinery Capacity
Thousand Barrels per Day

Rising Global Prices of Oil, Gold and Food
Source: Bloomberg, Datastream
Crude Oil
Food
Gold
50
100
150
200
250
300
350
400
January 2002 = 100
2002 2003 2004 2005 2006

World Gas Prices November 2006
Source:GTZ
0
1
2
3
4
5
6
7
Venezuela Libya Nigeria China S Africa Japan France Italy
$ Per Gallon
Iran S. Arabia U.S. Mexico India Brazil Germany U.K.
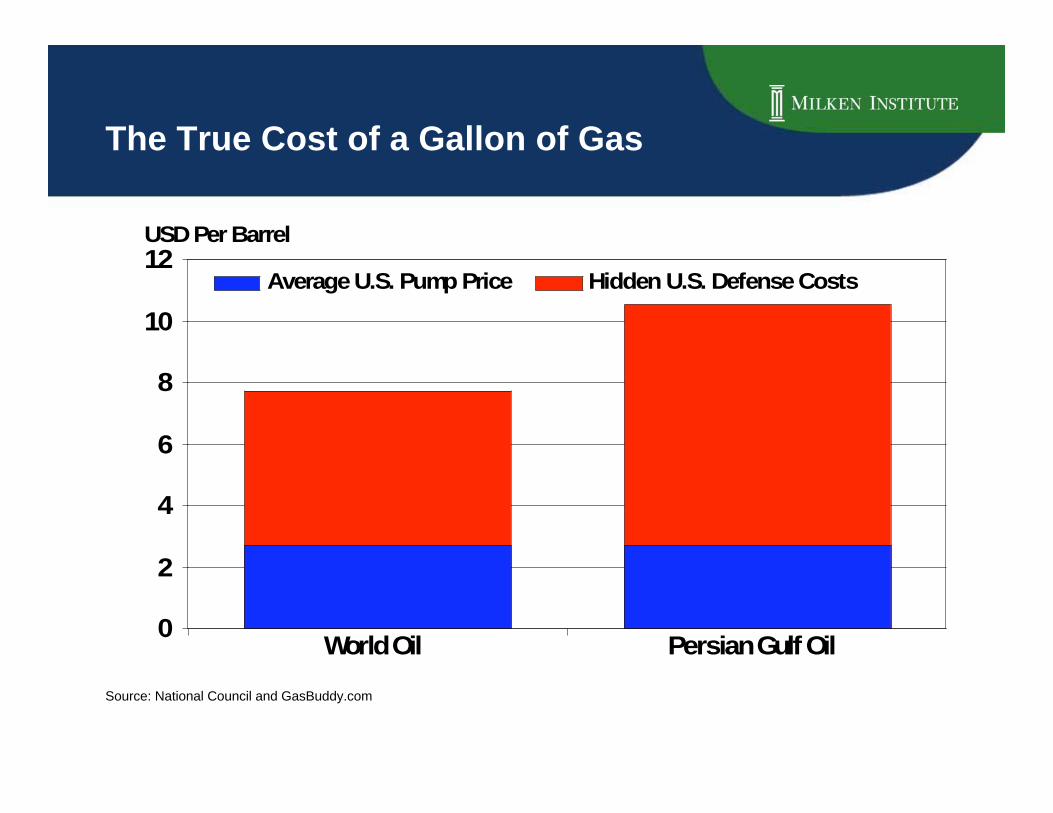
The True Cost of a Gallon of Gas
Persian Gulf OilWorld Oil
12
10
8
6
4
2
0
USD Per Barrel
Average U.S. Pump Price Hidden U.S. Defense Costs
Source: National Council and GasBuddy.com

Energy Prices and TaxesUS Dollars Per Gallon, 2006
0 1 2 3 4 5 6 7
TurkeyNorway
United KingdomGermany
ItalyFranceKorea
PolandJapan
FinlandLithuaniaAustralia
IndiaEcuador
BrazilCanada
South AfricaUnited States
GhanaJamaicaMexico
ArgentinaGuatemala
ChinaRussia
Saudi ArabiaIndonesia
Venezeula
Price Before Tax
Tax
Source: World Economic Outlook, 2006

China and India’s Energy Efficiency Energy Consumed per $ 1,000 GDP
Sources: BP, World Economic Outlook
0.0
0.4
0.8
1.2
1.6
2.0
1980 1985 1990 1995 2000 2005
China
India
United States
Tonnes Oil Equivalent Per US$ 1,000 GDP

Volatile Oil and Natural Gas Prices
Sources: Energy Information Administration
0500959085
$80
$70
$60
$50
$40
$30
$20
$10
$12
$10
$8
$6
$4
$2
$0
US dollars per barrel US dollars per Thousand Cubic
WTI Crude Oil PriceNatural Gas Price
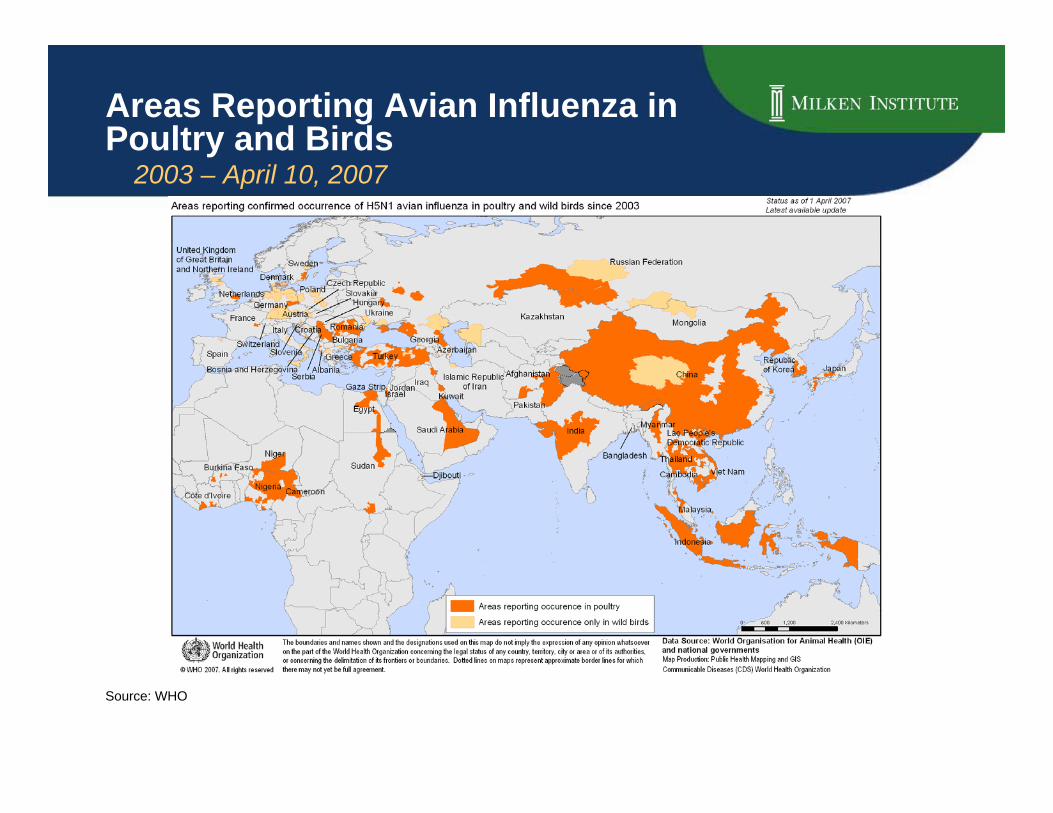
Areas Reporting Avian Influenza inPoultry and Birds 2003 – April 10, 2007
Source: WHO

Malaria Distribution Where Malaria is Endemic
Source: Malaria-vaccines.org

Tuberculosis Distribution 100 or More Cases Per 100,000 People
Source: University of South Carolina
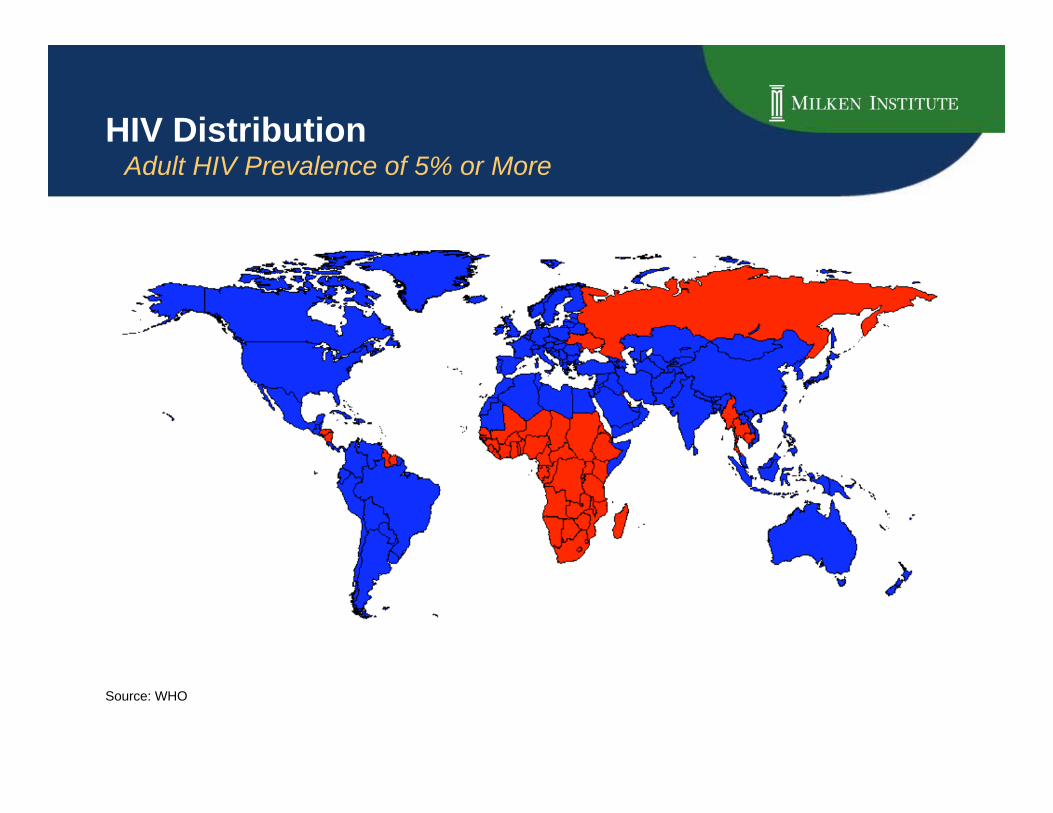
HIV Distribution Adult HIV Prevalence of 5% or More
Source: WHO

Hepatitis B Distribution Prevalence of 7% or More
Source: CIA

Water ShortagesHigh Vulnerability to Water Scarcity
Source: World Resources Institute

World Hunger 20% or More Undernourished
Source: World Resources Institute
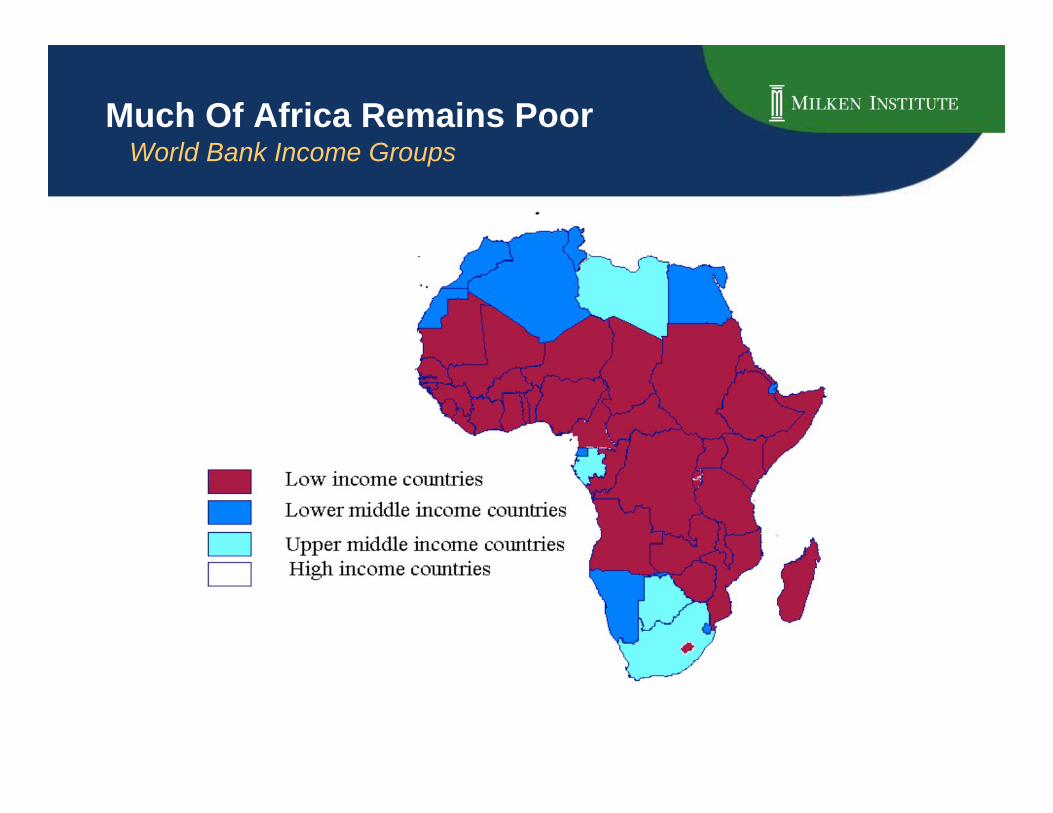
Much Of Africa Remains PoorWorld Bank Income Groups
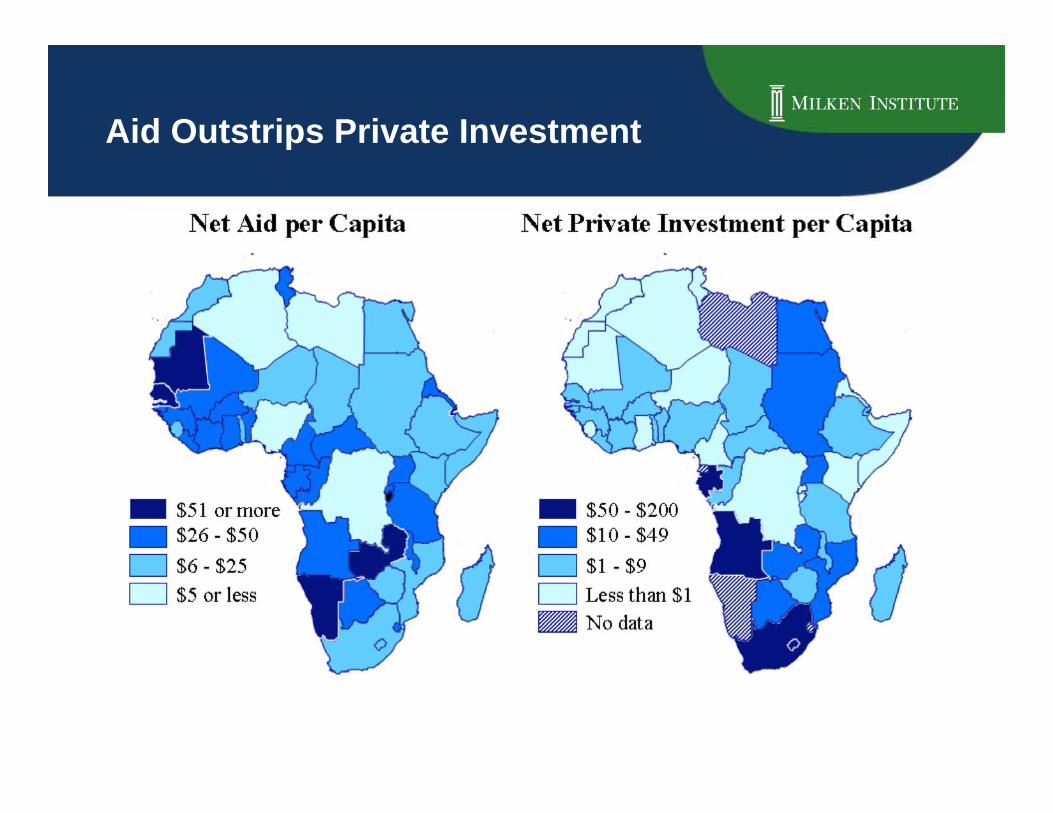
Aid Outstrips Private Investment
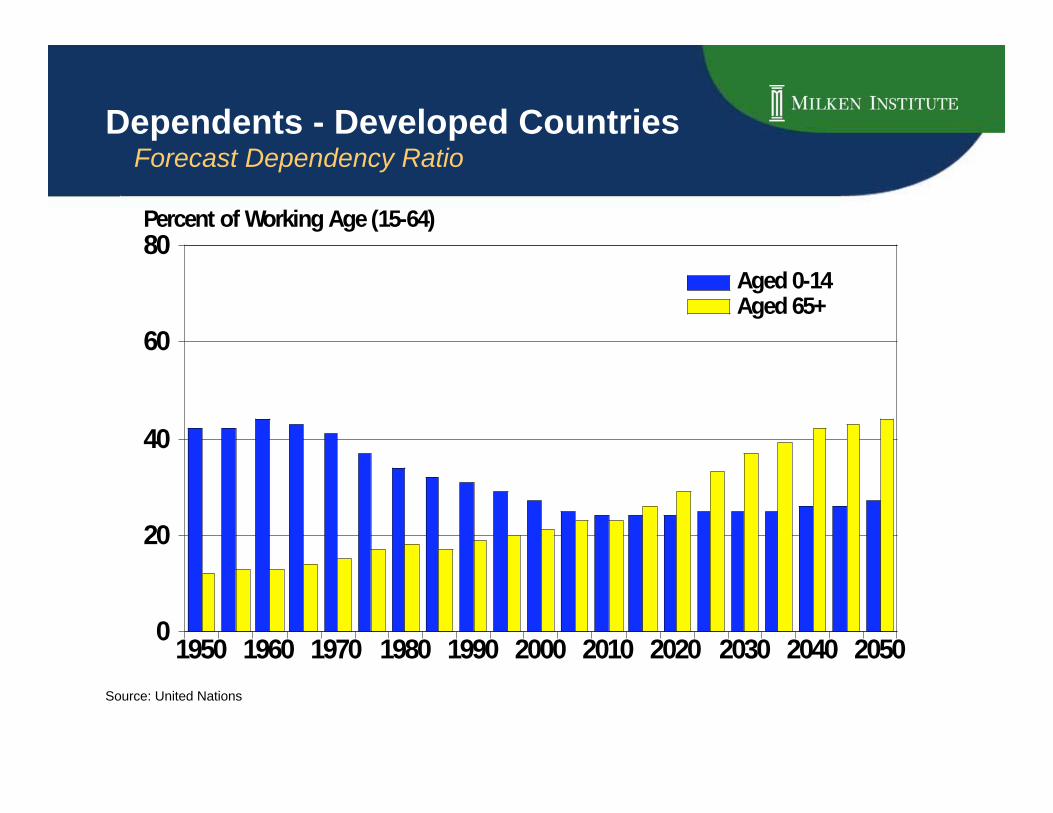
Dependents - Developed Countries Forecast Dependency Ratio
20502040203020202010200019901980197019601950
80
60
40
20
0
Percent of Working Age (15-64)
Aged 0-14Aged 65+
Source: United Nations

20502040203020202010200019901980197019601950
80
60
40
20
0
Percent of Working Age (15-64)
Aged 0-14Aged 65+
Source: United Nations
Dependents - Developing Countries Forecast Dependency Ratio
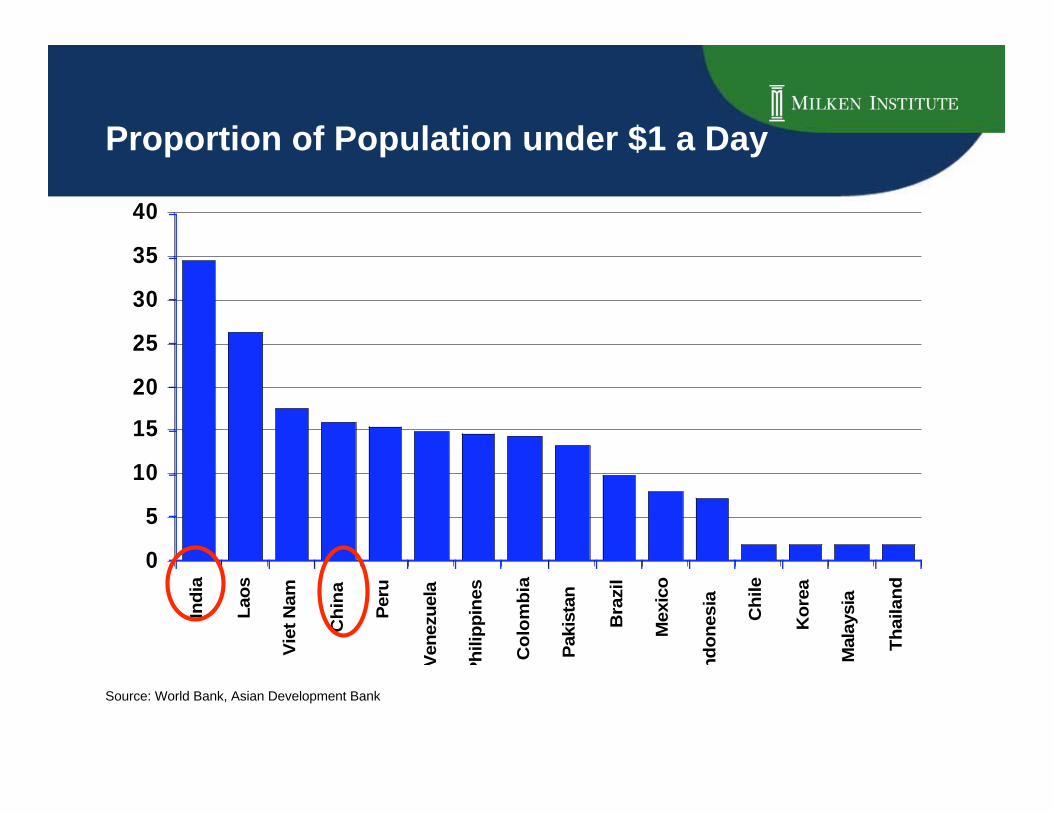
0
5
10
15
20
25
30
35
40In
dia
Lao
s
Vie
t N
am
Ch
ina
Peru
Ven
ezu
ela
Ph
ilip
pin
es
Co
lom
bia
Pakis
tan
Bra
zil
Mexic
o
nd
on
esia
Ch
ile
Ko
rea
Mala
ysia
Th
ailan
d
Source: World Bank, Asian Development Bank
Proportion of Population under $1 a Day

Catastrophic Risk on the Rise Global Number of Catastrophic Events, 1979 – 2004
Sources: Allstate Insurance Company
0
50
100
150
200
250
1979 1984 1989 1994 1999 2004
Natural Catastrophes
Man-Made Disasters
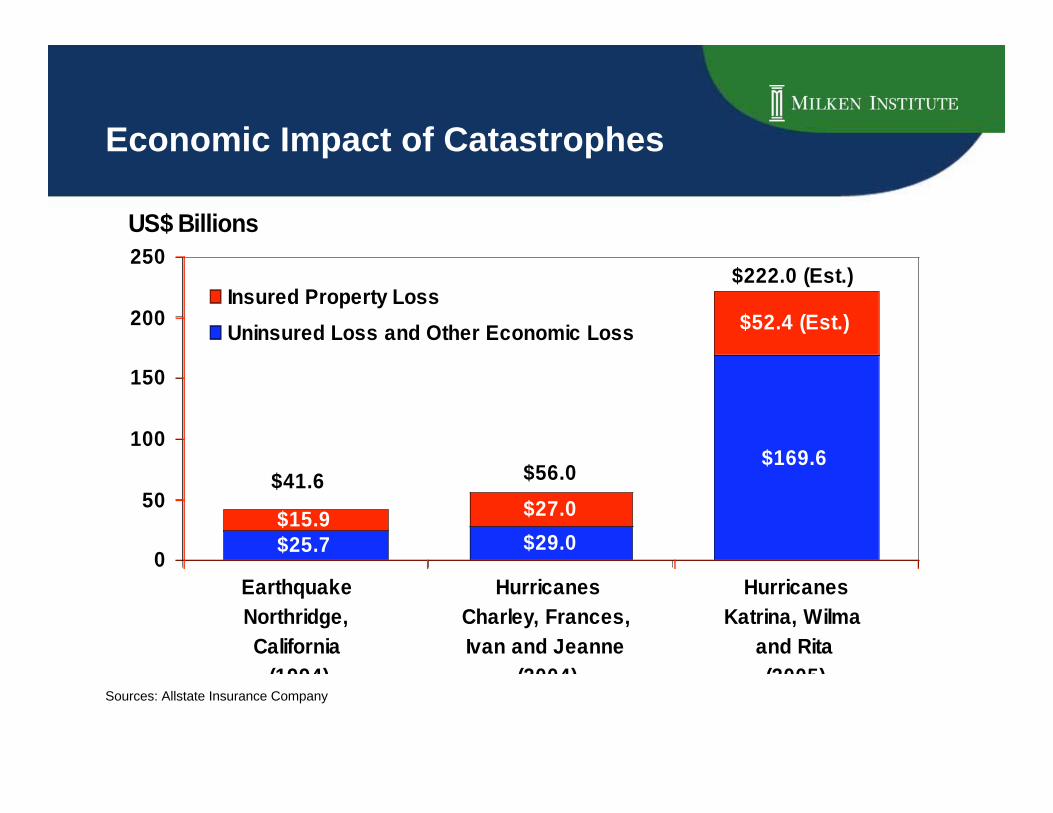
Economic Impact of Catastrophes
Sources: Allstate Insurance Company
$25.7 $29.0
$169.6
$15.9$27.0
$52.4 (Est.)
0
50
100
150
200
250
1 2 3
Insured Property Loss
Uninsured Loss and Other Economic Loss
Earthquake
Northridge,
California
(1994)
Hurricanes
Charley, Frances,
Ivan and Jeanne
(2004)
Hurricanes
Katrina, Wilma
and Rita
(2005)
US$ Billions
$41.6 $56.0
$222.0 (Est.)
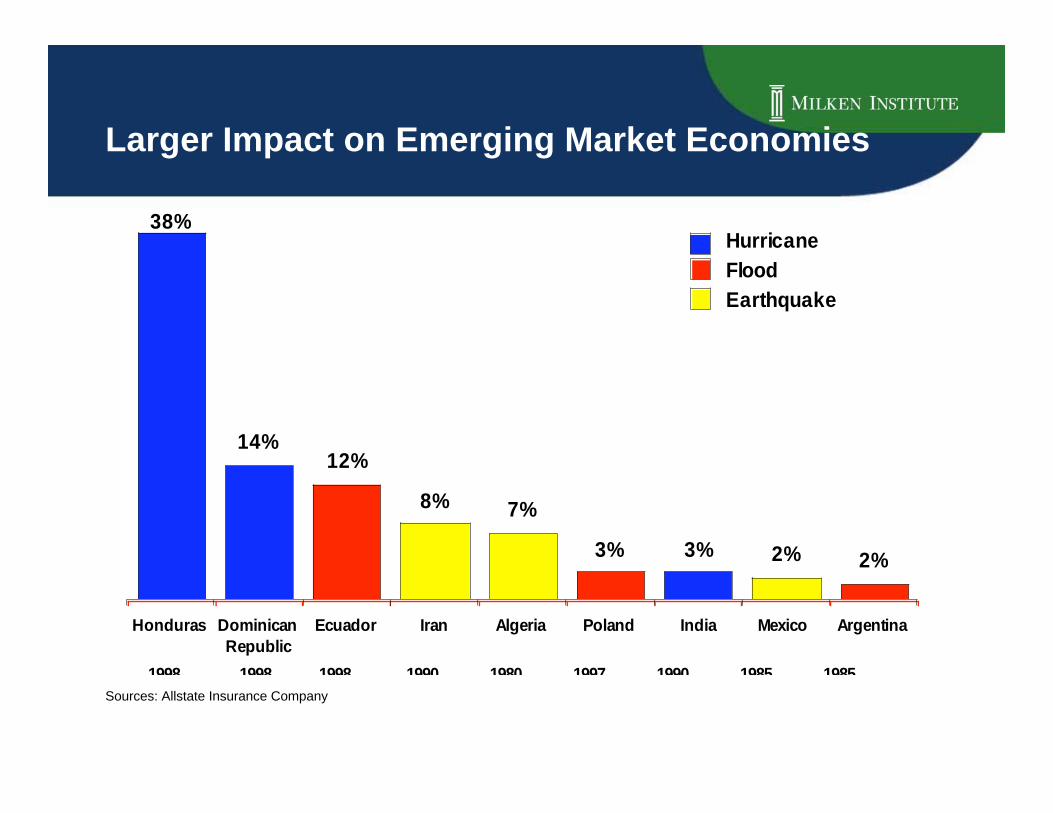
Larger Impact on Emerging Market Economies
Sources: Allstate Insurance Company
38%
14%12%
8% 7%
3% 3% 2% 2%
Honduras Dominican
Republic
Ecuador Iran Algeria Poland India Mexico Argentina
Hurricane
Flood
Earthquake
1998 1998 1998 1990 1980 1997 1990 1985 1985

Top 10 Military Spending Countries 2006
31.3Saudi Arabia
21.3India
32.1Italy
32.4Russia
44.9China
46.0Japan
57.5Germany
60.0France
66.2United Kingdom
532.8United States
Billion $MilitarySpending
Source: The World Factbook, CIA

4 0
4.5
5.0
5.5
6.0
6.5
7.0
7.5
8.0
8.5
9.0Max = 10
U.S.
Hong Kong
China
Russia
Brazil
India
United Kingdom
Capital Access Index 2006 Gauging Entrepreneurial Access to Capital
Source: Milken Institute
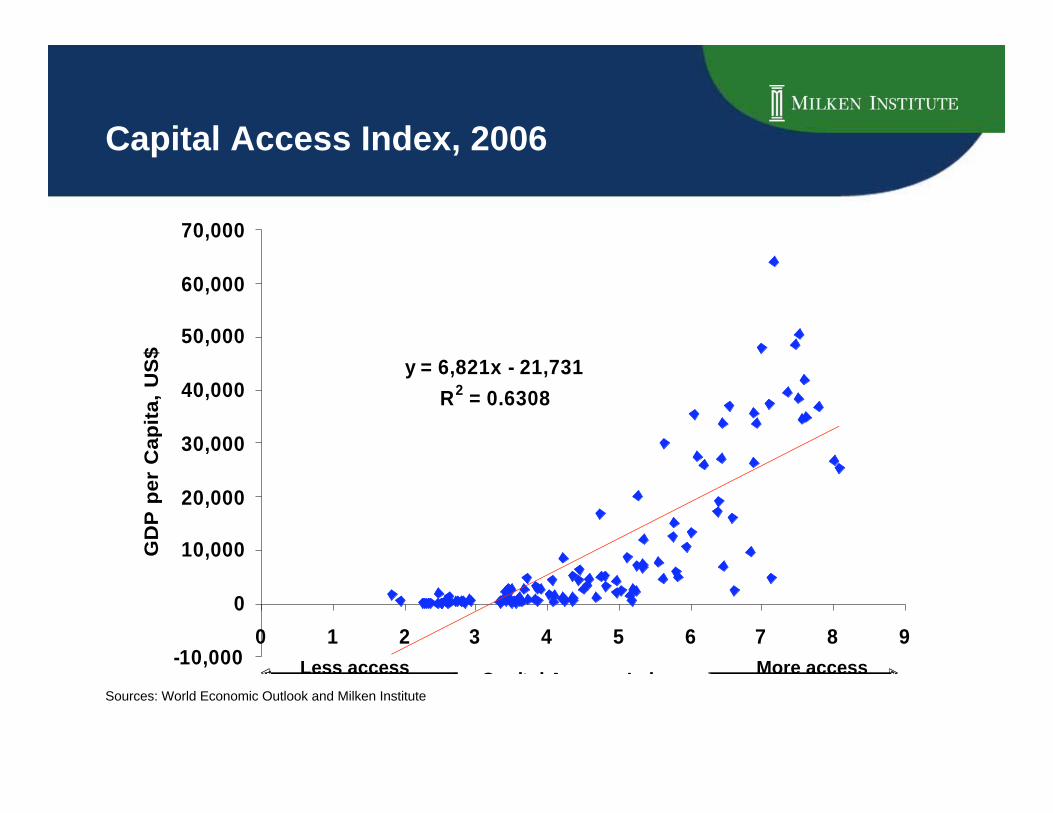
Capital Access Index, 2006
Less access More access
Sources: World Economic Outlook and Milken Institute
y = 6,821x - 21,731
R2 = 0.6308
-10,000
0
10,000
20,000
30,000
40,000
50,000
60,000
70,000
0 1 2 3 4 5 6 7 8 9
C it l A I d
GD
P p
er
Ca
pit
a,
US
$

Improved Capital Access CanAdd Billions to Emerging Economies
1.71.7India
2.41.7Pakistan
4.52.0Argentina
5.72.5Russia
15.72.6Mexico
Forgone GDP
US$ Billions
Forgone GDPGrowth %
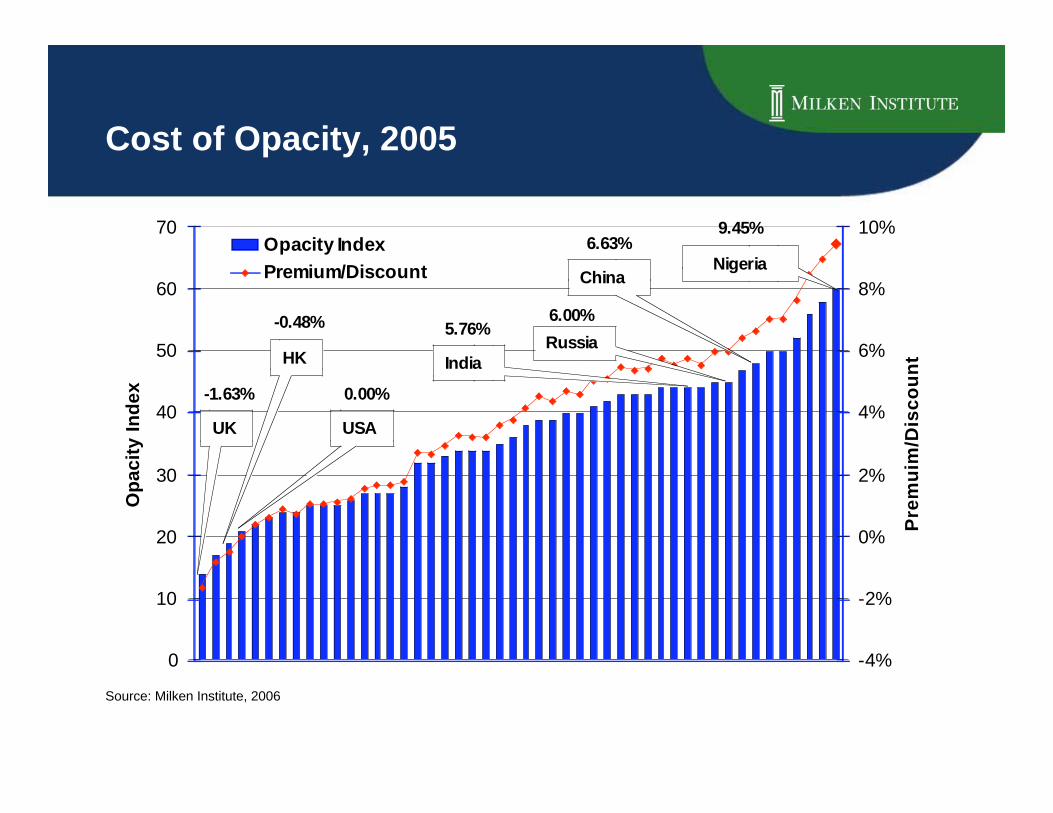
Cost of Opacity, 2005
Source: Milken Institute, 2006
6.00%
9.45%
-1.63%
-0.48%
0.00%
6.63%
5.76%
0
10
20
30
40
50
60
70
Op
ac
ity
In
de
x
-4%
-2%
0%
2%
4%
6%
8%
10%
Pre
mu
im/D
isc
ou
nt
Opacity Index
Premium/Discount Nigeria
UK
HK
USA
China
India
Russia
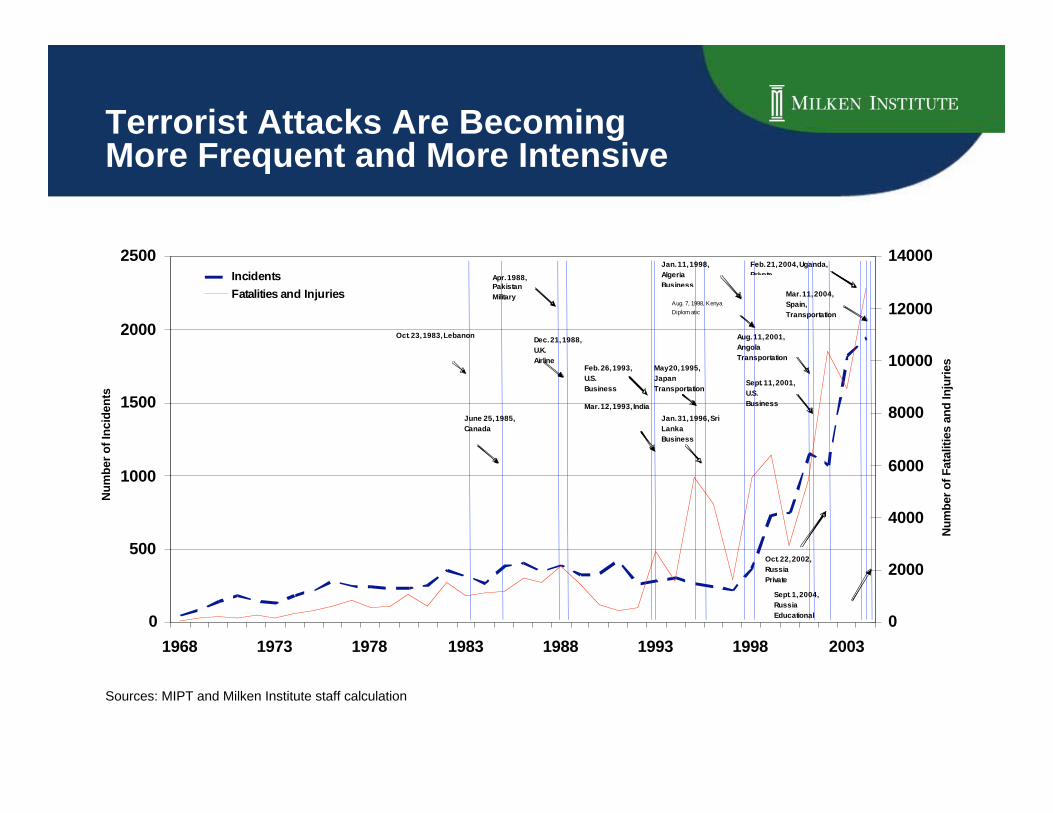
0
500
1000
1500
2000
2500
1968 1973 1978 1983 1988 1993 1998 2003
Nu
mb
er
of
Incid
en
ts
0
2000
4000
6000
8000
10000
12000
14000
Nu
mb
er
of
Fata
liti
es a
nd
In
juri
es
Incidents
Fatalities and Injuries
Oct. 23, 1983, Lebanon
June 25, 1985,
Canada
Dec. 21, 1988,
U.K.
Airline
Mar. 12, 1993, India
Jan. 11, 1998,
Algeria
Business
Aug. 7, 1998, Kenya
Diplom atic
Aug. 11, 2001,
Angola
Transportation
Sept. 11, 2001,
U.S.
Business
Feb. 21, 2004, Uganda,
Private
Sept. 1, 2004,
Russia
Educational
Apr. 1988,
Pakistan
Military
Feb. 26, 1993,
U.S.
Business
May 20, 1995,
Japan
Transportation
Jan. 31, 1996, Sri
Lanka
Business
Oct. 22, 2002,
Russia
Private
Mar. 11, 2004,
Spain,
Transportation
Sources: MIPT and Milken Institute staff calculation
Terrorist Attacks Are BecomingMore Frequent and More Intensive

0
5
10
15
20
25
30
2005 2002 1990
Percent
Corporate Crisis by Category
White Collar CrimeMismanagementClass Action Law SuitsLabor DisputesCatastrophesCasualty AccidentsDefects/RecallsConsumer Activism
DiscriminationFinancial DamagesWorkplace ViolenceEnvironmentExecutive DismissalSexual HarassmentHostile TakeoverWhistle Blowers
Sources: Institute for Crisis Management, 2007
Percent of Total Crisis