u.s. geological survey karst interest group proceedings ... · u.s. geological survey karst...
TRANSCRIPT
U.S. Geological Survey Karst Interest Group Proceedings, Rapid City, South Dakota September 12-15, 2005
Scientific Investigations Report 2005-5160
U.S. Department of the InteriorU.S. Geological Survey
U.S. Army Environmental Center

U.S. Geological Survey Karst Interest Group Proceedings, Rapid City, South Dakota September 12-15, 2005
Edited by Eve L. Kuniansky
Prepared in cooperation with U.S. Army Environmental Center
Scientific Investigations Report 2005-5160
U.S. Department of the InteriorU.S. Geological Survey
U.S. Department of the InteriorGale A. Norton, Secretary
U.S. Geological SurveyCharles G. Groat, director
U.S. Geological Survey, Reston, Virginia: 2005
For sale by U.S. Geological Survey, Information ServicesBox 25286, Denver Federal CenterDenver, CO 80225
For more information about the USGS and its products:Telephone: 1-888-ASK-USGSWorld Wide Web: http://www.usgs.gov/
Any use of trade, product, or firm names in this publication is for descriptive purposes only and does not imply endorsement by the U.S. Government.
Although this report is in the public domain, permission must be secured from the individual copyright owners to reproduce any copyrighted materials contained with this report.
Suggested citation:Kuniansky, E.L., 2005, U.S. Geological Survey Karst Interest Group proceedings, Rapid City, South Dakota, September 12-15, 2005: U.S. Geological Survey Scientific Investigations Report 2005-5160, 296 p.

iii
Contents
Introduction and Acknowledgments ...........................................................................................................................1
Agenda, U.S. Geological Survey Karst Interest Group Workshop.............................................................................3
National Programs
Establishing the National Cave and Karst Research Institute as a Robust Research and Education Center, by Louise D. Hose .................................................................................................................................................9
Geophysical Methods for Karst Studies
The State of the Art of Geophysics and Karst: A General Literature Review, by D.V. Smith................................10
Review of Airborne Electromagnetic Geophysical Surveys over Karst Terrains, by Bruce D. Smith, Jeffrey T. Gamey, and Greg Hodges ...................................................................................................................17
Overview of Karst Effects and Karst Detection in Seismic Data from the Oak Ridge Reservation, Tennessee,by W.E. Doll, B.J. Carr, and J.R. Sheehan, and W.A. Mandell .........................................................................20
Application of Seismic Refraction Tomography to Karst Cavities, by Jacob R. Sheehan, and William E. Doll, David B. Watson, and Wayne A. Mandell .......................................................................29
Borehole Geophysical Techniques to Determine Groundwater Flow in the Freshwater/Saline-Water Transitionof the Edwards Aquifer, South Central Texas, by R.B. Lambert, A.G. Hunt, and G.P. Stanton, and John Waugh ..................................................................................................................................................39
An Evaluation of Methods Used to Measure Horizontal Borehole Flow, by Wayne A. Mandell, James R. Ursic, William H. Pedler, Jeffrey J. Jantos, E. Randall Bayless, and Kirk G. Thideaux....................40
The Edwards Aquifer, Texas
Characterization of Hydrostratigraphic Units of the Capture, Recharge, and Confining Zones of the Edwards Aquifer using Electrical and Natural Gamma Signatures, Medina, Uvalde, And Bexar Counties, Texas, by Bruce D. Smith, Allan K. Clark, Jason R. Faith, and Gregory P. Stanton .....................................................41
Use of Helium Isotopes to Discriminate Between Flow Paths Associated with the Freshwater/Saline Water Transition Zone of the Edwards Aquifer, South Central Texas, by Andrew G. Hunt, Rebecca B. Lambert, Gary P. Landis, and John Waugh .......................................................................................................................42
Airborne and Ground Electrical Surveys of the Edwards and Trinity aquifers, Medina, Uvalde, and Bexar Counties, Texas, by Bruce D. Smith, David V. Smith, Jeffrey G. Paine, and Jared D. Abraham.....43
Magnetic Geophysical Applications Reveal Igneous Rocks and Geologic Structures in the Edwards Aquifer, Texas, by D.V. Smith, C. Foss, and B.D. Smith..........................................................44
Structural Controls on Karst Development in Fractured Carbonate Rock, Edwards and Trinity Aquifers, South-Central Texas, by Jason R. Faith, Charles D. Blome, Allan K. Clark, George B. Ozuna, and Bruce D. Smith .............................................................................................................................................45

iv
Numerical Modeling of Karst Systems
Simulating Ground-Water Flow in the Karstic Madison Aquifer using a Porous Media Model, by L.D. Putnam and A.J. Long............................................................................................................................46
Dual Conductivity Module (DCM), A MODFLOW Package for Modeling Flow in Karst Aquifers, by Scott L. Painter, Ronald T. Green, and Alexander Y. Sun.............................................................................47
Conceptualization and Simulation of the Edwards Aquifer, San Antonio Region, Texas, by R.J. Lindgren, A.R. Dutton, S.D. Hovorka, S.R.H. Worthington, and Scott Painter.....................................48
The role of MODFLOW in numerical modeling of karst flow systems, by J. J. Quinn, David Tomasko, and J.A. Kuiper....................................................................................................................................................58
Springs and the Use of Geochemistry in Karst Studies
The Case of the Underground Passage: Putting the Clues Together to Understand Karst Processes, by B. Mahler, B. Garnier, and N. Massei ............................................................................................................63
Spatial and Temporal Variations in Epikarst Storage and Flow in South Central Kentucky’s Pennyroyal Plateau Sinkhole Plain, by Chris Groves, Carl Bolster, and Joe Meiman .......................................64
Comparison of Water Chemistry in Spring and Well Samples from Selected Carbonate Aquifers in the United States, by Marian P. Berndt, Brian G. Katz, Bruce D. Lindsey, Ann F. Ardis, and Kenneth A. Skach.........................74
Interpretation of Water Chemistry and Stable Isotope Data from a Karst Aquifer According to Flow Regimes Identified through Hydrograph Recession Analysis, by D.H. Doctor and E.C. Alexander, Jr. ..........................82
Hydrogeologic Mapping and Tracer Techniques in Karst Areas
An Appalachian Regional Karst Map and Progress Towards a New National Karst Map, by D.J. Weary..............93
Hydrogeologic Framework Mapping of Shallow, Conduit-Dominated Karst—Components of a Regional GIS-Based Approach, by Charles J. Taylor, Hugh L. Nelson Jr., Gregg Hileman, and William P. Kaiser .....103
Application of Multiple Tracers to Characterize Sediment and Pathogen Transport in Karst, by Tiong Ee Ting, Ralph K. Davis, J.V. Brahana, P.D. Hays, and Greg Thoma ............................................................................114
Estimating Ground-Water Age Distributions from CFC and Tritium Data in the Madison Aquifer, Black Hills, South Dakota, by Andrew J. Long and Larry D. Putnam .............................................................115
A Multi-Tracer Approach for Evaluating the Transport of Whirling Disease to Mammoth Creek Fish Hatchery Springs, Southwestern Utah, by Larry E. Spangler, Meiping Tong, and William Johnson..............................116
Black Hills and Evaporite Karst
National Evaporite Karst—Some Western Examples, by Jack B. Epstein.............................................................122
Gypsum and Carbonate Karst Along the I-90 Development Corridor, Black Hills, South Dakota, by Larry D. Stetler and Arden D. Davis............................................................................................................134
Karst Features as Animal Traps: Approximately 500,000 Years Of Pleistocene And Holocene Fauna and Paleoenvironmental Data in the Northern High Plains, by Larry D. Agenbroad and Kristine M. Thompson................................................................................................................................135
Developing a Cave Potential Map of Wind Cave to Guide Exploration Efforts, by Rodney D. Horrocks ............141
The Potential Extent of the Jewel Cave System, by Michael E. Wiles...................................................................142
v
Karst Studies in Arkansas and the Ozarks
Geologic Controls on a Transition Between Karst Aquifers at Buffalo National River, Northern Arkansas, by Mark R. Hudson, David N. Mott, and Kenzie J. Turner, and Kyle E. Murray ............................................143
Quantification of Hydrologic Budget Parameters for the Vadose Zone and Epikarst in Mantled Karst, by J.V. Brahana, Tiong Ee Ting, Mohammed Al-Qinna, John F. Murdoch, Ralph K. Davis, Jozef Laincz, Jonathan J. Killingbeck, Eva Szilvagyi, Margaret Doheny-Skubic, Indrajeet Chaubey, P.D. Hays, and Gregg Thoma............................................................................................................................144
Characterization of Nutrient Processing at the Field and Basin Scale in the Mantled Karst of the Savoy Experimental Watershed, Arkansas, by Jozef Laincz, .P.D. Hays, Sue Ziegler, Byron Winston, J.V. Brahana, Ken Steele, Indrajeet Chaubey, and Ralph K. Davis.................................................................153
Water Supply and Land Use Issues in Karst Areas
Transport Potential of Cryptosporidium parvum Oocysts in a Drinking-Water, Karstic-Limestone Aquifer: What We Have Learned Using Oocyst-Sized Microspheres in a 100-m Convergent Tracer Test at Miami'sNorthwest Well Field, by Ronald W. Harvey, Allen M. Shapiro, Robert A. Renken, David W. Metge, Joseph N. Ryan, Christina L. Osborn, and Kevin J. Cunningham ....................................................................154
Ground-Water Quality Near a Swine Waste Lagoon in a Mantled Karst Terrane in Northwestern Arkansas, by Christopher M. Hobza, David C. Moffit, Danny P. Goodwin, Timothy Kresse, John Fazio, John V. Brahana, and Phillip D. Hays...............................................................................................................155
Vulnerability (Risk) Mapping of the Madison Aquifer near Rapid City, South Dakota, by Scott L. Miller,Arden D. Davis, and Alvis L. Lisenbee ............................................................................................................163
Hydrogeologic Characteristics of Four Public Drinking-Water Supply Springs in the Ozark Plateaus of Northern Arkansas, by Joel M. Galloway.....................................................................................................164
Adaptation of the Residence Time Distribution (RTD)-Biodegradation Model to Quantify Peroxide-Enhanced Fuel Biodegradation in a Single Karst Well, by Lashun K. King, Roger D. Painter, and T.D. Byl .................174
Free-Living Bacteria or Attached Bacteria: Which Contributes More to Bioremediation? by Roger D. Painter, Shawkat Kochary, and T.D. Byl........................................................................................................................180
Desorption Isotherms for Toluene and Karstic Materials and Implications for Transport in Karst Aquifers, by Mario Beddingfield, Khalid Ahmed, Roger Painter, and T.D. Byl..............................................................188
A Computer Program that Uses Residence-Time Distribution and First-Order Biodegradation to Predict BTEX Fate in Karst Aquifers, by Ryan Fitzwater, Roger Painter, Valetta Watson, and T.D. Byl...................189
Lactate Induction of Ammonia-Oxidizing Bacteria and PCE Cometabolism, by LyTreese Hampton, Roneisha Graham, and T.D. Byl .......................................................................................................................190
Biodegradation of Toluene as It Continuously Enters a 5-Liter Laboratory Karst System, by Fuzail Faridi, Roger Painter, and T.D. Byl ..............................................................................................................................191
Bacteria Induced Dissolution of Limestone in Fuel-Contaminated Karst Wells, by Serge Mondesir and T. D. Byl .....................................................................................................................................................192
vi
Field Trip Guides
Introduction to Three Field Trip Guides: Karst Features in the Black Hills, Wyoming and South Dakota- Prepared for the Karst Interest Group Workshop, September 2005, by Jack B. Epstein and Larry D. Putnam .........................................................................................................................................193
Field Trip Guide 1 Karst Features of the Southern Black Hills, South Dakota, Karst Interest Group Workshop, September 12, 2005, by Jack B. Epstein, Larry Agenbroad, Mark Fahrenbach, Rodney D. Horrocks, Andrew J. Long, Larry D. Putnam, J. Foster Sawyer, and Kristine M. Thompson .........................199
Field Trip Guide 2 Karst Features of the Northern Black Hills, South Dakota and Wyoming, Karst Interest Group workshop, September 15, 2005, by Jack B. Epstein, Arden D. Davis, Andrew J. Long, Larry D. Putnam, and J.Foster Sawyer..............................................................................................................232
Field Trip Guide 3 for a Self-Guided Trip to Karst Features of the Western Black Hills, Wyoming and South Dakota, Karst Interest Group Workshop, September 12-15, 2005, by Jack B. Epstein .................................................283

1
INTRODUCTION AND ACKNOWLEDGMENTS
Karst aquifer systems are present throughout parts of the United States and some of its territories. The complex depositional environments that form carbonate rocks combined with post-depositional tectonic events and the diverse climatic regimes under which these rocks were formed, result in unique systems. The dissolution of calcium carbonate and the subsequent development of distinct and beautiful landscapes, caverns, and springs have resulted in some karst areas of the United States being designated as national or state parks and commercial caverns. Karst aquifers and landscapes that form in tropical areas, such as the north coast of Puerto Rico differ greatly from karst areas in more arid climates, such as central Texas or South Dakota. Many of these public and private lands contain unique flora and fauna associated with the karstic hydrologic systems. Thus, multiple Federal, state, and local agencies have an interest in the study of karst areas.
Carbonate sediments and rocks are composed of greater than 50 percent carbonate (CO3) and the predominant carbonate mineral is calcium carbonate or limestone (CaCO3).Unlike terrigenous clastic sedimentation, the depositional processes that produce carbonate rocks are complex, involving both biological and physical processes. These depositional processes impact greatly the development of permeability of the sediments. Carbonate minerals readily dissolve and precipitate depending on the chemistry of the water flowing through the rock, thus the study of both marine and meteoric diagenesis of carbonate sediments is multidisciplinary. Even with a better understanding of the depositional environment and the subsequent diagenesis, the dual porosity nature of karst aquifers presents challenges to scientists attempting to study ground-water flow and contaminant transport.
Many of the major springs and aquifers in the United States develop in carbonate rocks and karst areas. These aquifers and springs serve as major water-supply sources and as unique biological habitats. Commonly, there is competition for the water resources of karst aquifers, and urban development in karst areas can impact the ecosystem and water quality of these aquifers.
The concept for developing a Karst Interest Group evolved from the November 1999, National Ground-Water Meeting of the U.S. Geological Survey, Water Resources Division. As a result, the Karst Interest Group was formed in 2000. The Karst Interest Group is a loose-knit grass-roots organization of U.S. Geological Survey employees devoted to fostering better communication among scientists working on, or interested in, karst hydrology studies.
The mission of the Karst Interest Group is to encourage and support interdisciplinary collaboration and technology transfer among U.S. Geological Survey scientists working in karst areas. Additionally, the Karst Interest Group encourages cooperative studies between the different disciplines of the U.S. Geological Survey and other Department of Interior agencies, and university researchers or research institutes.
The first Karst Interest Group Workshop was held in St. Petersburg, Florida, February, 13-16, 2001, in the vicinity of karst features of the Floridan aquifer. The proceeding of that first meeting, Water-Resources Investigations Report 01-4011 is available online at: http://water.usgs.gov/ogw/karst/index.htm. The U.S. Geological Survey, Office of Ground Water, provides support for the Karst Interest Group website.
The second Karst Interest Group workshop was held August 20-22, 2002 in Shepherdstown, West Virginia, in close proximity to the carbonate aquifers of the northern Shenandoah Valley. The proceedings

2
of the second workshop were published in Water-Resources Investigations Report 02-4174, which is available online at the previously mentioned website.
The third workshop of the Karst Interest Group was held September 12-15, 2005 in Rapid City, South Dakota, which is in close proximity to karst features in the semi-arid Black Hills of South Dakota and Wyoming, Wind Cave National Park and Jewell Cave National Monument, and the Madison Limestone aquifer. Financial support of the third workshop was obtained from Wayne A. Mandell, U.S. Army Environmental Center; Louise Hose, National Cave and Karst Research Institute; Thomas J. Casadevall, Regional Director, Central Region, U.S. Geological Survey; and Kevin F. Dennehy, Ground-Water Resources Program Coordinator, U.S. Geological Survey.
Numerous individuals contributed to the workshop and proceedings, and especially to the development of the field trips to karst features of the Black Hills in South Dakota and Wyoming. Three field trips were offered at this workshop, none of which were duplicative, as evidenced in the three field trip guides. Trips to the southern and northern karst features of the Black Hills were scheduled for Monday and Thursday and the third field trip to the western part of the Black Hills was designed to be accomplished on your own using the field trip guide. These field trips allow attendees of all the previous workshops to compare karst in the more humid eastern United States to karst in the semi-arid central United States. Geologist Emeritus, USGS, Jack Epstein agreed to help lead the planning and development of the field trips and field trip guides. The members of the Field Trip Committee are: David Weary, Andrew Long, and Larry Putnam, USGS; Rod Horrocks and Mike Wiles, National Park Service; Arden Davis and Scott Miller, South Dakota SMT; Larry Agenbroad and Kristine Thomas, Mammoth Site; Mark Fahrenbach and Foster Sawyer, South Dakota Department of Environmental and Natural Resources; and Bob Paulson, The Nature Conservancy. Larry Putnam also helped with logistical support for the field trips and the meeting. Additionally, Linda Stool and Todd Suess, Superintendents of Wind and Jewel Cave National Parks, respectively, have given permission for two guided evening trips for 25 people at their Parks. Rod Horrocks and Mike Wiles, Cave Specialists at Wind and Jewel Cave National Parks, respectively, will lead each evening trip.
The session planning committee for this third workshop included: Louise Hose, National Cave and Karst Research Institute; and Alan Burns, Kevin Dennehy, Perry Jones, Brian Katz, Eve Kuniansky, Randy Orndorff, Bruce Smith, Larry Spangler, Greg Stanton, and Chuck Taylor, U.S. Geological Survey, and Jack Epstein, Geologist Emeritus, U.S. Geological Survey. We sincerely hope that this workshop promotes future collaboration among scientists of varied backgrounds and improves of our understanding of karst systems in the United States and its territories.
The extended abstracts of U.S. Geological Survey authors were reviewed and approved for publication by the U.S. Geological Survey. Articles submitted by university researchers and other Department of Interior agencies did not go through the U.S. Geological Survey review process, and therefore may not adhere to our editorial standards or stratigraphic nomenclature. All articles were edited for consistency of appearance in the published proceedings. The use of trade names in any article does not constitute endorsement by the U.S. Government.
The cover illustration was designed by Ann Tihansky, U.S. Geological Survey, St. Petersburg, Florida, for the first Karst Interest Group Workshop.
Eve L. KunianskyKarst Interest Group Coordinator

3
AGENDA U.S. GEOLOGICAL SURVEY
KARTS INTEREST GROUP WORKSHOPSeptember 12-15, 2005Rapid City South Dakota
Rushmore Plaza Civic Center444 Mt. Rushmore Road
Rapid City, South Dakota 57701
Monday, September 12
Time Title
8:00 – 5:00 Field Trip 1 Karst Features of the Southern Black Hills
NOTE: BUS LEAVES FROM THE HOLIDAY INN PARKING LOT ADJACENT TO THE RUSHMORE PLAZA CIVIC CENTER -- 505 North Fifth Street, Rapid City, SD.
Tuesday, September 13
RegistrationAll day – pick up name tags and proceedingsWelcome8:30 – 8: 40 Welcome-Eve Kuniansky, U.S. Geological Survey, Karst Interest Group Coordinator
Geophysical Methods for Karst Studies8:40 – 9:00 The State of the Art of Geophysics and Karst: A General Literature Review—David V.
Smith, U.S. Geological Survey
9:00 – 9:20 Review of Airborne Electromagnetic Geophysical Surveys over Karst Terrains—Bruce D. Smith, U.S. Geological Survey, Jeffrey T. Gamey, Batelle, and Greg Hodges,Fugro Airborne
9:20 – 9:40 Overview of Karst Effects and Karst Detection in Seismic Data from the Oak Ridge Reservation, Tennessee—William E. Doll, Battelle, Bradley J. Carr, Geophex, and Jacob R. Sheehan, Battelle, and Wayne A. Mandell, U.S. Army Environmental Center
9:40 – 10:00 Application of Seismic Refraction Tomography to Karst Cavities—Jacob R. Sheehan and William E. Doll, Battelle, David B. Watson, Environmental Sciences Division, Oak Ridge National Laboratory, and Wayne A. Mandell, U.S. Army Environmental Center
10:00 – 10:40 BREAK
10:40 – 11:00 Borehole Geophysical Techniques to Determine Groundwater Flow in the Freshwater/Saline-Water Rransition of the Edwards Aquifer, South Central Texas—Rebecca B. Lambert, Andrew G Hunt, and Gregory P. Stanton, U.S. Geological Survey, and John Waugh, San Antonio Water System
The Edwards Aquifer, Texas11:00 – 11:20 Characterization of Hydrostratigraphic Units of the Capture, Recharge, and Confining
Zones of the Edwards Aquifer using Electrical and Natural Gamma Signatures, Medina, Uvalde, and Bexar Counties, Texas—Bruce D. Smith, Allan K. Clark, Jason R. Faith, and Greg Stanton, U.S. Geological Survey

4
11:20 – 11:40 Use of Helium Isotopes to Discriminate Between Flow Paths Associated with the Freshwater/Saline Water Transition Zone of the Edwards Aquifer, South Central Texas—Andrew G. Hunt, Rebecca B. Lambert, and Gary P. Landis, U.S. Geological Survey, and John Waugh, San Antonio Water System
11:40 – 1:20 LUNCH At the Civic Center, Luncheon Speakers, Tom Casadevall, Central Regional Director, U.S. Geological Survey, plus update from Louise Hose, Director of the National Cave and Karst Research Institute, “Establishing the National Cave and Karst Research Institute as a Robust Research and Education Center”
Numerical Modeling of Karst Systems1:20 – 1:40 Simulating Ground-Water Flow in the Karstic Madison Aquifer using a Porous Media
Model—Larry Putnam and Andy Long, U.S. Geological Survey
1:40 – 2:00 Dual Conductivity Module ( DCM), A MODFLOW Package for Modeling Flow in Karst Aquifers—Scott L. Painter, Ronald T. Green, and Alexander Y. Sun, Southwest Research Institute
2:00 – 2:40 Conceptualization and Simulation of the Edwards Aquifer, San Antonio Region, Texas—Richard J. Lindgren, U.S. Geological Survey, Alan R. Dutton, University of Texas, Susan D. Hovorka, Bureau of Economic Geology, S.R.H. Worthington, Worthington Groundwater, and Scott L. Painter, Southwest Research Institute
2:40 – 3:20 BREAK
Springs and the Use of Geochemistry in Karst Studies3:20 – 3:40 The Case of the Underground Passage: Putting the Clues Together to Understand Karst
Processes—Barbara Mahler, U.S. Geological Survey, B. Garner, and N. Massei, Département de Géologie, Université de Rouen,
3:40 – 4:00 Spatial and Temporal Variations in Epikarst Storage and Flow in South Central Kentucky’s Pennyroyal Plateau Sinkhole Plain—Chris Groves, Western Kentucky University, Carl Bolster, U. S. Department of Agriculture, and Joe Meiman, National Park Service
4:00 – 4:20 Comparison of Water Chemistry in Spring and Well Samples from Selected Carbonate Aquifers in the United States—Marian P. Berndt, Brian G. Katz, Bruce D. Lindsey, Ann F. Ardis, and Kenneth A. Skach, U.S. Geological Survey
4:20 – 4:40 Interpretation of Water Chemistry and Stable Isotope Data from a Karst Aquifer According to Flow Regimes Identified through Hydrograph Recession Analysis—Daniel H. Doctor, U.S. Geological Survey and E. Calvin Alexander, Jr., University of Minnesota
4:40 – 6:40 POSTER SESSION

5
Wednesday, September 14
Time Title
Hydrogeologic Mapping and Tracer Techniques in Karst Areas8:00 – 8:20 An Appalachian Regional Karst Map and Progress Towards a New National Karst
Map—David J. Weary, U.S. Geological Survey
8:20 – 8:40 Hydrogeologic Framework Mapping of Shallow, Conduit-Dominated Karst—Components of a Regional GIS-Based Approach—Charles J. Taylor, Hugh L. Nelson Jr., Gregg Hileman, and William P. Kaiser, U.S. Geological Survey
8:40 – 9:00 Application of Multiple Tracers to Characterize Sediment and Pathogen Transport in Karst—Tiong Ee Ting, Ralph Davis, Van Brahana, P.D. Hays, and Greg Thoma, University of Arkansas
9:00 – 9:20 Estimating Ground-Water Age Distributions from CFC and Tritium Data in the Madison Aquifer, Black Hills, South Dakota—Andrew Long and Larry Putnam, U.S. Geological Survey
Black Hills and Evaporite Karst9:20 – 9:40 National Evaporite Karst—Some Western Examples—Jack Epstein, U.S. Geological
Survey, Geologist Emeritus
9:40 – 10:00 Black Hills Evaporite Karst: A Multi-Tiered Dissolution Front—Jack Epstein, U.S. Geological Survey, Geologist Emeritus
10:00 – 10:40 BREAK
10:40 – 11:00 Gypsum and Carbonate Karst Along the I-90 Development Corridor, Black Hills, South Dakota—Larry D. Stetler and Arden D. Davis, Department of Geology and Geological Engineering, South Dakota School of Mines and Technology
11:00 – 11:20 Karst Features as Animal Traps: Approximately 500,000 Years Of Pleistocene And Holocene Fauna and Paleoenvironmental Data in the Northern High Plains—Larry D. Agenbroad and Kristine M. Thompson, Mammoth Site of Hot Springs, South Dakota, Incorporated
11:20 – 11:40 Developing a Cave Potential Map of Wind Cave to Guide Exploration Efforts—Rod Horrocks, National Park Service
11:40 – 12:00 The Potential Extent of the Jewel Cave System—Mike Wiles, National Park Service
12:00 – 1:40 LUNCH At the Civic Center, Luncheon Speaker, Larry Agenbroad—Mammoth Site
Karst Studies in Arkansas and the Ozarks1:40 – 2:00 Geologic Controls on a Transition Between Karst Aquifers at Buffalo National River,
Northern Arkansas—Mark R. Hudson, U.S. Geological Survey, David N. Mott, National Park Service, and Kenzie J. Turner and Kyle E. Murray, University of Texas, San Antonio
2:00 – 2:20 Quantification of Hydrologic Budget Parameters for the Vadose Zone and Epikarst in Mantled Karst—Van Brahana, Tiong Ee Ting, Mohammed Al-Qinna, John Murdoch, Ralph Davis, Jozef Laincz, Jonathan J. Killingbeck, Eva Szilvagyi, Margaret Doheny-Skubic, and Indrajeet Chaubey, University of Arkansas, and P.D. Hays, U.S. Geological Survey

6
2:20 – 2:40 Characterization of Nutrient Processing at the Field and Basin Scale in the Mantled Karst of the Savoy Experimental Watershed, Arkansas—Jozef Laincz, Sue Ziegler, Byron Winston, Van Brahana, Ken Steele, Indrajeet Chaubey, and Ralph Davis, University of Arkansas, and Phil Hays, U.S. Geological Survey
2:40 – 3:00 BREAK
Water Supply and Land Use Issues in Karst Areas 3:00 – 3:20 Transport Potential of Cryptosporidium parvum Oocysts in a Drinking-Water, Karstic-
Limestone Aquifer: What We Have Learned Using Oocyst-Sized Microspheres in a 100-m Convergent Tracer Test at Miami's Northwest Well Field—Ronald W. Harvey, Allen M. Shapiro, Robert A. Renken, David W. Metge, Joseph N. Ryan, Christina L. Osborn, and Kevin J. Cunningham, U.S. Geological Survey
3:20 – 3:40 Ground-Water Quality Near a Swine Waste Lagoon in a Mantled Karst Terrane in Northwestern Arkansas—Christopher Hobza and Phillip D. Hays, U.S. Geological Survey, David C. Moffit and Danny Goodwin, Natural Resources Conservation Service, and Van Brahana, University of Arkansas
3:40 – 4:00 Vulnerability (Risk) Mapping of the Madison Aquifer near Rapid City, South Dakota—Scott Miller, Arden D. Davis, and Alvis L. Lisenbee, South Dakota School of Mines and Technology, Department of Geology and Geological Engineering
4:00 – 4:20 Hydrogeologic Assessment of Four Public Drinking-Water Supply Springs in the Ozark Plateaus of Northern Arkansas—Joel M. Galloway, U.S. Geological Survey
4:20 – 6:20 POSTER SESSION
Thursday, September 15
8:00 – 5:00 Field Trip 2 Karst Features of the Northern Black Hills
NOTE: BUS LEAVES FROM THE HOLLIDAY INN PARKING LOT ADJACENT TO THE RUSHMORE PLAZA CIVIC CENTER — 505 North Fifth Street, Rapid City, SD.

7
Poster Session TitlesA Multi-Tracer Approach for Evaluating the Transport of Whirling Disease to Mammoth Creek Fish Hatchery Springs, Southwestern Utah, by Larry Spangler, U.S. Geological Survey, Meiping Tong and William Johnson, University of Utah
The role of MODFLOW in numerical modeling of karst flow systems, by John J. Quinn, David Tomasko, and James A. Kuiper, Argonne National Laboratory
Structural Controls on Karst Development in Fractured Carbonate Rock, Edwards and Trinity Aquifers, South-Central Texas, by Jason R. Faith, Charles D. Blome, Allan K. Clark, and Bruce D. Smith, U.S. Geological Survey
Structural and Stratigraphic 3-D Modeling of the Edwards Aquifer, Medina County, Texas, Using helicopter EM Survey Data to Evaluate and Extrapolate Geologic Mapping and Drillhole Data, by Michael P. Pantea, James C. Cole, Bruce D. Smith, and Maria Deszcz-Pan, U.S. Geological Survey
Airborne and Ground Electrical Surveys of the Edwards and Trinity aquifers, Medina, Uvalde, and Bexar Counties, Texas, by Bruce D. Smith, David V. Smith, Jeffrey G. Paine, and Jared D. Abraham, U.S. Geological Survey
An Evaluation of Methods Used to Measure Horizontal Borehole Flow, by Wayne A. Mandell, U.S. Army Environmental Center, James R. Ursic, U.S. Environmental Protection Agency, William H. Pedler and Jeffrey J. Jantos (RAS, Inc., Golden, Colorado), and E. Randall Bayless and Kirk G. Thideaux, U.S. Geological Survey
Magnetic Geophysical Applications Reveal Igneous Rocks and Geologic Structures in the Edwards Aquifer, Texas, by David V. Smith, U.S. Geological Survey, Clive Foss, Encom Technology, Sydney, Australia and Bruce D. Smith, U.S. Geological Survey
Desorption Isotherms for Toluene and Karstic Materials and Implications for Transport in Karst Aquifers, by Mario Beddingfield, Khalid Ahmed, and Roger Painter, Tennessee State University, and T.D. Byl, U.S. Geological Survey
A Computer Program that Uses Residence-Time Distribution and First-Order Biodegradation to Predict BTEX Fate in Karst Aquifers, by Ryan Fitzwater, Roger Painter, and Valetta Watson, Tennessee State University, and T.D. Byl, U.S. Geological Survey
Lactate Induction of Ammonia-Oxidizing Bacteria and PCE Cometabolism, by LyTreese Hampton and Roneisha Graham, Tennessee State University, and T.D. Byl, U.S. Geological Survey
Biodegradation of Toluene as It Continuously Enters a 5-Liter Laboratory Karst System, by Fuzail Faridi and Roger Painter, Tennessee State University, and T.D. Byl, U.S. Geological Survey
Bacteria Induced Dissolution of Limestone in Fuel-Contaminated Karst Wells, by Serge Mondesir, Tennessee State University, and T. D. Byl, U.S. Geological Survey
Adaptation of the Residence Time Distribution (RTD)-Biodegradation Model to Quantify Peroxide-Enhanced Fuel Biodegradation in a Single Karst Well, by Lashun K. King and Roger D. Painter, Tennessee State University, and T.D. Byl, U.S. Geological Survey
Free-Living Bacteria or Attached Bacteria: Which Contributes More to Bioremediation?, by Roger D. Painter and Shawkat Kochary, Tennessee State University, and T.D. Byl, U.S. Geological Survey

8
9
Establishing the National Cave and Karst Research Institute as a Robust Research and Education Center
By Louise D. HoseNCKRI-National Park Service, 1400 Commerce Dr., Carlsbad, NM 88220 [email protected]
ABSTRACT
The U.S. Congress directed the National Park Service (NPS) to establish the National Cave and Karst Research Institute (NCKRI) through legislation in 1998. The mandated purposes are to: (1) further the sci-ence of speleology; (2) centralize and standardize speleological information; (3) foster interdisciplinary cooperation in cave and karst research programs; (4) promote public education; (5) promote national and international cooperation in protecting the environment for the benefit of cave and karst landforms; and (6) promote and develop environmentally sound and sustainable resource management practices. To achieve this mission, an academic entity (now identified as New Mexico Institute of Mining and Technology) will administer NCKRI on a day-to-day basis while the NPS will retain “ultimate responsibility” and “indirect control.” An interim board of directors that includes representatives from a diverse collection of cave and karst programs nationwide is preparing Articles of Incorporation and Bylaws in conjunction with NPS and New Mexico Tech representatives to establish the National Cave and Karst Research Institute, Inc. The board and New Mexico Tech expect to formalize the 501.c.3 corporation and begin day-to-day operation of NCKRI by October 1, 2005.
The City of Carlsbad has designed and will soon build a 24,000 ft2 headquarters building through a combination of state, federal, and local funding. They anticipate groundbreaking this fall and completion within two years. Another major effort for NCKRI involves a Karst Digital Portal initiative in partnership with the University of New Mexico and the University of South Florida. The conceived network portal will enhance information access and improved communication within the national and international karst com-munity. The partnership will develop an on-line digital portal housed at the three institutions and provide free access to a variety of information including journal articles, images, maps, datasets, bibliographies, and gray literature. The portal should enhance international awareness and accessibility to National Karst Map products, as well.

10
The State of the Art of Geophysics and Karst: A General Literature Review
By D.V. Smith1
1U.S. Geological Survey, Box 25046 MS964, Denver, CO 80225-0046
ABSTRACT
To assess the state of the art of geophysics as applied to karst investigations, a general review of the literature over the period 2001-2005 was undertaken. This time frame witnessed rapid advances in instrumentation and data process-ing for interpretation and visualization of subsurface geology. Essentially, it has become possible to rapidly acquire, process and view high quality data in the field. GPS technology has been adapted to most commercial geophysical instruments, allowing for high geolocation accuracy with unprecedented ease. To answer the question: “What methods work best for karst investigations and under what conditions?”, this review relied mainly on the GeoRef database for abstracts. GeoRef is an on-line indexing service maintained by the American Geological Institute. It is the most com-prehensive database in the geosciences, with references to journal articles, society proceedings, books, theses, and gov-ernment reports. Keyword searches were completed for a comprehensive list of geophysical methods, ranging from conventional to exotic. As a general review of a wide variety of methods, no attempt is made to explain the theory of operation beyond fundamental principles.
INTRODUCTION
Geophysical surveys have been performed for decades to characterize karst, sometimes with success, but often with mixed results. Their applicability to karst was summarized in past reviews (Greenfield, 1979, Dobecki, 1990). Now, due to advances in computerization, minia-turization, and data processing, combined with global position system (GPS) geolocation technology, it has become possible to conduct investigations with unprece-dented speed and accuracy. With the recognition that no one technique can solve the problem at hand, whether geotechnical, geohydrological, or environmental, more emphasis is being placed on integrated surveys, in which two or more complementary methods are combined to constrain an interpretation. Examples abound, particularly seismic refraction combined with earth resistivity imag-ing (Sumanovac and Weisser, 2001), and different electri-cal methods (Tarhule and others, 2003). The success of the recent advances in geophysical methods is reflected not only in a growing geotechnical consulting industry, but also in the many studies and case histories presented by researchers, as the new hardware and software tools become available.
For simplicity, the methods are separated into sur-face, borehole, and airborne categories, since these strongly distinguish the various tools that are available.
SURFACE METHODS
Surface methods predominate in karst investigations, both because of available, the logistical ease of deploy-ment, and the relatively low cost compared to airborne and borehole methods. Some attempts have been made to standardize the selection of different methods for specific problems (ASTM, 1999), but by and large the ones selected for use on any given assignment are based on time and cost. Surface methods fall into three broad cate-gories: 1) electromagnetic, involving time-varying mag-netic and electric fields across the spectrum, from DC (the static limit) to high frequencies, 2) seismic, based on the propagation of acoustic waves in earth media, and 3) potential field, including gravity and magnetics, for which the physics of potential field theory apply.
Electromagnetic
This category embraces the greatest variety of tech-niques, which cover the electromagnetic spectrum from DC (0 Hz) to UHF (100 MHz). Sources and detectors operate in electric and/or magnetic field mode in various

11
combinations and geometrical arrangements. The theory underpinning their operation, based upon Maxwell’s equations, is mature and highly devel-oped. Recent years have seen significant advances in instrumentation and data processing capabilities.
Multielectrode resistivity (referred to variously as electrical resistivity imaging (ERI) and electrical resistivity tomography (ERT)) is increasingly used because modern, automated multi-electrode control units simplify the acquisition of high quality data. Case histories are numerous, and excellent examples are readily available (Roth and others, 2002; Van Schoor, 2002). The topic of which array configura-tion is optimal for given site conditions has received attention (Zhou and others, 2002). Robust algo-rithms for generating pseudo-sections and inver-sions (resistivity profiles) are commercially available. While these instruments can acquire 3D data over a 2D spatial arrangement of electrodes, no true 3D inversions capability exists yet. Standard practice is to arrange 2D profiles in fence diagrams in order to visualize the 3D distribution of apparent resistivities. As a result, ambiguities are still intro-duced by lateral inhomogeneities.
Ground penetrating radar (GPR) finds wide application in karst investigations, particularly in settings like Florida where the limestones are hori-zontally stratified and the soils and overburden do not severely attenuate the signals. Interpretation is subjective and prone to error because of complex scattering phenomena and reflections from off-line (transverse) inhomogeneities, often referred to as 3D effects. Commercial GPR units are continually improved, and GPR research and applications are practiced worldwide (Baradello and Yabar, 2002). Case histories and developments are regularly reported in annual international conferences devoted to this method.
Frequency-domain electromagnetic (EM) sur-veys Time-domain electromagnetic (TEM) surveys for voids have been found to be more effective and cheaper than seismic in places (Xue and others, 2004). Software packages for interpreting both EM and TEM data. The very-low frequency (VLF) method has been used for decades for locating ground water aquifers. A recent paper (Bosch and
Mueller, 2001) describes a possible new approach for mapping karst.
Self potential (SP), also known as natural potential and streaming potential, continues to be used to distinguish active sinkholes from filled depressions (Adams and others, 2002; Vichabian and Morgan, 2002). Anomalous voltages are present over an air-filled cavity when ground water is in-flowing from the surface.
Seismic
Small scale shallow seismic surveys are regu-larly performed in karst terrain, primarily to answer geotechnical questions relating to thickness of over-burden and bedrock competency. By measuring the seismic velocities of compressional (P), shear (S), and/or surface (Rayleigh) waves, as they are either refracted or reflected off acoustic boundaries, a velocity-versus-depth profile can be derived along the seismic line. Steady improvements in instrumen-tation, seismic sources and inversion software make the seismic method attractive.
The multichannel analysis of surface waves (MASW) method is used to evaluate the elastic modulus of the shallow surface, and has been used to detect subsurface voids (Bonila and others, 2004). A similar method, spectral analysis of surface waves (SASW), employs an electromechanical harmonic shaker as a frequency-controlled active source (Kayen, 2005). Its use in karst investigations has not yet been reported.
The basal plane of epikarst has been determined from seismic refraction plus electrical resistivity and gravity, thus limiting the epikarst zone from geo-physical point of view (Bosak and Benes, 2003). Seismic refraction tomography (P and S wave) was used with ERT and GPR to identify loosened rock around a cave at an archaeological site (Leucci, 2003).
While the theory and practice of seismology are well developed, on-going theoretical work on under-standing effects of karst on acoustic wave scattering and attenuation (Hackert and Parra, 2003), may improved the practice.

12
Gravity
Gravity methods have long been used in karst investigations, mainly in search of voids and cav-erns. Tedious field work, involving careful survey-ing and tie points, has limited its use. A new generation of automated digital-output gravity meters attain 5 microGal accuracy, which is suffi-cient to detect shallow voids. Absolute gravity meters with 10 microGal accuracy are now available which eliminate the need to tie into an established benchmark. While global positioning systems (GPS) have generally replaced surveying with total sta-tions, GPS elevation measurements are insuffi-ciently accurate for void detection. The theoretical gravity vertical gradient is 3.086 microGal/cm. Therefore, to realize the precision of modern gravimeters, local elevation control has to be kept to about 1 cm. This can be done by combining GPS, to establish an accurate local benchmark, and an opti-cal surveying instrument to measure relative eleva-tions. Data analysis and modeling is made easier through automated corrections and advanced gravity inversion software, some of which uses 3D voxel models instead of 2D slab approximations. Micro-gravity has been used in conjunction with GPR to map shallow caves (Beres and others, 2001).
Magnetics
High-resolution ground magnetic surveys rarely take place in karst investigations. Carbonate rocks do not, as a rule, contain sufficient magnetic minerals to cause magnetic anomalies. In cases where high susceptibility sediments overlie karstic limestone, it is possible to map areas where the soils are depleted or concentrated, as with an active sink-hole. Magnetometers with 0.01 nT sensitivity can directly detect such voids and caves (Rybakov and others, 2005). Research into the origin of magnetic soils in karst regions (Rivers and others, 2004) can lead to the further application of magnetic surveys.
BOREHOLE METHODS
By placing geophysical instruments directly in the earth, borehole methods can offer superior results over surface methods – but at a cost: bore-holes are not cheap, especially in karst. Many tools require open holes, while other tools can operate
through plastic casing. Furthermore, investigations involving tomographic techniques require multiple boreholes. Unlike surface methods, borehole meth-ods are largely immune to above ground cultural noise. Because of the wealth of information obtained, every borehole should be logged as stan-dard practice.
Integrated approaches to borehole data have been followed to identify high transmissivity zones (Brandon and others, 2001) and to investigate con-tamination in fractured sedimentary bedrock (Will-iams, 2002).
Electromagnetic
Much work has been done by the mining indus-try to detect voids and obstacles. There is a strong reliance on borehole radar to image the conditions around a single borehole (bi-static mode) and between pairs of boreholes (tomographic mode). Because the tools are expensive and difficult to use, they have found limited use in karst studies.
Logging
Borehole logging tools are now available with miniaturized versions of virtually all surface electro-magnetic techniques, plus nuclear (gamma, neutron) measurement capabilities. Borehole logging should be considered indispensable during installation of a well, as it provides detailed lithologic and porosity information. Many case studies are reported annu-ally (e.g., Brandon and others, 2001).
Televiewer
Visual and acoustic televiewers are extremely valuable in classifying porosity, fractures, and voids, as well as lithologic changes, as determined from fabric, grain, color. Combined with ArcGIS and Spatial Analyst software, digital images can be used to derive the spatial distribution of macropore density.
Seismic
The oil and gas industry relies heavily on bore-hole seismic techniques. Spin-offs of this technol-ogy have benefited near-surface geophysics, particularly in ground water investigations. Vertical seismic profiling (VSP), in which geophone receivers are lowered in a well to measure acoustic

13
waves generated by a source on the surface, and cross-well tomography (CWT), in which both receivers and sources are positioned in adjacent boreholes, have the capability of directly detecting cavities and conduits. Because of the high cost fac-tor, these methods are still in the research stage as applied to karst studies, and are not widely used.
AIRBORNE METHODS
When it is impossible to gain access to land for laying out seismic lines or resistivity arrays, air-borne methods offer one means of acquiring high resolution data. Though costly, they can be cost effective for large area reconnaissance mapping of large-scale structures under cover, such as faults and lithology. In kart terrain, surface conductivity varia-tions can sometimes be related to surface subsidence over sinkholes.
Electromagnetic
Early work in a karst setting (Doll and others, 1993) and subsequent papers based on the helicopter data showed effectiveness in mapping geology in the Appalachian fold-and-thrust belt, and anomalies correlating with known karst features were noted (Doll and others, 2000). These anomalies were fol-lowed up using surface geophysical techniques. A program of airborne and surface geophysics was undertaken to delineate in potential pathways for contamination transport in karst (Gamey and others, 2001). More recent work (Smith and others, 2003; Hodges, 2004; Smith and others, 2005) demon-strated ability to map structure and lithology in a karst aquifer. However, the ability to map large voids and conduits has yet to be shown definitively. Future investigations using improved sensors and improved GPS will help answer this question.
Aeromagnetic
Although magnetic surveys cannot, as a rule, directly map karst features, they can provide valu-able information on geologic structure. A high-resolution aeromagnetic survey was flown in 2001 over the western extent of the Edwards aquifer in Medina and Uvalde Counties, Texas. The objective of the survey was to improve the geohydrologic
framework of this important world-class karst aqui-fer. This data set (Smith and others, 2002) has helped to develop a 3D geologic model of the aqui-fer, which will be used to refine ground water mod-els for aquifer management. In addition to analyzing how newly detected igneous bodies may influence regional ground water flow. Aeromagnetic data from a helicopter survey over a small study area cen-tered on a sinkhole revealed a magnetic lineation aligned with a major fault juxtaposing the Edwards and Glen Rose limestones (Smith and Pratt, 2003).
LIDAR
Subtle changes in topographic features can be indicative of karst features, such as dolines and active sinkholes. Current light detection and ranging (LIDAR) systems can achieve accuracies of 15 cm vertically and less than 1 m horizontally at flying altitudes of 300 – 2,000 m. Measurements can be degraded by ground cover, however. One paper (Montane and Whitman, 2000) examined the rela-tionship of LIDAR topography to subsurface karst structures, but no reports have since been published on the topic.
Remote Sensing
The airborne visible/infrared imaging spec-trometer (AVIRIS) and satellite (LANDSAT) plat-forms obtain spectral and hyperspectral images of the earth’s surface. Emissions in various bands can be related to vegetation and mineralization. Over karst terrain, variations of vegetation, in particular, can be used as indicators of active drainage and recharge sites. Other studies used photographic images and digital elevation models (Jemcov and others, 2002), and true geological remote sensing (Hung and Batelaan, 2003; Rouse and others, 2004). Aerial thermography, by which slight temperature variations (0.1 deg C) are mapped, has been used to characterize karst hydrology (Campbell and Keith, 2001).
FRONTIER METHODS
In very recent years commercial equipment has become available based on the surface nuclear mag-netic resonance (SNMR) geophysical technique pioneered in Russia. The method of magnetic

14
resonance sounding (MRS) is based upon the pre-cession of protons of hydrogen of water when acted on by a strong magnetic field. Its possible applica-tions are beginning to be explored (Valla and Legchenko, 2003). The method has the capability of measuring the quantity and depth of free (not surface bound) water. Thus, it may be possible to detect perched water and water filled cavities in karst (Vouillamoz and Legchenko, 2003). Advances in this field are presented at an annual European Sym-
posium on NMR Spectroscopy in Soil, Geo and Environmental Sciences.
Gravity and magnetic tensor gradiometry are evolving rapidly as commercial versions of military systems become available. As gradiometric devices, they measure field variations caused by near sources more than from distance sources. Thus, tensor microgravimetry might prove effective in mapping density variations in the near surface.
REFERENCES
Adams, A.L., Zhou, W., Wang, J., and Beck, B.F., 2002, A differentiation of karst hazards based on ground pen-etrating radar and natural potential measurements, in Abstracts with Programs, Geological Society of Amer-ica, 34; 2, p. 89.
ASTM International , 1999, D6429: Standard Guide for Selecting Surface Geophysical Methods
Baradello, L., and Yabar, D.N., 2002, Singlefold and multifold GPR techniques to detect karst caves, Alti del Museo Civico di Storia Naturale di Trieste, 49, Suppl.; p. 23-28.
Beres, M., Luetscher, M., Oliver, R., 2001, Integration of ground penetrating radar and microgravimetric meth-ods to map shallow caves, Journal of Applied Geo-physics, Vol. 46, No. 4.
Bonila, C., Rehwoldt, E.B, and Dunscomb, M.H., 2004, Geophysical testing for voids caused by non-com-pacted backfill, in Proceedings of the Symposium on Engineering Geology and Geotechnical Engineering, 39, p. 197-205.
Bosak, P., and Benes, V., 2003, Geophysical characteris-tics of epikarst; case studies from Zagros Mts. (Iran) and the Koneprusy region (Czech Republic), Acta Car-sologica, 32;2, p. 255-267.
Bosch, F.P., and Mueller, I., 2001, Continuous gradient VLF measurements; a new possibility for high resolu-tion mapping of karst structures, First Break, 19; 6, p. 343-349.
Brandon, W.C., Behr, R.E., Blackey, M.E., and Zay, A., 2001, Identification of discrete high transmissivity zones in sparsely fractured limestone; an integrated approach using fracture trace analysis and surface and
borehole geophysical methods, Loring, Maine, in Abstracts with Programs, Geological Society of Amer-ica, 33; 6, p. 413.
Campbell, C. W., and Keith, A.G., 2001, Karst ground-water hydrologic analyses based on aerial thermogra-phy, Hydrological Science and Technology, 17;1-4, p. 59-68.
Dobecki, T.L., 1990, Review of geophysical methods for karst detection and mapping; Bulletin of the Houston Geological Society. 32; 5, p. 21-24.
Doll, W.E., Nyquist, J.E., Holladay, J.S., Labson, V.F., and Pellerin, L., 1993, Preliminary Results of a Heli-copter Electromagnetic and Magnetic Survey of the Oak Ridge Reservation, Tennessee for Environmental and Geologic Site Characterization, in Proceedings of the Symposium on the Application of Geophysics to Engineering and environmental Problems, p. 15.
Doll, W.E., Nyquist, J.E., Beard, L.P., and Gamey, T.J., 2000, Case History: Airborne geophysical surveying for hazardous waste site characterization on the Oak Ridge Reservation, Tennessee, Geophysics, Vol. 65, No. 5, p. 1372-1387.
Gamey, T.J., Thompson, M., Mandell, W., and Frano, G., 2001, Karst pathway delineation using combined spa-tial and geophysical analysis at Camp Crowder, Mis-souri, in Abstracts with Programs, Geological Society of America, 33; 6, p. 132.
Greenfield, R.J., 1979, Review of geophysical approaches to the detection of karst; Bulletin of the Association of Engineering Geologists, 16; 3, p. 393-408.
Hackert, C.L., and Parra, J.O., 2003, Estimating scatter-ing attenuation from vugs or karsts, Geophysics, 68;4, p. 1182-1188.

15
Hodges, G., 2004, Practical Inversions for Helicopter Electromagnetic Data: Airborne Geophysical Methods Workshop, Symposium on the Application of Geo-physics to Environmental and Engineering Problems, p. 45-58.
Hung, L.Q., and Batelaan, O., 2003, Environmental geo-logical remote sensing and GIS analysis of tropical karst areas in Vietnam, International Geoscience and Remote Sensing Symposium (IGARSS), Vol. 4, p. 2964-2966.
Jemcov, I., Pavlovic, R., and Stevanovic, Z., 2002, Mor-photectonic analysis in hydrogeological research of karst terrains; a case study of SW Kucaj Massif, eastern Serbia, Theoretical and Applied Karstology, 15, p. 51-59.
Kayen, R., 2005, The Spectral Analysis of Surface Waves Measured at William Street Park, San Jose, California, Using Swept-Sine Harmonic Waves, in Asten, M.W. and Boore, D.M., eds., Blind comparisons of shear wave velocities at closely spaced sites in San Jose, Cal-ifornia: U.S. Geological Survey Open-File Report 2005-1169, p. 7
Leucci, G., 2003, Evaluation of karst cave stability using integrated geophysical methods, GeoActa, 2, p. 75-88.
Montane, J.M, and Whitman, D., 2000, Relationships between micro-topography and subsurface karst struc-tures from airborne LIDAR and GPR data, in Abstracts with Programs, Geological Society of America, 32; 7, p. 515.
Rivers, J.M., Nyquist, J.E., Roh, Y., Terry, D.O., Doll, W.E., 2004, Investigation into the origin of magnetic soils on the Oak Ridge Reservation, Tennessee, Soil Science Society of America Journal, 68;5, p. 1772-1779.
Roth, M.J.S., Mackey, J.R., Mackey, C., and Nyquist, J.E., 2002, A case study of the reliability of multielec-trode earth resistivity testing for geotechnical investi-gations in karst terrains, Engineering Geology, 65;2-3, p. 225-232.
Rouse, K.J, Palmer, J.R., and Young, G., 2004, Multi-spectral image analysis as a guide to identifying poten-tial soil-bedrock karst collapse hazards in urban set-tings, Farmington, Missouri, in Abstracts with Programs, Geological Society of America, 36; 3, p. 6.
Rybakov, M., Rotsetin, Y., Shirman, B., and Al-Zoubi, A., 2005, Cave detection near the Dead Sea – a micro-
magnetic feasibility study, The Leading Edge, p 585-590.
Smith, B.D., Smith, D.V., Hill, P.L., and Labson, V.F., 2003, Helicopter Electromagnetic and Magnetic Survey Data and Maps, Seco Creek Area, Medina and Uvalde Counties, Texas: U.S. Geological Survey Open-File Report 03-0226, p. 12.
Smith, B.D., Cain, M.J., Clark, A.K.,. Moore, D.W., Faith, J.R., and Hill, P.L., 2005, Helicopter Electro-magnetic and Magnetic Survey Data and Maps, North-ern Bexar County, Texas: U.S. Geological Survey Open-File Report 05-1158, p. 83.
Smith, D.V., Smith, B.D., Hill, P.L., 2002, Aeromagnetic Survey of Medina and Uvalde Counties, Texas: A Web Site for Distribution of Data: U.S. Geological Survey Open-File Report 02-0049.
Smith, D.V., and Pratt, D., 2003, Advanced Processing and Interpretation of the High-resolution aeromagnetic Survey data over the Central Edwards Aquifer, Texas, in Proceedings of the Society for the Application of Geophysics to Engineering and Environmental Prob-lems, p. 11.
Sumanovac, F., and Weisser, M., 2001, Evaluation of resistivity and seismic methods for hydrogeological mapping in karst terrains, Journal of Applied Geophys-ics, Vol. 47, No. 1.
Tarhule, A., Dewers, T., Young, R., Witten, A., and Hali-han, T., 2003, Integrated subsurface imaging tech-niques for detecting cavities in the gypsum karst of Oklahoma, Oklahoma Geological Survey Circular, p. 77-84.
Valla, P., and Legchenko, A., 2002, Surface nuclear mag-netic resonance; what is possible?, Journal of Applied Geophysics, Vol. 50, No2. 1-2.
Van Schoor, M., 2002, Detection of sinkholes using 2D electrical resistivity imaging, Journal of Applied Geo-physics, V. 50, No. 4.
Vichabian, Y., and Morgan, F.D., 2002, Self potentials in cave detection, The Leading Edge, 21:9, p. 866.
Vouillamoz, J.M., Legchenko, A., et al., 2003, Localiza-tion of saturated karst aquifer with magnetic resonance sounding and resistivity imagery, Ground Water, 41:5, p. 578-586.

Williams, J.H., 2002, Borehole geophysics for contami-nation investigations in fractured sedimentary bedrock, in Abstracts with Programs, Geological Society of America, 34: 6, p. 228.
Xue, G., Song, J., and Xian, Y., 2004, Detecting shallow caverns in China using TEM, The Leading Edge, 23;7, p. 694-695.
Zhou, W., Beck, B.F., and Adams, A.L., 2002, Selection of an effective electrode array to map sinkholes in karst terranes using electrical resistivity tomography, in Abstracts with Programs, Geological society of Amer-ica, 34:2, p. 16.
17
Review of Airborne Electromagnetic Geophysical Surveys over Karst Terrains
By Bruce D. Smith1, Jeffery T. Gamey2, Greg Hodges3 1U.S. Geological Survey, MS 964, Box 25046, Denver Federal Center, Denver, CO 80225, 2Battelle, 105 Mitchell Rd, Suite 103, Oak Ridge, TN 378303Fugro Airborne, 2270 Argentia Road Mississauga (Toronto), Ontario
ABSTRACT
This paper describes airborne electromagnetic geophysical surveys that have been applied to geologic or hydrologic studies of karst terrain in the United States. These surveys have all used helicopter frequency domain electromagnetic (HEM) systems to map subsurface electrical conductivity (or equivalently its recip-rocal, resistivity). The first published survey was at the Oak Ridge Reservation including the Oak Ridge National Laboratory (Tennessee) in 1993-1994 (Doll and others, 2000; Nyquist and Beard, 1999). The sur-vey used a 6-frequency HEM system with three frequencies each for horizontal and vertical coplanar coil configurations. The frequency range was from approximately 850 to 36,000 Hz. This survey showed excel-lent examples of geophysical mapping of Permian limestone and dolomite lithologies, structure, and map-ping of anomalous electrical conductivity highs associated with karst features. The karst features consisting of dolines, depressions, and disappearing streams, were postulated to be important controls for ground water flow paths and potential flow of contaminants.
The second survey was conducted in 1999 at Camp Crowder in Southeastern Missouri (Gamey and oth-ers, 2000). This HEM survey used five frequencies from approximately 400 to 102,000 Hz. This was an integrated study using photo-interpretation, ground and airborne electromagnetic (EM) surveys, seismic profiling, ground resistivity depth imaging surveys, and natural potential methods. Depth imaging methods for HEM data had progressed and at the time this survey was done, there was greater flexibility and resolu-tion. The karstic bedrock produced similar types of electrical signatures as the survey at Oak Ridge. The interpreted resistivity depth sections from the HEM survey agreed well with other geophysical data and with the borehole data and provided significantly greater aerial coverage. An important characteristic of the geo-logic setting of Camp Crowder is the 5 to 50 meter thick McDowell Residuum that provides an important ground water storage and pathway to the karstic bedrock. The high frequency HEM apparent resistivity data maps the colluvium and residuum. The residuum thickness can be interpreted in detail from the HEM resis-tivity depth sections and shows subsurface bedrock topographic karstic features that are important in migra-tion of shallow ground water. These near surface pathways interpreted from the HEM data help explain some of the complex results of tracer studies.
Based in part on the success of these surveys, a HEM survey was flown (2002) over the Seco Creek area in the Cretaceous Edwards Aquifer in Central Texas (Smith and others, 2003a,b). The HEM system used here was similar to that used at Camp Crowder with a frequency range from 400 to 115,000 Hz for horizontal co-planer coils. This survey successfully mapped structure, stratigraphy, and karst features within the recharge zone of exposed Edwards limestone, the artesian zone where the Edwards is buried by younger sediments, and the capture zone of older Glen Rose limestone. In this geologic setting the highest frequency is a direct reflection of bedrock geology because there is little development of a residuum or Qua-ternary alluvial deposits. The HEM data has mapped much more structure than the previously mapped geol-ogy confirming the importance of structural features in this karst setting. Computation of electrical

18
resistivity depth sections had progressed even from the time of the Camp Crowder survey. In addition the calibration and noise levels of the HEM system had improved. Different inversion schemes for the HEM data were evaluated to compute resistivity depth sections along flight lines (Smith and others, 2003a). Due to the improvements in the airborne geophysical system, the HEM data could be used in three-dimensional imaging of geology (Pantea and others, 2005) and karst features (Smith and others, 2004). A more recent survey in N. Bexar County of Texas (Smith and others 2005) has demonstrated applications to mapping karst features in the Glen Rose Limestones of the Trinity Aquifer.
The final example of mapping karst features is from a survey in the Canada over Silurian limestones (Hodges, 2004). The objective of this survey was to map the thickness of glacial overburden in the area of a known sinkhole in order to determine if other significant sinkholes existed in the area. These survey data were used to develop and refine automatic inversion of the HEM data to interpret overburden depth maps. In particular, seismic lines and drill hole data was used to constrain starting models. Seismic data was used to map the depth of overburden in the sinkhole because the 150-meter thickness of the conductive overbur-den was too great to be resolved by the HEM data. However, elsewhere, the constrained inversion provided realistic depth estimates for the overburden. A paleo-channel was mapped in one corner of the survey area but no other major sinkholes where found.
Helicopter electromagnetic surveys have proven to be cost effective and efficient in mapping large areas of karstic terrain that often are inaccessible. Though the surveys have not identified specific cave sys-tems or other voids, they have identified structure, stratigraphy, and other features such as dolines that can be important in the control of groundwater flow paths.
SELECTED REFERENCES
Doll, W.E, Nyquist, J.E., Beard, L.P., and Gamey, T.J., 2000, Airborne Geophysical Surveying for Hazardous Waste Site Characterization on the Oak Ridge Reservation, Tennessee: Geophysics, vol. 65, no. 5., p 1372-1387.
Nyquist J.E. and Beard, L.P., 1999, Clean Enough for Industry? An Airborne Geophysical Case Study: Symposium on the Application of Geophysics to Environmental and Engineering Problems.
Gamey, T.J., Thompson, M., Mandell, W., Frano, G., Miller, S., 2000, Karst Pathway Delineation using Combined Spatial and Geophysical Analysis at Camp Crowder, Missouri,: Symposium on the Application of Geophysics to Environmental and Engineering Problems 12 p.
Hodges, G., 2004, Practical Inversions for Helicopter Electromagnetic Data: Airborne Geophysical Methods Work-shop, Symposium on the Application of Geophysics to Environmental and Engineering Problems, p. 45 - 58.
Pantea, M.P., Cole, J.C., Smith, B.D., and Deszcz-Pan, M., 2005, Structural and stratigraphic 3-D modeling of the Edwards Aquifer, Medina County, Texas, using helicopter EM survey data to evaluate and extrapolate geologic mapping and drillhole data, these proceedings.
Smith, B.D., Irvine, R., Blome, C.D., Clark, A.K., and Smith, D.V., 2003a, Preliminary Results, Helicopter Electro-magnetic and Magnetic Survey of the Seco Creek Area, Medina and Uvalde Counties, Texas: Proceedings for the Symposium on the Application of Geophysics to Environmental and Engineering Problems, San Antonio, Texas, 15 p.
Smith, B.D., Smith, D.V., Hill, P.L., and Labson, V.F., 2003b, Helicopter electromagnetic and magnetic survey data and maps, Seco Creek Area, Medina and Uvalde counties, Texas: U.S. Geological Survey Open-File Report 03-226, 43 p.

19
Smith, B.D. Cain, M.J., Clark, A.K.,. Moore, D.W., Faith, J. R., and Hill, P. L., 2005, Helicopter Electromagnetic and Magnetic Survey Data and Maps, Northern Bexar County, Texas: U.S. Geological Survey Open-File Report 05-1158, 83 p.
20
Overview of Karst Effects and Karst Detection in Seismic Data from the Oak Ridge Reservation, Tennessee
W. E. Doll1, B. J. Carr2, J. R. Sheehan1 and W. A. Mandell3
1Battelle, 105 Mitchell Rd., Suite 103, Oak Ridge, TN 37830 2Geophex, 605 Mercury Street, Raleigh, NC 27603 3 U.S. Army Environmental Center, 5179 Hoadley Rd, Aberdeen, MD 21010
ABSTRACT
The Oak Ridge Reservation (ORR), Tennessee has an abundance of karst features, including sinkholes, voids, and epikarstal features. In addition to non-seismic investigations, several seismic surveys, primarily seismic reflection and refraction, were conducted on the ORR between 1992 and 2005. In some cases, karst was the target of the seismic investigations, but in others, karst had detrimental effects on data acquired for other applications. In this paper, we sum-marize the results of these surveys as well as the modeling that we conducted to understand these results, and present our observations on the strengths and limitations of seismic methods for karst investigations.
OAK RIDGE RESERVATION KARST
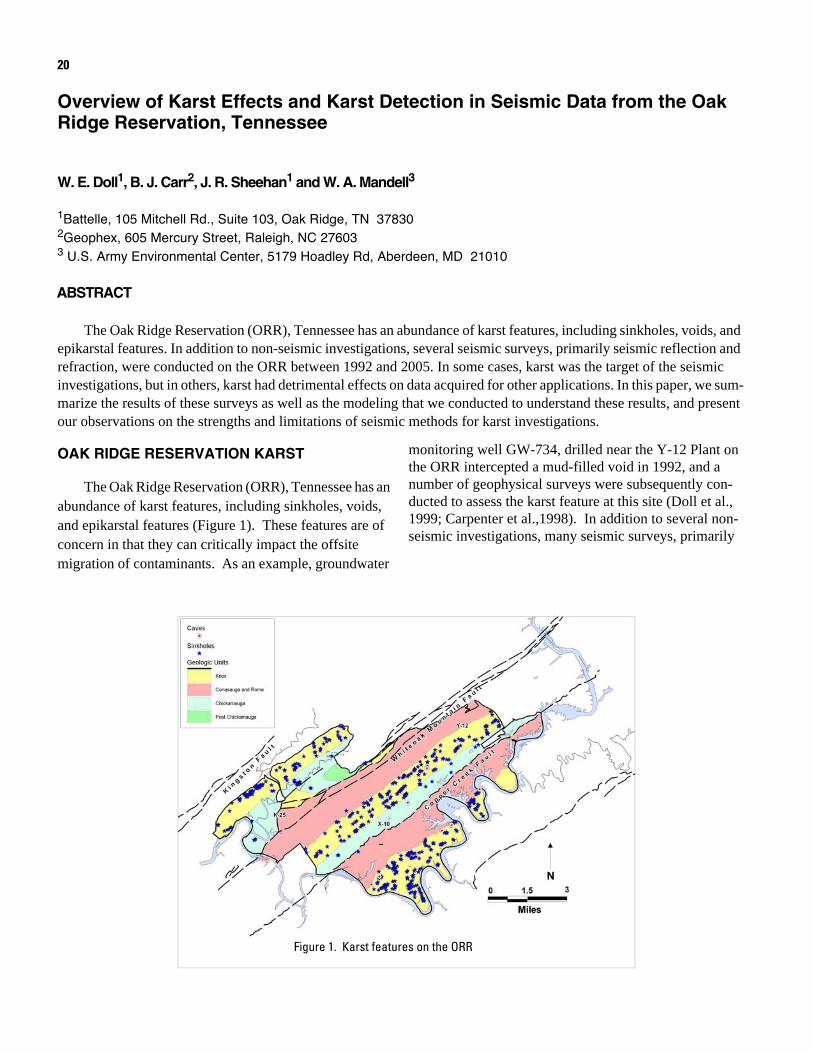
The Oak Ridge Reservation (ORR), Tennessee has an abundance of karst features, including sinkholes, voids, and epikarstal features (Figure 1). These features are of concern in that they can critically impact the offsite migration of contaminants. As an example, groundwater
monitoring well GW-734, drilled near the Y-12 Plant on the ORR intercepted a mud-filled void in 1992, and a number of geophysical surveys were subsequently con-ducted to assess the karst feature at this site (Doll et al., 1999; Carpenter et al.,1998). In addition to several non-seismic investigations, many seismic surveys, primarily
Figure 1. Karst features on the ORR

Figure 1. Locations of seismic reflection and refraction lines on the ORR.
seismic reflection and refraction, were conducted on the ORR between 1991 and 2005 (Figure 2). Seis-mic refraction surveys were conducted for depth to bedrock measurements (e.g. at the proposed Advanced Neutron Source ANS site, Nyquist et al., 1996), and sinkhole imaging. Seismic reflection surveys were conducted primarily for mapping structures that control contaminant transport in the vicinity of high-level waste sites (e.g. Doll et al.,
1998; Doll, 1998; Carr et al., 1997; Liu and Doll, 1997). The results were used for selection of groundwater monitoring well locations. In some cases (e.g. Doll et al., 1999; Carpenter et al., 1998; Sheehan et al., 2005), karst was the target of the seis-mic investigations, but in the seismic reflection stud-ies and many of the refraction studies, karst had detrimental effects on data acquired for other appli-cations.
Figure 3. Karst effects in seismic reflection stacked section, Line M, ETTP data group, ORR.
Thrust Fault

KARST IN SEISMIC REFLECTION DATA
Seismic reflection data can yield indicators of karst, but infrequently provides a satisfactory degree of imaging. Figure 3 shows a portion of ETTP seis-mic reflection line M, a north-south line which is oriented perpendicular to strike from the northern portion of the ORR. The data were acquired with an IVI Minivib source, sweeping 20-200 Hz with 96 recording channels for a 0.55s section, as described in Liu et al., 1997. A known sinkhole causes disrup-tion of shallow reflections, as shown. Other disrup-tions of shallow reflections may be associated with sinkholes that are presently unknown. At other sites, shallow karst completely obliterates deeper reflec-tions. At the Bear Creek Burial Grounds (Figure 4; Doll, 1998), data were acquired along two south-dipping strike-parallel lines using the KGS Auger-gun 8-guage source and 48 receiving channels. The data in the northern line (BCV Line 1) were acquired
in the Nolichucky Formation, an interbedded shale and limestone unit that is not prone to karstification. The southern line (BCV Line 3) occurs in the May-nardville Formation, a limestone unit that is fre-quently karst-bearing on the ORR. The stacked section for Line 1 (figure 5) is a very nice image of the underlying structure of the site. On Line 3a (Fig-ure 6), only a few reflections can be recognized in a largely diffuse image. Seismic Lines 3b and 3c do not display any reflections. Thus the shallow karst on Line 3 prevents acquisition of useable reflection data. In none of the stacked sections described above is it possible to determine the size or shape of the karst features or to even state conclusively that karst is responsible for the absence of reflections. Other authors have reported downward deflection of reflections, weak amplitudes or lack of laterally coherent reflections as indicators of karst (e.g. Branham and Steeples, 1988; Steeples and Miller, 1987).
Figure 4. Map view of the lines that comprise the Bear Creek Valley data group
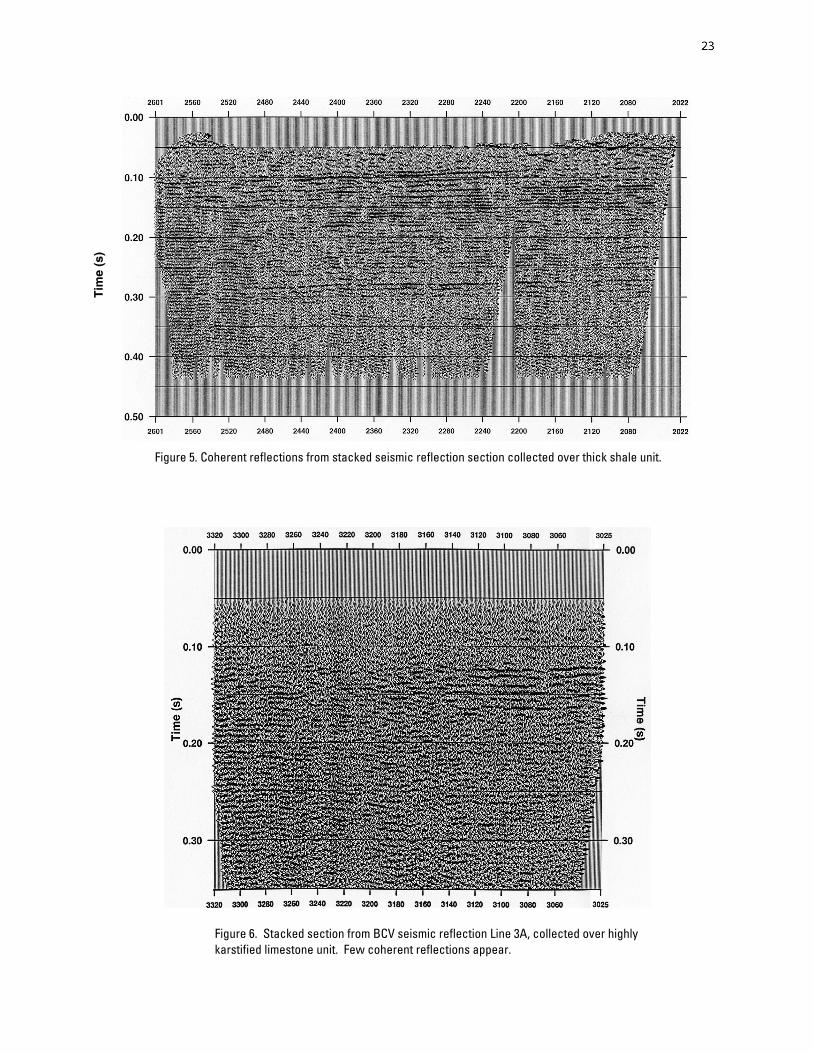
Figure 6. Stacked section from BCV seismic reflection Line 3A, collected over highly karstified limestone unit. Few coherent reflections appear.
Figure 5. Coherent reflections from stacked seismic reflection section collected over thick shale unit.
Tim
e (s
)
Karst Effects on Shot Gathers in Seismic Reflection Data
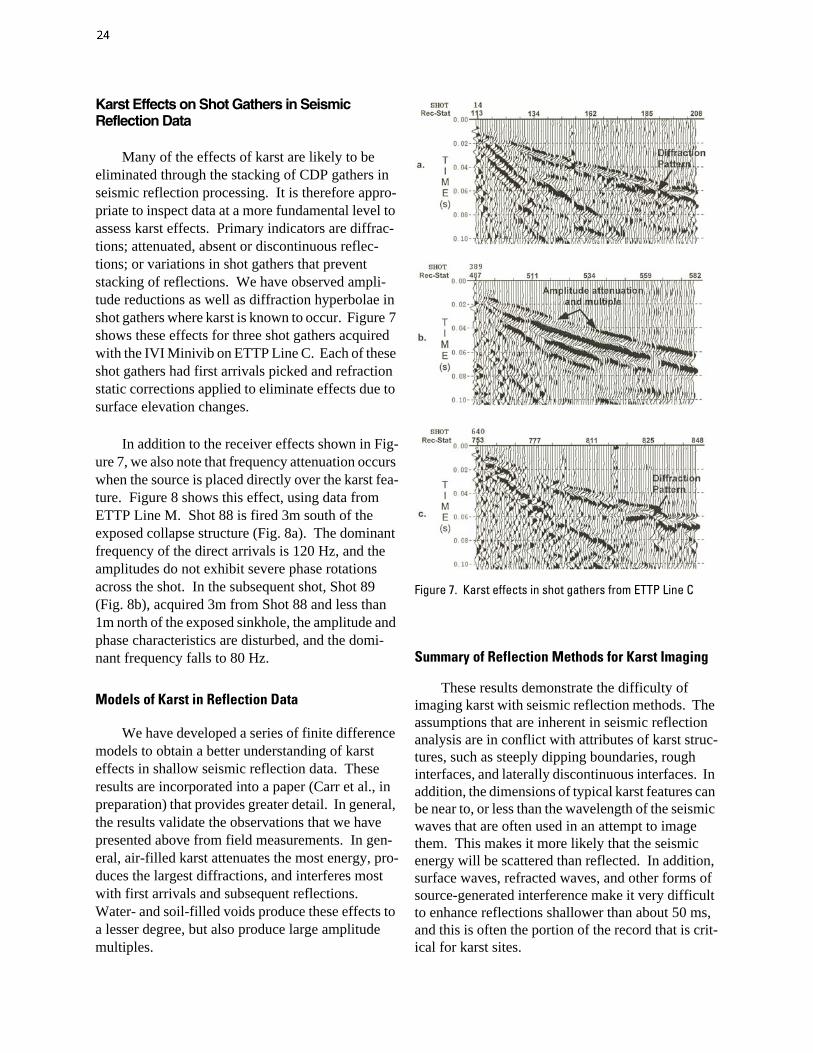
Many of the effects of karst are likely to be eliminated through the stacking of CDP gathers in seismic reflection processing. It is therefore appro-priate to inspect data at a more fundamental level to assess karst effects. Primary indicators are diffrac-tions; attenuated, absent or discontinuous reflec-tions; or variations in shot gathers that prevent stacking of reflections. We have observed ampli-tude reductions as well as diffraction hyperbolae in shot gathers where karst is known to occur. Figure 7 shows these effects for three shot gathers acquired with the IVI Minivib on ETTP Line C. Each of these shot gathers had first arrivals picked and refraction static corrections applied to eliminate effects due to surface elevation changes.
In addition to the receiver effects shown in Fig-ure 7, we also note that frequency attenuation occurs when the source is placed directly over the karst fea-ture. Figure 8 shows this effect, using data from ETTP Line M. Shot 88 is fired 3m south of the exposed collapse structure (Fig. 8a). The dominant frequency of the direct arrivals is 120 Hz, and the amplitudes do not exhibit severe phase rotations across the shot. In the subsequent shot, Shot 89 (Fig. 8b), acquired 3m from Shot 88 and less than 1m north of the exposed sinkhole, the amplitude and phase characteristics are disturbed, and the domi-nant frequency falls to 80 Hz.
Models of Karst in Reflection Data
We have developed a series of finite difference models to obtain a better understanding of karst effects in shallow seismic reflection data. These results are incorporated into a paper (Carr et al., in preparation) that provides greater detail. In general, the results validate the observations that we have presented above from field measurements. In gen-eral, air-filled karst attenuates the most energy, pro-duces the largest diffractions, and interferes most with first arrivals and subsequent reflections. Water- and soil-filled voids produce these effects to a lesser degree, but also produce large amplitude multiples.
Summary of Reflection Methods for Karst Imaging
These results demonstrate the difficulty of imaging karst with seismic reflection methods. The assumptions that are inherent in seismic reflection analysis are in conflict with attributes of karst struc-tures, such as steeply dipping boundaries, rough interfaces, and laterally discontinuous interfaces. In addition, the dimensions of typical karst features can be near to, or less than the wavelength of the seismic waves that are often used in an attempt to image them. This makes it more likely that the seismic energy will be scattered than reflected. In addition, surface waves, refracted waves, and other forms of source-generated interference make it very difficult to enhance reflections shallower than about 50 ms, and this is often the portion of the record that is crit-ical for karst sites.
Figure 7. Karst effects in shot gathers from ETTP Line C
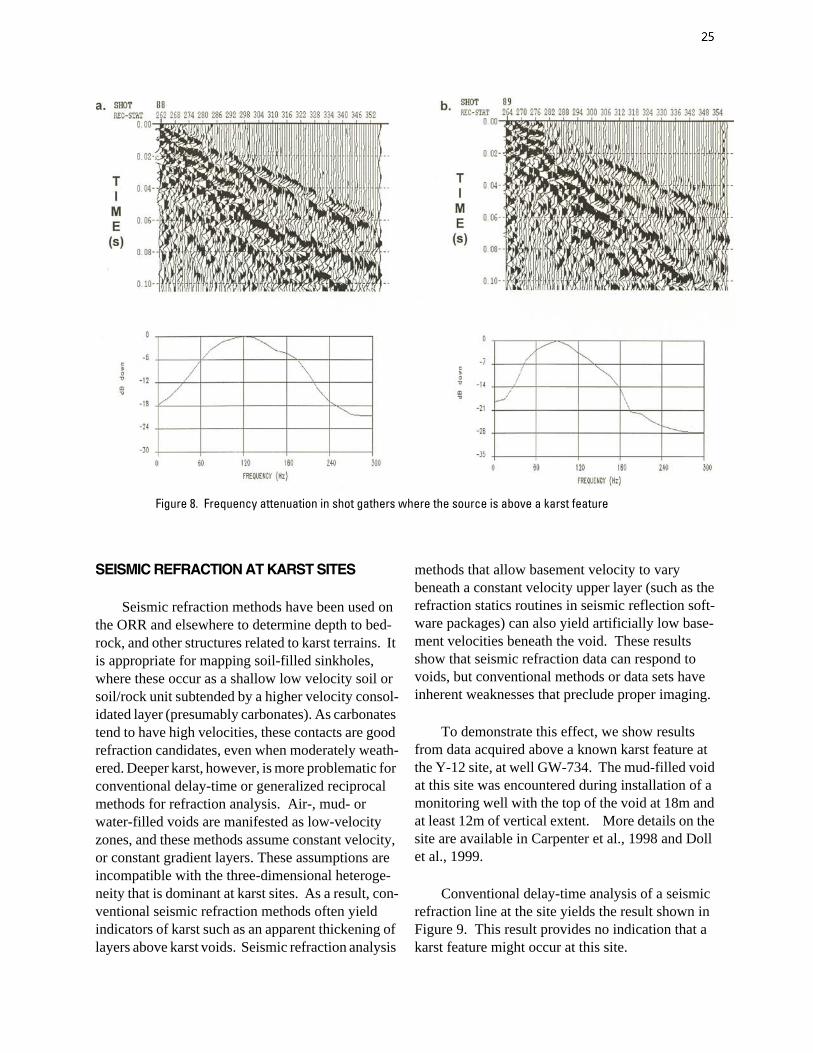
Figure 8. Frequency attenuation in shot gathers where the source is above a karst feature
SEISMIC REFRACTION AT KARST SITES
Seismic refraction methods have been used on the ORR and elsewhere to determine depth to bed-rock, and other structures related to karst terrains. It is appropriate for mapping soil-filled sinkholes, where these occur as a shallow low velocity soil or soil/rock unit subtended by a higher velocity consol-idated layer (presumably carbonates). As carbonates tend to have high velocities, these contacts are good refraction candidates, even when moderately weath-ered. Deeper karst, however, is more problematic for conventional delay-time or generalized reciprocal methods for refraction analysis. Air-, mud- or water-filled voids are manifested as low-velocity zones, and these methods assume constant velocity, or constant gradient layers. These assumptions are incompatible with the three-dimensional heteroge-neity that is dominant at karst sites. As a result, con-ventional seismic refraction methods often yield indicators of karst such as an apparent thickening of layers above karst voids. Seismic refraction analysis
methods that allow basement velocity to vary beneath a constant velocity upper layer (such as the refraction statics routines in seismic reflection soft-ware packages) can also yield artificially low base-ment velocities beneath the void. These results show that seismic refraction data can respond to voids, but conventional methods or data sets have inherent weaknesses that preclude proper imaging.
To demonstrate this effect, we show results from data acquired above a known karst feature at the Y-12 site, at well GW-734. The mud-filled void at this site was encountered during installation of a monitoring well with the top of the void at 18m and at least 12m of vertical extent. More details on the site are available in Carpenter et al., 1998 and Doll et al., 1999.
Conventional delay-time analysis of a seismic refraction line at the site yields the result shown in Figure 9. This result provides no indication that a karst feature might occur at this site.
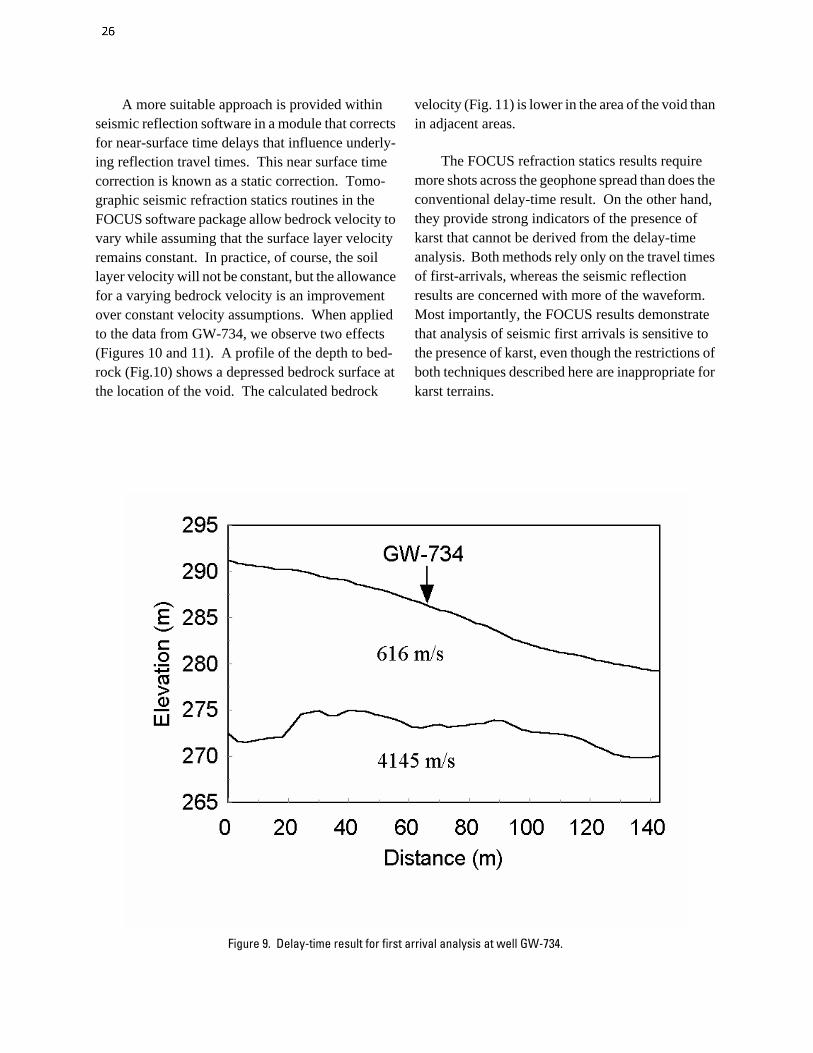
A more suitable approach is provided within seismic reflection software in a module that corrects for near-surface time delays that influence underly-ing reflection travel times. This near surface time correction is known as a static correction. Tomo-graphic seismic refraction statics routines in the FOCUS software package allow bedrock velocity to vary while assuming that the surface layer velocity remains constant. In practice, of course, the soil layer velocity will not be constant, but the allowance for a varying bedrock velocity is an improvement over constant velocity assumptions. When applied to the data from GW-734, we observe two effects (Figures 10 and 11). A profile of the depth to bed-rock (Fig.10) shows a depressed bedrock surface at the location of the void. The calculated bedrock
velocity (Fig. 11) is lower in the area of the void than in adjacent areas.
The FOCUS refraction statics results require more shots across the geophone spread than does the conventional delay-time result. On the other hand, they provide strong indicators of the presence of karst that cannot be derived from the delay-time analysis. Both methods rely only on the travel times of first-arrivals, whereas the seismic reflection results are concerned with more of the waveform. Most importantly, the FOCUS results demonstrate that analysis of seismic first arrivals is sensitive to the presence of karst, even though the restrictions of both techniques described here are inappropriate for karst terrains.
Figure 9. Delay-time result for first arrival analysis at well GW-734.
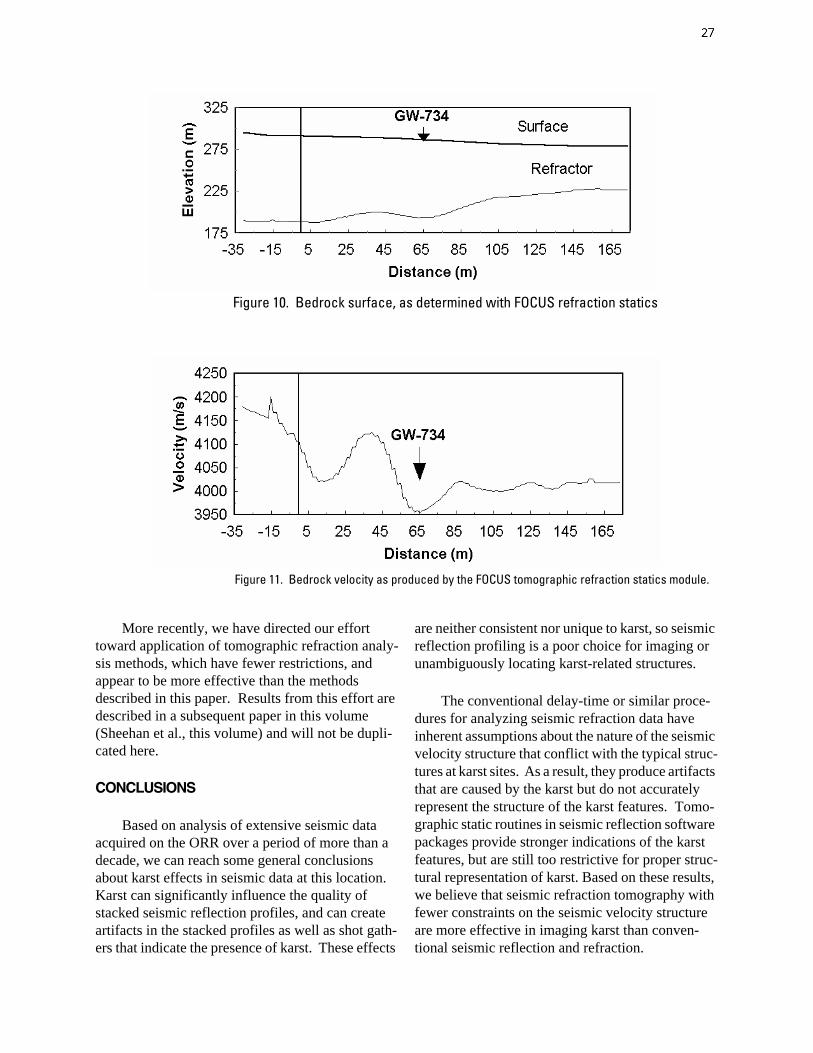
Figure 10. Bedrock surface, as determined with FOCUS refraction statics
Figure 11. Bedrock velocity as produced by the FOCUS tomographic refraction statics module.
More recently, we have directed our effort toward application of tomographic refraction analy-sis methods, which have fewer restrictions, and appear to be more effective than the methods described in this paper. Results from this effort are described in a subsequent paper in this volume (Sheehan et al., this volume) and will not be dupli-cated here.
CONCLUSIONS
Based on analysis of extensive seismic data acquired on the ORR over a period of more than a decade, we can reach some general conclusions about karst effects in seismic data at this location. Karst can significantly influence the quality of stacked seismic reflection profiles, and can create artifacts in the stacked profiles as well as shot gath-ers that indicate the presence of karst. These effects
are neither consistent nor unique to karst, so seismic reflection profiling is a poor choice for imaging or unambiguously locating karst-related structures.
The conventional delay-time or similar proce-dures for analyzing seismic refraction data have inherent assumptions about the nature of the seismic velocity structure that conflict with the typical struc-tures at karst sites. As a result, they produce artifacts that are caused by the karst but do not accurately represent the structure of the karst features. Tomo-graphic static routines in seismic reflection software packages provide stronger indications of the karst features, but are still too restrictive for proper struc-tural representation of karst. Based on these results, we believe that seismic refraction tomography with fewer constraints on the seismic velocity structure are more effective in imaging karst than conven-tional seismic reflection and refraction.
Here, we have dealt exclusively with methods that involve primary body waves (P-waves) in this analysis. We have not discussed shear wave meth-ods, or surface wave approaches s such as multi-channel analysis of surface waves (Park et al., 1999), that may also be suitable to karst sites. We have had mixed success with these methods on the ORR, and believe that they merit further study.
ACKNOWLEDGEMENTS
We thank Rick Miller and the Kansas Geologi-cal Survey for acquiring the seismic reflection data that we subsequently processed and discuss in this paper. We thank David Watson (ORNL) for provid-ing the karst map in Figure 1.
REFERENCES
Branham, K. L., and D. W. Steeples, 1998, Cavity detec-tion using high-resolution seismic reflection methods. Mining Engineering, 115-119.
Carpenter, P. J., W. E. Doll, and R. D. Kaufmann, 1998, Geophysical character of buried sinkholes on the Oak Ridge Reservation, Tennessee, , Jour. Environmental and Engineering Geophysics, v. 3, p. 133-146.
Carr, B. J., W. E. Doll, and R. D. Miller, 1997, Near-sur-face seismic imaging and reflectivity studies of the Melton Valley waste areas, Oak Ridge Reservation, , Expanded Abstracts, 1997 Soc. Expl. Geophy. Annual Meeting, p. 772-775.
Carr, B. J., W. E. Doll, and R. Bainer, in preparation, Seismic detection of shallow karst on the Oak Ridge Reservation.
Doll, W. E., R. D. Miller, and J. Xia, 1998, A non-inva-sive shallow seismic source comparison on the Oak Ridge Reservation, Tennessee Geophysics, v. 63, n. 4, p. 1318-1331.
Doll, W. E., Reprocessing of shallow seismic reflection data to image faults near a hazardous waste site on the Oak Ridge Reservation, Tennessee, Proceedings of the
1998 Symposium on the Application of Geophysics to Engineering and Environmental Problems, March 22-26, 1998, Chicago, IL, p. 705-714.
Doll, W. E., J. E. Nyquist, P. J. Carpenter, R. D. Kauf-mann, and B. J. Carr, 1999, Geophysical surveys of a known karst feature: Oak Ridge Y-12 Plant, Oak Ridge, Tennessee, in Geo-engineering for under-ground facilities, ASCE Geotechnical Special Publica-tion No. 90, G. Fernandez and R. Bauer, ed., p. 684-694.
Liu, Z. and W. E. Doll, 1997, Seismic reflection process-ing for characterization of a hazardous waste site, Pro-ceedings of the 1997 Symposium on the Application of Geophysics to Engineering and Environmental Prob-lems, p. 291-299.
Nyquist, J.E., W.E. Doll, R.K. Davis, and R.A. Hopkins, 1996, Cokriging surface topography and seismic refraction data for bedrock topography, Jour. Environ-mental and Engineering Geophysics, v. 1, n. 1, p. 67-74.
Park, C.B., R.D. Miller, and J. Xia, 1999 Multichannel analysis of surface waves, Geophysics, 64, 800-808
Sheehan, J. R., W. E. Doll, D. B. Watson, and W. A. Man-dell, this volume, Detecting cavities with seismic refraction tomography, 12pp.
Sheehan, J. R., W. E. Doll, D. B. Watson, and W. A. Man-dell, 2005, Detecting cavities wit seismic refraction tomography: Can it be done?, Proceedings of the 2005 Symposium on the Application of Geophysics to Engi-neering and Environmental Problems, p. 989-1003.
Steeples, D. W., and R. D. Miller, 1987, Direct detection of shallow subsurface voids using high-resolution seis-mic-reflection techniques; in Beck, B. F. Wilson, W. L., and Balkema, A. A., Eds., Karst Hydrogeology; Engineering and Environmental Applications, 179-183.
29
Application of Seismic Refraction Tomography to Karst Cavities
Jacob R. Sheehan1, William E. Doll1, David B. Watson2, Wayne A. Mandell31Battelle, 105 Mitchell Rd, Suite 103, Oak Ridge, TN 378302Oak Ridge National Laboratory, 1 Bethel Valley Rd, Oak Ridge, TN 378313 U.S. Army Environmental Center, 5179 Hoadley Rd, Aberdeen, MD 21010
ABSTRACT
For three years we have used synthetic and field data to investigate the effectiveness of commercial refraction tomography codes on both simple and complex subsurface velocity structures, with the ultimate goal of determining the suitability of the method for karst problems. The results of these studies indicate that refraction tomography is able to resolve karst features under some conditions. The analysis of field data acquired on the Oak Ridge Reservation, TN shows low velocity zones on three parallel seismic lines. These zones are located at similar depths and fall on a line that is parallel to geologic strike, leading to an interpre-tation of a possible karst conduit. This feature has velocities of about 1500-2000 m/s in a matrix of 3000-4000 m/s, reasonable velocities for a mud filled void in saprolite at these depths. Drilling of this feature is anticipated in the near future. Analysis of a seismic line taken over the known mud-filled cavity shows a low velocity feature with a location consistent with drilling results. The velocity of the feature is about 1000 m/s, a value that is a little lower than that found for the features discussed above. Synthetic modeling some-times generates results similar to the field results, but often fails to image cavities as well, or at all. Ongoing investigations are aimed at refining our understanding of the circumstances where these methods can be suc-cessful, and investigating the relevance of model results to actual field conditions.
INTRODUCTION
Oak Ridge National Laboratory and Battelle have been working with the United States Army Environmental Center to assess the performance of seismic refraction tomography (SRT) for karst ter-rains (Sheehan et al, 2005a, Sheehan et al, 2004, Sheehan et al, 2003). These terrains frequently con-tain sinkholes, irregular and gradational bedrock interfaces, remnants of high velocity bedrock above these interfaces, deeply weathered fractures, and voids that may be air-, water-, or mud-filled.
The seismic velocity of unconsolidated sedi-ments and voids associated with karst features usu-ally differs significantly from carbonate parent rock, making seismic methods a possible tool for mapping such features. In this paper, we are concerned with detection of karst voids, and will not be concerned with depressions, pinnacles, grikes, or other karst morphologic features (Carpenter et al, 1998).
Many seismic methods have been applied to karst problems, but few have been successful.
Some success has been attained in detecting sink-holes, or other structural features that lie above voids, but it has proven difficult to image or detect cavities with seismic methods. Conventional seis-mic refraction methods (e.g. delay-time or general-ized reciprocal) in particular fall short because air- water- or mud-filled voids occur as velocity lows, and these are largely incompatible with the constant velocity layered models that these methods require (Doll et. al, 1999).
Our first step in evaluating the effectiveness of SRT for karst detection was to use synthetic travel-times generated from 2-D models using the refrac-tion tomography code GeoCT-II (version 2.3) (GeoTomo, LLC). The synthetic models allow us to have a “reference” model with which to compare the results generated by SRT using another refraction tomography code, Rayfract™ (version 2.51, Intelli-gent Resources Inc.).
No synthetic model will ever be a completely accurate depiction of the real subsurface. Models are comprised of discrete units, which are further
30
broken down into small constant velocity grid cells. This means that however carefully constructed and applied, numerical analysis is based upon simplified and digitized representations of physical laws and models. In addition, most commercially available numerical modeling packages are based on two dimensional models. Three dimensional numerical analysis is in development, but is currently too com-putationally-intensive to be practical for most appli-cations.
Field testing complements the models by pro-viding realistic parameters and a basis for determin-ing model validity. For this we used five refraction tomography profiles collected in support of the Nat-ural and Accelerated Bioremediation Research (NABIR) Field Research Center (FRC). NABIR is a DOE sponsored research program to develop and evaluate bioremediation tools for contaminated sites. Liquid wastes containing nitrate, uranium, technetium, tetrachloroethylene, and other contami-nants were disposed of in sludge ponds until the mid-1980s, at which time the ponds were remedi-ated and capped with a parking lot. A large contam-ination plume within the underlying unconsolidated saprolite and inter-bedded shale and carbonate bed-rock is now spreading away from the site of the old ponds.
CONVENTIONAL AND TOMOGRAPHIC REFRACTION TOMOGRAPHY
Conventional refraction inversion methods use a “layer cake” approach. The subsurface is divided into a number of continuous constant velocity layers with velocities and thicknesses that are varied through interactive forward modeling in an effort to match the traveltimes that are determined from the field data. These methods require that sections of the traveltime curves be mapped to refractors, a task that can be difficult at best in karst situations. The pres-ence of karst features means that there can be large and sudden changes in the shape of the bedrock. There can also be localized features such as voids that contradict the assumption of continuous con-stant velocity layers.
Unlike conventional refraction methods, SRT does not require that the model be broken into
constant velocity continuous layers. Instead the model is made up of a high number of small constant velocity grid cells or nodes. Inversion is performed by an automated procedure which involves raytrac-ing through an initial model and comparing the mod-eled traveltimes to the field data, and adjusting the model grid-by grid in order to match the modeled traveltimes to the field data. This process is itera-tively repeated until a preset number of iterations as been reached. Because there is no assumption of continuous constant velocity layers, SRT can model localized velocity anomalies.
RESULTS
Synthetic
Synthetic models were used to test various properties, limitations and capabilities of SRT for cavity detection. A sample of the models that have been studied and the inversion results are shown in Figure 1. The most basic requirement for detecting a cavity is to have adequate ray coverage in the area surrounding it. Both survey geometry and the veloc-ity structure affect the ray coverage. As the effect of geometry is well-understood, we will focus on the effect of the velocity structure.
In order to be able to image a cavity success-fully, there must be rays that penetrate deeper than the cavity and can be refracted back to the surface. One factor that can limit the depth of penetration is the presence of sharp high-contrast velocity bound-aries. These boundaries cause most of the seismic energy to be reflected back to the surface. The energy that passes through the transition is refracted to shallow angles, limiting the depth of penetration within the area below the transition.
Even if energy does penetrate to adequate depths to image a cavity, it must have a path back to the surface in order to be detected. Seismic rays can return to the surface if there is a change in velocity under the cavity. This can be in the form of a verti-cal velocity gradient. Normally, velocities will increase slightly with depth in sedimentary rocks, so in a karst investigation this requisite can be easily met.

31
Ray coverage alone is not enough to insure that the cavity can be detected. Models that are otherwise identical can be created with and without voids to evaluate travel time changes due to the void. We have found cases where the ray coverage around the cavity is extensive, but the first arrival traveltimes generated from the model do not reflect the presence of the cavity, making it impossible for the inversion algorithm to detect the cavity. Even when a cavity has a significant effect on the travel times, the inver-sion may result in a feature with velocities only slightly lower than that of the surrounding volume. This muted response is unlikely to give the user con-fidence that a cavity has actually been detected.
In some cases applying matrix smoothing to the synthetic model before performing raytracing increases the effect of the cavity on the traveltimes, and allows the inverted result to better match the true model. An example of this is shown in Figure 2. In other cases smoothing has no effect at all.
SRT can create false positives as well as false negatives such as in the top result shown in Figure 1. These artifacts have been observed when inverting synthetic data, which does not include the inevitable noise and picking errors and inaccuracies. The inclu-sion of such factors is likely to increase the occur-rence of both false negatives and positives. One way artifacts can sometimes be distinguished from real features is by examining the ray coverage. In the case of a real low-velocity feature, the ray coverage should be nearly zero within the feature. Artifacts are usually caused by an area of low ray coverage, but not as low as is usually the case with a true fea-ture. A good example of this is shown in Figure 3. Figure 3a shows an artifact where indicated. Figure 3b shows the ray coverage for this model. The ray coverage in the vicinity of the cavity is low com-pared to the high coverage area above it that is caused by the increase in velocity. Figure 3c shows a feature that is real. Note that the ray coverage (Fig-ure 3d) is drastically lower in the area of the cavity.
Field Results
Four new refraction tomography profiles (des-ignated by Line A, C, D and E, Figure 4) were acquired in support of research at the NABIR FRC
site (Sheehan et. al, 2005b). Lines A and C are ori-ented parallel to an earlier line (Doll et al., 2002), designated Line B for this paper.
Lines A, D, and E used one-meter receiver spacing and two-meter shot spacing. Line B con-sisted of three collinear lines and combined for anal-ysis. Line C was collected using 2 meter receiver spacing and 4 meter shot spacing. All data were col-lected using a 48 channel Geometrics Strataview seismograph. Ten Hz geophones were used for Lines A, C, D and E and 40 Hz receivers were used for line B.
Lines A, B and C each show a very well-defined (~ 10m wide) low velocity feature (Figure 5). These low velocity features are all similar in size, at the same approximate depth, and fall on a line that is parallel to geologic strike at the field site (Figure 4). There is no such feature in lines D or E, which run roughly parallel to strike and perpendicular to the other three lines.
The ray coverage for Lines A and C are shown in Figure 6. In both cases the area of the low veloc-ity feature has very low ray coverage, just as in the example discussed above and shown in Figure 3. Because of this and the correlation to geologic strike it is reasonable to assume that these low velocity fea-tures are not artifacts, but rather indicate a long con-duit in the carbonate bedrock. This feature yields seismic velocities of approximately 1500-2000 m/s in a matrix of 3000-4000 m/s. The apparent cavity is below the water table so it cannot be air-filled, but its velocity is so low that we must surmise that it is water- or mud-filled.
Mud-filled Cavity
We examined a refraction tomography line taken over a known mud-filled cavity centered on a well designated GW-734 investigated by Doll et al., 1999 and described in Doll et al., this volume. In the previous work at this site various geophysical meth-ods were utilized in an effort to characterize a known mud-filled cavity. One of the methods used was con-ventional delay-time refraction analysis. The seis-mic analysis provided a bedrock profile that
32
matched the drilling logs, but was unable to image the cavity.
During installation of well GW-734, drillers encountered the cavity starting at a depth of 18 meters, and extending to at least 30 meters. Conven-tional refraction analysis at this site failed to show the cavity (Figure 7). The SRT result for the line shows a low velocity feature with a location consis-tent with the drilling results (Figure 8). The velocity of the feature is about 1000 m/s. The velocity of the surrounding area is about 2750 m/s, which is consis-tent with measured velocities for fractured and weathered carbonate at this locale.
CONCLUSIONSOur assessment of synthetic models for deter-
mining the capabilities and limitations of seismic refraction for cavity detection has had mixed results. Usually the cavity will be represented in the inver-sion result, but the velocity will not be as low as it should be. At other times the cavity is not detected at all. In one case applying matrix smoothing to the model before generating the synthetic data allowed the cavity to be detected when it was previously undetectable. However, smoothing other models did not have such a positive effect, demonstrating the complexity of synthetic modeling and analysis.
Analysis of field data suggests that SRT is capa-ble of imaging cavities. Four seismic lines from two separate sites on the Oak Ridge Reservation show possible and known cavities. At the FRC a low velocity feature occurs at a consistent depth and fall-ing along a line parallel to geologic strike. Another seismic line was collected over a cavity that had been found by drilling. The drilling found that the top of the cavity is at a depth of about 18 meters and the bottom was at 30 meters or deeper. The SRT result shows a low velocity feature at a depth that is consistent with the drilling results.
SRT has the potential to be an effective tool for studies where the presence of cavities needs to be detected. It is not a fail-proof method, however. False positives and negatives are possible.
Future Work
We hope to build a physical scaled model in order to further evaluate the effectiveness of refrac-tion tomography and to improve synthetic modeling procedures. This will allow controlled acquisition of data from a known three-dimensional model while avoiding many of the limitations of computer models. To the extent that a model is an accurate representation of the problem of interest, data collected using a physical model will more reliably replicate the physical response without errors asso-ciated with discretizing the properties of a model. In addition, a physical model, as long as it is large enough, will include 3-D effects.
Comparison of the traveltimes generated from digital and physical versions of the same model should greatly improve our understanding of the behavior of digital computer models. This would in turn allow more effective use of computer models for all types of geologic settings.
REFERENCES
Carpenter, P. J., W. E. Doll, and R. D. Kaufmann, 1998 Geophysical character of buried sinkholes on the Oak Ridge Reservation, Tennessee, Jour. Environmental and Engineering Geophysics, v. 3, p. 133-146.
Doll, W.E., J. E. Nyquist, P. J. Carpenter, R. D. Kauf-mann and B. J. Carr, 1998 Geophysical Surveys of a Known Karst Feature, Oak Ridge Y-12 Plant, Oak Ridge, Tennessee, Jour. Environmental and Engineer-ing Geophysics, v. 3, p. 133-146, 1998
Doll, W.E., J.E. Nyquist, P.J. Carpenter, R.D. Kaufmann, and B.J. Carr, 1999, Geophysical surveys of a known karst feature: Oak Ridge Y-12 Plant, Oak Ridge, Ten-nessee, in Geo-engineering for underground facilities, ASCE Geotechnical Special Publication No. 90, G. Fernandez and R. Bauer, ed., p. 684-694.
Doll, W.E., T.J. Gamey, D.B. Watson, and P.M. Jardine, 2002. Geophysical profiling in support of a nitrate and uranium groundwater remediation study, 2002 Annual Meeting of the Symposium on the Application of Geo-physics to Engineering and Environmental Problems, Las Vegas, NV, February 10-14 2002.

33
Doll, W.E., B.J. Carr, J.R. Sheehan, and W.A. Mandell, this volume, Application of Seismic Refraction Tomography to Karst Cavities
Sheehan, J.R., W. E. Doll, and W. Mandell, 2003. Evalu-ation of refraction tomography codes for near-surface applications. Extended abstract, presented at the 2003 Annual Meeting of the Society of Exploration Geo-physicists, Dallas TX, October 26-31, 2003, 4.
Sheehan, J.R., W. E. Doll and W. Mandell, 2004. Com-parison of MASW and Refraction Tomography. Extended abstract, presented at the 2004 Annual Meeting of the Symposium on the Application of Geo-physics to Engineering and Environmental Problems, Colorado Springs, CO, February 22-26 2004.
Sheehan, J.R., W. E. Doll and W.A. Mandell, 2005a. An Evaluation of Methods and Available Software for Seismic Refraction Tomography Analysis, Jour. Envi-ronmental and Engineering Geophysics, v. 10, p. 21-34, 2005
Sheehan, J.R., W. E. Doll and W.A. Mandell, and D.B. Watson, 2005b. Detecting Cavities with Seismic Refraction Tomography: Can it be done?. Extended abstract, presented at the 2005 Annual Meeting of the Symposium on the Application of Geophysics to Engi-neering and Environmental Problems, Atlanta, GA, April 3-7, 2005.
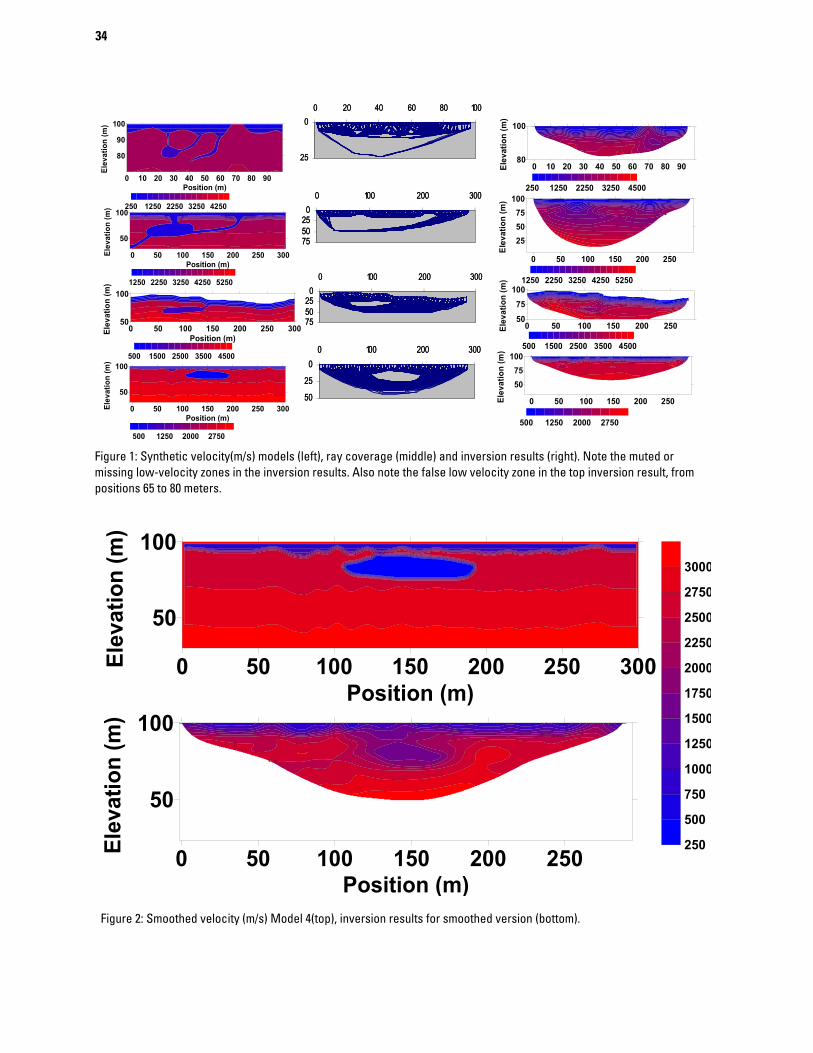
34
Figure 2: Smoothed velocity (m/s) Model 4(top), inversion results for smoothed version (bottom).
0 10 20 30 40 50 60 70 80 9080
100
Elev
atio
n (m
)
0 50 100 150 200 250
255075
100
Elev
atio
n (m
)
0 50 100 150 200 25050
75100
Elev
atio
n (m
)
0 50 100 150 200 250
5075
100
Elev
atio
n (m
)
250 1250 2250 3250 4500
1250 2250 3250 4250 5250
500 1500 2500 3500 4500
500 1250 2000 2750
0 10 20 30 40 50 60 70 80 90Position (m)
80
90
100
Elev
atio
n (m
)
0 50 100 150 200 250 300Position (m)
50
100
Elev
atio
n (m
)
0 50 100 150 200 250 300Position (m)
50
100
Elev
atio
n (m
)
0 50 100 150 200 250 300Position (m)
50
100
Elev
atio
n (m
)
250 1250 2250 3250 4250
1250 2250 3250 4250 5250
500 1500 2500 3500 4500
500 1250 2000 2750
0255075
0 100 200 300
0
25
50
0 100 200 300
0
25
0 20 40 60 80 100
0255075
0 100 200 300
0255075
0 100 200 300
0
25
50
0 100 200 300
0
25
0 20 40 60 80 100
0255075
0 100 200 300
Figure 1: Synthetic velocity(m/s) models (left), ray coverage (middle) and inversion results (right). Note the muted or missing low-velocity zones in the inversion results. Also note the false low velocity zone in the top inversion result, from positions 65 to 80 meters.
0 50 100 150 200 250Position (m)
50
100
Elev
atio
n (m
)
0 50 100 150 200 250 300Position (m)
50
100
Elev
atio
n (m
)
250
500
750
1000
1250
1500
1750
2000
2250
2500
2750
3000

35
0 50 100 150 200 250
Position (m)
50
100
0 50 100 150 200 250
Position (m)
50
100
0 100 200 300 400
0 10 20 30 40 50 60 70 80 90
Position (m)
80
100
Ele
va
tio
n (
m)
0 10 20 30 40 50 60 70 80 90
Position (m)
80
100
Ele
va
tio
n (
m)
0 100 200 300 400 500
500 1500 2500 3500500 1500 2500 3500
Artifact Real
VelocityVelocity
Ray
Density
Ray
Density
0 50 100 150 200 250
Position (m)
50
100
0 50 100 150 200 250
Position (m)
50
100
0 100 200 300 400
0 10 20 30 40 50 60 70 80 90
Position (m)
80
100
Ele
va
tio
n (
m)
0 10 20 30 40 50 60 70 80 90
Position (m)
80
100
Ele
va
tio
n (
m)
0 100 200 300 400 500
500 1500 2500 3500500 1500 2500 3500
Artifact Real
VelocityVelocity
Ray
Density
Ray
Densityc
ba
d
Fi 3 D t ti f th diff i f tif t d l it
9175
9200
9225
9250
9275
9300
9325
15700 15750 15800 15850 15900 15950 16000 16050
Admin. Coord. (m)
Strike
9175
9200
9225
9250
9275
9300
9325
15700 15750 15800 15850 15900 15950 16000 16050
Admin. Coord. (m)
Strike
Figure 3: Demonstration of the difference in ray coverage of an artifact and a real cavity.
Figure 4: Relative locations of 5 seismic refraction tomography lines collected in support of FRC. The sections of lines A, B, and C that are marked white represent the areas where the low velocity feature appears. Note that no such feature appears on Lines D and E. Athough Line E does cross the line containing the three low-velocity features, it does not over-lap it enough to see to the depth of the feature.
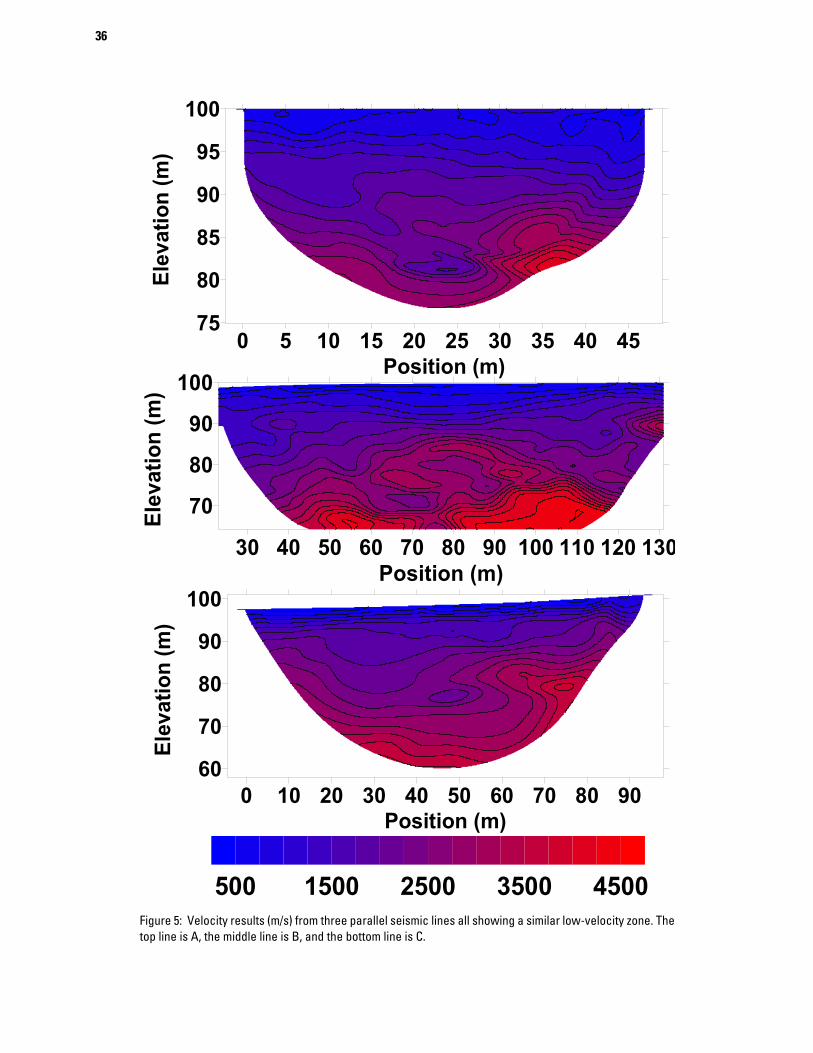
36
0 5 10 15 20 25 30 35 40 45Position (m)
75
80
85
90
95
100
Elev
atio
n (m
)
0 10 20 30 40 50 60 70 80 90Position (m)
60
70
80
90
100
Elev
atio
n (m
)
500 1500 2500 3500 4500
30 40 50 60 70 80 90 100 110 120 130Position (m)
70
80
90
100
Elev
atio
n (m
)
Figure 5: Velocity results (m/s) from three parallel seismic lines all showing a similar low-velocity zone. The top line is A, the middle line is B, and the bottom line is C.

37
0 5 10 15 20 25 30 35 40 45Position (m)
75
80
85
90
95
100El
evat
ion
(m)
0 10 20 30 40 50 60 70 80 90Position (m)
270
280
290
300
Elev
atio
n (m
)
0
50
100
150
200
250
300
350
Figure 6: Ray coverage for FRC lines A (top) and C (bottom). Note the low coverage areas that correspond to the low velocity zones. This is in contrast to the case for the artifact shown in figure 3.
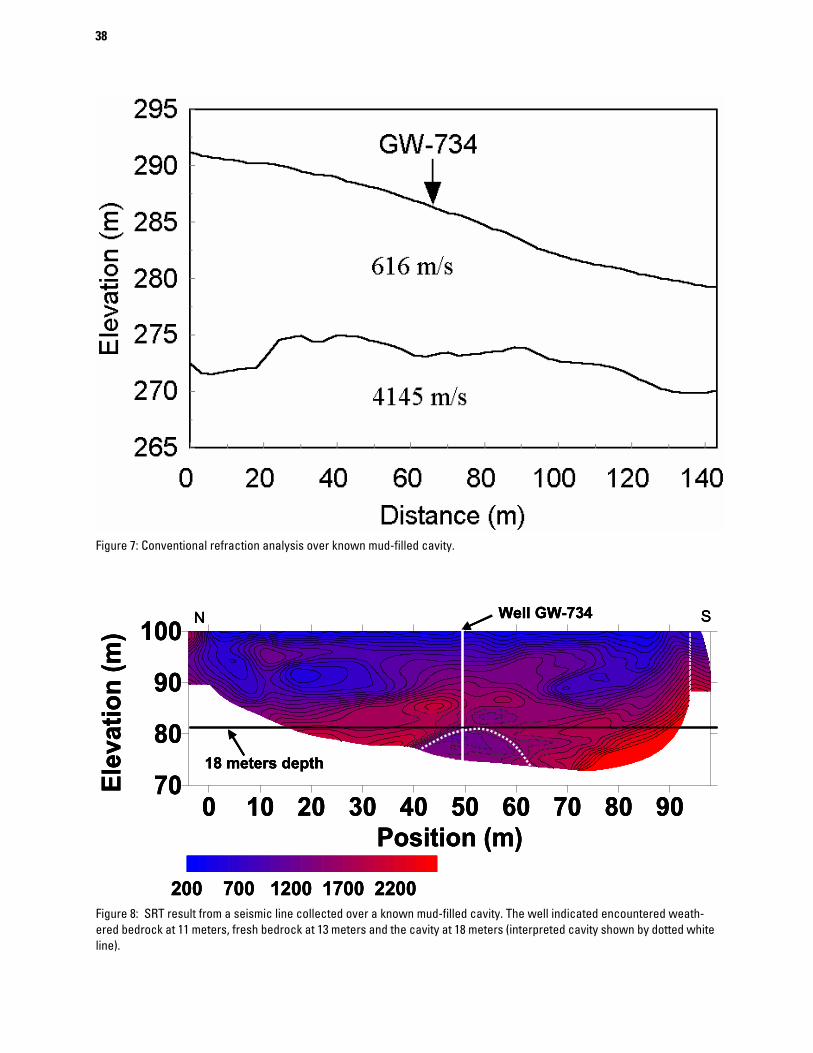
38
Figure 7: Conventional refraction analysis over known mud-filled cavity.
0 10 20 30 40 50 60 70 80 90Position (m)
70
80
90
100
Elev
atio
n (m
)
200 700 1200 1700 2200
18 meters depth
Well GW-734N S
0 10 20 30 40 50 60 70 80 90Position (m)
70
80
90
100
Elev
atio
n (m
)
200 700 1200 1700 2200
18 meters depth
Well GW-734N S
0 10 20 30 40 50 60 70 80 90Position (m)
70
80
90
100
Elev
atio
n (m
)
200 700 1200 1700 2200
18 meters depth
Well GW-734N S
Figure 8: SRT result from a seismic line collected over a known mud-filled cavity. The well indicated encountered weath-ered bedrock at 11 meters, fresh bedrock at 13 meters and the cavity at 18 meters (interpreted cavity shown by dotted white line).
39
Borehole geophysical techniques to determine groundwater flow in the freshwater/saline-water transition zone of the Edwards aquifer, south-central Texas
By R.B. Lambert1, A.G. Hunt2, G.P. Stanton3, and J. Waugh41U.S. Geological Survey, 5563 De Zavala Rd., Suite 290, San Antonio, TX 78249 2U.S. Geological Survey, Bldg. 21, M.S. 963, Denver Federal Center, Denver, CO 802253U.S. Geological Survey, 8027 Exchange Drive, Austin, TX 787544San Antonio Water System, 1001 E. Market St., San Antonio, TX 78298
ABSTRACT
The Edwards aquifer is the primary water supply for nearly 2 million people in the San Antonio area of south-central Texas. The freshwater/saline-water transition zone in this carbonate aquifer is fresh to moderately saline with dissolved-solids concentrations ranging from 1,000 to 10,000 milligrams per liter. Recent work by the U.S. Geological Survey in cooperation with the San Antonio Water System has shown that the transition zone is physically and chemically more dynamic than previously thought, and that there is vertical and horizontal stratification within the transition zone. Borehole geophysical techniques includ-ing fluid profiling of conductance and temperature, acoustic televiewer surveys, and flowmeter surveys are being used in monitor well transects to indicate which fractures and hydrostratigraphic subdivisions in the Edwards aquifer are more transmissive. When combined with other geologic, geochemical, and hydrologic information, these data can provide a two-dimensional subsurface representation of the freshwater/saline-water transition zone. This information is needed to improve the understanding of how water moves in and near the transition zone.
40
An Evaluation of Methods Used to Measure Horizontal Borehole Flow
By Wayne A. Mandell1, James R. Ursic2, William H. Pedler3, Jeffrey J. Jantos3, E. Randall Bayless4, and Kirk G. Thibodeaux5
1U.S. Army Environmental Center, Aberdeen Proving Ground, Maryland2U.S. Environmental Protection Agency, Chicago, Illinois3RAS, Inc., Golden, Colorado4U.S. Geological Survey, Indianapolis, Indiana5U.S. Geological Survey, Stennis Space Center, Mississippi
ABSTRACT
Identifying and quantifying ground-water-flow rates and directions are important components of most hydrologic investigations. High flow rates through preferential-flow zones commonly observed in karstic bedrock and the potential for rapid transport of dissolved solutes accentuate the value of flow-rate and direc-tion information. Typically, field characterization of preferential-flow zones in fractured-rock aquifers relies on tracer studies and vertical-flowmeter measurements. In unconsolidated aquifers, identification of flow rate and direction relies on multiple well installations and geometric triangulation. Horizontal borehole flowmeters and hydrophysical logging may provide quick, direct, and cost-effective alternatives for char-acterizing flow through discrete borehole intervals.
A collaborative investigation by the U.S. Army Environmental Center, the U.S. Environmental Protec-tion Agency, the U.S. Geological Survey, and RAS, Inc., has been evaluating three borehole flowmeters and hydrophysical logging in an aquifer-simulation chamber at the USGS Hydraulic Instrumentation Facility-Hydraulic Laboratory. The evaluation assesses the capabilities of the methods to measure horizontal ground-water flow and their applicability to field situations. The chamber is 4x4x6 feet and contains approx-imately 8,000 pounds of granular media. Hydraulic gradient, ground-water flow and direction are controlled by fluid levels in reservoirs on opposite ends of the chamber. Hydraulic heads are monitored with nine pie-zometers along the axis of the chamber and tank discharge is measured with inline paddle flowmeters and volumetric measurements.
During 2003 and 2005, flow rates and directions were measured in 2- and 6-inch slotted-PVC well screens and 4- and 6-inch wire-wound well screens. The well screens were installed during 2003 in a sim-ulated aquifer of uniformly sized medium sand and during 2005 in a simulated aquifer of uniformly sized fine (granule) gravel. Flow rates through the aquifer-simulation chamber ranged from approximately 4 to 155 feet/day and hydraulic gradients ranged from 0.0017 to 0.167 feet/foot.
Hydrophysical logging (NxHpL) and the horizontal heat-pulse flowmeter (KVA Model 200) were capable of measuring flow and flow direction through a 6-inch slotted-PVC well screen installed in the sim-ulated medium-sand aquifer. The acoustic flowmeter (prototype ADV) and optical flowmeter (prototype SCBFM) were hampered by the relatively low transport of colloidal matter through the well screen. All four methods measured flow through the simulated gravel aquifer, however the 3.5-inch diameter of the ADV prohibited measurements in the 2-inch well.
Results of this study indicate that the NxHpL, KVA, and SCBFM accurately measured ground-water-flow rate, and the KVA and SCBFM accurately measured ground-water-flow direction. The NxHpL does not measure ground-water-flow direction. The ADV was inaccurate at measuring ground-water-flow rate and direction. Detailed information about the strengths and limitations of each method and a complete pre-sentation of the data and analysis will be presented at the USGS Karst Interest Group Workshop.
41
Characterization of Hydrostratigraphic Units of the Capture, Recharge, and Confining Zones of the Edwards Aquifer Using Electrical and Natural Gamma Signatures
By Bruce D. Smith1, Allan K. Clark2, Jason R. Faith2,and Gregory P. Stanton3 1U.S. Geological Survey, MS 964, Box 25046, Denver Federal Center, Denver, CO 80225, 2U.S. Geological Survey, 5563 DeZavala Rd, San Antonio, TX 78249,3U.S. Geological Survey, 8027 Exchange Drive, Austin, TX 78754
ABSTRACT
Two high resolution multi-frequency airborne resistivity surveys have been completed over the Edwards aquifer capture (lower confining units), recharge, and upper confining areas in different geologic and structural settings. Borehole geophysical logs have been acquired to assist in characterization and map-ping of hydrostratigraphic units. These surveys shed additional light on the complex hydrostratigraphy and structure of one of the most productive and permeable carbonate aquifers in the United States. Detailed map-ping of near surface units and structure is essential in understanding possible subsurface groundwater flow paths, aquifer resources, and vulnerability to near surface contamination. The geophysical surveys map the near surface variations in electrical conductivity that can be correlated with variations in hydrostratigraphic units. Alluvial deposits and Quaternary formations are thin so the very high frequency resistivity data (around 100 kHz) provide a surrogate map of the bedrock geology and structure. Detailed comparison of the geology and geophysics suggests that hydrostratigraphic subdivision of the stratigraphic sequence cor-relates better with the lithologic complexity mapped by the airborne geophysics. Particular levels of resis-tivity of the bedrock hydrostratigraphy can be interpreted from the airborne surveys just as particular levels of resistivity are interpreted from borehole geophysical logs. In particular the Del Rio and Eagle Ford for-mations consisting mostly of clays are the lowest resistivity hydrostratigraphic units in the upper confining zone. These units are excellent “marker beds” for interpretation of stratigraphy for the airborne survey in Medina County. Another low resistivity unit is associated with the upper-most unit of the lower member of the Glen Rose Limestone. This unit serves as an excellent marker unit for the bottom of hydrostratigraphic interval E of the Trinity aquifer in Bexar County. All of the units of the Edwards group have high resistiv-ities but in Medina County the upper and lower Devils River can be separated on the basis of a lower overall resistivity of the upper unit in Medina County. The Trinity aquifer (Glen Rose Limestone) has a lower over-all resistivity than the Edwards is consistent with it’s role as the lower confining unit. However, there are thin high resistivity limestone units in the upper zone that can be mapped in detail by the airborne geophys-ics. Hydrostratigraphic unit D in the upper Trinity aquifer is characterized by a very high resistivity and can be used as a marker unit in stratigraphic interpretation. Current work is focusing on utilizing the detailed airborne resistivity surveys to refine bedrock geologic maps and construct 3D geologic models. This infor-mation will be critical to future generations of groundwater models of the Edwards Aquifer.

42
Use of Helium Isotopes to Discriminate Between Flow Paths Associated with the Freshwater/Saline Water Transition Zone of the Edwards Aquifer, South-Central Texas.
By Andrew G. Hunt1,Rebecca B. Lambert2, Gary P. Landis1, and John R. Waugh3
1U.S. Geological Survey, MS 963, Bld. 21, Denver Federal Center, Denver, CO 802252U.S. Geological Survey, Texas Water Science Center,5563 De Zavala Rd, San Antonio, TX 78249 3San Antonio Water Systems, 1101 E. Market St., San Antonio, TX 78298
ABSTRACT
The Edwards Aquifer currently is the primary source of water in south central Texas for agriculture, municipal, industrial, and ecological needs, supplying over 1.5 million people and supporting unique habi-tats for endangered species. The aquifer consists of limestone with some dolostone members of the Edwards Group (lower Cretaceous) that dip in a southeasterly direction. Structurally the aquifer is faulted by the Bal-cones fault zone, a system of Miocene age normal faults that run parallel to the strike of the aquifer. The up-dip freshwater zone of the aquifer is recharged with surface water along the northern area of the outcropping Edwards Group. Adjacent to the freshwater zone is the saline-water zone that forms an interface at the down-dip limit of the fresh water. Though the freshwater/saline-water interface is spatially defined within the aquifer, little is known about the nature of groundwater flow between and along its surface. Concerns are that structural, lithologic and hydrologic features and freshwater extraction may influence the possible up-dip migration of the saline water into the freshwater zone and may adversely affect current freshwater supplies.
Discrete samples were taken from an existing monitoring well network representing a variety of differ-ent flow regimes spanning the transition zone. The results show that the saline waters are overwhelmingly enriched in helium (up to 4000 times that of atmospheric solubility). Sources of helium in a ground water sample include atmospheric helium at solubility, helium associated with excess air incorporated during recharge, and excess helium derived from external sources such as release from the rocks that comprise the aquifer or a basal helium flux into the aquifer. In the fresh water zone, atmospheric solubility (R/RA ~ 0.989) and excess air sources (R/RA =1.0) characterize the composition of the helium isotopes in the samples. In the saline waters, the externally sourced helium dominates the sample composition, with two distinctive end member compositions of 0.13 and 0.22 R/RA apparent from the data set. The unique isotopic ratio of the excess helium indicates that the excess helium is mainly associated with a basal flux to the aquifer that appears to be geographically controlled by the Balcones fault system. This dichotomy in helium isotopic compositions allows us to use the helium data to deduce flow compartmentalization observed in the monitoring well transects and estimate the influence of ground water flow and mixing within the freshwater/ saline water transition zone.