u.s. international trade commission · pdf fileu.s. international trade commission roberta....
TRANSCRIPT


U.S. International Trade Commission
Robert A. RogowskyDirector of Operations
COMMISSIONERS
Address all communications toSecretary to the Commission
United States International Trade CommissionWashington, DC 20436
Jennifer A. Hillman, Vice ChairmanDeanna Tanner Okun, Chairman
Marcia E. MillerStephen Koplan
Charlotte R. LaneDaniel R. Pearson
Robert B. KoopmanDirector, Office of Economics

U.S. International Trade CommissionWashington, DC 20436
May 2004
www.usitc.gov
Publication 3697
U.S.-Australia Free Trade Agreement:Potential Economywide and
Selected Sectoral Effects
Investigation No. TA--2104-11

This report was principally prepared by
Arona M. Butcher, Chief, Country and Regional Analysis Division
Thomas Jennings, Project Leader
Office of EconomicsEdward Balistreri, Alan Fox, Kyle Johnson,
Walker Pollard, and Edward Wilson
Office of IndustriesVincent Honnold, Agriculture/Manufacturing Coordinator
Joanna Bonarriva, Jonathan Coleman, Brad Gehrke, Alfred Dennis, Dennis Fravel,Christopher Johnson, Ruben Mata, Deborah McNay, Doug Newman, Warren Payne,
Laura Polly, Laura Rodriquez, and George Serletis
Richard Brown, Services CoordinatorLaura Bloodgood, Lisa Ferens, Dennis Luther,
Michael Nunes, and Michelle Vaca-Senecal
Office of the General CounselWilliam W. Gearhart
Office of Tariff Affairs and Trade AgreementsJanis L. Summers and Donnette Rimmer
Office of Information ServicesPatricia Augustine
Office of Publishing
Primary ReviewersScott Baker, Cathy Jabara, and David Ingersoll
Supporting assistance was provided by:Patricia M. Thomas, Office of Economics

i
PREFACE
On March 3, 2004, the United States International Trade Commission (theCommission), instituted Investigation No. TA-2104-11, U.S.-Australia Free TradeAgreement: Potential Economywide and Selected Sectoral Effects. The investigation,conducted in accordance with section 2104(f) of the Trade Act of 2002, was inresponse to a request from the United States Trade Representative (USTR), (seeappendix A).
The purpose of this investigation is to assess the likely impact of the U.S.-Australia FreeTrade Agreement on the United States economy as a whole and on specific industrysectors and the interests of U.S. consumers. As specified in section 2104(f)(2)-(3) of theTrade Act, the Commission shall submit to the President and the Congress (not laterthan 90 calendar days after the President enters into the Agreement) a reportincluding
S an assessment of the likely impact of the Agreement on the United Stateseconomy as a whole and on specific industry sectors, including the impact theagreement will have on the gross domestic product, exports and imports,aggregate employment and employment opportunities, the production,employment, and competitive position of industries likely to be significantlyaffected by the Agreement, and the interests of the United States consumers;and
S a review of available economic assessments regarding the Agreement,including literature regarding any substantially equivalent proposedagreement, and shall provide in its assessment a description of the analysesused and conclusions drawn in such literature and a discussion of areas ofconsensus and divergence between the various analyses and conclusions,including those of the Commission regarding the Agreement.
The Commission solicited public comment for this investigationbypublishing a notice inthe Federal Register of March 8, 2004 (see appendix B). Interested party views aresummarized in chapter 9 of this report.


iii
TABLE OF CONTENTS
PagePreface i. . . . . . . . . . . . . . . . . . . . . . . . . . . . . . . . . . . . . . . . . . . . . . . . . . . . . .List of Frequently Used Abbreviations and Acronyms ix. . . . . . . . . . . . . . . . . . .Executive Summary xi. . . . . . . . . . . . . . . . . . . . . . . . . . . . . . . . . . . . . . . . . . . . .Chapter 1. Introduction 1. . . . . . . . . . . . . . . . . . . . . . . . . . . . . . . . . . . . . . . . . .
Purpose of the report 1. . . . . . . . . . . . . . . . . . . . . . . . . . . . . . . . . . . . . . .Scope of the report 2. . . . . . . . . . . . . . . . . . . . . . . . . . . . . . . . . . . . . . . .Approach of the report 2. . . . . . . . . . . . . . . . . . . . . . . . . . . . . . . . . . . . .Organization of the report 4. . . . . . . . . . . . . . . . . . . . . . . . . . . . . . . . . .Country profile 4. . . . . . . . . . . . . . . . . . . . . . . . . . . . . . . . . . . . . . . . . . . .
Chapter 2. Overview of the U.S.-Australia FTA 7. . . . . . . . . . . . . . . . . . . . . . .Background on Free Trade Agreements 7. . . . . . . . . . . . . . . . . . . . . . . .Brief summary of treaty provisions 7. . . . . . . . . . . . . . . . . . . . . . . . . . . . .
Introduction 7. . . . . . . . . . . . . . . . . . . . . . . . . . . . . . . . . . . . . . . . . . . .Summary of tariff commitments 8. . . . . . . . . . . . . . . . . . . . . . . . . . . . .Chapter-by-chapter review 9. . . . . . . . . . . . . . . . . . . . . . . . . . . . . . . .
Chapter 3. Simulated Impact of the U.S.-Australia FTA 25. . . . . . . . . . . . . . . . .Simulation design 27. . . . . . . . . . . . . . . . . . . . . . . . . . . . . . . . . . . . . . . . . .Economywide summary results 28. . . . . . . . . . . . . . . . . . . . . . . . . . . . . . .Simulated changes in trade volumes 30. . . . . . . . . . . . . . . . . . . . . . . . . . .U.S. gross output and employment effects 34. . . . . . . . . . . . . . . . . . . . . . .Sensitivity of the Commission simulated impacts to the trade elasticities 36
Chapter 4. Impact of the U.S.-Australia FTA on Selected Sectors 39. . . . . . . . . .Live cattle and beef 41. . . . . . . . . . . . . . . . . . . . . . . . . . . . . . . . . . . . . . . .
Overview 41. . . . . . . . . . . . . . . . . . . . . . . . . . . . . . . . . . . . . . . . . . . . . .U.S. industry 41. . . . . . . . . . . . . . . . . . . . . . . . . . . . . . . . . . . . . . . .Australian industry 42. . . . . . . . . . . . . . . . . . . . . . . . . . . . . . . . . . .
Potential impact on U.S. trade flows 43. . . . . . . . . . . . . . . . . . . . . . . . .U.S. imports 43. . . . . . . . . . . . . . . . . . . . . . . . . . . . . . . . . . . . . . . . .U.S. exports 46. . . . . . . . . . . . . . . . . . . . . . . . . . . . . . . . . . . . . . . . .
Dairy 47. . . . . . . . . . . . . . . . . . . . . . . . . . . . . . . . . . . . . . . . . . . . . . . . . .Overview 47. . . . . . . . . . . . . . . . . . . . . . . . . . . . . . . . . . . . . . . . . . . . . .
U.S. industry 47. . . . . . . . . . . . . . . . . . . . . . . . . . . . . . . . . . . . . . . .Australian industry 48. . . . . . . . . . . . . . . . . . . . . . . . . . . . . . . . . . .
Potential impact on U.S. trade flows 49. . . . . . . . . . . . . . . . . . . . . . . . .U.S. imports 49. . . . . . . . . . . . . . . . . . . . . . . . . . . . . . . . . . . . . . . . .U.S. exports 52. . . . . . . . . . . . . . . . . . . . . . . . . . . . . . . . . . . . . . . . .
Citrus fruit 53. . . . . . . . . . . . . . . . . . . . . . . . . . . . . . . . . . . . . . . . . . . . . . .Overview 53. . . . . . . . . . . . . . . . . . . . . . . . . . . . . . . . . . . . . . . . . . . . . .
U.S. industry 53. . . . . . . . . . . . . . . . . . . . . . . . . . . . . . . . . . . . . . . .Australian industry 53. . . . . . . . . . . . . . . . . . . . . . . . . . . . . . . . . . .
Potential impact on U.S. trade flows 54. . . . . . . . . . . . . . . . . . . . . . . . .U.S. imports 54. . . . . . . . . . . . . . . . . . . . . . . . . . . . . . . . . . . . . . . . .U.S. exports 54. . . . . . . . . . . . . . . . . . . . . . . . . . . . . . . . . . . . . . . . .

iv
TABLE OF CONTENTS-Continued
PageChapter 4. Impact of U.S.-Australia FTA–Continued
Certain fresh and processed fruit 55. . . . . . . . . . . . . . . . . . . . . . . . . . . . . .Overview 55. . . . . . . . . . . . . . . . . . . . . . . . . . . . . . . . . . . . . . . . . . . . . .
U.S. industry 55. . . . . . . . . . . . . . . . . . . . . . . . . . . . . . . . . . . . . . . .Australian industry 57. . . . . . . . . . . . . . . . . . . . . . . . . . . . . . . . . . .
Potential impact on U.S. trade flows 58. . . . . . . . . . . . . . . . . . . . . . . . .U.S. imports 58. . . . . . . . . . . . . . . . . . . . . . . . . . . . . . . . . . . . . . . . .U.S. exports 60. . . . . . . . . . . . . . . . . . . . . . . . . . . . . . . . . . . . . . . . .
Macadamia nuts 60. . . . . . . . . . . . . . . . . . . . . . . . . . . . . . . . . . . . . . . . . .Overview 60. . . . . . . . . . . . . . . . . . . . . . . . . . . . . . . . . . . . . . . . . . . . . .
U.S. industry 60. . . . . . . . . . . . . . . . . . . . . . . . . . . . . . . . . . . . . . . .Australian industry 61. . . . . . . . . . . . . . . . . . . . . . . . . . . . . . . . . . .
Potential impact on U.S. trade flows 62. . . . . . . . . . . . . . . . . . . . . . . . .U.S. imports 62. . . . . . . . . . . . . . . . . . . . . . . . . . . . . . . . . . . . . . . . .U.S. exports 64. . . . . . . . . . . . . . . . . . . . . . . . . . . . . . . . . . . . . . . . .
Motor vehicles 64. . . . . . . . . . . . . . . . . . . . . . . . . . . . . . . . . . . . . . . . . . . .Overview 64. . . . . . . . . . . . . . . . . . . . . . . . . . . . . . . . . . . . . . . . . . . . . .
U.S. industry 64. . . . . . . . . . . . . . . . . . . . . . . . . . . . . . . . . . . . . . . .Australian industry 65. . . . . . . . . . . . . . . . . . . . . . . . . . . . . . . . . . .
Potential impact on U.S. trade flows 67. . . . . . . . . . . . . . . . . . . . . . . . .U.S. imports 67. . . . . . . . . . . . . . . . . . . . . . . . . . . . . . . . . . . . . . . . .U.S. exports 69. . . . . . . . . . . . . . . . . . . . . . . . . . . . . . . . . . . . . . . . .
Certain motor-vehicle parts 71. . . . . . . . . . . . . . . . . . . . . . . . . . . . . . . . . .Overview 71. . . . . . . . . . . . . . . . . . . . . . . . . . . . . . . . . . . . . . . . . . . . . .
U.S. industry 71. . . . . . . . . . . . . . . . . . . . . . . . . . . . . . . . . . . . . . . .Australian industry 72. . . . . . . . . . . . . . . . . . . . . . . . . . . . . . . . . . .
Potential impact on U.S. trade flows 74. . . . . . . . . . . . . . . . . . . . . . . . .U.S. imports 74. . . . . . . . . . . . . . . . . . . . . . . . . . . . . . . . . . . . . . . . .U.S. exports 75. . . . . . . . . . . . . . . . . . . . . . . . . . . . . . . . . . . . . . . . .
Textiles, apparel, and footwear 76. . . . . . . . . . . . . . . . . . . . . . . . . . . . . . .Overview 76. . . . . . . . . . . . . . . . . . . . . . . . . . . . . . . . . . . . . . . . . . . . . .
U.S. industry 76. . . . . . . . . . . . . . . . . . . . . . . . . . . . . . . . . . . . . . . .Australian industry 76. . . . . . . . . . . . . . . . . . . . . . . . . . . . . . . . . . .
Potential impact on U.S. trade flows 78. . . . . . . . . . . . . . . . . . . . . . . . .U.S. imports 78. . . . . . . . . . . . . . . . . . . . . . . . . . . . . . . . . . . . . . . . .U.S. exports 79. . . . . . . . . . . . . . . . . . . . . . . . . . . . . . . . . . . . . . . . .
Agricultural and horticultural machinery 80. . . . . . . . . . . . . . . . . . . . . . . .Overview 80. . . . . . . . . . . . . . . . . . . . . . . . . . . . . . . . . . . . . . . . . . . . . .
U.S. industry 80. . . . . . . . . . . . . . . . . . . . . . . . . . . . . . . . . . . . . . . .Australian industry 80. . . . . . . . . . . . . . . . . . . . . . . . . . . . . . . . . . .
Potential impact on U.S. trade flows 80. . . . . . . . . . . . . . . . . . . . . . . . .U.S. imports 80. . . . . . . . . . . . . . . . . . . . . . . . . . . . . . . . . . . . . . . . .U.S. exports 81. . . . . . . . . . . . . . . . . . . . . . . . . . . . . . . . . . . . . . . . .

v
TABLE OF CONTENTS-Continued
PageChapter 4. Impact of U.S.-Australia FTA–Continued
Household appliances 82. . . . . . . . . . . . . . . . . . . . . . . . . . . . . . . . . . . . . .Overview 82. . . . . . . . . . . . . . . . . . . . . . . . . . . . . . . . . . . . . . . . . . . . . .
U.S. industry 82. . . . . . . . . . . . . . . . . . . . . . . . . . . . . . . . . . . . . . . .Australia industry 83. . . . . . . . . . . . . . . . . . . . . . . . . . . . . . . . . . . .
Potential impact on U.S. trade flows 84. . . . . . . . . . . . . . . . . . . . . . . . .U.S. imports 84. . . . . . . . . . . . . . . . . . . . . . . . . . . . . . . . . . . . . . . . .U.S. exports 84. . . . . . . . . . . . . . . . . . . . . . . . . . . . . . . . . . . . . . . . .
Services 85. . . . . . . . . . . . . . . . . . . . . . . . . . . . . . . . . . . . . . . . . . . . . . . . .Overview 85. . . . . . . . . . . . . . . . . . . . . . . . . . . . . . . . . . . . . . . . . . . . . .Potential impact on U.S. trade flows 88. . . . . . . . . . . . . . . . . . . . . . . . .
U.S. imports 88. . . . . . . . . . . . . . . . . . . . . . . . . . . . . . . . . . . . . . . . .U.S. exports 91. . . . . . . . . . . . . . . . . . . . . . . . . . . . . . . . . . . . . . . . .Indirect benefits of the FTA 93. . . . . . . . . . . . . . . . . . . . . . . . . . . . .
Audiovisual services 94. . . . . . . . . . . . . . . . . . . . . . . . . . . . . . . . . . . . . .Express delivery services 95. . . . . . . . . . . . . . . . . . . . . . . . . . . . . . . . . .Financial services 96. . . . . . . . . . . . . . . . . . . . . . . . . . . . . . . . . . . . . . . .Information technology services 96. . . . . . . . . . . . . . . . . . . . . . . . . . . . .Education services 97. . . . . . . . . . . . . . . . . . . . . . . . . . . . . . . . . . . . . . .
Chapter 5. Overview of Investment Provisions and the Potential Effectof the U.S.-Australia FTA 99. . . . . . . . . . . . . . . . . . . . . . . . . . . . . . . . . . . . . .
Introduction 99. . . . . . . . . . . . . . . . . . . . . . . . . . . . . . . . . . . . . . . . . . . . . .U.S. Australia investment 99. . . . . . . . . . . . . . . . . . . . . . . . . . . . . . . . . . . .Current investment policies of Australia 102. . . . . . . . . . . . . . . . . . . . . . . . .Non-conforming measures of the agreement 103. . . . . . . . . . . . . . . . . . . .Potential effects on the U.S. economy 104. . . . . . . . . . . . . . . . . . . . . . . . . .
Chapter 6. Review of the Intellectual Property Provisions and thePotential Effect of the U.S.-Australia FTA 107. . . . . . . . . . . . . . . . . . . . . . . . . .
Current conditions of IPR protection in Australia 107. . . . . . . . . . . . . . . . . .Copyrights, trademarks, and satellite program signals 108. . . . . . . . . . .Patents and trade secrets 111. . . . . . . . . . . . . . . . . . . . . . . . . . . . . . . . . .Enforcement 112. . . . . . . . . . . . . . . . . . . . . . . . . . . . . . . . . . . . . . . . . . . .
Major achievements in IPR protection of the U.S.-Australia FTA 112. . . . . .Copyrights, trademarks, and satellite program signals 113. . . . . . . . . . .Patents and trade secrets 115. . . . . . . . . . . . . . . . . . . . . . . . . . . . . . . . . .Enforcement 115. . . . . . . . . . . . . . . . . . . . . . . . . . . . . . . . . . . . . . . . . . . .
Potential effects on the U.S. economy 116. . . . . . . . . . . . . . . . . . . . . . . . . .Chapter 7. Other Potential Effects of the U.S.-Australia FTA 119. . . . . . . . . . . . .
Customs administration 120. . . . . . . . . . . . . . . . . . . . . . . . . . . . . . . . . . . . .Technical barriers to trade 123. . . . . . . . . . . . . . . . . . . . . . . . . . . . . . . . . . .Trade remedies/safeguards 125. . . . . . . . . . . . . . . . . . . . . . . . . . . . . . . . .Competition policy 125. . . . . . . . . . . . . . . . . . . . . . . . . . . . . . . . . . . . . . . . .Government procurement 126. . . . . . . . . . . . . . . . . . . . . . . . . . . . . . . . . . .Electronic commerce 127. . . . . . . . . . . . . . . . . . . . . . . . . . . . . . . . . . . . . . .

vi
TABLE OF CONTENTS-Continued
PageChapter 7. Other Potential Effects of the U.S.-Australia FTA-Continued
Labor 129. . . . . . . . . . . . . . . . . . . . . . . . . . . . . . . . . . . . . . . . . . . . . . . . . .Environment 130. . . . . . . . . . . . . . . . . . . . . . . . . . . . . . . . . . . . . . . . . . . . . .Transparency 131. . . . . . . . . . . . . . . . . . . . . . . . . . . . . . . . . . . . . . . . . . . . .Other institutional arrangements and dispute settlement 132. . . . . . . . . . . .
Chapter 8. Review of Literature and Comparison with Commission Findings 135.Introduction 135. . . . . . . . . . . . . . . . . . . . . . . . . . . . . . . . . . . . . . . . . . . . . .General effects of trade agreements 135. . . . . . . . . . . . . . . . . . . . . . . . . . .
Static effects: Trade creation and trade diversion 135. . . . . . . . . . . . . . .Static effects: Terms of trade 136. . . . . . . . . . . . . . . . . . . . . . . . . . . . . . .Scale Effects 136. . . . . . . . . . . . . . . . . . . . . . . . . . . . . . . . . . . . . . . . . . . .Nonquantifiable effects 137. . . . . . . . . . . . . . . . . . . . . . . . . . . . . . . . . . .
Impact on the United States of the U.S.-Australia FTA 138. . . . . . . . . . . . . .Alternative policy experiment 146. . . . . . . . . . . . . . . . . . . . . . . . . . . . . . . . .
Chapter 9. Summary of Views of Interested Parties 153. . . . . . . . . . . . . . . . . . . .The Honorable Russell D. Feingold, United States Senator
from Wisconsin 153. . . . . . . . . . . . . . . . . . . . . . . . . . . . . . . . . . . . . . . . . .The Honorable Tim Johnson, United States Senator
from South Dakota 153. . . . . . . . . . . . . . . . . . . . . . . . . . . . . . . . . . . . . . .The Honorable Charles E. Schumer, United States Senator
from New York 154. . . . . . . . . . . . . . . . . . . . . . . . . . . . . . . . . . . . . . . . . .The Honorable Ed Case, Member of Congress from Hawaii 154. . . . . . . . .His Excellency Michael Thawley, Australian Ambassador to
the United States 154. . . . . . . . . . . . . . . . . . . . . . . . . . . . . . . . . . . . . . . . .Air Courier Conference of America, International (ACCA) 155. . . . . . . . . .American-Australian Free Trade Agreement Coalition (AAFTAC) 156. . . . .American Dehydrated Onion and Garlic Association 156. . . . . . . . . . . . . .American Sugar Alliance 157. . . . . . . . . . . . . . . . . . . . . . . . . . . . . . . . . . . .Association of Equipment Manufacturers 157. . . . . . . . . . . . . . . . . . . . . . . .Automotive Trade Policy Council, Inc. 158. . . . . . . . . . . . . . . . . . . . . . . . . .The Boeing Company 159. . . . . . . . . . . . . . . . . . . . . . . . . . . . . . . . . . . . . . .Distilled Spirits Council of the United States 160. . . . . . . . . . . . . . . . . . . . . .Electronic Data Systems 160. . . . . . . . . . . . . . . . . . . . . . . . . . . . . . . . . . . . .Family Dairies USA 161. . . . . . . . . . . . . . . . . . . . . . . . . . . . . . . . . . . . . . . .Hawaii Department of Agriculture 162. . . . . . . . . . . . . . . . . . . . . . . . . . . . .Hawaii Macadamia Nut Assocation 162. . . . . . . . . . . . . . . . . . . . . . . . . . .International Intellectual Property Alliance 163. . . . . . . . . . . . . . . . . . . . . . .National Association of Manufacturers 164. . . . . . . . . . . . . . . . . . . . . . . . .National Farmers Union 164. . . . . . . . . . . . . . . . . . . . . . . . . . . . . . . . . . . .National Milk Producers Federation 165. . . . . . . . . . . . . . . . . . . . . . . . . . .News Corporation, Inc. 165. . . . . . . . . . . . . . . . . . . . . . . . . . . . . . . . . . . . .Ranchers - Cattlemen Action Legal Fund-United
Stockgrowers of America 166. . . . . . . . . . . . . . . . . . . . . . . . . . . . . . . . . .

vii
TABLE OF CONTENTS-Continued
PageChapter 9. Summary of Views of Interested Parties-Continued
Time Warner, Inc. On Behalf of the Entertainment IndustryCoalition for Free Trade (EIC) 167. . . . . . . . . . . . . . . . . . . . . . . . . . . . . . .
U.S. Chamber of Commerce 168. . . . . . . . . . . . . . . . . . . . . . . . . . . . . . . . .AppendicesA. Request Letter A-1. . . . . . . . . . . . . . . . . . . . . . . . . . . . . . . . . . . . . . . . . . . . .B. Federal Register Notice B-1. . . . . . . . . . . . . . . . . . . . . . . . . . . . . . . . . . . . .C. Hearing Participants C-1. . . . . . . . . . . . . . . . . . . . . . . . . . . . . . . . . . . . . . .D. Technical Appendix D-1. . . . . . . . . . . . . . . . . . . . . . . . . . . . . . . . . . . . . . . .FiguresES-1. U.S. exports and imports from Australia, 2003, by sector xiii. . . . . . . . . . .ES-2. U.S. direct investment in Australia, 2002 xiv. . . . . . . . . . . . . . . . . . . . . . . .ES-3. U.S. Australia Free Trade Agreement: Market access effects xvii. . . . . . . .ES-4. U.S. Australia Free Trade Agreement: Trade facilitation effects xxvi. . . . . .ES-5. U.S. Australia Free Trade Agreement: Investment effects xxviii. . . . . . . . . . .ES-6. U.S. Australia Free Trade Agreement: Regulatory environment
effects xxviii. . . . . . . . . . . . . . . . . . . . . . . . . . . . . . . . . . . . . . . . . . . . . . . .1-1. Australia: Economic profile 5. . . . . . . . . . . . . . . . . . . . . . . . . . . . . . . . . .3-1. Distribution of simulated U.S. welfare impacts of the
U.S.-Australia FTA 37. . . . . . . . . . . . . . . . . . . . . . . . . . . . . . . . . . . . . . .5-1. U.S. direct investment with Australia, 1998-2002 100. . . . . . . . . . . . . . . . .5-2. U.S. direct investment in Australia, 2002 101. . . . . . . . . . . . . . . . . . . . . . . .6-1. U.S. royalties and license fees from Australia, by value, and as a
percent of total U.S. royalties and license fees from the world 117. . . . .Tables3-1. Benchmark tariffs (2005) 26. . . . . . . . . . . . . . . . . . . . . . . . . . . . . . . . . . .3-2. Summary report on welfare and GDP 29. . . . . . . . . . . . . . . . . . . . . . . . . .3-3. Simulated changes in aggregate U.S. trade volume 31. . . . . . . . . . . . . . .3-4. FTA partner trade equilibrium: Imports from partner
(landed-duty paid) 31. . . . . . . . . . . . . . . . . . . . . . . . . . . . . . . . . . . . . . .3-5. U.S. trade equilibrium: Imports (landed-duty paid) and Exports (fob)
with the world 33. . . . . . . . . . . . . . . . . . . . . . . . . . . . . . . . . . . . . . . . . .3-6. Changes in output and employment in the United States 35. . . . . . . . . . . .4-1. U.S. imports from Australia: Actual 2002 imports for selected sectors
and estimated 2005 imports for model sectors 40. . . . . . . . . . . . . . . . .4-2. U.S. market access provisions for dairy products under
the U.S.-Australia FTA 50. . . . . . . . . . . . . . . . . . . . . . . . . . . . . . . . . . . .4-3. Estimated additional U.S.-imports of milk components from Australia
under provisions of the U.S.-Australia FTA, and comparisonwith total U.S. imports and production in 2003 52. . . . . . . . . . . . . . . . .
4-4. Gross domestic product (GDP) and employment: United Statesand Australia, selected service industries, 2000 89. . . . . . . . . . . . . . . .
4-5. U.S. and Australian trade data in selected service industries, 2002 89. . .

viii
TABLE OF CONTENTS-ContinuedPage
Tables-Continued5-1. Foreign direct investment, United States and Australia, 2002 100. . . . . . . .5-2. U.S. investment in Australia, by sector, FY2000-2001 102. . . . . . . . . . . . . .5-3. Industry sectors subject to nonconforming measures in
the U.S.-Australia FTA 105. . . . . . . . . . . . . . . . . . . . . . . . . . . . . . . . . . . .8-1. Quantifiable FTA effects 139. . . . . . . . . . . . . . . . . . . . . . . . . . . . . . . . . . . .8-2. United States sectoral changes, CIE GTAP analysis 142. . . . . . . . . . . . . . . .8-3. Estimated changes in value of the sectoral pattern of U.S. production
and exports as a result of a U.S.-Australia FTA, Gilbert 144. . . . . . . . . .8-4. U.S.-Australia FTA: Change in exports, imports, output,
and employment, by sectors, Brown et al. 145. . . . . . . . . . . . . . . . . . . . .8-5. Methodology and model assumptions: Selected economic
literature on a hypothetical U.S.-Australia FTA 147. . . . . . . . . . . . . . . . .8-6. Comparison of U.S. welfare changes for different scenarios 150. . . . . . . . .D-1. Substitution elasticities and confidence intervals D-6. . . . . . . . . . . . . . . . . .D-2. Benchmark tariffs (2005) D-7. . . . . . . . . . . . . . . . . . . . . . . . . . . . . . . . . . .D-3. Alternative policy scenarios D-9. . . . . . . . . . . . . . . . . . . . . . . . . . . . . . . . . .

OMB No.: 3117--0188
05/04
ITC READER SATISFACTION SURVEYU.S.-Australia Free Trade Agreement: Potential Economywide and
Selected Sectoral Effects
The U.S. International Trade Commission (USITC) is interested in your voluntary com-ments (burden less than 10 minutes) to help assess the value and quality of our reports, and to assistin improving future products. Please return survey by facsimile (202-205-2340) or by mail to theUSITC, or visit the USITC Internet home page(http://reportweb.usitc.gov/reader_survey/readersurvey.html) to electronically submit a Web version ofthe survey.
(Please print; responses below not for attribution):
Your name and title:
Organization (if applicable):
Which format is most useful to you? - CD-ROM - Hardcopy - USITC Internet site
Circle your assessment of each factor below: SA = strongly agree, A = agree, N = no opinion,D = disagree, or SD = strongly disagree.
Value of this report:" Statistical data are useful SA A N D SD. . . . . . . . . . . . . . . . . . . . . . . . . . . . . ." Other non-numerical facts are useful SA A N D SD. . . . . . . . . . . . . . . . . . . ." Analysis augments statistical data/other facts SA A N D SD. . . . . . . . . . . ." Relevant topic(s)/subject matter SA A N D SD. . . . . . . . . . . . . . . . . . . . . . . ." Primary or leading source of information on this subject SA A N D SD. .
Quality of this report:" Clearly written SA A N D SD. . . . . . . . . . . . . . . . . . . . . . . . . . . . . . . . . . . . . . ." Key issues are addressed SA A N D SD. . . . . . . . . . . . . . . . . . . . . . . . . . . . . . ." Charts and graphs aid understanding SA A N D SD. . . . . . . . . . . . . . . . . . ." References cite pertinent sources SA A N D SD. . . . . . . . . . . . . . . . . . . . . . .
Other preferred source of information on this subject:
Specify chapters, sections, or topics in report that are most useful:
Identify any type of additional information that should have been included in report:
Suggestions for improving report:
Please update your mailing and electronic addresses below (voluntary)-
Mailing address:
City, state, and zip code:
E-mail address:

UNITED STATESINTERNATIONAL TRADE COMMISSION
WASHINGTON, DC 20436
OFFICIAL BUSINESSPENALTY FOR PRIVATE, USE $300
FOLD
NO POSTAGENECESSARY
IF MAILEDIN THE
UNITED STATES
BUSINESS REPLY MAILFIRST CLASS PERMIT NO. 12840 WASHINGTON, DC
POSTAGE WILL BE PAID BY ADDRESSEE
U.S INTERNATIONAL TRADE COMMISSION500 E STREET, SW.WASHINGTON, DC 20277--2840
ATTN:OFFICE OF ECONOMICSU.S.-Australia Free Trade Agreement: PotentialEconomywide and Selected Sectoral Effects

ix
List of Frequently Used Abbreviations andAcronyms
AAFTAC American-Australian Free Trade Agreement CoalitionACIS Automotive Competitiveness and Investment SchemeATAC Agricultural Technical Advisory CommitteeATC Agreement on Textiles and ClothingACTPN Advisory Committee on Trade Policy NegotiationsAEM Association of Equipment ManufacturersATPC Automotive Trade Policy CouncilBITs Bilateral investment treatiesCDs compact disksCGE computable general equilibriumDEIF date of entry into forceDFAT Australian Department of Foreign Affairs and TradeDVDs digital video discsEIC Entertainment Industry Coalition for Free TradeFAPM Federation of Automotive Products ManufacturersFCOJ frozen concentrated orange juiceFDI foreign direct investmentFIRB Foreign Investment Review BoardFTAA Free Trade Area of the AmericasFTAs Free Trade AgreementsGDP gross domestic productGTAP Global Trade Analysis ProjectHTS Harmonized Tariff SystemIIPA International Intellectual Property AllianceIMF International Monetary FundIPR intellectual property rightsLAC Labor Advisory Committee for Trade Negotiations and Trade PolicyMFN most-favored-nationMPAA Motion Picture Association of AmericaNAFTA North America Free Trade AgreementNMPF National Milk Producers FederationNTBs nontariff barriersNTR normal trade relationsROOs rules of originSSGs Special SafeguardsSPS Sanitary and Phytosanitary (Measures)SUVs sport-utility vehiclesTBT Technical Barriers to TradeTCF textiles, clothing, and footwearTRIPs Trade Related Aspects of Intellectual Property Rights

x
TRQs tariff rate quotasUSITC U.S. International Trade CommissionUSTR United States Trade RepresentativeWIPO World Intellectual Property OrganizationWTO World Trade Organization

xi
EXECUTIVE SUMMARY
On February 18, 2004, the U.S. International Trade Commission (Commission)received a letter from the Office of the United States Trade Representative (USTR)requesting that the Commission prepare a report in accordance with section 2104(f) ofthe Trade Act of 2002, to assess the likely impact of the U.S.-Australia Free TradeAgreement (FTA) on the United States economy as a whole, on specific industrysectors, and on the interests of U.S. consumers.1 Section 2104(f)(3) also requires thatthe Commission, in preparing its report, review available economic assessmentsregarding any substantially equivalent proposed agreement, and discuss areas ofconsensus and divergence between the various analyses and conclusions, includingthose of the Commission regarding the Agreement.
Study Approach and Scope
The United States and Australia both have open trade and investment regimes andrelatively strong protections in place for intellectual property rights. The FTA’squantifiable benefits are related to the immediate reciprocal tariff elimination on alarge number of products, both agricultural and manufacturing. While an FTA isdesigned to eliminate tariffs after it is phased in, this Agreement eliminates virtually allofAustralia’s manufacturing tariffs on the first day the Agreement is implemented. Thisis significant to U.S. manufacturers as more than 90 percent of U.S. exports toAustralia are manufactured goods. The FTA also provides specific obligations inimportant areas such as intellectual property, services, investment, andtelecommunications, which are more difficult to quantify. Because the agreement willsecure these obligations, U.S. companies may be more likely to use Australia as theirbase for expanded Asian operations. In the U.S.-Australia FTA , the issue of both acommon language and culture contribute greatly to the potential for strengthening theexisting trading relationship.
1 On Nov. 13, 2002, President Bush notified Congress of his intent to initiate FTAnegotiations with Australia. USTR announced on Feb. 8, 2004, that the United States andAustralia had successfully concluded negotiations for the U.S.-Australia FTA (negotiationsbegan in March 2003). On Feb. 13, 2004, President Bush signed a letter notifying Congress ofthe intent to enter into the U.S.-Australia FTA; the letter started the process under which theagreement can be signed and sent to the Congress for approval. On March 3, 2004, the drafttext of the U.S.-Australia FTA was made available to the general public. U.S. TradeRepresentative, “United States.-Australia Free Trade Agreement, found athttp://www.ustr.gov/new/fta/australia/text/index.htm. On March 15, 2004, USTR receivedreports from 32 trade advisory groups commenting on the proposed U.S.-Australia FTA. U.S.Trade Representative Robert Zoellick and Australian Minister of Trade Mark Vaile signed theFTA on May 18, 2004.

xii
United States - Australia Trade and InvestmentThe United States has enjoyed a bilateral merchandise trade surplus for a number ofyears with Australia: $3.9 billion in 2001, $5.9 billion in 2002, and nearly $6.0 billionin 2003. In 2003, U.S. domestic merchandise exports to Australia measured $12.4billion, while U.S. imports for consumption from Australia measured $6.5 billion. TheAustralian economy is less than 5 percent the size of the U.S. economy. In 2003,Australia was the second largest U.S. trading partner in terms of positive tradebalance position.2
By 2-digit SITC classification, the largest categories of U.S. merchandise exports toAustralia in 2003 included transport equipment, road vehicles, specializedmachinery, industrial machinery, equipment and parts, and miscellaneousmanufactured articles. U.S. merchandise imports from Australia in 2003 includedmeat and meat preparations, beverages, metal ores and scrap, road vehicles, andpetroleum and related products (figure ES-1).
U.S. cross-border exports of services to Australia measured $5.2 billion in 2002,resulting in a $2.3 billion surplus in services trade. The majority of U.S. cross-borderservice exports are transactions between U.S. parent corporations and theirAustralianaffiliates,while 16percent ofU.S. exports comprise receipts of royaltiesandlicense fees. Sectors that account for significant portions of cross-border exports toAustralia include travel and transportation; business, professional, and technicalservices; and financial (non-insurance) services. U.S. cross-border imports of servicesfrom Australia consist primarily of travel and transportation services, and business,professional, and technical services.
The U.S. stock of investment position in Australia measured $36.3 billion in 2002, andgenerated $2.6 billion in income. The United States is the leading foreign investor inAustralia, and only Japan and Singapore have higher levels of U.S. investment withinthe Asia-Pacific region. U.S. investment in Australia is broadly based, withmanufacturing accounting for about 30 percent followed by mining and finance andinsurance (figure ES-2). Australian investment in the United States was valued at $24.5billion in 2002, with the largest shares in manufacturing (14 percent); real estate,rental, and leasing (11 percent); and finance and insurance (6 percent).
2 The U.S. merchandise trade balance with Australia in 2003 was second only to the $8.23 billionbalance with the Netherlands.

xiii
Other 8%
Figure ES-1U.S. exports and imports from Australia, 2003, by sector
Source: Compiled from official statistics of the U.S. Department of Commerce.
Machinery & transportation
Miscellaneous
Chemicals & related 14% Manufactured goods 6%
Food, live animals 4%
Exports
manufactures 10%
Imports
Machinery &transportation
Chemicals & related 9%
Manufactured goods 10%
Food, live animals 22%
Miscellaneousmanufactures 12%
Other 10%
Crude materials, inedible,except fuel 7%
Mineral fuels, lubricantsand related 6%
Beverages & tobacco 10%
equipment 57%
equipment 16%

xiv
Other 8.6%
Figure ES-2U.S. direct investment in Australia, 2002
Source: U.S. Department of Commerce, Bureau of Economic Analysis, Survey of Current BusinessSept 2003, p. 121.
Mining 22.6%
Finance & insurance 10.9%
Utilities 4.5%
Chemicals 4.2%
Primary & fabricated metals 7.0%
Manufacturing 29.7%
Wholesale trade 7.9%Depository institutions 4.7%
U.S.- Australia FTAUnder the FTA’s market access commitments, originating U.S. exports covered by amajority of HS headings (except textiles and apparel of chapters 50-63 and somemotor vehicles of chapter 87) are eligible for immediate duty-free entry into Australiaunder staging categories A and E; six other staging categories—D, L, T1, Tx, T2 andT3—apply, eliminating duties ranging up to 25 percent ad valorem by January 1,2015. Australia’s exports to the United States are covered by 11 different duty stagingcategories, with duties phased out over periods of up to 18 years. Tariff-rate quotasapply to some agricultural commodities, and sugar is not included in the agreement.Rules of origin based mainly on specific changes in tariff classification, applicable tothird-country inputs, determine eligibility for FTA treatment.
Many of the substantive commitments in the Agreement reflect obligations of theparties under World Trade Organization agreements on the same subject matter(although Australia is not a member of the Agreement on Government Procurement),and the language in this FTA in many places closely parallels provisions in recent FTAswith Singapore and Chile. The language of many Agreement chapters reflects therelatively similar legal and political systems and the comparable levels of developmentand economic complexity between the United States and Australia. Like other recentFTAs to which the United States is a party, the Agreement includes a bilateral

xv
safeguard provision that allows a party to impose temporary relief measures duringthe transitional period of the Agreement.
MethodologyTo provide the most comprehensive assessment of the effects of the U.S.-Australia FTAon the U.S. economy and specific sectors, the Commission has employed both aquantitative and a qualitative approach. The quantitative assessment is limited to theliberalization of tariffs and tariff-rate quotas only.
The non-quantifiable effects are associated with provisions related to investment,intellectual property rights, services, customs administration, and governmentprocurement. These effects are not readily quantifiable due to the lack of necessarydata and the intangible nature of some of these effects. Information to assess theliberalization of the barriers in these areas was obtained from industry and publicsources; from testimonypresentedat thepublic hearingat theCommission; andwrittensubmissions in response to a Federal Register notice. Government sources, both in theUnited States and Australia, also were utilized to assemble information for the report.
For the liberalization of tariffs and tariff-rate quota (TRQs), the study employs amulticountry model with economywide coverage of merchandise and service sectors(a global computable general equilibrium model). The analysis is static and assumesthe U.S.-Australia FTA is fully implemented and its effects felt on January 1, 2005. Thatis, it assumes that the FTA’s provisions will not be phased in over time, or its effectsgradually realized over time. The modeled results can be considered to be long-runeffects, after all adjustments have worked their way through the economy, of a fullyimplemented agreement in an economy otherwise identical to the baseline 2005economy.3 This simulation liberalizes trade completely in all goods subject toliberalization under the free trade agreement. Sugar is excluded from the Agreement,and therefore this sector is not analyzed. The United States has relatively low tariffs,averaging 1.7 percent ad valorem on imports from Australia. The average appliedMFN tariff rate for U.S. goods entering Australia is 4.3 percent ad valorem, downfrom 5.6 percent ad valorem in 1998. The average for agricultural goods is 1.2percent ad valorem. The average for industrial products is 4.7percent advalorem. It isexpected that those sectors that face relatively high trade restrictions will show largereffects from the implementation of the FTA.
3 Models are highly simplified descriptions of an economy, dependent on parameter estimates andsubject to potential biases due to product and regional aggregations. See Appendix D.

xvi
Principal Findings
The comprehensive assessment of the FTA has been grouped into four areas: marketaccess, trade facilitation, investment,and regulatoryenvironment. Impactassessmentsare presented for each of these four areas together with the chapters of the FTAaddressing that subject area.
Market AccessMarket access relates to the extent to which a good or service can compete withlocally-made products in another market. In a bilateral sense, the term relates to thedegree of openness or accessibility that foreign-made products experience in anothermarket. The entire array of trade policy measures that a country employs toadminister, measure, and support its trade regime affect the ability of a foreignproduced product or service to enter another country under non-discriminatoryconditions.
The market access provisions provide the principal guarantee of national treatmentunder the U.S.-Australia FTA for goods in bilateral trade. Relying upon broadercommitments of the GATT 1994, the specific obligations in these provisions commit thetwo parties to progressively eliminate duties on originating goods and to implement awide array of customs procedures that would enhance this trade. For example,provisions on temporary admission of goods, the treatment of containers, andduty-free entry of commercial samples would ensure consistent customs treatment byboth parties. Many of these measures apply already to U.S. imports, under HTSchapter 98, but the Agreement would make the treatment of U.S. exports clear andsimple. The Agreement also provides that no new duties or charges would be imposed,that the parties cannot apply import and export restrictions other than in limited cases,that administrative fees relating to trade would be limited to the cost of servicesrendered, and that merchandise processing fees must be eliminated. A Committee onTrade in Goods will provide institutional support in implementing and maintainingthese measures.
Figure ES-3 presents an overview of the potential effects of the U.S.-Australian FTA inthe market access area.
Economywide Effects of Tariff LiberalizationThe most relevant and comprehensive measure of the impact that the quantifiablecomponents (tariff liberalization) of the U.S.-Australia FTA will have on the U.S.economy as a whole is the change in welfare (i.e., the value to consumers of theAgreement in terms of increased income). It summarizes the benefits to consumers oftariff liberalization, as well as the effects on households in their roles as providers oflabor, owners of capital, and taxpayers. According to the Commission simulation,

xvii
Goods, ch. 2S Tariff elimination on a wide range of goods.
Agriculture, ch. 3S Tariff elimination on a wide range of agricultural
products.S Improved market access under TRQs for U.S.
imports of certain products (dairy, beef).
Textiles, ch. 4S Duty-free trade for imports that meet rules of
origin.
Market Access Provisions
Subject negotiated and FTA chapter
Complete implementation, full phase-in of tariff liberalization
Economywide resultsWelfare—The effects of tariff removal under the FTA onU.S. economic welfare and GDP are likely to be minimal(less than 0.01 percent of U.S. GDP). Actual simulationresult: between $434.8 and $639.4 million.
Exports—After full phase-in of tariff cuts, U.S. exports to theworld are likely to be higher by 0.13 percent. For U.S. bilateralexports, the largest increases are expected to be for: coal, oil,gas, etc.; processed food; textile, apparel, and leather prod-ucts; motor vehicles and parts; ferrous metals; and wood prod-ucts. Key U.S. exports gain immediate duty-free access.
Imports—After full phase-in of tariff cuts, U.S. imports arelikely to be 0.07 percent higher. For U.S. bilateral imports,the largest increases are expected to be for: meat products;processed foods; textiles and apparel; chemicals, rubberand plastic; and motor vehicles and parts. In most cases, theincreases in trade with Australia come at the expense oftrade with other partners.
Production—Little or no change in U.S. production indistinct U.S. industry sectors. The largest proportional impactis on meat products, output of which decreases by 0.3percent. The largest positive change is an increase of 0.14percent in the coal, oil, and gas sector.
Employment—Little or no change in U.S. employment indistinct U.S. industry sectors.
Consumers— Little or no impact on U.S. consumers(household prices).
Sectoral resultsExports—After full phase-in of tariff cuts, U.S. exports to Aus-tralia of coal, oil, gas, etc. would likely increase by 533.29 per-cent; processed foods, 62.43 percent; textile, apparel, andleather products, 87.16 percent; motor vehicle and parts,43.32 percent; ferrous metals, 34.45 percent; and wood prod-ucts, 30.19 percent. U.S. exports to Australia as a whole in-crease by 14.1 percent.
Imports—After full phase-in of tariff cuts, U.S. importsfrom Australia of meat products increase 55.2 percent;textiles, 57.7 percent (rules of origin will limit themodel-simulated gains); processed food, 37.6 percent;chemicals, rubber and plastic, 21.0 percent; and motorvehicles and parts, 21.5 percent. Imports from Australia asa whole increase by 15.5 percent.
Figure ES-3U.S.-Australia Free Trade Agreement: Market Access Effects
Model based results
Likely economic impact on U.S. economy: Quantitative Assessment

xviii
Market Access Provisions
Subject negotiated and FTA chapter Likely economic impact on U.S. economy: Qualitative Assessment
Figure ES-3-ContinuedU.S.-Australia Free Trade Agreement: Market Access Effects
Goods, ch. 2Tariff elimination
Motor vehicles—A measurable increase in two-wayU.S.-Australia trade in motor vehicles, with the greaterpotential for trade effects on U.S. exports. The FTA isexpected to allow the U.S. and Australian operations ofU.S. automakers to reevaluate their global sourcingstrategies, and take advantage of each other’s individualstrengths by filling product gaps in each market. Phasedelimination of the 15 percent Australian tariff on passengercars and immediate elimination of the 5 percent Australiantariff on commercial all-wheel drive vehicles will provideU.S. exports with an advantage over vehicles from othermarkets. The U.S. motor vehicle sector supports the FTA.
Motor-vehicle parts—U.S. parts industry will benefitfrom increased export opportunities in Australia. Greaterintegration of the industries and increased growth andefficiency as a result. The U.S. motor vehicle parts sectorsupports the FTA.
Staged phase-in of FTA
Agriculture, ch. 3S Tariff elimination on a wide range of agricultural
products.S Improved market access under TRQs for U.S.
imports of certain products (dairy, beef).
Beef—A small, but increasing, preferential tariff-ratequota above Australia’s current WTO tariff-rate quota isexpected to be offset by demand growth. When over-quotaduty rates begin to decline in year eight of the agreement,the impact is uncertain because the point at whichover-quota duty rates will no longer be prohibitive varies bycut and type of beef. The U.S. cattle and beef industry isdivided on the long-term impact of the Agreement–opinionsrange from minimal to negative effects.
Dairy—Small increase in imports of dairy products. TheFTA also will have a very small effect on milk productionand employment in the U.S. dairy industry. U.S. milkproducers have expressed concerns with the dairy elementsof the FTA.
Macadamia nuts—Increased imports of prepared orpreserved macadamia nuts. U.S. industry thinks that this willhave long-term negative impacts on some U.S. growers andprocessors.
Textiles, ch. 4S Duty-free trade for imports that meet rules of
origin - duties are phased out until 2010 or 2015;phaseout varies by product.
S Yarn forward rule of origin for apparel articles.S Originating fibers forward for knit fabrics made
of cotton and manmade fiber, yarn forward forfabrics made of wool.
S Yarn forward for woven fabrics.S Fiber forward for most yarn.
Textiles and apparel— Overall, relatively small impacton the U.S. economy is expected because of Australia’slimited domestic market size. Rules of origin will limit themodel-simulated gains. The U.S. textile sector supports theU.S.-Australia FTA as currently written. In contrast, much ofthe U.S. apparel industry views the rule of origin as toorestrictive and asserts that it, along with the Agreement’slong duty phaseout, will discourage trade.
(Sanitary and phytosanitary measures) ch.7
Establishment of bilateral SPS Working Group to provide aforum for resolving specific bilateral animal and planthealth matters with a view to facilitate trade.
Rules of origin, ch. 5S Rules designed to be easy to administer.S Rules use same criteria as in NAFTA and FTAs
with Chile and Singapore.
Rules of origin, ch. 5S Rules designed to be easy to administer.S Rules use same criteria as in NAFTA and FTAs
with Chile and Singapore.

xix
Market Access Provisions
Subject negotiated and FTA chapter Likely economic impact on U.S. economy: Qualitative Assessment
Figure ES-3-ContinuedU.S.-Australia Free Trade Agreement: Market Access Effects
Staged phase-in of FTA
Sources: Text of the U.S.-Australia FTA found at http://www.ustr.gov/new/fta/Australia/text/index.htm. Impact estimates obtained from USITCestimates and calculations and compiled from multiple sources cited elsewhere in this report, including testimony from the Commission’s publichearing for this investigation held on Mar. 30, 2004, written submissions in response to the Federal Register notice for this investigation (seeappendix B), USITC staff interviews with industry officials, and reports filed by the various U.S. government trade policy advisory committees.
Cross border trade in services, ch. 10,Telecommunications, ch. 12 and Financialservices, ch. 13
S National treatment and most-favored-nationtreatment.
S Market access: Guarantees U.S. access in allservice sectors without specific exemptions.
S For telecommunications sector: Guaranteesreasonable and nondiscriminatory access topublic telecommunication networks andincludes new commitments on resale, leasedcircuits and networks, and co-location.
Services: No significant increases in either exports orimports of services, but other benefits in terms of marketaccess, national treatment, IPR protection, and governmentprocurement opportunities. U.S. services industriesgenerally support the Agreement.
Increased transparency and regulatory certainty forU.S.-based services. Overall small impact on the U.S.economy is expected because of Australia’s existing levelof openness for services, and limited domestic market size.
The first Australian trade commitments in the audiovisualservices sector, a major improvement for U.S. serviceproviders, and an important precedent for futureagreements.
Increased U.S. exports of telecommunications services as aresult of increased economic activity in other sectors.Overall small impact on the U.S. economy is expectedbecause of Australia’s existing level of openness fortelecommunications services and limited domestic marketsize.
Increased sales of insurance and express delivery andother services as a result of increased trade in goods.
Government procurement, ch. 15S New disciplines on the purchases of most
Australian central government agencies, as wellas the vast majority of Australian regional andmunicipal government.
S Anti-corruption measures in governmentcontracting.
S U.S. firms guaranteed a fair and transparentprocess to sell goods and services to a widerange of Australian government entities.
This provides new opportunities to U.S. businesses asAustralia is not a signatory of the WTO GovernmentProcurement Agreement.
E-commerce, ch. 16S Non-discriminatory treatment of digital products
and no customs duties on digital products.S Equity and reciprocity for e-commerce firms.
Benefits U.S. e-commerce providers and investors, butoverall relatively small impact on the U.S. economy isexpected because of Australia’s limited domestic marketsize. Potential for trade increases exists.

xx
when tariff cuts have been fully implemented and all economic adjustments haveoccurred under the Agreement, overall U.S. welfare should increase in the range of$434.8 million to $639.4 million. That is, when fully implemented, the FTA wouldprovide benefits to consumers within this range. Exports would increase by $1.5 billionand imports would increase by about $1.2 billion, with minimal impact on employmentand output.
Sectoral effectsThe largest percentage increases in trade are found in those sectors undergoing thegreatest degree of liberalization. According to the Commission analysis, the sectorsshowing the greatest percentage increase in exports to Australia include coal, oil, gas,and other mineral products; textiles, apparel, and leather products; and otherprocessed food and tobacco products. The greatest value increases in exports toAustralia occur in other machinery and equipment, and motor vehicles and parts. U.S.imports of textile, apparel, and leather products; meat products; and other processedfoods and tobacco products are expected to see the greatest percentage increases.The greatest increase in the value of imports is estimated tooccur inmeat products,withan increase of $758 million (an increase of 55 percent over the base level). However,total U.S. imports of meat products (includes beef, pork, and lamb) from the world areexpected to increase by about 6 percent, and Australian imports likely would displacesome imports from other U.S. sources. As indicated below, the impact of the FTA onbeef imports is expected tobe relatively small in the short termand uncertain in the longterm.
Overall, some sectors of the U.S. economy likely will experience increased importcompetition from Australia, while other sectors likely will experience increased exportopportunities in Australia. However, given Australia’s economy and market size, anysuch increases would be from a small base and thus have a minimal impact onproduction, prices, or employment in corresponding U.S. sectors.
A more detailed analysis also was conducted for some sectors at a moredisaggregated level. These sectors were selected according to their importance in thebilateral trade flows and the potential for the increased export opportunities relative toother foreign suppliers to the Australian market. The assessment was based on thestaged implementation of the FTA.
Live Cattle and BeefUnder the FTA, Australia will receive immediate duty free access on all U.S. beefimports within existing WTO tariff-rate quota (TRQ) levels. Increased market access isinitially granted in the form of a duty-free preferential TRQ in addition to Australia’scurrent allocation of existing WTO TRQ. The preferential TRQ provisions of the FTA,however, will not be implemented until U.S. beef exports return to their 2003 levels, orthe third year of the agreement, whichever comes first. The preferential TRQ increasesfrom 15,000 metric tons in year two of the agreement to 70,000 metric tons in year 18.

xxi
A phased reduction of the over-quota duty rate begins in year nine of the agreement,dropping from 26.4 percent to zero in year 18. The agreement will have no immediateimpact on U.S. exports of fresh, chilled, or frozen beef (HTS 0201 and 0202) toAustralia because these products can currently enter Australia duty free.
The impact of the FTA on total U.S. beef imports in the first eight years of the Agreementlikely will be relatively small because the amount by which duty-free entry canpotentially increase is known and limited. Thus, the impact of the FTA on beef imports isexpected to be small relative to U.S. production and consumption. The preferentialtariff-rate quotas do not go into effect until U.S. beef exports exceed the amountexported in 2003, or year three of the agreement, whichever comes first, to allow U.S.beef exports time to recover from export bans related to discovery of a BSE positivecow in the United States. Consequently, the initial impact of the agreement will beelimination of the 4.4 cents per kg tariff on beef imports within the WTO quota, whichincreases Australian competitiveness vis-a-vis other beef exporters, but does notincrease Australian access to the U.S. beef market. The impact during years ninethrough 18 is less certain because the specific timing and level of increased marketaccess cannot be known.
The impact of the FTA on U.S. beef exports also is expected to be relatively smallbecause most of Australia’s beef production is grass-fed and hence Australians havedeveloped a preference for grass-fed beef. In contrast, U.S. production is grain-fed.However, the Australian industry has developed a small, but growing grain-fedsegment to supply its high value Asian markets. With increased access to grain-fedbeef, Australians may develop a taste for grain-fed beef, resulting in a market for U.S.grain-fed beef exports.
Dairy
Under the FTA pertaining to U.S. imports of dairy products from Australia, 12 separateTRQs were established that cover almost all U.S. dairy imports already subject to TRQsunder the WTO Agreement on Agriculture. Under the FTA, quota quantities increaseannually and indefinitely by specified compound growth rates that range from 3percent to 6 percent depending on the TRQ category. Over-quota tariffs on dairyimports from Australia remain at their NTR levels (i.e., there is no staged reduction ofover-quota tariffs over time).
The U.S.-Australia FTA likely will result in a relatively small increase in U.S. imports ofdairy products from Australia. The Agreement also is likely to have a small effect onU.S. milk production and employment in the dairy industry. This is so because theadditional quantities of Australian dairy products entering the U.S. market as a resultof the Agreement are relatively small in comparison with current levels of domesticdairy production and consumption. All dairy products exported to Australia currentlyface no duty rate and are not subject to sanitary/phytosanitary restrictions. Thus, theFTA is not expected to change the trade flows of dairy products into Australia.
xxii
Macadamia NutsUnder the terms of the U.S.-Australia FTA, the current U.S. tariffs on raw shelled andin-shell macadamia nuts will be reduced to zero immediately for imports fromAustralia. The current U.S. tariff on prepared or preserved macadamia nuts will bephased out for Australia in equal annual stages until year four of the agreement.
The U.S.-Australia FTA will likely result in an increase in U.S. imports of prepared orpreserved macadamia nuts from Australia. The current 17.9 percent ad valorem tariffon these nuts has generally kept Australian exports from entering the U.S. market. TheU.S. industry thinks that increased imports of prepared or preserved macadamia nutsfrom Australia will lower the average macadamia kernel price in the United States,reducing farm gate prices, and, in the long term, result in the economic hardship formany growers and some of the smaller processors and manufacturers of value-addedproduct in Hawaii. Australian production of macadamia nuts reached 65.5 millionpounds in crop year 2003-04 and in 2002-03 (the most recent year for which exportdata are available) Australian exports were 51.8 million pounds.
U.S. exports to Australia in 2003 were less than 3 percent of U.S. total exports ofmacadamia nuts. The Australian tariff of 5percent onprepared nuts will be eliminatedimmediately upon the implementation of the FTA, resulting most likely in an increase inU.S. exports, though not a significant one.
Motor VehiclesThe U.S. NTR tariff on passenger motor vehicles, including minivans and sport-utilityvehicles, is 2.5 percent; the NTR tariff on trucks, including pickup trucks, is 25 percent;the NTR tariff on road tractors for semi-trailers is 4 percent; and the NTR rate on busesis 2 percent. All U.S. duties on motor vehicle imports from Australia will be eliminatedupon entry into force of the FTA. Australian imports of new and used passenger motorvehicles, campers, and mobile homes are subject to an NTR 15 percent customs duty,legislatively scheduled to be reduced to 10 percent in 2005 and to 5 percent in 2010.New and used commercial and all-wheel drive vehicles are subject to an NTR 5percent customs duty. Under the FTA, Australia would eliminate the 5 percent NTRduties upon entry into force of the Agreement, and reduce the 15 percent NTR duties inequal stages beginning on the date of entry into force of the Agreement, such duties tobe eliminated as of 2010.
The U.S.-Australia FTA will likely result in measureable increases in bilateralU.S.-Australian trade in motor vehicles, with the greater effect expected for U.S.exports. Both the U.S. and Australian industries are dominated by the same twocompanies, General Motors and Ford. The FTA will allow the U.S. and Australianoperations of these U.S. automakers to take advantage of each others’ strengths byfilling product gaps in each market. Australian tariff concessions may spur U.S.automakers to consider the export of U.S.-built products that may be marketable inAustralia. Moreover, Australian demand for SUVs and pickup trucks is growing, andU.S. automakers are well-positioned tobenefit from enhanced access to the Australian

xxiii
market. Likewise, these automakers may reevalaute sourcing strategies and decide tosource more ornewpassenger vehicles fromAustralia. Inparticular, removal of the25percent light truck duty may provide some incentive for automakers to import lighttrucks from Australia to fill market niches in the United States.
Certain Motor-Vehicle PartsIn the FTA, the United States and Australia both agreed to eliminate their tariffs oncertain motor-vehicle parts immediately upon the implementation of the Agreement.The U.S. NTR rateon thesemotor-vehicle parts is 2.5percent, andAustralianNTR tariffis significantly higher, at 15 percent. Both the U.S. and Australian motor-vehicle partsindustries likelywill benefit from enhanced export opportunities with the U.S.-AustraliaFTA, particularly vis-à-vis other import sources lacking similar FTA benefits. The FTAmay allow greater integration of the two industries and promote growth andefficiency, in part because of the industries’ historic linkages. Moreover, the economicstimulus expected from the FTA likely will lead to an improved Australian market formotor-vehicle parts.
The U.S. motor-vehicle parts industry is likely to experience a net gain as a result of theU.S.-Australia FTA. Because of the relatively small size of the Australian motor-vehicleparts industry and the low level of U.S. tariffs (2.5 percent ad valorem or less) to beeliminated, the FTA likely will result in a small increase in U.S. imports from Australiaand a negligible increase in total U.S. imports. However, the immediate elimination ofthe 15 percent Australian tariff on U.S. imports and the larger size of the U.S. industrylikely will boost U.S. exports under the FTA, leading to a measurable increase in U.S.exports to Australia and a small increase in total exports.
Textiles, Apparel, and FootwearU.S. imports of textiles and apparel likely will experience a small increase as a result ofthe FTA. Australia is a very small supplier of specialized, higher-end textiles andapparel to the United States. Also, most tariffs on the leading textile and apparelimports from Australia will be phased out over 10years, thereby reducing the incentiveto boost imports from Australia significantly in the short term. In addition following theelimination of U.S. quotas on textiles and apparel from WTO countries on January 1,2005, Australian apparel exporters will face increased competition in the U.S. marketfrom China and other low-cost exporting countries whose shipments are currentlyconstrained by quotas. Immediate trade opportunities also may reportedly be limitedby complicated customs procedures and a complex yarn-forward rule of origin. Themodel results, which do not reflect the yarn-forward rule, indicate a 57 percentincrease in U.S. imports of textiles and apparel from Australia due to the FTA.However, a recent study by Centre for International Economics (CIE)4 indicates thatonly about 9 percent of Australia’s exports of textiles and apparel to the United Statesmayqualify for tariff elimination under the Agreement’s rules of origin. In this case, theCommission estimates that the increase in U.S. imports of textiles, apparel, and leatherproducts due to tariff elimination could be as low as 10 percent.
4 Centre for International Economics, Canberra and Sydney, Economic Analysis ofAUSFTA—Impact of the Bilateral Free Trade Agreement with the United States, April 2004, pp. 53-54.

xxiv
The increase in U.S. textile and apparel exports to Australia likely will be small. It islikely that thegreatest growth inU.S. sector exportswill be in textile fabrics, particularlyin specialized textiles for industrial use, a sector in which the United States isparticularly competitive.
ServicesThe service sectors in the United States and Australia are substantially open.Therefore, the FTA is not expected to generate significant increases of U.S. exports orimports of services in the aggregate. The Agreement does provide other importantbenefits, however, particularly forU.S. providers of audiovisual, express delivery, andinformation technology services. One of the most important benefits is the automaticinclusion of services developed in the future. The FTA includes all services to bedeveloped, unless a service is explicitly exempted in the Agreement (i.e., negative listapproach). The FTA includes several important new benefits for service industries, inparticular binding existing market access and national treatment in Australia,increased protection of intellectual property rights, increased governmentprocurement opportunities, and additional e-commerce protections, includingcoverage of new products, and the non-discriminatory treatment of electronicallydelivered products (reducing or eliminating barriers that impede the use ofe-commerce). The Australian commitments on audiovisual services representAustralia’s first such commitments in a trade agreement, and are expected to set animportant precedent for future U.S. bilateral trade agreements. The United States hasa strong trade surplus with Australia in audiovisual services.
The FTA’s creation of a Professional Services Working Group is expected to facilitatetrade in professional services. The working group is to report regularly on progress inpromoting mutual recognition arrangements beyond those in place for certainprofessions, and the creation of model standards and criteria for licensing andcertification. The authority of U.S. states and Australian states and territories toregulate professional services is unaffected by the FTA (e.g., licensing).
Trade FacilitationThe range of activities that directly affect imports and exports-customs procedures,transportation rules and formalities, payments, insurance, etc., are all encompassedby the term “trade facilitation.” The simplification and harmonization of suchformalities and procedures across national borders constitutes facilitation. With thedecline in the significance of duties as a result of successive multilateral rounds of tariffand trade negotiations, and the increased reliance on technology to aid in theinternational movement of goods and services, the cost of doing business is directlyimpacted by delays, complicated documentation, lack of automation, and theimposition of government-mandated trade procedures. A free trade agreement canbe used by governments to attempt to lessen such costs and inefficiencies.

xxv
Under the U.S.-Australia FTA’s chapter on customs administration, the parties wouldensure that all trade-related legal measures are publicly available and that they areadministered in a uniform, impartial, and reasonable manner so as to avoid creatingobstacles to trade. An elaborate advance rulings process and access for importers toreview procedures would simplify their dealings with customs authorities and at thesame time help ensure that the agreement’s commitments are carried out. In addition,a clear structure for cooperation in customs matters should assist in implementing theFTA and carrying out its terms. Importers would also benefit from the certainty arisingfrom the FTA’s provisions on penalties, release and security, risk assessment, and thetreatment of express shipments. The end result should be expedited treatment of goodscovered by the agreement.
Figure ES-4 presents the likely effects of the U.S.-Australia FTA in the area of tradefacilitation. The Commission analysis suggests that the effects of removing non-tariffbarriers related to services, intellectual property rights, and investment under theU.S.-Australia FTA will have little impact on related U.S. sectors due to the relativelyfew existing trade barriers between the United States and Australia. Nonetheless,certain provisions in the FTA may foster trade facilitation in service industries. Forexample, removal of certain restrictive regulatory barriers may lead to increased U.S.exports in certain specific segments of the insurance industry, as well as greater salesby U.S. bank affiliates and affiliates of U.S. asset management firms in Australia.
InvestmentForeign investment is a primary channel by which businesses lower costs and increasecompetitiveness, essentially increasing the efficiency with which the world’s scarceresources are used. Seen previously as an alternative means for supplying a foreignmarket, trade and investment are increasingly seen as complementary. As foreigninvestment grows in importance as an engine of economic growth, the lack of detailedinvestment rules creates an even greater need for trade agreements to fill this gap.
TheU.S.-Australia FTA’sprovisionsonbilateral investmentwould result in national andnondiscriminatory treatment for all covered activities, and would set a clear minimumlegal standard against which the parties’ laws would be measured for compliance.This chapter of the FTA would govern the treatment of investments in times of strife andthe expropriation or nationalization of covered investment. It would also require thatcapital and other specified payments relating to covered investments be freelytransferrable without delay into and out of the parties’ territories. A range ofperformance requirements would be prohibited, and restrictions on the compositionofsenior management and boards of directors would likewise be barred. Procedures fordealing with investment disputes would be established, so that investors could know inadvance how tomanage theirdealings with the parties. The chapter contains anannexwhich outlines the non-conforming measures that would not be covered by certainobligations of the chapter. Overall, the chapter provides investors a higher level ofcertainty regarding investment rules, which is likely to encourage investment.

xxvi
Subject negotiated and FTA chapter Likely economic impact on U.S. economy: Qualitative Assessment
Figure ES-4U.S.-Australia Free Trade Agreement: Trade Facilitation Effects
S Improved transparency, efficiency, andpredictability of Australia’s laws.
S Agreement to share information to combatillegal transshipment of goods.
Technical barriers, ch. 8
S Australia to make its standards systemmore transparent and open.
S Creates opportunities for interested U.S.parties to comment on changes tostandards, technical regulations, andconformity assessment procedures.
S Provides for alternatives for reducingunnecessary technical barriers to trade.
S Secures national treatment in accreditationof conformity assessment bodies.
Customs administration, chs. 6, 20
Side letters/joint statement on SPS cooperation.
Benefits to U.S. exporters, but overall relatively small impacton the U.S. economy is expected because of Australia’slimited domestic market size.
More rapid, efficient inspection and admission proceduresensures faster express delivery service.
Benefits U.S. exporters, but overall relatively small impacton the U.S. economy is expected because of Australia’slimited domestic market size.
Possible future liberalization in fruit/vegetableopportunities.
Sources: Text of the U.S.-Australia FTA found at http://www.ustr.gov/new/fta/Australia/text/index.htm. Impact estimates obtainedfrom USITC estimates and calculations and compiled from multiple sources cited elsewhere in this report, including testimony from theCommission’s public hearing for this investigation held on Mar. 30, 2004, written submissions in response to the Federal Register noticefor this investigation (see appendix B), USITC staff interviews with industry officials, and reports filed by the various U.S. Governmenttrade policy advisory committees.

xxvii
Figure ES-5 presents the effects of the U.S.-Australia FTA on investment. The FTA willadd transparency to the investment regimes of the United States and Australia, but it isnot expected to generate significant amounts of new investment between the twocountries, as the investment environment in each is already substantially open.
The FTA contains some specific benefits for U.S. investors. The threshold for screeningof new investments by Australia’s Foreign Investment Review Board (FIRB) has beenraised to A$800 million (US$519.5 million in 2003) for new investments in mostsectors, up from the current threshold of A$50 million. Additionally, the FTA clearlyspecifies rules for investing in the audiovisual services industry, a first for a U.S. tradeprogram. The U.S. business community, however, would have preferred that the FTAincorporate an investor-state dispute settlement provision,5 and that Australiacompletely remove the FIRB investment screening process.
Regulatory EnvironmentThe FTA effects that are attributable to improved regulatory environment areunmeasured and largely intangible but are believed to be significant. Improvements incompetition policy and economic regulation affect how the market mechanismoperates, the former by setting broad guidelines for how firms operate, the latter bysetting in much greater detail the conditions of competition that affect how businessoperations take place typically using regulatory controls involving prices, quantities,qualities, and rules for entry into or exit from an industry.
The U.S.-Australia FTA would address a wide range of regulatory issues relating tobilateral trade. Additional intellectual property rights protections would be available,most of them immediately effective upon implementation of the FTA. Cooperation andconsultations in dealing with anticompetitive business practices would be required;business conduct affecting competition and state enterprises would be subject tocontrol. Protections and procedures applicable to bilateral investment would beprovided,withamechanism for investors toutilize in resolving disputes.With respect toboth labor and the environment, effective enforcement of domestic law, efforts toimprove national and international standards, and cooperation betweengovernments and with the private sector are required, and the parties agree not toweaken environmental laws to attract investment.
Figure ES-6 presents likely impacts of the U.S.-Australian FTA ina numberof areas thatare among the most difficult to quantify. Covered are the following areas, most ofwhich are addressed by a separate chapter of the Agreement: intellectual property,competition policy, trade remedies, labor, environment, transparency, and disputesettlement.
5 Under an “investor-state” mechanism, foreign investors may settle investment disputes througharbitration directly with the host country government.

xxviii
Subject negotiated and FTA chapter Likely economic impact on U.S. economy: Qualitative Assessment
Figure ES-5U.S.-Australia Free Trade Agreement: Investment Effects
Change in threshold level for review/screening of newforeign investments.
Change from A$50 million to A$800 million (US$519.5million) for investment in most industries could encourageincreased investment by U.S. investors.
Secure, predictable legal framework for U.S. investors.Opportunities also derive from common language,culture, and well- established legal traditions.
National treatment; most-favored-nation treatment. Increased U.S. investment opportunities in motorvehicles and certain service sectors, but overallrelatively minimal impact on the U.S. economy isexpected because of the openness that existed prior tothe negotiation of the FTA.
Sources: Text of the U.S.-Australia FTA found at http://www.ustr.gov/new/fta/Australia/text/index.htm. Impact estimates obtained from USITCestimates and calculations and compiled from multiple sources cited elsewhere in this report, including testimony from the Commission’s publichearing for this investigation held on Mar. 30, 2004, written submissions in response to the Federal Register notice for this investigation (seeappendix B), USITC staff interviews with industry officials, and reports filed by the various U.S. Government trade policy advisory committees.
Investment, chs. 11, 13

xxix
Subject negotiated and FTA chapter Likely economic impact on U.S. economy: Qualitative Assessment
Figure ES-6U.S.-Australia Free Trade Agreement: Regulatory Environment Effects
S New higher IPR standards, includingcertain TRIPs-plus provisions, for IPRprotection.
S Strengthened copyright provisions thataddress Internet and other digital piracyissues.
S Strengthened patent, trademark, and dataprotection measures.
S Most provisions become effective uponentry into force of the Agreement, withoutlong transition periods.
Intellectual property rights, ch. 7
S Commitment to provide fair procedures inadministrative proceedings covering trade andinvestment.
S Traders and investors to obtain prompt and fairreview of administrative decisions affecting theirinterests.
Potential increase in revenues for U.S. industries dependenton copyrights, patents, trade secrets, and trademarks.Software, motion picture, sound recording, book publishingindustries could benefit from strengthened Internet andother digital piracy provisions. Pharmaceutical andagricultural chemicals industries could benefit fromimproved patent and data exclusivity protections. A broadrange of industries could benefit from strengthenedtrademark and other IPR provisions of the Agreement.
Strengthened enforcement–criminal penalties, seizure,forfeiture, and destruction of counterfeit or pirated goods.
Benefits to U.S. exporters and investors, but overallrelatively small impact on the U.S. economy is expectedbecause of Australia’s limited domestic market size.Negotiated provisions help increase the effectiveness oftrade remedies, as well as minimizing the possibility ofmisuse of trade remedy measures.
Competition policy, ch.14
S Address issues of anticompetitive businessconduct, state monopolies, and stateenterprises.
S Seek cooperation and consultationprovisions that foster cooperation oncompetition law and policy, and that providefor consultations on specific problems thatmay arise.
Trade remedies, chs. 9
Labor, ch. 18
S Both parties commit to effectively enforce theirdomestic labor laws.
S Agreement includes cooperative mechanism forlabor issues.
S Both parties commit to effectively enforce theirdomestic environmental laws.
S Commitment not to weaken or reduceenvironmental laws to attract investment.
S Agreement includes a cooperative mechanism inenvironmental areas.
Environment, ch. 19
Benefits U.S. exporters and investors by pursuing tradeliberalizing measures and arrangements that contribute togreater competiveness which moves beyond the essentialfoundation of WTO multilateral disciplines. In addition to thedirect bilateral benefits to the parties, provisions establishedunder bilateral and regional agreements can often beleveraged into being adopted more broadly undermultilateral agreements, and thus benefit participants in themultilateral trade system.
Overall, the labor provisions in the Agreement areexpected to ensure that no disguised protectionism resultsby enforcing already existing labor laws.
Increased trade and investment opportunities under theAgreement create opportunities to enhance environmentalprotection, but also require sustained regulatory oversight toavoid creating or amplifying adverse environmentalexternalities. The investment protection and state-to-statedispute resolution provisions in the Agreement areconsidered by a number of environmental advisors to be animprovement over those found in the NAFTA, and so areanticipated to channel environmental challenges moretoward resolution than confrontation, thereby betterintegrating the needs for environmental protection with theneeds of business investment.

xxx
Subject negotiated and FTA chapter Likely economic impact on U.S. economy: Qualitative Assessment
Figure ES-6-ContinuedU.S.-Australia Free Trade Agreement: Regulatory Environment Effects
S Encourage the early identification andsettlement of disputes through consultation.
Institutional Arrangements and DisputeSettlement, ch. 21
Benefits U.S. exporters and investors by ensuring thetransparency and predictability of government-to-governmentdispute settlement, as a prerequisite for competitive businessunder fair conditions. Benefits business decisionmaking andcompetitive conditions by focusing on fine-based penalties thatare less likely to disrupt trade flows between the parties than adispute-settlement mechanism that results in trade restrictivemeasures.
S Seek to establish fair, transparent, timely,and effective procedures to settle disputesthat might arise under the agreement.
Strengthening of the overall business climate and theopportunities for increased bilateral trade and investment.
Sources: Text of the U.S.-Australia FTA found at http://www.ustr.gov/new/fta/Australia/text/index.htm. Impact estimates obtained from USITCestimates and calculations and compiled from multiple sources cited elsewhere in this report, including testimony from the Commission’s public hearingfor this investigation held on Mar. 30, 2004, written submissions in response to the Federal Register notice for this investigation (see appendix B), USITCstaff interviews with industry officials, and reports filed by the various U.S. Government trade policy advisory committees.

xxxi
The FTA provides for improved protection and enforcement for copyrights and otherintellectual property and may lead to increased revenues for certain U.S. industriesdependent on intellectual property rights.
The U.S.-Australia FTA goes further than the WTO Agreement on Trade-RelatedAspects of Intellectual Property Rights (TRIPs) by extending the terms of protection forcopyrights, trademarks, patents, trade secrets, andother formsof intellectual propertyrights.
The U.S.-Australia FTA strengthens enforcement of copyright piracy and trademarkcounterfeiting, by requiring that certain infringements be considered a criminaloffense when engaged in willfully and on a commercial scale. It also requires theseizure, forfeiture, and destruction of counterfeit and pirated goods and theequipment used to produce them.
According toU.S. industry representatives, an important achievement of the FTA is thatit addresses Internet and other digital piracy, which was not specifically addressed inTRIPs.
The U.S.-Australia FTA is expected to result in increased revenues for U.S. industriesdependent on intellectual property protection. U.S. copyright industries that wouldpotentially benefit most from strengthened provisions regarding digital piracy are themotion picture, sound recording, software, and book publishing industries. Industriesthat could benefit from greater patent and data protection provisions are thepharmaceutical and agricultural chemicals industries. A broad range of U.S.industries should benefit from strengthened trademark and other IPR provisions of theFTA.
Literature Review
Studying the economic impact of FTAs entails investigating static effects, such as tradecreation and trade diversion, as well as terms of trade (i.e., the price of exports relativeto the price of imports). In addition, related scale effects and nonquantifiable effectshave to be considered. The FTA effects that are attributable either to the liberalizationof the supply of services, or to FTA provisions regarding intellectual property rights, orinvestment usually remain unmeasured. As the review of literature shows, these FTAeffects could be more significant than the effects of removing tariffs.
A small number of studies have directly assessed the impact on the United States of ahypothetical U.S.-Australia FTA. There are three studies employing computablegeneral equilibrium analysis of a U.S.-Australia FTA that directly assess the impact ofsuch an FTA on the United States. These studies all estimated a very small effect of apotential U.S.-Australia FTA on the United States.
These studies generally estimated the effects of removing all tariffs and selectednon-tariff barriers, although one, with the smallest estimated effects, only considered

xxxii
the removal of tariffs. The welfare benefit to the United States was estimated by thesestudies to be in the range of 0.01 percent of U.S. GDP to 0.20 percent. The USITCwelfare estimate was similarly small and within the range of estimates in the literature.
A study by CIE6 finds small positive effects, both for Australia and the United States,whereas ACIL7 finds small negative effects of the Agreement on Australia. Brown,Kiyota, andStern8 find largerpositive effects forboth countries,modeling largeeffectsof liberalization in services, and strong dynamic effects of investment liberalization,among other things.
To compare more directly the outcomes of these other models to that of theCommission, the USITC model was used to prepare welfare estimates using the tariffassumptions of the other models. By applying the alternative trade barriers to theUSITC model, theobjective was to determine the extent towhich the results obtained byother authors depended on the barriers, as opposed to other differences between themodels. For the most part, differences did not depend on assumptions related to tradebarriers but on the assumptions related to substitution elasticities, investment effects,and scale economies.9
Interested Parties
Interested party views of the FTA expressed indirect testimony to the Commission in thisinvestigation, as well as written submissions, have been mixed, but on balancegenerally positive. The majority of interested parties praised the text and provisions ofthe FTA, particularly those parties representing the services sector. Specifically,interested parties indicated that the commitments in the FTA provide for enhancedmarket access, promote a stable business environment for certain service providers,facilitate bilateral trade, and offer a high degree of intellectual property rightsprotection for firms. With some exceptions, representatives of the manufacturing and
6 Leon Berkelmans, Lee Davis, Warwick McKibbin, and Andrew Stoeckel, “Economic Impacts of anAustralia-United States Free Trade Area,” Centre for International Economics, Canberra and Sydney,June 2001, found at Internet address http://www.dfat.gov.au/publications/aus_us_fta/aus_us_fta.pdf,retrieved Apr. 20, 2004. (Cited as CIE 2001.) In 2004 CIE issued a follow-up after the FTA was negotiated.The new study does not report findings for the United States., and it reports slightly higher positive effectsfor Australia than did the 2001 CIE report. See: CIE, Economic Analysis of AUSFTA: Impact of the BilateralFree Trade Agreement with the United States, Centre for International Economics, Canberra and Sydney,April 2004.
7 ACIL Consulting, “ Bridge Too Far?” An Australian Agricultural Perspective on the Australia/United States Free Trade Area Idea, Report of the Rural Industries Research and DevelopmentCorporation, Canberra, February 2003.
8 Drusilla K. Brown, Kozo Kiyota, and Robert Stern, “Computational Analysis of the U.S. BilateralFree Trade Agreements with Central America, Australia, and Morocco,” Feb. 8, 2004, found at Internetaddress http://www.fordschool.umich.edu/rsie/seminar/BrownKiyotaStern.pdf, retrieved Apr. 20,2004.
9 For a further discussion of the studies reviewed by the Commission, see chapter 8, ”Review ofLiterature.”

xxxiii
commodity goods sectors praised the FTA and felt that implementation of theAgreement will improve commercial trade. Indeed, companies expressed satisfactionthat this Agreement eliminates virtually all of Australia’s manufacturing tariffs on thefirst day the Agreement is implemented. They also thought the Agreement will providefor strong IPR protection for U.S. manufacturers. A few parties expressed concern thatthe carve out for sugar could lead other countries to withhold commitments in futureagreements. Dissenting views were expressed by three U.S. Senators and oneCongressman. Congressional areas of particular interest were the dairy and beefsectors and the Hawaiian macadamia nut industry. Of the twelve groups or companyrepresentatives who appeared before the Commission, ten were positive in theirreaction to the FTA, while two expressed a differing opinion on the pact with Australia.Dissenting opinions were expressed concerning the impact of the FTA on the beef anddairy as well as macadamia nuts sectors.


1
CHAPTER 1Introduction
Purpose of the Report
This report analyzes the likely impact of the U.S.-Australia Free Trade Agreement(FTA) on the U.S. economy as a whole and on specific industry sectors and the interestsof U.S. consumers. The U.S. International Trade Commission (USITC or “theCommission”) initiated work on this fact-finding investigation in accordance withsection 2104(f) of the Trade Act of 2002 following receipt of a letter of request from theUnited States Trade Representative (USTR) on February 17, 2004.1
As specified in section 2104(f)(2)-(3) of the Trade Act, the Commission shall submit tothe President and the Congress (not later than 90 calendar days after the Presidententers into the agreement)2 a report assessing the likely impact of the U.S.-AustraliaFTA on the U.S. economy as a whole and on specific industry sectors, including theimpact the Agreement will have on the gross domestic product, exports and imports,aggregate employment and employment opportunities, the production, employment,and competitive position of industries likely to be significantly affected by theAgreement, and the interests of U.S. consumers.
Section 2104(f)(3) states that the Commission, in preparing its assessment, will reviewavailable economic assessments regarding the agreement, including literatureregarding any substantially equivalent proposed agreement, and include in itsassessment a description of the analyses used and conclusions drawn in such literatureand a discussion of areas of consensus and divergence between the various analysesand conclusions, including those of the Commission regarding the Agreement.
1 A copy of the request letter from USTR is in Appendix A. The Commission’s Federal Register noticeof institution for this investigation is in Appendix B.
2 On Nov. 13, 2002, President Bush notified Congress of his intent to initiate FTA negotiations withAustralia. USTR announced on Feb. 8, 2004 that the United States and Australia had successfullyconcluded negotiations for the U.S.-Australia FTA (negotiations began in Mar. 2003). On Feb. 13, 2004,President Bush signed a letter notifying Congress of the intent to enter into the U.S.-Australia FTA; the letterstarted the countdown for when the Agreement can be signed. On Mar. 3, 2004 the text of theU.S.-Australia FTA was made available to the general public. U.S. Department of Commerce,“U.S.-Australia Free Trade Agreement,” found at http://www.mac.doc.gov/AustraliaFTA/whatsnew.html. On Mar. 15, 2004, USTR received reports from 31 trade advisory groups commenting onthe proposed U.S.-Australia FTA.

2
Scope of the Report
This report provides an analysis of the likely impact of the U.S.-Australia FTA on theU.S. economy as a whole and on specific sectors and the interests of U.S. consumers. Itincludes a brief profile of the Australian economy as well as a summary of theproposed U.S.-Australia FTA. It also includes a review of relevant economic literatureon the Agreement.
The Commission’s analysis examines all 23 chapters of the FTA.3 A quantitativeassessment is conducted for Chapters 2-4 (i.e., liberalization of tariffs and selectednontariff barriers) that increase market access for U.S. products in Australia. Thiscomputational analysis is supplemented with a qualitative analysis of the potentialimpact of increased market access on certainproduct and service sectors including livecattle and beef; dairy products; citrus fruit; certain fresh and processed fruit;macadamia nuts; motor vehicles; motor-vehicle parts; textiles, apparel, and footwear;agricultural and horticultural machinery; household appliances; and such servicesectors as audiovisual services, express delivery services, financial services,information technology services, and education services (Chapters 5, 7, 10, 12, 13, 15,and 16). Due to the data constraints and intangible nature of effects, a qualitativeassessment is conducted for negotiated objectives that facilitate trade (Chapters 6, 7,8, and 20), enhance investment opportunities (Chapters 11 and 13), and improveregulatory environment (Chapters 9, 10, 12, 14, 17-19, and 21).
Approach of the Report
For the quantitative assessment, the study employs a multicountry model witheconomywide coverage of merchandise and service sectors (a global computablegeneral equilibrium model). This USITC model is based on the Global Trade AnalysisProject (GTAP) database, which is described more fully in appendix D. It was used toestimate the likely trade and economic impact of the tariff and tariff-rate quotareductions of the U.S.-Australia FTA for 23 aggregated sectors. The commodityaggregation adopted here identifies sectors that have relatively high domestic-worldprice gaps due to tariffs and tariff-rate quotas (TRQs) and relatively large trade flows.Theeconomies covered in theanalysis included theUnitedStatesandAustralia, aswellas 11 regional aggregates representing the rest of the world.
The GTAP database, which represents the global economy in 2001, was adjusted toreflect expected changes in the global economy through economic growth in the worldin 2005, the year the proposed U.S.-Australia FTA is scheduled to enter into force. Theadjusted database reflects the scheduled removal of textile and apparel quotas under
3 Chapters 1, 20, 22, and 23, covering administrative and legal matters surrounding the FTA havenot been specifically focused on in this report.

3
theAgreement on Textilesand Clothing,as well as other international agreements. Thedata also reflect the FTAs between the United States and NAFTA partners, Israel,Jordan, Chile and Singapore.4 The analysis is static and assumes the U.S.-AustraliaFTA is fully implemented and its effects felt on January 1, 2005. In the model, the FTA’sprovisions are not phased in over time, nor are its effects assumed to be graduallyrealized over time. A series of simulations was conducted to determine the sensitivity ofimpacts to the critical parameters that determine the response to changes in tradeprices. The analysis and discussion of FTA impacts are based on the ranges obtainedfrom the sensitivity analysis.
The literature review for this investigation includes a description of analyses of theeconomic effects of other free trade agreements substantially similar to the proposedU.S.-Australia FTA. The economic literature reviewed was drawn from relevantacademic, public sector, and private sector institutions.
The qualitative analysis includes an assessment of the potential impacts on U.S.imports, U.S. exports, and the U.S. industry as a whole of specific provisions of theproposed U.S.-Australia FTA. Product and service sectors identified for qualitativeanalysis were selected based upon a comprehensive examination and considerationof the following: examinationof the trade liberalization schedules of theU.S.-AustraliaFTA to assess the relative liberalization of sectoral trade with respect to tariff andnontariff measures; U.S.-Australia bilateral trade flows; assessments of the apparentsensitivity of specific industries, commodities, and service sectors; and determinationsmade based on the expertise of Commission industry analysts. Unlike the quantitativeanalysis of Chapter 3, the qualitative analysis in Chapter 4 assesses the impact of theU.S.-Australia FTA by taking into account the staging process.
Economic models capture many important factors for the question underconsideration. However, they are limited in their ability to reflect the degree ofcomplexity evident in the real world.5 Therefore, qualitative analysis is conducted tosupplement the model-based analysis. The major contribution of the model-basedanalysis is its consideration of all sectors in the U.S. economy, as well as their relativeeconomic importance. The contribution of the qualitative analysis is its considerationofcommodity-specific issues.
Data and other information for the study were obtained from industry reports,interviews with government and industry contacts, official reports of the USTR advisorycommittees, hearing testimony,6 written submissions to the Commission, and the GTAPdatabase. Other data sources include the U.S. Department of Agriculture; the U.S.Department of Commerce; the U.S. Department of State; the U.S. Embassy in
4 The adjusted database also reflects Uruguay Round tariff reductions insofar as they are reflectedin trade data projected to 2005. Moreover, the FTAs between Australia and its trading partners aremodeled for selected products where necessary data are available. The agreement between Australiaand Thailand pertaining to motor vehicles and parts is incorporated.
5 See Appendix D for a discussion of the limitations related to the modeling framework.6 Hearing date: Mar. 30, 2004.

4
Canberra, Australia; the International Monetary Fund (IMF); the World TradeOrganization (WTO); the Australian Department of Foreign Affairs and Trade; andthe Australian Productivity Commission.
Organization of the Report
Chapter 2 of this report presents an overview of the U.S.-Australia FTA. Chapter 3reports quantitative estimates of the likely trade and economywide effects for theUnited States of increased market access due to the removal of tariff and selectednontariff barriers (for which tariff equivalents were available) in the U.S. andAustralian economies. The assessment of the U.S.-Australia FTA reports a number ofmeasures of U.S. economic activity, including exports, imports, production, andemployment. Chapter 4 presents the results of a qualitative analysis of the likely impactof the U.S.-Australia FTA on selected sectors. Chapter 5 discusses the investmentprovisions of the U.S.-Australia FTA and provides a qualitative assessment of thepotential impact on the United States. Chapter 6 provides a survey of the intellectualproperty rights (IPR) provisions of the U.S.-Australia FTA and provides a qualitativeassessment of the potential impact on the United States. Chapter 7 addresses theeffects of a number of other nonquantifiable facets of the Agreement: e-commerce,government procurement, customs administration, technical barriers to trade,competition policy, trade remedies, labor, and environment. Chapter 8 presents theliterature review as well as the comparison between the Commission’s findings and thefindings from studies reviewed. The report concludes with Chapter 9, an overview ofthe positions and views of interested parties who responded to the Commission’sFederal Register notice inviting public submissions on the impact of the U.S.-AustraliaFTA.
Country Profile
Figure 1-1 provides an economic profile of Australia, presenting data on recentmacroeconomic indicators, important products in Australian world trade, leadingtrading partners, and the major products in bilateral trade with the United States. Theoverview provides the main features of the Australian economy relevant to theCommission’s assessment of the U.S.-Australia FTA.

5
Economic indicators
2002 2003
Population (mn) . . . . . . . . . . . . . . . . .GDP (nominal A$ bn) . . . . . . . . . . . .GDP (US$ bn) . . . . . . . . . . . . . . . . . .Real GDP growth (%) . . . . . . . . . . . . .Goods exports (US$ mn) . . . . . . . . . .Goods imports (US$ mn) . . . . . . . . . .Trade balance (US$ mn) . . . . . . . . . .Exchange Rate (A/US$) . . . . . . . . . .Exchange Rate (US$/A) . . . . . . . . . .
19.7734.3398.9
3.865,09970,530-5,431
1.840.56
19.8779.7505.6
3.069,72383,806-14,083
1.540.75
Main trade commodities, US$ million, 2003
Exports Imports
Coal . . . . . . . . . . .Gold . . . . . . . . . . .Iron ore . . . . . . . . .Petroleum . . . . . . .Aluminum . . . . . . .
8,0214,3253,7513,7162,784
Motor vehicles . . . .Petroleum . . . . . . .Computers . . . . . . .Aircraft . . . . . . . . .Medicines . . . . . . .
7,9155,0703,5763,3343,247
Main trade partners, percent of total, 2003Export markets Suppliers
Japan . . . . . . . . . .United States . . . . .China . . . . . . . . . .New Zealand . . . .Korea . . . . . . . . . .
18.28.88.47.67.5
United States . . . . .Japan . . . . . . . . . .China . . . . . . . . . .Germany . . . . . . . .United Kingdom . . .
15.312.511.06.14.2
Source: Government of Australia, Dept. of Foreign Affairs andTrade.
Economic overviewAustralia ranks as the 10th largest industrialized economy in theworld (based on 2003 rankings of members of the Organizationfor Economic Cooperation and Development).
Australia’s economy is small relative to that of the United States.Australia’s gross domestic product (GDP), is 4.6 percent the size ofthe U.S. GDP. Australia’s population is 6.7 percent of that of theUnited States.
Services account for approximately 63 percent of Australia’s GDP.The largest service sector is finance and business services, whichaccounts for 17.5 percent of Australia’s GDP.
Raw materials, primarily metals and minerals, are Australia’slargest global exports. Passenger motor vehicles ranked asAustralia’s leading import in 2003.
Almost 9 percent of Australian exports were sent to the UnitedStates in 2003, making the United States Australia’s second largestexport destination.
The United States was Australia’s leading supplier in 2003,accounting for over 15 percent of total Australian imports.
In addition to membership in the World Trade Organization(WTO), Australia is a member of the Asia-Pacific EconomicCooperation (APEC) forum and the Organization for EconomicCooperation and Development (OECD).
Australia’s other key bilateral trade agreements include:S Australia-Thailand FTA (signed October 2003);S Australia-Singapore FTA (eff. July 2003);S Australia-New Zealand Closer Economic Relations FTA
(1983); andS Australia-Japan Trade and Economic Framework (2003) to
liberalize bilateral trade and investment.Australia also participates in other regional trade and economicfora, including:
S Association of Southeast Asian Nations (ASEAN)-CER CloserEconomic Partnership to expand trade and investment andpromote economic integration between Australia and NewZealand and the ASEAN FTA members, and
S The Indian Ocean Rim Association for Regional Cooperationgroup of 18 Indian Ocean littoral and island states,organized to facilitate trade and investment in the region.
ECONOMIC PROFILE
AUSTRALIA
Source: Economist Intelligence Unit (EIU), “Australia: EconomicStructure,” EIU Viewswire, April 2004.
Origins of GDP (2002)
Agriculture andMining 8%
Other 12%
Manufacturing 11%
Construction 6%
Services 63%

6
Selected U.S. exports to Australia, US$ million, 2003
Aircraft . . . . . . . . . . . . . . . . . . . . . . . . . . . . . . . . . 1,614
Aircraft parts . . . . . . . . . . . . . . . . . . . . . . . . . . . . . 367
Medicines . . . . . . . . . . . . . . . . . . . . . . . . . . . . . . . 220
Motor vehicle parts . . . . . . . . . . . . . . . . . . . . . . . . 216
Purebred breeding horses . . . . . . . . . . . . . . . . . . . 202
Fertilizers . . . . . . . . . . . . . . . . . . . . . . . . . . . . . . . . 165
Computer parts . . . . . . . . . . . . . . . . . . . . . . . . . . . 141
Motor vehicles . . . . . . . . . . . . . . . . . . . . . . . . . . . . 133
Off-highway dump trucks . . . . . . . . . . . . . . . . . . . 131
Medical, surgical, veterinary instruments & parts . 122
AUSTRALIA-CONTINUEDECONOMIC OVERVIEW-Continued
Beef, frozen 726. . . . . . . . . . . . . . . . . . . . . . . . . . . . . . . . . . . . .Wine 615. . . . . . . . . . . . . . . . . . . . . . . . . . . . . . . . . . . . . . . . . .Crude petroleum 267. . . . . . . . . . . . . . . . . . . . . . . . . . . . . . . . .Beef, fresh or chilled 163. . . . . . . . . . . . . . . . . . . . . . . . . . . . . .Aluminum oxide 159. . . . . . . . . . . . . . . . . . . . . . . . . . . . . . . . .Motor vehicles 140. . . . . . . . . . . . . . . . . . . . . . . . . . . . . . . . . . .Sweaters and pullovers, cotton, knitted or crocheted 135. . . . . .Titanium ores and concentrates 121. . . . . . . . . . . . . . . . . . . . . .Meat of sheep, cuts with bone in, fresh or chilled 110. . . . . . . .Airplane or helicopter parts 107. . . . . . . . . . . . . . . . . . . . . . . .
Selected U.S. imports to Australia, US$ million, 2003
0
2
4
6
8
10
12
14
2000 2001 2002 2003
Mill
ion
dolla
rs
U.S. exports U.S. imports Trade balance
Source: Compiled from official statistics of the U.S. Department ofCommerce.

7
CHAPTER 2Overview of the U.S.-Australia FTA
Background on Free Trade Agreements
Like other free trade agreements (FTAs) to which the United States is a party,1 theproposed agreement between the United States and Australia would create apreferential regime with a specific, negotiated range of goods and services measuresof mutual benefit or interest to the parties and with commitments covering othertrade-related matters. The FTA would cover almost every product in bilateral trade,with rules setting the scope of preferences for goods under each tariff category.2 Thepreamble states that this pact would strengthen cooperation and economic ties, set astructure of rules on bilateral trade, reduce barriers between the two partners, andimprove the business environment while fostering creativity. The 23 chapters of theAgreement set forth the legal obligations of the parties, together with schedules ofconcessions, rules of origin, and annex commitments and exceptions, that werenegotiated to cover trade-related matters of interest to the parties. Commitments oninvestment, intellectual property, environment, labor, and similar matters also areincluded in the agreement.
Brief Summary of Treaty Provisions
IntroductionWhile the text3 of the FTA with Australia is largely modeled upon recent FTAsnegotiated and implemented by the United States, it reflects that both parties aredeveloped nations with relatively similar legal systems, subordinate governmentalentities, and complex business structures. Certain provisions are identical tocorresponding provisions in the North America Free Trade Agreement (NAFTA) orFTAs with Singapore and Chile, while others reflect and rely upon multilateralinstruments of the World Trade Organization (WTO). For example, the text contains
1 Agreements with Canada, Israel, Jordan, Mexico, Singapore, and Chile are already in place.2 One product sugar, which is produced and processed in significant quantities in both countries–is
not afforded any benefits.3 The draft text of the Agreement as of March 3, 2004, as posted on the Web site of the Office of the
United States Trade Representative, is the basis of this chapter. Seehttp://www.ustr.gov/new/fta/Australia/text/index.htm for the Agreement and its side letters, alongwith other information.

8
preferential agricultural tariff-rate quotas4 (TRQs) based on broader WTO TRQs, aswell as provisions relating to intellectual property protections that adopt by referenceor draw upon commitments in other agreements. The draft FTA also includescommitments to observe certain WTO agreement obligations between the parties;these bilateral obligations would continue to exist independently even if the WTOagreement provision on the corresponding matter were eliminated or somehowceased to apply. Other FTA commitments deal with specific aspects of U.S. traderelations with Australia, as is further reflected by numerous side letters on specificmatters. Some portions of the agreement–such as those dealing with market accessand intellectual property rights–are particularly significant and will be described ingreater detail below. The discussion attempts to summarize briefly the text ofagreement chapters and is not intended to interpret them or identify the negotiators’intent.
Summary of Tariff CommitmentsUnder the Agreement and its schedules of concessions, duties on a wide range ofeligible goods would be eliminated immediately, while duties would be phased out formore sensitive originating goods of the regions. Most goods produced in the UnitedStates (other than textiles and apparel and some motor vehicle products) under theterms of the Agreement’s rules of origin5 would be guaranteed existing duty-freeaccess or be made immediately free of duty. Australia’s base duty rates fall intoseveral bands–free, 5 percent, 10 percent, 15 percent or 25 percent–and these dutieswould be eliminated for originating goods under six staging categories. By contrast,the more complex duty structure of the United States would give rise to 11 duty stagingcategories for Australia’s exports, with duties phased out over periods of 4 to 18years.Sensitive Australian agricultural shipments to the United States would receive benefitsunder special tariff-rate quotas; a small number of tariff categories see little tariffreduction until the end of the transition period.
These FTA tariff benefits are given only to “originating goods” under the terms andrules of the Agreement, and the rules are based upon the shared Harmonized System(HS) tariff nomenclature structure. Originating goods are of two types–namely, those
4 In a TRQ, two rate lines are minimally required, with one according a lower duty rate to imports upto a specified trigger quantity, and a second one according a higher duty rate to all other shipments. Itshould be noted that an importer may choose to enter a shipment into the United States under either rateline, until the trigger quantity is filled, and that this might occur where unit values of the good in questionvary by country, quality, time of entry, etc. In the Uruguay Round, as of Jan. 1, 1995, TRQs replaced priorabsolute quotas imposed under section 22 of the Agricultural Adjustment Act (7 U.S.C. 624) or othermeasures. The over-TRQ duty rate is intended to be economically prohibitive, thus restricting imports to thein-quota or trigger quantity.
5Goods are evaluated to identify the particular country to which they are attributable in the ordinarycustoms sense so as to determine whether they are eligible for either normal trade relations (NTR) orcolumn 2 duty rates, in the case of the United States. Additional rules, more clearly described as “rules ofpreference,” determine if a good that would otherwise be dutiable at NTR rates can be accorded aspecial duty rate upon importer compliance with Customs requirements. In the case of our FTAs, a goodthat meets FTA requirements is referred to as an originating good of the FTA partner in question, and theimporter must claim the preference and establish eligibility to Customs’ satisfaction.

9
comprising inputs only from the two parties and those complying with rules statingrequired particular changes in HS chapter, heading, or subheading classificationfrom foreign inputs to finished goods, based upon processing of third-country inputs ina partner country. Thus, not every “product of” a party in the ordinary customs sense orevery good shipped from one party to the other would receive preferential tarifftreatment, making it unlikely that 100 percent of trade between the parties will enterfree of duty even after the transition period. In light of the complexity of the rules, andthe difficulty of obtaining information on current input sourcing patterns and types oflocal processing for every good, it is impossible to take the FTA rules of origin fully intoaccount in this report. For individual products, some of this information may beavailable and may be usable in an economic model, but for others it may be necessaryto assume that importers would claim FTA benefits for all current trade (based on thebroader concept of substantial transformation) and then try to assess whether partnercountries have any unused production capacity that might add to such trade levels.Rules of origin are discussed below to the extent practicable.
Chapter-by-Chapter Review6
Chapter 1: Establishment and DefinitionsThe chapter states that the parties agree to set up a free trade area that is consistentwith the General Agreement on Tariffs and Trade (GATT) 1994, reaffirm that existingbilateral rights and obligations continue to apply, and restate that nothing in the FTA isto be read as altering any legal obligation under another international pact. Variousdefinitions are also set forth as part of the general provisions. Among them, the term“customs duties” includes any customs or import duty7 and charges but not internaltaxes, antidumping or countervailing duties, fees for import services (such as themerchandise processing fee, as to which there are separate obligations), oragricultural safeguard duties. An important definition delineates the territory of eachparty to which the FTA will apply: for the United States, it includes the customs territory,U.S. and Puerto Rican foreign trade zones, and the undersea international economiczone (the coastal waters underU.S. legal control are presumably included), but not theinsular possessions and not anyarea of outer space. ForAustralia, the definition is “theterritory of the Commonwealth... excluding all external territories other than [severalsmall Pacific islands]” and including [its] territorial sea, contiguous zone, exclusiveeconomic zone and continental shelf” without any mention of any free trade zones orother special customs areas.
Chapter 2: National Treatment and Market AccessThe chapter’s commitments on national treatment are similar to the correspondingprovisions of the GATT 1994 but apply onlywithin the region; thus, the obligations andmarket access concessions apply only to originating goods of the parties. The parties
6 References to chapters and articles in this section are to the corresponding provisions of theAgreement text.
7 The definition does not specify whether global safeguard duties would be covered.

10
agree to eliminate their customs duties on originating goods under the attachedschedules,8 to refrain from increasing any customs duty or imposing a new customsduty, and to apply the WTO Customs Valuation Agreement to determine the customsvalue of goods in trade. Obligations on temporary admission of goods are included inarticle 2.5, and in article 2.6 each party agrees to facilitate the duty-free access ofgoods entered for or following repairs or alterations in the other. The parties agree toban export taxes, but this provision should not require any U.S. legal change becausesuch taxes are prohibited by the Constitution. The parties also are barred fromadopting or expanding duty waivers related to performance requirements.
Other provisions in the chapter are similar to those of other FTAs and deal withtemporary importations, speedy release of goods, transshipment of goods, vehicles orcontainers used in international traffic, repaired/altered goods, duty-free entry forcommercial samples, etc. These provisions parallel existing U.S. law, perhapsrequiring only minor Customs regulatory adjustments. Article 2.9, prohibiting importand export restrictions on trade among the parties, is not found inNAFTA, because thesubject matter was first dealt with specifically in the GATT 1994 and the Agreement onTextiles and Clothing (ATC); the provisions and obligations of Article XI of GATT 1994will controlwhethera specificmeasurewouldbeallowedunder this agreement.Article2.9 recognizes that GATT 1994 controls provisions on export price requirements andcertain other areas and reiterates that the parties’ rights under various WTOagreements, of which both are members, are dictated by those agreements.
In various additional provisions of the chapter concerning trade in goods,merchandise processing fees (the so-called customs user fee) must be eliminated byboth parties on imports of originating goods, although certain “administrative fees”directly related to the cost of services (such as filing fees for entries) are allowed. Theparties agree that other fees and charges that are not duties or their equivalent will bedirectly related to administrative services being rendered. The two countries would notbe allowed to require “consular transactions, including related fees and charges” withrespect to any importation of goods of a party, and this protection should facilitatetrade and make its documentation simpler and cheaper. All fees and charges on tradein goods are required to be published on the Internet. A Committee on Trade in Goodsis established in section E to promote bilateral trade and address trade barriers withrespect to goods. Section F sets forth several definitions related to market access.Annexes set forth each party’s exclusions from coverage under the chapter, includingU.S. log export controls and the Merchant Marine Act and Australian exemptions onagricultural marketing arrangements for various goods and a few other limitedcategories; both parties exempt actions authorized by the WTO Dispute SettlementBody.
With regard to scheduled concessions on trade in goods, the U.S. base duty rates arethe 2003 column 1-general rates of duty and Australia’s 2003 duty rates applicable to
8 A summary of the thirteen staging categories for goods is provided herein (pp. 2-6 and 2-7).

11
U.S. goods. Thirteen duty staging categories are established: (A) immediate duty-freeentry; (B) four equal annual stages; (C) eight equal annual stages; (D) 10 equal annualstages; (E) continuation of a party’s existing most favored nation (MFN) duty; (F) 18annual stages; (G) delayed onset reductions starting in year 7 and continuing throughyear 18; (H) delayed onset staging starting in year 9 and continuing through year 18,and (I) duties remaining at base rates: (T1) for covered textiles and apparel with baseduties over 3 percent ad valorem, the applicable rate would drop to 3 percent throughyear 9 and be eliminated as of year 10; (TX) for covered textiles and apparel whosebase duty rates are from 3 percent to 5.5 percent, a slight reduction would occurthrough year 9, larger reductions in years 10-14, and duty elimination in year 15; (T2)the same general pattern of tariff cuts as in category TX would be given to coveredtextiles and apparel with base duty rates from 3 percent to 8 percent ad valorem; and(T3) the same pattern of tariff cuts would occur for covered textiles and apparel withbase duty rates from 3 percent to 15 percent.
Chapter 3: AgricultureChapter 3 sets forth provisions governing trade in agricultural products, including theimplementation and administration of tariff-rate quotas; it starts with a provisionstating that the two parties will work together at the WTO to end barriers to trade andtrade-distorting support payments. Under the text, a Committee on Agriculture iscreated to address barriers to trade, and export subsidies are barred. A major subjectof the chapter is agricultural safeguards, the ceiling for which is limited to the lower ofthe applied MFN duty rate or the MFN applied duty on the day before the date of entryinto force of this FTA. An adjustment mechanism is provided for goods subject to TRQswhere a party is importing more of a covered agricultural product from third- countrysources and then shipping more of its domestic output to the other party. In year 20, theparties are to consult about modifying dairymarket access commitments. A U.S. annexsets forth rules forhorticulture price-based safeguards, alongwith quantity-basedandprice-based beef safeguards.
Chapter 4: TextilesThis chapter treats these products separately for rules of origin and other regulatorypurposes, and discusses bilateral emergency actions at some length. An emergencyaction may only be taken after investigation by a competent authority, written notice,and consultations, if requested. No emergency action may be maintained for morethan two years, with a two-year extension, and may not be taken more than 10 yearsafter the elimination of customs duties for that good. The party taking the emergencyactionmust provide trade-liberalizing compensation, and the parties retain their rightsto restrain imports in accordance with the WTO ATC or WTO Safeguards Agreement.There are provisions dealing with customs cooperation on textile and apparel matters,verification, and enforcement. Rules of origin (“ROOs”) for the sector are subject toconsultations and possible adjustment. An annex contains specific rules of origin forHarmonized Tariff System (HTS) chapters 50-63 as well as for the textile goods inchapters 42, 70, and 94. While most of these tariff-shift ROOs are at the two- or
12
four-digit HS level, the ROOs for chapters 61 and 62 on apparel are primarily at thesix-digit level. These textile and apparel rules can be generally summarized as being“fiber forward” or “yarn forward” rules. Yarns must be made of originating fibers togain a tariff preference. In order for a textile fabric or a good of chapters 61 through63 made from fabric to be eligible for a tariff preference, the yarn used in such a goodmust generally be made inone orboth of the parties. The same criteria were commonlyused in the rules of origin in the NAFTA and in U.S. FTAs with Singapore and Chile.
Chapter 5: Rules of OriginThe duty benefits of the FTA will apply to originating goods, unless otherwiseprovided;9 textile and apparel goods are covered by a separate set of provisions inchapter 4, as noted above. Such goods are those wholly obtained in one or bothparties, those produced entirely in the territory of one or both parties from originatingmaterials only, or those meeting the requirements of the origin rules in the relatedannex. The latter category comprises goods in which each nonoriginating materialundergoes the applicable tariff change as a result of production within the region, orgoods that satisfy value content or other specified requirements. Thus, goods thatcontain only inputs attributable to the parties would be considered eligible withoutregard to tariff shifts or other criteria, and the complex rules of the annex apply tothose that contain non-party-sourced inputs. Goods containing de minimis foreigncontent that does not undergo the requisite tariff shifts (limited in the aggregate for allsuch materials to 10 percent of the adjusted value of the good, with thecomponent-based formula noted above applicable to textile and apparel products)also can qualify as originating, though their value is still counted as nonoriginatingwhen a regional value content test applies. A number of exceptions–all in theagricultural sector and relating primarily to sensitive commodities covered by U.S.TRQs (such as dairy or sugar products)–are not allowed to be made eligible under thede minimis rule, so that third country content not meeting tariff shift or other specifiedrequirements would disqualify the good for preferences.
Several other requirements for determining origin under the FTA are specified. A goodresulting from production in both parties will be considered to originate unless it fails tomeet specific tests of this chapter. Pursuant to article 5.3, originating goods ormaterials of one party that are incorporated into another good in the other party willbe treated as originating in the latter, and the parties must allow the accumulation ofproductionwithin the region. Article5.4 sets forth the rules and formulas for computingregional value content, with two types of computations–the build-down method andthe build-up method–designed to take into account all nonoriginating content. Article5.5 provides the rules for valuing materials and the adjustments that can be made tocertain expenses and producer costs. Under article 5.6, a good that originates will notbe disqualified because its accessories, spare parts, or tools delivered with it do notoriginate, if the latterare in customaryquantities, invoiced with the good,and thegood
9 As noted above, during the staging period, in-quota treatment under TRQs is available only to“qualifying goods” (goods meeting agreement ROOs when U.S. contribution is treated as coming from anon-party).

13
still meets any regional value test (treating the accessories, parts or tools asnon-originating). The treatment of fungible materials is covered in a flexible manner inarticle 5.7, so that either physical segregation or inventory management (averaging,LIFO or FIFO) can be used to track them. Articles 5.8 and 5.9 deal with packagingmaterials and containers, which are generally to be disregarded in terms of theirorigin; under article 5.10, indirect materials will be treated as originating. Animportant rule is contained in article 5.11–namely, that a good that undergoessubsequent production or other operations outside the parties (not counting minorpreservation or loading operations) will not be considered originating. Thus, goods ingeneral must be shipped without substantive change from one party to the other inorder to qualify for benefits, assisting in the enforcement of the agreement’srequirements.
Other provisions of the chapter deal with consultations among the parties and theverification and documentation of origin needed under the agreement. In essence, animporter can claim FTA benefits if he/she knows the good qualifies or if information inhis/her possession so indicates, and he/she can be required to submit statements andother evidence to establish qualification if asked bycustoms authorities. The partiesarerequired to provide that an importer can claim FTA treatment for a good based ondirect knowledge or on information in the importer’s possession, but they can requirean importer to make a statement proving the claim. Benefits will be given to goodscovered by such claims unless the parties learn the goods do not qualify and makefindings of fact and legal reasons to deny a claim, and they agree not to punishimporters who act in good faith or who correct the entry documents and paynecessaryduties in one year or a longer period set by a party. Records must be kept for five yearsafter entry to establish the origin of goods. Verification (based on requests forinformation, visits, and other methods) is governed by article 5.15.
Article 5.16 provides for modifications of agreement rules to ensure their uniform,effective, and consistent application and also to keep them current and make agreedadjustments in the future. This updating or rectification procedure is likewiseundertaken under the NAFTA and results in occasional changes in rules (sometimes asa result of HS classification or tariff changes). Regular consultations starting six monthsafter the date of entry into force (DEIF) of the agreement are required on issues relatingto the implementation or application of rules. Finally, article 5.18 provides definitionsrelating to the chapter.
Product-specific “tariff shift” rules at a HS heading or subheading level are set forth inan annex to the chapter. The notes provide that the rule listed next to each heading orsubheading is to apply to the goods of such provision, so that goods classified thereincan be evaluated; where alternative rules are listed for a heading or subheading, agood need only comply with one of them. The annex then contains the tariff shift andsubsidiary rules, which apply only to non-originating materials; if a rule excludescertain provisions, then any inputs in the good that fell within the excluded tariffcategory or categories must be originating for the good in question to qualify for

14
benefits. Thus, the rules may limit the availability of tariff preferences actuallyavailable.
In the abstract, it is not easy to attempt to determine if the rules are “tight” or not (interms of the restrictions on input sourcing), given that specific knowledge is needed ofthe industries in each party, the value of goods and their inputs, and the firms’ sourcesof inputs. For analytical purposes here, it is necessary to assume that all trade reportedas “products of Australia” under non-preferential rules (as opposed to “shipmentsfrom Australia,” which may be merely transshipped or repacked goods) would qualifyunder these ROOs. A review of any situations where Australia might increase itscapacity to make or process foreign-origin inputs, and a comparison of FTA ROOswith NTR ROOs, would suggest the possible impact of the product-specific ROOs in thischapter. In such a context, it would be possible to ask if a required tariff shift involvesprocessing that is costly or technically difficult, and to evaluate what processingAustralia currently does or might do in future. However, due to to time constraints andthe extensive industry survey that would be required, such a review has not beenundertaken and is beyond the scope of this report.
Although the rules themselves do not lend themselves to quantitative analysis, they arethe key to understanding the long-term impact of any FTA and the volume of goods forwhich duties would actually be eliminated. Although specific information is notavailable about the impact of individual ROOs on related U.S. import categories, thesmaller size of the Australian economy may mean the agreement’s ROOs bythemselves would not have a great impact on U.S. firms. Because Australia is agreeingto make its FTA rates of duty on many originating goods “free” as of the DEIF of theFTA, the rules of origin would immediately play a key role in determining which U.S.exports will receive such benefits. A survey on the same lines described above wouldbe needed to identify exporting industries for which ROOs would be significant.
Chapter 6: Customs AdministrationThis chapter deals with customs administration, including such subjects as thepublication of legal requirements and decisions (article 6.1); administration in a fairand impartial manner (6.2); advance rulings (6.3); review and appeal (6.4); customscooperation (6.5); confidentiality (6.6); penalties (6.7); release and security (6.8); riskassessment (6.9); express shipments (6.10); and definitions (6.11). These provisionsappear to be similar in general to those in other FTAs, and they seem likely to fit easilywith current practices in the two countries. The provisions are aimed at facilitating therelease of goods under the agreement and at formalizing and perhaps expandingcustoms cooperation.
Chapter 7: Sanitary and Phytosanitary MeasuresThis chapter covers the protection of human, animal, and plant health conditions in theparties’ territories and the enhancement of the WTO agreement on the same subject. Itestablishes a Committee on Sanitary and Phytosanitary Matters to serve as a forum for

15
cooperation regarding trade in originating goods and to provide a regular review ofthis subject area without dispute resolution authority; technical working groups wouldlikewise be available as needed. An annex sets up a standing working group onanimal and plant health measures and directs the development of work plans on anexpedited basis when any concerns or issues arise or when technical changes occur.
Chapter 8: Technical Barriers to TradeThis chapter encourages the full implementation of the WTO agreement on the samesubject and embodies the same principles and obligations. It rests on enhancedcooperation and consultations and provides that each party must “give positiveconsideration to accepting as equivalent [the] technical regulations of the other,” or inthe absence of acceptance, explain why. Several mechanisms to facilitate theacceptance of conformity assessment results are provided, along with proceduralrequirements for accrediting and licensing conformity assessment bodies.Transparency in the administration of such measures is required, and the partiescommit to working with each other to facilitate trade. A coordinator in each countrywouldadminister the implementationof the commitmentsand the cooperativeactivitiesunder the chapter.
Chapter 9: SafeguardsThis chapter provides the legal framework for the imposition of bilateral safeguardswith respect to originating goods. Under article 9.1, during the transition period only(10 years, unless the phase-out of duties for the product in question is longer), a partycan impose a bilateral safeguard measure by suspending staging or increasing a dutyrate toa level not exceeding the lesser of the MFN level or the party’s applied MFN ratepreceding the DEIF. This action can be taken when imports of an originating good ofthe other party at a reduced duty rate or free of duty constitute a substantial cause ofserious injury or threat thereof to a domestic industry producing a like or directlycompetitive product. Notification of the other party and of the WTO is required, andparties must cooperate in investigating such situations.
A safeguard can be imposed for two years, plus a possible two-year extension, andonly one safeguard can ever be imposed on a particular originating good underarticle 9.2. That article also regulates the rate of duty to be applied at the end of asafeguard and the recalculationof duty staging. For safeguards in effect formore than1 year, the parties must progressively liberalize the measures at regular intervals.Provisional safeguards (which can operate for not more than 200 days),compensation, and the relationship to global safeguards are covered by articles 9.3through 9.5, respectively. The United States already employs the procedures set forthin the chapter under existing law (notice, public hearing, causation and injury, and soon). Moreover, the FTA provisions are ingeneral similar to those of recently negotiatedand implemented FTAs, with the addition of the provisional safeguards language.Under article 9.5, each party retains all rights and obligations of the WTO Agreementon Safeguards but gains no additional ones under the FTA; if a WTO safeguard is

16
being considered, a party can exclude originating FTA goods where they do notsignificantly injure the domestic industry.
Chapter 10: Cross-Border Trade in ServicesThis chapter deals with cross-border trade in services. Significantly, the measurescovered by the agreement include those by central, regional, or local governmentsand authorities and also by nongovernmental bodies, but not measures dealing withfinancial services (chapter 13), air services in most cases,10 government procurement,subsidies, and grants. No obligation of employment is created, and the provisions donot apply to “services supplied in the exercise of governmental authority”(noncommercial and noncompetitive services). National and most-favored-nationtreatment on covered services are guaranteed. No local presence may be required,and the regulation of services and qualification requirements may not be undulyburdensome. Domestic regulation of services must be based on objective andtransparent criteria, and there are specific transparency requirements in addition tothose set out in the chapter on transparency. The parties may recognize education,experience, licenses, or certifications obtained in a non-party, but neither party isrequired to recognize education or other qualifications obtained in the other.Transfers and payments relating to the cross-border trade in services are to be freelyallowed without delay. The benefits of this chapter may be denied under limitedcircumstances, if the service supplier is controlled by persons of a non-party. Expressdelivery services are specifically covered by this chapter,11 following the precedent ofthe U.S.-Singapore FTA. An annex to this chapter discusses professional services andtemporary licensing and establishes schedules of covered services.
Chapter 11: InvestmentUnder these provisions, each party would be required to accord to investors of theother party and covered investments treatment no less favorable than that it accords toits own investors and investments, i.e., national and most-favored-nation treatment.Treatment must be in accordance with customary international law, including fair andequitable treatment and full protection and security. Expropriation is allowed only fora public purpose, and it must be nondiscriminatory and occur upon payment ofprompt, adequate compensation in accordance with due process of law. Each partymust permit all transfers relating toa covered investment tobe made freelyandwithoutdelay. The parties face several limitations regarding investments. For example, theycannot impose or enforce performance requirements: to export a given level or
10 Air services are the subject of numerous and interrelated international agreements and have thusbeen outside FTA regulation, a situation that likely reduces uncertainty for this industry and has notseemed to present difficulties for it.
11 This area did not receive separate coverage or significant national commitments in the WTOGeneral Agreement on Trade in Services, where it was treated in the “courier services” provisions. Insome countries the postal monopolies handle express deliveries, and access by outside private entities hasbeen denied.

17
percentage of goods; to achieve a given level or percentage of domestic content; topurchase, use, or accord preference to goods produced or sold in its territory; to relatethe volume or value of imports to the volume or value of exports or to the amount offoreign exchange associated with such investment; to transfer a technology orproprietary knowledge to someone within its territory; or to control distribution from itsterritory. Nor can a party require that the senior management of an enterprise of thatparty or a majority of the board of directors be of a particular nationality. In the eventof an investment dispute, the claimant and respondent are initially to try to resolve thedispute by consultation and negotiation, which may include the use of nonbindingthird-party procedures. Investment disputes may be submitted to arbitration. Theabsence of an investor-state mechanism for dispute resolution is unusual inan FTA andreportedly of some concern to U.S. industry, even though there have been no notableproblems.12
Chapter 12: TelecommunicationsEach party must ensure that enterprises of the other will have access to and use of anypublic telecommunications transport network and service offered in its territory oracross its borders. Suppliers of public telecommunication services in each party mustprovide for interconnection, number portability, and dialing parity. The chapterapplies to submarine cable systems and landing stations where a supplier isauthorized to operate a submarine cable system as a public telecommunicationservice. Major suppliers are required to accord suppliers of the other party treatmentno less favorable than that accorded its own subsidiaries, affiliates, or nonaffiliatedsuppliers. Competitive safeguards and resale are addressed, and access to networkelements shall be onanunbundled basis. Each party is to ensure that major suppliers inits territory provide interconnection for suppliers of the other party undernondiscriminatory terms, at any technically feasible point, in a timely fashionand of noless favorable quality than that provided by such major supplier for its own or itssubsidiary’s services or for services of non-affiliated suppliers. Interconnection optionsare listed, and interconnection offers must be publicly available. The chapter discussesthe provisioning and pricing of leased circuit services; co-location; andaccess topoles,ducts, conduits, and rights of way. It provides for flexibility in the choice of technologyand establishes conditions for the provision of value-added services. Procedures fortheallocationanduseof scarce telecommunications resources must be administered inan objective, timely, transparent, and nondiscriminatory manner. In addition, thechapter provides for the resolution of domestic telecommunication disputes andappeals. Each partymust make its licensing criteria, procedures, terms and conditions,and normal timeframes publicly available. It also must ensure that its nationaltelecommunications regulatory body is independent of service providers and that theregulatory body is authorized to enforce compliance relating to the obligations in thischapter.
12 Unlike previous FTAs to which the United States is a party, this Agreement does not have an“investor-state” dispute settlement provision to allow individual U.S. investors to bring Australia toarbitration on investment disputes.
18
Chapter 13: Financial ServicesUnder this chapter, each party commits to accord national treatment andmost-favored-nation treatment to investors of the other party and to provide marketaccess for financial institutions without limitations on the number of financialinstitutions, value of transactions, number of service operations, or number of personsemployed. Cross-border trade in financial services must be allowed, and each partymust permit a financial institution of the other to provide new financial services that itwould permit its own institutions to provide without additional legislative action.
Neither party is required to furnish or allow access to information related to individualcustomers or confidential information whose disclosure would impede law enforce-ment, be contrary to the public interest, orprejudice legitimate commercial concerns.Aparty cannot require financial institutions of the other party to hire individuals of aparticular nationality or require more than a simple majority of the board of directorsto be nationals or residents of the party. Provisions are made for nonconformingmeasures and exceptions. The parties agree that transparent regulations and policiesare important, commit to publishing in advance all regulations of general application,and agree to maintain or establish mechanisms to respond to inquiries from interestedpersons. Where a party requires membership in a self-regulatory organization, suchorganizations also are subject to some of the obligations of this chapter. The twoparties recognize the importance of maintaining and developing expeditedprocedures for offering insurance services. To deal with these provisions, the chapterestablishes a financial services committee. Consultations and dispute resolution arediscussed and cross-referenced to the article covering dispute settlement procedures.There is an annex with additional provisions on insurance, banking, and portfoliomanagement.
Chapter 14: Competition PolicyPursuant to this chapter, each party is required to adopt or maintain measures toproscribe anticompetitive business conduct and to take appropriate actionwith respectto such conduct. Moreover, each party is required to establish or maintain anauthorityresponsible for the enforcement of such measures. The enforcement policy so adoptedcannot discriminate on the basis of the nationality of the subjects of the proceedingsand must provide due process and procedures for review. Although article 14.3 statesthat “designated monopolies should not operate in a manner that creates obstacles totrade and investment” and makes the parties responsible for the conduct of suchmonopolies, a party may designate a monopoly or establish or maintain agovernment monopoly enterprise (and the United States would assume certainobligations for sub-federal monopolies as well13). Under article 14.5, differences in
13 Article 14.4 provides that the United States “shall ensure that anticompetitive activities bysub-federal state enterprises are not excluded from the reach of its national antitrust laws solely by reasonof their status as sub-federal state enterprises, to the extent that their activities are not protected by theState Action Doctrine.” The meaning and scope of this provision would need to be determined. The UnitedStates has no bilateral investment treaty with Australia.
19
pricing in a market or in different markets, where based on “normal commercialconsiderations,” do not themselves violate the chapter’s commitments. The chapterprovides for cooperation, transparency, information requests, and consultations andemphasizes consumer protection. Article 14.7 provides that monetary judgements onbehalf of consumers, customers, or investors will be recognized by the parties andenforced. Article 14.11 expressly bars dispute settlement regarding most of theprovisions of the chapter.
Chapter 15: Government ProcurementThis chapter is significant in that Australia is an observer, rather than a signatory, withrespect to the WTO plurilateral agreement on this subject14 and thus, unlike the UnitedStates, has no obligations under that pact. Obligations in the FTA chapter relate toparticular procurements by contractual means for values exceeding the agreedthresholds set forth in annexes on specific subject matter, and a number of other typesof purchases are specifically not covered. The parties reaffirm their commitmentsunder their existing reciprocal defense procurement agreement of 1995 and agree totry to improve its operation. Article 15.2 sets forth principles of national treatment andnondiscrimination, consistent with the WTO Agreement on Government Procurement(which treats procurement commitments as being outside the scope of market accesscommitments15), and deals with procurement methods; it also provides that the FTArules of origin must be applied for procurement purposes under the chapter.Subsequent articles of the chapter provide definitions; requirements for publication ofnotice of intended procurement; time limits of at least 30 days (with specifiedcircumstances warrantinga 10-day lead time)betweenpublicationand the submissionof tenders; rules on documentation, technical specifications, and tenderingprocedures; information on awarded contracts; and a mechanism for the review ofsupplier challenges. The obligations do not appear to cover noncontractualagreements orany form ofgovernmental assistance not specifically covered under theschedules appended to this chapter. Exceptions for public purposes are listed(includinga provisionauthorizing prisonand shelteredworkshops), andmodificationsand rectifications are authorized.
Chapter 16: Electronic CommerceUnder this chapter, which deals with subject matter not covered by the WTO in explicitcommitments, a party cannot apply customs duties or other duties, fees, or charges onor in connection with the importation or exportation of digital products on a carriermedium or sent by electronic transmission, and the parties must accordnondiscriminatory treatment to digital products. Internal taxes charged on domesticand imported products are allowed if imposed in accordance with the agreement (but
14 See www.wto.org/english/tratop_e/gproc_e/memobs_e.htm for a list of the members of theWTO agreement, current as of Apr. 12, 2004.
15 See www.wto.org/english/tratop_e/gproc_e/gpintr_e.htm for a discussion of the WTOagreement, related to excerpted legal texts, as of Apr. 12, 2004.

20
the obligations do not apply to nonconforming measures and other listed matters). Aparty cannot accord less favorable treatment to some digital products on the basis ofthe nationality of the author, performer, producer, developer, or distributor of theproducts or on the grounds that the digital products were created, stored, transmitted,or published outside its territory. Transparency and cooperation are to be the guidingprinciples.
Chapter 17: Intellectual Property RightsThe provisions of this chapter are quite detailed. Each party affirms that it has ratifiedor acceded to the Patent Cooperation Treaty, as revised and amended (1970); theConvention Relating to the Distribution of Programme-Carrying Signals Transmittedby Satellite (1974); the Protocol relating to the Madrid Agreement Concerning theInternational Registration of Marks (1989); the Budapest Treaty on the InternationalRecognition of the Deposit of Microorganisms for the Purposes of Patent Procedure(1980); the International Convention for the Protection of New Varieties of Plants(1991); the Trademark Law Treaty (1994); the Paris Convention for the Protection ofIndustrial Property (1967); the Berne Convention for the Protection of Literary andArtistic Works (1971); and the WTO Agreement on Trade Related Aspects ofIntellectual Property Rights (“TRIPs”) (1994). Each party agrees to ratify or accede tothe World Intellectual Property Organization (WIPO) Copyright Treaty (1996) and theWIPO Performances and Phonograms Treaty (1996) by the date of entry into force ofthe agreement. Further, the parties agree to make best efforts to ratify or accede to theHague Agreement Concerning the International Deposit of Industrial Designs (1999)and the provisions of the Patent Law Treaty adopted in Geneva in June 2000. Theparties may implement more extensive protection in their respective national laws, andnational treatment must be granted by each party to nationals of the other.
For purposes of the agreement, trademarks include service marks, collective marks,sound marks and certification marks and may include geographical marks and scentmarks. The owner of a registered mark shall have the exclusive right to prevent thirdparties not having the owner’s consent from using identical or similar signs where suchuse would result in a likelihood of confusion, with limited exceptions such as fair use ofdescriptive terms. Article 6bis of the Paris Convention for the Protection of IndustrialProperty (1967) will apply to “well-known” trademarks. Each party must provide anelectronic system for the application, registration and maintenance of trademarks.Registrationand renewals will have periods of not less than 10years, and neither partywill require recordation of licenses for trademarks. Each party will require themanagement of its country code top-level domain to provide public access to accurateinformation about domain name registrants and to provide dispute resolutionprocesses.
Specific provisions of the Berne Convention are cited for the protection of copyrightsand related rights. Authors, performers, and producers are to have exclusive rights toauthorize or prohibit all reproductions and all communications to the public of theirworks. Under the agreement, the term of protection of a work will be not less than the
21
life of the author and 70 years after the author’s death or not less than 70 years at theend of the calendar yearof the first authorized publication of the work, if the term is notbased on the life of a natural person. The knowing circumvention of effectivetechnological measures to protect works, or trafficking in devices intended tocircumvent such measures, will result in criminal and civil liability, while certainnoninfringing good faith activities are exempt from sanctions. Removing or alteringrights management information or trafficking in works from which the rightsmanagement information has been removed or altered likewise must result in criminaland civil liability. Specific exceptions are set out; the terms “effective technologicalmeasure” and “rights management information” are defined in detail, and there arespecific obligations relating to the performers and producers of phonograms.Encrypted program-carrying satellite signals are protected by criminal and civilsanctions. The parties also agree to maintain industrial design protection systems andto endeavor to reduce differences in law and practice in this subject area.
In terms of patents, the parties must make patents available and exclude inventionsfrom patentability only in specifically defined circumstances. Limitedexceptions are setout in the chapter. Patent owners must have the right toassign, license, and transfer thepatent by succession. The patent owner may request that a patent term be adjusted tocompensate for unreasonable delays in granting the patent. There are additionalprovisions that apply only to pharmaceutical and agrochemical patents.
Final judicial decisions and administrative rulings pertaining to the enforcement ofintellectual property rights must be in writing, published, and made publicly available.Each party is required to publicize information on its efforts to provide effectiveenforcement. In civil, administrative, and criminal proceedings each party shallprovide for a presumption that the natural person or entity indicated as the author isthedesignated rights holder. In civil judicial proceedings, the rights holdermayrequestdestruction of goods that have been found to be pirated or bear counterfeit marks,except in exceptional cases. Judicial authorities shall have the authority to order theinfringer to identify third parties involved in the production or distribution of theinfringing goods or services and may fine or imprison persons who fail to abide byvalid court orders.
In dealing with border authorities, the applicant for customs enforcement must provideadequate evidence to show prima facie infringement and may be required to providesecurity. The parties’ customs services may initiate bordermeasures ex officio and takeaction against goods passing in transit. Goods determined to be pirated or bearingcounterfeit marks must be destroyed. The simple removal of a counterfeit trademarkwill not be sufficient to permit the release of goods into channels of commerce. Theparties agree not to allow the exportation of goods bearing counterfeit marks or ofpirated goods.
Each party is obliged to provide appropriate criminal procedures and penalties atleast to cases of willful trademark counterfeiting or copyright or related rights piracyon a commercial scale. Parties must provide legal incentives for service providers tocooperate with rights holders and limitations on liability.

22
Chapter 18: LaborThe parties reaffirm their obligations as members of the International LaborOrganization, commit to ensure that their domestic laws are consistent withinternational standards, and agree to try to enforce these laws and improve thosestandards.Article 18.2 states that the obligationof aparty under the agreement relatesto the effective enforcement of domestic laws, in keeping with those standards, andproscribes “a sustained or recurring course of action or inaction” affecting tradebetween the parties. Article 18.3 requires each country to ensure that “persons with alegally recognized interest” under local law have access to “tribunals” of all types forenforcement, with the proceedings handled on a “fair, equitable, and transparent”basis. The parties must assist in the conduct of these proceedings and promoteawareness of labor laws. While the Joint Committee set up under Chapter 21 toadminister the agreement would handle most discussions on this chapter, aSubcommittee on Labor Affairs is authorized under article 18.4 to maintain contactswithin the member governments and to ensure that the chapter is implemented. Laborcooperation and consultations, under articles 18.5 and 18.6, respectively, are toprovide the primary means of implementing the chapter. Article 18.7 sets forth thedefinition of “internationally recognized worker rights” for purposes of the FTA, andarticle 18.8 delineates the scope of the commitments by defining the parties’ covereddomestic laws.
Chapter 19: EnvironmentUnder these provisions, each party must ensure that its environmental protection lawsprovide for high levels of protection and strive to improve those laws, provideappropriate and effective remedies and sanctions for violations of environmentalprotection laws, and provide opportunities for public participation. The parties agreeto pursue cooperative environmental activities and provide for environmentalconsultations; they also agree to encourage voluntary mechanisms and incentives asmethods of attaining compliance. The Joint Committee set up to administer theagreement will discuss environmental issues and offer public and private parties anopportunity to provide input, and a subcommittee on environmental affairs isauthorized. Environmental cooperation is the end objective of article 19.6, and article19.7 provides for collaborative consultations upon request by one party to the other. Ifconsultations fail, a party can refer a matter to the subcommittee for furtherdiscussionsand work, with ultimate recourse to the Joint Committee. The parties agree to continueto work toward enhancing other international agreements on environmental mattersand to implement such measures.
Chapter 20: TransparencyThe subject of this chapter is the abstract concept of “transparency” as it relates to acountry’s actions and legal measures; it generally provides the structural rules that willgovern theapplicationof theagreement, startingwith theofficial contact points ineachgovernment and continuing through publication of laws and requirements relating to

23
the agreement and to the administrative rulings process and review and appealstherefrom. Interested persons are to be given the right to know about actual or futuremeasures in the member countries and to comment on them. Because the domesticlegal systems of the parties both operate generally in public and with rights of review,this chapter seems less detailed than its counterparts in some other FTAs. As notedabove, other chapters may contain additional transparency requirements tailored toindividual subject matter.
Chapter 21: Institutional Arrangements and Dispute SettlementThe chapter sets up a Joint Committee of government officials of the twocountries–chaired by the United States Trade Representative and the Minister forTrade for Australia–to supervise the implementation and functioning of the FTA andconsider all types of matters raised under it. The Committee is to meet at least annuallyto examine the operation of the agreement, provide transparency for the public, andaddress any environmental concerns arising out of the FTA. Section B of the chapterrelates to dispute settlement proceedings and their administration; it providesdesignation by each party of an office to assist the Committee and provides forconsultations on labor issues at the request of either party during which a broad rangeof private and public views would be sought. Dispute settlement panels, theircomposition and operation, a requirement for reports within 180 days afterappointment of a panel chair, and the implementationof panel reports are the subjectsof this section. The provisions authorize a suspension of benefits under the agreement,as delimited by the panel, where no other method of resolving a dispute is accepted;monetary assessments are also available under stated rules. Article 21.12 providesthat annual monetary assessments of up to U.S.$15 million, adjusted for inflation, canbe awarded by a panel if a decision contained in a report is not implemented, subjectto a five-year review. No private right of action is given.
Chapter 22: General Provisions and ExceptionsAs in earlier agreements dealing with international trade, the chapter sets forthgeneral exceptions, as well as provisions on essential security, taxation, disclosure ofinformation, and corruption, along with specific commitments on expropriation andinvestment. The provisions appear to follow prior language in other agreements.
Chapter 23: Final ProvisionsThis chapter contains the legal mechanisms for acceding to the agreement and puttingit into force and an article on the legal significance of annexes. Article 23.3 providesthat the parties must consult on any changes made in provisions of the WTOAgreement incorporated in this text to determine if the same principlewill applyherein.Reservations are allowed only upon written consent of the other parties. Under article23.4, the FTA would enter into force 60days after the exchange of writtennotificationsthat domestic requirements have been met and other conditions. Any withdrawalwould take effect six months after written notice.

24
Side LettersA long list of side letters16 accompanies the agreement on specific subjects, rangingfrom waivers of customs duties and import without bond to higher education in U.S.states and the privatizationof Telstra (anAustralianprovider of telephone and internetservices, business support, and other products). Many of these letters clarify theinterpretation of agreement provisions, while others may state effective nationalreservations to allow a party to continue a particular domestic practice withoutchange. Where individual side letters are relevant to more detailed discussions ofsubject matter in the agreement or are referred to in submissions, additional text isprovided in this report.
16 See footnote 3 to this chapter.

25
CHAPTER 3Simulated Impact of the U.S.-Australia FTA
This chapter provides a quantitative assessment of the likely impacts of those chaptersof the U.S.-Australia Free Trade Agreement that provide increased access for U.S.goods and services in the Australian market and for Australian goods in the U.S.market (i.e. chapters 2, 3, and 4). In providing a quantitative assessment undersection 2104(f)(2) of the Trade Act of 2002, the Commission is ordered to “...submit tothe President and the Congress a report assessing the likely impact of the Agreementon the United States economy as a whole and on specific industry sectors, including theimpact the Agreement will have on the gross domestic product, exports and imports,aggregate employment and employment opportunities, the production, employment,and competitive position of industries likely to be significantly affected by theAgreement, and the interests of United States consumers.” The method chosen forquantitative analysis is a computable general equilibrium simulation. The modelincludes the social accounts and trade patterns for multiple regions of the worldeconomy and for multiple products produced in those regional economies. Employinga simulation permits the Commission to quantify the probable impact of specificcomponents of the negotiated Agreement on individual sectors, labor markets, andexports and imports, as required by the Trade Act of 2002.
The U.S.-Australia FTA provides a broader trade liberalization than is analyzed in thischapter. This chapter focuses only on the liberalization of tariffs and measurable tariffrate quotas of the Agreement. As indicated in chapter 1, a qualitative assessment ofselected sectors as well as other provisions and their effects on investments, intellectualproperty, and other provisions are discussed in chapters 4, 5, 6, and 7 of this report.
This simulation liberalizes trade completely in all goods subject to liberalization underthe free trade agreement. There is no implicit or explicit time elapsing in the model. Thismeans, first, that all provisions of the Agreement are assumed to be fully phased inimmediately, rather than over any phase-in period embodied in the agreement.Second, it means that all effects of the Agreement are felt immediately, without anadjustment period. The modeled results can be considered to be long-run effects, of afully implemented agreement in an economy otherwise identical to the baseline 2005economy after all adjustments related to the agreement have worked their waythrough the economy.1 The qualitative assessment of the likely effects of the FTA onselected sectors in chapter 5 considers the short to medium run effects, as well as longrun effects, as it is expected to be phased in over an 18-year period.
1 If the product is a non-qualifying good under ROO, the model results may be overstated to theextent that the traded good is non-qualifying.

26
A full list of the initial measured trade barriers in the model is shown in table 3-1. Thesebarriers essentially constitute price gaps, or wedges, between existing “world prices”and “domestic prices,” which include the tariffs and other barriers. As tabulated, theyconsist of tariffs and the portion of tariff rate quotas (TRQs) collected as duties,measured in the Global Trade Analysis Project (GTAP) data base as ad valoremequivalent tariffs. The proposed tariff cuts in the FTA are to be phased in over atransitional period, but for the purposes of the modeling in this chapter they areassumed to enter into force all at once, on January 1, 2005.2 Note that services arerestricted by nontariff barriers, which are not quantifiable in the context of the USITCmodel. A qualitative assessment of the effects of the FTA on the services sector isprovided in chapter 4.
2 Implementation of the Agreement is scheduled to be staged over 18 years. See chapter 2 for adiscussion of the staging. See chapter 4 for a discussion of the staging in selected sectors.
Table 3-1Benchmark tariffs (2005)
(Percent)
C ditU.S. imports Australian imports
Commodity Tariffs TariffsVegetables, fruits, and nuts . . . . . . . . . . . . . . . . 4.00 1.00Other crops . . . . . . . . . . . . . . . . . . . . . . . . . . . . . . . 3.00 0Cattle and horses . . . . . . . . . . . . . . . . . . . . . . . . . 2.00 0Animal products n.e.c. . . . . . . . . . . . . . . . . . . . . . 0.67 0Coal, oil, gas, other mineral . . . . . . . . . . . . . . . . . 0 18.31Meat products . . . . . . . . . . . . . . . . . . . . . . . . . . . . 7.99 0Dairy products . . . . . . . . . . . . . . . . . . . . . . . . . . . . 125.00 5.00Sugar . . . . . . . . . . . . . . . . . . . . . . . . . . . . . . . . . . . . (2) (2)Other processed food and tobacco products . . 12.85 20.70Textile, apparel, and leather products . . . . . . . . 7.76 10.32Wood products . . . . . . . . . . . . . . . . . . . . . . . . . . . . 2.00 5.00Petroleum, coal, chemicals, rubber, plastic . . . . 3.83 3.62Ferrous metals . . . . . . . . . . . . . . . . . . . . . . . . . . . . 2.00 5.69Metals n.e.c. and metal products . . . . . . . . . . . . 2.00 2.00Motor vehicles and parts . . . . . . . . . . . . . . . . . . . 4.50 9.50Transport equipment n.e.c. . . . . . . . . . . . . . . . . . 1.00 0Electronic equipment . . . . . . . . . . . . . . . . . . . . . . 1.00 1.00Other machinery and equipment . . . . . . . . . . . . . 1.00 3.00Other manufactures . . . . . . . . . . . . . . . . . . . . . . . 1.47 3.36Services . . . . . . . . . . . . . . . . . . . . . . . . . . . . . . . . . 0 0.06
1 To conform to the FTA, the simulation reported in this study partially removes the tariffon dairy products.
2 To conform to the FTA, the simulation reported in this study does not remove the tariffon sugar.
Source: GTAP version 6, prerelease 1 data and Commission calculations. Note that toconform to the FTA, the simulation reported in this study does not remove the tariff on sugar,and only partially removes the tariff on dairy products. See text.

27
An important feature of the Agreement, as discussed in chapter 2, is the rules of origin(ROOs) that determine the eligibility of goods for the tariff reductions of theAgreement. As chapter 2 notes, the ROOs themselves are not likely to have a greatimpact on U.S. firms. The impact of these rules is not explicitly modeled, but the generalform of the simulation employed is consistent with the existence of rules of origin. In thesimulation, it is assumed that traded commodities are differentiated by country oforigin, which implies a limit to the ability of FTA partners to source exports from a thirdcountry.
The primary data source is prerelease 1 of the(GTAP) version 6 database, a snapshotof the world economy for 2001. To the extent feasible, the GTAP data are updated to2005, the yearof the earliest probable implementationof the Agreement. Importantly,the 2005 benchmark incorporates the following: the scheduled removal of textile andapparel quotas (under the Agreement on Textiles and Clothing); and the ratifiedfree-trade agreements between the United States and Chile, and the United States andSingapore. The model also incorporates tariff reductions implemented by NAFTA, theUruguay Round and U.S. Free Trade Agreements with Israel and Jordan insofar asthey are reflected in trade data projected through 2005.3
The model used in the assessment is based on the core model available in theGTAPinGAMS software developed by Rutherford and Paltsev.4 The core model hasbeen modified to incorporate the updated 2005 base year, to compute and reportthose specific items mandated by the Trade Act of 2002, and to perform systematicsensitivity analysis over econometrically estimated trade elasticities. A more detaileddescription of the methodology and model are presented in appendix D.
Simulation Design
The analysis employs a comparative static framework in which a baseline equilibriumdepiction of the U.S. economy, as of January 1, 2005, is derived through a set ofbalanced accounts of trade, production, consumption, and taxes. Once this baselinehas been created, policy shocks are imposed on the balanced model. A policy shocksimply means a change in policy, typically a tariff removal or reduction, which isimposed on the model in order to measure its effect. In this model the policy shocksconsist of the reduction or elimination of tariffs agreed to in the FTA. Table 3-1 lists thetrade distortions (tariffs) incorporated in the model and its data. While a tariff forsugar is listed, the removal of this tariff is not modeled as sugar was not included in theAgreement. Similarly, the restrictions on dairy products were not fully removed. TheU.S. quota-based tariff of 25 percent in the database was reduced to 21.6 percent, in
3 The model has been also modified to take account of provisions of Australia’s free tradeagreement with Thailand pertaining to trade in motor vehicles and parts, as data allow.
4 Thomas F. Rutherford and Sergey V. Paltsev, GTAPinGAMS and GTAP-EG: Global Datasets forEconomic Research and Illustrative Models, Department of Economics, University of Colorado WorkingPaper, September 2000.

28
order to simulate the expected long-run effects of liberalization in this sector asdiscussed in chapter4. Note that the sectors listed in this table, and their correspondingshocks or trade distortions, represent aggregates. The meat products sector includespork, lamb, and other meats as well as beef, for example, and the “other crops”category includes such things as coffee, tea, oilseeds, cotton, spices, and tobacco. As aresult, the listed trade distortions are averages of the specific trade distortions faced bythe individual commodities composing the aggregates. The tariffs listed here includethe tariff rate quotas imposed on certain agricultural products. Prerelease 1 of theGTAP version6 data base,5 which provides the bulk of the data used in this model, alsoincludes measures of export tax equivalents, primarily measuring domestic taxes orsubsidies on exports. These export measures are in general not affected by the FTA,and are not removed in the model.
The trade policies included in the data are shocked by replacing them with new levels(generally zero, except as noted for sugar and dairy products) for the tariffs and taxequivalents of the trade distortions. The model is rebalanced, and newvalues for tradeflows, outputs, employment, welfare, GDP, and other values are generated. Thedifference between the baseline values of these variables and their new values isinterpreted as the estimated impact of the tariff removal under the trade agreement. Itis expected that those sectors which face relatively high trade restrictions will showlarge effects from the implementation of the FTA.
Economywide Summary ResultsWithin the economic simulation, the most relevant and comprehensive measure of theimpact that the quantifiable components of the U.S.-Australia FTA will have on the U.S.economy as a whole is the change in welfare. The change in welfare summarizes theimpact of the components of the Agreement in a single value and in a mannerconsistent with economic theory, taking into account all of the income and expenditurechanges of U.S. households. It thus summarizes the benefits to consumers of the tradeagreement, as well as the effects on households in their roles as providers of labor,owners of capital, and taxpayers. The Commission simulation of these components of
5 Version 6 of the GTAP data has not been published or publicly released at the time of this writing.Version 5 is described in Dimaranan, Betina V. and Robert A. McDougall (2002). Global Trade,Assistance, and Production: The GTAP 5 Data Base, Center for Global Trade Analysis, Purdue University.Also see the web site, www.agecon.purdue.edu/gtap. There are several advantages to using theprerelease version of the GTAP data base rather than the most recently published version. For one thing,trade flows and national economic data have been updated to a 2001 base year from 1997 (although forthis study the Commission has further updated the data to 2005). More importantly, much work has beendone to improve the protection data in the data base. Rather than relying for the most part on WTO boundtariffs, the new data makes a strong effort to incorporate actual applied tariffs (generally smaller thanbound rates); for this reason, apparent duties on some commodities have declined from those in previousversions of the data set. This is aside from the fact that further implementation of the Uruguay Round andother trade agreements has actually reduced duties. Also, this new version of the data base reflects workthat is in progress to develop appropriate methods to quantify tariff rate quotas and nontariff measures.Work remains to be done in these areas, but the current prerelease version 6 of the GTAP data baseappears to provide the best available basis for the analyses of current trade policy with appropriatemeasures of trade and trade policy.

29
the U.S.-Australia FTA suggests that the welfare value to the United States of the tariffliberalization under the Agreement is $490.8 million. This can be interpreted asstating that, when fully implemented, the FTA would provide annual benefits toconsumers worth $490.8 million, in the economy of 2005.6 Table 3-2 presents thesimulated welfare impact of the U.S.-Australia FTA, as well as the simulated impact ongross domestic product (GDP).7
The change in gross domestic product is decomposed into specific changes inpayments to primary factors of production (land, unskilled labor, skilled labor, andcapital) and a change in the net transfer from households to the government. Note thatlabor and capital income increase as a result of the FTA, but payments to land declineslightly, due largely to increased imports in agricultural products. The transfer fromhouseholds to the government compensates for the loss of tariff revenue to thegovernment.8
6 This welfare measure is often referred to as the “equivalent variation.”7 Unlike the change in welfare, measures of changes to GDP include both price and quantity
changes. The general equilibrium model determines only relative prices, however, so a unit of measurefor real values must be chosen. Throughout the analysis in this chapter and chapter 8 the Commission usesthe true-cost-of-living index as measured by the unit U.S.-household expenditure function, to deflate allnominal results. In this case, using the true-cost-of-living index to deflate GDP yields a measure that is aclose proxy for welfare changes. In a simple model without government expenditure and other distortionsthey would be the same.
8 Without making up for the government’s lost tariff revenue, real government spending and netgovernment indebtedness could not be maintained, and national welfare could not be comparedbetween the benchmark and the counterfactual simulation.
Table 3-2Summary report on welfare and GDP1
Item Million Dollars Percent
Welfare . . . . . . . . . . . . . . . . . . . . . . . . . . . . . . . . . 490.8 0.01Decomposition of GDP:
Land . . . . . . . . . . . . . . . . . . . . . . . . . . . . . . . . . . -74.8 -0.12Unskilled Labor . . . . . . . . . . . . . . . . . . . . . . . . 271.6 0.01Skilled Labor . . . . . . . . . . . . . . . . . . . . . . . . . . . 236.7 0.01Capital . . . . . . . . . . . . . . . . . . . . . . . . . . . . . . . . 296.3 0.01Balance for Lost Tariff Revenue2 . . . . . . . . . -241.7 NA
Total GDP . . . . . . . . . . . . . . . . . . . . . . . . . . . 488.2 0.001 Unlike the change in welfare, measures of changes to GDP include both price and
quantity changes. The general equilibrium model only determines relative prices,however, so a unit of measure for real values must be chosen. Throughout the analysisin this chapter and the next the Commission uses the true-cost-of-living index, asmeasured by the unit U.S.-household expenditure function, to deflate all nominal results.In this case using the true-cost-of-living index to deflate GDP yields a measure that is aclose proxy for welfare changes. In a simple model without government expenditure andother distortions they would be the same.
2 This transfer compensates the government for lost tariff revenue in order to holdgovernment expenditure and borrowing constant. Holding fixed the government budgetposition (and by extension government purchases) is necessary for welfare analysis.
Source: Commission calculations.

30
Simulated Changes in Trade Volumes
Aggregate U.S. trade with the world is likely to increase as a result of the increasedmarket access due to the U.S.-Australia FTA. Table 3-3 reports the simulated changesin U.S. trade volumes. Total imports increase by $1.2 billion (0.07 percent) on alanded-duty paid basis and total exports increase by $1.5 billion (0.13 percent) on anf.o.b. basis.9
The trade volumes with Australia increase substantially more than aggregate trade.Table 3-4 reports the simulated changes in U.S.-Australian bilateral trade. Thenumbers are reported on a landed-duty paid basis, and thus reflect changes in thevalue of trade including tariff payments. U.S. imports from Australia increase byalmost $1.8billion. Comparing this to the aggregate change inU.S. imports of less than$1.2 billion, the simulated FTA diverts the difference of about $700 million of tradeaway from other trading partners. That is, the increase in imports from Australia isoffset partially by declines in imports from other sources.
Table 3-4 includes a decomposition of the U.S.-Australian bilateral trade equilibriumby commodity. In general, the sectors facing the greatest trade barriers are the onesexperiencing the greatest effects of eliminating the trade barriers. U.S. imports of fivecategories—meat products10 (which includes beef); other processed foods andtobacco; textiles, apparel, and leather products; petroleum, coal, and chemicals; andmotor vehicles and parts—increase substantially, accounting for $1.5 billion of thetotal increase in imports from Australia.
The greatest percentage increase in sectoral trade occurs in textiles, apparel, andleather products, with a 58 percent increase in imports from Australia, although thiseffect may be overstated; see the discussion in the next paragraph. The estimatedincrease in meat imports does not represent the net increase of U.S. imports of meatproducts because increased meat imports from Australia would be expected to beaccompanied by declines in meat imports from other sources.11
9 Net capital flows are assumed not to change in the simulated FTA, requiring balance between thechange in the value of imports on a c.i.f. basis and the change in value of exports on an f.o.b. basis. Thesmaller change in imports reported in table 3-2 is due to the lost tariff revenue that is included in importsmeasured on a landed-duty-paid basis.
10 It should be noted that the assessment of the impact of the FTA in this section is not based on astaged implementation (over 18 years) of the agreement, but on an immediate full implementation of theAgreement on January 1, 2005. In addition, a broader sector (meat products) is analyzed here becausethe GTAP database does not measure beef separately. Therefore, the assessment of impacts on beef inchapter 4 is not directly comparable to the assessment of the impact in this section.
11 For the specific impact of the agreement as it pertains to beef, see the discussion in chapter 4.

31
Table 3-3Simulated changes in aggregate U.S. trade volume
FlowMillionDollars
Percentchange
Imports (landed duty paid) . . . . . . . . . . . . . . . . . 1,160.7 0.07
Exports (free on board) . . . . . . . . . . . . . . . . . . . . 1,499.3 0.13
Source: Commission calculations. See text.
Table 3-4FTA partner trade equilibrium: Imports from partner (landed-duty paid)
United States Australia
Change Change
SectorBasevalue Percent
Basevalue Percent
Million dollars Million dollarsMeat products1 . . . . . . . . . . . . . . . . . . 1,373.9 758.0 55.21 13.0 0.0 -0.26Other processed food and tobacco
products . . . . . . . . . . . . . . . . . . . . . 824.4 310.2 37.63 295.6 184.5 62.43Textile, apparel, and leather
products . . . . . . . . . . . . . . . . . . . . . 312.6 180.5 57.74 143.5 125.0 87.16Petroleum, coal, chemicals, rubber,
plastic . . . . . . . . . . . . . . . . . . . . . . . 655.9 137.7 21.00 2,218.5 396.4 17.87Motor vehicles and parts . . . . . . . . . 591.8 127.1 21.47 1,159.8 502.4 43.32Metals nec and metal products . . . . 695.4 104.0 14.95 84.9 12.9 15.16Other machinery and equipment . . . 819.6 54.5 6.65 3,828.8 686.8 17.94Ferrous metals . . . . . . . . . . . . . . . . . . 294.2 32.6 11.08 218.8 75.4 34.45Other manufactures . . . . . . . . . . . . . 233.3 18.6 7.98 546.2 103.7 18.98Transport equipment n.e.c. . . . . . . . 249.7 18.1 7.23 3,349.9 -1.6 -0.05Dairy products . . . . . . . . . . . . . . . . . . 79.7 13.8 17.35 6.2 0.0 0.39Electronic equipment . . . . . . . . . . . . 121.4 9.6 7.88 1,322.3 90.3 6.83Other crops . . . . . . . . . . . . . . . . . . . . . 62.8 8.9 14.14 41.3 0.5 1.21Vegetables, fruits, and nuts . . . . . . . 52.6 5.3 10.13 43.7 1.4 3.18Wood products . . . . . . . . . . . . . . . . . . 41.9 4.6 11.04 67.6 20.9 30.91Animal products n.e.c. . . . . . . . . . . . 82.3 1.2 1.45 15.6 0.3 1.79Cattle and horses . . . . . . . . . . . . . . . 3.2 0.2 5.72 2.4 0.2 6.59Grains . . . . . . . . . . . . . . . . . . . . . . . . . 0.0 0.0 NA 8.4 0.2 2.47Sugar crops . . . . . . . . . . . . . . . . . . . . 0.0 0.0 NA 0.0 0.0 NACapital goods . . . . . . . . . . . . . . . . . . . 0.0 0.0 NA 0.0 0.0 NASugar . . . . . . . . . . . . . . . . . . . . . . . . . . 55.6 -0.4 -0.77 0.2 0.0 1.78Coal, oil, gas, other mineral . . . . . . . 798.9 -7.4 -0.92 58.1 309.9 533.29Services . . . . . . . . . . . . . . . . . . . . . . . 4023.7 -18.4 -0.46 4647.7 30.2 0.65
Total . . . . . . . . . . . . . . . . . . . . . . . 11,371.6 1,758.6 15.47 18,072.7 2,539.3 14.091 Meat products include beef, pork, lamb, and other meat products. See text.
Source: GTAP version 6, prerelease 1 data and Commission calculations.

32
Table 3-4 shows a 57.7 percent increase in imports of textiles, apparel, and leatherproducts from Australia. A major factor in this increase is the elimination of tariffs onthis aggregate sector, which in the USITC model are 7.76 percent (table 3-1). As ispointed out in chapter 4, a recent study by CIE12 finds that the bulk of Australianexports to the United States at the present time (in the absence of the FTA and its rules oforigin) would not qualify for tariff elimination under the rules of origin of the FTA,because most Australian exports in this category are made from inputs imported fromother countries. CIE states that on average over the past 5 years, 8.8 percent ofAustralian exports to the United States could be determined to have satisfied theyarn-forward rules of origin for textiles and apparel. CIE notes that they were not ableto survey completely the Australian industry, and there may be more exports that infact qualify under the rules. They further note that under the FTA there would be anincentive for Australian producers to change the source of their inputs, either todomestic Australian sources or to U.S. sources. Nevertheless, it is likely that some largefractionofAustralian textile and apparel exports to the United States would not qualifyfor duty-free treatment, as compliance with the rules of origin might be more costlythan the savings to be realized from the preferential tariff treatment.13 A simplenumerical exercise can illustrate the extent to which the rules of origin for textile andapparel products might limit the trade effects of the FTA in these products.
In the USITC model, textiles and apparel are combined with leather products in alarger aggregate sector, in which leather accounts for 9 percent of imports. Assumingleather products satisfy the rules of origin, and assuming that only 8.8 percent oftextiles and apparel do (even after Australian producers had adjusted their sources inresponse to the FTA and its incentives), then 17.0 percent of the larger aggregatesector in the USITC model would qualify for duty free entry. Then the model’s tariff of7.76 percent might be adjusted to an effective rate of 1.3 percent (7.76 times 0.17). Analternative but equivalent way of looking at this is that, while the tariff is 7.76 percent,only 17 percent of it (1.3 percentage points) can be liberalized.
Imports from Australia are less than a quarter of one percent of all U.S. imports in thissector. For a small trading partner a fair approximation of the effect of eliminating thereduced tariff on imports of this sector from Australia can be made, simply by makinga proportional reduction in the effect estimated by the model. Thus, the model shows a57.6 percent increase in importswith eliminationof a7.76 percent tariff. Eliminationofa 1.3 percent tariff (17 percent of the 7.76 percent value, as calculated above) wouldthus cause imports from Australia to increase roughly by only 9.8 percent (17.0percent of the 57.6 percent value), orabout $31million. Small secondary effectswouldbe observed in other sectors.
12 Centre for International Economics, Canberra and Sidney, Economic Analysis of AUSFTA–Impactof the Bilateral Free Trade Agreement with the United States, April 2004, pp. 53-54.
13 See chapter 4 for a discussion of textile and apparel trade with Australia, and the rules of origingoverning it.

33
Table 3-5 puts the information of table 3-4 into the broader context of the effects of theFTA on U.S. trade with the world at large. Note, for example, that under the FTA, U.S.imports of meat from Australia increase by $758.0 million (table 3-4), or 55 percent,whereas U.S. total imports of meat increase by only $383.6 million, or 6.0 percent(table 3-5). Thus, most of the increase in meat imports from Australia is diverted fromimports formerly supplied by other countries. Similarly, in the case of other processedfood and tobacco products, the $310 million increase in imports from Australia islargely offset by decreases in imports from other countries, leading to a net increase inimports of only $95 million. Further, the $180 million increase in imports of textiles,apparel, and leather products is also largely offset, with a total increase of only $78
Table 3-5U.S. trade equilibrium: Imports (landed-duty paid) and Exports (fob) with the world
P d tImports Exports
Products Base Change Percent Base Change Percent
— Million dollars — — Million dollars —
Meat Products . . . . . . . . . . . . . 6,411.30 383.60 5.98 7,879.30 8.10 0.10
Other processed food andtobacco products . . . . . . . . . . . 37,301.80 94.90 0.25 20,350.30 189.30 0.93
Textile, apparel, and leatherproducts . . . . . . . . . . . . . . . . . . 126,765.20 78.40 0.06 24,793.80 90.90 0.37
Petroleum, coal, chemicals,rubber, plastic . . . . . . . . . . . . 165,200.00 99.50 0.06 156,842.40 289.20 0.18
Motor vehicles and parts . . . . 178,272.90 61.20 0.03 69,089.20 501.30 0.73
Metals nec and metal products 30,370.40 41.80 0.14 18,686.50 1.90 0.01
Other machinery andequipment . . . . . . . . . . . . . . . . . 249,915.60 108.90 0.04 233,893.50 456.00 0.19
Ferrous metals . . . . . . . . . . . . . 49,069.40 39.60 0.08 33,566.90 50.90 0.15
Other manufactures . . . . . . . . 79,450.80 37.40 0.05 37,818.50 66.50 0.18
Transport equipment n.e.c. . . 51,579.90 22.40 0.04 71,897.50 -57.60 -0.08
Dairy products . . . . . . . . . . . . . 1,893.50 6.90 0.36 860.60 -0.40 -0.04
Electronic equipment . . . . . . . 219,645.40 43.60 0.02 165,883.00 -78.60 -0.05
Other crops . . . . . . . . . . . . . . . . 10,914.10 2.10 0.02 11,728.10 0.00 0.00
Vegetables, fruits, and nuts . . 9,198.80 1.50 0.02 4,990.50 0.10 0.01
Wood products . . . . . . . . . . . . . 21,545.30 11.40 0.05 6,996.90 14.60 0.21
Animal products n.e.c. . . . . . . 2,871.40 -3.20 -0.11 3,375.60 -1.00 -0.03
Cattle and horses . . . . . . . . . . 2,151.40 -6.40 -0.30 842.50 -1.30 -0.15
Grains . . . . . . . . . . . . . . . . . . . . 1,073.50 -1.50 -0.14 9,954.40 -1.50 -0.02
Sugar crops . . . . . . . . . . . . . . . 6.60 0.00 -0.04 0.00 0.00 NA
Capital goods . . . . . . . . . . . . . . 0.00 0.00 NA 0.00 0.00 NA
Sugar . . . . . . . . . . . . . . . . . . . . . 1,481.30 -0.30 -0.02 431.20 0.10 0.02
Coal, oil, gas, other mineral . . 86,585.40 25.40 0.03 8,170.60 193.70 2.37
Services . . . . . . . . . . . . . . . . . . 223,370.80 113.60 0.05 276,862.30 -222.90 -0.08
Total . . . . . . . . . . . . . . . . . . 1,555,074.80 1,160.70 0.07 1,164,913.70 1,499.30 0.13
Source: GTAP version 6, prerelease 1 data and Commission calculations.

34
million in imports from the world as a whole.14 Conversely, while imports of servicesfrom Australia drop slightly (by $18.4 million), imports from the world as a wholeincrease by $114 million. Note that no U.S. tariffs or other quantitative import barriersto services were removed in this model. The reported changes in trade and output inservices arise from secondary general equilibrium effects, including changes indemand for services by other sectors and changes in supply of services resulting fromthe reallocation of labor and capital resources to other sectors that are growing morestrongly as a result of the policy changes. For a discussion of the changes in trade inservices that might be expected from non-quantifiable provisions of the FTA, seechapter 4.
On the U.S. export side, there are substantial increases in the motor vehicles and partssector; other machinery and equipment; petroleum, coal, chemical, rubber, plasticproducts; and in the coal, oil, gas, and other minerals sector. While the model showsan increase of $127 million in U.S. imports of vehicles and parts from Australia,Australian imports of these goods from the United States increase by $502 million. Onthe import side, most imports from Australia are diverted from other countries, leavinga net increase in imports of $61 million. On the export side, however, the increase inexports of vehicles and parts to Australia is essentially all new trade; table 3-5 showsan increase in U.S. exports to the world of $501.3 million f.o.b. Chapter 4 providesspecific analyses of products in some of these and other sectors, with additionaldiscussion of the timing of the implementation of the Agreement with respect to them.
U.S. Gross Output and Employment Effects
The U.S.-Australia FTA is likely to result in expansion of industries that experienceincreased export demand due to the removal of Australian tariffs. In addition, thereallocation of resources and direct competition from Australian goods that are givenpreferential import treatment into the United States likely will cause some U.S.industries todecline. For example, output in thehuge services sector declinesbya smallpercentage, as resources are allocated to other sectors. Price increases for the outputof this sector imply that even as its quantity of output declines, its revenue increasesslightly. Table 3-6 reports the simulated percent changes in output, revenue, andemployment by industry. Changes in gross output should be interpreted as purequantity changes. Changes in revenues by industry incorporate both the quantity andproducer price changes generated in the simulated FTA.
14 If the actual tariff reduction in these products is significantly lower than the modeled value of 7.76percent, as discussed in the previous paragraph, the increase in imports from the world would also bemuch smaller than the reported $75 million.

35
Table 3-6Changes in output and employment in the United States
Output1 LaborQuantity
impactRevenue
impact
Laborquantity
impactPercent
Services . . . . . . . . . . . . . . . . . . . . . . . . . . . -0.002 0.003 -0.002Capital goods . . . . . . . . . . . . . . . . . . . . . . . 0.000 0.000 0.000Petroleum, coal, chemicals, rubber,
plastic . . . . . . . . . . . . . . . . . . . . . . . . . . . 0.021 0.022 0.021Other machinery and equipment . . . . . . . 0.039 0.041 0.039Other processed food and tobacco
products . . . . . . . . . . . . . . . . . . . . . . . . . 0.009 0.004 0.007Motor vehicles and parts . . . . . . . . . . . . . 0.098 0.097 0.099Other manufactures . . . . . . . . . . . . . . . . . 0.004 0.007 0.004Ferrous metals . . . . . . . . . . . . . . . . . . . . . . 0.021 0.022 0.021Electronic equipment . . . . . . . . . . . . . . . . -0.044 -0.042 -0.044Textile, apparel, and leather products . . 0.014 0.009 0.014Wood products . . . . . . . . . . . . . . . . . . . . . . 0.002 0.004 0.002Transport equipment n.e.c. . . . . . . . . . . . -0.047 -0.046 -0.048Meat products . . . . . . . . . . . . . . . . . . . . . . -0.304 -0.328 -0.304Metals n.e.c. and metal products . . . . . . -0.041 -0.044 -0.041Coal, oil, gas, other mineral . . . . . . . . . . . 0.145 0.151 0.146Cattle and horses . . . . . . . . . . . . . . . . . . . -0.298 -0.314 -0.335Dairy products . . . . . . . . . . . . . . . . . . . . . . -0.005 -0.011 -0.005Grains . . . . . . . . . . . . . . . . . . . . . . . . . . . . . -0.118 -0.134 -0.155Other crops . . . . . . . . . . . . . . . . . . . . . . . . . 0.001 -0.014 -0.030Animal products n.e.c. . . . . . . . . . . . . . . . -0.109 -0.126 -0.146Vegetables, fruits, nuts . . . . . . . . . . . . . . . 0.009 -0.006 -0.027Sugar . . . . . . . . . . . . . . . . . . . . . . . . . . . . . . -0.010 -0.018 -0.010Sugar crops . . . . . . . . . . . . . . . . . . . . . . . . -0.010 -0.031 -0.049
1 The revenue impact reflects changes in the prices as well as the output quantitiesof the listed sectors.
Source: Commission calculations and GTAP version 6, prerelease 1 data.
Generally, those industries with the largest increases in export demand expand themost, and those industries that face significant import competition contract the most.The sector experiencing the greatest expansion under full liberalization is the motorvehicle and parts industry. This finding is consistent with the relatively high rates ofprotection on both exports and imports and the substantial vertical linkages within themotor vehicle sector. The patternof employment impacts across the sectors is generallyconsistent with the changes in output, because the FTA has little impact on the relativeprices of the primary factors of production.
The simulation model abstracts from a great deal of labor market detail in order tocharacterize the world trade equilibrium. The simulation model does not considerchanges in total labor supply nor does it consider potential unemployment impacts;labor supply in the model is assumed to be fixed, and the labor market clears inequilibrium, as do all other simulated markets either for other factors or for goods orservices. The model serves to indicate the ways in which a fixed labor supply would bereallocated among sectors in response to trade policy changes. In order to gain insight

36
on how the overall labor supply and employment level may respond to policy, otherinformation can be applied in addition to the model results.
The model provides an estimated proportional change in the wage rate across theeconomy. The simulated U.S.-Australia FTA increases the average wage in the UnitedStates by 0.01 percent. Assuming a labor-supply elasticity of 0.1, this translates into a0.001 percent increase in labor supply. With a U.S. labor force of 150 million, thesimulation results imply an equilibrium increase in the labor market of roughly 1,500full-time equivalent jobs. Thus, although employment may fall in contracting industries,the overall small net increase in demand for labor is likely to decrease theeconomywide unemployment rate.
The increase in GDP due to the FTA also may have an effect on the labor force. Okun’slaw,15 which relates an economy’s GDP and the actual unemployment rate, suggeststhat for every one percent increase in GDP there is roughly a one-half percentdecrease in the unemployment rate. The 0.01 percent increase in GDP suggests a0.005 percent drop in the economy-wide unemployment rate. If the equilibriumunemployment rate is 5.5 percent, this GDP change would reduce the rate to 5.495percent, suggesting that employment would increase by roughly 7,000 jobs, incomparison to the 1,500 jobs derived using the labor supply elasticity above. Both ofthese calculations indicate the relatively small impact the U.S.-Australia FTA is likely tohave on the overall U.S. labor market. It should be noted that these numbers are notfindings of the USITC model simulation, but are simple calculations of employmentchanges based on economic theory that would be consistent with the wage and outputchanges calculated in the model.
Sensitivity of the Commission Simulated Impacts to the Trade Elasticities
The construction of a simulation of the economy and its response to trade policydepends on many underlying parameters, most of which are obtained from sourcesoutside the model. Appendix D describes the USITC model, its data base, and theparameters upon which it depends. The choice of values for these parameters stronglyinfluences the results obtained by the model. In order to assess and illustrate the modeland its sensitivity to the values of the underlying parameters, an analysis has beenperformed showing how one outcome of the model (the welfare measure) responds toa range of values selected for one set of input parameters (the Armington elasticities).
One of the most important sets of parameters necessary for the model is the set ofArmington trade elasticities, which measure the extent to which imported goods aresimilar to (and substitutable for) domestically produced goods. These parametersdirectly describe and control the responsiveness of trade flows to changes in trade
15 A definition and discussion of economist Arthur Okun’s law can be found athttp://economics.about.com/cs/termpaperhelp/a/okunslaw.htm.

37
policy instruments (tariffs and other distortions). Because of the sensitivity of the modelto these elasticities, and because there is often uncertainty on the values assigned tothese elasticities,16 the Commission has systematically analyzed the sensitivity of itsmodel to the values assumed for the trade elasticities.
Trade elasticities are drawn from the econometric literature (see appendix D) allowingfor the incorporation of uncertainty in the values of these estimates in the numericsimulation. Using 1,000 random draws from the published elasticity distributions, thenumeric model was run to generate a distribution of the simulated welfare impacts ofthe U.S.-Australia FTA. This distribution is presented graphically in figure 3-1.
16 Chapter 8 reviews several analyses of the U.S.-Australia FTA. As is pointed out there, differentassumptions on the appropriate values for the trade elasticities distinguish some of the models from eachother.
Figure 3-1Distribution of simulated U.S. welfare impacts of the U.S.-Australia FTA
Percentage probability
Source: Commission calculations
Welfare Change ($M)
0
2
4
6
8
10
12
415 425 435 445 455 465 475 485 495 505 515 525 535 545 555 565 575 585 595 605

38
The simulations suggest a 95 percent confidence interval of welfare changes between$434.8 million and $639.42 million. In other words, accepting the distribution of theArmington elasticities as described in appendix C, and disregarding other sources ofuncertainty in the model and its parameters, one could be 95 percent certain that thetrue welfare change resulting from the FTA lies in the interval between $434.8 millionand $639.4 million. It is important to recognize that, although the trade elasticities aresome of the most important parameters, there is unmeasured uncertainty on a numberof other parameters (such as demand and supply elasticities) that are required forcomputation of the model. Furthermore, this confidence interval pertains only to thewelfare change, only one of several measures of the effect of outcome measures in themodel. Similar analyses could be performed to examine the sensitivity to theArmington elasticities of GDP and aggregate trade flows, for example.

39
CHAPTER 4Impact of the U.S.-Australia FTA on SelectedSectors
Chapter 3 quantified the economy wide impact of the liberalization of tariff andtariff-rate quotas of the increased market access to be realized with theimplementation of the U.S.- Australia FTA. The discussion in this chapter supplementsthose results with a qualitative assessment of the impact of increased market access onselected sectors of the U.S. economy. Sectors chosen are live cattle and beef; dairy;citrus fruit; certain fresh and processed fruit; macadamia nuts; motor vehicles; certainmotor-vehicle parts; textiles, apparel, and footwear; agricultural and horticulturalmachinery; household appliances; audiovisual services; express delivery services;financial services; information technology services; and education services. Sectorswere chosen based upon a number of criteria, including the extent and speed of tradeliberalization and its potential for increasing U.S. trade, the importance of the sector interms of bilateral trade, increased export opportunities for U.S. producers relative toother foreign suppliers, the views of Commission industry analysts and industryspokesmen, and the apparent sensitivity of certain U.S. industries to tradeliberalization. The assessments in this chapter are based on the industry knowledgeand expertise ofUSITC industryanalysts. Theyhave also relied on industry sources, theUSITC public hearing in this investigation, and the advisory committee reports on theU.S.-Australia FTA, submitted to the USTR.
Table 4-1 shows the relationship between the selected sectors and the correspondingaggregated model sectors analyzed in chapter 3. As seen in table 4-1, there is a closecorrespondence between the textile, apparel, and footwear sector analyzed inchapter 3 and in chapter 4, while the correspondence between chapter 3 and chapter4 is relatively limited for macadamia nuts, agricultural and horticultural machinery,and household appliances. In addition, the qualitative analysis in Chapter 4 is basedon the staged implementation of the FTA, while the analysis in Chapter 3 assumes theU.S.-Australia FTA is fully implemented and its effects are felt on January 1, 2005.Thus, any seeming difference in the assessment of impacts in these chapters is notunexpected, as different degrees of aggregation and different analytical frameworkshave been employed in the chapters. The results in Chapters 3 and 4, while directlyrelated, are not directly comparable.
The U.S.-Australia FTA provides increased export opportunities for U.S.manufacturers by eliminating immediately upon entry into force of the Agreementvirtually all Australian tariffs on U.S. manufactured goods exports. The immediateelimination of Australian tariffs on virtually all U.S. agricultural exports is expected toprovide greater export opportunities for U.S. farmers. Tariff elimination will likelyincrease the competitiveness of U.S. manufacturers and farmers in the Australian

Table 4-1U.S. Imports from Australia: Actual 2002 imports for selected sectors and estimated 2005 imports for model sectors
Chapter 4 sector Million dollars1 Chapter 3 sector Million dollars2
Selected sectorshare of model
sector
PercentLive cattle and beef . . . . . . . . . . . . . . . . . . . . . . . . . . . . 880.3 Meat products 1,373.2 64.1Dairy . . . . . . . . . . . . . . . . . . . . . . . . . . . . . . . . . . . . . . . . 70.7 Dairy products 79.7 88.7Citrus fruit . . . . . . . . . . . . . . . . . . . . . . . . . . . . . . . . . . . . 27.7 Vegetables, fruits, and nuts 52.6 52.7Certain fresh and processed fruit . . . . . . . . . . . . . . . . 2.8 Vegetables, fruits, and nuts 52.6 5.3Macadamia nuts . . . . . . . . . . . . . . . . . . . . . . . . . . . . . . 8.9 Vegetables, fruits, and nuts 52.6 16.9Motor vehicles . . . . . . . . . . . . . . . . . . . . . . . . . . . . . . . . 311.4 Motor vehicles and parts 591.8 52.6Certain motor-vehicle parts . . . . . . . . . . . . . . . . . . . . . 183 Motor vehicles and parts 591.8 30.9Textile, apparel, and footwear . . . . . . . . . . . . . . . . . . . 303.2 Textile, apparel and leather products 312.6 97.0Agricultural and horticultural machinery . . . . . . . . . . . 19.4 Other machinery and equipment 819.7 2.4Household appliances . . . . . . . . . . . . . . . . . . . . . . . . . 24.9 Other machinery and equipment 819.7 3.0
1 Compiled from official statistics of the U.S. Department of Commerce.2 GTAP database (see table 3-4).

41
market not only relative to Australian producers but also relative to other foreignsuppliers. The FTA also will reduce Australian nontariff barriers on U.S. agriculturalexports.
With respect to services, many of the benefits of the FTA are indirect, such as greatertransparency and legal certainty. In certain instances, however, bindings in the FTAare clear improvements over those found in the General Agreement on Trade inServices. In particular, FTA bindings on audiovisual and insurance services appear torepresent significant improvements. In addition, the “negative list” format of the FTA,as opposed to the “positive list’ format found in GATS, ensures that the provision of theFTA will apply to new products resulting from technological advances and otherinnovations.
Live Cattle and Beef1
Overview
U.S. IndustryA combination of abundant grazing land and access to low cost feed grains helpsmake U.S. farmers, ranchers, and cattle feeders efficient low cost producers ofgrain-fed cattle. In addition, a large domestic market has allowed processors toconsolidate and build large efficient plants to take advantageof economiesof sizeandscale, which makes them low cost processors of cattle into wholesale and retail cuts ofbeef. These factors make the United States one of the world’s most efficient producersof high quality grain-fed beef. In general, demand for high quality grain-fed beefincreases as per capita income increases. Consequently, the United States is acompetitive supplier of high quality grain-fed beef to high per capita incomeinternational markets such as Japan, and those exhibiting per capita income growthsuch as Korea and Taiwan.2 U.S. grain-fed beef competes with pork and poultry in theU.S. market and international markets.
1 The primary focus of the FTA is meat of bovine animals, fresh, chilled, or frozen in HTS headings0201 and 0202, specifically those tariff lines subject to TRQ listed in Additional U.S. Notes to Chapter 2 ofthe Harmonized Tariff Schedule of the United States. However, U.S. beef packers operate on the marginbetween wholesale beef prices and slaughter cattle prices. Furthermore, market structure suggests thatprocessors can eventually pass most, if not all, of any decrease in the price of wholesale beef that resultsfrom increased import access of Australian beef on to U.S. cattle producers in terms of lower slaughtercattle prices. Therefore, this section addresses the impact of the FTA on the domestic industry from thefocus of live cattle producers rather than beef processors. The meat products sector in Chapter 3 includespork and sheep meat, as well as beef.
2 U.S. beef exports to most markets are currently suspended as a result of the discovery of a singlecow in Washington State with mad cow disease (Bovine Spongiform Encephalopathy or BSE).

42
The U.S. cattle sector consisted of slightly more than 1 million farming, ranching, andfeedlot operations in2002.3 Most of these operations (61 percent) were small cow-calfoperations with less than 50 beef cows.4 In 2003, a total of 56.0 million cattle andcalves were marketed, generating cash farm receipts totaling $38 billion.5 As ofJanuary 1, 2003, U.S. farms, ranches, and feedlots held $69.8 billion worth of liveanimals in inventory.6 Most cow-calf operations rely on unpaid family labor;nonetheless, it is estimated that as many as 517,000 full-time-equivalent workerswould be required to care for the U.S. cattle herd annually.7
The U.S. beef packing segment of the industry consisted of 706 federally inspectedcattle slaughter plants and 268 federally inspected calf slaughter plants in 2002.8 The23 largest cattle plants, each processing 500,000 animals or more annually,processed 70 percent of U.S. federally inspected cattle slaughter.9 An additional2,326 plants (many with 10 or fewer employees) operated under state inspectionsystems.10 On a carcass weight basis, industry shipments were valued atapproximately$30billion.11 U.S. cattle slaughteroperations employedapproximately76,700 persons in 2002.12
Australian IndustryAustralia is a highly competitive exporter of live cattle and beef. Its large cattle herd(29.2 million animals)13 relative to its human population (19.5 million),14 andabundant grazing land contribute to its competitive position. In 2002, Australia’s livecattle exports totaled 977,540 animals. Major markets include Indonesia (44percent), Egypt (15 percent), and the Philippines (12 percent).15 Record live cattleexports in 2002 were partly driven by severe drought in many of Australia’s cattleproduction areas. Exports averaged 832,000 animals during 1998-2002.16
3 USDA, National Agricultural Statistics Service, Cattle, Feb. 2002.4 USDA, National Agricultural Statistics Service, Cattle, Feb. 2002.5 USDA, National Agricultural Statistics Service, Meat Animals Production, Disposition, and
Income, 2002 Summary, Apr. 2003.6 USDA, National Agricultural Statistics Service, Meat Animals Production, Disposition, and
Income, 2002 Summary, Apr. 2003.7 USITC staff estimate based on cattle numbers and labor requirement estimates.8 USDA, National Agricultural Statistics Service, Livestock Slaughter 2002 Summary, Mar. 2003.9 USDA, National Agricultural Statistics Service, Livestock Slaughter 2002 Summary, Mar. 2003.10 USDA, National Agricultural Statistics Service, Livestock Slaughter 2002 Summary, Mar. 2003;
smaller State-inspected processing plants are most likely multi-species plants, which means that they mayprocess hogs, sheep, or poultry as well as cattle. Meat from animals processed in State-inspected plantscannot generally be sold outside of the State in which it was inspected.
11 USITC estimate based on number of animals slaughtered by class, dressed weight, and cutoutvalues. USDA, National Agricultural Statistics Service, Livestock Slaughter 2002 Summary, Mar. 2003.
12 USITC estimate based on meat packing plant employees and percentage of slaughter.13 Based on Jan. 1, 2003 inventory, USDA, FAS, Australia Livestock and Products Semi-Annual
2003, GAIN Report #AS3004, Feb. 5, 2003.14 Central Intelligence Agency, The World Factbook 2002.15 Peter Weeks, Australian Cattle and Sheep, Industry Projections 2003, Meat and Livestock
Australia, Jan. 2003.16 Peter Weeks, Australian Cattle and Sheep, Industry Projections 2003, Meat and Livestock
Australia, Jan. 2003.

43
Australia’s 2002 beef production of 2.1 million metric tons (mt) represented 4 percentof world production.17 About two-thirds of beef production was exported, whichrepresented 21 percent of world beef exports in2002.18 The United States (38percent)and Japan (34 percent) were Australia’s largest beef markets.19 Australian exports toJapan, however, dropped by 26 percent between 2001 and 2002. The decrease wasrelated to the discovery of mad-cow disease (bovine spongiform encephalopathy orBSE) in the Japanese cattle herd, which, coupled with a beef labeling scandal in whichimported beef was mislabeled as domestic beef, caused Japanese beef demand todecrease by 50 percent.20 Australian beef exports were subsequently diverted toCanada (63 percent increase), Indonesia (51 percent increase), and Korea (41percent increase).21 Australian exports of live cattle and beef have been also aided bythe low value of the Australian dollar compared with the U.S. dollar and the Japaneseyen.22
Potential Impact on U.S. Trade Flows
U.S. ImportsThe impact of the U.S.-Australia FTA on total U.S. beef imports in the first eight years ofthe Agreement will be minimal because the amount by which duty-free entry canpotentially increase is specifically known, is limited, and is small relative to U.S.production and consumption.23 The impact in years 9 through 18, however, is lesscertain because the specific timing and level of increased market access cannot beknown.
The preferential tariff-rate quota (TRQ) provisions of the Agreement will not beimplemented until U.S. beef exports exceed their 2003 level, or the third year after theAgreement enters into force. Therefore, until either of these conditions exists, theprimary result of the FTA is to eliminate the in-quota duty of 4.4 cents per kg on beefimported from Australia within its WTO-allocated quota of 378,214 mt.24 This will
17 Quantities reported here are based on carcass weight. About 90 percent of Australian beefexports to the United States are boneless, frozen, manufacturing beef.
18 Based on world totals reported by USDA that includes only those countries contained in USDA’sofficial Production Supply and Demand tables. Source: USDA, FAS, Livestock and Poultry: WorldMarkets and Trade, Mar. 2003.
19 Five-year average volume basis.20 USDA, FAS, GAIN Report #JA2008, Japan Livestock Products Semi-Annual 2002, Mar. 1, 2002.21 Peter Weeks, Australian Cattle and Sheep, Industry Projections 2003, Meat and Livestock
Australia, Jan. 2003.22 Peter Weeks, Australian Cattle and Sheep, Industry Projections 2003, Meat and Livestock
Australia, Jan. 2003.23 It should be noted that the assessment of the impact of the FTA on beef imports in this section is
based on the staged implementation (over 18 years) of the Agreement and not as in Chapter 3 on the fullimplementation of the Agreement on Jan. 1, 2005. In addition, the GTAP database used in the model inChapter 3 includes beef as part of the larger meat products sector, which also includes pork and lamb.This section covers beef only. Therefore, the assessment of impacts in Chapter 3 is not comparable to theassessment of the impact in this section.
24 While in-quota tariffs of 4 percent and 10 percent exist on some in-quota beef imports, more than99 percent of Australian beef imports were subject to a duty of 4.4 cents per kilogram.

44
slightly increase the competitiveness of Australian beef vis-à-vis other exporters withinthe WTO quota. However, as long as the over-quota duty rate is not changed, andremains for the most part, prohibitive, Australia’s access will be limited to its WTOquota amount.
After the preferential TRQ enters into effect, the impact on total U.S. beef imports willcontinue to be minimal. In the third year of the Agreement, Australia will receiveincreased market access in terms of a duty-free preferential TRQ of 20,000 mt inaddition to its WTO allocation. This amounts to a 5.3 percent increase over Australia’scurrent duty-free access to the U.S. beef market of 398,214 mt. Australia’s totalduty-free access in year 3 of the Agreement will represent 3.3 percent of U.S. beefproduction and consumption (based on 2003 levels). This increase is approximatelyequivalent to an increase in U.S. cattle slaughter of 88,000 animals.25 This level ofincreased slaughter represents a 0.25 percent increase compared with actual 2003U.S. cattle slaughter, which implies a 0.5 percent decrease in the fed cattle price.26 Byyear 8 of the Agreement, the preferential TRQ will have increased to 30,000 mt,representing a 7.9 percent increase over Australia’s base WTO TRQ. Australianduty-free access would then represent 3.4 and 3.3 percent of 2003 U.S. beefproduction and consumption, respectively.27 The 30,000 mt of preferential duty-freeaccess represents an equivalent increase in U.S. cattle slaughter of less than 0.4percent compared with 2003 U.S. cattle slaughter, suggesting a fed-cattle priceimpact of less than 0.8 percent.
The preferential TRQ will continue to increase until year 18 of the Agreement,28 atwhich time the preferential quantity will be 70,000 mt and Australia’s total quotaaccess will be 448,214 mt. This represents an 18.5 percent increase over Australia’sbase WTO quota. However, Australia’s total quota access will still represent less than4 percent of 2003 U.S. production and consumption levels. The 70,000 mt isapproximately equivalent to 309,000 animals, or less than 0.9 percent of 2003 U.S.
25 Quantities of meat were converted to a live-cattle equivalent using the USDA boneless to carcassconversion rate of 0.669 and the 2003 average carcass weight for all cattle of 746 pounds. U.S. beefpackers operate on the margin between wholesale beef prices and slaughter cattle prices. Marketstructure suggests that processors can eventually pass most, if not all, of any decrease in the price ofwholesale beef on to cattle producers in terms of lower slaughter cattle prices. Therefore, this assumptionimplies that 100 percent of any price impact on beef at the wholesale level will be passed through to cattleproducers.
26 In testimony before the USITC, R-CALF USA stated that each 1 percent increase in supplydecreased price by 1 to 2 percent. Source: Brett DeBruycker, testimony before the USITC, hearingtranscript, p. 128. This was confirmed by USITC staff to be the farm level elasticity of demand for slaughtercattle, such that each 1 percent increase in fed cattle numbers would be expected to decrease fed cattleprices by 2 percent. Source: Wayne D. Purcell, The “Why” of Record-High Cattle Prices and Backgroundfor Longer Term Strategic Planning, Research Institute on Livestock Pricing, Virginia Polytechnic and StateUniversity, Department of Agricultural Economics, found at http://www.aaec.vt.edu/rilp/publications.html, retrieved on Apr. 13, 2004.
27 Note that these percentages are based on 2003 production and consumption, which couldchange significantly by year 8 of the Agreement, and thus significantly increase or decrease thesepercentages.
28 After year 8 of the Agreement, the increased level of the preferential TRQ is coupled withdecreased levels of over-quota duty rates. This section continues the analysis of the preferential TRQ only.The impact of the over-quota duty reductions is provided later.

45
cattle slaughter. Based on the fed cattle slaughter demand elasticity, this implies a fedcattle price impact of less than 1.8 percent. Current USDA baseline projections havetotal U.S. cattle numbers and beef production declining through 2005, and thenincreasing from 2006 through 2013.29 The USDA baseline has U.S. commercial beefproduction exceeding the 2003 level by 2011, which implies that after 2011, theexpected impact on U.S. cattle prices of a 70,000 mt increase in Australian marketaccess would be less than the 1.8 percent based on 2003 production.30 The U.S.industry estimates that given the primary end-use of imported Australian beef (groundbeef for the food service industry) and current estimates for domestic growth for foodservice ground beef, there will be no negative price impacts during the next 10 years.31
Furthermore, even if demand for lean beef stagnates, the domestic industry estimatesthat the maximum price impact of the increased TRQ in year 18 of the Agreementwould be less than one cent per pound on the live price of utility cows.32
Beginning in year 9, the impact of the FTA on the U.S. live cattle and beef industry is lesscertain because potential increases in imports above the TRQ amounts will dependupon the point at which the over-quota duty rate is no longer prohibitive. This point canbe expected to vary based on total demand and supply in the world market and theU.S. market; as well as the relative prices for individual cuts and products, both ofwhich might be expected to change significantly over the life of the Agreement. Theover-quota duty rate will be reduced by 6.7 percent annually during years 9 through13, and by 13.3 percent annually during years 14 through 18, resulting in duty-freeaccess for all Australian beef imports on January 1 of year 18.
While the specific impact of the over-quota duty rate cannot be known, R-CALF USA33
estimates that “Australian beef imports could well enter the United States with littleregard to the tariff level” once the over-quota duty rate drops below 14 to 15 percent –which will occur in year 14 of the Agreement.34 That is, R-CALF USA believes thatAustralian access to the U.S. beef market will be essentially unlimited by year 14 of theAgreement as opposed to year 18 of the Agreement as implied by the preferentialtariff-rate quotas. USITC estimates have confirmed that the price wedge – thedifference between the prices of U.S. imports of Australian beef and comparabledomestically produced beef – on about 90 percent of U.S. imports from Australia was
29 USDA, Office of the Chief Economist, Agriculture Baseline Projections to 2013, Staff ReportWAOB-2004-1, Feb. 2004.
30 In general, this analysis does not account for any displacement of 3rd country imports. Suchdisplacement would mitigate the effects.
31 “Report of the Agricultural Technical Advisory Committee (ATAC) for Trade in Animals andAnimal Products,” Majority Opinion of Beef Industry, USTR, Mar. 12, 2004; found athttp://www.ustr.gov/new/fta/Australia/advisor/atac-animals.pdf, retrieved on Apr. 16, 2004.
32 “Report of the Agricultural Technical Advisory Committee (ATAC) for Trade in Animals andAnimal Products,” Majority Opinion of Beef Industry, USTR, Mar. 12, 2004; found athttp://www.ustr.gov/new/fta/Australia/advisor/atac-animals.pdf, retrieved on Apr. 16, 2004.
33 R-CALF USA is concerned about the negative impact of granting increased Australian access tothe U.S. beef market; for additional detail see the position of interested parties in Chapter 9.
34 R-CALF USA, post-hearing brief, submitted Apr. 6, 2004.

46
less than 12 percent;35 suggesting that the impact of the over-quota duty rate could besignificantly diminished in the later years of the Agreement.
In the first eight years of the Agreement, increased market access forAustralian beef isclearly small relative to current U.S. production: it amounts to less than 0.4 percent of2003 production in terms of the number of cattle slaughtered. Therefore, thisAgreementwouldbeexpected tohave aminimal impact on theU.S. live cattle andbeefindustry in its first eight years. Furthermore, increased demand for U.S. beef couldeasily offset any increased market access for Australian beef.36The impact in the lateryears of the Agreement is, however, less certain. As the over-quota duty ratedecreases after year 8, the degree to which market access will increase is uncertainbecause the impact will vary among cuts of meat depending on relative prices.However, at some point prior to the end of the Agreement, before the over-quota dutyrate actually falls to zero, the over-quota tariffs may not impose any restriction onAustralian beef imports. Additionally, changes in U.S. consumer tastes andpreferences cannot be known; for example, some U.S. consumers may develop apreference for grass-fed beef.
U.S. ExportsMost of Australia’s beef production is grass-fed, compared to the grain-fed U.S.production. However, to increase its competitiveness in the high value Asian markets(primarily Japan, Korea, and Taiwan), which seem to prefer grain-fed beef, theAustralian industry has developed a small, but growing, grain-fed segment to supplygrain-fed beef to these markets. With increased access to grain-fed beef over the longterm, Australians could develop a taste for grain-fed beef, resulting in a market forU.S. grain-fed beef exports. This segment of the Australian industry is very competitivein the Asian markets, however; therefore, it would be expected to also be highlycompetitive in its own market, which is very limited in size.
35 This analysis compared the average unit value of imports under HTS 0202.30.50 to the price of90 percent lean fresh processing beef, FOB Omaha basis. The U.S. product would be expected to be at apremium to the Australian product because it is fresh, therefore this comparison would tend tooverestimate the price gap.
36 From 1980 to 1998, U.S. beef demand dropped by about 50 percent. However, since 1998,demand has increased by about 10 percent. Source: Wayne D. Purcell, The “Why” of Record-High CattlePrices and Background for Longer Term Strategic Planning, Research Institute on Livestock Pricing,Virginia Polytechnic and State University, Department of Agricultural Economics, found at:http://www.aaec.vt.edu/rilp/publications.html, retrieved on Apr. 13, 2004.

47
Dairy
Overview
U.S. IndustryThe United States is the world’s largest milk producer, its output of almost 78.2 millionmt in2003having accounted forabout 15percent of the world’s milk supply.37 Dairy isthe second-largest agricultural sector in the United States, generating about $22billion in cash receipts in 2003, equivalent to approximately 10 percent of cashcommodity farm receipts.38 According to the National Milk Producers Federation(NMPF), the retail value of dairy products containing U.S.-produced milk reached $90billion in 2003.39 The NMPF also reported that about 70,000 commercial dairy farmswere in operation in 2003, and that U.S. milk production generates close to 1.2 millionjobs both on farms and in dairy processing. Milk production in the United States isexperiencing considerable structural change, including (1) a steady increase inproduction and productivity over time; (2) an increasing share of U.S. milk suppliedfrom a relatively few, very large dairy operations; and (3) a regional shift inproduction from the Northeast and Upper Midwest to the Southwest and West. In2002, U.S. milk production costs were in the $10-13 per cwt range, significantly higherthan Australia ($2.7-9.1 per cut).40
In the United States, milk is marketed under a complex system of federal, state, andlocal laws and regulations.41 Programs at the federal level include a dairy pricesupport program,42 Federal milk marketing orders,43 income deficiency payments,import controls, and export assistance. These programs are used to influence the useand availability ofmilk in thedomestic market in order toaffect the level and reduce thevolatility of producer prices and incomes. A consequence of U.S. Government
37 Food and Agriculture Organization of the United Nations, FAOSTAT database Feb. 3, 2004update.
38 USDA, ERS, Cash receipts from farming, table 33, Agricultural Outlook, various issues.39 National Milk Producers Federation, submission to the Commission concerning U.S.-Australia
Free Trade Agreement: Potential Economy-wide and Selected Sectoral Effects (Investigation No.TA-2104-11), Apr. 6, 2004.
40 International Farm Comparison Network, Dairy Report 2003, found athttp://www.ifcnnetwork.org/.
41 For a detailed discussion of U.S. dairy policy, see USDA, ERS, Dairy. Briefing Room, found athttp://www.ers.usda.gov/Briefing/Dairy/Policy.htm.
42 Under the system, market prices for butter, cheddar cheese, and skim milk powder are supportedthrough purchases of domestic surpluses by the Commodity Credit Corporation (CCC). The CCC is agovernment-owned and -operated corporation within the U.S. Department of Agriculture.
43 Federal milk marketing orders regulate handlers that sell milk or milk products within an orderregion, by requiring them to pay not less than an established minimum price for the Grade A milk theypurchase from dairy producers, depending on how the milk is used. This classified pricing system requireshandlers to pay a higher price for milk used for fluid consumption (Class I) than for milk used inmanufactured dairy products such as yogurt, ice cream (Class II), cheese, (Class III), and butter and skimmilk powder (Class IV)).

48
intervention has been the rise of U.S. domestic prices substantially above world marketprices.44
Owing to the incentives createdby theprice gapbetweendomestic and worldmarkets,border controls in the form of TRQs have been necessary to prevent imports fromlowering domestic dairy prices and undermining government support programs.Dairy imports account for about 2 percent of the value of domestic production. TotalU.S. imports subject to TRQs– mainly cheese – amounted to $783 million annually in2003, while imports not subject to TRQs amounted to $971 million. In 2003, U.S.imports of dairy products from Australia amounted to $93 million, accounting for 5percent of total U.S. dairy imports. Imports from Australia included $27 million ofproducts subject to TRQs, and $66 million of products not subject to TRQs.
Australian IndustryIn 2003, Australia was the world’s 14th-largest milk-producing country withproduction of 10.6 million mt, accounting for about 2.1 percent of world production.45
However, it ranked third among leading exporting countries, accounting for about 17percent of the global dairy trade.46 The Australian dairy industry is thethird-most-important agricultural industry (behind the wheat and beef industries), andmilk production accounted for about 11 percent of the total value of Australianagricultural production in 2000/01.47 Further, dairy products accounted for about 8percent of total Australian agricultural exports in 2002.48 Australia’s pasture-basedproduction system is highly efficient, making Australia one of the world’s lowest-costmilk producing countries. Australia’s dairy industry is largely dominated bycooperatives, which process about three-quarters of all the milk delivered tofactories.49 Recently, the Australian dairy industry has undergone significantderegulation and there is relatively little government support of the sector.
Low milk production costs and highly modern and efficient processing facilities makeAustralia highly competitive in international markets, especially in cheese, milkpowders, butter, and dry dairy ingredients (such as whey, lactose, milk proteinconcentrate, casein, and caseinate). In 2002/03,50 approximately 60 percent of alldairy products manufactured in Australia were exported.51 The volume is estimated at
44 In 2003 the average U.S. price of butter was 80 percent higher than the world price, while U.S.cheese prices were 42 percent higher, and skim milk powder prices were 8 percent higher. USDA, FAS,Dairy World Markets and Trade, Dec. 2003.
45 Food and Agriculture Organization of the United Nations, FAOSTAT database Feb. 3, 2004update.
46 Dairy Australia, Australian Dairy Industry in Focus 2003.47 Agriculture, Fisheries, and Forestry Australia, Australian Food Statistics 2003, June 2003, table
1.2, pp. 37-38.48 Australian Bureau of Agricultural and Resource Economics, Australian Commodities, Dec. 2003.49 Paul Kerr, Chief Operating Officer, Murray Goulburn Co-op Ltd, testimony before the USITC
concerning Investigation 332-453: Conditions of Competition for Milk Protein Products in the U.S.Market, Dec. 11, 2003, transcript p. 371.
50 Australia’s marketing year for milk, ending June 30.51 Dairy Australia, prehearing submission, USITC Investigation 332-453: Conditions of Competition
for Milk Protein Products in the U.S. Market, Dec. 1, 2003, p. 7.

49
13.8 billion pounds (raw milk equivalent). Australia supplies more than 120 countriesworldwide. However, Asian markets account for between two-thirds andthree-quarters of total Australian exports, reflecting Australia’s proximity to thosemarkets.52 The United States is also an important market for Australian dairy exports;in 2001, it accounted for about 5 percent of the total value of dairy exports fromAustralia.
Potential Impact on U.S. Trade Flows
U.S. ImportsThe U.S.-Australia FTA will likely result in a relatively small increase in U.S. imports ofdairy products from Australia. The Agreement is also likely to have a small effect onU.S. milk production and employment in the dairy industry. This conclusion is based onan analysis showing that the additional quantities of Australian dairy productsentering the U.S. market as a result of the Agreement are relatively small incomparison with current levels of domestic dairy production and consumption.
Current U.S. tariff and nontariff barriers in the sectorU.S. tariff treatment of imported dairy products varies considerably by product type.Imports of dairy products including fluid milk and cream (fresh, condensed, andevaporated), butter, cheese, milk powders, whey products, chocolate containingbutterfat, infant formula, ice cream, and animal feeds containing milk are subject toTRQs with high over-quota tariffs. In 2003, the over-quota tariffs on an ad valoremequivalent basis for butter and skim milk powder were 84 percent and 53 percent,respectively.53 In contrast, imports of many other milk protein products, such as milkprotein concentrate, whey protein concentrate, and caseinate, face generally low advalorem or specific tariffs and no quantity restrictions,54 while imports of casein andmilk albumin enter the United States duty-free.
Specific FTA provisions for this sectorThe market access provisions under the FTA pertaining to U.S. dairy imports fromAustralia are shown in table 4-2. Under the FTA, 12 separate TRQs were established
52 Dairy Australia, Australian Dairy Industry in Focus 2003.53 In addition, U.S. imports of dairy products subject to TRQs are also covered by Special
Safeguards (SSGs) which take the form of temporary additional duties and are typically applied toproducts that are particularly “sensitive to trade.” Under rules in the World Trade OrganizationAgreement on Agriculture, SSGs are permissible to prevent low prices or import surges from injuring adomestic industry.
54 For example, the tariff on milk protein concentrate (HTS subheading 0404.90.10) is $3.70 per mt,less than 0.1 percent on an ad valorem equivalent basis.

50
Table 4-2U.S. market access provisions for dairy products under the U.S.-Australia FTA
HTS chapter andAdditional quota
ProductHTS chapter andadditional note WTO quota Year 1 Year 10 Year 25
Metric tons
Milk/cream/ice cream1 . . . Ch. 4: 5; Ch. 21: 5 0 7.5 12.7 230.4Condensed milk . . . . . . . . . Ch. 4: 11 92 3,000 5,068 212,147Butter/butterfat . . . . . . . . . . Ch. 4: 6, 9, 14 0 1,500 1,957 33,049Skim milk powder . . . . . . . Ch 4: 7 600 100 130 3203Other powder . . . . . . . . . . . Ch: 4, 8, 12; Ch. 23: 2 56 4,000 5,693 410,253Other dairy . . . . . . . . . . . . . Ch. 4: 10; Ch. 18: 2 3,016 1,500 2,534 26,074Cheddar cheese . . . . . . . . Ch. 4: 18 2,450 750 979 31,525American-type cheese . . . Ch. 4: 19 1,000 500 652 31,016Swiss cheese . . . . . . . . . . . Ch. 4: 25 500 500 776 51,612European-type cheese6 . . Ch 4: 17, 20, 21, 22 0 2,000 3,103 56,451NSPF (other) cheese . . . . Ch 4: 16 3,050 3,500 5,430 511,288Goya cheese . . . . . . . . . . . Ch 4: 21 13,481 2,500 3,878 (7)
1 Million liters.2 6 percent compound growth after year 17.3 3 percent compound growth after year 17.4 4 percent compound growth after year 17.5 5 percent compound growth after year 17.6 Includes blue mold cheese, Edam and Gouda, Italian-type cheese, and Gruyere-processed cheese.7 Unlimited access after year 17.
Source: U.S.-Australia Free Trade Agreement, Draft, Annex 2-B, Mar. 1, 2004
that cover almost all U.S. dairy imports already subject to TRQs under the World TradeOrganization (WTO) Agreement on Agriculture. Under the FTA, quota quantities willincrease in the first 17 years in staged amounts, after which they will increase annuallybased on a compound growth rate (table 4-2).55 After year 17, quotas will increase bya specified compound growth rate that ranges from 3 to 6 percent depending on thecategory. Imports up to the FTA quota level will face a tariff rate of zero. However,imports entering beyond the quota amount will continue to face the normal traderelations (NTR) over-quota tariff rate; the Agreement does not include phasedreductions in the over-quota tariff on Australian products.56 For most dairy productsnot subject to TRQs, tariffs will be eliminated in equal installments over an 18-yearphase-out period. Also eliminated are the in-quota tariffs on Australia’scountry-specific TRQs under the WTO Agreement on Agriculture.57 After year 20, theFTA allows either country to request consultations with the other to review the dairymarket access arrangements.
To gauge the impact of these provisions on the U.S. dairy industry, the additionalamount of dairy products entering the U.S. market resulting from the FTA were
55 Goya cheese is an exception for which the over-quota tariff will drop to zero in year 18 (i.e., theTRQ will be eliminated).
56 In other U.S. FTAs (e.g., Chile, Jordan, and Israel), over-quota tariffs are reduced over theimplementation period.
51
compared with total U.S. dairy imports and U.S. dairy production. In light of theheterogenous nature of dairy products, an accurate accounting of additional importscannot be made by simply summing tonnages acrossproducts (e.g., combining liters ofmilk with tons of butter and cheese). A more accurate method of accounting (and onecommonly used by dairy analysts) is to convert dairy products into their milkcomponents (i.e., protein, milkfat, and other milk solids (mainly lactose, minerals,vitamins)), which then can be summed and compared. The additional volume of U.S.imports of milk protein, milkfat, and other milk solids derived from additional marketaccess by Australia under the Agreement are compared with U.S. production in table4-3.58
In the initial year of the Agreement, it is estimated that the additional amount of milkprotein entering the U.S. market will be about 9.1 million pounds, increasing to 13.8million pounds in year 10, and to 23.2 million pounds in year 25. The United Statesproduced about 170.3 billion pounds of milk in 2003,59 equivalent to about 5,620millionpoundsof protein (fluid wholemilk is assumed tobe 3.3percent protein).60 Thusthe additional quantities of protein imports resulting from the FTA are equivalent toabout 0.2 percent of U.S. production in years 1 and 10, and 0.4 percent in year 25(assuming a 2003 level of milk production) (table 4-3). The analysis also indicates thatthe FTA would add relatively small quantities of milkfat and other milk solids to the U.S.market, based on 2003U.S. milk production. After 25 years, additional imports wouldaccount for 0.5 percent of domestic milkfat production and 0.3 percent of other milksolids production. These estimates are consistent with the GTAP results reported inChapter 3.
The USDA has reported that it expects increased trade access under the FTA. TRQs willbe equivalent to about 0.2 percent of the annual value of U.S. dairy production. It alsobelieves it unlikely that additional imports will impact the operation of the U.S. dairy
57 For example, under the WTO Agreement on Agriculture, Australia has an exclusive access(country-specific quota) for 2,450 mt of cheddar cheese.
58 The procedure used to estimate the milk components of additional imports under the FTA was asfollows. The percentages of protein, milk fat, and other solids contained within each product covered byTRQs were obtained from the USDA Nutrient Database. Using these conversion factors, the additionalquantities of milk components imported into the United States under the FTA were calculated for each ofthe first 25 years of the FTA, based on the growth in TRQs over this period. Total additional imports of milkcomponents were summed across all 12 TRQs and compared with domestic production. For example,cheddar cheese is 25 percent protein, 33 percent milk fat, and 5 percent other solids. Thus everyadditional ton of cheddar cheese entering the United States under the FTA means an additional 250kilograms of protein, 330 kilograms of milk fat, and 50 kilograms of other solids in the U.S. dairy market.In year 1 of the FTA, the cheddar cheese quota is 750 mt, implying an additional 187.5 tons of protein,247.5 mt of milk fat, and 37.5 mt of other solids. By year 25, when the cheddar cheese quota reaches1,525 mt, additional milk components will amount to 381 mt of protein, 503 mt of milk fat, and 76 mt ofother solids. These milk component quantities were summed across all 12 TRQs, and compared with U.S.milk production (about 170 billion pounds, with 3.3 percent protein, 3.3 percent milk fat, and 5.4 percentother solids).
59 USDA, NASS, Milk production, Mar. 2004.60 USDA, Nutrient database.

52
Table 4-3Estimated additional U.S. imports of milk components from Australia under provisions of theU.S.-Australia FTA, and comparison with total U.S. imports and production in 2003Item Protein Milkfat Other milk solids
Million pounds
Additional imports from Australia:Year 1 . . . . . . . . . . . . . . . . . . . . . . . . . . . . . 9.1 12.2 8.9Year 10 . . . . . . . . . . . . . . . . . . . . . . . . . . . . 13.8 17.9 13.8Year 25 . . . . . . . . . . . . . . . . . . . . . . . . . . . . 23.2 30.4 28.9
Total U.S. production in 2003 . . . . . . . 5,620 5,620 9,196
PercentShare of 2003 production:
Year 1 . . . . . . . . . . . . . . . . . . . . . . . . . . . . . 0.2 0.2 0.1Year 10 . . . . . . . . . . . . . . . . . . . . . . . . . . . . 0.2 0.3 0.2Year 25 . . . . . . . . . . . . . . . . . . . . . . . . . . . . 0.4 0.5 0.3
Note.—Milk component conversion factors are sourced from the U.S. Department of Agriculture’s, Nutrientdatabase.
Source: USITC estimates.
price support programs.61 The NMPF analysis also shows effects of similar magnitudein the out years. For example, by the 10th year, the NMPF expects the cumulated dairyincome loss to be $610 million. This represents about 0.25 percent of cumulated farmreceipts from sales of milk over a 10-year period based on annual receipts of $23billion.62
U.S. Exports
The United States is not a major dairy-exporting country. In 2003, its dairy exports toAustralia amounted to $8.8 million, of which about one-half was infant formula and20 percent was lactose. All dairy products exported to Australia currently face an NTRduty rate of zero and are not subject to sanitary/phytosanitary restrictions. Thus theFTA is not expected to change the trade flows of U.S. dairy products into Australia.63
61 USDA, FAS, http://www.fas.usda.gov/info/factsheets/australia.html.62 National Milk Producers Federation, submission to the Commission concerning U.S.-Australia
Free Trade Agreement: Potential Economy-wide and Selected Sectoral Effects (Investigation No.TA-2104-11), Apr. 6, 2004, table 2, p. 3.
63 Report of the Agricultural Technical Advisory Committee (ATAC) for Trade in Animals and AnimalProducts, Mar. 2004, found at http://www.ustr.gov/new/fta/Australia/advisor/atac-animals.pdf.

53
Citrus Fruit64
Overview
U.S. IndustryThe United States is a leading citrus producer, importer, and exporter. The value ofU.S. citrus shipments (packinghouse-door equivalent) was $2.3 billion in 2003.65 In2003, the United States produced 10.5 mt of oranges, most of which were processedinto orange juice, and exported 620,000 mt of fresh oranges. U.S. domesticconsumption of oranges in 2003 was 1.6 mt, of which imports accounted for about 2percent, mainly from Spain, South Africa, and Australia.66 U.S. juice production in2003 was 898,289 mt, of which exports were 70,000 mt. Imports accounted for lessthan one-fifth of U.S. domestic orange juice consumption.
The State of Florida accounts for the majority of U.S. citrus production. Most ofFlorida’s citrus is processed, primarily for orange juice. California produces much ofthe fresh market citrus, including navel oranges and lemons. Florida accounts for mostfreshgrapefruit production. Thereare some17,000citrusgrowers in the UnitedStates,most of whom are loosely affiliated through grower associations.67 For many yearsthe numberof growers has steadily declined through consolidationor smaller growersleaving the industry. The U.S. industry has remained competitive through innovation ingrowing and processing of citrus and because of ideal growing conditions.
World trade in fresh and processed citrus fruit has expanded considerably in recentyears as transportation has become more efficient and because consumers desireyear-round supplies of fresh produce. For example, the United States importedvirtually noorange juice, its principal citrus import, prior to the mid-1980s, but 10 yearslater was importing over half of its domestic consumption. This partly explains thepredominance of many Southern Hemisphere countries (Brazil, Chile, Argentina,South Africa, and Australia) as citrus suppliers because their growing seasons are theopposite of countries in the Northern Hemisphere and thus can supply fresh producewhen fresh fruit is out of season in countries such as the United States.
Australian IndustryAustralia’s principal citrus products, in descending order, are valencia oranges, naveloranges, mandarins, lemons and limes, and grapefruit. The Government of Australia
64 Fresh citrus is classified under HTS 0805, while most citrus juices are classified under HTS 2009.65 Citrus Fruits 2003 Summary, USDA/National Agricultural Statistics Service, Fr. Nt. 3-1 (03), Sept.
2003.66 USDA/FAS, FAS Quarterly Reference Guide to World Horticultural Trade, FHORT 1-04, Jan.
2004.67 Based on grower memberships in citrus organizations in Florida and California.

54
estimates that therewere some3,444establishments growingcitrus fruit inAustralia in2000.68 Australia’s principal exports are fresh navel oranges and orange juice. In2003, Australia produced 535,000 mt of oranges, of which 150,000 mt wereexported as fresh oranges, with the remainder either processed into orange juice orconsumed domestically. Australian imports of fresh oranges account for less than 10percent of domestic consumption.
Australia produced about 18,774 mt of orange juice in 2003, of which 2,000 mt wereexported. Australia’s imports of orange juice accounted for over one-half of itsdomestic consumption, with about 98 percent of imports coming from Brazil.69
Australia’s principal export to the United States is fresh navel oranges. The marketingseason for Australian navel oranges is from about July 1 to the end of August. U.S.navel oranges are marketed from November to April; hence, Australian naveloranges do not compete directly with U.S. navel oranges. However, they do competedirectly with U.S. fresh valencia oranges, which are marketed in the late spring andsummer. The United States was the fourth-largest export destination for freshAustralian oranges in 2001, accounting for about 12 percent of its exports, ahead ofJapan but after Hong Kong, Malaysia, and Singapore.
Potential Impact on U.S. Trade Flows
U.S. ImportsThe impact of the U.S.-Australia Free Trade Agreement on total U.S. citrus imports islikely to be minimal. U.S. tariff rates on fresh Australian citrus are generally less than 3percent, ad valorem equivalent, so the immediate removal of most of these dutiesunder the FTA would likely not lead to any appreciable increase in imports. U.S. citrusjuice tariffs for Australia are currently relatively high, 30 to 40 percent ad valorem,and most would be phased out over 18 years in equal annual reductions. Australia,however, is not expected to significantly expand citrus juice production.
U.S. ExportsThe impact of the U.S.-Australia Free Trade Agreement on total U.S. citrus exports isexpected to be minimal. Australian import duties are only 5 percent on frozenconcentrated orange juice (FCOJ) and less than that for fresh citrus. U.S. exports ofcitrus to Australia consist mainly of oranges, lemons and grapefruit. While Australiantariff rates are relatively low, U.S. exporters have stated that phytosanitary restrictionsare the main barrier to entry. U.S. industry representative claim that these barriers
68 USDA/FAS, Australia Citrus Annual 2002, GAIN Report AS2014, May 1, 2002.69 USDA/FAS, Australia Citrus Annual 2002, GAIN Report AS2014, May 1, 2002.

55
include excessively strict inspections and rejections of fruit that are not necessarilybased on science and which may violate Australia’s WTO obligations.70 However, theU.S.-Australia FTA established a Committee on Sanitary and Phytosanitary Matters.(See text box 4-1.) If Australia’s phytosanitary restrictions on fresh citrus were to beresolved, U.S. exports to Australia of fresh citrus fruits would likely increase.
Certain Fresh and Processed Fruit71
Overview
U.S. IndustryThe United States is a major producer, trader, and consumer of the subject fruit. Itranked fourth in the volume of global production of the subject fruit in 2003, behindChina, the EU, and Turkey, and accounted for about 5 percent of the quantity of suchproduction that year.72 The United States is most prominent among global producersof blueberries (54 percent of the total quantity in 2003), strawberries (26 percent),raspberries (13 percent), peaches and nectarines (11 percent), and cherries (10percent).
U.S. production of the subject fruit totaled approximately $4.4 billion, farm value, in2003. The principal items include strawberries (30 percent), peaches and nectarines(13 percent), cherries (9 percent), and avocados (9 percent).73 The U.S. industrycomprises thousands of farms, processing plants, and workers, with major producingareas including California, Washington, Oregon, Florida, and Michigan.
The United States is the leading world producer of canned deciduous fruit, accountingfor about 53 percent of the total world quantity in 2002.74 Production totaled about1.2 million mt in 2002. Principal products include canned peaches (37 percent of theworld total in 2002), pears (75 percent), mixtures (56 percent), and apricots (36percent). There are seven processors of canned deciduous fruit in the United States,located mainly in California and Washington. The U.S. industry has been
70 Based on USITC staff conversation with representative of Sunkist Growers, Apr. 9, 2004.71 This sector includes products classified in HTS chapters 8 and 20. The U.S. fruit sector comprises a
broad range of fruit items and product forms. The types of fruit of concern in this sector include apricots,avocados, berries, cherries, dates, figs, melons, papayas, peaches and nectarines, pears, plums, andquinces. The principal product forms in the U.S. market are fresh, frozen, and canned.
72 Data from the Food and Agriculture Organization (FAO) of the United Nations. Data representprimary product forms before processing.
73 U.S. Department of Agriculture, National Agricultural Statistics Service, Noncitrus Fruits and Nuts2003 Preliminary Summary January 2004, Fr Nt 1-3 (04), available at Internet addresshttp://usda.mannlib.cornell.edu/reports/nassr/fruit/pnf-bb/ncit0104.pdf; Vegetables 2003Summary January 2004, Vg 1-2 (04), available at Internet address http://usda.mannlib.cornell.edu/reports/nassr/fruit/pvg-bban/vgan0104.pdf.
74 Not including China, for which data are not available.

Text box 4-1The U.S.-Australia FTA and Sanitary and Phytosanitary Regulations
Sanitary and phytosanitary (SPS) regulations are measures designed to protect human,animal, and plant health. The U.S. agriculture community has expressed concern that anumber of Australian SPS measures, in particular those that affect U.S. exports of pork,poultry, and horticulture products unduly limit trade. The U.S.-Australia FTA establisheda Committee on Sanitary and Phytosanitary Matters (Committee). The Committeecomprises representatives of the agencies who have responsibility for SPS measures ineach country. The Committee will work to enhance each party’s implementation of theWTO SPS Agreement and enhance consultation and cooperation on SPS matters andfacilitate trade between the Parties.
Further the FTA established a Standing Technical Working Group on Animal and PlantHealth Measures (Working Group). The Working Group will be co-chaired by the chiefadministrators of Biosecurity Australia and the Animal and Plant Health InspectionService of the USDA. The Working Group shall provide a forum for resolving specificbilateral animal and plant health matters with a view to facilitate trade and engage inscientific and technical cooperation regarding animal and plant health matters thataffect trade. The FTA outlines the process by which the Working Group will review issuesof interest to either the United States or Australia. Committee and the Working Groupprovide for consultation and cooperation between the United States and Australia butcannot require changes in SPS regulations in either country. Also, the bilateral disputesettlement system contained in the FTA cannot be used to settle SPS disputes between theUnited States and Australia.
CertainSPS issues regarding U.S. exports have been, or are currently being, resolved. Inparticular, Biosecurity Australia has issued a final import risk assessment that will permitthe importation of processed pork and pork for processing. Further, imports of tablegrapes from the United States are now permitted, although the U.S. industry believescurrent risk mitigation requirements still limit trade. Import risk assessments on imports ofcitrus from Florida and stone fruit from California are expected.
56

57
experiencing financial difficulties in recent years, leading to the bankruptcy of thelargest processor in 2000. Capacity has decreased recently in response to risingimports, mostly EU products, and a static domestic market, as consumers shift to freshfruit.
The United States possesses a relatively large amount of quality land, a variety ofclimates, excellent infrastructure, leading technology, and a large domestic market,all of which are factors aiding the competitiveness of the fruit sector. Mitigating factorsinclude relatively high costs, mainly related to labor, land values, and environmentalrestrictions. Changes in harvesting, storage, and shipping technology; tradeagreements that have lowered tariffs andphytosanitarybarriers; structural changes inthe food distribution and retail sectors; and demographic shifts leading to changes inconsumer tastes have also shifted the competitive landscape for the U.S. fruit sector,both in domestic and international markets.
Australian IndustryAustralia’s fresh fruit sector is small relative to that of the United States. Australia rankswell behind major global producers of the subject fruit and accounted for less than 0.5percent of the quantity of world production in 2003.75 Australian production of thesubject fruit was approximately 6 percent of the level of U.S. production in 2003.Principal Australian fruit items include pears, peaches, and nectarines.
Australia is a major global producer and exporter of canned deciduous fruit. In 2002,the country accounted for about 6 percent of global production of such fruit, withproduction totaling about 131,000 mt.76 Principal products include canned peaches(4 percent of the world total in 2002), pears (9 percent), mixtures (8 percent), andapricots (7 percent). Australia’s share of the quantity of world exports is relatively highfor canned fruit mixtures (17 percent) and canned pears (14 percent).77 Although theAustralianpreparedorpreserved fruit industryexports a significant shareof its output,it is oriented toward the domestic market.78 This mainly is to avoid competition, largelyfrom EU products, in the lower-priced, institutional sector that tends to dominate exportmarkets. Exports have been depressed in recent years as a result of suchcompetition.79 Australia is increasing efforts to become more competitive in exportmarkets by lowering costs and by developing innovative packaging, such as plastic
75 FAO.76 Estimated by the U.S. International Trade Commission based on data from the Foreign
Agricultural Service of the U.S. Department of Agriculture and from the 6th World Canned DeciduousFruit Conference. Data are based on the 2001 or 2002 season.
77 Estimated by the U.S. International Trade Commission based on data from the ForeignAgricultural Service of the U.S. Department of Agriculture and from the 6th World Canned DeciduousFruit Conference. Data are based on the 2001 or 2002 season.
78 FAS, USDA, Australia Canned Deciduous Fruit Annual 2002, GAIN Report #AS2030, Oct. 1,2002, p. 6.
79 FAS, USDA, Australia Canned Deciduous Fruit Annual 2002, GAIN Report #AS2030, Oct. 1,2002, p. 1.

58
cups as opposed to traditional metal cans.80 The Australian prepared or preservedfruit industry is highly concentrated, as the largest fruit processor accounts for about90 percent of output.81 The firm employs approximately 3,000 during the peakproduction period.82 Canned fruit production is affected by weather conditions thatdetermine fresh fruit inputs and can fluctuate significantly on an annual basis.
Australia possesses less suitable land area than the United States and has a similarrange of climates. The country is counterseasonal to the United States and can marketfresh fruit during periods when U.S.-produced supplies are low. Australia alsocompetes with other Southern Hemisphere sources, such as Argentina, Chile, andSouth Africa, in the U.S. market for offseason fresh fruit. Favorable competitive factorscompared to the United States include lower production costs and the exchange rate.Disadvantages include a relatively small domestic market and a long distance to U.S.markets.
Potential Impact on U.S. Trade Flows
U.S. Imports
The U.S.-Australia FTA likely will result in a minimal increase in U.S. imports of thesubject fruit in the short term. While current U.S. tariffs on most of the subject items arerelatively high, phytosanitary restrictions apply to most fresh fruit items,83 and underthe FTA, the major imports of concern are subject to relatively long staging periods,TRQs, and safeguard measures. Fresh or dried avocados84 are subject to a seasonalTRQ, with duty-free imports during Feb. 1-Sept. 15 increasing from zero the first year to1,500 mt the second year, and 10 percent annually thereafter, becoming unlimited inthe 18th year and beyond. Such imports during Sept. 16-Jan. 31 will increase from zerothe first year to 2,500 mt in the second year, 10,443 mt in the 17th year, and unlimitedin the 18th year and beyond. Price-based safeguards, in the form of additional duties,are provided for imports of prepared or preserved pears, apricots, peaches, and fruitmixtures85 if the import unit price86 is below a trigger price by greater than specified
80 S.P.C. Limited, S.P.C. Limited Annual Report 2001, pp. 15-16, found at Internet addresshttp://www.spcardmona.com.au/investor/reports/downloads/SPC%20AR%20front01.pdf, retrievedMar. 31, 2003.
81 FAS, USDA, Australia Canned Deciduous Fruit Annual 2002, GAIN Report #AS2030, Oct. 1,2002, p. 7.
82 S.P.C. Limited, S.P.C. Limited Annual Report 2001, p. 22, found at Internet addresshttp://www.spcardmona.com.au/investor/reports/downloads/SPC%20AR%20front01.pdf, retrievedMar. 31, 2003.
83 Currently, only imports of fresh grapes, strawberries, blackberries (Tasmania only), andraspberries (Tasmania only) are permitted from Australia. U.S. Department of Agriculture, Animal andPlant Health Inspection Service, Regulating the Importation of Fresh Fruits and Vegetables, available atInternet address http://www.aphis.usda.gov/ppq/manuals/pdf_files/20Fruits_and_Vegetables.pdf.
84 HTS subheading 0804.40.00.85 HTS subheadings 2008.40.0020, 2008.40.0040, 2008.50.4000, 2008.70.2020,
2008.70.2040, 2008.92.9030, 2008.92.9035, 2008.92.9040, and 2008.92.9050.86 Determined on the basis of the F.O.B. import price of the good in U.S. dollars.

59
ranges.87 The safeguards expire when tariffs are eliminated. Current phytosanitaryrestrictions remain in place and will be addressed under the FTA through a technicalworking group to resolve specific bilateral issues within the framework of the currentWTO Agreement on the Application of Sanitary and Phytosanitary Measures (the SPSAgreement).
U.S. imports of the subject fruit from Australia totaled about $1.4 million in 2003,representing about 0.2 percent of total imports of such items and a miniscule share ofthe U.S. market. By far the largest Australian import share is held by prepared orpreserved pears, about 7 percent of the total value of U.S. imports in 2003. This sharecan fluctuate significantly on an annual basis, resulting mainly from weather-relatedconditions in major competing supplier markets, including the United States.88 Theimportance of the United States as an Australian export market varies by product. Forcanned peaches, Australia’s market share varies annually, depending on supplyconditions affecting U.S. and other foreign suppliers. For example, the United Stateswas the leading export market for Australian canned peaches in 2001, accounting for22 percent of the total quantity that year.89 However, by 2003, the U.S. marketaccounted for only 2 percent of such exports.90 For canned pears, the U.S. marketgenerally is more stable for Australian exports. The United States was thesecond-leading export market for Australian exports of canned pears in 2003,accounting for 22 percent of the total quantity that year.91Primary markets forAustralian exports of the subject fruit include the EU, Canada, New Zealand, andJapan.
In the longer term, after tariffs, TRQs, and safeguards are eliminated, theU.S.-Australia FTA may lead to increased imports of some of the subject fruit items.Australia generally is a lower-cost producer than the United States for the subject fruititems. Australia could shift exports from other markets in response to substantial dutyreductions in the U.S. market. However, Australia is a minor supplier to the UnitedStates and some of its competitors (Argentina, Chile, and South Africa) are eithernegotiating or have negotiated FTAs with the United States, which would negate anycompetitive advantage conferred byduty-free treatment under the U.S.-Australia FTA.Also, the canned deciduous fruit import market has been dominated by EU supplies,mainly from Greece and Spain. Any increase in imports from Australia could displace
87 No additional duty is imposed if the difference between the unit import price and the trigger priceis less than or equal to 10 percent of the trigger price. A maximum additional duty of 100 percent advalorem is imposed if the difference between the unit import price and the trigger price is greater than 75percent of the trigger price. Trigger prices vary depending on the product and range between $0.32 perkilogram and $1.21 per kilogram.
88 The same is true for prepared or preserved peaches. U.S. imports from Australia were zero in2002 and 2003, but were $1.5 million, or about 15 percent of the total, in 1999.
89 FAS, USDA, Australia Canned Deciduous Fruit Annual 2002, GAIN Report #AS2030, Oct. 1,2002, p. 6.
90 FAS, USDA, Australia Canned Deciduous Fruit Annual 2003, GAIN Report #AS3035, Sept. 30,2003, p. 7.
91 FAS, USDA, Australia Canned Deciduous Fruit Annual 2003, GAIN Report #AS3035, Sept. 30,2003, p. 8.

60
other imports as well as domestic production. The impact of the U.S.-Australia FTA onU.S. production and employment likely will be gradual, as a consequence of theextended phasing-in of tariff reductions. Any impact would be affected by otherfactors, such as shifts among import suppliers, FTAs with other competitors, thelong-term viability of EU production, and U.S. market conditions.
U.S. ExportsThe U.S.-Australia FTA likely will result in a nonmeasurable increase in U.S. exports ofthe subject fruit. Existing Australian duties on imports of the subject fruit are relativelylow, generally ranging between zero and 5 percent ad valorem, and are scheduledfor immediate elimination. Australia is a relatively small market, possesses acompetitive domestic industry, and is a long distance from the United States. Australiamaintains restrictive phytosanitary measures that limit U.S. exports of certain freshfruit. Such measures likely will not change directly as a result of the FTA, as the FTAestablishes a technical working group to address the measures within the existingframework of the WTO SPS Agreement. U.S. exports of the subject fruit generally aresmall compared with production and are mainly destined for larger and moreproximate markets, such as Canada, the EU, Japan, and Mexico. U.S. exports of thesubject fruit to Australia totaled $10.1 million in 2003, representing about 2 percent ofthe total U.S. exports of the subject fruit. Major export items included dried plums (36percent of the total value of the subject exports to Australia in 2003; 3 percent of thetotal value of item exports to the world), fresh or dried dates (31 percent; 23 percent),and prepared or preserved cherries (12 percent; 19 percent).
Macadamia Nuts92
Overview
U.S. IndustryThe U.S. macadamia nut industry is concentrated in Hawaii. In crop year93 2002-03,approximately650 growers farmed 18,000acres inHawaii, and produced 57millionpounds of nuts (wet in-shell basis), valued at $30.1 million.94 Sales of processedmacadamia nuts are in excess of $150 million.95 Macadamia nuts are Hawaii’s
92 In-shell and shelled macadamia nuts are classified in the eight-digit HTS subheadings0802.90.80 and 0802.90.98, respectively, while prepared or preserved macadamia nuts are classifiedin the eight-digit HTS subheading 2008.19.90.
93 The U.S. crop year runs from July 1 to June 30 the following year.94 Hawaii Macadamia Nuts: Final Season Estimates, Hawaii Department of Agriculture, National
Agricultural Statistics Service, July 8, 2003.95 Written submission to the Commission by Sandra Lee Kunimoto, Chairperson, Board of
Agriculture, Hawaii Department of Agriculture, received Apr. 2, 2004.

61
fourth-largest agricultural crop and have been described as one of the most successfulagricultural value-added enterprises in the state.96 The United States is thesecond-largest producer of macadamia nuts after Australia, accounting forapproximately 23 percent of global macadamia nut production in 2003-04.97 Asmost of Hawaiian macadamia acreage is mature, future production is not expected toincrease significantly.98 U.S. macadamia nut production has fallen over the last fiveyears because of adverse weather, reduced harvested acreage and new plantings,and some reduction in orchard care due to low returns. Rising consumer income andawareness of health benefits of certain nuts continue to spur U.S. consumer demandfor nuts in general and macadamia nuts in particular, yet Hawaiian growers facecompetition from lower-priced imported raw product. Although some large U.S.producers have been able to reduce costs of production to meet import prices,99
average Hawaiian costs of production are higher than foreign producers’, andincreased imports have put downward pressure on prices received by Hawaiiangrowers. National brands and private-label producers of snack nut mixes, the fastestgrowing segment of the U.S. nut market, have become very active in the market formacadamia nuts and generally use lower-priced, imported kernels.100
TheUnitedStates is theworld’s largest consumerofmacadamias.U.S. foodprocessorshave increasingly turned to imported bulk kernels to supplement their U.S. purchasesand ensure a steady year-round supply.101 While other major macadamianut-producing countries (Australia, South Africa, Guatemala, and Kenya) exportedover 75 percent of their production in 2003-04, the United States only exported 20percent of its domestic production in the same period.102
Australian IndustryIn crop year 2003-04,103 Australian production of macadamia nuts was 65.5 millionpounds, valued at $59.8 million.104 Approximately 800 growers farm about 14,000hectares of 4.1 million commercially bearing macadamia trees mainly in northeastern
96 Written submission to the Commission by Sandra Lee Kunimoto, Chairperson, Board ofAgriculture, Hawaii Department of Agriculture, received Apr. 2, 2004.
97 Macadamia Situation and Outlook in Selected Countries, Foreign Agricultural Service, U.S.Department of Agriculture, Apr. 2004, found at http://www.fas.usda.gov/htp/circular/2004/04-02-04.pdf, retrieved Mar. 30, 2004.
98 Written statement by David G. Rietow, President, Hawaii Macadamia Nut Association, submittedto the Commission Mar. 30, 2004.
99 Commission staff communication with U.S. industry representatives, Apr. 1, 2003.100 Commission staff communication with U.S. industry representatives, Apr. 1, 2003.101 Situation and Outlook for Macadamia Nuts, Foreign Agricultural Service, U.S. Department of
Agriculture, April 2002, found at http://www.fas.usda.gov/htp/circular/2002/02-04/Mac.htm,retrieved Mar. 30, 2004.
102 Macadamia Situation and Outlook in Selected Countries, Foreign Agricultural Service, U.S.Department of Agriculture, Apr. 2004, found at http://www.fas.usda.gov/htp/circular/2004/04-02-04.pdf, retrieved Mar. 30, 2004.
103 The Australian crop year runs from March 1 to February 28 the following year.104 Australia Tree Nuts Annual 2004, Global Agriculture Information Network Report AS4004,
Foreign Agricultural Service, U.S. Department of Agriculture, Feb. 23, 2004.

62
New South Wales and southeastern Queensland. Roughly 45 percent of the trees areconsidered mature at 15 years or older, 30 percent are considered in the earlybearing stage, and 25 percent are in the pre-bearing stage.105 Australian productionis expected tomaintain a steady increase driven bymore trees coming intoproduction.Total production is estimated to reach 110 million to 150 million pounds by 2010.106
Australia is currently the world’s largest producer of macadamia nuts, which arenative to the continent. In 2002-03, Australia exported 51.8 million pounds ofmacadamia nuts, or about 78 percent of its total production.107 Its primary exportmarkets are Japan, the United States, and the EU. Since its macadamia nut industry ishighly dependent on exports, Australia’s competitiveness in world export markets andproducer returns are greatly influenced by the value of the Australian dollar.108 Untilearly 2002, the strong U.S. dollar relative to the Australiandollar rendered Australianexports more competitive in the United States.109
Potential Impact on U.S. Trade Flows
U.S. ImportsThe impact of the free tradeagreement onU.S. imports ofmacadamianuts will dependon which tariff is considered. The current U.S. tariffs on raw shelled and in-shellmacadamia nuts110 (0.4 and 0.8 percent AVE, respectively) are low, and thereforetheir immediate removal is not likely to contribute to a significant rise in imports.However, the U.S.-Australia FTA will likely result in an increase in U.S. imports ofprepared or preserved macadamia nuts from Australia.111 The current 17.9 percentad valorem tariff on these nuts (which would be phased out in equal annual stages untilyear 4 of the agreement) has generally been prohibitive, preventing exports to theUnited States because roasting can be done in the United States as competitively as inAustralia.112 The removal of the duty allows Australian processors to expand
105 Australia Tree Nuts Annual 2004, Global Agriculture Information Network Report AS4004,Foreign Agricultural Service, U.S. Department of Agriculture, Feb. 23, 2004. There is generally a five tosix-year lag between the time a macadamia nut tree is planted and when it reaches nut-bearing age.
106 Hinton, Brad, The Australian Macadamia Industry, Industry Note 062-2002, RabobankInternational, June 2002, p. 2.
107 Australia Tree Nuts Annual 2004, Global Agriculture Information Network Report AS4004,Foreign Agricultural Service, U.S. Department of Agriculture, Feb. 23, 2004.
108 Australia Tree Nuts Annual 2004, Global Agriculture Information Network Report AS4004,Foreign Agricultural Service, U.S. Department of Agriculture, Feb. 23, 2004.
109 U.S. industry representatives indicated that while the exchange rate was not directly responsiblefor the drop in macadamia prices, it did allow Australian (and other foreign) producers to reduce theirprices in the United States without adversely impacting their local currency margins. Commission staffcommunication with U.S. industry representatives, Apr. 1, 2003.
110 In-shell and shelled macadamia nuts are classified in the eight-digit HTS subheadings0802.90.80 and 0802.90.98, respectively.
111 Prepared or preserved macadamia nuts are classified in the eight-digit HTS subheading2008.19.90.
112 The costs involved in growing macadamia nuts do not differ significantly between the twocountries.

63
prepared or preserved production, which currently takes place largely for thedomestic market, thereby taking advantage of economies of scale.113 The potential3-fold increase in the Australian crop in the next 5 years will likely result in a significantincrease in imports from Australia of both raw and prepared or preservedmacadamia nuts. As U.S. production does not currently meet U.S. demand, and U.S.purchasers have been willing to accept lower quality imported nuts at lower prices,114
Australian prepared or preserved imports are likely to gain significant additional U.S.market share (from the very small current base) as a result of the duty eliminationunder the FTA.
In 2003, U.S. imports of shelled and in-shell macadamia nuts from Australia reached1,659 mt, or 26 percent of total raw macadamia nut imports. Only 1 mt and 8 mt ofAustralian imports of prepared and preserved macadamia nuts were recorded in2002 and 2003, respectively, up from zero during 1997-2001.
There are currently 11 macadamia nut-processing facilities in Australia with a totalannual capacity of approximately 88 million pounds.115 This is believed to be sufficientcapacity to handle current production but expected future growth due to more treescoming into production is likely to require expansion.116 Processed kernel productionin Australia is currently limited only by the capacity to produce raw kernels.117
Reportedly, some Australian processors have already made plans to expand existingcapacity in anticipation of production growth.118
The Australian industry expects increasing global demand for macadamia nuts in thenext few years in Asia, Europe, and the United States based on rising incomes, qualityimprovements, and increased market research and promotion.119 Although industryefforts had been made throughout the 1990s to diversify export market opportunitiesaway from the larger markets such as the United States, Australianexporters will likelycontinue to view the U.S. market as an attractive one. Australian exporters may viewthe decreased production in Hawaii due to the lack of cost competitiveness asanopportunity to sell more product into the United States.120 The U.S. industry has
113 Andrew Heap, “Macadamia Nut Industry Brief,” Australian Macadamia Nut Society NewsBulletin, Mar. 2004, p. 22.
114 Although high quality kernels are produced in Australia, the overall quality of Australian nuts hasbeen described as inconsistent. Commission staff communication with U.S. industry representatives,Apr. 1, 2003 and Brad Hinton, the Australian Macadamia Nut Industry, Industry Note 062-2002,Rabobank International, June 2002,. p. 6.
115 Commission staff communication with Australian industry representatives, Mar. 14, 2003, andHinton, Brad, The Australian Macadamia Industry, Industry Note 062-2002, Rabobank International,June 2002, p. 6.
116 Brad Hinton, The Australian Macadamia Industry, Industry Note 062-2002, RabobankInternational, June 2002, p. 6.
117 Commission staff communication with Australian industry representatives, Mar. 14, 2003.118 Brad Hinton, The Australian Macadamia Industry, Industry Note 062-2002, Rabobank
International, June 2002, p. 6.119 Brad Hinton, The Australian Macadamia Industry, Industry Note 062-2002, Rabobank
International, June 2002, p. 2.120 Brad Hinton, The Australian Macadamia Industry, Industry Note 062-2002, Rabobank
International, June 2002, p. 2.

64
stated that increased U.S. imports of Australian prepared or preserved macadamianuts will lower the average macadamia kernel price in the United States, reducingfarm gate prices, and, in the long term, result in the economic failure of many growersand some of the smaller processors and manufacturers of value-added product inHawaii.121
U.S. ExportsCurrent Australian tariffs on raw and prepared or preserved macadamia nuts arezero and 5 percent ad valorem, respectively. Under the terms of the free tradeagreement, the 5 percent tariff will be reduced to zero immediately. The United Statesis not an important exporter of macadamia nuts; U.S. producers exported less than 20percent of their 2003 crop. Exports to Australia in 2003 were only 75 mt, or less than 3percent of total exports of raw macadamia nuts. U.S. exports of prepared orpreserved macadamia nuts totaled 1,467 mt in 2003, of which only 30 mt wereshipped to Australia. Given that the Australian tariff on prepared or preservedmacadamia nuts would be eliminated immediately, it is expected that U.S. exports ofthese nuts would increase, though not significantly.
Motor Vehicles122
Overview
U.S. IndustryThe United States is the world’s largest single-country producer and consumer ofmotor vehicles, which includes passenger vehiclesand medium-and heavy-duty trucksand buses, typically referred to as commercial vehicles. In 2003, passenger car andcommercial vehicle production reached 12.1 million units, and sales were slightlyunder 17 million vehicles.123 Passenger vehicles - passenger cars and lighttrucks-account for approximately 98 percent of the production, sales, and trade in theU.S. motor vehicle sector by units; medium- and heavy-duty trucks and buses accountfor the remainder. There are two U.S.-based passenger vehicle makers: General
121 Written statement by David G. Rietow, President, Hawaii Macadamia Nut Association, submittedto the Commission Mar. 30, 2004.
122 This sector includes items classified in the HTS under the following subheadings: 8701.20,8702.10, 8702.90, 8703.22, 8703.23, 9703.24, 8703.31, 8703.32, 8703.33, 8703.90, 8704.21,8704.22, 8704.23, 8704.31, 8704.32, and 8704.90.
123 Ward’s Automotive Reports, vol. 79, No. 4, Jan. 26, 2004.
65
Motors (GM) and Ford.124 A numberof foreign-based automakers have established asubstantial manufacturing presence in the United States;125 however, GM and Fordare the largest producers in the United States, accounting for 33 percent and 26percent, respectively, of total U.S. passenger vehicle production in 2003.126
The U.S. passenger vehicle industry has a presence in nearly every market in theworld. The U.S. industrymanufactures and sells its vehicles globally, and has extensivelinkages with foreign automakers and foreign parts suppliers. The United Statesconsistently runs a deficit in motor vehicle trade, as U.S. automakers tend to produce inforeign markets instead of relying on exports from the United States. Additionally, thehigh level of integration and rationalization of automotive production in the NAFTAregion, and the popularity of foreign models that are produced overseas or the U.S.production of which is supplemented by imports, contribute to the U.S. motor vehicletrade deficit. However, the United States runs a trade surplus with Australia in motorvehicles. In 2003, U.S. motor vehicle imports from Australia totaled $140.4 million,and U.S. motor vehicle exports to Australia totaled $387.2 million.127
Australian IndustryThe Australian motor vehicle industry is considerably smaller than its U.S. counterpart,ranking as the 23rd largest vehicle producer in the world in 2002.128 In 2002,production of passenger cars and commercial vehicles reached 340,466 units,129
and grew nearly 20 percent in 2003 to reach 408,184 vehicles.130 The Australianmarket for motor vehicles ranked 15th in the world in 2002.131 The Australian motorvehicle market has been growing; sales reached 824,309 units in 2002132 and hit arecord high of over 909,811 units in 2003.133 Imports currently account for over 50percent ofmotor vehicle sales inAustralia. Australia’s leading sourcesofmotor vehicleimports, in order of magnitude, include Japan, Germany, the United States, Thailand,and Republic of Korea. Australia’s motor vehicle imports from the United States totaled
124 In 1998, U.S. automaker Chrysler merged with Daimler-Benz of Germany to form a newGerman-based company called DaimlerChrysler.
125 In addition to the Chrysler and Mercedes-Benz subsidiaries of DaimlerChysler, foreignautomakers with a manufacturing presence in the United States include Honda, Mitsubishi, Nissan,Subaru-Isuzu, and Toyota (Japan); U.S.-Japanese joint ventures Autoalliance International(Ford-Mazda) and New United Motor Manufacturing, Inc. (NUMMI) (GM-Toyota); and BMW andMercedes-Benz (Germany).
126 Ward’s Automotive Reports, vol. 79, No. 2, Jan. 12, 2004.127 Based on official statistics of the U.S. Department of Commerce.128 Automotive News, 2003 Market Data Book, May 26, 2003, p. 44.129 Ward’s World Motor Vehicle Data 2003 (Southfield, MI: Ward’s Communications, 2003),
p. 199.130 Ward’s Auto Info Bank, email communication to USITC staff, Apr. 20, 2004.131 Automotive News, 2003 Market Data Book, May 26, 2003, p. 47.132 Ward’s World Motor Vehicle Data 2003 (Southfield, MI: Ward’s Communications, 2003),
pp. 199 and 201.133 Just-auto.com editorial team, “Australia: Housing boom fuels record vehicle sales in 2003,”
Jan. 8, 2004, found at http://just-auto.com, retrieved Jan. 8, 2004.

66
A$936.0 million in 2003, accounting for 6 percent of Australia’s vehicle imports thatyear.134 The Australian market for motor vehicles is a mature one; in 2002 there were2.0 persons per car in Australia, compared to 2.2 persons per car in the UnitedStates.135 Therefore, future market expansion would be relatively modest.
There are four motor vehicle producers in Australia: Ford, GM/Holden, Mitsubishi,and Toyota. GM/Holden is the largest producer in Australia, accounting for 36percent of total motor vehicle production in 2002. Ford is the second-leadingproducer, accounting for 25 percent, followed by Toyota and Mitsubishi,respectively.136 Mitsubishi is reportedly considering closing its Australian assemblyplant.137 Australian motor vehicle production is concentrated in large passengervehicles and low-volume, high value-added variants of these platforms in the highperformance, luxury, and light truck segments.138 In fact, Australia has distinguisheditself as a low-volume assembly producer for the domestic market and become adeptat production of niche vehicles for export.139
Over the last decade, the Australian motor vehicle sector has become increasinglycompetitive, productive, and export-oriented. Exports account for more thanone-thirdof the country’s motor vehicle production.140 Australia’s leading markets forpassenger vehicle exports, in order of magnitude, include Saudi Arabia, NewZealand, Kuwait, and the United States. Exports to the United States totaled $138.2(US) million in 2003, accounting for 9 percent of Australia’s vehicle exports thatyear.141
Since the early 1900s, the Australian automotive industry has traditionally benefitedfrom significant government protection, including high tariffs and othermeasures suchas import licensing, local content requirements,andmarket-sharingarrangements.142
This protection began to be dismantled in 1984; as a result, the industry has becomemore competitive. Currently, Australian automakers benefit from the AutomotiveCompetitiveness and Investment Scheme (ACIS). ACIS, which replaced the Export
134 Department of Foreign Affairs and Trade official, email communication to USITC staff,Apr. 7, 2004.
135 Ward’s World Motor Vehicle Data 2003 (Southfield, MI: Ward’s Communications, 2003),pp. 192 and 198.
136 Ward’s World Motor Vehicle Data 2003 (Southfield, MI: Ward’s Communications, 2003),p. 200.
137 Just-auto.com editorial team, “Axe again looms over Mitsubishi car plant,” Mar. 31, 2004, foundat http://just-auto.com, retrieved Mar. 31, 2004.
138 U.S. Department of State telegram, “U.S.-Australia FTA: Motor Vehicles and Components,”message reference No. 000372, prepared by U.S. Embassy, Canberra, Feb. 2003.
139 Just-auto.com editorial team, “Australia’s auto industry - smarter working for global markets,”Mar. 10, 2003, found at http://just-auto.com, retrieved Mar. 12, 2004.
140 Federation of Automotive Products Manufacturers, “Value of Automotive Exports” found athttp://www.fapm.com.au, retrieved Mar. 31, 2004.
141 Department of Foreign Affairs and Trade official, email communication to USITC staff,Apr. 7, 2004.
142 U.S. Department of State telegram, “U.S.-Australia FTA: Motor Vehicles and Components.”

67
FacilitationScheme, was established in2001 and is scheduled to continue as is through2005; beginning in 2006 the program will be gradually reduced until it is completelyeliminated in2015. ACIS is designed to encourage automotive firms tomake long-terminvestments in Australia based on their production, research and development (R&D),and investment activity by providing them with tradeable import duty credits based ontheir expenditures in these three areas. ACIS is WTO-compliant, and is not affected bythe U.S.-Australia FTA.143
With respect to the U.S.-Australia FTA, the motor vehicle industry is unique in that theU.S. industry and the Australian industry are dominated by the same two companies,GM and Ford. These companies will benefit from improved access to the U.S. marketfor their Australian operations as well as improved access to the Australian market fortheir U.S. operations. Overall, the U.S.-Australia FTA will likely provide the impetus forincreased integration of the passenger vehicle industries in both countries, therebyincreasing two-way trade in passenger vehicles. According to one industry official, theFTA will allow the U.S. and Australian operations of U.S. automakers to takeadvantage of each other’s individual strengths by filling product gaps in eachmarket.144 Further, as the leading producers in both countries, GM and Ford may bemotivated by the FTA to further integrate their Australian subsidiaries into their globalsourcing strategies,makingmoreefficient useof theirAustralianoperations inmeetingglobal market demands.
Potential Impact on Trade Flows145
U.S. ImportsThe U.S.-Australia FTA will likely result in a measurable, although small, increase inU.S. imports of motor vehicles from Australia. In 2003, Australia was the 16th-leadingsource of U.S. motor vehicle imports,146 with such imports totaling $140.5 million andaccounting for 0.1 percent of total motor vehicle imports. Nearly all the motor vehicleimports from Australia were large passenger cars with cylinder capacity over 3,000cc; in that product category, Australia ranked as the 11th-leading supplier, accountingfor 0.2 percent of total U.S. imports in this category in 2003.147
The U.S. NTR tariff on passenger motor vehicles, including minivans and sport-utilityvehicles (SUVs), is 2.5 percent; the NTR tariff on trucks, including pickup trucks, is
143 U.S.-Australia Free Trade Agreement, Exchange of Letters on Waiver of Customs Duties, foundat http://www.ustr.gov/new/fta/Australia/text/text02-letter-customsduties.pdf, retrieved Apr. 12,2004.
144 U.S. industry official, email communication to USITC staff, Apr. 7, 2004.145 The scope of the combined motor vehicle and motor-vehicle parts sector is broadly consistent with
that of the GTAP model. Motor vehicles and motor-vehicle parts exhibit similar expected effects whichclosely track the model results.
146 Based on official statistics of the U.S. Department of Commerce.147 Based on official statistics of the U.S. Department of Commerce.

68
25 percent; the NTR tariff on road tractors for semi-trailers is 4 percent; and the NTRrate on buses is 2 percent. All U.S. duties on motor vehicle imports from Australia willbe eliminated upon entry into force of the FTA. In 2003, Mitsubishi accounted fortwo-thirds of the motor vehicle imports from Australia, with GM accounting for most ofthe remainder (imports from Ford accounted for less than 1 percent). Mitsubishisources the Diamante exclusively from Australia. Total U.S. imports of the Diamante in2003 were 9,174 vehicles, down from 14,352 in 2002.148 In December 2003, GMbegan importing the Pontiac GTO from Australia; GM hopes to import 18,000 of thesevehicles per year.149 U.S. imports of trucks that are subject to the 25 percent NTR dutyare de minimis.
Removal of the 2.5 percent U.S. duty on passenger cars alone is not likely to have asignificant effect onU.S. imports, as the duty is so small. Indeed, should the automakersin Australia reevaluate their global sourcing strategies as an overall result of the FTA,they may decide to source more or new passenger vehicles from Australia, but the 2.5percent duty savings alone is not likely to be the driving force behind such a decision.One industry official confirms that the greatest potential for trade effects in the motorvehicle sector is on U.S. exports, not U.S. imports.150
Removal of the 25 percent U.S. duty on trucks may provide some incentive forAustralian automakers to alter their global sourcing strategies to produce and exportlight trucks to the United States. However, such decisions would be weighed against theautomakers’ global production strategies as well as their relations and contractualobligations with the United Auto Workers.151 Moreover, an industry official stated thathe does not expect an influx of pickup trucks resulting from removal of the 25 percentduty, because there currently are not any pickup truck products produced in Australiathat are geared toward the U.S. market, and the U.S. domestic industry has acompetitive advantage in pickup truck production.152 Indeed, another industry officialconfirmed that Australia does not currently produce conventional pickups as definedby the U.S. market, but does produce car-derived pickups that are largely targeted forthe Australian market; there may be some potential for these vehicles to serve a nichemarket in the United States.153 Further, Australian industry sources assert that removalof the 25 percent U.S. duty may induce new light truck production in Australia,“particularly if parent companies decided that such ’niche’ vehicles represented aprofitable way of broadening product offerings in this important market segment.”154
148 Automotive News, Jan. 12, 2004, p. 50. This decline was reportedly due to the appreciation ofthe Australian dollar versus the U.S. dollar. “Mitsubishi Australia Plant Up for Review?” Ward’sAutomotive Reports, Mar. 22, 2004, p. 5.
149 Just-auto.com editorial team, “Australia: Free trade agreement with US seen strengtheningalready ‘significant’ automotive business,” Feb. 9, 2004, found at http://just-auto.com, retrieved Feb. 9,2004.
150 USITC, hearing transcript, pp. 99-100.151 “GM, Holden Discuss More Product Sharing,” Ward’s Automotive Reports, Mar. 17, 2003, p. 3.152 USITC, hearing transcript, p. 113. There were 2.7 million pickup trucks produced in the United
States in 2003. Ward’s AutoInfoBank, email communication to USITC staff, Apr. 7, 2004.153 U.S. industry official, email communication to USITC staff, Apr. 13, 2004.154 Federation of Automotive Products Manufacturers, “Submission to the Department of Foreign
Affairs and Trade on Negotiations for a Free Trade Agreement between Australia and the United Statesof America – Issues and Implications for Australia’s Automotive Components Industry,” Jan. 2003, p. 24,found at http://www.fapm.com.au, retrieved Mar. 26, 2004.

69
U.S. ExportsThe U.S.-Australia FTA will likely result in a measurable increase in U.S. exports ofmotor vehicles toAustralia. In2003, Australia was the seventh-leading market forU.S.motor vehicle exports. Motor vehicle exports to Australia totaled $387.2 million in2003, accounting for 1.3 percent of total sector exports.155 As with imports, theleading product category in terms of U.S. exports to Australia is large passenger carswith cylinder capacity over 3,000 cc; 35 percent of the value of U.S. motor vehicleexports to Australia were in this product category in 2003. Other important exportcategories are passenger cars with cylinder capacity between 1,501 cc and 3,000cc(22 percent of value of total exports in 2003), and road tractors for semi-trailers (22percent in 2003).156
Australian imports of new and used passenger motor vehicles, campers, and mobilehomes are subject to an NTR 15 percent customs duty, legislatively scheduled to bereduced to 10 percent in 2005 and to 5 percent in 2010. New and used commercialand all-wheel drive vehicles are subject to an NTR 5 percent customs duty.157 Usedvehicles are assessed the applicable tariff plus a $A12,000 levy on vehicles notclassified as “specialty or enthusiast” vehicles.158 Under the FTA, Australia wouldeliminate the 5 percent NTR duties upon entry into force of the Agreement, and reducethe 15 percent NTR duties in equal stages beginning on the date of entry into force ofthe Agreement, with such duties to be eliminated as of 2010.
Immediate removal of the 5 percent Australian duty on commercial and all-wheeldrive vehicles and the staged phase-out of the 15 percent duty on passenger vehiclesmay spur U.S. automakers to consider the export of other U.S.-built products that maybe marketable in Australia.159As previously noted, the FTA is expected to allow theU.S. and Australian operations of U.S. automakers to take advantage of each other’sindividual strengths by filling product gaps in each market.160 A U.S. industry officialasserts that Australia is already an important export market for U.S. automakers, andthat it will become an even bigger market because of the tariff preferences negotiatedin the FTA. Moreover, Australian demand for SUVs and pickup trucks – a productsegment in which U.S. manufacturers are strong – is growing, so U.S. automakers arewell-positioned to benefit from enhanced access to the Australian market.161
Australia applies two taxes on motor vehicle purchases: (1) a 10-percent federal goodsand services tax (GST), which is levied on the assessed value of the vehicle; and (2) a
155 Based on official statistics of the U.S. Department of Commerce.156 Based on official statistics of the U.S. Department of Commerce.157 U.S. Department of Commerce, International Trade Administration, Office of Automotive
Affairs, Compilation of Foreign Motor Vehicle Import Requirements, Dec. 2003, found athttp://www.ita.doc.gov/td/auto/tbr2003rev1.pdf, retrieved Mar. 31, 2004.
158 U.S. Department of State telegram, “U.S.-Australia FTA: Motor Vehicles and Components.”Australia has retained the right to continue assessing this levy on used vehicle imports from the UnitedStates. “Guide to the Agreement,” found at http://www.dfat.gov.au/trade/negotiations/us_fta/guide/2.html, retrieved Apr. 7, 2004.
159 USITC, hearing transcript, p. 50.160 U.S. industry official, email communication to USITC staff, Apr. 7, 2004.161 U.S. industry official, email communication to USITC staff, Apr. 7, 2004.
70
luxury car tax, which is levied on passenger vehicles designed to carry a load of lessthan two mt and fewer than nine passengers.162 Australian-built vehicles are alsoassessed the GST and luxury tax, but there are no import duties included in the taxableamount.163 Elimination of the luxury tax on U.S.-built vehicles was not part of the FTA,and an industry official states that exemption from the tax was not an objective for theU.S. industry.164
With respect to government procurement, the Australian Government’s ExecutiveVehicle Scheme stipulates that government agencies must purchase Australian-madevehicles whenever possible.165 Most state and local governments follow a similarpolicy.166 Australia excluded motor vehicles from coverage in the GovernmentProcurement chapter of the FTA.167 However, because GM and Ford manufacturevehicles in Australia, inclusion of motor vehicles in the government procurementchapter of the FTA was not an important negotiating objective.168 Governmentpurchases in Australia account for a much larger percentage of total sales than in theUnited States.
Finally, while not specifically a nontariff barrier, Australia’s standards andcertification system for motor vehicle safety and emissions is different from that of theUnited States, which adds significant cost to automakers that want to export to thatmarket. Mutual recognition of motor vehicle standards was not part of the FTA; at best,the United States and Australia left open the possibility that they each would facilitate“the consideration of a request by a Party for the recognition of the results ofconformity assessment procedures, including a request for the negotiation of an
162 The luxury tax is a 25 percent tax on the Australian Customs Service-determined customs value ofthe vehicle, plus international shipping and insurance charges, applicable customs duties, and GST. The25 percent tax is due on 91 percent of any amount of that sum which is above the tax threshold, which wasA$57,009 in 2003.
163 U.S. Department of Commerce, International Trade Administration, Office of AutomotiveAffairs, Compilation of Foreign Motor Vehicle Import Requirements, Dec. 2003, found athttp://www.ita.doc.gov/td/auto/tbr2003rev1.pdf, retrieved Mar. 31, 2004.
164 USITC, hearing transcript, p. 100.165 “Under the Federal Government’s Executive Vehicle Scheme (EVS), vehicles can be provided to
members of the Senior Executive Service as part of a remuneration package. While the Guidelinesrequire that Australian-made vehicles be leased where these are available, they do provide scope tolease certain imported vehicles where the engine capacity of those vehicles is below that of the smallestAustralian-made vehicle. Under the Guidelines, imported vehicles are to have an engine capacity of2000cc or less and be selected from the range of vehicles sold by manufacturers with a local operation invehicle assembly or component production. . . . The EVS does provide favoured treatment forAustralian-produced vehicles.” Federation of Automotive Products Manufacturers, “Submission to theDepartment of Foreign Affairs and Trade on Negotiations for a Free Trade Agreement between Australiaand the United States of America: Issues and Implications for Australia’s Automotive ComponentsIndustry,” Jan. 2003, found at http://www.fapm.com.au/docs/fapmusftasubmission.pdf, retrievedApr. 7, 2004.
166 U.S. Department of State telegram, “U.S.-Australia FTA: Motor Vehicles and Components.”167 USTR, email communication to USITC staff, Apr. 7, 2004; and U.S.-Australia Free Trade
Agreement, Combined Government Procurement Annexes, found at http://www.ustr.gov/new/fta/Australia/text/text15-annexes.pdf, retrieved Apr. 7, 2004.
168 U.S. industry official, email communication to USITC staff, Apr. 7, 2004.

71
agreement, in a sector nominated by that Party.”169 This was an acceptable outcomefor U.S. industry.170
The recently concluded FTA between Thailand and Australia may temper potentialmarket gains based on preferential tariff treatment. Thailand is a leading motorvehicle producer in Asia and is likely to build upon its existing market presence inAustralia, particularly in light of the fact that Thailand secured immediate removal ofAustralian tariffs on all motor vehicles, which gives Thai vehicles more preferentialtariff treatment than U.S. vehicles.171 Australia is Thailand’s largest export market formotor vehicles, accounting for approximately 50 percent of Thailand’s vehicleexports.172 According to a U.S. industry official, however, Thailand supplies Australiaprimarily with small pickups, while the United States exports large sport-utility vehiclesand minivans – products that are not directly competitive, and products that will bothreceive immediate Australian duty elimination in their respective FTAs.173
Certain Motor-Vehicle Parts174
Overview
U.S. IndustryThe United States is the world’s largest single-country producer of motor-vehicle parts,accounting for an estimated one-quarter ($191 billion175) of the world’s production in
169 U.S.-Australia Free Trade Agreement, Chapter 8, Article 8:9, 1(f). Further, Article 8.8, 1, statesthat “The Parties shall work co-operatively in the fields of standards, technical regulations, andconformity assessment procedures with a view to facilitating access to each other’s markets. In particular,the Parties shall seek to identify bilateral initiatives that are appropriate for particular issues or sectors.Such initiatives may include cooperation on regulatory issues, such as convergence or equivalence oftechnical regulations and standards, alignment with international standards, reliance on a supplierdeclaration of conformity, and use of accreditation to qualify conformity assessment bodies, as well asco-operation through recognition of conformity assessment procedures.”
170 U.S. industry official, email communication to USITC staff, Apr. 7, 2004.171 “Australia will eliminate upon entry into force of the Agreement the current tariffs on all
passenger vehicles, off-road vehicles, goods vehicles and other commercial vehicles of Thai origin. Thesetariffs are currently 15% for passenger motor vehicles (although the general rate is legislated to fall to 10%on 1 January 2005) and 5% for other vehicles.” Australia-Thailand FTA - Trade in Goods - AustralianTariff Commitments, found at http://www.dfat.gov.au/trade/negotiations/goods_tariff_commitments.html#2, retrieved Apr. 7, 2004.
172 Just-auto.com editorial team, “Thailand looks beyond AFTA for next phase of growth,” Dec. 22,2003, found at http://just-auto.com, retrieved Apr. 7, 2004.
173 U.S. industry official, email communication to USITC staff, Apr. 13, 2004.174 This sector includes items classified in HTS chapters 84 (motor-vehicle engines), 85 (electrical
equipment for motor vehicles), and 87 (motor-vehicle parts).175 Includes body manufacturing (NAIC 336211) and parts manufacturing (NAIC 3363) for motor
vehicles.

72
2001. A large supplier network has developed to support the U.S. original-equipmentmanufacturers’ (OEM)motor-vehicle industry, theworld’s largest, and theaftermarket(replacement parts).176 Approximately 5,000 U.S. producers177 manufacture acomplete range of motor-vehicle parts, employing 667,400 workers in 2002.178
Economic weakness and declining North American vehicle production have likelycontributed to deterioration of these indicators since that time.
In response to vehicle makers’ purchasing requirements, such as just-in-time delivery,global sourcing, and local content, motor-vehicle parts manufacturers have followedtheir vehicle customers throughout the world. Over 500 Japanese, European, andother foreign parts manufacturers have established operations in the United States tosupply U.S.-based motor-vehicle producers; many U.S.-based parts producers havepursued a similar strategy, setting up facilities abroad to supply the global operationsof their motor-vehicle customers. Unlike the aftermarket sector, OEM suppliers areunder increasing pressure by motor-vehicle assemblers (and other higher-tiersuppliers) to reducepriceandcosts179 while shoulderinggreatermanufacturing, R&D,and supply chain responsibilities.U.S. component producers havealso expanded theirproduct and technological scope through mergers and acquisitions to supplyhigher-valued modules and systems to vehicle makers.
Although the United States is the world’s leading exporter of motor-vehicle parts,180 itcurrently runs a trade deficit in these products. The further integration of the NorthAmerican automotive industry under NAFTA, the growing U.S.-based production byGerman and Japanese transplants of motor vehicles that incorporate importedcomponents, and increased purchases by U.S. automakers of motor-vehicle partsfrom China contribute to this trade deficit. Relatively low U.S. tariffs (2.5 percent advalorem or less) facilitate imports of these products.
Australian IndustryThe Australian parts industry is less than 5 percent of the size of the U.S. industry, with200 firms producing components with 30,000 employees.181 Australian industry salesof motor-vehicle components are believed to exceed an estimated A$5 billion (US$2.7billion).182 The industry is concentrated, with the top four parts producers accounting
176 Manufacturers for OEMs supply parts for use in the assembly of motor vehicles or for dealers’service operations, whereas aftermarket producers generally supply replacement parts to retail andnon-dealer service outlets.
177 U.S. Department of Commerce, International Trade Administration, “Automotive Parts,” U.S.Industry & Trade Outlook 2000, 2001, p. 37-1.
178 U.S. Department of Commerce, International Trade Administration, Office of AutomotiveAffairs, U.S. Automotive Parts Industry/Market Assessment, May 2003, pp. 1-2.
179 U.S. Department of Commerce, International Trade Administration, Office of AutomotiveAffairs, U.S. Automotive Parts Industry/Market Assessment, May 2003, p. 4.
180 U.S. Department of Commerce, International Trade Administration, Office of AutomotiveAffairs, U.S. Automotive Parts Industry/Market Assessment, May 2003, p. 7.
181 Submission to the Productivity Commission Review of Post 2005 Assistance Arrangements to theAustralian Automotive Industry, Federation of Automotive Products Manufacturers, May 2002, p. 11.
182 Submission to the Productivity Commission Review of Post 2005 Assistance Arrangements to theAustralian Automotive Industry, Federation of Automotive Products Manufacturers, May 2002, p. 15.

73
for 37 percent183 and the top 20 firms accounting for 75 percent of componentproduction. Up to 80 percent of industry output is destined for the domestic OE andreplacement markets.184 Reflecting the global nature of the motor-vehicle industry, anumber of leading world parts suppliers manufacture in Australia, including Delphiand Johnson Controls (United States), Denso (Japan), and Robert Bosch and Hella(Germany). 185 Approximately 50 percent of the Australian market for motor-vehicleparts is accounted for by imports, primarily from Japan and the United States.186
With only four motor-vehicle companies, all of which are subsidiaries of Japanese orU.S. motor-vehicle producers, assembling a limited range of models in Australia, theAustralian parts industry lacks the large customer base necessary to support costreductions realized from the scale economies gained from large production runs.Consequently, Australian parts producers emphasize their expertise in flexiblemanufacturing and smaller production runs, and increasingly seek to expand exportsales to leading automotive markets.187 Implementation of lean manufacturing andgreater efficiencies in the supply chain have also improved the competitiveness of theAustralian component industry.188
As previously discussed in the motor vehicle analysis, the Australian motor vehicle andparts industry is gradually increasing its exposure to the competitive pressures of theglobal motor-vehicle market. The Automotive Investment and Competitiveness Schemeoffers parts producers an investment credit for expenditures on plants and equipmentas well as R&D that can be used to offset import duties only.189 Another feature of theAustralian market is the comparatively high tariff structure for motor-vehicle parts. A15 percent tariff is currently applied to imports of motor-vehicle components, includingthose from the United States; the tariff is scheduled to drop to 10 percent in 2005 andthen to 5 percent in 2010 under the Australian Government’s automotive assistancepackage.190
183 Submission to the Productivity Commission Review of Post 2005 Assistance Arrangements to theAustralian Automotive Industry, Federation of Automotive Products Manufacturers, May 2002, p. 11.
184 U.S. Department of State telegram, “U.S.-Australia FTA: Motor Vehicles and Components,”message reference No. 000372, prepared by U.S. Embassy, Canberra, Feb. 2003.
185 Submission to the Productivity Commission Review of Post 2005 Assistance Arrangements to theAustralian Automotive Industry, Federation of Automotive Products Manufacturers, May 2002, p. 20.
186 Submission to the Productivity Commission Review of Post 2005 Assistance Arrangements to theAustralian Automotive Industry, Federation of Automotive Products Manufacturers, May 2002, p. 11.
187 Submission to the Productivity Commission Review of Post 2005 Assistance Arrangements to theAustralian Automotive Industry, Federation of Automotive Products Manufacturers, May 2002, p. 26.
188 Submission to the Productivity Commission Review of Post 2005 Assistance Arrangements to theAustralian Automotive Industry, Federation of Automotive Products Manufacturers, May 2002, p. 26.
189 Motor-vehicle component producers can claim an import duty credit equal to 25 percent ofquarterly value of new investment in plant and equipment, and 45 percent of the quarterly value of R&Dexpenses. For more information on ACIS and its implementation, see Submission to the ProductivityCommission Review of Post 2005 Assistance Arrangements to the Australian Automotive Industry,Federation of Automotive Products Manufacturers, May 2002, p. 41.
190 Submission to the Productivity Commission Review of Post 2005 Assistance Arrangements to theAustralian Automotive Industry, Federation of Automotive Products Manufacturers, May 2002, p. 36,and U.S. Department of State telegram, “U.S.-Australia FTA: Motor Vehicles and Components,” messagereference No. 000372, prepared by U.S. Embassy, Canberra, Feb. 2003.

74
Australia is a partner in the 1983 Closer Economic Relations Agreement with NewZealand, which resulted in the free trade of goods on July 1, 1990. Australia alsoimplemented an FTA with Singapore in July 2003, and entered into an FTA withThailand in 2003. In the FTA with Thailand, a major motor-vehicle and partsproduction center in Southeast Asia, both countries agreed to eliminate or significantlyreduce tariffs on motor-vehicle parts.191
Potential Impact on U.S. Trade Flows 192
U.S. Imports
The U.S.-Australia FTA will likely result in a small increase in U.S. imports of certainmotor-vehicle parts from Australia and a negligible increase in total U.S. imports. TheAustralian industry is modest in size and U.S. tariffs are already low (2.5 percent advalorem or less). However, improved access to the large U.S. market resulting fromimmediate tariff elimination will provide opportunities for Australian componentsproducers, particularly vis-à-vis other import sources lacking FTA benefits.193
Although the United States is Australia’s leading export market for motor-vehicleparts, the share of total imports accounted for byAustralia is small (about $210million,or less than 1 percent).
The U.S. industry believes that both the U.S. and Australian industries will benefit fromenhanced export opportunities with the FTA,194 and that the FTA may allow greaterintegration of the two industries, encouraging growth and efficiency, in part becauseof their historic linkages.195 The Federation of Automotive Products Manufacturers(FAPM), which represents the Australian industry, recognizes that growth of
191 With the Thailand FTA, Australian tariffs on 98 of 146 import items covering automotive parts willdecline from 10 or 15 percent to 5 percent on entry into force of the Agreement (expected in 2005), andwill be eliminated in 2010. Australian tariffs on the remaining 48 items will be eliminated upon entry intoforce. All current tariffs of 5 percent or below will be eliminated upon entry into force. Thailand’s tariffs onimports of automotive parts components from Australia, which are currently assessed duties of up to 42percent, would be immediately reduced to no more than 20 percent, and phased to zero by 2010. Thaitariffs on engines would be immediately reduced from 30 percent to 15 percent. Other tariffs onautomotive parts that are currently 20 percent or below would also be immediately reduced and phaseddown accordingly. Information on free-trade agreements from the Australian Department of ForeignAffairs and Trade, found at http://www.dfat.gov.au/trade/index.html.
192 The scope of the combined motor vehicle and motor-vehicle parts sectors is broadly consistentwith that of the GTAP model. The motor vehicle and motor-vehicle parts sector exhibit similar trade impacttrends, which closely track the GTAP model results.
193 US official, email communication to USITC staff, Apr. 7, 2004, Washington, D.C., and“Australia-United States Free Trade Agreement – Automotive,” Department of Foreign Affairs and Trade,found at http://www.dfat.gov.au, retrieved Apr. 8, 2004.
194 Report of the Industry Sector Advisory Committee on Transportation, Construction, Mining &Agricultural Equipment for Trade Policy Matters (ISAC 16) on the U.S.-Australia Free Trade Agreement(FTA), Mar. 2004, p. 3.
195 USITC hearing statement of the Automotive Trade Policy Council, Inc., Mar. 30, 2004, p. 2.

75
Australian exports to the U.S. market is a challenge given the relatively small priceinducement resulting from the elimination of U.S. tariffs on these products.196
U.S. ExportsThe U.S.-Australia FTA will likely result in a measurable increase in U.S. exports ofmotor-vehicle parts to Australia and a small increase in total exports. The immediateelimination of the 15 percent Australian tariff on U.S. imports and the larger size of theU.S. industry will likely contribute to a boost in U.S. exports.197 Additionally, theeconomic stimulus expected from the FTA would likely lead to an improved Australianmarket for motor-vehicle parts. Vehicle and parts producers may also reevaluatecomponent-purchasing patterns to determine optimal sourcing, which could raise U.S.export volume.198 This growth potential, however, maybe limitedby themodest sizeofthe Australian market. Although the United States is Australia’s second-largest importsource of these components, U.S. exports to Australia represent less than 2 percent(about $758 million) of total U.S. exports of motor-vehicle parts (approximately $40billion).
The motor-vehicle parts industry supports the FTA agreement with Australia, and citesfavorably its market access provisions and customs treatment for remanufacturedmotor-vehicle parts and the use of simplified rules of origin for motor-vehicle productsbased on the NAFTA “net cost” calculation.199 The FAPM acknowledges that U.S.exports to Australia will likely benefit from the greater price advantage resulting fromthe elimination of Australian tariffs on motor-vehicle parts, with some net inroads intothe Australian market expected.200 Any increase in U.S. exports to Australia wouldeither displace local parts production or imports from other sources, principallySoutheast Asia and Europe.201
196 Submission to the Australian Department of Foreign Affairs and Trade on Negotiations for aFree Trade Agreement between Australia and the United States of America: Issues and Implications forAustralia’s Automotive Components Industry, Federation of Automotive Products Manufacturers, Jan.2003, pp. 24-25.
197 One industry source testified that “opportunities for increasing of parts exports to Australia. . . .probably in the short-term has the highest potential for a fairly significant increase.” USITC hearingtranscript, p. 79.
198 This scenario could occur within the broader trend of motor-vehicle and parts firmsconcentrating production and sourcing of components in only a few regions. USITC hearing transcript, p.79.
199 Report of the Industry Sector Advisory Committee on Transportation, Construction, Mining &Agricultural Equipment for Trade Policy Matters (ISAC 16) on the U.S.-Australia Free Trade Agreement(FTA), Mar. 2004, p. 3, and hearing transcript, p. 34.
200 Submission to the Australian Department of Foreign Affairs and Trade on Negotiations for aFree Trade Agreement between Australia and the United States of America: Issues and Implications forAustralia’s Automotive Components Industry, Federation of Automotive Products Manufacturers, Jan.2003, pp. 24-25.
201 Submission to the Australian Department of Foreign Affairs and Trade on Negotiations for aFree Trade Agreement between Australia and the United States of America: Issues and Implications forAustralia’s Automotive Components Industry, Federation of Automotive Products Manufacturers, Jan.2003, p. 25.

76
Textiles, Apparel, and Footwear
Overview
U.S. IndustryThe United States is the world’s largest importer of textiles, clothing, and footwear(TCF), accounting for an estimated 25 percent of world imports by value in 2002.202
The framework for U.S. trade in textiles and apparel will be liberalized on January 1,2005, when the United States, along with other importing countries, eliminates allremaining import quotas on textiles and apparel from WTO countries, as required bythe Uruguay Round Agreement on Textiles and Clothing. As such, competition willintensify in the U.S. market, particularly for apparel, which represented 68 percent ofU.S. sector imports by value in 2003. The large number of suppliers in the market,rising import penetration, changing consumer tastes, and the growing buying powerof large retailers have contributed to the downward pressure on prices that hasreverberated throughout the textile and apparel supply chain. Retailers areincreasingly sourcing apparel directly from low-cost foreign producers, as are manyU.S. apparel companies that have reduced or eliminated domestic manufacturingaltogether so as to focus on product design and marketing. As a result, the U.S. textileindustry faces shrinking domestic markets for its yarn and fabric output. Faced withdifficult market conditions and the prospect of increased import competition followingquota elimination in 2005, the textile industry, along with the apparel industry, hasundergone extensive restructuring and consolidation. Between 1999 and 2003, theU . S . t e x t i l e , a ppare l , and f oot we ar s e c t or pos t e d d e c l i ne s of 15 pe rc e nt i n s h i pm e nt s t o$129.6 billion, and 32 percent in empl oyment to 797,600 worke rs, represent ing a lossof 374,300 jobs in the period.203 In addition, during 1999-2003, the sectorexperienced 274 plant closures.204
Australian IndustryAustralia’s TCF manufacturing sector is much smaller than its U.S. counterpart. In2002, the Australian TCF sector reportedly had a total output of $5.1 billion andemployed about 70,000 people.205 By contrast, Australian imports of sector goods in
202 The latest year for which United Nations data are available on world textile and apparel trade is2002.
203 The data are for textile mills (NAICS 313), textile product mills (314), apparel manufacturing(315), and footwear manufacturing (3162). The data are based on official statistics of the U.S. CensusBureau (shipments) and U.S. Bureau of Labor Statistics (employment).
204 National Council of Textile Organizations, “Textile Plant Closings -as of January 13, 2004,”found at http://www.ncto.org/ustextiles/closings.asp, retrieved Apr. 14, 2004.
205 Jason Koutsoukis, “Grim Future For Textile Industry,” The Australian Financial Review, Apr. 16,2003, found at http://newsstore,f2.com/au, retrieved Apr. 9, 2004. (The output figure of $5.1 billion ($9billion) was based on the foreign exchange rate for Dec. 1, 2002, of $A0.56 to the U.S. dollar.) Anothersource reported that Australia’s TCF sector in 2001 had shipments of US$4.75 billion and employed87,000 people. See U.S. & Foreign Commercial Service, “Industry Sector Analysis: Australia - Apparel &Textiles - Textile Fabrics,” 2002, found at http://www.buyusainfo.net, retrieved Mar. 22, 2004.

77
2002 totaled $3.9 billion.206 Nevertheless, Australian production of industrial fabricshas expanded in recent years, reflecting increased demand for filtration products toaddress environmental concerns, the proliferation of technical textiles in motor vehiclemanufacturing, and the increased use of disposable medical products by the medicalindustry.207 Australia is the world’s largest producer and exporter of wool;208 it ranksin the top 10 of the world’s producers of cotton and is the world’s third-largest exporterof cotton.209
Australia’s trade deficit in sector goods widened by 3 percent during 1999-2002 to$3.4 billion. Australian imports of sector goods rose by less than .05 percent to $3.9billion and Australian exports of sector goods fell by 12 percent to $487 million in2002. Exports represented 10 percent of total Australian output of sector goods in2002.210
Australia’s TCF sector faces competitive challenges similar to those faced by its U.S.counterpart, particularly rising competition from lower-cost exporting countries bothat home and in export markets. Australia does not impose quotas and even if tariffbarriers were maintained, Australia’s Productivity Commission has warned thatAustralia’s textile and apparel industry will not likely survive competition from Chinaand that “further migration of standardized, labor intensive production offshore isinevitable.”211 To remain competitive, Australian apparel producers have shiftedproduction of basic, high-volume garments to lower-cost countries, particularlyChina, and now focus on producing high-fashion, seasonal apparel in Australia.212
TheAustralianTCF sector employs largenumbers of immigrant clothinghomeworkers,who reportedly account for as much as 90 percent of the country’s apparel productionand who earn an average wage of about (US) $1.14 per hour, compared withAustralia’s minimum wage of (US) $6.47 per hour.213
U.S.-Australian trade in textiles and apparel is relatively small and not subject to anyquotas. Under an industry development program, however, Australia’s tariffs ontextiles, clothing, and footwear have been frozen at their current levels (25 percent forapparel, and 15 percent for footwear and linens) until 2005, when they are scheduledto drop again – apparel to 17.5 percent, 10 percent for fabrics and footwear, and 7.5
206 Based on United Nations trade statistics.207 U.S. & Foreign Commercial Service, “Industry Sector Analysis: Australia - Textile Fabrics,”
found at http://www.buyusainfo.net/info, retrieved Mar. 22, 2004.208 USDA Economic Research Service, Cotton and Wool Situation and Outlook Yearbook, Nov.
2003, Appendix table 37–Sheep Population, wool production, and exports, major foreign producingcountries, 1995/96-2002/03.
209 USDA Production, Supply, and Distribution database, FAS, USDA, found athttp://www.fas.usda.gov/psd/, retrieved Apr. 13, 2004.
210 All the data in this paragraph are based on United Nations trade statistics.211 Jason Koutsouki, “Grim Future For Textile Industry,” Australian Financial Review, Apr. 16, 2003,
found at http://newsstore.f2.com.au/apps/view, retrieved Apr. 9, 2004.212 U.S. Department of State telegram, “New Efforts to End the Exploitation of Clothing
Homeworkers in Australia,” message No. 437, prepared by U.S. Embassy, Canberra, Feb. 27, 2003.213 U.S. Department of State telegram, “New Efforts to End the Exploitation of Clothing
Homeworkers in Australia,” message No. 437, prepared by U.S. Embassy, Canberra, Feb. 27, 2003.

78
percent for linens.214 The U.S. trade deficit in textiles and apparel with Australia morethan doubled from $39 million in 1999 to almost $98 million in 2003, reflecting a 7percent increase in U.S. imports from Australia, to $208 million, and a 27 percentdecline in U.S. exports to Australia, to $110 million. Sector imports from Australia,which accounted for 3 percent of total U.S. imports from Australia in 2003, consistedprimarily of apparel, particularly knit cotton sweaters and blouses, followed by woolblouses and sweaters. Sector exports to Australia, which accounted for less than 1percent of total U.S. exports to Australia in 2003, consisted primarily of intermediatetextiles, led by nonwovens, synthetic filament yarn, and woven fabrics of syntheticfilament yarn.
Potential Impact on Trade Flows
U.S. ImportsThe results of the model used in this study (Chapter 3), which assumed an immediateelimination of all tariffs on U.S. sector imports, showed a 58 percent increase in U.S.sector imports from Australia. The increase will be spread out over time because mosttariffs on the leading textile and apparel imports from Australia will be phased outover 10 years, or by January 1, 2015, thereby reducing the incentive to boost importsfrom Australia significantly in the short term. In addition, Australia is a very smallsupplier of such goods and primarily competes in specialized, higher-end niches of theU.S. market for these goods. U.S. textile representatives alsopoint out that the shippingdistance between the U.S. and Australia in a time-sensitive industry and the relativelyhigh cost of production inAustralia will limit trade between the twocountries for textilesand apparel.215 U.S. apparel representatives, in turn, note that immediate tradeopportunities will be limited by what they consider to be a complex yarn-forward ruleof origin in the Agreement and complicated customs procedures.216 In addition,according to a recent study by the Center for International Economics (CIE) inAustralia,217 only about 8.8 percent of total current Australian textiles and clothingexports to the United States would satisfy the yarn-forward rule of origin. Australiaimports a significant share of the yarns it uses in textile and apparel production,especially polyester/cotton and polyester/viscose yarns,218 most of which wereimported from Asia.219 The study indicates that it is unclear how many Australianproducers would be willing or be able to switch their sources of production inputs to
214 U.S. Department of Commerce, Office of Textiles and Apparel, “Australia: Import Tariffs andTaxes,” Nov. 24, 2003, found at http://web.ita.doc.gov/tacgi/overseas.nsf, retrieved Mar. 3, 2004.
215 Industry Sector Advisor Committee on Textiles and Apparel (ISAC-15), “The U.S.-Australia FreeTrade Agreement (FTA),” Mar. 2004, p. 2.
216 Industry Sector Advisor Committee on Textiles and Apparel (ISAC-15), “The U.S.-Australia FreeTrade Agreement (FTA),” Mar. 2004, p. 5.
217 Centre for International Economics, Canberra & Sydney, Economic Analysis of AUSFTA- Impactof the Bilateral Free Trade Agreement with the United States, Apr. 2004, pp. 52-53.
218 U.S. & Foreign Commercial Service, “Industry Sector Analysis: Australia-Textile Fabrics,” foundat http://www.buyusainfo.net/info, retrieved Mar. 22, 2004.
219 Based on United Nations trade statistics. Note: U.N. data combines yarn and fabric imports.

79
U.S. suppliers to meet the yarn-forward rule because U.S. materials are reportedlyaround 30 percent more expensive than inputs from Asia and transportation costswould also be higher. It is also unknown the extent to which Australian production ofinputs (fiber, yarn, etc.) might increase in response to the policy changes. Based onlimited industry information, CIE assumes that the yarn -orward rule will greatly restrictthe growth of Australian textile and apparel exports to the United States since only asmall share of these exports can meet the yarn-forward rule and thereby takeadvantage of the preferential tariff treatment under the U.S.-Australia FTA. Asdiscussed in Chapter 3, taking the potential effects of the yarn-forward rules intoaccount substantially reduces the likely increase in U.S. imports of these producers.
U.S. ExportsThe results of the GTAP model, which assumed an immediate elimination ofAustralia’sduties, showed an 87 percent increase in U.S. exports to Australia. The actual increasewill be spread out over time, however, because although certain products such as silkfabrics, most wadding, cut corduroy, tuiles and other net fabrics, become duty freeimmediately, most of the rest of the sector goods are staged over a widely varyingperiod and do not become duty free until January 1, 2015.220 Consequently, there isless incentive for Australian importers to boost their purchases of U.S. goodssignificantly in the short term. The United States is also a small supplier of sectorproducts to Australia, accounting for only 4 percent of Australia’s total sector importsin 2003. It is likely that the greatest growth in U.S. exports to Australia will be in textilefabrics, particularly in specialized textiles for industrial use, a sector in which theUnited States is particularly competitive; the United States held a 10 percent share ofAustralia’s textile fabric market in 2001.221 Annual growth of Australia’s textile fabricmarket is “expected to average 4 percent into the foreseeable future.”222
220 U.S. textile manufacturers have stated that because Australia has limited manufacturinginfrastructure, the potential to increase exports to Australia as a result of the FTA is encouraging.However, they also pointed out that high freight costs and long shipping times could still hamper theircompetitiveness with Asian suppliers that have greater proximity to Australia. Peter Mayberry, Director,Government Affairs, Association of the Nonwoven Fabrics Industry (INDA), telephone conversation withCommission staff, Apr. 2, 2004.
221 U.S. manufacturers are currently major suppliers in the categories of industrial, furnishing, andcraft fabrics because of their technological innovations and edge over Asian and other suppliers whorepresent “modest competition” in this category. See U.S. & Foreign Commercial Service, “Industry SectorAnalysis: Australia-Textile Fabrics,” found at http://www.buyusainfo.net/info, retrieved Mar. 22, 2004.
222 U.S. & Foreign Commercial Service, “Industry Sector Analysis: Australia-Textile Fabrics,” foundat http://www.buyusainfo.net/info, retrieved Mar. 22, 2004.

80
Agricultural and Horticultural Machinery
Overview
U.S. IndustryThe United States is a dominant supplier in the global agricultural and horticultural(including lawn care) machinery industry. U.S. producers, such as Deere & Co., CNHGlobal N.V. (headquartered in the Netherlands, but with major U.S. brands Case IHand New Holland), and AGCO Corp., offer a wide range of agricultural machinery.Deere and CNH alsoproduce construction equipment, and Deere is alsoa producerofcommercial and consumer lawn care equipment. These firms have either globalproduction facilities or operate a network of brands, with production primarily basedin North America and Europe. The U.S. lawn care machinery industry is also a leadingglobal supplier. In 2003, U.S. agricultural and horticultural machinery shipmentstotaled an estimated $19.9 billion.223
Australian IndustryBy comparison, Australia has very limited production of agricultural and horticulturalmachinery, totaling $745 million in 2000.224 Australian production is limited tosprayers, tillage tools, seeding equipment, and other miscellaneous farm equipment.For 2000, the Australian agricultural equipment market was estimated at $3.4billion.225 There is limited U.S. investment in the Australian agricultural andhorticultural machinery industry.
Potential Impact on U.S. Trade Flows
U.S. ImportsMost U.S. imports of agricultural and horticultural machinery from Australia alreadyenter the United States free of duty. The few exceptions are agricultural andhorticultural sprayers–including irrigation equipment–subject to a 2.4 percent ad
223 Estimated based on shipments data for NAICS industries 333111 and 333112, from the U.S.Census Bureau, Current Industrial Reports: Farm Machinery and Lawn and Garden Equipment, 2002,MA333A(02)-1, Aug. 2003; portions of Current Industrial Reports: Construction Machinery, 2002,MA333D(02)-1(RV), Aug. 2003; and Annual Survey of Manufactures: Value of Product Shipments,2002, Jan. 2003.
224 U.S. Department of Commerce, US&FCS Market Research Reports: Farm Machinery, Mar.2000, found at http://www.stat-usa.gov, retrieved Aug. 6, 2004.
225 Ibid.

81
valorem tariff,226 and parts of nonagricultural tractors227 not separately providedfor that are subject to U.S. tariffs ranging from 1.4 percent to 4.0 percent ad valorem,with most subject to 2.5 percent. U.S. imports of agricultural and horticulturalmachinery from Australia totaled $22.2 million in 2003, or 0.5 percent of all U.S.imports of these articles. In that same year, estimated dutiable imports of theseproducts, exclusively sprayers, from Australia totaled $194,000, with calculatedduties collected of approximately $4,700. It is unlikely that there have been anyimports of parts of nonagricultural tractors from Australia. The U.S.-Australia FTA isnot expected to result in any measurable increase in imports of agricultural orhorticultural machinery.
U.S. ExportsAs a result of the FTA, there is likely to be a moderate effect on certain U.S. exports toAustralia of agricultural and horticultural machinery that are currently subject toduties. U.S. producers will benefit directly from Australian tariff reductions228 andaccess to the Australian government procurement market, as well as indirectly fromthe inclusion of remanufactured articles in the FTA. In 2003, U.S. shipments ofagricultural and horticultural machinery to Australia, the fourth-leading U.S. exportmarket,229 totaled an estimated $405.5 million, or 8 percent of U.S. exports to alldestinations. However, only 37 percent of U.S. exports to Australia were subject totariffs,230 as major high-priced products, such as combine harvesters and most typesof tractors, alreadyenterAustralia free of duty. For2003, calculated Australiandutieson U.S. exports totaled an estimated $7.5 million.231 U.S. competitors in the productssubject to duties are most likely EU and Australian producers of agricultural andhorticultural machinery.
Other provisions of the FTA that are likely to benefit U.S. exports are increased accessto the Australian government procurement market for utility tractors and equipment,and the treatment of remanufactured parts and components as new equipment.Increased access to the Australian government procurement market for U.S.agricultural and horticultural machinery as a result of the FTA is likely to be smallbecause most types of agricultural and horticultural machinery purchased bygovernments, such as utility tractors, possibly sprayers, are not produced in Australia.
226 HTS subheading 8424.81.90.227 These include chassis fitted with engines, bodies for vehicles, and other parts of nonagricultural
tractors classified in HTS headings 8706 through 8708.228 Industry Sector Advisory Committee 16, The U.S.-Australia Free Trade Agreement (FTA): Report
of the Industry Sector Advisory Committee on Transportation, Construction, Mining & AgriculturalEquipment for Trade Policy Matters (ISAC 16), Mar. 2004, found athttp://www.ustr.gov/new/fta/Australia/advisor/isac16.pdf, retrieved Apr. 16, 2004.
229 In 2003, leading markets ranked by value were Canada, the EU, Mexico, and Australia.230 In this sector, Australia’s tariffs are limited to agricultural dryers, sprayers and irrigation
equipment, lawnmowers, certain harvesting and threshing machinery, milking machinery and dairyequipment, most barnyard equipment, one type of low-power tractor, certain parts for tractors, and farmwagons and carts.
231 Based on U.S. export data from official statistics of the U.S. Department of Commerce andAustralian tariff rates under the FTA.

82
Further, Australian government procurement preferences for small- andmedium-sized enterprises are maintained under the FTA,232 thus Australiangovernment procurement of articles from these firms would likely not change.
Remanufactured parts and components are produced from used parts andcomponents, where key core materials, such as a cast housing, are salvaged. The partor component is disassembled, cleaned, inspected, and new materials added asneeded, so that the part or component functions as new, although it is sold at a greatlyreduced price. Typical parts that may be remanufactured include engines andtransmissions. Data on U.S. production and trade in remanufactured parts are notavailable. The importance of providing full access for remanufactured parts andcomponents for the U.S. industry is that although their use is increasing, manydeveloping countries prefer not to become prime markets for old machinery andequipment, and generally have limitations on the importation of used machinery andparts. Although there are no issues regarding remanufactured articles in trade withAustralia, the inclusion of provisions for remanufactured parts in the U.S.-AustraliaFTA, carries the potential that such provisions regarding remanufactured parts wouldbe incorporated in future FTAs with developing countries.233
Household Appliances234
Overview
U.S. IndustryThe United States is the world’s foremost producer of electric household appliances.The U.S. household appliance market is relatively mature, characterized by modestsales growth and intense price competition. The industry is highly concentrated, withfour companies accounting for 96 percent of total production. General Electric
232 Australian Department of Foreign Affairs and Trade, Australia-United States Free TradeAgreement: Guide to the Agreement, “Government Procurement,” found at http://www.dfat.gov.au/trade/negotiations/us_fta/guide/15.html, retrieved Apr. 29, 2004.
233 William Lane, American-Australian Free Trade Agreement Coalition, Commissin hearingtranscript, Mar. 30, 2004, p. 106. See also Association for Equipment Manufacturers, in chap. 9, Positionof Interested Parties.
234 Includes HTS headings and subheadings 8418-8419; 8421-8422; 8450-8451; 8476; 8479;8509-8510; 8514.20.40-8514.90.40; and 8516. The household appliance industry comprises awide-variety of major electric appliances and small portable (countertop) appliances. These householdappliances are of the type used in homes and do not include electric appliances made exclusively forcommercial or industrial application (e.g., commercial and industrial food mixers, and commerciallaundry equipment). The important types, or subcategories, of small appliances are vacuum cleaners,and floor polishers, electromechanical and electrothermic kitchen and household appliances, andelectric heating equipment. Major appliances consist principally of refrigerators, dishwashers, washingmachines, clothes dryers, and electric cooking stoves and ranges.

83
Appliance Group (GE), Whirlpool Corp., Electrolux (maker of Frigidaire andWestinghouse brands), and Maytag Corp (Maytag and Amana brands) produce afull line of household appliances—cooking, refrigeration, and laundry. There arenumerous other medium-sized and small companies specializing in more narrowproduct lines.
The household appliance market has changed only slightly over recent decades, andthere is little to differentiate one manufacturer’s product from another.235 Majorappliances already have high penetration levels in the U.S. market, and nobreakthrough products are looming on the horizon to create newdemand. Inaddition,the domestic household appliance industry has experienced major industryconsolidation (e.g., Maytag’s acquisition of Amana) leading to a reduction in thenumber of duplicative operations, but an increase in the number of brands in specificcategories of products.236 As a result, companies have experienced only a modestchange in U.S. market share for these products since 1997.237 In 2003, the U.S.household appliance industry recorded shipments of approximately $31.2 billion, andemployed approximately 131,000workers.238 The United States currentlymaintainsa$55 million trade surplus with Australia for these products, despite U.S. exportersencountering a 5 percent duty.239
Australian IndustryAustralia’s household appliance industry240 is small relative to the U.S. industry, withdomestic production totaling $2.5 billion in 2003.241 The Australian industry isdominated by Electrolux (Sweden), which has an estimated 50 percent share ofdomestic production.Other leadingproducers inAustralia include Fisher-Paykel (NewZealand) and Whirlpool (U.S.).242 Electrolux, Fisher-Paykel, and LG Electronics(Korea) are estimated to supply up to 80 percent of the domestic market. U.S. firms,including Whirlpool Corp., GE Appliance Group, and Maytag (through its Amanaappliance subsidiary), primarily supply the Australian market through exports.However, Whirlpool also has assembly plants in Australia. Electrolux, Fisher-Paykel,and Whirlpool Corp. reportedly source much of their household appliancecomponentry from external suppliers and use their Australian production facilities forassembly and as market distribution points.243
235 Justification for higher prices to the consumer for certain models is based on brand recognition,size, style, and added features, whereas basic functions (cooling, cooking, and cleaning) arecomparable.
236 Eileen M. Bossong,“Industry Surveys: Household Durables,” Standard & Poor’s, Nov. 6, 2003.237 “Portrait of the U.S. Appliance Industry,” Appliance Magazine, Sept. 2002, p. 53.238 Shipment data include figures for the following NAICS categories 33521, 33522, and 335228,
compiled from Industry Surveys: Household Durables, Standard & Poor’s, Nov. 6, 2003.239 All imports entering Australia are subject to a 10 percent value-added tax. The tax is also applied
to goods produced in Australia.240 In Australia, the more common term for major household appliances is “white goods.”241 The value of Australian household appliance production is in Australian dollars, which as of
Sept. 21, 2003 was 1.49 to the U.S. dollar.242 Rochelle Burbury, “Electrolux to Fill Its Image Vacuum,” Australian Financial Review, Sept. 21,
2003, p. 46.243 Alan Johnston, “Teamwork Keeps Production Work in Australia,” found at
http://www.ferret.com/au/article, retrieved Apr. 6, 2004.

84
Potential Impact on U.S. Trade Flows
U.S. ImportsThe FTA will likely have relatively limited impact on U.S. imports of householdappliances or on production and employment in the U.S. industry. Generally, nearlyall household appliance products from Australia currently enter the United Statesduty-free.244 In 2003, household appliance imports from Australia totaled $69.7million (less than 1 percent of the total imports and U.S. market share), and consistedprimarily of refrigerators and freezers, dishwashers, vacuum cleaners, andmiscellaneous appliance parts. Australia’s exports of household refrigerators,freezers, and other related freezing equipment to the world totaled $65 million in2002.245 Household refrigerators accounted for the dominant share of Australia’sexports to the world in2003. The bulk ofmajor householdappliances sold in theUnitedStates are manufactured domestically, because of their high ratio of weight to valueand therefore high transport cost, and low ratio of labor content of total cost. Bycontrast, most counter-top appliances having low transportation costs and a higherratio of labor to total cost, are imported from low labor-cost countries in Asia,especially China.
U.S. ExportsHousehold appliances are a leading U.S. export to Australia ($125 million in 2003) inthe machinery and electrical equipment sector.246 U.S. exports account for 15 percentof total Australian imports of household appliances and that share is expected toincrease. Australian consumers reportedly prefer U.S. household appliances andparts for their quality, innovation, and after-sales service.247 Elimination ofAustraliantariffs (4.3 percent in 2003) may provide increased export opportunities for U.S.products relative to those of other foreign suppliers. Major European (e.g., Miele andAsko brands) and Korean (e.g., Samsung, Daewoo Electronics) household appliancesuppliers to the Australian market will likely see a diminishing market share whenduties on competing imports from the United States are eliminated.248
244 A limited number of household appliances from Australia, such as absorption-typerefrigerators, are subject to duties that range from 1 percent to 1.9 percent rate ad valorem.
245 International Trade Center, “Commodity Trade Statistics (Comtrade),” United Nations TradeStatistics, found at http://unstats.org/comtrade/, retrieved Apr. 1, 2004. Data regarding Australia’sexports of other appliances to the world are not available from the United Nations.
246 The Industry Sector Advisor Committee on Consumer Goods (ISAC-4), which includedhousehold appliances, reported to USTR that a AUSFTA would deliver important benefits to consumergoods firms in terms of market access, regulatory transparency, and customs procedures.
247 Fisher-Pakel, representative, telephone interview by USITC staff, Apr. 8, 2004.248 Julie Macken, “For a Steal in White Goods, Go to the Source,” Australian Financial Review, May
10, 2002, p. 31.

85
Services
OverviewIn 2002, the United States exported private services249 valued at $5.2 billion toAustralia, and imported $2.9 billion, producing a $2.3 billion surplus in cross-borderservices trade. Australia was the 13th-leading export market for U.S. service providersin 2002.250 However, the majority of services between the United States and Australiais conducted through overseas affiliates. In 2001, sales of services by U.S.-ownedaffiliates in Australia totaled $14.7 billion, while services sales by Australian-ownedaffiliates in the United States totaled $10.7 billion.251 This discussion will address theexpected direct impact of the FTA on U.S. imports and exports of services, primarilybased on the provisions of the FTA chapters on services (chapter 10), financial services(chapter 12), and telecommunications (chapter 13). In particular, the discussion willaddress the effects of the FTA on the service industries addressed separately anddistinctly in the FTA text itself: financial services, including banking, securities, andinsurance; telecommunications; professional services, particularly education; expressdelivery services; and audiovisual services. A discussion of the indirect effects of theAgreement focusing on the same service industries also is presented. Several gainsfrom the FTA, over and above Australia’s existing commitments under the GeneralAgreement on Trade in Services (GATS),252 are discussed in greater detail below. Inparticular, the FTA includes binding commitments on audiovisual services, andprovides new branching rights for U.S. insurance companies. In addition, the“negative list” format of the FTA, as opposed to the “positive list” format of the GATS,ensures that the provisions of the FTA will apply to new products resulting from newtechnology and other innovation.
Although it is not possible to establish an overall quantitative measure for the FTA’seffects on trade in services,253 the FTA is expected to have some impact on servicestrade between the United States and Australia.254 First, trade in services will likelyincrease in some areas as a direct result of increased market access and nationaltreatment for U.S. service providers, resulting from barriers removed by the FTA. For
249 Excludes services provided by Federal, State, or local governments.250 USDOC, BEA, Survey of Current Business, Oct. 2003, pp. 80-81.251 USDOC, BEA, Survey of Current Business, Oct. 2003, p. 114.252 The WTO’s General Agreement on Trade in Services (GATS) was signed in 1994 at the end of
the Uruguay Round of WTO negotiations. It is the first multilateral trade treaty to include rules for trade inservices.
253 Tables 3-4 and 3-5 of this report indicate that tariff reduction under the U.S.-Australia FTA wouldcause a very slight modification in services trade between the two countries, and would have a negligibleeffect on output and employment in the U.S. services sector. However, non-tariff measures typically havea more important impact on services trade than tariffs. At the present time, it is not possible to do a precisequantitative analysis regarding the modification or elimination of non-tariff measures under theU.S.-Australian FTA.
254 Due to data constraints in estimating the tariff equivalents for such FTA commitments in servicesas national treatment and transparency, as well as the intangible nature of benefits in the services sector,quantitative assessment was precluded in Chapter 3.

86
instance, the FTA includes language that permits U.S. information technology (IT) firmsto bid on certain government procurement contracts that were previously open solelyto Australian firms.255 Even though much of Australia’s services market is alreadyopen to foreign trade and investment, the removal of the remaining market accessbarriers will ensure the openness of this segment of the Australian economy. In caseswhere barriers were not actually removed, it is possible that the act of binding existingbarriers into a trade agreement, thereby enhancing regulatory transparency andproviding legal certainty, will lead to increased trade and investment. In the case ofaudiovisual services, for example, the Australian Government imposes screen quotasrequiring that 55 percent of broadcast programming originate in Australia. Eventhough the FTA has not removed these quotas, it has promised that they will not beincreased, or applied to additional means of distribution such as the Internet. Thisassurance is important to industry’s assessment of future trade and investmentopportunities.256
Second, since services often serve a support role for both trade and investment inmanufactured and agricultural goods, it is expected that both cross-border trade anddirect investment in services will increase as a secondary result of the increased tradein goods resulting from the FTA’s entry into force. In particular, trade in freighttransport services, express delivery services, port services, and wholesale tradeservices stems in large measure from cross-border trade in goods. This indirectrelationship holds true for financial services and telecommunications as well. Banksand insurance carriers are not likely to increase significantly their direct business inAustralia as a result of the FTA, because Australian financial services markets arelargely open, with many U.S. firms currently conducting business there. However, theyare likely to see increases in their business with U.S.-based manufacturers oragricultural firms, as theyare called upon to finance or insure an increasing amount ofgoods trade between the United States and Australia. Cross-border trade intelecommunication services may also record increases, as U.S.-based firms from alleconomic sectors increase communications with counterparts in Australia, or openaffiliates there, and Australian firms do the same in the United States.
An important feature of the FTA, in the eyes of U.S. business interests, is the treaty’s“negative list” format. Under a negative list approach, all industries are covered by theAgreement, other than those specifically carved out as exceptions in the FTA annexes.This type of approach tends to yield significantly greater coverage than the “positivelist” approach employed by the GATS. Under a positive list approach, industries mustbe specifically included in an agreement in order to be covered. Australia, forexample, did not include audiovisual services in its GATS commitments, so trade in thatarea was not protected by the provisions of the GATS. By contrast, in the U.S.-AustraliaFTA, Australia took specific, limited exemptions in these areas, leaving other parts of
255 William R. Sweeney, Jr., EDS, Commission hearing transcript, Mar. 30, 2004, p. 192.256 Laura Lane, Time Warner, Inc., Commission hearing transcript, Mar. 30, 2004, pp. 185 and
207.

87
the industry to enjoy the benefits of the agreement. For example, the audiovisualservices area includes exemptions for transmission quotas requiring 55 percent localcontent and other specific exemptions that apply to television and radio broadcastingservices. However, the FTA extends coverage to otherareas of the audiovisual servicesindustry, such as Internet distribution of entertainment, by virtue of not beingmentioned in the agreement. This negative list approach is particularly important forhigh-technology industries such as audiovisual, computer-related, and financialservices, where new products are constantly being developed and brought to market.Such new products have automatic coverage under the Agreement, whereas under apositive-list agreement, new products and industries may not be covered unless theagreement is amended to include them.
Further, the FTA features liberal rules of origin in regard to services. Specifically,service providers operating in the United States and Australia are equallybeneficiaries of all investment and service obligations irrespective of ownership orcontrol. This assures that the benefits of the agreement can be extended to third partiesthat wish to enter either market.257 This could increase investment flows to one or bothparties and further intensify competition among leading service providers, which inturn could create greater efficiencies and reduce costs.
Industry representativeswouldhavepreferred that the FTA include provisions ensuringthe temporary entry of businesspersons. U.S. and Australian multinational companiesfrequently need to transfer personnel across borders on a short- or medium-termbasis, and existing visa procedures for transferring employees can be time-consumingand expensive. Reasons for such transfers include establishing a new foreign affiliate,training at a corporate office overseas, or employing skilled personnel for a particulartask, such as drilling an oil well. Temporary entry commitments are particularlyimportant for providers of professional services, including lawyers, accountants,architects, and health care personnel, many of whom provide the bulk of their servicesby traveling to meet with clients.258 Trade commitments regarding temporary entry,which are included in the GATS, provide legal certainty and transparency forbusinesses, with regard to the categories of personnel that they may transfer betweenaffiliates in different countries, and the length of stay that is permitted for eachcategory of employee.259
257 Centre for International Economic (CIE), Economic Analyses of AUSFTA: Impact of the BilateralFree Trade Agreement with the United States, Apr. 2004, p. 16.
258 “The U.S.-Australia Free Trade Agreement (FTA): Report of the Industry Sector AdvisoryCommittee on Services for Trade Policy Matters (ISAC 13),” Mar. 12, 2004, found at Internet addresshttp://www.ustr.gov/, retrieved Mar. 16, 2004.
259 Under the GATS, countries have the option of scheduling trade commitments under four modesof supply for all service industries. Mode 4 covers temporary entry and stay of personnel.

88
Potential Impact on U.S. Trade Flows
U.S. ImportsIt is unlikely that the U.S.-Australia FTA will have a significant impact on U.S. imports ofservices, though imports of services that facilitate trade in goods may increase.Although U.S. services markets are among the largest and most liberalized in theworld, U.S. services firms are highly competitive globally, and are the leadingsuppliers of services in a wide variety of industries, including financial services,telecommunications, audiovisual services, and information technology. Further, mostAustralian-based, multinational firms with commercial interests in the U.S. market arealready doing business here.260 Like the United States, Australia is a developedcountry with globally competitive services firms in several industries. However,consistent with the smaller size of the Australian economy, fewer Australian firms arecompetitive on a global basis. Table 4-4 compares the U.S. and Australian markets forselected service industries, and table 4-5 illustrates current levels of U.S.-Australiatrade for selected service industries.
The FTA will likely affect the different segments of the service sector in somewhatvarying ways. In the financial services industry, for instance, six Australian banks wereoperating in the United States with $11.3 million in combined domestic assets inDecember 2003.261 However, such activities are most likely concentrated in theprovision of trade financing to Australian clients exporting goods to the United States,and do not directly compete with U.S.-based banks. Hence, future growth in thisindustry segment is expected to result from increased trade in goods, due to the FTAbetween the United States and Australia. In addition, several Australian insurancefirms already maintain affiliates in the United States, with recorded U.S. sales of $329million in 2001.262
U.S. commitments as part of the WTO Basic Telecommunications Agreement liftedmost foreign investment restrictions in theU.S.market andprovided greater regulatorycertainty for foreign firms.263 However, Australian firms have chosen to concentratemore on the Asia-Pacific region rather than make significant investments in the U.S.telecommunication servicesmarket.264 Forexample, Telstra, theAustralian incumbentservice provider, has concentrated its foreign investments in Hong Kong and NewZealand. The company continues to evaluate business opportunities in the Asia-Pacificregion, where it has “operational experience.”265
260 Industry representatives from several service industries, telephone interviews with USITC staff,Washington, D.C., Mar. 8-23, 2004.
261 Total domestic assets of Australian banks operating in the United States account for less than 1percent of all domestic assets of foreign banks operating in the United States. U.S. Federal Reserve,“Structure Data for U.S. Offices of Foreign Banks,” Dec. 31, 2003, found athttp://www.federalreserve.gov, retrieved Mar. 23, 2004.
262 USDOC, BEA, Survey of Current Business, Oct. 2003, p. 118.263 The WTO’s Basic Telecommunications Agreement became effective Feb. 5, 1998.264 An examination of U.S. affiliate transactions indicates that U.S. telecommunication purchases
from Australian-based firms totaled $2 million in 2001, compared with U.S. affiliate sales of $687 million.Affiliate transactions entail sales to foreign persons by firms established as joint-ventures or subsidiariesin foreign markets. Such affiliates are funded through foreign direct investment.
265 Telstra, 2003 Annual Report, p. 27, found at Internet address http://telstra.com.au/communications/shareholder/docs/company_overview03fy.pdf, retrieved Mar. 26, 2004.

89
Table 4-4Gross domestic product (GDP) and employment: United States and Australia, selected serviceindustries, 2000
United States Australia
Service industry GDP1 Employment GDP1 Employment2
Billion dollars Thousands Billion dollars ThousandsElectricity, gas and water
supply . . . . . . . . . . . . . . . . . . . . 217.6 857 8.0 64Construction . . . . . . . . . . . . . . . . . 367.5 7,007 16.6 466Wholesale & retail3 . . . . . . . . . . . 1,745.2 32,923 36.2 1,586Hotels & restaurants . . . . . . . . . . 66.3 1,979 7.1 391Transport, storage &
communication . . . . . . . . . . . . . 637.6 7,232 29.4 494Financial intermediation . . . . . . . 753.1 6,175 20.2 314Real estate, renting &
business activities . . . . . . . . . . 1,842.1 16,657 67.2 856Public administration &
defence; compulsory socialsecurity . . . . . . . . . . . . . . . . . . . 939.0 12,639 12.4 448
Education . . . . . . . . . . . . . . . . . . . 61.5 11,829 13.8 585Health & social work . . . . . . . . . . 526.6 13,477 18.3 781Other community, social and
personal service activities . . . 194.6 6,445 13.9 3341 In 1995 dollars.2 Data are for 1999.3 Includes repair of motor vehicles and household goods.
Source: Organisation for Economic Co-Operation and Development (OECD), National Accounts of OECDCountries: Detailed Tables, Volume II, 1989-2000, 2002, pp. 20, 21, 26, 27, 730, 731, 736, 737; and InternationalMonetary Fund, International Financial Statistics, Dec. 2002, p. 108.
Table 4-5U.S. and Australian trade data in selected service industries, 2002
IndustryTotal U.S.
exportsU.S. exportsto Australia
Total U.S.imports
U.S. importsfrom Australia
Milliondollars
Milliondollars Percent
Milliondollars
Milliondollars Percent
Audiovisual . . . . . . . . . . . . . . . . . . . . 9,837 325 3.3 153 (1) -0.7
Financial services . . . . . . . . . . . . . . 15,859 363 2.3 3,665 95 2.6
Education . . . . . . . . . . . . . . . . . . . . . 12,759 67 0.5 2,466 121 4.9
Express delivery . . . . . . . . . . . . . . . 5,787 109 1.9 4,878 32 0.7
Insurance . . . . . . . . . . . . . . . . . . . . . 2,839 66 2.3 15,348 8 0.1
Business, professional, andtechnical services . . . . . . . . . . . . 28,799 598 2.1 10,732 200 1.9
Telecommunications (bilateral) . . . 4,137 139 3.4 4,180 49 1.2
1 Suppressed to avoid disclosure of data of individual companies.
Source: U.S. Department of Commerce, Bureau of Economic Analysis, Survey of Current Business, Oct. 2003, pp.85, and 100-101.

90
Imports of audiovisual services comprise the collection of royalties, license fees, andsales revenues in return for granting rights to display, broadcast, reproduce, ordistribute audiovisual works on a variety of media, including prerecorded film reels,video tapes, digital video discs (DVDs), audio cassettes, and compact disks (CDs).Restrictions on trade in both goods and services therefore apply to the audiovisualindustry. Tariffs on imports of CDs and DVDs, as well as nontariff barriers such ascinema screen quotas and broadcast quotas, all affect trade in audiovisual services.However, the FTA is unlikely to have a measurable impact on either goods or servicesimports of audiovisual services, since there is only one existing tariff on such goods,266
and the FTA will not affect existing nontariff barriers to U.S. imports in the industry.267
An aspect of the U.S.-Australia FTA likely to facilitate trade in professional servicesover time is the creation of a Professional Services Working Group, a mechanism toencourage relevant bodies to develop mutually acceptable standards and criteria forthe licensing and certification of professional services suppliers and makerecommendations on mutual recognition.268 The working group is to considerprocedures for encouraging development of mutual recognition arrangements andexplore the creation of models for licensing and certification.269 Progress by theworking group is to be reported within two years of the FTA’s entry into force. Theworking group mechanism is ultimately likely to facilitate relevant bodies’ efforts toestablish new mutual recognition arrangements, and preserve or augment sucharrangements in place for accountants,270 architects,271 and engineers272 inAustralia and the United States.273
266 The only remaining import duty (7 percent) is on VHS cassettes (all categories - HTS8524.52.1040 and HTS 8524.52.1080), but this trade is small, due to the advent of new technology(primarily DVDs) and the fact that most VHS tapes distributed in a foreign country are manufactured inthat market, from a single master tape exported from the film’s country of origin.
267 Existing restrictions include screen quotas which require 55 percent of broadcast programmingto originate in Australia, restrictions on foreign ownership of television licenses, and an investmentrequirement for subscription television services.
268 See Annex 10-A of the U.S.-Australia FTA.269 Consultations with relevant bodies are to assist in the selection of professions for the working
group’s consideration.270 Two mutual recognition agreements, signed in 1996 and 2002, simplified the process whereby
professionals from the United States and Australia could qualify for a similar designation in the othercountry. “The U.S.-Australia Free Trade Agreement (FTA): Report of the Industry Sector AdvisoryCommittee on Services for Trade Policy Matters (ISAC 13),” Mar. 12, 2004, found at Internet addresshttp://www.ustr.gov/, retrieved Mar. 16, 2004.
271 The Accord on Professionalism in Architecture, signed in 1998 and reaffirmed in 2003 for fiveyears, sets forth cooperation toward inter-recognition of standards to facilitate mutual market opening. Inaddition, the Protocol for Practice in a Host Nation, established in 2003, allows qualified Australianarchitects to apply to practice in the United States in association with a licensed U.S. architect. The RoyalAustralian Institute of Architects, Submission - AUSFTA, found at Internet addresshttp://www.architecture.com.au/, retrieved Mar. 10, 2004, and Architects Accreditation Council ofAustralia, Inc., international news, found at Internet address http://www.aaca.org.au/internationalissues_2.html, retrieved Mar. 10, 2004.
272 The Washington Accord, signed in 1989, provides for recognition of the substantial equivalencyin engineering education programs required for accreditation in Australia, the United States, and sixadditional signatory countries. David L. Curtis, “International Forum Could Eliminate Barriers to Mobility,”Licensure Exchange, National Council of Examiners for Engineering and Surveying, vol. 7, issue 1, Feb.2003, p. 11.
273 “The U.S.-Australia Free Trade Agreement (FTA): Report of the Industry Sector AdvisoryCommittee on Services for Trade Policy Matters (ISAC 13),” Mar. 12, 2004, found at Internet addresshttp://www.ustr.gov/, retrieved Mar. 16, 2004.

91
In terms of restrictiveness, U.S. and Australian markets for architectural, engineering,and accounting services are comparable.274 By national law, U.S. states areresponsible for regulating professional services within their borders. Consequently,market entry for both domestic and foreign providers is deemed complex and subjectto diverse regulatory provisions, such as those regarding establishment, nationality,residency requirements, and requirements of reciprocity.275 The FTA will not changesuch state regulations, so no direct impact on U.S. imports of professional services isexpected.
U.S. Exports
By and large, U.S. service providers report that the Australian markets are alreadyopen to trade and investment from U.S. firms, and the FTA is expected to preserve theexisting positive environment. Several FTA provisions also create new opportunities forU.S. companies, including insurance and asset management firms. Other provisionsbind existing policies within a trade agreement for the first time, including Australia’snew commitments on audiovisual services. These changes are likely to lead to smallincreases in U.S. cross-border exports and U.S. direct investment in Australia,especially over time.
U.S. financial services companies have a strong market presence in Australia. Forexample, as measured by revenue, six U.S. firms were among the world’s 10 largestfinancial advisers in 2003,276 and all but one of these firms had operations inAustralia.277 Nonetheless, the U.S.-Australia FTA does include provisions that willfurther benefit U.S.-based financial services companies already active in or seeking toenter the Australian market. Asset management firms will benefit from the newcommitment allowing for cross-border provision of portfolio management services,which will allow them to reduce costs and capitalize on existing resources.278 U.S.firms will also be able to provide asset management services to the civil service pensionsystem under the national treatment and most-favored-nation provisions of theagreement.279
U.S. insurers also report that the Australian market is essentially open to U.S.cross-border trade and investment in the industry, and that most firms with an interest
274 Nguyen-Hong, D., Restrictions on Trade in Professional Services, Commonwealth of Australia,Productivity Commission, pp. 20, 35.
275 World Trade Organization (WTO), Trade Policy Review: The United States, WT/TPR/S/126,Jan. 2004, pp. 101, 156, 157, found at Internet addresshttp://www.wto.org/english/ tratop_e/tpr_e/tp226_e.htm, retrieved Mar. 19, 2004.
276 These companies are Goldman Sachs, Citigroup, J.P. Morgan, Merrill Lynch, Morgan Stanley,and Lehman Brothers. Standard & Poor’s, Industry Surveys: Investment Services, Oct. 30, 2003.
277 Lehman Brothers does not have offices in Australia.278 “The U.S.-Australia Free Trade Agreement: Report of the Industry Sector Advisory Committee on
Services for Trade Policy Matters,” Mar. 12, 2004.279 Industry representative, telephone interview with Commission staff, Mar. 12, 2004.

92
in the market already have operations there. Sales by U.S.-owned insurance affiliatestotaled $612 million in 2001.280 Therefore, the FTA is not expected to generatesignificant additional U.S. exports of insurance services to Australia.281 However, theFTA does include two specific liberalizations for insurers, who as a result will seegreater regulatory transparency and, perhaps, a wider range of business prospects.First, several key cross-border insurance products, including marine, aviation, andtransport (MAT) insurance; intermediation (brokerage) for MAT; reinsurance; andinsurance auxiliary services are specifically covered by the Agreement, and are notcovered by Australia’s commitments under the GATS.282 More important, life insurerswill now be permitted to conduct operations in Australia through branches, which wasnot previously permitted. Establishment through branching, rather than establishing aseparately capitalized subsidiary, reduces operating costs and enlarges the numberof services that can be provided economically. These improvements may generatesome additional U.S. exports of insurance services.283
Australia deregulated its telecommunications sector in 1997, so the FTA is unlikely tohave any direct impact on U.S. exports of telecommunication services. There are 100carriers currently registered with the Australian Communications Authority, includingU.S.-based WilTel Communications, AT&T, UEComm, MCI, and Sprint.284
U.S.-owned affiliates such as these generated $687 million in sales during 2001.However, such sales are expected to decline as a result of “intense competition” in theAustralian market.285 Opportunities may exist for U.S.-based firms that providewireless data, resale, and broadband services, but such opportunities are the result oftrends in consumer demand rather than a direct result of the FTA.286 Provisions in theFTA may provide greater regulatory certainty for firms that provide these services.
In the case of the market for motion pictures,287 U.S. films already hold a substantialshare of the market in Australia.288 However, the commitments in the FTA will ensurecontinued access to Australia’s audiovisual services market for U.S. firms, albeitsubject to a significant number of restrictions. Industry experts expect greater two-waytrade in the long term, particularly through co-production and increased distributionopportunities.289
280 USDOC, BEA, Survey of Current Business, Oct. 2003, p. 115.281 Industry representatives, telephone interviews with USITC staff, Mar. 8-9, 2004.282 World Trade Organization, “Australia: Schedule of Specific Commitments,”
GATS/SC/6/Suppl.4., Feb. 26, 1998.283 “The U.S.-Australia Free Trade Agreement (FTA): Report of the Industry Sector Advisory
Committee on Services for Trade Policy Matters (ISAC 13),” Mar. 12, 2004, found at Internet addresshttp://www.ustr.gov/, retrieved Mar. 16, 2004; and Laura Lane, Time Warner, Inc., Commissionhearing, Mar. 30, 2004.
284 USDOC, Foreign Commercial Service, Australia Country Commercial Guide, 2004.285 USDOC, Foreign Commercial Service, Australia Country Commercial Guide, 2004.286 USDOC, Foreign Commercial Service, Australia Country Commercial Guide, 2004.287 Specifically, home video entertainment.288 Australia is the eighth-largest export market for U.S. motion pictures. Time Warner, Inc. on
behalf of the Entertainment Industry Coalition for Free Trade (IEC) and New Corporation, Testimonybefore the Commission, U.S.-Australia Free Trade Agreement: Potential Economy-wide and SelectedSectoral Effects (Inv. No. TA-2104-11), Mar. 30, 2004.
289 Industry representative, telephone interview by USITC staff, Washington, D.C., Mar. 30, 2004.

93
Given the substantial current presence of U.S.-based express delivery services firms inAustralia, the impact of the FTA on U.S. exports of express delivery services will largelydepend on the resulting increase in merchandise trade. Federal Express and UPSalready maintain extensive operations in Australia, reflecting the existingliberalization of Australia’s market.290 In fact, UPS was the official express courierand package delivery company of the 2000 Olympic Games in Sydney.291 Thoughnot measurable in terms of increased exports, U.S.-based express delivery firms willbenefit from greater regulatory transparency and legal certainty as a result of newFTA commitments on market access and national treatment. In particular, sinceAustralia did not make such commitments for courier services in the GATS, its FTAcommitments are important in ensuring that market access and national treatmentprovisions apply to express delivery services.
It is likely that U.S. exports of professional services to Australia will increase over time,although the Australian market is considered reasonably open at present.292 U.S.professional services industry representatives indicate that the above-referencedmutual recognition arrangements in place between the United States and Australiaare working smoothly,293 and believe that the working group set up by the FTA is apositive step, likely to foster closer harmonization and facilitate mutual recognition ofprofessional credentials.294
Indirect Benefits of the FTA
Many of the benefits of the FTA for U.S. service firms do not come from the chaptersthat directly address cross-border trade in services (Chapter 10), financial services(Chapter 13), and telecommunications (Chapter 12). Other important aspects of theAgreement cited by service sector industry representatives include the chapters oninvestment (Chapter 11), government procurement (Chapter 15), electronic commerce(Chapter 16), and intellectual property rights (Chapter 17). All of these chaptersinclude language that will significantly add to the rights and protections enjoyed byU.S. firms in their trade and investment relationships with Australia, and may very wellincrease U.S. trade with, and investment in, Australia over the medium and long terms.Although it is difficult toquantifyor clearly illustrate thedirect effects of these sectionsofthe Agreement on cross-border trade, industry representatives have clearly stated thatthey consider these provisions of the treaty vital for their business operations in
290 Federal Express, Submission to the Industry Commission of Australia, Enquiry into InternationalAir Services, Feb. 1998, p. 10; and UPS, “UPS shares the Olympic spirit,” press release, Sept. 21, 2000.
291 UPS, “UPS shares the Olympic spirit.”292 “The U.S.-Australia Free Trade Agreement (FTA): Report of the Industry Sector Advisory
Committee on Services for Trade Policy Matters (ISAC 13),” Mar. 12, 2004, found at Internet addresshttp://www.ustr.gov/, retrieved Mar. 16, 2004.
293 U.S. industry representatives, interviews by USITC staff, Feb. 24, 2004.294 “The U.S.-Australia Free Trade Agreement (FTA): Report of the Industry Sector Advisory
Committee on Services for Trade Policy Matters (ISAC 13),” Mar. 12, 2004, found at Internet addresshttp://www.ustr.gov/, retrieved Mar. 16, 2004.

94
Australia. For example, the government procurement chapter opens new markets forU.S. computer services firms, which had previously been barred from bidding oncertain types of Australian Government database contracts. New protections andopportunities relating to electronic commerce will also permit U.S. firms to increasemarket opportunities in Australia.295 Representatives of the audiovisual servicesindustry have clearly stated that changes to Australia’s intellectual property regimeresulting from the FTA are vital to their ability to invest in Australia and retain theirprofits in that market.296
Audiovisual ServicesThe U.S.-Australia FTA will retain several current restrictions on market access, such aslocal content quotas on broadcast television and an investment requirement onsubscription television. However, the U.S. audiovisual services industry does notconsider these overly burdensome. Rather, industry representatives believe that thisFTA successfully achieves a balance between Australia’s cultural concerns and U.S.industry’s future access to the country’s audiovisual services market.297 Australiapreviously held no audiovisual service commitments in its GATS schedule, so this is animportant step forward. In addition, the audiovisual provisions in this FTA areregarded as setting an important precedent for future bilateral and multilateral tradeagreements.
The audiovisual services industry specifically highlighted the following provisionsachieved in the FTA as beneficial:
D provisions for intellectual property (IP) protections that representimprovements over those in TRIPS,298 such as implementing the WorldIntellectual Property Organization (WIPO) Internet Treaties, ensuring thatcopyright owners have exclusive rights to make works available online, andprotecting copyrighted works for extended terms;
D strengthened IP enforcement, which will increase criminal and civil protectionagainst unlawful decoding of encrypted satellite television signals, andauthorize seizure, forfeiture, and destruction of pirated products andequipment;
D zero tariffs on entertainment products, including all movies, music, consumerproducts, books and magazines imported into Australia, and a requirementon customs valuation, basing it on the value of the carrier media rather thanprojected royalties;
295 William R. Sweeney, Jr., EDS, testimony at Commission hearing, Mar. 30, 2004.296 Rick Lane, Vice President of Government Affairs, News Corporation; and Laura Lane, Vice
President of Global Public Policy, Time Warner, Inc., testimony at Commission hearing, Mar. 30, 2004.297 Industry Sector Advisory Committee on Services (ISAC-13),” The U.S. Australia Free Trade
Agreement (FTA): Report of the Industry Sector Advisory Committee on Services for Trade Policy Matters(ISAC-13),” Mar. 12, 2004.
298 The WTO’s Agreement on Trade-Related Aspects of Intellectual Property Rights (TRIPS) wassigned in 1994 at the end of the Uruguay Round of WTO negotiations. It is the first multilateral trade treatyto include intellectual property rules.

95
D improved market access, ensuring market access for U.S. films and televisionprograms over cable, satellite, and the Internet;
D free trade in digital downloads and electronic commerce, committing tonondiscriminatory treatment of digital products, and agreeing not to imposecustom duties on such products.299
Several other IP provisions of the U.S.-Australia FTA are also important to theaudiovisual services industry. The Motion Picture Association of America (MPAA) hasestimated that audiovisual piracy in Australia cost the United States motion pictureindustry approximately $45 million in 2003.300 Although Australia’s piracy rate hasgenerally been low, according to international standards, it has recently increasedfrom 5 percent in 2002 to 8 percent in 2004, raising concerns within the U.S.audiovisual industry.301 Industry representatives have emphatically stated thatprotecting intellectual property is critical to tradeand investment inexistingaudiovisualservices, and in the host of new entertainment services that are based on upcomingtechnology, and currently under development.302
Express Delivery ServicesAustralian firms involved in cross-border freight delivery will likely benefit fromgreater regulatory certainty in customs processing. The FTA’s customs provisionsensure transparency of administration and rulings, and threaten the imposition ofpenalties in the case of legal and regulatory violations. Processing and rapid releaseguidelines for express shipments alsoprovide greater certainty forU.S. andAustralianfirms, although such guidelines do not result in procedural improvements, as U.S. andAustralian customs’ processing procedures for express shipments are alreadyefficient.303 U.S.-based firms receive additional certainty from the FTA’s competitionpolicy provisions, including the chapter on competition-related matters and languagein the services chapter that limits Australia Post’s ability to cross-subsidize competitiveservices with monopoly-derived profits.304
299 Time Warner, Inc. on behalf of the Entertainment Industry Coalition for Free Trade (EIC) andNews Corporation, Testimony before the Commission, U.S.-Australia Free Trade Agreement: PotentialEconomywide and Selected Sectoral Effects (Inv. No. TA-2104-11), Mar. 30, 2004.
300 Time Warner, Inc. estimates about $10 billion in lost revenue for global exports in 2003, due toweak intellectual property enforcement.
301 Motion Picture Association of America (MPAA), “Trade Barriers to Exports of U.S. FilmedEntertainment: 2004 Report to the U.S. Trade Representative,” June 2004.
302 Time Warner, Inc. on behalf of the Entertainment Industry Coalition for Free Trade (EIC) andNews Corporation, Testimony before the Commission, U.S.-Australia Free Trade Agreement: PotentialEconomywide and Selected Sectoral Effects (Inv. No. TA-2104-11), Mar. 30, 2004.
303 Industry representative, telephone interview with USITC staff, Washington, D.C., Mar. 16, 2004;and ACCA, Testimony before the Commission, U.S.-Australia FTA (Inv. No. TA-2104-11), Mar. 30, 2004.
304 Although Australian firms receive the same assurances from the U.S. Postal Service, their limitedparticipation in the U.S. market reduces the potential benefits of such provisions. Despite their overallsupport of the FTA, the U.S. express delivery services industry is concerned that the language oncross-subsidies creates a “minimally enforceable commitment that would not fully cover the scope ofcross-subsidization that could occur.” Report of the Industry Sector Advisory Committee on Services forTrade Policy Matters (ISAC 13),” The U.S.-Australia Free Trade Agreement (FTA), Mar. 12, 2004, p. 12.

96
Financial ServicesThe FTA provisions regarding regulatory transparency are viewed favorably by thefinancial services industry, particularly the requirement that regulators state thepurpose of proposed regulations.305 One component of the Agreement viewednegatively by U.S. industry sources is Australia’s retention of its requirement thatforeign investors obtain investment approval from the Foreign Investment ReviewBoard, which may deny specific foreign investment on the basis of national interest.306
While branching by financial investors already present in the market has beenexcluded from the provision,307 it is believed that the provision could negatively affectmarket access and portfolio investment for financial service providers.308 For furtherinformation on the provision and its possible effects, see the investment chapter of thisreport.
Information Technology ServicesThe most prominent topics related to IT services addressed by the FTA are electroniccommerce (e-commerce) and intellectual property rights (IPR).309 Industry stronglysupports the IT-relatedprovisionsof theAgreement.With regard to IPR, theAgreementcontains vigorous standards of protection and enforcement for copyrights and otherintellectual property. Such protection is critical to trade and investment in IT sectorsreliant on IPR such as software development.310
The electronic commerce chapter proposes that electronically delivered goods andservices should receive no less favorable treatment than products delivered in physicalform, and that when domestic regulations affect e-commerce, such regulations shouldbe nondiscriminatory, transparent, and as least trade restrictive as possible. As noted,the section covering digital products311 addresses the valuation of physically delivereddigital products, and assures a zero duty rate on digital products transmittedelectronically. Suchcommitmentsareexpected to facilitatean increase ine-commerce.
305 “The U.S.-Australia Free Trade Agreement: Report of the Industry Sector Advisory Committee onServices for Trade Policy Matters,” Mar. 12, 2004.
306 U.S. Trade Representative, 2003 National Trade Estimate Report on Foreign Trade Barriers, andindustry representative, telephone interview with Commission staff, Mar. 23, 2004.
307 “The U.S.-Australia Free Trade Agreement: Report of the Industry Sector Advisory Committee onServices for Trade Policy Matters,” Mar. 12, 2004.
308 Industry representative, telephone interview with Commission staff, Mar. 23, 2004.309 Generally speaking, electronic commerce and IPR are not considered to be IT services sectors.
E-commerce is a methodology—a way to shop. IT services directly related to e-commerce exist, such asdeveloping Web sites that sell products online, however, such activities are not the focus of theAgreement. Similarly, IPR are mentioned within the context of IT services only to the extent that they mayprofoundly affect trade within an IT sector.
310 William R. Sweeney, Jr., EDS, Testimony before the Commission, U.S.-Australia Free TradeAgreement: Potential Economywide and Selected Sectoral Effects (Inv. No. TA-2104-11), Mar. 30, 2004.
311 The text covering digital products puts forth the need for predictability in how digital products aretreated in terms of trade.

97
Education ServicesThe U.S.-Australia FTA provides for the recognition of standards or criteria forauthorization, licensing, or certification.312 Education services trade may be affected,in part, by processes within which development of such standards or criteria may beapplied to teachers. U.S. industry sources state that the FTA may ease the provision ofU.S. services in grade levels other than primary and may also facilitate negotiationsoutside the FTA in other education service areas, such as testing services.313 Two sideletters to the FTA state understandings with regard to education services. One letterreinforces the U.S. and Australian governments’ understanding that the FTA would notinterfere with the ability of an education and training institution to maintain autonomyin admissions policies, including the recognition of credits and degrees;nondiscriminatory accreditation and quality assurance procedures; governmentfunding, subsidies, or grants; and compliance with nondiscriminatory requirements asto the establishment and operation of a facility. The second letter concerns anunderstanding that the U.S. Government will review and report to the Government ofAustralia measures affecting cross-border trade in higher education services withregard to transparency in 18 particular U.S. States, to be completed within three yearsof the FTA’s entry into force.
312 Article 10.9.313 “The U.S.-Australia Free Trade Agreement (FTA): Report of the Industry Sector Advisory
Committee on Services for Trade Policy Matters (ISAC-13),” Mar. 12, 2004, found at Internet addresshttp://www.ustr.gov/, retrieved Mar. 16, 2004.


99
CHAPTER 5Overview of Investment Provisions andthe Potential Effect of the U.S.-Australia FTA
Introduction
This chapter presents a description of the bilateral investment relationship between theUnitedStatesandAustralia, andadiscussionofAustralia’s current investment policies.It then summarizes the major provisions of chapter 11 of the FTA, which is related toinvestment, and the investment-related aspects of Annexes I - IV of the Agreement. Theprovisions of chapter 11 specify the rights and privileges of U.S. and Australianinvestors in the territory of the other party. The annexes contain any exceptions to themore general language found in Chapter 11. This chapter concludes with a discussionof the effects of the FTA’s investment provisions on the U.S. economy, taking intoaccount the viewsofU.S. industry representatives. To the extent possible, thisdiscussionconsiders the potential effects of implementationof the investment provisionsof the FTAon U.S. industries and the U.S. economy as a whole.
U.S.-Australia Investment
Both the United States and Australia already have high standards for the treatment offoreign investors. The Australianeconomyhas traditionally beenviewed aswelcomingto investment by U.S. firms,1 and the FTA is expected to preserve the existing, positiveinvestment environment. TheUnitedStates isAustralia’s largest sourceof foreigndirectinvestment;2 only Japan and Singapore host higher levels of U.S. investment within theAsia-Pacific region.3 In 2002, the U.S. direct investment position in Australiameasured $36.3 billion on a historical-cost basis (figure 5-1 and table 5-1), andgenerated income of $2.6 billion for U.S. investors.4 U.S. investment in Australia isdivided among a wide range of sectors, with manufacturing accounting for 30percent, followed by mining (23 percent), and finance and insurance (11 percent)(figure 5-2).
1 Industry representatives, telephone interviews by USITC staff, Mar. 3-12, 2004; and EmergencyCommittee for American Trade (ECAT), “ECAT Praises Groundbreaking Tariff Deal in U.S.-AustraliaFTA,” Feb. 13, 2004, found at Internet address http://ecattrade.org/, retrieved Mar. 11, 2004.
2 USDOC, US&FCS, “Australia Country Commercial Guide FY2002,” found at Internet addresshttp://www.stat-usa.gov/mrd.nsf/, retrieved Feb. 23, 2004.
3 USDOC, BEA, Survey of Current Business, Sept. 2003, p. 144.4 USDOC, BEA, Survey of Current Business, Sept. 2003, p. 144.

100
Figure 5-1U.S. direct investment with Australia, 1998-2002
0
5
10
15
20
25
30
35
40
1998 1999 2000 2001 2002
Million U.S. dollars
U.S. investment in AustraliaAustralian investment in the United States
Source: U.S. Department of Commerce, Bureau of Economic Analysis, Survey ofCurrent Business, Sept. 2003, pp. 19 & 144 and Oct. 2002, pp. 64 & 94.
Table 5-1Foreign direct investment, United States and Australia, 2002
UnitedStates Australia
Total inbound investment stock (billions of U.S. dollars) . . . . . . . 1,351.1 128.7Inbound investment stock as percentage of GDP . . . . . . . . . . . . . 12.9 32.2Total outbound investment stock (billions of U.S. dollars) . . . . . . 1,501.4 91.2Outbound investment stock as percentage of GDP . . . . . . . . . . . . 14.4 22.9Bilateral outbound investment stock (billions of U.S. dollars) . . . 36.3 24.5
Note.—Bilateral outbound investment stock reflects U.S. Government statistics for U.S.outbound direct investment position in Australia on a historical-cost basis, and U.S.inbound direct investment position from Australia on a historical-cost basis.
Sources: UNCTAD, World Investment Report 2003; USDOC, BEA, Survey of CurrentBusiness, Sept. 2003.

101
Other 8.6%
Figure 5-2U.S. direct investment in Australia, 2002
Source: U.S. Department of Commerce, Bureau of Economic Analysis, Survey ofCurrent Business, Sept. 2003, p. 121
Manufacturing 29.7%
Chemicals 4.2%
Utilities 4.5%
Finance & Insurance 10.9%Mining 22.6%
Wholesale trade 7.9%
Primary & Fabricatedmetals 7.0%
Depository institutions 4.7%
As of 2001, U.S. residents controlled about 3,400 operating businesses in Australia,with total employment of 331,000 workers, responsible for approximately $2.3 billionin gross fixed capital formation, and $18.8 billion in value added.5 Table 5-2illustrates the sectoral diversity of existing U.S.-owned affiliates in Australia as of June2001.Wholesale trade serviceswas the single service industrywhichaccounted for thelargest number of U.S.-owned affiliates in Australia, followed by affiliates in themanufacturing and financial services sectors. Manufacturing comprised the greatestshare of industry value added, followed by mining.6
Australia ranks eleventh as a source of foreign direct investment in the United States,and the second most important source from the Asia-Pacific region, after Japan.7
Australian investment in the United States was valued at $24.5 billion in 2002, with the
5 Australia Bureau of Statistics (ABS), “Economic Activity of Foreign Owned Businesses in Australia,”Jan. 9, 2004, found at Internet address http://www.abs.gov/au/ausstats, retrieved May 3, 2004.Conversion into U.S. dollars calculated by the Commission.
6 Australian Bureau of Statistics, “Economic Activity of Foreign-Owned Businesses in Australia,”found at Internet address http://www.abs.gov.au/ausstats/, retrieved Mar. 10, 2004.
7 USDOC, BEA, Survey of Current Business, Sept. 2003, p. 69.

102
Table 5-2U.S. investment in Australia, by sector, FY 2000-2001
IndustryNumber of
affiliates Employment
Affiliates’grossfixed
capitalformation
Affiliates’industry
valueadded
Estimate only Thousands Millions of U.S. dollars
Mining . . . . . . . . . . . . . . . . . . . . 60 6.4 777.3 3,543.9Manufacturing . . . . . . . . . . . . . 373 89.2 629.9 5,872.4Electricity, gas, and water
supply . . . . . . . . . . . . . . . . . . 10 2.6 105.3 715.2Construction . . . . . . . . . . . . . . . 10 8.3 8.3 352.3Wholesale trade . . . . . . . . . . . . 949 36.8 111.9 2,151.2Retail trade . . . . . . . . . . . . . . . . 33 39.1 73.7 853.7Hotels and restaurants . . . . . . 35 8.1 9.4 156.2Transport, storage, and
communication . . . . . . . . . . . 31 6.5 233.2 435.4Finance and insurance . . . . . . 308 22.9 NA NAOther services . . . . . . . . . . . . . 1,630 111.1 1,192.2 3,977.2All industries2 . . . . . . . . . . . . . . 3,439 331.0 2,279.2 18,786.7
1 Excludes value for cultural, recreational, and personal services, which is notavailable.
2 Excludes agriculture, forestry, and fishing. Data originally presented in Australiandollars. Calculation of exchange rates by the Commission.
Source: Australian Bureau of Statistics, “Economic Activity of Foreign OwnedBusinesses in Australia.”
largest shares in manufacturing (14 percent); real estate, rental, and leasing(11 percent); and finance and insurance (6 percent), generating income of $749million for Australian investors.8
Current Investment Policies of Australia
Under the Foreign Acquisitions and Takeovers Act of 1975 and related regulations,foreign investment in Australia is subject to screening by the Foreign Investment ReviewBoard (FIRB). Approval is required for acquisitions valued at A$50 million (US$27.7million) or greater, and new business establishments of A$10 million (US$5.5 million)or greater, with approval to be granted as long as the proposed investment passes anational interest test. Direct investments by foreign governments or their agencies, orby foreign private investors in the banking, media (broadcasting and newspapers),telecommunications, air transport, shipping, and urban residential real estate sectors,must apply for FIRB approval regardless of size, and investment in these service sectors
8 USDOC, BEA, Survey of Current Business, Sept. 2003, p. 69.

103
is subject to minority-share equity limits.9 In the five years preceding the FTA, the FIRBapproved all but four investment proposals, out of a total 2,285 applications. Themajority of these applications were decided quickly; 93 percent of all applicationswere approved within 30 days.10 U.S. investors report no problems with overseasinvestment or capital repatriation, and acquisitions of domestic firms are generallyapproved without problems.11
Nonconforming Measures of the Agreement
This section provides additional background information on certain investmentprovisions of the U.S.-Australia FTA that is useful to the analysis of the impact of theAgreement on the United States.12 The investment chapter of the FTA contains manyprovisions similar to those in the investment chapters of previous bilateral FTAs,including the agreements concluded with Chile and Singapore. The chapter containsprovisions for the treatment of existing or future measures that are inconsistent withcertain disciplines (specifically, those concerning nondiscrimination, performancerequirements, and senior personnel). Existing measures maintained at the central orregional government level are exempted from these disciplines provided that they aredescribed in Annex I of the Agreement. Reservations to ensure that a party maintainsflexibility to impose measures in the future that may be inconsistent with thesedisciplines are described in Annex II. Nonconforming measures at the localgovernment level are simply exempted without requiring anynotation inanannex. Theactual content of these reservations varies widely. Some reservations are horizontal innature, meaning that theyaddress general policyprovisions that affect all investments,whereas others apply to specific industry segments.
Australia’s horizontal reservations under Annex I address existing nonconformingmeasures at the regional government level, and the investment notificationrequirements under the FIRB. The reservation lists the threshold over which investmentsmust be notified to and approved by the FIRB, including the new threshold of A$800million (US $443.2 million) for many investments – a level that applies to U.S. investorsspecifically as a result of the FTA. Australia’s horizontal reservations listed underAnnex II include a measure permitting Australia to adopt measures that favor
9 Australian Government, The Treasury, Foreign Investment Policy Division, “Summary ofAustralia’s Foreign Investment Policy,” May 2000, found at Internet addresshttp://www.firb.gov/au/content/_downloads/policysummary.pdf, retrieved Mar. 12, 2004; andUSDOC, US&FCS, “Australia Country Commercial Guide FY2002,” found at Internet addresshttp://www.stat-usa.gov/mrd.nsf/, retrieved Feb. 23, 2004.
10 Letter from the Australian Trade Minister to the U.S. Trade Representative, Exchange of Letters onthe FIRB, side letter to the U.S.-Australia FTA, Draft, Mar. 1, 2004, found at Internet addresshttp://www.ustr.gov/, retrieved Mar. 8, 2004.
11 USDOC, US&FCS, “Australia Country Commercial Guide FY2002,” found at Internet addresshttp://www.stat-usa.gov/mrd.nsf/, retrieved Feb. 23, 2004.
12 A summary of the provisions of the U.S.-Australia FTA is provided in Chapter 2.
104
indigenous persons or organizations, and a measure that permits Australia to adoptfuture measures at the federal or regional levels of government that are notinconsistent with its market access obligations under GATS Article XVI. Otherhorizontal reservations in Annex II refer to foreign investment proposals regardingurban land, and the MFN obligations of Australia with regard to non-U.S. foreigninvestors, particularly in the areas of aviation, fisheries, or maritime matters, includingsalvage.
Horizontal reservations taken by the United States under Annex I address theprograms of the Overseas Private Investment Corporation and the registration ofpublic offerings of securities, as well as existing nonconforming measures at the statelevel. Horizontal reservations listed by the United States under Annex II include areservation that preserves the United States’ rights to adopt any measure regardingcross-border services trade or establishment of a service enterprise, so long as it isconsistent with obligations undertaken in the GATS. Annex II of the FTA also contains ahorizontal U.S. reservation for measures that accord preferential treatment tocountries under bilateral or multilateral international agreements that have beensigned prior to the entry into force of the U.S.-Australia FTA, including internationalagreements involving aviation, fisheries, or maritime matters. Annex III containsreservations related to financial services excluding insurance, and Annex IV containsreservations related to financial services including insurance.
The specific sectors for which reservations are listed in Annexes I, II, III, and IV arepresented in table 5-3 without attempting to characterize the actual substance of thereservations. In many cases, the reservation represents a measure that imposes apotential constraint on foreign investment that may or may not have any significantbearing on the activities of foreign investors. Consequently, the inclusion of a sector inthe annex should not be interpreted to mean that the sector as a whole has beenexempted from coverage under the investment disciplines.
Potential Effects on the U.S. Economy
The markets in both the United States and Australia are substantially open to foreigndirect investment under current policies. Therefore, according to several U.S. industryrepresentatives, the U.S.-Australia FTA is not expected to have a significant impact onthe level of U.S. direct investment in Australia, or the level of Australian directinvestment in the United States. The U.S. business community has stated that it supportsthe agreement’s investment provisions insofar as they expand market access andincorporate high standards of protection for investment.13
13 Industry representatives, telephone interviews by USITC staff, Mar. 3-12, 2004; EmergencyCommittee for American Trade (ECAT), “ECAT Praises Groundbreaking Tariff Deal in U.S.-AustraliaFTA,” Feb. 13, 2004, found at Internet address http://ecattrade.org/, retrieved Mar. 11, 2004; and “TheU.S.-Australia Free Trade Agreement (FTA): Report of the Industry Sector Advisory Committee on Servicesfor Trade Policy Matters (ISAC-13), Mar. 12, 2004, found at Internet address http://www.ustr.gov/,retrieved Mar. 16, 2004.

105
Table 5-3Industry sectors subject to nonconforming measures in the U.S.-Australia FTA
Australia United States
Current measures Potential measures Current measures Potential measures
Information andcommunicationstechnology
Communications:Radio
Communications
Transportationservices: Air andmaritime
Transportationservices: Air,maritime
Transportationservices: Airtransportation
Transportationservices: Maritime
Banking BankingInsurance Insurance InsuranceSocial services Social services
Audiovisual services:Broadcasting
Audiovisual services:broadcasting, filmand televisionproduction
Advertising services Advertising servicesFishing Education services:
Primary educationAtomic energy
Distribution services MiningTelecommunications Customs brokerageNewspapersHealth care
Note.—Nonconforming measures are found in Annexes I through IV of the FTA. Annex Icontains reservations for cross-border services, excluding financial services, to preserveexisting measures that are inconsistent with the disciplines concerning nondiscrimination,performance requirements, and senior personnel. Annex II contains reservations forcross-border services, excluding financial services, to ensure that a party maintainsflexibility to impose measures in the future that may be inconsistent with the disciplines ofthe FTA. Annex III contains both existing and future nonconforming measures related tofinancial services excluding insurance. Annex IV contains both existing and futurenonconforming measures related to insurance services.
Source: Text of the U.S.-Australia FTA, Annex I, Annex II, Annex III, and Annex IV, foundat www.ustr.gov., retrieved March 16, 2004.
The U.S. business community would have preferred that the FTA include an“investor-state” dispute resolution mechanism.14 Industry representatives view this asa significant shortcoming of the agreement, and an important step back from previousFTAs and Bilateral Investment Treaties (BITs) concluded by the United States.15 U.S.industry representatives note that they are not concerned with current Australian
14 Under an “investor-state” mechanism, foreign investors may settle investment disputes througharbitration directly with the host country government.
15 Industry representatives, telephone interviews by USITC staff, Mar. 3-12, 2004; EmergencyCommittee for American Trade (ECAT), “ECAT Praises Groundbreaking Tariff Deal in U.S.-AustraliaFTA,” Feb. 13, 2004, found at Internet address http://ecattrade.org/, retrieved Mar. 11, 2004; and “TheU.S.-Australia Free Trade Agreement (FTA): Report of the Industry Sector Advisory Committee on Servicesfor Trade Policy Matters (ISAC-13), Mar. 12, 2004, found at Internet address http://www.ustr.gov/,retrieved Mar. 16, 2004.

106
Government policies, but that the FTA does not give them any recourse to enforce theprovisions of the Agreement if current policies should change in a manner contrary tothe interests of U.S. investors.16
U.S. industry representatives would also have preferred to discontinue the investmentscreening performed by Australia’s FIRB. However, the minimum size of most foreigninvestments that require screening has been substantially raised.17 In general, U.S.investors in Australia must notify the Australian Government (through the FIRB) ofinvestments only if an investment is valued at more than A$800 million (US $443.2million).18 The previous investment threshold was A$50 million (US $27.7 million). Thenew higher limit applies to investments in most sectors, but does not include the media;telecommunicationsor transport sectors; defense-related sectors; and theextractionofuranium or plutonium, or operation of nuclear facilities.19 Industry representativeshave stated that the higher limits are an improvement in the investment approvalprocess, particularly when combined with the market access provisions of the FTA,which are expected to create significant market liberalization. However,representatives expresseddisappointment at the sectoral exclusions,particularly in themediaand telecommunications industries.20 Industry representatives indicate thatdueto Australia’s fairly liberal existing investment regime, they have been free to invest inmost industries despite FIRB screening, and that is not expected to change.21
16 Industry representatives, telephone interviews with USITC staff, Feb. 26, Mar. 9, and Mar. 11,2004.
17 Industry representatives, telephone interviews by USITC staff, Mar. 3-12, 2004; and “TheU.S.-Australia Free Trade Agreement (FTA): Report of the Industry Sector Advisory Committee on Servicesfor Trade Policy Matters (ISAC-13), Mar. 12, 2004, found at Internet address http://www.ustr.gov/,retrieved Mar. 16, 2004.
18 Non-U.S. investors remain subject to the existing A$50 million investment screening limit.19 As noted above, investments of any size in the media sector, and investments valued at more than
A$50 million in the telecommunications, transport, defense-related, uranium or plutonium extraction, ornuclear facilities-related sectors remain subject to FIRB approval. U.S.-Australia FTA, Draft Text, Mar. 1,2004, Annex I.
20 Industry representatives, telephone interviews with USITC staff, Feb. 26, Mar. 9, and Mar. 11,2004.
21 Industry representatives, telephone interviews by USITC staff, Mar. 9-11, 2004.

107
CHAPTER 6Review of the Intellectual Property Provisions andthe Potential Effect of the U.S.-Australia FTA
This chapter analyzes the economic effects of the intellectual property rights (IPR)provisions of the U.S.-Australia FTA (Chapter 17). In general, Australia is considered tohave a strong IPR regime.1 Although U.S. industry representatives have expressedconcerns about certain remaining IPR issues in Australia, the FTA addresses almost allof these.2 The increased level of protection afforded to IPR holders by the FTA likelywould result in increased revenues for U.S. industries dependent on copyrights,trademarks, patents, and trade secrets. However, due to the small size of Australia’seconomy compared to that of the United States,3 any increases in revenues for the U.S.IPR industry likely would have small effects on the U.S. industry and economy. Further,there would be little, if any, effect on U.S. industries or the U.S. economy based onUnited States implementation of its FTA obligations. The following sections of thischapter describe the current status of IPR protection in Australia, summarize keyprovisions of the FTA related to IPR, and describe the potential effects ofimplementation of IPR provisions in the FTA on U.S. industries and the U.S. economy asa whole.
Current Conditions of IPR Protection in Australia
According to U.S. industry and government officials, Australia has a strong IPR regimeproviding protection for copyrights, trademarks, patents, trade secrets, and otherintellectual property.4 As a member of the WTO, Australia has assumed obligations
1 Hearing transcript at pp. 71 and 193; and U.S. industry representatives, in-person and telephoneinterviews by USITC staff, Jan.-Apr. 2004.
2 Hearing transcript at pp. 181, 182, and 197; Industry Functional Advisory Group (IFAC-3) onIntellectual Property Rights for Trade Policy Matters, The U.S.-Australia Free Trade Agreement (FTA): TheIntellectual Property Provisions, Mar. 12, 2004, pp. 1-22, found at http://www.ustr.gov, retrieved Mar.17, 2004; and Industry Sector Advisory Committee for Chemicals and Allied Products (ISAC-3), “Chapter17: Intellectual Property,” The U.S.-Australia Free Trade Agreement (FTA), Mar. 12, 2004, pp. 9-10,found at http://www.ustr.gov, retrieved Mar. 22, 2004.
3 Central Intelligence Agency (CIA), CIA Factbook, “United States,” “Australia,” found athttp://www.cia.gov, retrieved Mar. 1, 2004.
4 Hearing transcript at pp. 71 and 193; International Intellectual Property Alliance (IIPA), Letterdated Jan. 21, 2003 from Steven J. Metalitz, Senior Vice President, IIPA, to Chairman, Trade Policy StaffCommittee, Regarding 2004 National Trade Estimate Report on Foreign Trade Barriers, 68 Fed. Reg.62159 (Oct. 31, 2003), pp. 1-3, found at http://www.iipa.com, retrieved Feb. 24, 2004; U.S. Chamberof Commerce, “Testimony - U.S.-Australian Free Trade Agreement,” Press Release, Feb. 6, 2003, p. 3,found at http://www.uschamber.com, retrieved Feb. 24, 2004; U.S. industry representatives, in-personand telephone interviews by USITC staff, Jan.-Apr. 2004; and Nasir Abbasi, U.S. & Foreign CommercialService (US&FCS) and U.S. Department of State, “Australia Country Commercial Guide 2004,” US&FCSMarket Research Reports, July 22, 2003, Ch. 7, pp. 73-74.

108
under the WTO Agreement on Trade-Related Aspects of International Property Rights(TRIPs). Nevertheless, U.S. companies indicate that there still is room for improvementin Australia’s IPR regime, including enactment of legislation to improve Internet andother digital piracy.5 In this regard, U.S. government and industry officials indicatethat Australia’s regime could be improved significantly6 if the country adopted anumber of provisions addressing digital piracy7 found in the World IntellectualProperty Organization (WIPO) Copyright Treaty (WCT) and the WIPO Performancesand Phonograms8 Treaty (WPPT) (see text box 6-1).9 Australia has not yet signedeither, unlike the United States and a number of its other trading partners, which havesigned both.10 Finally, U.S. government and industry officials cite remaining concernswith Australia in the areas of copyright infringement; satellite signal, patent,trademark, and trade secret protection; as well as IPR enforcement.
Copyrights, Trademarks, and Satellite Program SignalsDespite acknowledgment by U.S. industry representatives that Australia has a strongcopyright and trademarkprotection regime,11 they identify several areas of concern inthat country, including importation of piratical and counterfeit12 video cassettes anddigital video discs13 (DVDs),14 and other digital, including Internet, piracy.15 Australia
5 U.S. industry representatives, in-person and telephone interviews by USITC staff, Jan.-Apr. 2004.6 Motion Picture Association of America (MPAA), “Australia,” Motion Picture Association - 2004
Trade Barriers Report, 2004, p. 330; and U.S. industry representatives, in-person and telephoneinterviews by USITC staff, Jan.-Apr. 2004.
7 Piracy is a term used to refer to copyright infringement.8 Phonograms are sound recordings.9 These two treaties are often referred to as the “Internet Treaties” because they provide new
international standards for the protection of copyrights and related rights in the digital economy. TheUnited States ratified each treaty and implemented them domestically via the Digital MillenniumCopyright Act of 1998.
10 U.S. industry representatives, in-person and telephone interviews by USITC staff, Washington,DC, Jan.-Apr. 2004.
11 International Intellectual Property Organization (IIPA), letter dated Jan. 21, 2003, from Steven J.Metalitz, Senior Vice President, IIPA, to Chairman, Trade Policy Staff Committee, Regarding 2004National Trade Estimate Report on Foreign Trade Barriers, 68 Fed. Reg. 62159 (Oct. 31, 2003), pp. 1-3;found at http://www.iipa.com, retrieved Feb. 24, 2004; U.S. Chamber of Commerce,“Testimony–U.S.-Australian Free Trade Agreement,” Press Release, Feb. 6, 2003, p. 3, found athttp://www.uschamber.com, retrieved Feb. 24, 2004; and U.S. industry representatives, in-person andtelephone interviews by USITC staff, Jan.-Apr. 2004.
12 Counterfeiting is a term used to refer to the unauthorized use of a representation or copy of atrademark or service mark, although it is sometimes used to refer to an unauthorized copy of a protectedproduct. In addition to counterfeiting of the packaging, appearance, symbols, and other trademarkfeatures of entertainment products contained on such media as video cassettes, CDs and DVDs, suchcounterfeiting can also affect a broad range of products from a number of industries, including apparel,leather goods, toys, cigarettes, pharmaceuticals, beverages, and auto parts.
13 United States Trade Representative (USTR), 2004 National Trade Estimate Report on ForeignTrade Barriers, Mar. 31, 2004, pp. 13-14, found at http://www.ustr.gov, retrieved Apr. 2, 2004.
14 Also known as digital versatile discs.15 U.S. industry representatives report that as more Australian consumers obtain computers,
“peer-to-peer” piracy, including Internet file sharing, is growing, as “consumers are freely tradingbillions of dollars of content for free.” Hearing transcript at pp. 221 and 224; and U.S. industryrepresentatives, in-person and telephone interviews by USITC staff, Jan.-Apr. 2004.

109
Text box 6-1The WIPO Internet Treaties
The WIPO Copyright Treaty (WCT) and the WIPO Performances and Phonograms Treaty(WPPT) are often referred to as the “Internet Treaties” because they provide new internationalstandards for the protection of copyrights and related rights in the digital economy. The twotreaties entered into force on March 6 and May 20, 2002, respectively, once the requiredminimum 30 countries had ratified each.
The WCT provides that traditional means for copyright protection (for such products asbooks, movies, and software) should apply to works transmitted on the Internet orotherwise using digital media, technology, protections.
The WPPT similarly provides intellectual property protections to producers of soundrecordings, as well as performers, with respect to works on the Internet or inconnection with use of digital technology and media.
Both treaties clarify that traditional rights of reproduction continue to apply in thedigital environment, including the storage of material in digital form in an electronicmedium.
The treaties establish the right holders’ right to maintain control of their works over theInternet and across other digital transmission media.
The treaties ensure that right holders can use digital rights management technology toprotect their rights on the Internet. The treaties’ anti-circumvention provisions addresssecurity and intellectual property infringement risks by requiring that signatoriesprovide minimum levels of legal protection, including civil and criminal penalties,sufficient to deter the unauthorized circumvention of technical protective measures.
Another provision in the treaties requires signatory countries to prohibit the intentionalmodification or removal of digital rights management information. This includesprohibitions against interfering with information and data that can be incorporatedinto the digital code of a protected work and used “to identify the work, its author,performer or owner, the terms and conditions for its use, and any other relevantattributes.”
Australia has not yet ratified eitherof these treaties, while the UnitedStates has ratifiedboth. The United States implemented the treaties domestically via the DigitalMillennium Copyright Act of 1998.
Sources: Adapted, and parts excerpted, by USITC staff from information provided in the followingsources: Chris Gibson, Steptoe & Johnson, LLP, WIPO Internet Copyright Treaties Coming IntoForce, 2002, found at http://www.steptoe.com; and World Intellectual Property Organization(WIPO), “WIPO Copyright Treaty (adopted in Geneva on Dec. 20, 1996)” and “WIPO Performancesand Phonograms Treaty (WPPT) (adopted in Geneva on Dec. 20, 1996),” found athttp://www.wipo.org; retrieved Mar. 29, 2004.

110
also allegedly allows the parallel importation16 of goods that are produced for othermarkets.17 For instance, Australian entities have copied videocassettes from DVDsprogrammed for use only inNorth America18 allegedly infringing both copyrights andtrademarks of U.S. companies.19 This permits the importation of new entertainmentvideos and recordings20 to be sold in Australia before the official release date for suchmedia in that area.21
Meanwhile, movie producers indicate that installation of digital technologycircumvention tools in DVD players in Australia enables copyright and trademarkinfringers to produce and distribute videocassettes and DVD recordings of movies inAustralia not only several months prior to their scheduled release in that country, butsometimes even before the movie is scheduled to play for the first time in Australiantheaters.22 The U.S. entertainment industry also has expressed concerns about abusesin Internet-delivered programming and theft of movies and television programmingthrough circumvention of encrypted satellite signals.23 Australian legislation currentlydoes not provide for criminal or civil actions against end-users for the unlawfuldecoding of encrypted program-carrying television signals.24
16 Motion Picture Association of America (MPAA), “Anti-Piracy,” [undated], p. 6, found athttp://www.mpaa.org, retrieved Apr. 2, 2004.
17 Motion Picture Association of America (MPAA), “Australia,” Motion Picture Association - 2004Trade Barriers Report, 2004, p. 327; United States Trade Representative (USTR), 2004 National TradeEstimate Report on Foreign Trade Barriers, Mar. 31, 2004, pp. 13-14, found at http://www.ustr.gov,retrieved Apr. 2, 2004; and U.S. industry representatives, in-person and telephone interviews by USITCstaff, Jan.-Apr. 2004.
18 United States Trade Representative (USTR), 2004 National Trade Estimate Report on ForeignTrade Barriers, Mar. 31, 2004, pp. 13-14, found at http://www.ustr.gov, retrieved Apr. 2, 2004.
19 Copyright piracy and trademark counterfeiting can occur with reference to the same product. Forexample, “videocassette piracy is the illegal duplication, distribution, rental or sale of copyrightedvideocassettes.” Such “pirate product [s] [are] often packaged in counterfeit videocassette boxes thatresemble legitimate packaging.” Motion Picture Association of America (MPAA). Anti-Piracy [undated],pp. 1-7, found at http://www.mppa.org, retrieved Apr. 2, 2004.
20 Motion Picture Association of America (MPAA), “Anti-Piracy,” [undated], p. 6, found athttp://www.mpaa.org, retrieved Apr. 2, 2004.
21 According to U.S. government officials, until 1998, except in limited cases with respect to books,Australian law prohibited importation of copyrighted products without a license from the copyrightowner. However, in 1998, “Australia adopted legislation” removing the restrictions on parallel imports ofsound recordings, “then books, periodicals, sheet music, enhanced CDs, computer software, and someelectronic games” in 2003. Nasir Abbasi, U.S. & Foreign Commercial Service (US&FCS) and U.S.Department of State, “Australia Country Commercial Guide 2004,” US&FCS Market Research Reports,July 22, 2003, Ch. 7, pp. 73-74.
22 United States Trade Representative (USTR), 2004 National Trade Estimate Report on ForeignTrade Barriers, Apr. 2003, pp. 13-14, found at http://www.ustr.gov, retrieved Apr. 20, 2004; and U.S.industry representatives, telephone interviews by USITC staff, Jan.-Apr. 2004.
23 Motion Picture Association of America (MPAA), “2003 Australia Piracy Fact Sheet,” MPAWorldwide Market Research, Dec. 2003, pp. 1-2, found at http://www.mpaa.org, retrieved Feb. 24,2004; MPAA, “Statement on the US-Australia Free Trade Agreement,”Press Release, Feb. 9, 2004, p. 1,found at http://www.mpaa.org, retrieved Feb. 24, 2004; and U.S. copyright industry representatives,in-person and telephone interviews by USITC staff, Jan.-Apr. 2004.
24 Economic (CIE), Economic Analysis of AUSFTA, (Canberra and Sydney, Australia=CIE, April2004), pp. 34 and 35.

111
Patents and Trade SecretsAccording to U.S. industry representatives, Australia has a strong overall patent andtrade secret protection regime.25 Nevertheless, there remain lingering problems inboth of these areas. U.S. industry and government trade officials are especiallyconcerned that the Australian Government may allow domestic drug producers toconduct trials and produce generic equivalents of patented pharmaceuticals prior tothe expirationof thepatent holders’ rights to the legally sold drugs.26 This wouldpermitdomestic producers’ drugs to obtain Australian regulatory marketing approval inadvance of patent expiration so that generic equivalents could be sold immediatelyonce the patent had expired occurred.27 According to the industry representatives,allowing such “spring boarding”28 would allow Australian companies tomanufacturegeneric equivalents of patented drugs “for export in violation of TRIPs Article 28.”29
The U.S. industry also criticizes the lack of linkage between Australia’s patent officeand health care regulatory body, which could result in marketing approval beingprovided to patent infringing products.30
The U.S. agricultural and veterinary chemical industries have expressed concernsregarding unauthorized disclosure of their confidential trade secret information, suchas safety and test data. U.S. firms are required to submit such data to governmentagencies in support of their applications for marketing their products in Australia.Although legislation was enacted in Australia in 1999 to provide five years ofprotection of test data for the evaluation of new active constituents for agricultural andveterinary chemical products,31 U.S. Government trade officials state that “Australiadoes not yet have a system to provide protection for agricultural chemicals,”32 thus
25 Pharmaceutical Research and Manufacturers of America (PhRMA), “Australia,” National TradeEstimate Report on Foreign Trade Barriers (NTE) 2004, Report to USTR, Dec. 12, 2003, pp. 5-7, found athttp://www.phrma.org, retrieved Feb. 24, 2004; and U.S. industry representatives, interview by USITCstaff, Washington, D.C., Feb. 25, 2004.
26 United States Trade Representative (USTR), 2004 National Trade Estimate Report on ForeignTrade Barriers, Mar. 31, 2004, pp. 13-14, found at http://www.ustr.gov, retrieved Apr. 2, 2004; andU.S. pharmaceutical industry representatives, interview by USITC staff, Feb. 25, 2004.
27 United States Trade Representative (USTR), 2004 National Trade Estimate Report on ForeignTrade Barriers, Mar. 31, 2004, pp. 13-14, found at http://www.ustr.gov, retrieved Apr. 2, 2004; andU.S. pharmaceutical industry representatives, interview by USITC staff, Feb. 25, 2004.
28 United States Trade Representative (USTR), 2004 National Trade Estimate Report on ForeignTrade Barriers, Mar. 31, 2004, pp. 13-14, found at http://www.ustr.gov, retrieved Apr. 2, 2004.
29 Such exports could also be in violation of the “The WTO Appellate Body’s decision in Canada –Term of Patent Protection (AB-1998-3) that struck down a similar Canadian Scheme.” PharmaceuticalResearch and Manufacturers of America (PhRMA), “Australia,” National Trade Estimate Report onForeign Trade Barriers (NTE) 2004, Report to USTR, Dec. 12, 2003, pp. 5-7, found athttp://www.phrma.org, retrieved Feb. 20, 2004.
30 Pharmaceutical Research and Manufacturers of America (PhRMA), “Australia,” National TradeEstimate Report on Foreign Trade Barriers (NTE) 2004, Report to USTR, Dec. 12, 2003, pp. 5-7, found athttp://www.phrma.org, retrieved Feb. 20, 2004.
31 Nasir Abbasi, U.S. & Foreign Commercial Service (US&FCS) and U.S. Department of State,“Australia Country Commercial Guide 2004,” US&FCS Market Research Reports, July 22, 2003, Ch. 7,pp. 73-74.
32 United States Trade Representative (USTR), 2004 National Trade Estimate Report on ForeignTrade Barriers, Apr. 2004, pp. 13-14, found at http://www.ustr.gov, retrieved Apr. 2, 2004.

112
limiting the effectiveness of the 1999 legislation; however, such protection is expectedto be in place in the near future.33
EnforcementAlthough Australia’s IPR laws are generally comprehensive, U.S. industryrepresentatives argue that, in practice, enforcement at the Australian Federal andState levels requires strengthening.34 Major problems have been judicialinterpretation in State courts and “positions taken by the Australian Federal Police notto pursue criminal prosecution where civil remedies are available,”35 which haveweakened the deterrent effect of IPR enforcement policies.36 The U.S. copyrightindustry asserts that the Australian Government needs to make enforcement ofcopyright protection a higher priority at both the State and Federal levels.37 Thatindustry further contends that the Australian Government also needs to encourage itsjudicial system to impose criminal sentences, which provide a greater deterrent thancivil penaltiesaccomplish.38U.S. industry representatives furtherassert thatAustraliancustoms resources need to be increased for effective border enforcement againstimports of copyright and trademark infringing goods, such as pirated DVDs, CDs, andother recordings, and those bearing counterfeit marks, such as apparel, footwear,jewelry, cigarettes, and toys, imported primarily from Asian countries.39
Major Achievements in IPR Protection of the U.S.-Australia FTA
The U.S.-Australia FTA reaffirms the rights and obligations set forth in TRIPs, to whichboth the United States and Australia are bound. However, the FTA goes further thanTRIPs by (1) increasing protection of copyrights and trademarks in light of advances in
33 U.S. industry representatives, telephone interviews by USITC staff, Feb.-Apr. 2004.34 United States Trade Representative (USTR), 2004 National Trade Estimate Report on Foreign
Trade Barriers, Apr. 2004, pp. 13-14, found at http://www.ustr.gov, retrieved Apr. 20, 2004; and U.S.industry representatives, in-person and telephone interviews by USITC staff, Jan.-Apr. 2004. Australiahas not enacted legislation necessary to accede to the 1996 WIPO Copyright Treaty and WIPOPerformances and Phonograms Treaty
35 United States Trade Representative (USTR), 2003 National Trade Estimate Report on ForeignTrade Barriers, Apr. 2003, pp. 10-11, found at http://www.ustr.gov, retrieved Feb. 20, 2004; and U.S.industry representatives, in-person and telephone interviews by USITC staff, Jan.-Apr. 2004.
36 U.S. industry representatives, in-person and telephone interviews by USITC staff, Jan.-Apr. 2004.37 Motion Picture Association of America (MPAA), “Australia,” Motion Picture Association – 2004
Trade Barriers Report, 2004, p. 328; and U.S. industry representatives, in-person and telephoneinterviews by USITC staff, Jan.-Apr. 2004.
38 International Intellectual Property Alliance (IIPA), letter dated Jan. 21, 2003 from Steven J.Metalitz, IIPA, to Ms. Carmen Suro-Bredie, Chairman, Trade Policy Staff Committee, Office of the UnitedStates Trade Representative, p. 2, found at http://www.iipa.com, retrieved Feb. 23, 2004.
39 Motion Picture Association of America (MPAA), “2003 Australia Piracy Fact Sheet,” MPAAWorldwide Market Research, Dec. 2003, pp. 1-2, found at http://www.mpaa.org, retrieved Feb. 23,2004; and U.S. industry representatives, in-person and telephone interviews by USITC staff, Jan.-Feb.2004.

113
digital technology; (2) extending the terms of protection for copyrights, trademarks,patents, and trade secrets; and (3) increasing IPR enforcement for piracy andcounterfeiting.40
Copyrights, Trademarks, and Satellite Program SignalsAccording to U.S. industry representatives, an important accomplishment of theU.S.-Australia FTA is that it addresses Internet and other digital piracy41 by requiringAustralia “to ratify or accede to the [WIPO Internet Treaties] by the date of entry intoforce” of the FTA.42 In this regard, the FTA provides strict legal protections andremedies against the circumvention of technological measures used by copyrightholders to prevent piracy and unauthorized distribution of copyrighted materials overthe Internet.43 Further, the FTA provides that only copyright owners have the right tomake their works available online. Such copyright holders retain all rights to copies,including temporary copies, of their works on computers and networks, whichprecludes unauthorized sharing of copyrighted material (including music, videos,software, and text) on the Internet.44 In addition, the FTA clarifies the extent to whichliability accrues to Internet service providers for copyright infringement by theirsubscribers.45 Also, protection for encrypted program-carrying satellite signals isprovided to both the signals and the programming, in order to deter piracy of satellite
40 Motion Picture Association of America (MPAA), “Statement on the US-Australia Free TradeAgreement,”Press Release, Feb. 9, 2004, p. 1, found at http://www.mpaa.org, retrieved Feb. 24, 2004;U.S. copyright industry representatives, in-person and telephone interviews by USITC staff, Jan.-Feb.2004; United States Trade Representative (USTR), “Free Trade ‘Down Under’: Summary of theU.S.-Australia Free Trade Agreement,” Trade Facts, Feb. 8, 2004, pp. 5-7, found athttp://www.ustr.gov, retrieved Feb. 24, 2004; United States Trade Representative (USTR) 2004National Trade Estimate Report on Foreign Trade Barriers, Mar. 31, 2004, pp. 13-14, found athttp://www.ustr.gov, retrieved Apr. 2, 2004; Australian Department of Foreign Affairs and Trade,“Australia-United States Free Trade Agreement,” Media Release, Feb. 8, 2004, p, 1, found athttp://www.dfat.gov.au, retrieved Feb. 23, 2004; and Albert Yuen, “Australia US Free TradeAgreement–IP Implications,” Country File: Australia (Sydney, Australia: Coudert Brothers, Global LegalAdvisers, Mar. 2004), p. 57, found at http://www.coudert.com, retrieved Mar. 10, 2004.
41 Hearing transcript at pp. 183 and 199.42 Industry Functional Advisory Group (IFAC-3) on Intellectual Property Rights for Trade Policy
Matters, The U.S.-Australia Free Trade Agreement (FTA): The Intellectual Property Provisions, Mar. 12,2004, pp. 8-10, found at http://www.ustr.gov, retrieved Mar. 17, 2004; International IntellectualProperty Alliance, written statement to Secretary, U.S. International Trade Commission, Mar. 22, 2004,p. 2; and U.S. copyright industry representatives, in-person and telephone interviews by USITC staff,Jan.-Feb. 2004.
43 Hearing transcript at pp. 183, 214, and 241; and United States Trade Representative (USTR),“Free Trade ‘Down Under’: Summary of the U.S.-Australia Free Trade Agreement,” Trade Facts, Feb. 8,2004, pp. 5-7, found at http://www.ustr.gov, retrieved Feb. 20, 2004.
44 International Intellectual Property Alliance, written statement to Secretary, U.S. InternationalTrade Commission, Mar. 22, 2004, p. 2.
45 Albert Yuen, “Australia US Free Trade Agreement–IP Implications,” Country File: Australia(Sydney, Australia: Coudert Brothers, Global Legal Advisers, Mar. 2004), p. 57, found athttp://www.coudert.com, retrieved Mar. 10, 2004.
114
television programming.46 To reinforce this provision, both Australia and the UnitedStates affirmed in the FTA that they had “ratified or acceded to” the 1974 BrusselsConvention Relating to the Distribution of Programme-Carrying Signals Transmittedby Satellite.47 The FTA also requires government involvement related to unauthorizeduse of trademarked names by non-right holders in Internet domain names.48
The FTA extends copyright terms of protection beyond those required by TRIPs49 andunder current Australian law.50 Under the FTA, in instances where the term ofprotection of a work (including a photographic work), performance, or phonogram isto be calculated on the basis of a person’s life, the term shall be not less than the life ofthe author and 70 years after the author’s death. There are no corresponding terms ofprotection based on the life of the author explicitly provided for in TRIPs. However, byreference to the Berne Convention, the term of protection in TRIPs is life of the authorand 50 years after his or her death.51 In cases where the term of protection of a work istobe calculated ona basis other than the life of a person, the term in the FTA is 70yearsfrom the end of the calendar year of the first authorized publication of the work. Thecomparable period of protection in TRIPs is 50 years and does not apply tophotographic works. Finally, if there is no such authorized publication within 50 yearsfrom the creation of a work, performance, or phonogram, the FTA term of protection isto be not less than 70 years from the end of the calendar year of the creation of thework. Again, the comparable period of protection in TRIPs is 50 years and does notapply to photographic works.
46 Hearing transcript at p. 214; and United States Trade Representative (USTR), “Free Trade $DownUnder’: Summary of the U.S.-Australia Free Trade Agreement,” Trade Facts, Feb. 8, 2004, pp. 5-7,found at http://www.ustr.gov, retrieved Feb. 20, 2004.
47 U.S.-Australia FTA Article 17.1 2. (b).48 Article 17.3 of the FTA provides, among other things, that each party “shall require that the
management of the country-code top-level domain (ccTLD) provide appropriate procedures for thesettlement of disputes, based on the principles established in the Uniform Domain-NameDispute-Resolution Policy (UDRP), in order to address the problem of trademark cyber-piracy.”
49 Hearing transcript at p. 183; Australian Department of Foreign Affairs and Trade,“Australia-United States Free Trade Agreement,” Media Release, Feb. 8, 2004, p. 1, found athttp://www.dfat.gov.au, retrieved Feb. 23, 2004; and Albert Yuen, “Australia US Free TradeAgreement – IP Implications,” Country File: Australia (Sydney, Australia: Coudert Brothers, Global LegalAdvisers, Mar. 2004), p. 57, found at http://www.coudert.com, retrieved Mar. 10, 2004.
50 According to Australian legal professionals, copyright protection in Australia currently is “life ofthe author plus 50 years for copyrighted works, including phonograms.” Albert Yuen, “Australia US FreeTrade Agreement – IP Implications,” Country File: Australia (Sydney, Australia: Coudert Brothers, GlobalLegal Advisers, Mar. 2004, p. 57, found at http://www.coudert.com, retrieved Mar. 10, 2004. Also seeNasir Abbasi, U.S. & Foreign Commercial Service (US&FCS) and U.S. Department of State, “AustraliaCountry Commercial Guide 2004,” US&FCS Market Research Reports, July 22, 2003, Ch. 7, pp. 73-74;and Centre for International Economics (CIE), Economic Analysis of AUSFTA, (Canberra and Sydney,Australia=CIE, April 2004), pp. 35-37.
51 Although the term of protection based on the life of a natural person is not specifically stated in theWTO TRIPs agreement, Article 9 of that agreement specifies that WTO members shall comply withArticles 1-21 of the Berne Convention for the Protection of Literary and Artistic Works (1971). Article 7 ofthe Berne Convention provides that “the term of protection granted by this Convention shall be the life ofthe author and fifty years after his death.” For more information on the Berne Convention, seehttp://www.wipo.org.

115
Patents and Trade SecretsThe FTA also extends patent and trade secret protections beyond TRIPs and otherapplicable international agreements.52 Patent terms can be restored beyond the20-year TRIPs requirement when delays in the regulatory approval process result in“an unreasonable consumption of the patent term.”53 The FTA also ensures thatgovernment product approval agencies deny marketing approval to patent-violatingproducts. Test data and trade secrets submitted for the purpose of marketing approvalare protected against disclosure for 5 years for pharmaceuticals and 10 years foragricultural chemicals.54 U.S. industry representatives also noted their satisfaction“that the FTA confirms that patents will be available for all products and processes andfor any uses or methods of using a known product.... and “validates the importance ofextending, without exclusion, broad patent eligibility for biotechnology products,” anarea of U.S. competitive strength.55 To reinforce some of these provisions, Australiaalso affirmed in the FTA that it had “ratified or acceded to” the 1970 PatentCooperation Treaty and the 1994 Trademark Law Treaty.56
EnforcementAustralia’s IPRenforcementmeasuresare strengthenedby the FTA.57 For instance, theFTA requires both statutory and actual damages for copyright piracy and trademarkcounterfeiting.58 This is expected to deter IPR infringement and allow monetarydamages to be awarded even when actual economic harm cannot be calculated.59 To
52 United States Trade Representative (USTR), “Free Trade $Down Under’: Summary of theU.S.-Australia Free Trade Agreement,” Trade Facts, Feb. 8, 2004, pp. 5-7, found athttp://www.ustr.gov, retrieved Feb. 20, 2004; and Australian Department of Foreign Affairs and Trade,“Australia-United States Free Trade Agreement,” Media Release, Feb. 8, 2004, p. 1, found athttp://www.dfat.gov.au, retrieved Feb. 23, 2004.
53 The U.S.-Australia Free Trade Agreement (FTA), Report of the Industry Sector Advisory Committeefor Chemicals and Allied Products (ISAC-3), Mar. 12, 2004, pp. 9-19, found at http://www.ustr.gov,retrieved Mar. 22, 2004; and Centre for International Economics (CIE), Economic Analysis of AUSFTA,(Canberra and Sydney, Australia=CIE, April 2004), pp. 41-42.
54 Pharmaceutical Research and Manufacturers of America (PhRMA), “Australia,” PhRMA Special301 Submission, Mar. 31, 2003, pp. 5-7, found at http://www.phrma.org, retrieved Apr. 8, 2003; andAlbert Yuen, “Australia US Free Trade Agreement – IP Implications,” Country File: Australia (Sydney,Australia: Coudert Brothers, Global Legal Advisers, Mar. 2004), p. 57, found athttp://www.coudert.com, retrieved Mar. 10, 2004.
55 Industry Functional Advisory Group on Intellectual Property Rights for Trade Policy Matters(IFAC-3), The U.S.-Australia Free Trade Agreement (FTA): The Intellectual Property Provisions, Mar. 12,2004, pp. 11, found at http://www.ustr.gov, retrieved Mar. 17, 2004.
56 U.S.-Australia FTA Article 17.1 2. (A) and (f).57 Albert Yuen, “Australia US Free Trade Agreement –IP Implications,” Country File: Australia
(Sydney, Australia: Coudert Brothers, Global Legal Advisers, Mar. 2004, p. 57, found athttp://www.coudert.com, retrieved Mar. 10, 2004; and United States Trade Representative (USTR),“Free Trade ‘Down Under’: Summary of the U.S.-Australia Free Trade Agreement,” Trade Facts, Feb. 8,2004, pp. 5-7, found at http://www.ustr.gov, retrieved Feb. 20, 2004.
58 Hearing transcript at p. 184; and International Intellectual Property Alliance (IIPA), pre-hearingstatement to Secretary, U.S. International Trade Commission, Mar. 22, 2004, p. 3.
59 United States Trade Representative (USTR), “Free Trade $Down Under’: Summary of theU.S.-Australia Free Trade Agreement,” Trade Facts, Feb. 8, 2004, pp. 5-7, found athttp://www.ustr.gov, retrieved Feb. 24, 2004.

116
further deter copyright and trademark infringement, the FTA applies criminalprocedures and penalties in cases of wilful trademark counterfeiting or copyrightpiracy and by making end-use of pirated or counterfeited products a criminal offense.Enforcement stipulations of the FTA also require that provisions be made for theseizure, forfeiture, and destruction of counterfeit and pirated goods and theequipment used to produce them.60 Further, IPR laws are to be enforced not onlyagainst infringement originating within each country, but also against goods in transitto deter violators from using their ports or free trade zones to traffic in piratedproducts.61 Finally, police and border agents are provided with greater authority topursue IPR criminal enforcement actions on their own initiative.62
Potential Effects on the U.S. Economy
The intellectual property provisions of the U.S.-Australia FTA address manyof the mostsignificant concerns that U.S. industry representatives have expressed regardingAustralia’s IPR regime.63 The FTA is expected to result in increased revenues for U.S.industries dependent on copyrights, trademarks, patents, and trade secrets. However,owing to the much smaller size of the Australian economy compared to that of theUnited States, and the relatively small contributionofAustralia toU.S. IPR receipts fromthe world (figure 6-1), any increases in revenues for the U.S. IPR industries likely wouldhave a limited effect on U.S. IPR-related industries and the U.S. economy as a whole.
Among the U.S. copyright industries that would potentially benefit most due to theincreased digital technology features of the FTA are the motion picture, soundrecording, business software applications, entertainment software, and bookpublishing industries. Industries that might benefit from the greater patent and tradesecret protections, including the protection of confidential data, are thepharmaceutical and agricultural chemicals industries. A broad range of U.S.
60 Hearing transcript at p. 184; U.S. industry representatives, telephone interviews by USITC staff,Jan-Apr. 2004; and United States Trade Representative (USTR), “Free Trade $Down Under’: Summary ofthe U.S.-Australia Free Trade Agreement,” Trade Facts, Feb. 8, 2004, pp. 5-7, found athttp://www.ustr.gov, retrieved Feb. 20, 2004.
61 United States Trade Representative (USTR), “Free Trade $Down Under’: Summary of theU.S.-Australia Free Trade Agreement,” Trade Facts, Feb. 8, 2004, pp. 5-7, found athttp://www.ustr.gov, retrieved Feb. 20, 2004.
62 FTA Article 17.11, 22.63 Hearing transcript at pp. 184 and 197; Motion Picture Association of America (MPAA), “MPAA
Statement on the US-Australia Free Trade Agreement,” Press Release, Feb. 9, 2004, p. 1, found athttp://www.mpaa.org, retrieved Feb. 19, 2004; Recording Industry Association of America (RIAA),“RIAA Applauds Conclusion of U.S.-Australia Free Trade Agreement,” News Release, Feb. 10, 2004, p.1, found at http://www.riaa.com, retrieved Feb. 19, 2004; International Intellectual Property Alliance,pre-hearing statement to Secretary, U.S. International Trade Commission (USITC), Mar. 22, 2004, pp1-4; United States Trade Representative (USTR), “Free Trade $Down Under’: Summary of theU.S.-Australia Free Trade Agreement,” Trade Facts, Feb. 8, 2004, pp. 5-7, found athttp://www.ustr.gov, retrieved Feb. 24, 2004; and Australian Department of Foreign Affairs and Trade,“Australia-United States Free Trade Agreement,” Media Release, Feb. 8, 2004, p. 1, found athttp://www.dfat.gov.au, retrieved Feb. 24, 2004.

117
0.0
0.5
1.0
1.5
2.0
1998 1999 2000 2001 20020
200
400
600
800
1000
Figure 6-1U.S. royalties and license fees from Australia, by value, and as a percent of totalU.S. royalties and license fees from the world
Source: U.S. Department of Commerce, Bureau of Economic Analysis, Survey of Current Business,Oct. 2003.
Million dollars Percent
U.S. royalties and license fees from Australia (Y1)As a percent of U.S. royalties and licensing fees fromthe world (Y2)
industries should benefit from strengthened trademark and other IPR provisions of theFTA. By comparison, because the United States already meets the relatively highstandards of IPR protection and enforcement included in the U.S.-Australia FTA, therewould be little if any effect on U.S. industries or the U.S. economy based on U.S.implementation of its obligations under the FTA provisions.
A U.S. trade advisory committee representing a broad range of U.S. IPR interestsstated that it strongly supported the U.S.-Australia FTA chapter on intellectual propertyand believes that, as a whole, it “establishes key precedential provisions to be includedin the other FTAs now being negotiated, including the Free Trade Agreement of theAmericas (FTAA).”64 However, committee members said they would have preferredmore specific language in the agreement with regard to prohibition and cancellationof trademark registrations and recordals for products that are identical or similar to
64 Industry Functional Advisory Group (IFAC-3) on Intellectual Property Rights for Trade PolicyMatters , The U.S.-Australia Free Trade Agreement (FTA): The Intellectual Property Provisions, Mar. 12,2004, pp. 1-22, found at http://www.ustr.gov, retrieved Mar. 17, 2004.
65 Industry Functional Advisory Group on Intellectual Property Rights for Trade Policy Matters(IFAC-3), The U.S.-Australia Free Trade Agreement (FTA): The Intellectual Property Provisions, Mar. 12,2004, p. 10, found at http://www.ustr.gov, retrieved Mar. 17, 2004.

118
products with well-known marks. They also would have preferred that the FTA hadaddressed U.S. copyright owners’ requests for a provision requiring each party toprevent distribution of copyrighted products in markets for which they were notintended.65 Accordingly, they would like the United States to continue to pursue thoseand several other issues not resolved in the U.S.-Australia FTA in future FTAs. Anothertrade advisorygroup, representing the chemical industry and allied products industry,also supported the FTA, including improvements it provides for in trademark, patent,and data protection.66 Finally, although generally very pleased with the FTA’s IPRprovisions, U.S. sound recording industry representatives would have preferred thatthe final FTA had provided for national treatment of U.S. producers of soundrecordings with respect to being able to distribute their products and services throughtraditional broadcasting channels.67
66 Industry Sector Advisory Committee for Chemicals and Allied Products (ISAC-3), “Chapter 17:Intellectual Property,” The U.S.-Australia Free Trade Agreement (FTA), Mar. 12, 2004, pp. 9-10, found athttp://www.ustr.gov, retrieved Mar. 22, 2004.
67 Hearing transcript at pp. 183, 184, 219, and 220; and International Intellectual Property Alliance(IIPA), pre-hearing statement, U.S.-Australia Free Trade Agreement: Potential Economywide andSelected Sectoral Effects, 69 Fed. Reg. 10755 (March 8, 2004), Investigation No. TA-2104-11, Mar. 22,2004, p. 3.
119
CHAPTER 7Other Potential Effects of the U.S.-Australia FTA
The chapters of the Agreement covered in this chapter are: customs administration(chapter 6), technical barriers to trade (chapter 8), trade remedies and safeguards(chapter 9), competition policy (chapter 14), government procurement (chapter 15),electronic commerce (chapter 16), labor (chapter 18), environment (chapter 19),transparency issues (chapter 20), and other institutional arrangements and disputesettlement (chapter 21). Some of the elements of these FTA chapters have been coveredelsewhere in this report, when feasible (e.g., IPR, trade in services).
Because of data limitations, the discussion in this chapter relies on the public record forassessments of these elements of the FTA. The chapter sets out U.S. negotiating areasand objectives for the U.S.-Australia FTA, followed by overall judgments on theAgreement rendered by the advisory trade committees established by the U.S.Congress. Views on the Agreement’s advantages and disadvantages as raised bypanelists at the public hearing held by the United States International TradeCommission on March 30, 2004, concerning the U.S.-Australia FTA are includedwhere germane. See chapter 9 of this report for the positions of the interested partiesthat testified before the Commission. Where available, other public sources also arereviewed, such as a recent report done for the Australian Department of ForeignAffairs and Trade on the U.S.-Australia FTA.1
The U.S. negotiating areas and objectives for the U.S.-Australia FTA were put forwardby the United States Trade Representative to the leaders of Congress in the ExecutiveBranch notification to the Congress of intent to pursue negotiation of a bilateral freetrade agreement with Australia.2 Once an FTA has been negotiated, the elements ofthe U.S. Government advisory committee system submit formal reports regarding thelikely effects–both benefits and drawbacks–of the agreement reached.
The advisory committee system was established by the Congress under the Trade Act of1974 to ensure that U.S. trade policy and trade negotiating objectives adequatelyreflect U.S. public and private sector interests.At the time theadvisory committeeswere
1 Centre for International Economics (CIE), Economic Analysis of AUSFTA – Impact of the bilateralfree trade agreement with the United States, prepared for the Australian Department of Foreign Affairsand Trade, April 2004 (CIE:Canberra, 2004). The CIE report grapples as well with the difficulty of tryingto measure nonquantifiable aspects of the agreement. An overall message that emerges from the reportcan be broadly stated that the nonquantifiable provisions in the agreement provide an improved legaland business framework, which reduces the transaction costs for firms and increases decisionmakingcertainty for firms and investors, which thereby promotes increased investment opportunities by loweringany risk premiums associated with uncertainty over these business transactions.
2 USTR Zoellick, notification letters to Congress of intent to initiate free trade agreement negotiationswith Australia, Nov. 13, 2002, found at Internet addresses http://www.ustr.gov/releases/2002/11/2002-11-13-australia-byrd.pdf, and http://www.ustr.gov/releases/2002/11/2002-11-13-australia-hastert.pdf.

120
considering the U.S.-Australia FTA, there existed 32 advisory committees, with a totalmembership of up to 1,000 advisors. The trade policy advisory system is arranged inthree tiers.3 At the highest tier is the Advisory Committee on Trade Policy andNegotiations (ACTPN), which consists of up to 45 members appointed by the Presidentwhoare broadly representative of key economic sectors affected by trade. The ACTPNexamines U.S. trade policy and agreements from the broad context of the overallnational interest. At the second tier, the Policy Advisory Committees are appointed bythe USTR or in conjunctionwith otherCabinet offices. Among these are the AgriculturalPolicy Advisory Committee (APAC), Intergovernmental Policy Advisory Committee(IGPAC), Labor Policy Advisory Committee (LAC), and Trade and Environment PolicyAdvisory Committee (TEPAC), where each committee provides advice based upon theperspective of its specific area. At the third tier are 27 sectoral, functional, andtechnical advisory committees, organized in two areas–agriculture and industry–andappointed by USTR and the Secretary of Agriculture or Commerce, respectively.4
Where the advisory committees express a view of results achieved (or not achieved),their assessment follows on from the administration’s stated negotiating objectives forthat area. In negotiating areas that pertain more to public rather than private sectorinterests–for example, government policy on safeguards or competition policy–theadvisory committees at times have expressed little or no opinion.
Customs Administration
U.S. negotiating objectives for the U.S.-Australia FTA were to (1) seek rules to requirethat Australia’s customs operations are conducted with transparency, efficiency, andpredictability, and that customs laws, regulations, decisions, and rulings are notapplied in a manner that would create unwarranted procedural obstacles tointernational trade; and (2) seek rules of origin, procedures for applying these rules,and provisions to address circumvention matters that will ensure that preferential dutyrates under the FTA with Australia apply only to goods eligible to receive suchtreatment, without creating unnecessary obstacles to trade.
The ACTPN report addressing the U.S.-Australian FTA concluded that the Agreementmakes significant advances regarding customs procedures and rules of origin that arelikely to expedite the processing of customs.5 The specificity of obligations in theAgreement regarding customs procedures set a high standard, particularly whencoupled with the commitments to facilitate express shipment and to share information
3 USTR, “Trade Policy Development,” 2004 Trade Policy Agenda and 2003 Annual Report, March2004 (GPO: Washington, D.C., 2004), pp. 233-35.
4 Each committee provides specific technical advice concerning the effect that trade policy decisionsmay have on its sector, such as grains and oilseeds or textiles.
5 Advisory Committee for Trade Policy and Negotiations, Report to the President, the Congress, andthe United States Trade Representative on the U.S.- Australia Free Trade Agreement, Mar. 12, 2004,found at Internet address http://www.ustr.gov/new/fta/Australia/advisor/actpn.pdf, retrieved onApr. 19, 2004.

121
to combat illegal transshipment of goods. The Agreement provides steps to ensuretransparency and efficiency of these customs procedures. The Agreement alsoprovides for the quick release of goods, within 48 hours where possible. Withoutmaking comments applicable to specific industry sectors or products, the ACTPNrecommends that all negotiated FTAs include rules of origin that balance thedesirability of promoting the sourcing of rawmaterials within the relevant territorywithrules that permit U.S. businesses the flexibility and opportunity to take full advantageofthe Agreement.
The Industry Functional Advisory Committee on Customs Matters (IFAC-1) is a morespecialized advisory panel reporting to the President and Congress, involved with allaspects of the process of importing and exporting goods through customsservices–whether domestic or foreign–and with facilitation of the movement of goodsinto and out of customs.6 While a number of areas negotiated as part of theAgreement could have customs implications, the IFAC-1 committee focused on severalpriority areas of concern: (1) the functions of the import process and how it isadministered, which can either make the Agreement more successful for the benefit oftraders or, alternatively, can undermine benefits of the Agreement by helpingmaintain nontariff barriers to that trade; (2) ensuring that the rules and regulations aretransparent and understandable to all traders including small- and medium-sizedenterprises; and (3) ensuring that the Agreement included a mechanism to keeppractices for import and export current with business “best practices.”
The IFAC-1 committee highlighted that Australia has acustoms regime that is inherentlymore sophisticated than those of most other nations with whom the United States hasentered into free trade agreements. U.S. negotiators met regularly with the committeeand solicited advice, as well as responding well to the unsolicited advice from thecommittee. As a result, the IFAC-1 committee considered that the Agreement providesequity and reciprocity in the customs areas.
Regarding the general provisions of the Agreement, the IFAC-1 committee noted thatthe FTA contains many of the current “best practices” concepts in the generalprovisions of the customs section. Such practices include the utilization of riskassessment as a tool to enable customs officials to concentrate on high-risk shipments,and the provision of expedited procedures in connection with express shipments. TheAgreement also implements the 48-hour release of goods standard and provides forthe use of various surety or security mechanisms (e.g. bonds) in connection with therelease of goods. The Agreement also provides for the establishment of procedures toobtain advance rulings, and provides for the review and appeal of such rulings.
Regarding the definitions in the Agreement, the committee noted that the FTA providesclear and beneficial descriptions for the terms temporary admission, waste and scrap,
6 Industry Functional Advisory Committee on Customs Matters, IFAC 1 Advisory Committee Report tothe President, the Congress, and the United States Trade Representative on the U.S. –Australia Free TradeAgreement, Mar. 12, 2004, found at Internet address http://www.ustr.gov/new/fta/Australia/advisor/ifac01.pdf, retrieved on Apr. 19, 2004.

122
used goods, recovered goods, and especially remanufactured products in thedefinitions section.
Regarding rules of origin, the committee found that the Agreement provides a processfor clear rules, ability to request advance rulings, and an avenue for appeal of suchrulings. The general provisions also provide for de minimis nonoriginatingcomponents and permits use of the concept of accumulation. The Agreement’s strongadvance ruling provisions permit the use of advance rulings with respect to origindeterminations. The IFAC-1 committee noted that it reviewed this section for process,leaving judgment aside on the application of the rules to individual sectors with morespecific criteria.
Regarding the certification of origin, the IFAC-1 committee noted that the Agreementcontains excellent provisions for handling claims for preferential treatment. Uponrequest, claims may be made in the form of statements, and need not be made in aprescribed format. Statements may be submitted electronically. Accordingly, theseprocedures are less burdensome than those in earlier agreements.
Regarding customs valuation, the FTA sets forth the obligation on the part of the twoparties to apply the provisions of the WTO Agreement on the Implementation ofArticleVII of GATT 1994 (the WTO Customs Valuation Agreement). The U.S.-Australia FTAfurther recognizes the principle that software should be valued on the basis of thevalue of the carrier media. According to the report, these are both important andlongstanding objectives sought by the committee.
Regardingdispute resolution, the committee finds theAgreement’s procedure for this iswell thought out and appears workable, according to the IFAC-1 committee report.
Regarding trade facilitation, the Agreement includes provisions designed to facilitatethe international movement of goods. The committee noted that trade facilitation is anabsolutely essential ingredient of trade negotiations, especially given the recentsluggishness in the global economy. The Agreement’s provisions focus on thesimplification and harmonization of customs procedures and practices. Theseprovisions aim for the procedures to be transparent and predictable. The Agreementalso requires the parties to maintain appropriate measures to ensure efficient and faircustoms facilitation of goods that are imported and/or exported by express deliveryservices suppliers.7
Regarding other provisions, the committee finds that the FTA includes other provisionsas well that address drawback, alteration and repair, remanufactured goods, userfees, import pricing, and licensing–all objectives of the IFAC-1 committee. Thecommittee expressed particular satisfaction that the Agreement retained dutydrawback for those who qualify.
7 IFAC-1 committee members expressed the view, however, that the agreement’s six-hour target forrelease of express shipments should be reduced, preferably to three hours or less.

123
Laura Lane, of Time Warner, testified that her company’s support for theU.S.-Australia FTA represents the support from members of the Entertainment IndustryCoalition for Free Trade–those who produce, distribute, and exhibit creativeproductions such as motion pictures, television programs, video entertainment,recorded music, and the like.8 In addition to the Agreement’s strong intellectualproperty protections, she highlighted that rules for customs valuation require valuationof content-based goods, such as films or music CDs, to be based on the value of thecarrier media rather than be dependent on an artificial valuation based on projectedrevenues of the media content of the good. This will set a precedent for similarnegotiations with other countries in the region, as well as in the WTO where valuationproblems persist.9
Stephen Collins, of the Automotive Trade Policy Council, testified that his council’sstrong support for the Agreement was based in part on the view that greaterintegration of manufacturing, distribution, sales, financing, service, and relatedoperations would promote growth and efficiency in the markets of both parties to theAgreement.10 He outlined briefly how the rule of origin specific to automotive productswas similar to those included in other FTAs signed by Australia as well as theU.S.-Central America FTA automotive rule of origin.
Frank Vargo, representing the National Association of Manufacturers (NAM),reported that the FTA’s customs chapter will facilitate trade between the two countries,as a result of the specific obligations on customs procedures found in the customsprovisions, along with the commitments to share information to combat illegaltransshipment of goods and to facilitate express shipments.11 He pointed out inparticular the Agreement’s provision for the quick release of goods, within 48 hourswhere possible, which is of particular importance to express delivery services that areoften small- and medium-sized U.S. companies.
Technical Barriers to Trade
U.S. negotiating objectives were to (1) seek to have Australia reaffirm its commitmentsunder the WTO Agreement on Technical Barriers to Trade (TBT)–the WTO TBTAgreement, or WTO Standards Agreement–including those relating to labelingrequirements for U.S. food and agricultural products produced throughbiotechnology, and to eliminate any unjustified TBT measures; and (2) seek to
8 Laura Lane, Time Warner Inc., submission to the Commission, p. 1.9 Ibid., p. 3, par. 5.10 Stephen Collins, Automotive Trade Policy Council, submission to the Commission concerning the
U.S.-Australia Free Trade Agreement: Potential Economy-wide and Selected Sectoral Effects(Investigation No. TA-2104-11), Mar. 30, 2004, pp. 2-3.
11 Franklin Vargo, National Association of Manufacturers, submission to the Commissionconcerning the U.S.-Australia Free Trade Agreement: Potential Economy-wide and Selected SectoralEffects (Investigation No. TA-2104-11), Mar. 30, 2004, p. 5.

124
strengthen collaborationwith Australia on implementationof theWTOTBTAgreementand create a procedure for exchanging information with Australia on TBT-relatedissues.
The ACTPN report concludes that the U.S.-Australia FTA contains provisions forreinforcing the WTO TBT Agreement, and for promoting improvements in bilateralimplementation of the TBT Agreement. The ACTPN noted that duty drawback anddeferral programs were retained in the U.S.-Australia FTA for the exporters of bothcountries.
The Industry Functional Advisory Committee on Standards (IFAC-2) provides detailedpolicy and technical advice, information, and recommendations to the President andCongress, regarding certain trade barriers as well as the implementation ofnegotiated trade agreements.12 The IFAC-2 committee sought U.S. negotiations thatwould (1) reinforce transparency obligations that specifically require agencies todisclose and/or publish along with any final rulings the response to commentsreceived on proposed technical regulations; (2) seek national treatment in a bindingsense;13 (3) seek an opportunity for direct participation on a nondiscriminatory basisin the development of standards-related measures (not covered by WTO rules, butsuch as found in NAFTA Article 909.7); and (4) seek to establish an informalmechanism for the rapid resolution of disputes. In its report, the IFAC-2 committeefound that the U.S.-Australia FTA addresses these goals, providing for equity andreciprocity regarding standards and technical barriers to trade, and therebyeffectively promotes the economic interests of the United States overall. The committeenoted inparticular that the 5-year implementationperiod for transparencyobligationsfound in the U.S.-Chile FTA was removed from the U.S.-Australia FTA, which providesimmediate implementation.
Frank Vargo, representing NAM, noted that the Agreement represents anunparalleled achievement for America’s manufacturers.14 Regarding technicalbarriers to trade, he pointed out that the FTA reinforces the operation of the WTO TBTAgreement’s provisions between the United States and Australia, helping preventtechnical standards and regulations from becoming a nontariff barrier to tradebetween the two countries. He remarked that the U.S.-Australia FTA provides theopportunity to go beyond the WTO TBT Agreement, to find ways to streamline thestandards regulating conformity assessment that could be very important tosimplifying trade.
12 Industry Functional Advisory Committee on Standards, Industry Functional Advisory Committeeon Standards (IFAC 2) Advisory Committee Report to the President, the Congress and the United StatesTrade Representative on the U.S.-Australia Free Trade Agreement (FTA), Mar. 9, 2004, found at Internetaddress http://www.ustr.gov/new/fta/Australia/advisor/ifac02.pdf, retrieved on Apr. 19, 2004.
13 The IFAC-2 committee was opposed to having any transition period as was negotiated withMexico under the North American Free Trade Agreement (NAFTA), which the committee sees expressedcurrently as a weak obligation under WTO TBT Article 6.4, and as a binding obligation in NAFTA Article908.2. The committee also supported U.S. negotiations to acknowledge alternative approaches toconformity assessment.
14 Franklin Vargo, submission to the Commission, p. 4.

125
Trade Remedies/Safeguards
U.S. negotiating objectives were to (1) provide a bilateral safeguard mechanismduring the transition period; and (2) make no changes to U.S. antidumping andcountervailing duty laws. The completed Agreement provides for a framework duringthe 10-year transition period (unless the phase-out of duties is stipulated to be longer)whereby the parties can impose a safeguard measure that suspends staged decreasesin or increases a duty rate. A safeguard may only be imposed for two years, with thepossibility of a 2-year extension. The parties must, however, progressively liberalizesuch measures and return the duty rate to the level that would have applied without thesafeguard by the end point. The United States already employs such procedures underexisting law. Under the FTA, each party retains all rights and obligations of the WTOAgreement on Safeguards, but gains no additional rights or obligations.
Competition Policy
U.S. negotiating objectives were to (1) address issues of anticompetitive businessconduct, state monopolies, and state enterprises; and (2) seek cooperation andconsultation provisions that foster cooperation on competition law and policy, and thatprovide for consultations on specific problems that may arise. Under the Agreement,the parties would be required to adopt or maintain measures to proscribeanticompetitive business conduct, and to take appropriate action with respect to suchconduct. The parties must also under the Agreement establish or maintain an authorityresponsible for the enforcement of such measures. The U.S.-Australia FTA provides forcooperation, transparency, information requests, and consultations, and itemphasizes consumer protection.
A recent report done for the AustralianDepartment of Foreign Affairs and Trade notesthat the competition policy provisions largely reflect existing legislation, but that thevalue of these measures is to provide additional certainty to firms operating in bothcountries that these competition measures will be maintained.15 The report indicatesthat the agreement also addresses more directly cross-border dimensions ofcompetition and consumers protection, and provides for cooperation oncompetition-related issues intended toprotect firmsoperating inone another’smarketsand consumers purchasing goods and services from each market from unfaircompetition dealings.
15 Centre for International Economics, Economic Analysis of AUSFTA, pp. 48-49.

126
Government Procurement
U.S. negotiating objectives were to (1) seek to establish rules requiring that Australia’sprocurement practices be fair, transparent, and predictable for suppliers of U.S.goods and services who seek to do business with the Australian government; and (2)seek to expand access for U.S. goods and services to Australian governmentprocurement markets.
The ACTPN report concludes that the FTA makes significant advances in providingaccess for U.S. companies to a considerable part of Australia’s governmentprocurement market. The Agreement allows U.S. firms competitive entry toprocurement by Australian central government entities. The report indicates that this isan especially important accomplishment since Australia is not a signatory to the WTOAgreement on Government Procurement, meaning that these advantages are notavailable to competitors in the Australian market. Importantly, Australia will no longerapply provisions for local manufacturing or local content requirements to U.S. firms.Australia will also restrict its use of selective tendering provisions, which will improveU.S. suppliers’ ability to compete fairly for government contracts.
The Intergovernmental Policy Advisory Committee (IGPAC) provides overall policyadvice on trade policy matters that relate to the affairs of State and local governmentswithin the United States. Regarding government procurement, IGPAC memberssupport the goal of improving the transparency of government procedures andregulatory decisions related to procurement in the United States, while preserving theindependent authority of State and local governments to adopt legislation, standards,and procedures consistent with their experience and interests.16
William Sweeney, Jr., of EDS, pointed out that U.S. companies were now able underthe Agreement to compete for a broad range of Australian public sector contracts,including in the database services sector, where no business was possible previouslybecause Australia had made no liberalization commitments in the area of governmentprocurement.17
Frank Vargo, representing NAM, highlighted the advantage presented by theAgreement for U.S. firms to compete in the procurement market of Australian centralgovernment entities, an opportunity previously unavailable because Australia is not asignatory to the WTO plurilateral Agreement on Government Procurement.18 He
16 Intergovernmental Policy Advisory Committee, Advisory Committee Report to the President, theCongress and the United States Trade Representative on the US-Australia Free Trade Agreement, Mar.12, 2004, found at Internet address http://www.ustr.gov/new/fta/Australia/advisor/igpac.pdf,retrieved on Apr. 19, 2004.
17 William R. Sweeney, Jr., EDS, submission to the Commission concerning the U.S.-Australia FreeTrade Agreement: Potential Economy-wide and Selected Sectoral Effects (Investigation No. TA-2104-11),Mar. 30, 2004, p. 4.
18 Franklin Vargo, submission to the Commission, p. 5.

127
pointed out also that U.S. firms will no longer be subject to Australian localmanufacturing or local content requirements under provisions of the agreement.
The report done for the Australian Department of Foreign Affairs and Trade expressesthe view that, although the agreement includes some important changes in thefunctioning of government procurement, whether any significant impacts result fromthese changes will depend on how firms in the two countries respond to the newbusiness opportunities and challenges developed by these changes.19
Electronic Commerce
U.S. negotiating objectives were to (1) seek toaffirm thatAustralia will allowgoodsandservices to be delivered electronically on terms that promote the development andgrowth of electronic commerce, and (2) seek to ensure that Australia does not applycustoms duties in connection with digital products or unjustifiably discriminate amongproducts delivered electronically.
The ACTPN report concludes that the Agreement’s provisions on e-commerce anddigital products provide state-of-the-art recognitionof the increased importance of thisissue regarding global trade, and include the principle of avoiding barriers thatimpede the use of e-commerce. The ACTPN finds that the e-commerce provisions andthe liberal treatment of services in this Agreement are especially important to ensurefuture U.S. market access in these critical growth areas. The committee drawsparticular attention to the fact that the FTA establishesguarantees ofnondiscriminationand a binding prohibition on customs duties on products delivered electronically, andcreates a favorable environment for the development of increased e-commerce.
In its report, the Industry Functional Advisory Committee on Electronic Commerce forTrade Policy Matters (IFAC-4) found that the e-commerce provisions in the Agreementpromote the economic interests of the United States and provides equity andreciprocity for electronic commerce firms.20 The electronic commerce chapter in theAgreement introduces the concept of “digital products” as reflected by digital productdevelopment over the last two decades. Continuing the use of the definition as found inprevious agreements promotes needed predictability for how digital products are
19 Centre for International Economics, Economic Analysis of AUSFTA, p. 43.20 Industry Functional Advisory Committee on Electronic Commerce, Report of the Industry
Functional Advisory Committee on Electronic Commerce (IFAC-4), Mar. 8, 2004, found at Internetaddress http://www.ustr.gov/new/fta/Australia/advisor/ifac04.pdf, retrieved on Apr. 19, 2004. TheIFAC-4 committee provides advice on trade policy matters involving electronic commerce negotiatingpriorities, data privacy, taxation, standards, consumer protection, authentication, and security andcontent, in bilateral, regional, and multilateral forums, including the World Trade Organization (WTO),Free Trade Area of the Americas (FTAA), Organization for Economic Cooperation and Development(OECD), Asia-Pacific Economic Cooperation forum (APEC), and Trans-Atlantic Economic Partnership(TEP). The IFAC-4 committee seeks to nullify any e-commerce trade barriers that would undercut theflexibility and seamlessness of this medium.

128
treated in international trade. The committee noted that the e-commerce chapter in theAgreement affirms the importance of avoiding unnecessary e-commerce barriers andthe applicability of WTO rules. The chapter prevents the application of customs dutieson electronically delivered digital products, ensures the nondiscriminatory treatmentof digital products, addresses the valuation of physically delivered digital products,and provides commitments to cooperate on electronic commerce policy. The parties tothe Agreement agree not to impose customs duties on digital products transmittedelectronically. This provision is similar to the moratorium on customs duties onelectronic transmissions in force in the WTO. Australia agreed to nondiscriminatorytreatment of digital products providing broad national treatment andnondiscriminatory treatment (so-called “most-favored-nation,” or “MFN”) provisions.This is a step forward in securing liberal trade treatment of digital products. Withrespect to the physical delivery of digital products, Australia agreed to apply customsduties on the basis of the value of the carrier medium. Presently countries use differentmethods to apply customs duties. With respect to the ongoing WTO ElectronicCommerce Work Program, which is focused primarily on the classification debate ofelectronically delivered goods and services, the IFAC-4 committee indicated that thee-commerce provisions in the U.S.-Australia FTA will spur debate. The United Stateshas developed a method for treating digital products in terms of trade that shouldadvance discussions in the WTO in the long term.
William Sweeney, Jr., of EDS, testified that his company’s endorsement of theU.S.-Australia FTA reflected the support of virtually every company in every sector ofthe technology community in the United States.21 Regarding electronic commerce, hehighlighted the major steps taken under the Agreement toward the long-termliberalization of trade in digital products, including the definition of digital products,the assurance of a continued zero duty rate on digital products, the strong languageconferring nondiscriminatory national treatment and most-favored-nation treatmentfor digital products, as well as provisions in the Agreement addressing digitalauthentification, consumer protection, and paperless trading. Such provisions wouldprovide incentive for cost and productivity improvements in business transactions thatwould help business firms from the two parties to the Agreement remain competitive.He also commended the adoption of a comprehensive “negative list” approach toliberalization of computer and related information technology services, where all newservices and applications are covered by commitments under the Agreement unlessspecifically exempted. This approach is critical to the technology industry owing to therapid rate of innovation in the field and the need to keep measures that liberalize tradeup-to-date in these areas.22
Laura Lane of Time Warner testified in support of the Agreement’s strong e-commerceprovisions, the commitment to nondiscriminatory treatment of digital products, and thecontinuation of a zero duty rate on digital products.23
21 William R. Sweeney, Jr., EDS, submission to the Commission, p. 2.22 William R. Sweeney, Jr., EDS, submission to the Commission, p. 3.23 Laura Lane, Time Warner Inc., submission to the Commission, p. 3.

129
Labor
U.S. negotiating objectives were to (1) seek anappropriate commitment by Australia tothe effective enforcement of its labor laws; (2) establish that Australia will strive toensure that it will not, as an encouragement to trade or investment, weaken or reducethe protections provided under its labor laws; and (3) establish procedures forconsultations and cooperative activities with Australia to strengthen its capacity topromote respect for core labor standards, including compliance with ILO Convention182 on the worst forms of child labor.
The ACTPN report concludes that the Agreement incorporates labor andenvironmental protections into the body of the Agreement, requiring both parties toenforce their domestic environmental and labor laws, and that these obligations areenforceable through the FTA’s dispute-settlement procedures. With the exception ofthe International Brotherhood of Teamsters, which voiced a dissenting opinion, theACTPN representatives believe that the Agreement fully meets the labor objectives inthe Trade Act of 2002, and believe that the text of the Agreement provides an effectiveand balanced means of implementing the negotiating objectives regarding laborissues. The committee indicated that the labor provisions meet the Trade Act’srequirements while still providing strong assurances that the provisions cannot be usedas a means of disguised protectionism. After lengthy debate, the United StatesCongress decided that dispute settlement in labor matters should be limited to a failureto enforce existing laws. The ACTPN believes that the U.S.-Australia FTA faithfullyimplements that requirement. The ACTPN representative of the InternationalBrotherhood of Teamsters disagreed, and opposed the labor language in theAgreement.24
The Labor Advisory Committee for Trade Negotiations and Trade Policy (LAC)concluded that the Agreement neither fully meets the negotiating objectives laid out byCongress nor promotes the economic interest of the United States, in its failure to meetsome Congressional negotiating objectives and in its barely meeting otherobjectives.25 The LACconsiders that theAgreement repeatsmanyof the samemistakes
24 The International Brotherhood of Teamsters sets out in its dissent to the ACTPN report a number ofreasons for why it considers that: (1) Australia’s labor laws fail to protect the workers’ right to join a union;(2) Australia’s labor laws undermine collective bargaining; (3) Australia’s labor laws undermine theworkers’ right to strike; as well as the Teamsters’ belief that (4) the USTR failed to protect U.S. andAustralian workers in negotiating the agreement.
25 Labor Advisory Committee for Trade Negotiations and Trade Policy, Report to the President, theCongress and the United States Trade Representative on the U.S.-Australia Free Trade Agreement, Mar.12, 2004, found at Internet address http://www.ustr.gov/new/fta/Australia/advisor/lac.pdf, retrievedon Apr. 19, 2004. The LAC provides information and advice with respect to negotiating objectives andbargaining positions before the United States enters into a trade agreement with a foreign country, withrespect to the operation of any trade agreement once entered into, and with respect to other mattersarising in connection with the development, implementation, and administration of the trade policy of theUnited States. The LAC includes unions from nearly every sector of the U.S. economy, includingmanufacturing, high technology, services, and the public sector, and represents more than 13 millionAmerican working men and women.

130
of the NAFTA, and is likely to lead to the same deteriorating trade balances, lost jobs,and workers’ rights violations that, in its opinion, NAFTA has created.
The LAC report also concludes that labor provisions of the U.S.-Australia FTA will notprotect the core rights of workers in either country, and represent a retreat from theU.S.-Jordan FTA, as well as unilateral U.S. trade preference programs.26 The reportasserts that the enforcement procedures in the U.S.-Australia FTA completely excludeobligations for governments to meet international standards on workers’ rights. TheLAC report also asserts that provisions on investment, procurement, and servicesconstrain U.S. ability to regulate in the public interest, to pursue responsibleprocurement policies, and to provide public services. The LAC considers that theAgreement’s provisions on intellectual property reduce the flexibility available underWTOrules forgovernments toaddress public health crises. The LACreport alsoassertsthat the rules of originand safeguardsprovisions will invite producers to circumvent theintended beneficiaries of the U.S.-Australia FTA, and will fail to protect workers fromthe import surges that may result. The LAC recommends that the President not sign theAgreement until it is renegotiated to fully address the concerns raised by the LAC’sreport, or that the Congress reject the Agreement should it be presented by thePresident.
Environment
U.S. negotiating objectives were to (1) seek to promote trade and environment policiesthat are mutually supportive; (2) seek an appropriate commitment by Australiaregarding the effective enforcement of its environmental laws; (3) establish thatAustralia will strive to ensure that it will not, as an encouragement to trade orinvestment, weaken or reduce the protections provided under its environmental laws;and (4) seek to develop ways to work with Australia, including through consultativemechanisms, to address environmental issues of mutual interest.
The ACTPN report concludes that the FTA’s environmental provisions provide effectiveand creative ways of contributing to environmental improvement. It notes that thestreamlined nature of the environmental provisions of this Agreement recognizes thatboth countries have highly developed economies and a history of significant, positive,environmental regulation. However, it asserts that, given the country-specificconditions that support streamlining, these provisions should not be used as a model
26 The committee report considers that (1) the Agreement’s enforcement procedures exclude the“obligations for governments to meet international standards on workers’ rights;”(2) the Agreement’sprovisions on investment, procurement, and services constrain U.S. ability to “regulate in the publicinterest, pursue responsible procurement policies, and provide public services;” (3) the Agreement’sintellectual property provisions reduce the “flexibility available under WTO rules for governments toaddress public health crises;” and (4) the “rules of origin and safeguards provisions invite producers tocircumvent the intended beneficiaries of the trade agreement and fail to protect workers from the importsurges that may result.”

131
for all agreements. The ACTPN report also notes that concern has been expressed bysome nongovernmental organizations about the environmental impact of the sugarcarve-out, given the impact of sugar production on sensitive environmental resourcesin the United States. The ACTPN members in their report said that they believe theAgreement meets the requirements of the Trade Act of 2002 by requiring, in anenforceable manner, that neither country fail to enforce its environmental laws in amanner that could affect trade. The ACTPN states that it is important that theAgreement extends obligations on environmental laws at the State and territory levelbecause much environmental regulation takes place at this level of government.
A majority of Trade and Environment Policy Advisory Committee (TEPAC) memberssupport the conclusion that the Agreement provides adequate safeguards to ensurethat Congress’s environmental negotiating objectives will be met.27 The report notesthat Australia has a strong and positive record regarding environmental regulation,which the committee believes is likely to be atypical for other likely FTA candidates;thus, the report recommends that the environmental provisions in the Agreement arenot well suited as a model for other free trade agreements. The report notes thatAustralia’s strong record with regard to environmental regulation is unusual withrespect to other likely FTA candidates and thus should not serve as a model for futureagreements. The report states that the committee finds that the environmentalprovisions still appear to strike “a proper balance between the extensive commitmentsin the Agreement to cooperate on environmental matters” and “the need to ensure thatboth countries commit the requisite resources to enforce domestic environmental lawsand regulations.” The report notes that committee members were very concernedabout the Agreement not addressing tariff reductions regarding sugar, beef, anddairy. Overall, however, the report concluded that this Agreement is likely to meetCongress’s objectives regarding environmental regulation between the United Statesand Australia, although it should not be seen as a model for future FTAs.
Transparency
U.S. negotiating objectives were to (1) seek to ensure that Australia’s procedures foradministering trade-related measures are fair and transparent, including ensuringthat interested parties have timely access to information on these measures andAustralia’s procedures for administering them; and (2) seek to ensure that Australiaapplies high standards that prohibit corrupt practices affecting international trade, aswell as enforce such prohibitions.
The ACTPN report concludes that the Agreement is an “unparalleled accomplishment”that “serves as a shining example of what is possible” in that over 99 percent of U.S.
27 Trade and Environment Policy Advisory Committee, Report to the President, the Congress, and theUnited States Trade Representative on the U.S.- Australia Free Trade Agreement, Mar. 12, 2004, found atInternet address http://www.ustr.gov/new/fta/Australia/advisor/tepac.pdf, retrieved on Apr. 19,2004.

132
exports of consumer and industrial goods to Australia will become totally duty-free assoon as the U.S.-Australia FTA enters into force. Such market-access gains are likely tobe reinforced by improved transparency and efficiency in administering customsprocedures, including measures for facilitating express delivery shipments, which arean important means of exporting for small- and medium-sized firms.
Other Institutional Arrangements and Dispute Settlement
U.S. negotiating objectives were to (1) encourage the early identification andsettlement of disputes through consultation; and (2) seek to establish fair, transparent,timely, and effective procedures to settle disputes that might arise under theAgreement.
The ACTPN report concludes that the FTA continues the innovation of an option to usemonetary fines for needed enforcement under the Agreement’s provisions, whichreduces the need to resort to trade restrictions that can cause significant tradedislocations if used as an enforcement mechanism. The report concludes that theAgreement provides for new consultation mechanisms to expand possibilities forimproving trade cooperation and heading off disputes, including consultations toaddress technical barriers to trade.
The ACTPN report asserts that effective dispute-settlement provisions are essential toensure that trade agreements are actually implemented and enforced. It states thatthese provisions must permit timely and effective resolution of disputes, as well asenforcement mechanisms, to provide an adequate incentive for compliance. TheACTPN members conclude in their report that suspension of tariff benefits under theAgreement is available for all disputes as a last resort, including disputes over theenforcement of labor and environmental laws, but that there is a clear preference thatfines be used as an enforcement mechanism instead of trade restrictions whereconsultation fails to resolve a dispute.
The ACTPN report views this as a particularly good feature in bilateral tradeagreements, since no bilateral agreement can override the parties’ WTOcommitments, e.g., the maximum U.S. trade retaliation could only be a snap-back to itsbound tariff levels in the WTO. As the average U.S. tariff rate under the WTO is only1.6 percent, fines are a potent alternative that do not distort trade.
The ACTPN report states that retaliatory trade measures should be taken as a lastresort, for they have the capability of interfering with trade and causing considerableeconomic disruption. The report also states that the best way to deal with trade disputesis through consultation and mutual understanding, and expresses the committee’ssupport for the provisions in the Agreement that seek such amicable resolution ofdisputes. The report also concludes that the Agreement also sets high standards ofopenness and transparency for dispute-panel procedures, including provisionsallowing interested third parties to provide their views.

133
The ACTPN (save for the Teamsters’ dissenting view) believes that thedispute-resolutionprovisions fullymeet the requirements of the Trade Act of 2002, andthat they provide equivalent enforcement for all parts of the Agreement–including thenew labor and environmental provisions. The committee endorses thedispute-settlement provisions and considers them to advance the “state-of-the-art” intrade agreements.
The IGPAC members of State and local government representatives support thedispute-settlement provisions of the Agreement as well, because these provisionsrecognize State and local authority as well as the modern and transparent legalsystems of both the United States and Australia. IGPAC members are pleased that theFTA provides submission and arbitration provisions, clarifies language onexpropriation, and excludes investor-state dispute-settlement procedures.


135
CHAPTER 8Review of Literature and Comparison WithCommission Findings
Introduction
This chapter reviews the academic and policy literature pertaining to a U.S.-AustraliaFTA. Prior to reviewing the studies assessing the estimated impact on the United Statesof the U.S.-Australia FTA , a discussion is presented on the conceptual issues regardingfree trade agreements. The final section of this chapter makes an analyticalcomparison between the results obtained by the USITC model described in chapter 3and selected modeling results from the reviewed literature.
General Effects of Trade Agreements
Studying the economic impact of a FTA entails investigating static effects such as tradecreation and trade diversion as well as terms of trade. In addition, issues related toscale effects and non-quantifiable effects have to be considered. A discussion of theseissues is presented below.
Static Effects: Trade Creation and Trade DiversionTrade liberalization can in general be undertaken in two different manners. First, itcan be based on the “most favored nation” (MFN) principle where better marketaccess is granted to all trading partners equally. The classical “gains from trade”argument asserts that such trade liberalizationwouldhelpconsumers tohave access tomore goods at lower prices, and producers to have more sources for their inputs andmore markets for their products (for which they may receive higher prices). Second, itcan be done in a preferential way, with better market access granted to one partnerbut not to others. It should be noted that better market access can result not only frombilateral tariff removal but also from other negotiated provisions in the areas of crossborder trade in services, telecommunications, e-commerce, and governmentprocurement, the effects of which are not readily quantifiable. An FTA, such as the onebetween the United States and Australia, is an agreement in which preferentialliberalization is undertaken reciprocally between participating countries.1
1 It should be noted that, while negotiated bilaterally, some FTA provisions such as those related tocustoms administration or labor and environment tend to be applied in a non-discriminatory manner andare closer to the MFN principle.

136
To the extent that FTAs are designed to liberalize trade, they are likely to engendereconomic gains similar to those of an MFN liberalization. However, given theirdiscriminatory nature, studying the economic impact of FTAs involves additional issuesthat are not present in an MFN liberalization. The traditional way to study an FTA is tocategorize the FTA-induced trade expansion into trade creation or trade diversion.2
Trade creation improves welfare and occurs when partner country productiondisplaces higher cost domestic production. Trade diversion reduces welfare andoccurs when partner country production displaces lower cost imports from the rest ofthe world.3 The combined effect of an FTA on intra-bloc trade will then reflect tradecreationas well as tradediversion. Whether the trade-creation (welfare enhancing) orthe trade-diversion (welfare reducing) effects dominate depends on a variety offactors, including external trade barriers, cost differences, and relative supply anddemand responses and other domestic policies. From that point of view, the overallwelfare impact of an FTA is not unambiguous, making its determination an empiricalissue.
Static Effects: Terms of TradeThe impact of an FTA also can be studied from a “terms of trade” (i.e., the price ofexports relative to the price of imports) viewpoint. If the participating countries arelarge enough to be able to affect import and export prices by their actions, theestablishment of an FTA is likely to affect the terms of trade of a given FTA member inthree different manners. First, by increasing the demand for its partner’s products, thecountry’s own preferential trade liberalization may increase the (pre-tariff) price of itsimports from the partner country leading to a deterioration in its terms of trade.Second, tariff reduction by the partner country could increase the demand (and theprice) for the FTA member’s exports and improve its terms of trade. Finally, thedecreased demand for imports originating from non-member countries tends todecrease their price and improve the FTA members’ terms of trade. Therefore, theimpact on economic welfare will depend on whether the terms of trade have improvedor deteriorated for a given partner country.
Scale EffectsTo theextent that FTAs integrate (and, hence, enlarge)markets, somewould argue thatthey offer firms an opportunity to exploit economies of scale (or increasing returns toscale) and to lower costs by expanding production. Moreover, by increasing theintensity of competition, an FTA can potentially induce firms to make efficiency
2 The seminal works on this issue are J. Viner, The Customs Union Issue, New York: CarnegieEndowment for International Peace, 1950 and J. Meade, The Theory of Customs Union, Amsterdam:North Holland, 1955.
3 Losses from trade diversion occur when lost tariff revenue associated with changes in the pattern oftrade exceeds efficiency gains from the decline of the prices paid by consumers. These losses will belarger the higher the FTA’s margin of preferences (i.e., the trade barriers facing non-members relative tointra-FTA barriers).

137
improvements in order to raise productivity levels.4 It has, for instance, been pointedout that firms in Canada have long argued that U.S. market access would enable themto exploit economies of scale, and that this access would allow them to increase theirexports not only to the countries in North America, but also to the rest of the world.5
Increasing returns also affect the volume of trade in inputs and intermediate goodsused by increasing return industries because as firms expand production and exploiteconomies of scale, they need to purchase more inputs and intermediate goods. Thesegoods may be imported from inside or outside the FTA.
The enlarged FTA market also may attract investment, including foreign directinvestment (FDI), especially investment for which market size is important.6 It should benoted that the higher the FTA’s margin of preference, the more attractive it will be asan FDI destination. In the long run, changes in trade flows can lead to substantialchanges in the location of production between member countries of an FTA. Theserelocations may be determined by comparative advantage (i.e., the removal ofbarriersmight lead each country toproduce thegoods atwhich it is best).Alternatively,sectors with strong backward or forward linkages may all relocate to one country andtake advantage of the preferential access to cater to the whole FTA market from there.These agglomeration effects are stronger in the presence of economies of scale. Theimpact of an FTA will depend on the increased level of economic activity within the FTAand on the distribution of the effects among members.
Nonquantifiable EffectsIn addition to the generally quantifiable effects discussed so far, regional integrationcan provide other potential benefits that are more difficult to evaluate. A World Bankpublication discusses a variety of additional effects (or classes of effects) that mayresult from regional integration agreements.7 One such effect is enhanced security(either against nonmembers or between members).8 Another potential benefit is thatby forming a unit and pooling their bargaining power, FTA members can negotiatemore efficiently in international forums. Regional integration can also be useful in“locking in” domestic (trade or other policy) reforms by raising the cost of policyreversal. Another possible gain is the increased possibilities for cooperation inenvironmental or technological assistance projects. The non-quantifiable effectspertaining to the U.S.-Australia FTA are associated with market access provisions
4 A closely related gain comes from increased competition as firms are induced to cut prices and toexpand sales, benefitting consumers as the monopolistic distortion is reduced.
5 H.J. Wall, “NAFTA and the Geography of North American Trade,” Federal Reserve Bank of St.Louis Review, vol. 85, No. 2, Mar./Apr. 2003.
6 In addition to the effects of strictly tariff liberalization, many FTAs have explicit investmentprovisions (such as improved and secure investment environment) that would further enhance theseeffects.
7 The World Bank, Trade Blocs, New York: Oxford University Press, 2000, p. 66.8 For more on this, see Maurice Schiff, and L. Alan Winters. “Regional Integration as Diplomacy.”
World Bank Economic Review, 1998, 12(2): 271–96. As has been mentioned above, the impact ofnegotiated commitments of an FTA related to intellectual property rights and customs administration andservices is not readily quantifiable.

138
related to cross border trade in services, telecommunications, governmentprocurement; trade facilitation provisions related to customs administration andtechnical barriers; investment related provisions; and regulatory environmentprovisions related to intellectual property rights, trade remedies and labor andenvironment.9
Table 8-1 illustrates the territory in which economists tend to focus their analyticalefforts. It shows how limited the area is where effects of trade policy are discernible. Acell marked “yes” indicates that the given effect of the given policy is generallymeasurable (or canbe modeled ina simulation) and/orhas beenmeasured. Note thatthese occur mainly in the static economic effects. The fact that relatively few cells aremarked as measurable does not mean that other effects are not important. By focusingattention on a selected number of FTA effects, analysts provide important insights intospecific aspects of trade agreements, but it is possible that other non-quantifiableeffects dominate.
Impact on the United States of the U.S.-Australia FTA
As shown in chapter 1, the Australian economy is small relative to the U.S. economy.Given the low tariff levels and relatively small bilateral trade and investment flows,economywide effects of trade liberalization on the United States resulting from theU.S.-Australia FTA are expected to be small. A small number of studies have directlyassessed the impact on the United States of a U.S.-Australia FTA.
There are three studies employing computable general equilibrium (CGE)analysis ofaU.S.-Australia FTA that directly assess the impact of such an FTA on the United States. Itshould be noted that since most of the studies were done before the U.S.-Australia FTAnegotiations were final, their assessments are fora hypothetical FTA and not the actualFTA.10 The first of these three considered below, prepared for the AustralianDepartment of Foreign Affairs and Trade (DFAT) by the Centre for InternationalEconomics (CIE) in 2001,11 focused exclusively on a U.S.-Australia FTA. The second, by
9 Chapters 4 through 7 in the study provide a qualitative assessment of the impact of theU.S.-Australia FTA on these negotiated objectives.
10 Section 2104(f)(3) requires the commission to review available economic assessments regardingthe agreement, to provide a description of the analyses used and conclusions drawn in such literature,and to discuss of areas of consensus and divergence among reviewed literature, including those of theCommission. The Commission notes that it conducted one classified study at the request of the USTRconcerning a potential U.S.-Australia FTA. USITC, U.S.-Australia Free Trade Agreement: AdviceConcerning the Probable Economic Effect, Investigation Nos. TA-131-24 and TA-2104-4, June 2003.Consequently, for the purpose of this report, the Commission discussion consists only of externaleconomic assessments and the Commission’s present study.
11 Leon Berkelmans, Lee Davis, Warwick McKibbin, and Andrew Stoeckel, “Economic Impacts of anAustralia-United States Free Trade Area,” Centre for International Economics, Canberra and Sydney,June 2001, found at Internet address http://www.dfat.gov.au/publications/aus_us_fta/aus_us_fta.pdf,retrieved Apr. 20, 2004.

139
Table 8-1Quantifiable FTA effectsEffects Quantifiable
Static economic effects:Trade creation and diversion . . . . . . . . . . . . . . . . . . . . . . . . . . . . . . . . . . . . YesTerms of trade . . . . . . . . . . . . . . . . . . . . . . . . . . . . . . . . . . . . . . . . . . . . . . . . Yes
Scale effects:Pro-competitive effects . . . . . . . . . . . . . . . . . . . . . . . . . . . . . . . . . . . . . . . . . SomeEfficiency . . . . . . . . . . . . . . . . . . . . . . . . . . . . . . . . . . . . . . . . . . . . . . . . . . . . SomeInvestment (including FDI) . . . . . . . . . . . . . . . . . . . . . . . . . . . . . . . . . . . . . . YesIndustrial location . . . . . . . . . . . . . . . . . . . . . . . . . . . . . . . . . . . . . . . . . . . . . Some
Political Effects:Enhanced security . . . . . . . . . . . . . . . . . . . . . . . . . . . . . . . . . . . . . . . . . . . . NoIncreased bargaining power . . . . . . . . . . . . . . . . . . . . . . . . . . . . . . . . . . . . NoLocking in reforms . . . . . . . . . . . . . . . . . . . . . . . . . . . . . . . . . . . . . . . . . . . . . NoCooperation . . . . . . . . . . . . . . . . . . . . . . . . . . . . . . . . . . . . . . . . . . . . . . . . . . No
Source: Compiled by the Commission.
Gilbert in 2003, considered a number of potential U.S. FTAs with minimal analyticaldiscussion.12 The third, by Brown, et al., in 2004,13 considered U.S. FTAs with CentralAmerica, Australia, and Morocco with only slightly more analytical discussion thanGilbert. Another study (the ACIL study in 2003) focused exclusively on a U.S.-AustraliaFTA, but only reported effects for Australia.14 In yet another study, in late April 2004,CIE produced an update that focused exclusively on a U.S.-Australia FTA, but onlyreported effects for Australia, except for three instances where effects on the UnitedStates are reported or can be inferred.15
In the 2001 CIE study, Berkelmans, et al., analyze the economic impacts of ahypothetical United States-Australia FTA using two models–the APG-Cubed modeland the Global Trade Analysis Project (GTAP) model.16
12 John Gilbert, “CGE Simulation of U.S. Bilateral Free Trade Agreements,” Background Paper forthe Free Trade Agreements and U.S. Trade Policy conference, Institute for International Economics,Washington, DC May 7-8, 2003. FTA partners considered include the CER (Australia and New Zealand),ASEAN, Chile, East Asia (Korea and Taiwan), and some African countries.
13 Drusilla K. Brown, Kozo Kiyota, and Robert Stern, “Computational Analysis of the U.S. BilateralFree Trade Agreements with Central America, Australia, and Morocco,” Feb. 8, 2004, found at Internetaddress http://www.fordschool.umich.edu/rsie/seminar/BrownKiyotaStern.pdf, retrieved Apr. 20,2004.
14 ACIL Consulting, “A Bridge Too Far? An Australian Agricultural Perspective on the Australia/United States Free Trade Area Idea,” Report of the Rural Industries Research and DevelopmentCorporation, Canberra, February 2003.
15 CIE, Economic Analysis of AUSFTA: Impact of the Bilateral Free Trade Agreement with the UnitedStates,” Centre for International Economics, Canberra and Sydney, April 2004.
16 The APG-Cubed model is a product of the McKibbin Software Group (MSG), Pty. Ltd. (Australia).“The Asia Pacific G-Cubed multi-country model is based on the theoretical approach taken in theG-Cubed model but with a focus on a country and sectoral dis-aggregation relevant for the Asia Pacificregion.” The G-Cubed model “has been constructed to contribute to the current policy debate onenvironmental policy and international trade with a focus on global warming policies, but it has many

140
The APG-Cubed model combines aspects of computable general equilibrium modelsand dynamic intertemporal macroeconomic models, integrating both financial andgoods markets in a dynamic framework. The APG-Cubed model uses the GTAP(version 4, 1995 base year) database, aggregated to include 18 countries/regionsand 6 sectors. The authors do not specify assumptions about type of competition orreturns to scale, but do specify that product differentiation by country of origin (theArmington assumption) is assumed. The authors simulate a 5-year phase-in of theremoval of tariff barriers and selected nontariff barriers (NTBs) starting in 2000 andsubsequent adjustments in the modeled economies to 2020. The authors do not specifyany adjustments (such as provision for Uruguay Round liberalizations) they may havemade to the data from 1995 (the base year for the GTAP version 4 database) to 2000.The services sector is “represented as a domestic cost reduction” of 0.35 percent forAustralia and 0.02 percent for the United States whereas the usual practice in CGEmodeling is to remove a price wedge on imports of services.17 Modeling consists of asimulated dynamic baseline (which starts in 2000) and comparisons of the FTAscenario to the baseline. The authors present welfare impacts in two ways. First, theauthors report the welfare impact on the United States to be 0.02 percent higher realGDP relative to the (dynamic) baseline in 2006, when trade barriers are completelyremoved in their simulations. Second, they find real consumption (their preferredwelfare measure) tobe0.016 percent higher relative to thebaseline in2006. TotalU.S.exports are estimated tobe 0.1 percent higher relative to the baseline in2006 and totalU.S. imports are estimated to be 0.04 percent higher relative to the baseline in 2006.Sectoral effects are generally not reported.
The second of the analyses of a U.S.-Australia FTA in the 2001 CIE study is a staticanalysis using the GTAP CGE model and database (version 4). In the analysis, themodel is aggregated to include 16 countries/regions and 24 sectors, allowing formore detailed sectoral analysis than is possible with the APG-Cubed model. The modelassumes perfect competition, constant returns to scale, and product differentiation bycountry of origin. Version 4 of the GTAP database, based on 1995 data, was“updated to 1998-99 so as to reflect changes that have occurred since 1995.”18 Thethree services sectors included in the GTAP simulations (Utilities and other services,Trade and transport, and Financial, business, and recreation services) appear to beaccounted for as a domestic cost reduction as in the APG-Cubed simulations. Theauthors report that they “doubled the Armington elasticities found in the standard
16—Continuedfeatures that will make it useful for answering a range of issues in environmental regulation,microeconomic and macroeconomic policy questions.” From the MSG website, found at Internet addresshttp://www.msgpl.com.au/wmhp/home1.htm, retrieved Mar. 26, 2004. As indicated in ch. 3, GTAP isthe modeling framework developed as part of the Global Trade Analysis Project at Purdue University.
17 The authors do not explain exactly how the “domestic cost reduction” was modeled.18 CIE, 2001, p. 32.

141
GTAP model.”19 In a static analysis, the authors simulate a one-time removal of tariffsand selected NTBs. They report the welfare effect on the United States of aU.S.-Australia FTA tobe 0.02percent higherGDP. They report estimates ofU.S. exportprices being 0.03 percent lower and export volume being 0.10 percent higher as aresult of an FTA, and ofU.S. import prices being 0.05percent lowerand import volumebeing 0.12 percent higher.
Estimates from theGTAP analysis of the2001 CIE studyof the effects of aU.S.-AustraliaFTA on U.S. sectors are shown in table 8-2. Estimated effects are small, with only onesector–sugar– experiencing a reduction in output of over 1.0 percent. The sector withthe largest estimated increase inoutput ismotor vehiclesandparts. EstimatedeffectsonU.S. imports from or exports to Australia are much larger in percentage terms, with afew sectors estimated to increase by over 100 percent, most likely because they aremeasured from small bases.
CIE updated its analysis in late April, 2004, taking the actual negotiated agreementinto account, updating the database to GTAP version 5, and incorporating additionaleffects not quantified in its 2001 report. Specifically, the dynamic analysis in the 2004CIE study includes estimates of gains from a reduction in the equity risk premium inAustralia for investment and gains from dynamic productivity improvement associatedwith trade liberalization, in addition to the gains in allocative efficiency from tradeliberalization that are usually estimated in CGE analyses. The updated study includesextensive reports of estimated effects of the FTA on Australia, including results ofdynamic analysis using the APG-Cubed model and static, more disaggregatedanalysis using the GTAP model. The only reported estimates of effects on the UnitedStates are forGDP and gross national product (GNP) under the dynamic analysis, andU.S. national income and trade with Australia under the static analysis. The studyreports that “[r]eal GDP and real GNP in the U.S. will be 0.013 and 0.014 percenthigher than the baseline level ten years out” under the dynamic simulations.20 U.S. netnational income is estimated to be higher by $432 million,21 U.S. imports fromAustralia higher by $3.3 billion22 and U.S. exports to Australia higher by $6.5billion23 under the static simulations.
19 CIE, “Australia-United States Free Trade Agreement: Comments on the ACIL report, Centre forInternational Economics,” Canberra and Sydney, March 2003, p. 5. Further, the authors say “This wasdone on the basis of work conducted by other researchers–including the developers of the GTAP modelitself–which suggested that the Armington elasticities used in the standard GTAP model are too low andneed to be doubled.”
20 CIE, Economic Analysis of AUSFTA: Impact of the Bilateral Free Trade Agreement with the UnitedStates,” Centre for International Economics, Canberra and Sydney, April 2004, p. 80.
21 CIE, 2004, p. 83.22 CIE, 2004, p. 89. Reported as change in Australian exports to the United States. Changes in trade
flows are also reported by sector.23 CIE, 2004, p. 90. Reported as change in Australian imports from the United States. Changes in
trade flows are also reported by sector.

142
Table 8-2United States sectoral changes, CIE GTAP analysis
(Percent)
Sector
USexports
toAustralia
USimports
fromAustralia
Totalexport
volume
Totalimport
volumeDomestic
output
Grains . . . . . . . . . . . . . . . . . . . 1.87 3.31 0.07 -0.06 -0.02Other crops . . . . . . . . . . . . . . . 3.47 5.36 -0.01 0.05 -0.01Sugar cane, beet . . . . . . . . . . na na na na -0.23Animal products . . . . . . . . . . . 1.04 -1.18 0.11 -0.03 -0.01Raw milk . . . . . . . . . . . . . . . . . na na na na -0.16Forestry and fishing . . . . . . . . 0.40 -0.22 -0.11 0.06 0.00Mining and energy . . . . . . . . . 0.85 1.58 -0.02 0.04 0.00Meat products . . . . . . . . . . . . 0.63 7.77 0.00 0.86 -0.02Other food products . . . . . . . 9.21 6.60 0.11 0.04 0.01Dairy . . . . . . . . . . . . . . . . . . . . 38.13 354.30 1.94 16.38 -0.18Sugar . . . . . . . . . . . . . . . . . . . . 72.07 2,550.81 16.91 20.02 -1.47Beverages and tobacco . . . . 28.42 9.24 0.06 0.17 0.01Textiles, clothing and
footwear . . . . . . . . . . . . . . . 104.50 75.48 0.83 0.19 0.04Wood and paper products,
publishing . . . . . . . . . . . . . . 19.48 2.45 0.21 0.08 0.01Chemicals, rubber and
plastics . . . . . . . . . . . . . . . . 8.62 8.26 0.08 0.14 0.01Other mineral and metal
products . . . . . . . . . . . . . . . 24.14 10.52 0.08 0.12 0.00Ferrous metal
products . . . . . . . . . . . . . . . 25.24 15.41 0.05 0.13 -0.01Motor vehicles and parts . . . 46.60 10.33 0.78 0.11 0.12Other transport
equipment . . . . . . . . . . . . . . 4.52 5.69 -0.06 0.11 -0.01Electronic equipment . . . . . . 0.80 6.75 -0.12 0.07 -0.03Other manufacturing . . . . . . . 13.30 6.48 0.07 0.09 0.00Utilities and other
services . . . . . . . . . . . . . . . . -0.15 0.38 -0.22 0.10 0.00Trade and transport . . . . . . . . -0.02 0.59 0.12 -0.01 0.05Financial, business and
recreational services . . . . . -1.54 3.56 -0.11 0.06 0.00
Note.–na: Not applicable as there is no, or an insignificant amount of, trade in thesecommodities.
Source: Leon Berkelmans, Lee Davis, Warwick McKibbin, and Andrew Stoeckel,“Economic Impacts of an Australia-United States Free Trade Area,” Centre forInternational Economics, Canberra and Sydney, June 2001. GTAP model simulation,from table 4.5, p. 39 and table 4.6, p. 41.
Gilbert, in a background paper prepared for a conference in May 2003, presentsCGE simulations of a number of potential U.S. bilateral free trade agreements.24
Gilbert’s analyses are based on the GTAP CGE model and database (version 5),aggregated to include 22 countries/regions and 19 sectors. The model assumes
24 John Gilbert, “CGE Simulation of U.S. Bilateral Free Trade Agreements,” Background Paper forthe Free Trade Agreements and U.S. Trade Policy conference, Institute for International Economics,Washington, DC, May 7-8, 2003.

143
perfect competition, constant returns to scale, andproduct differentiationby countryoforigin (i.e., the Armington assumption). The tariffs used are those in place in the baseyear, 1997. All import tariffs are assumed to be reduced to zero in the participatingeconomies on a preferential basis in a static simulation. Although reporting isorganized in terms of groupings of countries with which the United States might formFTAs (for example, ASEAN, Australia-New Zealand FTA), results are reported interms of bilateral FTAs between the United States and individual countries in thosegroupings. Gilbert reports that data limitations do not allow substantive treatment ofservices sector liberalization. Gilbert reports the welfare impact (in terms of equivalentvariation25) on the United States of a U.S.-Australia FTA to be 0.01 percent higherGDP.26 Gilbert also reports estimates of the value of total U.S. exports to be 0.15percent higher and the value of total U.S. imports to be 0.14 percent higher.27
Gilbert’s estimates of the effects of a U.S.-Australia FTA on U.S. sectors are shown intable 8-3. Estimated effects are small, with no sector experiencing a change in outputof over 0.2 percent. The sector with the largest estimated increase in output is Motorvehicles, and the sector with the largest estimated decrease in output is Othertransportation equipment.
Brown et al., in a February 2004 paper, present estimates of the economic effects ofthe three most recently negotiated U.S. bilateral trade agreements–those with fiveCentral American countries and the DominicanRepublic, Australia, and Morocco. Theauthors use the Michigan Model, a CGE model that allows for increasing returns toscale, monopolistic competition, and product variety28 in a static analysis.29 Theversion of the model used has 18 sectors and 22 countries/regions and uses data fromversion 5.4 of the GTAP database as well as data derived from other sources. TheGTAP version 5.4 (base year 1997) database is projected to 2005, incorporating theUruguay Round liberalizations and the accession of China and Taiwan to the WTO.The authors report the welfare effect of a U.S.-Australia FTA to be 0.20 percent higher
25 The equivalent variation measures the welfare impact of a policy change in monetary terms and itis defined as the amount of income that would have to be given to (or taken away from) the economybefore the policy change in order to leave the economy as well off as the economy would be after thepolicy change. A positive figure for equivalent variation implies that the policy change would improveeconomic welfare (see H.R. Varian, Intermediate Microeconomics: A Modern Approach, Fifth Edition, W.W. Norton & Company, New York, 1999, pp. 252-253)
26 Gilbert, tab. 3.1a, p. 30.27 Ibid.28 An example of this would be restaurant meals. Most consumers who eat out frequently also will
switch between restaurants, one day eating at a Chinese restaurant, another day at a Mexicanrestaurant, etc. If all consumers share the same love of variety then the aggregate market will sustaindemand for many varieties of goods simultaneously. If a utility function is specified that incorporates alove of variety, then the well-being of any consumer is greater the larger the number of varieties of goodsavailable. Thus, in this case, the consumers would prefer to have twenty varieties to choose among ratherthan ten.
29 Increasing returns to scale, monopolistic competition, and product variety are elements of the“New Trade Theory.”

144
Table 8--3,Estimated changes in value of the sectoral pattern of U.S. production andexports as a result of a U.S.--Australia FTA, Gilbert
(Percent)8
Sector ProductionTotal
exportsExports to
Australia
Importsfrom
Australia
Grains . . . . . . . . . . . . . . . . . . . --0.04 0.00 4.14 1.98Other crops . . . . . . . . . . . . . . . --0.03 0.00 9.84 47.27Animal products . . . . . . . . . . . --0.05 0.07 4.23 3.00Forestry and fisheries . . . . . . --0.03 --0.10 1.35 6.44Processed food products . . . --0.05 0.16 28.43 67.36Lumber . . . . . . . . . . . . . . . . . . --0.01 0.10 27.00 8.76Pulp and paper products . . . 0.00 0.12 9.43 1.21Textiles and apparel . . . . . . . 0.10 1.27 137.97 79.29Coal, oil and gas . . . . . . . . . . --0.02 --0.06 0.29 1.51Petroleum and coal products 0.01 --0.04 --0.10 9.55Chemicals . . . . . . . . . . . . . . . . 0.03 0.21 12.51 13.51Metals . . . . . . . . . . . . . . . . . . . 0.00 --0.01 17.33 3.32Metal products . . . . . . . . . . . . 0.03 0.31 37.52 18.81Electronic equipment . . . . . . --0.08 --0.09 4.39 13.48Motor vehicles . . . . . . . . . . . . 0.19 1.38 105.83 26.44Other transportationequipment . . . . . . . . . . . . . . . .
--0.11 --0.23 2.52 6.57
Machinery NEC . . . . . . . . . . . 0.04 0.25 18.24 15.38Manufactures NEC . . . . . . . . --0.01 0.16 19.48 8.30Services . . . . . . . . . . . . . . . . . 0.00 --0.14 0.43 --0.51
Source: From John Gilbert, “CGE Simulation of U.S. Bilateral Free Trade Agreements,”Background Paper for the Free Trade Agreements and U.S. Trade Policy conference,Institute for International Economics, Washington, DC May 7--8, 2003, tables 3.2a and3.3a, pp. 31 and 32.
GNP, of which 0.17 percent higher welfare comes from services liberalization.30
Changes in total U.S. exports and total U.S. imports are not reported, althoughchanges in U.S. exports and imports by sector are reported.
Brownet al.’s, estimates of the effects of a U.S.-Australia FTA onU.S. sectors are shownin table 8-4. Estimated effects are small, with all but one sector (leather products andfootwear) experiencing changes of 0.15 percent or less in absolute value.
Two other studies have dealt either primarily or secondarily with a U.S.-Australia FTA,but did not report extensive estimates of effects on the United States. The ACIL report31
is partly a counter to the CIE report. It was commissioned by the Rural Industries
30 Brown et al., p. 15. “The services barriers are based on financial data on average (price-cost)margins constructed initially by Hoekman (Bernard Hoekman, “The Next Round of Services Negotiations:Identifying Priorities and Options,” Federal Reserve Bank of St. Louis Review, July/August 2000, vol. 82,pp. 31-47.) and adapted for modeling purposes in Brown, Deardorff, and Stern (Drusilla K. Brown, AlanV. Deardorff, and Robert M. Stern, “CGE Modeling and Analysis of Multilateral and RegionalNegotiating Options,” in Robert M. Stern (ed.), Issues and Options for U.S.-Japan Trade Policies. AnnArbor: University of Michigan Press, 2002).
31 ACIL, 2003.

Table 8--4U.S.--Australia FTA: Change in exports, imports, output, and employment, by sectors, Brown et al.
(Percent)
Exports Imports Output Employment
UnitedStates Australia
UnitedStates Australia
UnitedStates Australia
UnitedStates Australia
Agriculture . . . . . . . . . . . . . . . . . . . . . . . . . . . . . . . 0.06 -1.18 0.05 2.78 0.01 -0.11 0.01 -0.12Mining . . . . . . . . . . . . . . . . . . . . . . . . . . . . . . . . . . 0.19 -3.10 -0.04 2.15 0.12 -2.16 0.08 -1.84Food Beverages & tobacco . . . . . . . . . . . . . . . . 0.19 1.84 0.75 3.22 -0.01 0.60 -0.03 0.10Textiles . . . . . . . . . . . . . . . . . . . . . . . . . . . . . . . . . 0.61 1.61 0.05 2.62 0.12 0.04 0.09 -0.64Wearing apparel . . . . . . . . . . . . . . . . . . . . . . . . . 0.37 4.25 -0.08 1.72 0.10 0.68 0.07 -0.21Leather products & footwear . . . . . . . . . . . . . . . 0.50 0.00 -0.04 1.39 0.22 -0.29 0.19 -0.94Wood & wood products . . . . . . . . . . . . . . . . . . . 0.26 -0.85 -0.04 2.99 0.03 0.20 0.01 -0.29Chemicals . . . . . . . . . . . . . . . . . . . . . . . . . . . . . . . 0.37 -1.26 -0.06 3.71 0.08 -1.09 0.06 -1.42Non-metallic min. Products . . . . . . . . . . . . . . . . 0.51 -0.78 -0.06 4.84 0.09 -0.47 0.07 -0.91Metal products . . . . . . . . . . . . . . . . . . . . . . . . . . . 0.25 -2.31 -0.05 3.10 0.09 -1.27 0.06 -1.53Transportation equipment . . . . . . . . . . . . . . . . . 0.32 -0.09 -0.06 3.63 0.11 -0.65 0.08 -1.24Machinery & equipment . . . . . . . . . . . . . . . . . . . 0.28 -0.94 -0.06 2.09 0.13 -1.75 0.12 -2.31Other manufactures . . . . . . . . . . . . . . . . . . . . . . 0.35 -2.29 -0.07 2.39 0.15 -2.10 0.12 -2.40Elec., gas & water . . . . . . . . . . . . . . . . . . . . . . . . 0.09 -1.97 -0.04 2.22 0.03 0.07 0.00 -0.10Construction . . . . . . . . . . . . . . . . . . . . . . . . . . . . . 0.07 0.09 -0.01 2.01 0.01 0.32 0.00 -0.10Trade & transport . . . . . . . . . . . . . . . . . . . . . . . . . 0.04 15.81 1.70 0.14 -0.02 1.66 -0.03 0.44Other private services . . . . . . . . . . . . . . . . . . . . . 0.04 11.73 1.17 1.12 -0.01 0.95 -0.01 0.27Government services . . . . . . . . . . . . . . . . . . . . . 0.77 13.83 1.50 27.64 0.01 0.42 0.00 -0.08
Source: Computations by Drucilla K. Brown, Kozo Kiyota, and Robert Stern, “Computational Analysis of the U.S. Bilateral Free Trade Agreements with CentralAmerica, Australia, and Morocco,” Feb. 8, 2004, found at Internet address http://www.fordschool.umich.edu/rsie/seminar/BrownKiyotaStern.pdf, retrievedApr. 20, 2004, table 9.

146
Research and Development Corporation. The ACIL report does not report anyestimates of effects on the United States, but it does report small negative effects forAustralia in contrast to the small positive effects for Australia reported in the CIEreport.32
A studybyDeRosa33 applies parameter estimates from gravity modeling to analysis ofa number of potential U.S. bilateral FTAs and possible expansion of trade led by theseFTAs. The major contribution of the study is the application of the estimate in a gravitymodel by Rose34 that bilateral trade between FTA partners is 118 percent higher thanwithout an FTA.
There are a number of other papers dealing with the prospect of a U.S.-AustraliaFTA–mostly policy papers, but their analytical contribution is minimal, with mostreferring to one or more of the above studies with regard to quantitative estimates ofthe effects of such an FTA.35
A summary of methodology and model assumptions in the major analytical studies ispresented in table 8-5.
Alternative Policy Experiments
This section asks, just how different are the findings of the different models, given thatthese findings are based on different model structures and policy assumptions? Itmakes an analytical comparison between the results obtained by the USITC modeldescribed in chapter 3 and selected modeling results from the literature review above.Specifically, the purpose of this exercise is to help determine the extent to whichdifferences in outcomes reported by the various models are driven by differentassumptions about the trade barriers or shocks being modeled, and the extent towhichthese differences depend on other structural differences among the models in, forexample, trade elasticity parameters, the characterization of capital formation,returns to scale, and product variety effects. As will be seen, the differences betweenresults found in the USITC analysis and those found in others can be attributed to all ofthese different factors.
32 The response to the ACIL report by CIE is footnoted above, but since no additional estimates arepresented, the CIE response is not reviewed separately.
33 Dean A. DeRosa, “Gravity Model Calculations of the Trade Impacts of U.S. Free TradeAgreements,” Institute for International Economics, Mar. 29, 2003.
34 Andrew K. Rose, “Which Institutions Promote International Trade?,” University of California,Berkeley, mimeo, 2003. Coefficients estimated by Rose include those for the effects of size of the tradepartners’ economies and the distance between the two (standard variables in gravity models);membership of trade partners in a regional FTA; as well as a number of others such as membership in theWTO, IMF, or OECD, currency union, common language, etc.
35 See, for example, An Australia-United States Free Trade Agreement - Issues and Implications, AReport for the Department of Foreign Affairs and Trade by The Australian APEC Study Centre, MonashUniversity, August 2001, found at Internet addresshttp://www.dfat.gov.au/publications/aus_us_fta_mon/aus_us_fta_mon.pdf, retrieved Apr. 20, 2004.

Table 8-5Methodology and model assumptions: Selected economic literature on a hypothetical U.S.-Australia FTA
Author/year ModelDatabase, baseyear
Returns to scale/competition
Productdifferentiation
Type (static,dynamic, other)
Type ofexperiment
Welfare effect(percent of U.S.GDP or GNP)1
Berkelmans, etal./20012
APG-Cubed GTAP-4, 1995:simulations startwith 2000
Not specified inreport
Armington Dynamic Tariffs, selectedNTBs, andservices
Real GDP–higherby 0.02
Berkelmans, etal./20012
GTAP CIE version ofGTAP-4, 1995,updated to1998-99
Constant/Perfect Armington Static, GTAP Tariffs, selectedNTBs, andservices
Real GDP–higherby 0.02
Gilbert/20033 GTAP GTAP-5,1997 Constant/Perfect Armington Static, GTAP Tariffs only Real GDP–higher by 0.01
Brown, Kiyota,and Stern/20044
Michigan GTAP-5.4, 1997,projected to 2005
Increasing/Monopolistic (exceptAgriculture)
Product variety Static Tariffs, services GNP–higher by0.2
ACIL/20035 Tasman Global GTAP-5, 1997 Constant/Perfect Armington Dynamic(appears to besequentialsolutions)
Tariffs, possiblyservices
Lower GDP forAustralia–noestimatesreported for U.S.
1 These results include liberalization of sugar. However, sugar was not included in the U.S.-Australia FTA.2 Leon Berkelmans, Lee Davis, Warwick McKibbin, and Andrew Stoeckel, “Economic Impacts of an Australia-United States Free Trade Area,” Centre for
International Economics, Canberra and Sydney, June 2001.3 John Gilbert, “CGE Simulation of U.S. Bilateral Free Trade Agreements,” Background Paper for the Free Trade Agreements and U.S. Trade Policy
conference, Institute for International Economics, Washington, DC, May 7-8, 2003.4 Drusilla K. Brown, Kozo Kiyota, and Robert M. Stern, “Computational Analysis of the U.S. Bilateral Free Trade Agreements with Central America, Australia,
and Morocco,” Feb. 8, 2004.5 ACIL Consulting, “A Bridge Too Far? An Australian Agricultural Perspective on the Australia/United States Free Trade Area Idea,” Report of the Rural
Industries Research and Development Corporation, Canberra, February 2003.
Source: USITC summarization.

148
Some of the most important inputs into the simulation models are the magnitudes of thesimulated changes in trade policy. The studies reviewed above were prepared inadvance of the actual agreement and hence do not accurately reflect the actualchanges in these magnitudes. They therefore include products, such as sugar, that areexcluded from the Agreement, as well as dairy products that were subject to minimalliberalization.To put the Commission analysis in the context of these other studies,simulations are performed to examine how different assumptions about the policyexperiment influence model outcomes.
The alternative simulations use the USITC model with its underlying structureunchanged; inparticular,Armingtonelasticities (i.e., trade substitution elasticities) andother parameters remain at the values assumed for them in the analysis presented inchapter 3. That is, simulations are run applying the assumed tariff and nontariffbarrier shocks used by other authors on the USITC model. The CIE study usedArmington elasticities that are generally double the size of those included in thestandard GTAP model and also used by ACIL. The Armington elasticities in the USITCmodel are derived independently by Hertel, Hummels, Ivanic, and Keeney36 (2003),and are generally higher than the standard GTAP values.
The scenarios considered are those of ACIL, CIE, and Brown, Kiyota, and Stern (BKS),discussed in the previous section of this chapter. Table D-3, in appendix D, lists thecommodities modeled in the alternative scenarios, and the tariff and nontariff trademeasures assumed to be removed by the U.S.-Australia FTA in those scenarios. Allthree studies report their trade measures as a combination of tariffs and the tariffequivalent of nontariff measures. No export taxes or export tax equivalents of exportquotas or quantitative restrictions are modeled by anyof the studies reviewed or by theUSITC analysis. Because each of the alternative models uses commodity dataaggregated in ways that differ from the USITC model, it was necessary to reaggregatethe commodities to correspond to those in the USITC model.
The alternative policy shocks as applied to the USITC aggregation also are given in thetable. In matching the alternative policy shocks of other authors to the sectors in theUSITC model, the following simple procedures were used. Where one sector in analternative model includes more than one USITC sector (such as the BKS agriculturesector, which includes the USITC sectors grains, sugar crops, other crops, andvegetables, fruits and nuts) the shock from the alternative model sector was applied toeach of the USITC sectors. Where more than one alternative model sector matches aUSITC sector (such as the BKS sectors apparel, textiles, and leather products andfootwear, all of which are contained in the single USITC sector textiles, apparel, andleather products), a simple average of the shocks in the alternative model sectors wasapplied to the USITC sector. One exception to this is in the transfer of the CIE servicesshocks to the USITC model, where CIE’s value for financial, business, and recreationservices was applied to the USITC services sector. Note again that all three studies
36 Hertel, Thomas, David Hummels, Maros Ivanic and Roman Keeney, How Confident Can We Be inCGE-Based Assessments of Free Trade Agreements? GTAP Working Paper No. 26, 2003, available athttp://www.gtap.agecon.purdue.edu/resources/

149
assumed the elimination of trade barriers in sugar, which was not included in the FTAitself or the USITC analysis. Also, CIE and ACIL fully liberalized dairy trade, while BKSdid not consider this sector separately (including itwith food,beverages, and tobacco).As noted above, the USITC model analysis did not fully remove the duties on dairyproducts. Also, the USITC analysis did not estimate the impact of services liberalizationdue to unavailability of necessary data on non-tariff barriers.
Table 8-6 provides an illustration of the magnitude of the differences in the estimatedchanges in U.S. welfare found by the other authors, compared to the welfare changewhen the alternative scenarios are applied using the USITC model.
ACIL did not publish a measure of the change in U.S. welfare, but found a smallnegative effect forAustralian welfare. The USITCmodel found a very small but positiveeffect for Australia. The ACIL study employs the set of Armington elasticities used in theGTAP version5data base, which are half the values of those used in the CIE model andalso much lower than those used in the USITC model.
Chapter 3 presents a discussion of the sensitivity of trade models to the values of theseArmington trade elasticities. In general, lower values embody an assumption thattrade flows are relatively insensitive to changes in tariffs and other trade barriers. It islikely that most of the difference between the ACIL estimate of (Australia’s) welfarechange, and the estimate produced by the USITC model using ACIL’s policy shocks, isattributable to the different assumptions about the values of the Armington tradeelasticities.
In comparison to the results obtained by Brown, Kiyota, and Stern (BKS), the USITCmodel implementation of their shocks generated a far smaller welfare impact from thesame liberalization scenario. Their reported welfare gain from liberalization is $19.4billion compared with $2 billion using the USITC model with the BKS shocks, and with$0.49 billion obtained from the USITC model as reported in chapter 3. While BKS et al.do not report simulated changes in bilateral trade flows, it should be noted that thebenchmark U.S. imports from Australia for 1997 equal $8.0 billion, while exportsequal $14.6 billion reported in the BKS model. The Commission’s 2005 benchmark is$11.3 billion in imports and $18.1 billion in exports. Given these trade flows, BKS’ssimulated gains from liberalization are very large relative to the overall bilateral flowof trade between the United States and Australia. The gains equal 85 percent of thebenchmark trade flow ($19 billion welfare gain, divided by the sum of $8 billion U.S.imports and $14 billion exports); the increase in welfare is actually larger than theirbenchmark level of U.S. imports from Australia, while the Commission model with theBKS scenario yields a gain equal to 7 percent of benchmark trade flows ($2 billionwelfare gain, divided by the sum of $11 billion in U.S. imports and $18 billion exports);and an increase in U.S.-Australian trade of 132 percent.
This result suggests that the preponderance of the BKS welfare gains come from thenew trade theory aspects of their model, which emphasize ways in which tradepromotes increases in productivity (through exploitation of returns to scale andincreased product variety among other things). Those gains, in turn, are most likely

150
Table 8-6Comparison of U.S. welfare changes for different scenarios
Welfare changeMillion dollars
Scenario: USITC ACIL1 CIE BKSImplementation:
Author’s . . . . . . . . . . . . . . . . 490.8 -139.9 2 1,231.1 19,400.0Alternative scenarios3 . . . . 490.8 297.0 518.3 2,031.7
1 ACIL does not report a welfare effect for the United States. The figures given forboth implementations in this column apply to Australia. They represent reported percentchanges of -0.05 percent (ACIL) and 0.10 percent (USITC) applied to the baselinewelfare level in the USITC model.
2 CIE reports a percentage change in welfare of 0.016 percent in 2006. Thispercentage is applied to the baseline welfare level in the U.S. model.
3 The alternative scenario uses the USITC model with its underlying structure un-changed and applies the assumed tariff and nontariff barrier shocks used by theauthors.
Source: Commission calculations and cited reports by CIE, ACIL, and Brown et al.(BKS).
focused in the services sectors, which are modeled as featuring increasing returns toscale and undergoing substantial liberalization. Further, the services sectors tradebarriers themselves are quite large, and as the authors acknowledge, are “...possiblysubject to overstatement.”37 In comparison to the BKS liberalization scenario, theCommission benchmark liberalization does not model either the United States orAustralia as removing substantial barriers to services as a result of the FTA. In the BKSmodel the United States has ad valorem equivalent barriers against imports from allcountries of 27percent in trade and transport; 31 percent in other private services; and25 percent in government services, which represent relatively high levels of traderestrictions. As was mentioned in chapter 3, removing large barriers leads to largeeffects. The BKS model consists of removing those barriers against Australia (andlikewise Australia’s barriers against the United States).
The CIE model simulated effects of a reduction in protection in the transportationindustry in the form of enhanced productivity in this sector. The USITC replication oftheir model adopts a similar approach. CIE employs two models to estimate the effectsof the FTA, as noted earlier in this chapter. The CIE implementation of the GTAP modeldoes not yield estimates of welfare changes for either the United States or Australia,while the CIE implementationof the APG-Cubedmodel imposes tariff policy shocks at avery high level of aggregation (only six sectors). The Commission’s attempt toimplement the CIE policy assumptions makes use of the CIE shocks as aggregated byCIE for the GTAP model, and then linked to the slightly different aggregation used inthe USITC model (see table D-3). The USITC implementation yields a U.S. welfare gainof $490.8 million. CIE, in their APG-Cubed model, find a U.S. welfare gain of about$1.2 billion.
37 Brown, et al., p. 7.

151
The CIE approach as implemented in the APG-Cubed model is fundamentally differentfrom the approach of the USITCmodel. As described above, APG-Cubed has dynamicfeatures which incorporate investment and capital growth over time. The figure of $1.2billion actually represents the growth in welfare of 0.016 percent reported by CIE forthe year 2006, a year after implementation of the FTA. This percentage growth isapplied to the base level ofwelfare in the USITCmodel toderive the $1.2 billion changein U.S. welfare. In comparison, the USITC model’s U.S. welfare change is derived froma static model with no capital growth. It represents the “instantaneous” effects of fullimplementation of the FTA. This structuring of specific gains from dynamic capitalformation is evidently the source of the larger welfare effect obtained by the CIEanalysis. As reported earlier in this chapter, CIE published a study in late April 2004with updated information.38 While theydid not report a welfare number for the UnitedStates, their new report shows a long-run increase in GDP of 0.013 percent, a bitlarger than the change of 0.01 percent found in the USITC analysis, but notsubstantially different.
To summarize, the differences between results found in the USITC analysis and thosefound in others can be attributed to different factors. In comparison with the USITCmodel, the BKS study assumes much higher barriers in the services industries, but thisaccounts for only a small part of the difference in welfare effects. The remainder of thevery large difference in welfare effects is most likely due to the large scale economiesand other unique features of the BKS model. The ACIL model, while closer to the USITCmodel than the BKS,makes useof small trade substitutionelasticities (Armingtons), andthus produces a very small (and negative) welfare effect for Australia. The CIE resultsare qualitatively rather close to the USITC model implementation of their tariffremovals; the difference is largely due to the CIE APG-Cubed model’s dynamictreatment of investment and capital formation.
38 CIE, Economic Analysis of AUSFTA: Impact of the Bilateral Free Trade Agreement with the UnitedStates,” Centre for International Economics, Canberra and Sydney, April 2004.

153
CHAPTER 9Summary of Views of Interested Parties
The Honorable Russell D. Feingold, United States Senator from Wisconsin1
Senator Feingold thinks that the U.S.-Australia FTA will not be good for the dairyproducers in Wisconsin. Increased market access to dairy products from Australia willlead to rapid growth in dairy products entering the U.S. market. Senator Feingoldquotes a USTR estimate that additional dairy imports from Australia could amount to$40 million in the first year of implementation, and notes that increased quota accesswill result in a threefold increase in imports from Australia. As more dairy products areimported, prices will fall, forcing dairy farmers out of business. Senator Feingold alsois concerned about the impact the Agreement will have on cheese manufacturing in hisstate. He notes that the Administration missed an opportunity to “close the tariffloophole” that enables milk protein concentrate tobe imported in theUnited Stateswithminimal duty. Senator Feingold has heard from his constituents in the Wisconsin dairyindustrywho feel that theyare being harmed byunfair free trade agreements. SenatorFeingold states that the U.S.-Australia FTA comes at a bad time when the dairy industryis recovering from a period of very low prices and incomes.
The Honorable Tim Johnson, United States Senator from South Dakota2
Senator Johnson thinks that while Australia stands to benefit substantially from a freetrade agreement with the United States, there are limited opportunitiesand benefits forthe U.S. livestock industry and agricultural sector. Therefore, Senator Johnsonindicates that he cannot support an agreement that poses a significant threat to SouthDakota agriculture, and more specifically threatens South Dakota cattle producers.South Dakota cattle producers have expressed significant concern about the FTA toSenator Johnson and think that the provisions must be revisited and reviewed. SenatorJohnson states that the United States should not enter into trade agreements withAustralia, or any other country, that would further damage U.S. agriculture and placeeconomic hardship on rural communities.
1 Russell D. Feingold, U.S. Senate, letter to the Chairman of the Commission, Mar. 30, 2004.2 Tim Johnson, U.S. Senate, letter to the Chairman of the Commission, Apr. 6, 2004.

154
The Honorable Charles E. Schumer, United States Senator from NewYork3
Senator Schumer is concerned that the U.S.-Australia FTA will adversely affect the U.S.dairy industry, especially over the long term. While he is pleased that the Agreementdoes not lower over-quota tariffs on dairy products, he is concerned about the impactsof additional imports from Australia that will face azero in-quota tariff. Recently, dairyfarmers have engaged in a voluntary supply control program in an effort to raiseprices and incomes. Senator Schumer thinks that it wouldbe a“travesty” if the effects ofthis initiative were to be erased by additional imports from Australia.
The Honorable Ed Case, Member of Congress from Hawaii4
Congressman Case represents Hawaii’s second district, which encompasses theIslands of Hawaii, Maui, Kahoolawe, Lanai, Molokai, Oahu, Kauai, and Nihau, andNorthwestern Hawaiian Islands. Congressman Case states that the Hawaiianmacadamia nut industry is highly vulnerable to foreign imports because foreigngrowers shipa generally lower-quality product, which could flood the U.S. market anddisplace Hawaiiangrowers. According to the Congressman, over the past 10 years theHawaiian economy has endured the job losses associated with the closing of sugarplantations and the downsizing of the pineapple industry; he states that the loss of athird major agriculture industry - macadamia nuts - would be a critical blow to thestate’s agricultural economy.
His Excellency Michael Thawley, Australian Ambassador to the UnitedStates
Ambassador Thawley called the U.S.-Australia FTA “an extraordinary achievement,”referring to it as “laying the foundation for integrating more closely two modern andsophisticated economies.” He cited the Agreement’s two-sided potential for anincrease in trade and investment, faster economic growth, more and better jobs, andhigher living standards for both partner countries. He stated that “Of all the countrieswith which the United States could realistically negotiate a trade agreement, Australiahas the largest economy, [is] the fastest growing and the most open.”
Areas of significant importance in the FTA were highlighted in the Ambassador’stestimony before the Commission--manufactures, with the largest one-time andimmediate reduction in industrial tariffs ever achieved in a bilateral agreement;
3 Charles E. Schumer, U.S. Senate, letter to the Chairman of the Commission, Apr. 6, 2004.4 Ed Case, U.S. House of Representatives, letter to the Secretary to the Commission, Mar. 16, 2004.

155
foreign investment--where procedures will be liberalized to encourage capital; tradein services--with increased freedom and greater legal certainty for a sector thataccounts for over 70 percent of each partner economy; and intellectual property,which will be more closely harmonized in order to bring both further benefits andgreater predictability into segments of the service sector.
TheAmbassadoremphasized the importance of the agricultural concessions thatweresecured by the FTA. While Australian dairy and beef sectors stand to gain under theAgreement, he pointed out that the overall impact of these increases on the UnitedStates “is minimal in the context of total U.S. production and imports.” He also pointedout that while a number of the benefits of the FTA are unquantifiable, “they helpexplain why trade and investment growth under high quality FTAs ... has dramaticallyoutstripped the gains predicted by economic modeling.”
The Agreement was characterized as excellent and balanced, one that offers thecitizenry of both countries “a much more open and predictable economic andregulatory environment.”
Air Courier Conference of America International (ACCA) 5
ACCA represents the express delivery service industry, which specializes in fast,reliable transportation services for documents, parcels, and freight. ACCA’s membersinclude large integrated express delivery companies, such as FedEx Corp., UnitedParcel Service (UPS), DHL Worldwide Express, and TNT U.S.A., Inc.; as well as localand regional couriers and messengers. ACCA members employ 800,000 peopleworldwide and generate annual revenues of over $50 billion.
ACCA supports the U.S.-Australia FTA and states that express delivery operators willbenefit from increased merchandise transport volumes as a result of increased tradebetween the two countries. Additionally, the U.S.-Australia FTA includes tradefacilitation provisions that will improve customs processing in Australia and enhancethe operating environment for express delivery firms. The Agreement builds on earlierFTAs to provide important commitments for the industry and to define the expressdelivery industry in such a manner that all entities providing the service are subject tothe provisions of the Agreement, thereby reducing the potential for discriminatorytreatment. ACCA is further encouraged that the FTA includes a standstill provision,which halts the implementation of trade-impeding measures, thereby providinggreater regulatory certainty for providers of the service. The Agreement includeslanguage that ensures that the chapter on competition policy applies to expressdelivery services, helping to address cross-subsidization concerns. ACCA also statesthat the competition chapter will further reduce the potential for anitcompetitivemonopoly behavior in such areas as licensing, operational limitations, and taxes.
5 Susan Presti, Executive Director, Air Courier Conference of America, International.

156
American-Australian Free Trade Agreement Coalition (AAFTAC)6
The AAFTAC is a coalition of over 260 organizations and businesses representing abroad spectrum of industries and economic interests in the United States. Membersinclude manufacturing firms, service firms, agricultural businesses, chambers ofcommerce, and trade associations. AAFTAC supports the U.S.-Australia FTA, statingthat it will provide significant economic benefits to the U.S. economy. AAFTAC notesthat Australia is an important trading partner of the United States. The FTA willimmediately eliminate Australian tariffs on virtually all U.S. manufactured goodsexports, providing increased export opportunities for a wide range of U.S. industries.U.S. farmers, ranchers, and food processors will benefit from immediate duty-freeaccess to the Australian market for many U.S. agricultural products and processedfoods. According toAAFTAC, the FTAprovides greateraccess to the Australianmarketfor U.S. services such as telecommunications, financial, professional and technical,and travel. AAFTAC states that other areas of the FTA beneficial to the United Statesinclude national treatment for U.S. investors and the exemption of most screening fornew U.S. investments in Australia; the opening up of the government procurementmarket in Australia to U.S. firms; new commitments on e-commerce providing fornondiscriminatory treatment for digital products; and additional protections for U.S.trademarks, copyrights, and patents. AAFTAC notes that the United States andAustralia have been friends and allies for over 100 years; the FTA will bind the twocountries together for a common economic future that will improve the economicwell-being of their citizens.
American Dehydrated Onion and Garlic Association7
The American Dehydrated Onion and Garlic Association (ADOGA), comprising twofirms that account for the majority of domestic dehydrated onion and garlicproduction, opposes a U.S.-Australia FTA. ADOGA states that, although there wereno imports of the subject products from Australia prior to 2002, Australia poses aserious threat to the U.S. industry because of its favorable climate for raising onionsand garlic and because of its existing capacity for dehydrating vegetables. Most of theADOGA firms’ production is sold to institutional and food-service buyers for use, invery small amounts, as an ingredient in other processed foods. With the cost of driedonions or garlic accounting for a very small share of the cost of the end product inwhich it is used, demand for these products is derived by end-product producers.ADOGA states that any imports from Australia would place additional downwardprice pressure on the U.S. products and further exacerbate the competitive position of
6 William Lane, Co-Chairman, American-Australian Free Trade Agreement Coalition.7 Irene Ringwood, Ball Janik LLP, Washington, D.C., counsel for the American Dehydrated Onion
and Garlic Association, submission Mar. 31, 2004.

157
the U.S. industry. Finally, ADOGA states that there is the possibility of dried onions andgarlic being transshipped through FTA countries including Australia from China, theworld’s largest supplier of onions and garlic.
American Sugar Alliance8
The American Sugar Alliance (ASA) is a national coalition of sugar cane, sugar beet,and corn farmers, processors, suppliers, and other workers involved in the U.S.sweetener industry. ASA supports the exclusion of sugar from the U.S.-Australia FTAand supports the provisions of Article 3:1 of the FTA that call for Australia and theUnited States to work within the WTO to address issues such as State tradingenterprises. ASA also states that the FTA in its treatment of sugar, should serve as atemplate for future FTA agreements.
Association of Equipment Manufacturers9
The Association of Equipment Manufacturers (AEM)—a trade associationrepresenting U.S. and Canadian producers of construction, agricultural, mining,forestry, and utility equipment—supports the U.S.-Australia FTA. AEM states that U.S.producers will benefit from immediate elimination of Australian tariffs, access toAustralian Government procurement, and inclusion of remanufactured parts andcomponents in theAgreement.U.S. exports ofmany typesof construction, agricultural,mining, forestry, and utility equipment products face Australian tariffs of 5 percent.The eliminationof a 5percent tariff onheavy equipment is significant, asprices on suchequipment range from a few thousand dollars to more than a million dollars. U.S.exporters expect to realize increased sales in the Australian market as a result of tariffelimination enhancing their price competitiveness, particularly against European andAsian competitors. The Australian market is significant for U.S. exporters of this heavyequipment, and ranks among the top five destinations for U.S.-produced heavyequipment in the world.
The FTA also will benefit U.S. exporters by increasing access to the AustralianGovernment procurement market. This is important for U.S. producers of constructionand utility equipment. AEM notes that the FTA also defines and includesremanufactured parts and components and provides for remanufactured parts to betreated the same as new parts. Remanufactured parts and components are producedfrom used parts and components, where key core materials, such as a cast housing,are salvaged. The part or component is disassembled, cleaned, inspected, and new
8 Jack Roney, Director of Economics and Policy Analysis, American Sugar Alliance.9 Megan Carpentier, Manager of Government Affairs, Association of Equipment Manufacturers.

158
materials added as appropriate, so the part or component is sold and functions asnew, although at a greatly reduced cost. Typical parts that may be remanufacturedinclude engines and transmissions. Many developing countries do not desire to beprimemarkets for oldmachineryandequipment, andgenerally have limitations on theimportation of used machinery and parts. Since remanufactured products function asnew and are increasing in use, AEM thinks that by including provisions forremanufactured parts in the U.S.-Australia FTA, the Agreement continues the modelset in the U.S.-Chile and U.S.-Singapore FTAs, thereby increasing the likelihood thatremanufactured parts will be incorporated in future FTAs with developing countries.AEM notes that there are no issues regarding remanufactured articles in trade withAustralia.
Automotive Trade Policy Council, Inc.10
The Automotive Trade Policy Council (ATPC) is a Washington, D.C.-based nonprofittrade association that represents the common international economic, trade, andinvestment interests of its member companies: General Motors Corp., Ford Motor Co.,and DaimlerChrysler Corp. ATPC supports the U.S.-Australia FTA, asserting that it willbenefit the U.S. industry by allowing for greater integration of its members’operations, promoting growth and efficiency in ATPC members’ operations in both theUnited States and Australia.
ATPC states that Australia is an important export market for the U.S. automotiveindustry, and may be the only industrialized country with which the United States has atrade surplus in automotive products. According to ATPC, automotive productsaccount for almost 10 percent of total U.S. merchandise exports to Australia.
According to ATPC, the primary benefit of the FTA would be the removal of Australiantariffs on automotive products, which are currently 15 percent on imported motorvehicles and motor-vehicle components, and 5 percent on commercial vehicles. Anyremaining Australian duties will be eliminated by 2010.
ATPC asserts that the FTA is likely to result in increases both in local production by itsmembers and in exports from the United States to Australia. ATPC expects that the FTAwill have a greater effect on U.S. exports as opposed to U.S. imports. The potential forincreased exports of motor-vehicle parts is expected to be more significant in the shortterm than exports of vehicles, because of the relatively larger size of the U.S. partsindustry, the complementarity of products between the United States and Australia,established export patterns, and the global trend of companies tending to concentratethe sourcing of parts in as few areas as possible. While the local content ofAustralian-built vehicles is high, recent efforts to liberalize the automotive sector haveresulted in increased market share for imported parts; this likelywill continue under theFTA, according to ATPC.
10 Stephen J. Collins, President, Automotive Trade Policy Council, Inc.

159
With respect to vehicles, the reduction or elimination of Australian tariffs are likely tospur U.S. automakers to consider exporting other U.S.-built products that may bemarketable inAustralia. ATPA notes that imports account for themajority ofpassengervehicle sales inAustralia.While conceding that theAustralianmotorvehiclemarket,ascompared to other major markets, is limited, ATPC asserts that the FTA will give theUnited States a competitive advantage because the major import competition does nothave preferential trade agreements with Australia. ATPC states that it does not expecta large influx of light trucks from Australia despite the removal of the 25 percent U.S.tariff on these vehicles.
Another issue of importance to ATPC is the automotive rule of origin. ATPC states thatthe negotiated rule, which is slightly different from the generalized product rule, issimplified and fair. ATPC states that the Australian luxury tax on passenger vehicleswas not an important objective for the U.S. industry, and was not addressed in the FTA.
ATPC contends that the U.S.-Australia FTA is an important step in the effort of the U.S.Government to improve market access for U.S. products in the Asia-Pacific region.Moreover, ATPC also believes that passage of the FTA will provide an impetus to theUnited States’ trading partners to move forward to complete the Doha Round.
The Boeing Company11
The Boeing Company manufactures civil and military aircraft, spacecraft, andhelicopters; is active in leasing and air traffic management; and providesInternet-based connectivity to aircraft in flight. It employs over 156,000 people in over145 countries worldwide.
Boeing has been doing business in Australia for over 75 years. Two of Australia’sairlines operate more than 150 Boeing aircraft, with an additional 100 aircraft onorder. Boeing employs over 3,000 people at its facilities located in Australia, withdirect investments totaling over $A650 million. Boeing forecasts demand forcommercial airplanes and related services in Australia at $20 billion over the next 20years.
The Boeing Company states that the expansion of international trade is vital to thenational security of the United States, and critical to the economic growth of the UnitedStates. Therefore, Boeing supports the U.S.-Australia FTA. According to Boeing,reducing trade barriers between the two countries and expanding two-way tradethrough the FTA will facilitate a faster rate of economic growth and prosperity.
11 Rudy F. de Leon, Senior Vice President, The Boeing Company.

160
Distilled Spirits Council of the United States12
The Distilled Spirits Council of the United States (DISCUS) is a national tradeassociation representing producers and marketers of distilled spirits in the UnitedStates. DISCUS member companies represent a substantial portion of U.S. spiritsproduction and include leading multinational producers of spirits. The associationstates that Australia is a leading and growing market for U.S. exports, accounting fornearly $60 million or 10 percent of total U.S. spirits exports in 2003. DISCUS supportsthe U.S.-Australia FTA, which will eliminate Australian tariffs of 5 percent ad valoremon U.S. distilled spirits.
DISCUS maintains that the five percentage point tariff advantage for U.S. spirits,relative to EU and other competitors’ products, will save U.S. spirits producers $3million annually, and is projected to lead to an immediate 4 percent increase in thevolume of U.S. spirits exports to Australia. DISCUS states that bulk shipments ofwhiskey, used in the growing ready-to-drink products category, likely will experiencethe greatest benefit under an FTA. DISCUS states that bottled U.S. whiskey thatcompetes directly with Scotch and Irish whiskies also will benefit from the competitiveadvantage of duty-free treatment. Moreover, DISCUS argues that tariff eliminationunderanFTA will “level the playing field” as U.S. NTR tariffs onmost spirits arealreadyfree of duty.
DISCUS further notes that the U.S.-Australia FTA will provide explicit recognition that“bourbon” and “Tennessee whiskey” are distinctive products of the United States. Theassociation contends that such protection is important because there have been“numerous instances” in Australia and other markets where product labels andtrademarks have improperly used these terms.DISCUS argues that explicit recognitionof these distinctive U.S. products will protect U.S. producers and ensure Australianconsumers that products labeled “bourbon” and “Tennessee whiskey” aremanufactured in accordance with U.S. standards.
Electronic Data Systems13
Electronic Data Systems (EDS) is a global information technology services companywith more than 130,000 employees worldwide, serving more than 35,000 businessand government clients in 57 countries. EDS reported revenues of $21.5 billion in2003, with over 40 percent of the revenues coming from overseas business. EDS hasplayed an integral role in the Australian services market since 1985 and, currently,close to 6,000 EDS employees provide a broad range of computer and related
12 Christine A. LoCascio, Director, International Issues and Trade, Distilled Spirits Council of theUnited States.
13 William R. Sweeney, Jr., Vice President, Global Government Affairs, Electronic Data Systems.

161
services to both Australian public-and private-sector clients. EDS supports theU.S.-Australian FTA. The firm states that the FTA addresses issues so as to benefit EDSand the worldwide information technology services market in general. Further, EDScontends that the FTA will lead to greater economic integration between the UnitedStates and Australia, which will create opportunities for EDS, its U.S. competitors, andits Australian counterparts. FTA components that garnered specific endorsementinclude the Agreement’s adoption of a comprehensive “negative list” approach toliberalization. Specifying only the exemptions to liberalization leaves trade in allunspecified sectors unrestricted, which is particularly useful in the informationtechnology industry because it competes on innovation and rapidly brings newproducts to market. Without this approach, new services and applications risk notbeing covered by the Agreement’s commitments.
EDS identified electronic commerce and IPR as two topics covered by the FTA that areof particular importance to the information technology sector. EDS supports provisionswithin the FTA that ensure liberal and open trade transacted via informationtechnology. EDS supports provisions that provide for the nondiscriminatory treatmentof electronically delivered products, avoid barriers that impede the use of electroniccommerce, and those that prohibit customs duties for digital products deliveredelectronically. With regard to IPR, EDS supports the FTA’s vigorous standards ofprotection and enforcement for copyrights and other intellectual property. Suchprotection is considered critical to trade and investment in IT sectors reliant on IPR suchas software development.
Family Dairies USA14
Family Dairies USA (FDUSA) is the sixth-largest dairy cooperative in the United Statesheadquartered in Madison, Wisconsin. It has 4,200 member farms and processes 5.5billion pounds of milk annually. FDUSA opposes the U.S.-Australia FTA and states thatit will be a detriment to all producers. FDUSA notes that Australia will be able toincrease its current quota access three-fold in the first year, which will then increase 5percent per annum indefinitely. The Agreement not only increases access to productscurrently subject to TRQs, but also establishes new TRQs on products that currently areexcluded from the U.S. market (such as milk, ice cream, and certain types of cheese).Additional market access toAustraliandairyproducts comesat aparticularly bad timeforU.S. dairy farmers whoare recovering from a period whenmilk prices were at theirlowest levels in decades. FDUSA notes that the additional access to Australia’s productis equivalent to the amount of product removed from the U.S. market under a newproducer-operated supply control scheme (the CWT Program). FDUSA explains thatadditional imports have a significant effect on prices because of the inelastic demandfor milk and dairy products; that is, small changes in supply of imports typically lead to
14 Stewart G. Huber, Vice-President/Board of Directors, Family Dairies USA.

162
relatively large changes in dairy prices and revenues. Other concerns raised byFDUSA are the apparent lack of rules of origin or transhipment regulations and theovervaluation of the Australia dollar.
Hawaii Department of Agriculture15
The Hawaii Department of Agriculture (HDOA) opposes the inclusion of macadamianuts in the U.S.-Australia FTA, asserting that it will result in severe negativeconsequences to the U.S. industry based in Hawaii. The HDOA’s opposition is basedon its contention that the current import tariffs have allowed U.S. producers andprocessors to remain relatively competitive in the global market for macadamia nutsand products. The HDOA states that worldwide increases in production will besignificant as Australia’s already large macadamia nut production increases in thenear future when recently planted trees reach their full production potential.
The HDOA states that the advantages of the Hawaiian industry’s 50-year commitmentto research, development, and marketing to improve nut varieties, increase yields,establish nutritional claims, and develop the U.S. market will be given away to itsforeign competitors if the proposed Agreement is adopted. According to the HDOA,macadamia nuts are important to Hawaii’s local economy as they represent one of themost successful agricultural value-addedenterprises in theState. TheHDOAstates thatthe sector that further processes macadamia nuts in Hawaii offers expandedopportunities for employment in factories, delivery services, and sales. In addition, theHDOA maintains, over 96 percent of Hawaii’s production of macadamia nuts takesplace on the Island of Hawaii, where most employment is dependent on the agriculturesector.
Hawaii Macadamia Nut Association16
The Hawaii Macadamia Nut Association (HMNA) opposes the U.S.-Australia FTA,which it asserts will have a severe negative impact on Hawaii’s macadamia industry.The HMNA claims that the removal of import tariffs on macadamia nuts andmacadamia nut products from Australia will result in a lower average macadamiakernel price in the United States decreasing the return to Hawaii’s growers. Accordingto the HMNA, lowerprices will severelyweakenHawaii’s macadamianut industry -thefourth-largest agricultural commodity in Hawaii -and its economic contribution to theState.
15 Sandra Lee Kunimoto, Chairperson, Board of Agriculture, Hawaii Department of Agriculture.16 David G. Rietow, President, Hawaii Macadamia Nut Association.

163
The HMNA notes that Australian macadamia nut production currently exceeds that ofHawaii and is expected to grow because a significant amount of its planted acreage isin the pre-bearing stage and that new plantings are ongoing. The U.S. market isviewed by producers as a high volume market so that any increased production isexpected to be directed to the United States. According to the HMNA, most of theseadditional sales are expected tobe to the low-end retail business. The HMNA contendsthat increased imports of Australian macadamia kernel and manufactured productswill increase pressure on Hawaii’s producers to increase spending on marketdevelopment initiatives that distinguish Hawaii’s macadamia nuts from imports. Thiswill increase the average cost of production for Hawaiian kernel and retail productsrelative to Australian imports.
International Intellectual Property Alliance17
The International Intellectual Property Alliance (IIPA) is a coalition of six tradeassociations representing almost 1,100 U.S. companies that produce and distributematerials protected by copyright laws throughout the world. Copyright-protectedmaterials produced by companies represented by these associations include all typesof computer software, including business applications and entertainment software;theatrical films, television programs, home videos and digital representations ofaudiovisual works; music, records, CDs, DVDs, and audiocassettes; and textbooks,tradebooks, reference and professional publications, and journals in both electronicand print media. IIPA supports the U.S.-Australia FTA provisions on intellectualproperty protection.
Among the highlights of the FTA reported by IIPA include requirements that (1) requireAustralia to fully implement provisions of two international treaties that addressInternet and other digital piracy, (2) extend the terms of protection for all protectedsubject matter to terms more closely approximating those available underU.S. law, (3)ensure that Australian government agencies use only legal software, (4) forbid theunauthorized circumvention of encrypted program-carrying satellite signals, and (5)strengthen Australia’s enforcement of intellectual property rights.
A major disappointment to IIPA was that the FTA did not provide national treatment toU.S. producers of sound recordings that would ensure their ability to take advantageof traditional broadcasting channels available to domestic firms. In general, however,IIPA is pleased with the intellectual property provisions of the U.S.-Australia FTA andurges the Agreement’s early adoption.
17 Steven J. Metalitz, Senior Vice President, International Intellectual Property Alliance.

164
National Association of Manufacturers18
The National Association of Manufacturers (NAM) is the largest industrial tradeassociation in the United States. The NAM represents 14,000 members and 350member associations serving manufacturers and employees in every industrial sectorand all 50 states. Most of NAM’s members are small and mid-sized companies. NAMsupports the U.S.-Australia FTA because virtually all of Australia’s duties on U.S.manufactured goods will be eliminated the moment the FTA comes into force. Withmanufactured goods accounting for 95 percent of total U.S. exports to Australia, theFTA will provide immediate benefits to a wide range of U.S. manufacturers. The NAMestimates that the elimination of Australia’s 4.7 percent average industrial tariff onU.S. products would lead toanannual increase inU.S. exports of manufactured goodsto Australia of about $1.8 billion. Much of this gain in exports would come fromdisplacement of EU-manufactured goods’ exports to Australia.
The NAM notes that the FTA will provide greater market access for U.S. manufacturersby (1) helping to ensure that Australian technical standards and regulations formanufactured products do not act as barriers to U.S. exports; (2) allowing U.S. firms tocompete for business from Australian government entities, a market previously closedto them; and (3) improving customs procedures, through, among other things, greatertransparency, efficiency, and the faster release of goods. Finally, the NAM notes thatthe FTA will further solidify the strong partnership between the United States andAustralia, thus helping to open world markets and strengthening the world tradingsystem.
National Farmers Union19
National Farmers Union (NFU) is a general farm organization with a membership ofnearly 250,000 farm and ranch families throughout the United States. Its primarygoalhas been to sustain and strengthen family farm and ranch agriculture. The NFUbelieves that the U.S.-Australia FTA poses a serious threat to many sectors of the U.S.agricultural sector, while providing no opportunities for additional exports. Withrespect towheat, the NFU is concerned that the Australia Wheat Board still operatesasa State trading enterprise that does not act competitively in the market. With regard tobeef, the NFU notes that the effect of the Agreement is 250-400 million pounds ofadditional beef imports from Australia within the first nine years of the Agreement. Thiscould have a significant effect on both U.S. beef and dairy producers. With regard todairy, the NFU expects that the Agreement will result in the displacement of U.S. dairyproducts of about US$40-45 million, equivalent to the production of about 15,000dairy cows. There is also concern about transshipment of product from New Zealand
18 Franklin Vargo, Vice President for International Economic Affairs, National Association ofManufacturers.
19 Joaquin Contente, President, California Farmers Union on behalf of the National Farmers Union.

165
as a result of Fonterra’s merger with the Australian dairy processing company, BonlacFoods Ltd. Finally, the NFU voices concern over how the Agreement deals withsanitary/phytosanitary issues; instead of the creation of a working group to reviewSPS issues, NFU would have preferred a specific timetable for removal of SPSrestrictions on U.S. products exported to Australia.
National Milk Producers Federation20
The National Milk Producers Federation (NMPF) is a national organization thatrepresents the interests of dairy farmers and cooperatives throughout the UnitedStates. The NPMF opposes the U.S.-Australia FTA. In its view, the Agreement will resultin lower milk prices and farm income, and lead to the loss of numerous U.S. dairyfarms. Further, the Agreement will bring no new opportunities for exports. The NMPFestimates that the Agreement will lead to55 millionpounds of additional imported milkproducts and to a drop in dairy farm income of US$237 million in the first year afterimplementation. Although most of the impacts are expected to be felt in the first year ofthe Agreement, losses will continue to mount over time, and accrued dairy incomelosses resulting from the Agreement after 25 years will exceed $1 billion.
News Corporation, Inc.21
News Corporation, Inc. is a diversified international media and entertainmentcompany, operating businesses in filmed entertainment, television, cable networkprogramming, direct broadcast satellite television, magazines and inserts,newspapers, and bookpublishing. News Corporation, Inc. supports the U.S.-AustraliaFTA. News Corporation, Inc. asserts that this FTA will benefit major U.S. mediacompanies and smaller content companies in both countries. Additionally, NewsCorporation Inc. expresses the opinion that this FTA will provide legal infrastructure-encompassing effective laws and rigorous enforcement-that will facilitate investment,including investment innew technologyand distributionmethods. Consequently,NewsCorporation, Inc. anticipates increased production in filmed entertainment as well asgreater use of digital technologies as a result of the FTA.
News Corporation, Inc., in conjunction with the Entertainment Industry Coalition forFree Trade (EIC), specifically highlights the following beneficial provisions achieved inthis FTA: (1) TRIPS-plus provisions for intellectual property protections, such asimplementing the WIPO Internet Treaties, ensuring that copyright owners haveexclusive rights to make works available online, and protecting copyrighted works forextended terms; (2) strengthened intellectual property enforcement, which will
20 Peter Vitaliano, Vice President, Economic Policy and Market Research, National Milk ProducersFederation.
21 Rick Lane, Vice President, Government Affairs, News Corporation, Inc.

166
increase criminal and civil protection against unlawful decoding of encrypted satellitetelevision signals, and authorized seizure, forfeiture, and destruction of piratedproducts and equipment; (3) zero tariffs on entertainment products, including allmovies, music, consumer products, books, and magazines exported to the country,and a requirement that customs valuations be based on the value of the carrier mediarather than projected royalties; (4) improved market access, ensuring distribution ofU.S. films and television programs over cable networks, satellite networks, and theInternet; and (5) free trade in digital downloads, including commitments that ensurenondiscriminatory treatment ofdigital products andpreclude the impositionof customsduties on such items.
Overall, News Corporation, Inc. praises the achievements of this FTA, stressing thatthis Agreement will serve as a model for future FTAs, specifically in terms of intellectualproperty protection.
Ranchers - Cattlemen Action Legal Fund-United Stockgrowers ofAmerica22
Ranchers-Cattlemen Action Legal Fund – United Stockgrowers of America (R-CALFUSA) is a national trade association that represents approximately 9,000 individualmembers in 46 states and has 50 local and state-level affiliates. R-CALF’s originalposition concerning the U.S.-Australian FTA was that cattle and beef should beexcluded; because, in general, R-CALF believes that bilateral FTAs with majoragricultural producing countries with small internal markets do not address the globalbeef market distortions that restrict opportunities for U.S. beef exports. Consequently,R-CALF is concerned that the U.S.-Australia FTA grants increased access forAustralian beef exports to the United States, while there is limited benefit to the U.S.cattle and beef industries.
Although R-CALF recognizes that the 18-year phase-in period acknowledges theimport sensitivity of the U.S. cattle and beef sector, it nevertheless believes that withoutadditional access for U.S. beef exports to third-country markets, even small increasesin import volumes will have significant adverse effects on U.S. cattle producers, andlead to further erosion in the profitability of the U.S. cattle industry. R-CALF isconcerned that the Agreement does not address artificial advantages provided toAustralian beef producers that distort production decisions and result in moreAustralian cattle and beef production for export than would otherwise occur. R-CALFreports that these artificial advantages include lower feed grain prices resulting fromstate-trading operations and numerous business development programs operated byvarious State governments. R-CALF believes that the safeguard provisions included inthe Agreement represent only the minimum necessary level of protection, and believes
22 Brett DeBruycker, International Markets Vice Chairman, Ranchers-Cattlemen Action Legal Fund,United Stockgrowers of America.

167
that these provisions should be implemented onanautomatic rather thandiscretionarybasis. Moreover, R-CALF believes that the safeguard should have provided forautomatic snap-back to the full MFN rate rather than 65 percent of the MFN rate.R-CALF is very concerned about granting Australia additional access to the U.S.market since benefits to the U.S. cattle industry are limited and the potential exists forsignificant negative impact on U.S. cattle producers.
Time Warner, Inc. on Behalf of the Entertainment Industry Coalition forFree Trade (EIC)23
Time Warner, Inc., is a leading media and entertainment company, operating infilmed entertainment, interactive services, television networks, cable systems, andpublishing. Time Warner, Inc. supports the U.S.-Australia FTA. Time Warner, Inc.lauds the market access commitments incorporated in the Agreement in that theypromote continued access to the Australian market. Although Australia will retainseveral existing restrictions on market access, U.S. industry does not find them to beunduly burdensome.
Time Warner Inc., on behalf of the EIC, specifically highlights the following beneficialprovisions achieved in this FTA: (1) TRIPS-plus provisions for intellectual propertyprotections, such as implementing the WIPO Internet Treaties, ensuring that copyrightowners have exclusive rights to make works available online, and protectingcopyrighted works for extended terms; (2) strengthened intellectual propertyenforcement, which will increase criminal and civil protection against unlawfuldecoding of encrypted satellite television signals, and authorized seizure, forfeiture,and destruction of pirated products and equipment; (3) zero tariffs on entertainmentproducts, including all movies, music, consumer products, books, and magazinesexported to the country, and a requirement that customs valuations be based on thevalue of the carriermedia rather thanprojected royalties; (4) improved market access,ensuring distribution of U.S. films and television programs over cable networks,satellite networks, and the Internet; and (5) free trade in digital downloads, includingcommitments that ensurenondiscriminatory treatment ofdigital products andprecludethe imposition of custom duties on such items.
Overall, Time Warner Inc. praises the achievements of this FTA. However, U.S.industry expresses disappointment in Australia’s denial of national treatment to U.S.producers of sound recordings with respect to their ability to exploit their productsthrough traditional broadcasting channels. Time Warner Inc. also expresses hope thatthe U.S. Government might address movement of persons in future FTAs.
23 Laura Lane, Vice President, Public Policy, Time Warner, Inc.

168
U.S. Chamber of Commerce24
The U.S. Chamber of Commerce (“the Chamber”) is the world’s largest businessfederation, representing more than 3 million businesses, nearly 3,000 state and localchambers, 830 associations, and more than 90 American Chambers of Commerceabroad. The Chamber strongly supports the U.S.-Australia FTA because it offersAmerican companies greater access to the Australian market, advances trade andprosperity with Australia, increases U.S. competitiveness in the Asia-Pacific region,and contributes to U.S. and Australian global and regional trade liberalizationobjectives.
The Chambernotes that the FTA will immediately eliminate tariffs on over99 percent ofU.S.-manufactured goods exports toAustralia, providing greater export opportunitiesfor U.S. firms. The FTA provides greater protection for U.S. investment in Australia,including raising the threshold for screening acquisitions by U.S. investors in Australiato A$800 million. The Chamber notes, however, the absence of investor-state disputesettlement provisions in the FTA. The opening up of the government procurementmarket in Australia to U.S. firms will give them increased business opportunities, whilemore transparent and fair procedures in Australian customs administration willexpedite the entry of U.S. goods into Australia. According to the Chamber, theintellectual property rights provisions of the FTA will require a higher degree ofprotection for U.S. patents, trademarks, copyrights, and Internet domain names inAustralia. Finally, the Chamber states that the FTA will provide increased access intothe Australian market for a variety of U.S. services industries, including advertising,architecture, audiovisual services, education services, electronic commerce, expressdelivery services, and financial services.
24 Myron Brilliant, Vice President, Asia, U.S. Chamber of Commerce.

A-1
APPENDIX AREQUEST LETTER

A-2


APPENDIX BFEDERAL REGISTER NOTICE


C-1
APPENDIX CHEARING PARTICIPANTS

C-2

C-3
CALENDAR OF PUBLIC HEARING
Those listed below appeared as witnesses at the United States International TradeCommission’s hearing:
Subject: U.S.-Australia Free Trade Agreement: PotentialEconomywide and Selected Sectoral Effects
Inv. No.: TA-2104-11
Date and Time: March 30, 2004 - 9:30 a.m.
Sessions were held in connection with this investigation in the Main Hearing Room(room 101), 500 E Street, S.W., Washington, D.C.
EMBASSY APPEARANCE:
His Excellency Michael Thawley, Australian Ambassador to the United States ofAmerica
ORGANIZATION AND WITNESS:
PANEL 1:The American-Australian Free Trade Agreement Coalition (AAFTAC)Washington, D.C.
William C. Lane, Co-Chairman
National Association of Manufacturers (NAM) Washington, D.C.
Frank Vargo, Vice President, InternationalEconomic Affairs, International Trade Policy

C-4
ORGANIZATION AND WITNESS:
PANEL 1 (continued):Automotive Trade Policy CouncilWashington, D.C.
Stephen J. Collins, President
Association of Equipment Manufacturers (AEM)Washington, D.C.
Megan Carpentier, Manager, Government Affairs
Distilled Spirits Council of the United States (DISCUS)Washington, D.C.
Christine LoCascio, Director, International Issuesand Trade
PANEL 2:National Farmers UnionWashington, D.C.
Joaquin Contente, President, California Farmers Union
Ranchers-Cattlemen Action Legal Fund (R-CALF USA)Billings, MT
Brett DeBruycker, Vice Chairman, Trade Committee

C-5
ORGANIZATION AND WITNESS:
PANEL 3:Time Warner Inc.Washington, D.C.
Laura Lane, Vice President, Public Policy
EDSWashington, D.C.
William R. Sweeney, Jr., Vice President,Global Government Affairs
News CorporationWashington, D.C.
Rick Lane, Vice President, Government Affairs
Air Courier Conference of America, International (ACCA)Falls Church, VA
Susan M. Presti, Executive Director
--END--


D-1
APPENDIX DTechnical Appendix

D-2

D-3
APPENDIX DTECHNICAL APPENDIX
The general equilibrium modeling system employed to simulate the free tradeagreement is built around the GTAPinGAMS software developed by Rutherford andPaltsev.1 The GTAPinGAMS data system was modified to accommodate the mostrecent prerelease 1 of the GTAP version 6 data. In addition, the actual GTAPinGAMSmulti-region comparative-static simulation model was expanded to includeappropriate behavioral structures and to report elements relevant to the study. Thisappendix outlines the important methodological and structural assumptions of themodel.
There are several advantages to using the prerelease version of the GTAP data baserather than the most recently published version. For one thing, trade flows andnational economic data have been updated in the new data to a 2001 base year from1997 (although for this study the Commission has further updated the data to 2005).More importantly, much workhas beendone to improve the protectiondata in thedatabase. Rather than relying for the most part on WTO bound tariffs, the new data reflecta strong effort to collect data on actual applied tariffs (generally smaller than boundrates); for this reason, apparent duties on some commodities have declined from thosein previous versions of the data set. This is aside from the fact that furtherimplementation of the Uruguay Round and other trade agreements has actuallyreduced duties. Also, this new version of the data base reflects work that is in progressto develop appropriate methods to quantify tariff rate quotas and nontariff measures.Work remains to be done in these areas, but the current prerelease version 6 of theGTAP data base appears to provide the best available basis for the analyses of currenttrade policy with appropriate measures of trade and restrictions.
Model Scope
The simulation model represents the world trade equilibrium, and the production andconsumption structures of the world economy. The trade equilibrium is defined by thebilateral trade flows between 15 economies over 23 aggregate commodities, listedbelow. These regions and commodities are aggregated out of the regions andcommodities available inprerelease 1 of the GTAP version6database. The commodityand regional aggregations were driven by the Commission’s intention to include themost relevant sectoral detail considering the policy shocks included in theU.S.-Australia FTA and the benchmarking to the 2005 base year.
1 Thomas F. Rutherford and Sergey V. Paltsev, GTAPinGAMS and GTAP-EG: Global Datasets forEconomic Research and Illustrative Models, Department of Economics, University of Colorado WorkingPaper, September 2000.

D-4
RegionsAustralia New ZealandCanada and Mexico European Union 15Chile MoroccoMercosur Southern African Customs UnionRest of the Americas Rest of Subsaharan AfricaSingapore United StatesEast Asia Other CountriesRest of Asia
CommoditiesGrains Wood productsSugar cropsVegetables, fruits, and nuts
Petroleum, coal, chemicals, rubber,and plastic products
Other crops Ferrous metalsCattle and horses Metals n.e.c. and metal productsAnimal products n.e.c. Motor vehicles and partsCoal, oil, gas, and other minerals Transport equipment n.e.c.Meat products Electronic equipmentDairy products Other machinery and equipmentSugar Other manufacturesOther processed food and
tobacco productsServicesCapital goods
Textiles, apparel, and leather products
Structure of the Regional Economies
Each region of the model is characterized by three components. First, primary factorendowments determine the overall capacity of the economy. Primary factors includeland, labor, and capital. Households earn net of tax income from the primary factorsand are assumed not to change the total supply of primary factors across thesimulation.
Second, a region is characterized by its production technologies. These productiontechnologies determine the ability of the economy to transform primary factors andintermediate inputs into valuable output. The model employs a nestedconstant-elasticity-of-substitution production structure. Primary factors are combinedin a Cobb-Douglas nest. The primary factors aggregate is then combined withintermediate inputs in a Leontief nest. The resulting production function exhibitsconstant returns to scale and firms are assumed to be competitive such that marginalcost equals the output price.
Third, a region is characterized by its preferences for commodities. The model is static,and thus abstracts from changes in the aggregate mix of final demand on investmentand government spending. Households do react to policy-induced price changes,

D-5
however, by changing the mix of goods and services consumed. Household welfare isassumed to be Cobb-Douglas and maximized subject to market prices and incomeearned from ownership of primary factors.
Trade Equilibrium
Consistent with the objectives of the Commission analysis, substantial detail is built intothe mechanisms by which the different regions interact through international trade.Goods and services that are traded are assumed to be differentiated by theirrespective region of origin. Each region has a set of technologies for combining thesedifferentiated goods and services into a composite that may be consumed or used asan intermediate input. The technology is a nested constant-elasticity-of-substitutionaggregation; imports from different sources are combined in a lower nest, then theimport aggregate and the domestic variety is combined to produce the composite. Thisis a standard structure adopted by most contemporary trade simulation models.
The trade equilibrium is sensitive to the particular substitution elasticities assumed forthe differentiated goods aggregation. Table D-1 reports the central estimates of thesubstitution elasticity between import varieties, and their respective 95 percentconfidence bounds. The central estimates are the trade-weighted averages fromdisaggregate (GTAP level) econometric estimates presented by Hertel, Hummels,Ivanic, and Keeny.2 The confidence bounds are generated by making 1,000 randomdraws from the implied probability density functions of the econometric estimates andthen computing the trade-weighted average for the aggregate commodity. Rankordering these 1,000 draws per commodity, the 95 percent lower bound is the 25th
draw and the 95 percent upper bound is the 975th draw. Three commodities did nothave reliable econometric estimatesandwere thereforeassigned adefault elasticityof7. Conditional on the integrity of the estimating procedure, it is likely that the true valueof the substitution elasticity for the other commodities falls within the 95 percentconfidence interval. Consistent with standard practice, the substitution elasticitybetween the domestic variety and the import aggregate is set to one-half the importvariety substitution elasticity.
The policy instruments that are relevant for the trade equilibrium include import tariffsand export taxes. Table D-2 reports the 2005 benchmark trade policy between theUnited States and Australia. The benchmark policies include those distortions includedin version 6 of the GTAP database and modified to include relevant policy changesbetween 2001 and 2005.
2 Thomas Hertel, David Hummels, Maros Ivanic and Roman Keeney, How Confident Can We Be inCGE-Based Assessments of Free Trade Agreements? GTAP Working Paper No. 26, 2003, available athttp://www.gtap.agecon.purdue.edu/resources/working_papers.asp
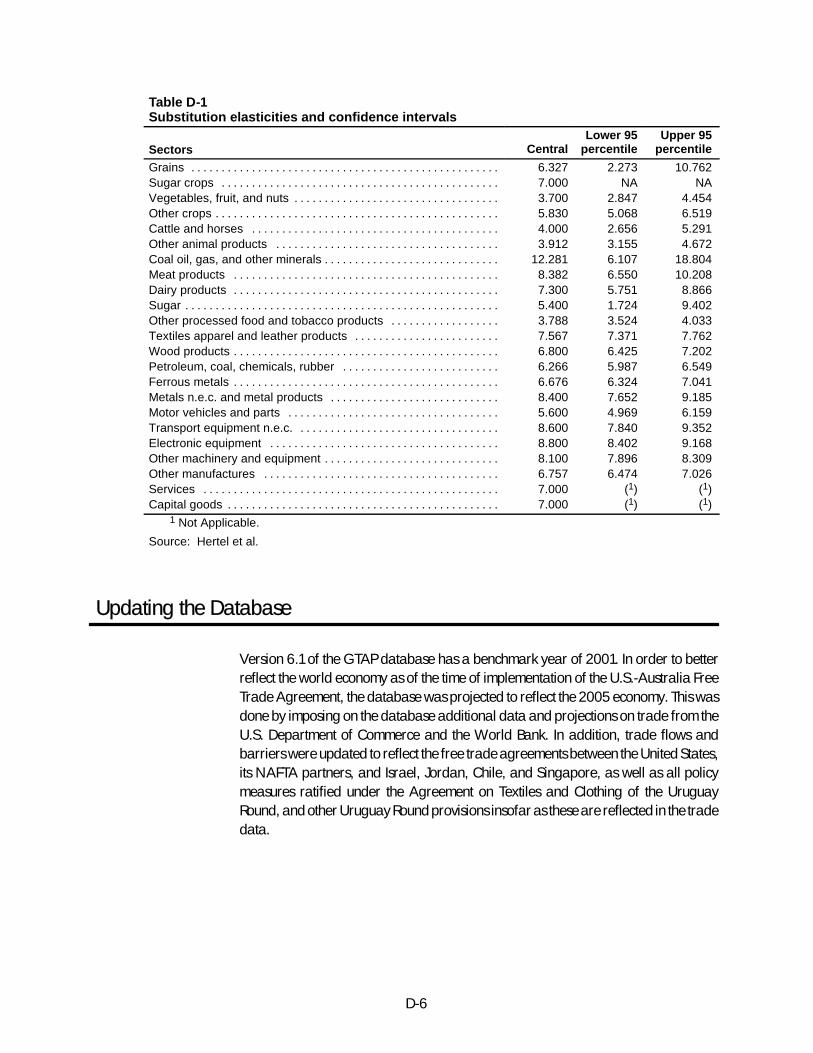
D-6
Table D-1Substitution elasticities and confidence intervals
Sectors CentralLower 95
percentileUpper 95
percentile
Grains . . . . . . . . . . . . . . . . . . . . . . . . . . . . . . . . . . . . . . . . . . . . . . . . . . . 6.327 2.273 10.762Sugar crops . . . . . . . . . . . . . . . . . . . . . . . . . . . . . . . . . . . . . . . . . . . . . . 7.000 NA NAVegetables, fruit, and nuts . . . . . . . . . . . . . . . . . . . . . . . . . . . . . . . . . . 3.700 2.847 4.454Other crops . . . . . . . . . . . . . . . . . . . . . . . . . . . . . . . . . . . . . . . . . . . . . . . 5.830 5.068 6.519Cattle and horses . . . . . . . . . . . . . . . . . . . . . . . . . . . . . . . . . . . . . . . . . 4.000 2.656 5.291Other animal products . . . . . . . . . . . . . . . . . . . . . . . . . . . . . . . . . . . . . 3.912 3.155 4.672Coal oil, gas, and other minerals . . . . . . . . . . . . . . . . . . . . . . . . . . . . . 12.281 6.107 18.804Meat products . . . . . . . . . . . . . . . . . . . . . . . . . . . . . . . . . . . . . . . . . . . . 8.382 6.550 10.208Dairy products . . . . . . . . . . . . . . . . . . . . . . . . . . . . . . . . . . . . . . . . . . . . 7.300 5.751 8.866Sugar . . . . . . . . . . . . . . . . . . . . . . . . . . . . . . . . . . . . . . . . . . . . . . . . . . . . 5.400 1.724 9.402Other processed food and tobacco products . . . . . . . . . . . . . . . . . . 3.788 3.524 4.033Textiles apparel and leather products . . . . . . . . . . . . . . . . . . . . . . . . 7.567 7.371 7.762Wood products . . . . . . . . . . . . . . . . . . . . . . . . . . . . . . . . . . . . . . . . . . . . 6.800 6.425 7.202Petroleum, coal, chemicals, rubber . . . . . . . . . . . . . . . . . . . . . . . . . . 6.266 5.987 6.549Ferrous metals . . . . . . . . . . . . . . . . . . . . . . . . . . . . . . . . . . . . . . . . . . . . 6.676 6.324 7.041Metals n.e.c. and metal products . . . . . . . . . . . . . . . . . . . . . . . . . . . . 8.400 7.652 9.185Motor vehicles and parts . . . . . . . . . . . . . . . . . . . . . . . . . . . . . . . . . . . 5.600 4.969 6.159Transport equipment n.e.c. . . . . . . . . . . . . . . . . . . . . . . . . . . . . . . . . . 8.600 7.840 9.352Electronic equipment . . . . . . . . . . . . . . . . . . . . . . . . . . . . . . . . . . . . . . 8.800 8.402 9.168Other machinery and equipment . . . . . . . . . . . . . . . . . . . . . . . . . . . . . 8.100 7.896 8.309Other manufactures . . . . . . . . . . . . . . . . . . . . . . . . . . . . . . . . . . . . . . . 6.757 6.474 7.026Services . . . . . . . . . . . . . . . . . . . . . . . . . . . . . . . . . . . . . . . . . . . . . . . . . 7.000 (1) (1)Capital goods . . . . . . . . . . . . . . . . . . . . . . . . . . . . . . . . . . . . . . . . . . . . . 7.000 (1) (1)
1 Not Applicable.
Source: Hertel et al.
Updating the Database
Version 6.1 of the GTAP database has a benchmark year of 2001. In order to betterreflect the world economy as of the time of implementation of the U.S.-Australia FreeTrade Agreement, the database was projected to reflect the 2005 economy. This wasdone by imposing on the database additional data and projections on trade from theU.S. Department of Commerce and the World Bank. In addition, trade flows andbarriers were updated to reflect the free trade agreements between the United States,its NAFTA partners, and Israel, Jordan, Chile, and Singapore, as well as all policymeasures ratified under the Agreement on Textiles and Clothing of the UruguayRound, and other Uruguay Round provisions insofar as these are reflected in the tradedata.

D-7
Table D-2Benchmark tariffs (2005)
(Percent)
CommodityU.S. imports
Australianimports
CommodityTariffs Tariffs
Vegetables, fruits, and nuts . . . . . . . . . . . . . . . . . . . . . . . . . . . . . 4.00 1.00Other crops . . . . . . . . . . . . . . . . . . . . . . . . . . . . . . . . . . . . . . . . . . . . 30.16 0Cattle and horses . . . . . . . . . . . . . . . . . . . . . . . . . . . . . . . . . . . . . . 2.00 0Animal products n.e.c. . . . . . . . . . . . . . . . . . . . . . . . . . . . . . . . . . . 0.67 0Coal, oil, gas, other mineral . . . . . . . . . . . . . . . . . . . . . . . . . . . . . . 0 18.31Meat products . . . . . . . . . . . . . . . . . . . . . . . . . . . . . . . . . . . . . . . . . 7.99 0Dairy products . . . . . . . . . . . . . . . . . . . . . . . . . . . . . . . . . . . . . . . . . 25.00 5.00Sugar . . . . . . . . . . . . . . . . . . . . . . . . . . . . . . . . . . . . . . . . . . . . . . . . . 17.00 15.00Other processed food and tobacco products . . . . . . . . . . . . . . . 12.85 20.70Textile, apparel, and leather products . . . . . . . . . . . . . . . . . . . . . 7.76 0Wood products . . . . . . . . . . . . . . . . . . . . . . . . . . . . . . . . . . . . . . . . . 2.00 5.00Petroleum, coal, chemicals, rubber, plastic . . . . . . . . . . . . . . . . . 3.83 3.62Ferrous metals . . . . . . . . . . . . . . . . . . . . . . . . . . . . . . . . . . . . . . . . . 2.00 5.69Metals n.e.c. and metal products . . . . . . . . . . . . . . . . . . . . . . . . . 2.00 2.00Motor vehicles and parts . . . . . . . . . . . . . . . . . . . . . . . . . . . . . . . . 4.50 9.50Transport equipment n.e.c. . . . . . . . . . . . . . . . . . . . . . . . . . . . . . . 1.00 0Electronic equipment . . . . . . . . . . . . . . . . . . . . . . . . . . . . . . . . . . . 1.00 1.00Other machinery and equipment . . . . . . . . . . . . . . . . . . . . . . . . . . 1.00 3.00Other manufactures . . . . . . . . . . . . . . . . . . . . . . . . . . . . . . . . . . . . 1.47 3.36Services . . . . . . . . . . . . . . . . . . . . . . . . . . . . . . . . . . . . . . . . . . . . . . 0 0.06
Source: GTAP and Commission calculations. Note that to conform to the FTA, the simulation reported inthis study does not remove the tariff on sugar, and only partially removes the tariff on dairy products. Seetext.
Solution Technique
In comparative static experiments, such as the one conducted in this report, trade isliberalized completely in all goods subject to liberalization under the free tradeagreement. There is no implicit or explicit time elapsing in the model. This means, first,that all provisions of the Agreement are assumed to be fully phased in immediately,rather than over an 18-year period. And second, it means that all effects of theAgreement are felt immediately, without an adjustment period. The modeled resultscan be considered to be long-run effects of a fully implemented agreement, in aneconomy otherwise identical to the baseline 2005 economy.
The analysis employs a comparative static framework in which a baseline equilibriumdepiction of the U.S. economy, as of January 1, 2005, is derived through a set ofbalanced accounts of trade, production, consumption, and taxes. Once this baselinehas been created, policy shocks are imposed on the balanced model. These policyshocks consist of the reduction or elimination of tariffs, TRQs and quotas agreed to inthe FTA.
Having imposed the policy shock by imposing the new levels of the tariffs and taxequivalents of the trade distortions, the model is rebalanced, and new values for trade

D-8
flows, outputs, employment, welfare, GDP, and other values are generated. Thedifference between the baseline values of these variables and their new values isinterpreted as the estimated impact of the tariff removal under the free tradeagreement.
Model Limitations
Economic models attempt to capture the most important factors for the question underconsideration. However, they are limited in their ability to reflect the degree ofcomplexity evident in the real world. One source of possible bias in virtually anyquantitative analysis of economic data arises from data aggregation. Internationaltrade occurs in thousands of different products and services. The United States collectstrade data under about 17,000 statistical categories and over 10,000 tariff rate lines.Formost general equilibriumanalysis, thesegroupings represent far toomuch detail tobe tractable computationally, or to be linked with more aggregate data on productionand consumption processes. The aggregation into broader categories introduces twogeneral sources of bias into a modeling exercise.
One source of bias involves the calculation of tariffs for aggregated productcategories. In this study, trade-weighted average tariffs were calculated, using thevalue of imports in a tariff line to weight the tariff in that line. This procedure tends tomask the importanceof thoseproductswithin theaggregate that haveparticularlyhightariffs, and which therefore face a greater barrier to imports than would be the case ifall goods within the aggregation had the same average tariff. The relationshipbetween the effect of an import-weighted average tariff and the effects of theindividual tariffs of goods within the group depends on the correlation between thelevel of these tariffs and the price responsiveness of final demand. The effect of a hightariff in a highly price-responsive good will be understated because the high tariff itselfwill cause less of the good tobe imported, giving it a small weight in the trade-weightedaverage tariff of the aggregate.
Another source of aggregation bias is due to the fact that goods within an aggregatemay not be close substitutes for one another. In particular, imported goods of aparticular category may be quite dissimilar to the domestically produced product inthat category, due among other things to a different mix of the individual goods in theaggregate. Thus a model may overstate the responsiveness of domestic production inresponse to a given tariff reduction.3
Despite these limitations, model simulations such as those performed here can beuseful in providing insights on the effects of an FTA on measures of the economy. Theypresent a unified and consistent framework within which to assess the policy.
3 Empirical trade models such as the one used here often apply the Armington assumption, whichtreats commodities produced in different countries as imperfect substitutes, with the degree of substitutiondescribed by the Armington substitution elasticity. This can reduce this type of bias.

D-9
Modeling Alternative Scenario Shocks
Chapter 8 discussed the comparison of alternative models of the U.S.-Australia FTA.Among the ways in which this study approaches the comparison is by asking,essentially, what results would be obtained in the USITC model if it made the sameassumptions made in other models regarding the tariff shocks to be eliminated. If thesame tariff shocks could be imposed in the USITC model as were imposed in othermodels, remaining differences between the results could be attributed to otherassumptions and structural differences among the models.
In fact, the different tariff shocks could not be directly applied to the USITC model.Because each of the alternative models uses commodity data aggregated in ways thatdiffer from the USITC model, it was necessary to reaggregate the commodities tocorrespond to those in the USITC model. Table D-3 shows the alternative policy shocksapplied in each of the three alternative models (CIE, ACIL, and Brown, Kiyota, andStern, or BKS). The table also shows the shocks as applied to the USITC aggregation.
Table D-3Alternative policy scenarios
(Percent)CIE policy shocks
CIE commodityAustralian tariffs &
non-tariff measuresU.S. tariffs &
non-tariff measuresGrains . . . . . . . . . . . . . . . . . . . . . . . . . . . . . . . . . . . . . . . . . 0.04 0.36Other crops . . . . . . . . . . . . . . . . . . . . . . . . . . . . . . . . . . . . . 0.38 0.63Sugar cane, beet . . . . . . . . . . . . . . . . . . . . . . . . . . . . . . . . 0.00 80.00Animal products . . . . . . . . . . . . . . . . . . . . . . . . . . . . . . . . . 0.00 0.08Raw milk . . . . . . . . . . . . . . . . . . . . . . . . . . . . . . . . . . . . . . . 0.00 0.00Forestry, fishing . . . . . . . . . . . . . . . . . . . . . . . . . . . . . . . . . 0.00 0.02Mining and energy . . . . . . . . . . . . . . . . . . . . . . . . . . . . . . . 0.14 0.35Meat products . . . . . . . . . . . . . . . . . . . . . . . . . . . . . . . . . . 0.06 1.99Other food products . . . . . . . . . . . . . . . . . . . . . . . . . . . . . 2.21 1.45Dairy . . . . . . . . . . . . . . . . . . . . . . . . . . . . . . . . . . . . . . . . . . 3.20 23.90Sugar . . . . . . . . . . . . . . . . . . . . . . . . . . . . . . . . . . . . . . . . . . 0.00 80.00Beverages & tobacco . . . . . . . . . . . . . . . . . . . . . . . . . . . . 4.80 1.40Textiles, clothing, and footwear . . . . . . . . . . . . . . . . . . . . 11.69 8.46Wood & paper products, publishing . . . . . . . . . . . . . . . . 4.85 0.33Chemicals, Rubber, Plastics . . . . . . . . . . . . . . . . . . . . . . 2.70 2.00Other mineral & metal products . . . . . . . . . . . . . . . . . . . . 4.47 1.73Ferrous metal products . . . . . . . . . . . . . . . . . . . . . . . . . . . 4.40 2.50Motor vehicles & parts . . . . . . . . . . . . . . . . . . . . . . . . . . . 9.30 1.40Other transport equipment . . . . . . . . . . . . . . . . . . . . . . . . 1.30 0.90Electronic equipment . . . . . . . . . . . . . . . . . . . . . . . . . . . . 0.20 1.10Other manufacturing . . . . . . . . . . . . . . . . . . . . . . . . . . . . . 2.99 0.91Utilities & other services . . . . . . . . . . . . . . . . . . . . . . . . . . 0.00 0.00Trade & transport . . . . . . . . . . . . . . . . . . . . . . . . . . . . . . . . 0.18 0.08Financial, business, rec services . . . . . . . . . . . . . . . . . . 0.94 0.03
Source: CIE 2001, table 4.2, p. 33.

D-10
Table D-3—ContinuedAlternative policy scenarios
(Percent)CIE policy shocks
USITC commodityAustralian tariffs &
non-tariff measuresU.S. tariffs &
non-tariff measures
Grains . . . . . . . . . . . . . . . . . . . . . . . . . . . . . . . . . . . . . . . . . 0.04 0.36Sugar crops . . . . . . . . . . . . . . . . . . . . . . . . . . . . . . . . . . . . 0.00 80.00Vegetables, fruits, and nuts . . . . . . . . . . . . . . . . . . . . . . . 0.38 0.63Other crops . . . . . . . . . . . . . . . . . . . . . . . . . . . . . . . . . . . . . 0.38 0.63Cattle and horses . . . . . . . . . . . . . . . . . . . . . . . . . . . . . . . 0.00 0.08Animal products n.e.c. . . . . . . . . . . . . . . . . . . . . . . . . . . . 0.00 0.08Coal, oil, gas, other mineral . . . . . . . . . . . . . . . . . . . . . . . 0.14 0.35Meat products . . . . . . . . . . . . . . . . . . . . . . . . . . . . . . . . . . 0.06 1.99Dairy products . . . . . . . . . . . . . . . . . . . . . . . . . . . . . . . . . . 3.20 23.90Sugar . . . . . . . . . . . . . . . . . . . . . . . . . . . . . . . . . . . . . . . 0.00 80.00Other processed food and tobacco prods . . . . . . . . . . . 3.50 1.42Textile, apparel, and leather products . . . . . . . . . . . . . . 11.69 8.46Wood products . . . . . . . . . . . . . . . . . . . . . . . . . . . . . . . . . . 4.35 0.33Petroleum, coal, chemicals, rubber, plastic . . . . . . . . . . 2.70 2.00Ferrous metals . . . . . . . . . . . . . . . . . . . . . . . . . . . . . . . . . . 4.40 2.50
Metals nec and metal products . . . . . . . . . . . . . . . . . . . . 4.47 1.73Motor vehicles and parts . . . . . . . . . . . . . . . . . . . . . . . . . 9.30 1.40
Transport equipment nec . . . . . . . . . . . . . . . . . . . . . . . . . 1.30 0.90Electronic equipment . . . . . . . . . . . . . . . . . . . . . . . . . . . . 0.20 1.10
Other machinery and equipment . . . . . . . . . . . . . . . . . . . 2.99 0.91Other manufactures . . . . . . . . . . . . . . . . . . . . . . . . . . . . . 2.99 0.91
Services . . . . . . . . . . . . . . . . . . . . . . . . . . . . . . . . . . . . . . . 0.94 0.03
Source: CIE and Commission calculation.

D-11
Table D-3—ContinuedAlternative policy scenarios
(Percent)ACIL policy shocks
ACIL commoditiesAustralian tariffs &
non-tariff measuresU.S. tariffs &
non-tariff measures
Rice . . . . . . . . . . . . . . . . . . . . . . . . . . . . . . . . . . . . . . . . . . . . 1.00 5.34Wheat . . . . . . . . . . . . . . . . . . . . . . . . . . . . . . . . . . . . . . . . . . 0.80 2.55Other grains . . . . . . . . . . . . . . . . . . . . . . . . . . . . . . . . . . . . . 0.80 0.61Other agricultural products . . . . . . . . . . . . . . . . . . . . . . . . . 2.12 4.61Sugar cane and beet . . . . . . . . . . . . . . . . . . . . . . . . . . . . . . 0.00 0.65Cattle, sheep . . . . . . . . . . . . . . . . . . . . . . . . . . . . . . . . . . . . 0.75 1.07Raw milk . . . . . . . . . . . . . . . . . . . . . . . . . . . . . . . . . . . . . . . . 0.00 0.00Forest, logging . . . . . . . . . . . . . . . . . . . . . . . . . . . . . . . . . . . 0.21 1.19Coal . . . . . . . . . . . . . . . . . . . . . . . . . . . . . . . . . . . . . . . . . . . . 0.00 0.00Oil . . . . . . . . . . . . . . . . . . . . . . . . . . . . . . . . . . . . . . . . . . . . . . 0.00 0.40Gas . . . . . . . . . . . . . . . . . . . . . . . . . . . . . . . . . . . . . . . . . . . . 0.00 0.00Other minerals . . . . . . . . . . . . . . . . . . . . . . . . . . . . . . . . . . . 0.07 0.18Cattle, sheep meat . . . . . . . . . . . . . . . . . . . . . . . . . . . . . . . 0.10 5.29Other processed agricultural products . . . . . . . . . . . . . . . 5.82 6.38Milk . . . . . . . . . . . . . . . . . . . . . . . . . . . . . . . . . . . . . . . . . . . . 7.35 42.49Processd sugar . . . . . . . . . . . . . . . . . . . . . . . . . . . . . . . . . . 13.89 53.45Textiles . . . . . . . . . . . . . . . . . . . . . . . . . . . . . . . . . . . . . . . . . 12.64 9.47Apparel . . . . . . . . . . . . . . . . . . . . . . . . . . . . . . . . . . . . . . . . . 23.76 9.65Leather . . . . . . . . . . . . . . . . . . . . . . . . . . . . . . . . . . . . . . . . . 12.63 5.17Wood, pulp, paper . . . . . . . . . . . . . . . . . . . . . . . . . . . . . . . . 3.20 0.88Petroleum, coal products . . . . . . . . . . . . . . . . . . . . . . . . . . 0.00 2.44Chemicals, rubber, plastic . . . . . . . . . . . . . . . . . . . . . . . . . 3.39 3.17Iron, steel . . . . . . . . . . . . . . . . . . . . . . . . . . . . . . . . . . . . . . . 4.80 3.16Motor vehicles and parts . . . . . . . . . . . . . . . . . . . . . . . . . . 8.52 2.19Other manufacturing . . . . . . . . . . . . . . . . . . . . . . . . . . . . . . 2.82 1.16Electricity . . . . . . . . . . . . . . . . . . . . . . . . . . . . . . . . . . . . . . . 0.00 0.00Gas distribution . . . . . . . . . . . . . . . . . . . . . . . . . . . . . . . . . . 0.00 0.00Water . . . . . . . . . . . . . . . . . . . . . . . . . . . . . . . . . . . . . . . . . . . 0.00 0.00Construction . . . . . . . . . . . . . . . . . . . . . . . . . . . . . . . . . . . . . 0.00 0.00Trade . . . . . . . . . . . . . . . . . . . . . . . . . . . . . . . . . . . . . . . . . . . 0.52 0.00Transportation . . . . . . . . . . . . . . . . . . . . . . . . . . . . . . . . . . . 0.00 0.00Communication . . . . . . . . . . . . . . . . . . . . . . . . . . . . . . . . . . 0.00 0.00Other services-private . . . . . . . . . . . . . . . . . . . . . . . . . . . . . 0.12 0.00Other services-government . . . . . . . . . . . . . . . . . . . . . . . . 0.00 0.00
Source: ACIL, table 4, p 40.

D-12
Table D-3—ContinuedAlternative policy scenarios
(Percent)
ACIL policy shocks
USITC commodityAustralian tariffs &
non-tariff measuresU.S. tariffs &
non-tariff measures
Grains . . . . . . . . . . . . . . . . . . . . . . . . . . . . . . . . . . . . . . . . . 0.86 2.83Sugar crops . . . . . . . . . . . . . . . . . . . . . . . . . . . . . . . . . . . . 0.00 0.65Vegetables, fruits, and nuts . . . . . . . . . . . . . . . . . . . . . . . 2.12 4.61Other crops . . . . . . . . . . . . . . . . . . . . . . . . . . . . . . . . . . . . . 2.12 4.61Cattle and horses . . . . . . . . . . . . . . . . . . . . . . . . . . . . . . . 0.75 1.07Animal products n.e.c. . . . . . . . . . . . . . . . . . . . . . . . . . . . 2.12 4.61Coal, oil, gas, other mineral . . . . . . . . . . . . . . . . . . . . . . . 0.02 0.14Meat products . . . . . . . . . . . . . . . . . . . . . . . . . . . . . . . . . . 0.10 5.29Dairy products . . . . . . . . . . . . . . . . . . . . . . . . . . . . . . . . . . 7.35 42.49Sugar . . . . . . . . . . . . . . . . . . . . . . . . . . . . . . . . . . . . . . . 13.89 53.45Other processed food and tobacco prods . . . . . . . . . . . 5.82 6.38Textile, apparel, and leather products . . . . . . . . . . . . . . 16.34 8.1Wood products . . . . . . . . . . . . . . . . . . . . . . . . . . . . . . . . . . 3.20 0.88Petroleum, coal, chemicals, rubber, plastic . . . . . . . . . . 3.39 3.17Ferrous metals . . . . . . . . . . . . . . . . . . . . . . . . . . . . . . . . . . 4.80 3.16
Metals nec and metal products . . . . . . . . . . . . . . . . . . . . 2.82 1.16Motor vehicles and parts . . . . . . . . . . . . . . . . . . . . . . . . . 8.52 2.19
Transport equipment nec . . . . . . . . . . . . . . . . . . . . . . . . . 2.82 1.16Electronic equipment . . . . . . . . . . . . . . . . . . . . . . . . . . . . 2.82 1.16
Other machinery and equipment . . . . . . . . . . . . . . . . . . . 2.82 1.16Other manufactures . . . . . . . . . . . . . . . . . . . . . . . . . . . . . 2.82 1.16
Services . . . . . . . . . . . . . . . . . . . . . . . . . . . . . . . . . . . . . . . 0.12 0.00
Source: ACIL and Commission calculation.

D-13
Table D-3—ContinuedAlternative policy scenarios
(Percent)BKS policy shocks
BKS commoditiesAustralian tariffs &non-tariff measures
U.S. tariffs &non-tariff measures
Agriculture . . . . . . . . . . . . . . . . . . . . . . . . . . . . . . . . . . . . 1.40 0.70Mining . . . . . . . . . . . . . . . . . . . . . . . . . . . . . . . . . . . . . . . 0.00 0.20Food, beverages, tobacco . . . . . . . . . . . . . . . . . . . . . . 3.80 1.80Textiles . . . . . . . . . . . . . . . . . . . . . . . . . . . . . . . . . . . . . . 12.00 2.00Apparel . . . . . . . . . . . . . . . . . . . . . . . . . . . . . . . . . . . . . . 3.60 9.80Leather products & footwear . . . . . . . . . . . . . . . . . . . . 9.30 5.30Wood, wood products . . . . . . . . . . . . . . . . . . . . . . . . . . 3.10 0.40Chemicals . . . . . . . . . . . . . . . . . . . . . . . . . . . . . . . . . . . . 3.40 3.10Non-metalic mineral products . . . . . . . . . . . . . . . . . . . 2.10 1.50Metal products . . . . . . . . . . . . . . . . . . . . . . . . . . . . . . . . 4.50 0.10Transport equipment . . . . . . . . . . . . . . . . . . . . . . . . . . . 4.20 0.30Machinery & equipment . . . . . . . . . . . . . . . . . . . . . . . . 3.00 1.10Other manufacturing . . . . . . . . . . . . . . . . . . . . . . . . . . . 3.70 0.50Electricity, gas, water . . . . . . . . . . . . . . . . . . . . . . . . . . 0.00 0.00Construction . . . . . . . . . . . . . . . . . . . . . . . . . . . . . . . . . . 4.00 9.00Trade & transport . . . . . . . . . . . . . . . . . . . . . . . . . . . . . . 0.00 27.00Other private services . . . . . . . . . . . . . . . . . . . . . . . . . . 0.00 31.00Government services . . . . . . . . . . . . . . . . . . . . . . . . . . 21.00 25.00
Source: Brown, Kiyota, and Stern, table 1.

D-14
Table D-3—ContinuedAlternative policy scenarios
(Percent)
BKS policy shocks
USITC CommodityAustralian tariffs &
non-tariff measuresU.S. tariffs &
non-tariff measures
Grains . . . . . . . . . . . . . . . . . . . . . . . . . . . . . . . . . . . . . . 1.40 0.70Sugar crops . . . . . . . . . . . . . . . . . . . . . . . . . . . . . . . . . 1.40 0.70Vegetables, fruits, and nuts . . . . . . . . . . . . . . . . . . . . 1.40 0.70Other crops . . . . . . . . . . . . . . . . . . . . . . . . . . . . . . . . . . 1.40 0.70Cattle and horses . . . . . . . . . . . . . . . . . . . . . . . . . . . . 1.40 0.70Animal products nec . . . . . . . . . . . . . . . . . . . . . . . . . . 1.40 0.70Coal, oil, gas, other mineral . . . . . . . . . . . . . . . . . . . . 1.05 0.85Meat Products . . . . . . . . . . . . . . . . . . . . . . . . . . . . . . . 3.80 1.80Dairy products . . . . . . . . . . . . . . . . . . . . . . . . . . . . . . . 3.80 1.80Sugar . . . . . . . . . . . . . . . . . . . . . . . . . . . . . . . . . . . . . . . 3.80 1.80Other processed food and tobacco prods . . . . . . . . 3.80 1.80Textile, apparel, and leather products . . . . . . . . . . . 8.30 5.70Wood products . . . . . . . . . . . . . . . . . . . . . . . . . . . . . . . 3.10 0.40Petroleum, coal, chemicals, rubber, plastic . . . . . . . 3.40 3.10Ferrous metals . . . . . . . . . . . . . . . . . . . . . . . . . . . . . . . 4.50 0.10Metals nec and metal products . . . . . . . . . . . . . . . . . 4.50 0.10Motor vehicles and parts . . . . . . . . . . . . . . . . . . . . . . 4.20 0.30Transport equipment nec . . . . . . . . . . . . . . . . . . . . . . 4.20 0.30Electronic equipment . . . . . . . . . . . . . . . . . . . . . . . . . 3.70 0.50Other machinery and equipment . . . . . . . . . . . . . . . . 3.70 0.50Other manufactures . . . . . . . . . . . . . . . . . . . . . . . . . . 3.70 0.50Services . . . . . . . . . . . . . . . . . . . . . . . . . . . . . . . . . . . . 6.25 23.00
Source: BKS, and Commission calculation
In matching the alternative policy shocks of other authors to the sectors in the USITCmodel, the following simple procedures were used. Where one sector in an alternativemodel includes more than one USITC sector (such as the BKS agriculture sector, whichincludes the USITC sector grains, sugar crops, other crops, and vegetables, fruits andnuts), the shock from the alternative model sector was applied to each of the USITCsectors. Where more than one alternative model sector matches a USITC sector (suchas the BKS sectors apparel, textiles, and leather products and footwear, all of whichare contained in the single USITC sector textiles, apparel, and leather products), asimple average of the shocks in the alternative model sectors was applied to the USITCsector. One exception to this is in the transfer of the CIE services shocks to the USITCmodel, where CIE’s value for financial, business, and recreation services was appliedto the USITC services sector. Note again that all three models assumed the eliminationof trade barriers in sugar, which was not included in the FTA or in the USITC analysis ofthe FTA. Also, CIE and ACIL fully liberalized dairy trade, while BKS didnot consider thissector separately (including it with food, beverages, an tobacco). In comparing thealternative scenarios, only the aggregate welfare effects are examined. These arediscussed in Chapter 8.