u.s. leveraged buyout market 1980-2002 - piper … · u.s. leveraged buyout market 1980-2002. ......
TRANSCRIPT

M E R G E R S & A C Q U I S I T I O N S
Douglas J. LawsonVice [email protected]
Tina D. [email protected]
M A Y 2 0 0 3
U.S. LEVERAGED BUYOUT MARKET1980-2002

May 2003
U.S. Bancorp Piper Jaffray M&A Insights U.S. Leveraged Buyout Market From 1980-2002 | 1
Part I: Overview of the Leveraged Buyout Market .................................................. 2
Part II: Leveraged Buyout Market From 1980 – 2002 .............................................. 5Overview ........................................................................................... 5Leveraged Buyout Volume .................................................................. 5Number of Leveraged Buyouts ............................................................ 6Number of Financial Sponsors ............................................................ 7Breakdown of Leveraged Buyouts By Size ............................................ 8Leveraged Buyouts by Sector ............................................................. 11Leveraged Buyout Activity Versus M&A Activity .............................. 13Global Leveraged Buyouts ................................................................ 17
Part III: Leveraged Buyout Market Drivers ............................................................. 18Overview ......................................................................................... 18Leverage .......................................................................................... 21Valuations ........................................................................................ 25Availability of Targets....................................................................... 26Availability of Capital ...................................................................... 33
Part IV: Conclusion ............................................................................................... 34
T A B L E O F C O N T E N T S

May 2003
2 | U.S. Leveraged Buyout Market From 1980-2002 U.S. Bancorp Piper Jaffray M&A Insights
P A R T I : O V E R V I E W O F T H E L E V E R A G E D B U Y O U T M A R K E T
The leveraged buyout market rose to prominence in the late 1980s when private equityfirms such as Kohlberg Kravis & Roberts (“KKR”) and Fortsmann Little wereconsistently making headlines with large buyouts including the largest leveraged buyoutever, KKR’s $25 billion buyout of RJR Nabisco in 1988. The success of these financialsponsors (i.e., private equity firms) and others in completing transactions and earningfavorable returns attracted many other parties to the industry. There are currentlyhundreds of financial sponsors focused on buying companies of all sizes across manyindustries.
With an estimated $120 billion in uninvested capital, hundreds of financial sponsors, anda difficult M&A environment, private equity firms currently face a challengingenvironment. As the buyout community moves forward in this competitive environment,we think it is appropriate to look back at leveraged buyouts over the last 22 years. In thisM&A Insights article, we review the trends and drivers of the U.S. leveraged buyoutmarket over the 1980-2002 period.
Our data comes from a number of different sources including Thomson Financial (i.e.,Securities Data Corporation (“SDC”), Venture Economics and Buyouts), Standard &Poor’s Portfolio Management Data, Loan Pricing Corporation, FactSet, Moody’s andFitchRatings. In some cases, complete data back to 1980 was not available. In othercases, the data available was incomplete or contradictory. In particular, we suspect thatmany smaller leveraged buyouts are not reported due to the difficulty in obtaining data.In addition, some deals do not report transaction size. However, we have used what webelieve to be the most complete and reliable data available. We believe that the dataavailable captures many of the important trends. In relevant sections and exhibits, ouranalysis is based on disclosed transactions that are either of completed or pending status.Our analysis of volume (i.e., deal value) is based on total enterprise value (e.g., total rankvalue as reported by SDC) reported by each respective source. The data represents U.S.leveraged buyouts unless otherwise indicated.
The data and our analysis revealed the following about the leveraged buyout market overthe 1980-2002 period:
• Leveraged Buyout Volume Peaked in the Late 1980sFrom 1980-2002, SDC reported leveraged buyouts totaling $505 billion.Approximately 56%, 29% and 15% of the leveraged buyout volume was in the 1980s,1990s and 2000s (2000-2002), respectively. The period from 1985-1989 was the mostactive, accounting for approximately 51% of the deal volume. Leveraged buyoutvolume declined significantly in the early 1990s and then increased in the late 1990s and2000s.
• The Late 1980s was the Period with the Greatest Number of Leveraged BuyoutsOver the period 1980-2002, SDC reported 4,310 leveraged buyouts. Between 1985 and1989, there was a total of 1,290 leveraged buyouts, averaging 258 per year. Thiscompares to an average of 216 and 235 per year in the 1990s and 2000s, respectively.Unlike the case with the volume of leveraged buyouts, the annual number of leveragedbuyouts from 1990-2002 was relatively flat.

May 2003
U.S. Bancorp Piper Jaffray M&A Insights U.S. Leveraged Buyout Market From 1980-2002 | 3
• Competition in the Leveraged Buyout Market has Continued to IncreaseAccording to data published by Buyouts, the number of financial sponsors increasedfrom 229 in 1994 to 346 in 2001. While we believe the trend is accurate, we currentlytrack more than 500 private equity firms.
• The Majority of Leveraged Buyouts were with Small to Midsized CompaniesFrom 1980-2002, 79% of leveraged buyouts had a total deal value of $250 million orless, and 61% had a total deal value of $100 million or less. The average and mediansize of leveraged buyouts was the highest in the late 1980s. Although average andmedian deal size in the 1990s and 2000s was not as high as in the late 1980s, theaverage and median deal size did gradually trend upward.
• The Majority of Leveraged Buyouts were with Manufacturing BusinessesOver the 1980-2002 period, almost 50% of leveraged buyouts (by number of deals andvolume) were with manufacturing businesses. Approximately 25% (by number of dealsand volume) were with service businesses.
• Leveraged Buyouts Represented a Relatively Small Percentage of the Overall M&AMarketFrom 1980-2002, leveraged buyouts represented 5% of the total M&A volume and 4%of the total number of M&A transactions. Over this period, annual leveraged buyoutvolume and the number of transactions were generally lower than 4% of the totalM&A market except for the late 1980s when the volume and number of transactionswere in the 20% to 30% and 9% to 10% range, respectively.
• The Leveraged Buyout Market Outside the United States has Grown in Importance inRecent YearsFrom 1980-2002, leveraged buyouts outside of the United States accounted forapproximately 39% of the global leveraged buyout volume. Leveraged buyouts outsideof the United States accounted for 10%, 50% and 67% of global leveraged buyoutvolume in the 1980s, 1990s and 2000s, respectively.
We reviewed a variety of data in order to determine what was driving these trends in theleveraged buyout market over the 1980-2002 period. The data revealed clear drivers forthe high level of leveraged buyout activity of the late 1980s. The data also providedinsight into the higher leveraged buyout volume in the late 1990s versus the early 1990s.The following drivers were evident from the data we examined:
• Leverage – The lending multiples (as measured by total debt/EBITDA) peaked at morethan 8.5x in the late 1980s, coinciding with the period of the greatest leveraged buyoutactivity. The lower lending multiples of the 1990s and 2000s (as compared to the1980s) resulted in lower leveraged buyout activity. As the lending multiples increasedthrough the mid-1990s, so did the value of leveraged buyouts (but not the number ofdeals). Over the 1997-2002 period, lending multiples decreased while the volume ofleveraged buyouts generally increased and the number of leveraged buyouts did notshow a trend.
May 2003
4 | U.S. Leveraged Buyout Market From 1980-2002 U.S. Bancorp Piper Jaffray M&A Insights
• Valuations – The high leveraged buyout activity of the late 1980s was also the periodwhen overall M&A valuations were relatively low. The combination of relatively lowvaluations and high lending multiples made the late 1980s an attractive period forleveraged buyouts. However, this same trend was not evident after the 1980s. That is,leveraged buyout volume was not higher during periods of lower valuations. In fact,the opposite trend is evident during periods in the 1990s.
• Availability of Targets – There were significantly more leveraged buyouts in which thetarget was a corporate divestiture or a public company during the late 1980s than in the1990s and 2000s. The high level of leveraged buyouts in which the target was acorporate divestiture likely reflected the favorable environment (i.e., leverage andvaluations), combined with a time when corporations were focusing on corecompetencies and disposing of non-core assets. We suspect that the fallout in goingprivate transactions in the 1990s and the 2000s (i.e., transactions in which the targetwas a public company) was primarily driven by corporate law and regulatorydevelopments. In addition, the initial public offering market was much more active inthe 1990s and 2000s, presenting sellers with an attractive exit alternative to selling tofinancial sponsors and strategic buyers.
• Availability of Capital – The availability of buyout capital increased in the late 1990sand 2000s resulting in more participants entering the industry. This increase inavailable capital was likely a driver of the increase in leveraged buyout volume in thelate 1990s and 2000s versus the early 1990s.
In Part II, we review the trends in the leveraged buyout market over the 1980-2002period. In Part III, we review the key drivers of the leveraged buyout market over 1980-2002. Finally, in Part IV, we provide some concluding comments about the leveragedbuyout market including some of the strategies private equity firms are considering and/oradopting.

May 2003
U.S. Bancorp Piper Jaffray M&A Insights U.S. Leveraged Buyout Market From 1980-2002 | 5
P A R T I I : L E V E R A G E D B U Y O U T M A R K E T F R O M 1 9 8 0 – 2 0 0 2
Overview In Part II, we review trends in the leveraged buyout market over the 1980-2002 period.Generally, we do not review the drivers of these leveraged buyout trends until Part III. Inthis part, we review the following leveraged buyout trends:
• Leveraged Buyout Volume• Number of Leveraged Buyouts• Number of Financial Sponsors• Breakdown of Leveraged Buyouts by Size• Leveraged Buyouts by Sector• Leveraged Buyout Activity Versus M&A Activity• Global Leveraged Buyouts
Leveraged BuyoutVolume
From 1980-2002, the total leveraged buyout volume as reported by SDC was $505billion. As a percentage of total leveraged buyout volume over the 1980-2002 period, thebreakdown of leveraged buyout volume by the 1980s, 1990s, and 2000s was 56%, 29%,and 15%, respectively. The period from 1985-1989 was a particularly active period forleveraged buyouts, accounting for approximately 51% of the total leveraged buyoutvolume.
Leveraged buyout volume grew from a few billion dollars in 1980 to a peak of $97 billionin 1988 (Exhibit I). Leveraged buyout volume in the 1980s totaled $285 billion. In thelate 1980s, average leveraged buyout volume was $52 billion per year. The volume ofleveraged buyouts declined in the early 1990s, averaging approximately $10 billion peryear over the 1990-1995 period. Leveraged buyout volume increased in the late 1990s,peaking in 1999 at $32 billion. Leveraged buyout volume reached $40 billion in 2000and declined to $12 billion in 2001. Leveraged buyout volume was $23 billion in 2002.
L B O V O L U M E
Exhibit I
Source: Securities Data Corporation
$-
$20
$40
$60
$80
$100
$120
1980 1981 1982 1983 1984 1985 1986 1987 1988 1989 1990 1991 1992 1993 1994 1995 1996 1997 1998 1999 2000 2001 2002
Do
mes
tic
LB
O V
alu
e ($
in
bil
lio
ns)

May 2003
6 | U.S. Leveraged Buyout Market From 1980-2002 U.S. Bancorp Piper Jaffray M&A Insights
Number of LeveragedBuyouts
From 1980-2002, the number of leveraged buyouts as reported by SDC was 4,310.Approximately 35% of leveraged buyouts occurred in the 1980s, 49% in the 1990s and16% in the 2000s. The average annual number of leveraged buyout deals between 1985and 1989 was 258 deals (we excluded 1980-1984 due to insufficient data). The averageannual number of leveraged buyouts during the 1990s and 2000s was 210 and 235 deals,respectively.
The leveraged buyout market grew from few reported deals in the early 1980s to 315deals in 1989 (Exhibit II). Over the 1990-1999 period, the annual number of deals variedfrom a low of 187 deals to a high of 233 deals. The number of leveraged buyouts peakedin 2000 at 341 deals, declined in 2001 to 179 deals, and rebounded to 185 deals in 2002.
The trend of higher leveraged buyout activity in the late 1980s was not as pronouncedwhen comparing the number of deals (Exhibit II) to volume (Exhibit I). This suggestshigher average deal size in the late 1980s (versus the 1990s and 2000s). In addition,unlike the case with leveraged buyout volume, the number of leveraged buyouts did notshow the increasing trend from the early 1990s to the late 1990s and 2000s. Again, thissuggests a change in deal size.
N U M B E R O F L B O D E A L S
Exhibit II
Source: Securities Data Corporation
-
50
100
150
200
250
300
350
400
1980 1981 1982 1983 1984 1985 1986 1987 1988 1989 1990 1991 1992 1993 1994 1995 1996 1997 1998 1999 2000 2001 2002
Do
mes
tic
LB
O T
ran
sact
ion
s

May 2003
U.S. Bancorp Piper Jaffray M&A Insights U.S. Leveraged Buyout Market From 1980-2002 | 7
Number of FinancialSponsors
Over 1994-2001, the number of financial sponsors as reported by Buyouts increased from229 to 346 (Exhibit III). The available data only tracked the number of financial sponsorsfrom 1994-2001. While we have used Buyouts as the source of information to track thegrowth in private equity firms, our internal database currently has more than 500 firms.We note that the increase in financial sponsors over the 1994-2001 period is notassociated with an increase in the number of leveraged buyouts. While the data may beincomplete, it does suggest that the environment is much more challenging for privateequity firms.
F I N A N C I A L S P O N S O R S
Exhibit III
Source: Buyouts
200
225
250
275
300
325
350
375
1994 1995 1996 1997 1998 1999 2000 2001
Nu
mb
er o
f L
BO
Fir
ms
May 2003
8 | U.S. Leveraged Buyout Market From 1980-2002 U.S. Bancorp Piper Jaffray M&A Insights
Breakdown of LeveragedBuyouts by Size
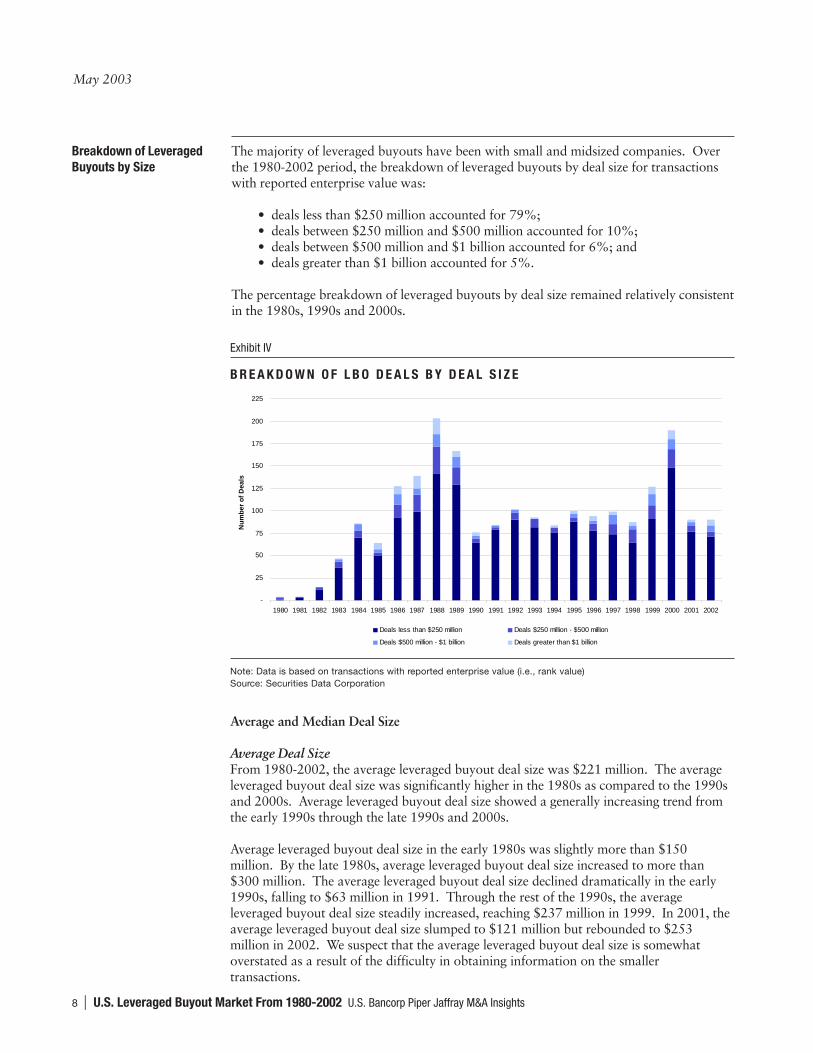
The majority of leveraged buyouts have been with small and midsized companies. Overthe 1980-2002 period, the breakdown of leveraged buyouts by deal size for transactionswith reported enterprise value was:
• deals less than $250 million accounted for 79%;• deals between $250 million and $500 million accounted for 10%;• deals between $500 million and $1 billion accounted for 6%; and• deals greater than $1 billion accounted for 5%.
The percentage breakdown of leveraged buyouts by deal size remained relatively consistentin the 1980s, 1990s and 2000s.
Average and Median Deal Size
Average Deal SizeFrom 1980-2002, the average leveraged buyout deal size was $221 million. The averageleveraged buyout deal size was significantly higher in the 1980s as compared to the 1990sand 2000s. Average leveraged buyout deal size showed a generally increasing trend fromthe early 1990s through the late 1990s and 2000s.
Average leveraged buyout deal size in the early 1980s was slightly more than $150million. By the late 1980s, average leveraged buyout deal size increased to more than$300 million. The average leveraged buyout deal size declined dramatically in the early1990s, falling to $63 million in 1991. Through the rest of the 1990s, the averageleveraged buyout deal size steadily increased, reaching $237 million in 1999. In 2001, theaverage leveraged buyout deal size slumped to $121 million but rebounded to $253million in 2002. We suspect that the average leveraged buyout deal size is somewhatoverstated as a result of the difficulty in obtaining information on the smallertransactions.
Note: Data is based on transactions with reported enterprise value (i.e., rank value)Source: Securities Data Corporation
B R E A K D O W N O F L B O D E A L S B Y D E A L S I Z E
Exhibit IV
-
25
50
75
100
125
150
175
200
225
1980 1981 1982 1983 1984 1985 1986 1987 1988 1989 1990 1991 1992 1993 1994 1995 1996 1997 1998 1999 2000 2001 2002
Nu
mb
er o
f D
eals
Deals less than $250 million Deals $250 million - $500 million
Deals $500 million - $1 billion Deals greater than $1 billion
May 2003
U.S. Bancorp Piper Jaffray M&A Insights U.S. Leveraged Buyout Market From 1980-2002 | 9
Note: Data in 1980 was omitted because it was not meaningful.Source: Securities Data Corporation
A V E R A G E V E R S U S M E D I A N L B O D E A L S I Z E
Exhibit V
$-
$80
$160
$240
$320
$400
$480
$560
1981 1982 1983 1984 1985 1986 1987 1988 1989 1990 1991 1992 1993 1994 1995 1996 1997 1998 1999 2000 2001 2002
Dea
l Siz
e ($
in m
illio
ns)
Average LBO Deal Size Median LBO Deal Size
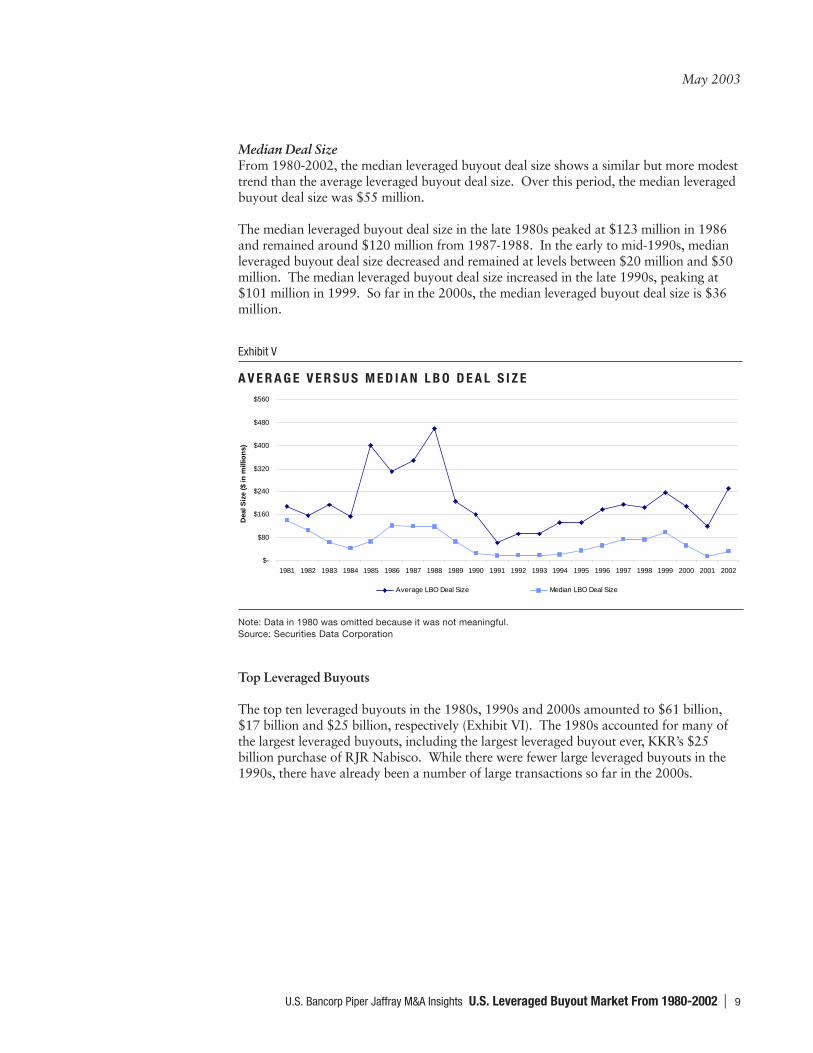
Median Deal SizeFrom 1980-2002, the median leveraged buyout deal size shows a similar but more modesttrend than the average leveraged buyout deal size. Over this period, the median leveragedbuyout deal size was $55 million.
The median leveraged buyout deal size in the late 1980s peaked at $123 million in 1986and remained around $120 million from 1987-1988. In the early to mid-1990s, medianleveraged buyout deal size decreased and remained at levels between $20 million and $50million. The median leveraged buyout deal size increased in the late 1990s, peaking at$101 million in 1999. So far in the 2000s, the median leveraged buyout deal size is $36million.
Top Leveraged Buyouts
The top ten leveraged buyouts in the 1980s, 1990s and 2000s amounted to $61 billion,$17 billion and $25 billion, respectively (Exhibit VI). The 1980s accounted for many ofthe largest leveraged buyouts, including the largest leveraged buyout ever, KKR’s $25billion purchase of RJR Nabisco. While there were fewer large leveraged buyouts in the1990s, there have already been a number of large transactions so far in the 2000s.

May 2003
10 | U.S. Leveraged Buyout Market From 1980-2002 U.S. Bancorp Piper Jaffray M&A Insights
T O P T E N L E V E R A G E D B U Y O U T S ( 1 )
Exhibit VI
(1) Lists primary acquirers only.(2) From 2000-2002.Source: U.S. Bancorp Piper Jaffray and Securities Data Corporation
2000s
Date Deal ValueAnnounced Acquirer Target Industry ($ in billions)
08/20/2002Carlyle Group Welsh, Carson, Anderson & Stowe
Qwest Commun Intl - QwestDex Communications $7
09/23/2002 David H. Murdock Dole Food Food 3
08/07/2000Schroder Ventures Avnet Arrow Electronics
VEBA Electronics Computer 2
10/20/2000 Berkshire Hathaway Shaw Industries Consumer 2
05/29/2000 BC Partners Mark IV Industries Automotive 2
03/29/2000Veritas Software Silver Lake Partners
Seagate Technology Technology 2
01/16/2001 Forstmann Little Citadel Communications Communications 2
11/07/2002Thomas H. Lee Bain Capital
Houghton Mifflin Publishing 2
04/13/2002Kelso & Company LP Nortek Management
Nortek Building Products 2
01/31/2001First Reserve Corporation Odyssey Investment DEG Management
Dresser Equipment Group Energy 2
Total $25
���
1980s
Date Deal ValueAnnounced Acquirer Target Industry ($ in billions)
10/24/1988 Kohlberg Kravis Roberts RJR Nabisco Tobacco and Food $25
10/16/1985 Kohlberg Kravis Roberts Beatrice Companies Food/Consumer 5
07/25/1986 Kohlberg Kravis Roberts Safeway Stores Retail - Grocery 4
06/22/1988 FH Acquisition Corp Fort Howard Paper Paper 4
03/28/1989 Wings Holdings NWA Airline 4
01/21/1988 BFB Acquisition Montgomery Ward Retail 4
04/13/1987Merrill Lynch Capital Partners/ Borg-Warner Holdings
Borg-Warner Automotive/Manufacturing 4
07/03/1987 JT Acquisition Southland Convenience Stores 4
12/11/1986Kohlberg Kravis Roberts/ Owens-Illinois Holdings
Owens-Illinois Packaging 4
09/15/1988 HCA Management Group Hospital Corp of America Hospitals 4
Total $61
1990s
Date Deal ValueAnnounced Acquirer Target Industry ($ in billions)
07/02/1998 Welsh, Carson, Anderson & Stowe Centennial Cellular Communications $3
09/12/1994 Kohlberg Kravis Roberts Borden Inc Food 2
06/28/1999Thomas H. Lee Roger Altman
Big Flower Holdings Advertising 2
08/12/1997 Hicks Muse Tate & Furst LIN Television Broadcasting 2
05/11/1999 Texas Pacific Group Motorola (Semiconductor Group) Semiconductors 2
07/02/1990 Forstmann Little General Instrument Cable/Television 2
04/25/1990 Investcorp Bank EC BATUS (Saks Fifth Avenue) Retail 2
09/08/1999 dba Communications LLC GTE (Assets) Communications 1
05/09/1995 RIC Holdings Inc Riverwood International Paper 1
02/09/1996Bain Capital Thomas H. Lee
TRW Information Systems Group Financial 1
Total $17

May 2003
U.S. Bancorp Piper Jaffray M&A Insights U.S. Leveraged Buyout Market From 1980-2002 | 11
Leveraged Buyouts bySector
Volume
Over the 1980-2002 period, the breakdown of leveraged buyout volume by sector as apercentage of total leveraged buyout volume was:
• manufacturing businesses accounted for 49%;• service businesses accounted for 25%;• distribution businesses accounted for 17%; and• other sectors accounted for 9%.
Manufacturing businesses have accounted for the largest percentage (by volume) ofleveraged buyouts in all three periods. In the 1980s, 1990s, and 2000s they accounted for54%, 44%, and 42% of the volume of leveraged buyouts, respectively. However,leveraged buyouts of service businesses have increased in the 1990s and 2000s, duringwhich time they accounted for 32% of the volume.
Source: U.S. Bancorp Piper Jaffray and Securities Data Corporation
N U M B E R O F L B O D E A L S B Y S E C T O R
Exhibit VII
$-
$20
$40
$60
$80
$100
$120
1980 1981 1982 1983 1984 1985 1986 1987 1988 1989 1990 1991 1992 1993 1994 1995 1996 1997 1998 1999 2000 2001 2002
LB
O D
eal V
alu
e ($
in b
illio
ns)
Manufacturing Business Services Distribution Other

May 2003
12 | U.S. Leveraged Buyout Market From 1980-2002 U.S. Bancorp Piper Jaffray M&A Insights
Number of Deals
From 1980-2002, the breakdown of the number of leveraged buyouts by sector as apercentage of the total leveraged buyouts mirrored the results previously discussed whenleveraged buyouts were broken down by volume. The trends in each time period (i.e., the1980s, 1990s, and 2000s) were also similar. The breakdown of leveraged buyouts bysector from 1980-2002 was:
• manufacturing businesses accounted for 48%;• service businesses accounted for 25%;• distribution businesses accounted for 15%; and• other sectors accounted for 12%.
Source: U.S. Bancorp Piper Jaffray and Securities Data Corporation
N U M B E R O F L B O D E A L S B Y S E C T O R
Exhibit VIII
-
50
100
150
200
250
300
350
400
1980 1981 1982 1983 1984 1985 1986 1987 1988 1989 1990 1991 1992 1993 1994 1995 1996 1997 1998 1999 2000 2001 2002
Nu
mb
er o
f L
BO
s
Manufacturing Business Services Distribution Other
May 2003
U.S. Bancorp Piper Jaffray M&A Insights U.S. Leveraged Buyout Market From 1980-2002 | 13
Leveraged BuyoutActivity Versus M&AActivity
Volume
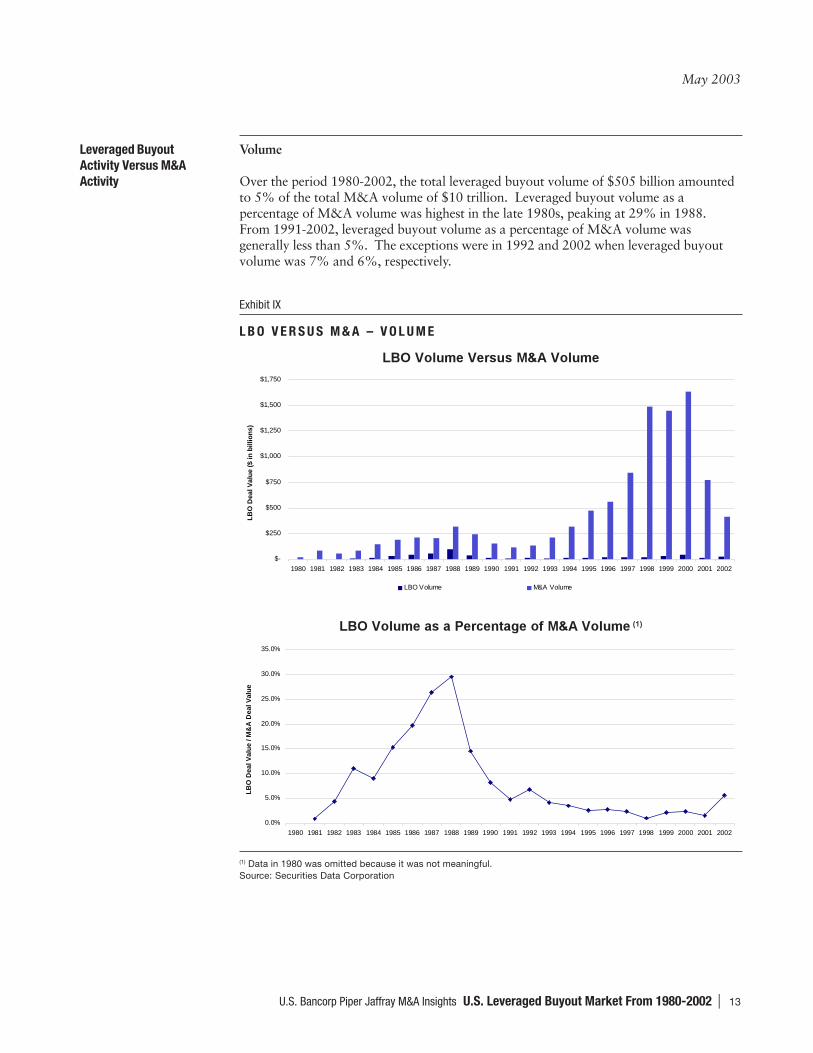
Over the period 1980-2002, the total leveraged buyout volume of $505 billion amountedto 5% of the total M&A volume of $10 trillion. Leveraged buyout volume as apercentage of M&A volume was highest in the late 1980s, peaking at 29% in 1988.From 1991-2002, leveraged buyout volume as a percentage of M&A volume wasgenerally less than 5%. The exceptions were in 1992 and 2002 when leveraged buyoutvolume was 7% and 6%, respectively.
��������������� �������
������������������������� �����������
(1) Data in 1980 was omitted because it was not meaningful.Source: Securities Data Corporation
L B O V E R S U S M & A – V O L U M E
Exhibit IX
$-
$250
$500
$750
$1,000
$1,250
$1,500
$1,750
1980 1981 1982 1983 1984 1985 1986 1987 1988 1989 1990 1991 1992 1993 1994 1995 1996 1997 1998 1999 2000 2001 2002
LB
O D
eal V
alu
e ($
in b
illio
ns)
LBO Volume M&A Volume
0.0%
5.0%
10.0%
15.0%
20.0%
25.0%
30.0%
35.0%
1980 1981 1982 1983 1984 1985 1986 1987 1988 1989 1990 1991 1992 1993 1994 1995 1996 1997 1998 1999 2000 2001 2002
LB
O D
eal V
alu
e / M
&A
Dea
l Val
ue
May 2003
14 | U.S. Leveraged Buyout Market From 1980-2002 U.S. Bancorp Piper Jaffray M&A Insights
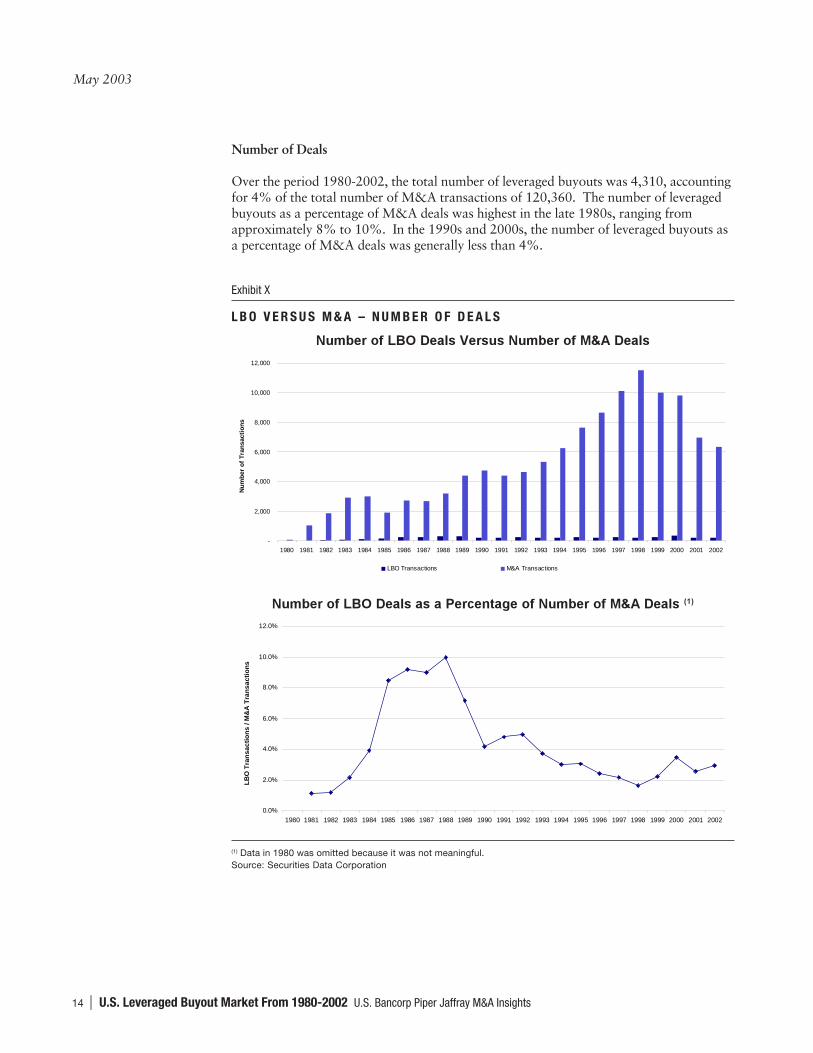
Number of Deals
Over the period 1980-2002, the total number of leveraged buyouts was 4,310, accountingfor 4% of the total number of M&A transactions of 120,360. The number of leveragedbuyouts as a percentage of M&A deals was highest in the late 1980s, ranging fromapproximately 8% to 10%. In the 1990s and 2000s, the number of leveraged buyouts asa percentage of M&A deals was generally less than 4%.
������������������������������� �������
����������������������������������������� �����������
(1) Data in 1980 was omitted because it was not meaningful.Source: Securities Data Corporation
L B O V E R S U S M & A – N U M B E R O F D E A L S
Exhibit X
-
2,000
4,000
6,000
8,000
10,000
12,000
1980 1981 1982 1983 1984 1985 1986 1987 1988 1989 1990 1991 1992 1993 1994 1995 1996 1997 1998 1999 2000 2001 2002
Nu
mb
er o
f T
ran
sact
ion
s
LBO Transactions M&A Transactions
0.0%
2.0%
4.0%
6.0%
8.0%
10.0%
12.0%
1980 1981 1982 1983 1984 1985 1986 1987 1988 1989 1990 1991 1992 1993 1994 1995 1996 1997 1998 1999 2000 2001 2002
LB
O T
ran
sact
ion
s / M
&A
Tra
nsa
ctio
ns
May 2003
U.S. Bancorp Piper Jaffray M&A Insights U.S. Leveraged Buyout Market From 1980-2002 | 15
Average and Median Deal Size
Average Deal SizeOver the 1980-2002 period, the average leveraged buyout deal size of $221 million waslarger than the average M&A deal size of $188 million. In the late 1980s, the averagedeal size for leveraged buyouts was significantly higher than the average deal size forM&A transactions (Exhibit XI). Over the 1985-1989 period, the average deal size of aleveraged buyout was $345 million versus $175 million for the overall M&A market.During the 1990s, the average deal size of leveraged buyouts of $149 million was closer tothe average deal size of M&A transactions of $177 million. So far in the 2000s, theaverage deal size of leveraged buyouts and M&A transactions have been $188 million and$271 million, respectively.
Median Deal SizeFrom 1980-2002, the median leveraged buyout deal size was $55 million, which washigher than the median M&A deal size of $20 million. Median leveraged buyout dealsize in the late 1980s was $100 million as compared to $40 million for M&Atransactions. During the 1990s, the median deal size was $40 million for leveragedbuyouts and $17 million for M&A transactions. So far in the 2000s, the median dealsizes of leveraged buyouts and M&A transactions have been $34 million and $22 million,respectively.

May 2003
16 | U.S. Leveraged Buyout Market From 1980-2002 U.S. Bancorp Piper Jaffray M&A Insights
���������� ����������������
���������� ��� ������������
Note: Data in 1980 was omitted because it was not meaningful.Source: Securities Data Corporation
L B O V E R S U S M & A – D E A L S I Z E
Exhibit XI
$-
$80
$160
$240
$320
$400
$480
$560
1981 1982 1983 1984 1985 1986 1987 1988 1989 1990 1991 1992 1993 1994 1995 1996 1997 1998 1999 2000 2001 2002
Dea
l Siz
e ($
in m
illio
ns)
Average LBO Deal Size Average Domestic M&A Deal Size
$-
$50
$100
$150
$200
$250
$300
$350
$400
1981 1982 1983 1984 1985 1986 1987 1988 1989 1990 1991 1992 1993 1994 1995 1996 1997 1998 1999 2000 2001 2002
Dea
l S
ize
($ i
n m
illi
on
s)
Median LBO Deal Size Median Domestic M&A Deal Size
May 2003
U.S. Bancorp Piper Jaffray M&A Insights U.S. Leveraged Buyout Market From 1980-2002 | 17
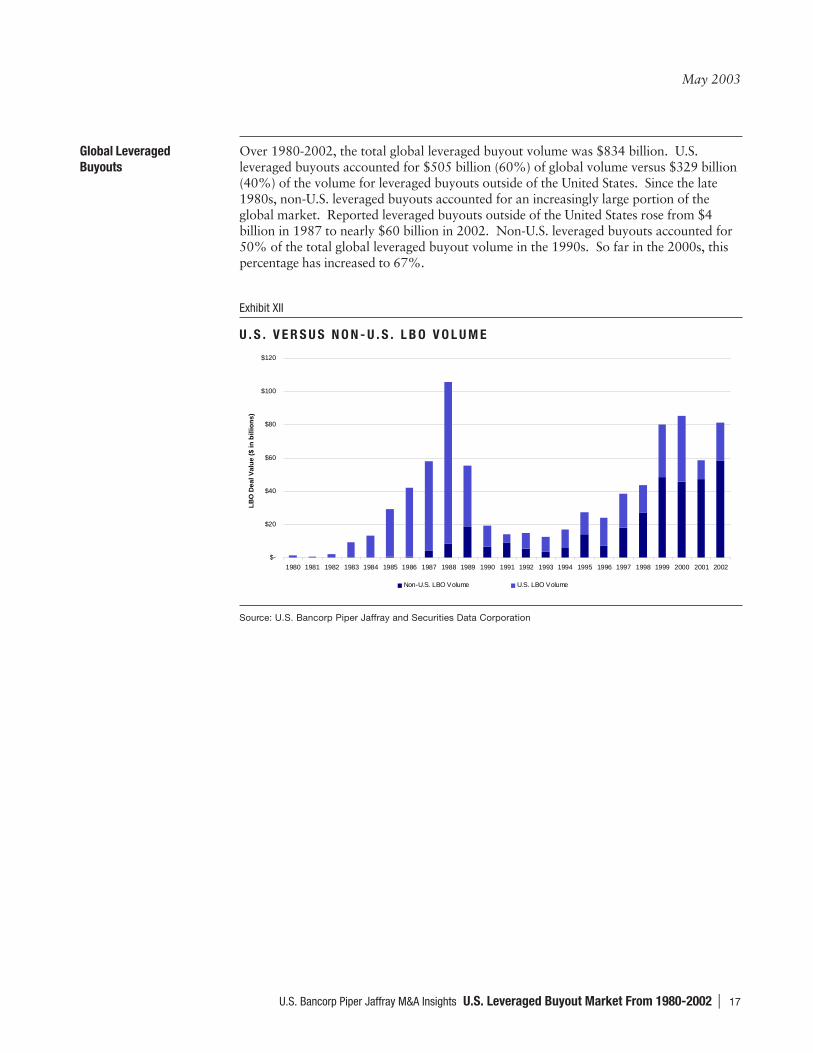
Global LeveragedBuyouts
Over 1980-2002, the total global leveraged buyout volume was $834 billion. U.S.leveraged buyouts accounted for $505 billion (60%) of global volume versus $329 billion(40%) of the volume for leveraged buyouts outside of the United States. Since the late1980s, non-U.S. leveraged buyouts accounted for an increasingly large portion of theglobal market. Reported leveraged buyouts outside of the United States rose from $4billion in 1987 to nearly $60 billion in 2002. Non-U.S. leveraged buyouts accounted for50% of the total global leveraged buyout volume in the 1990s. So far in the 2000s, thispercentage has increased to 67%.
U . S . V E R S U S N O N - U . S . L B O V O L U M E
Exhibit XII
Source: U.S. Bancorp Piper Jaffray and Securities Data Corporation
$-
$20
$40
$60
$80
$100
$120
1980 1981 1982 1983 1984 1985 1986 1987 1988 1989 1990 1991 1992 1993 1994 1995 1996 1997 1998 1999 2000 2001 2002
LB
O D
eal V
alu
e ($
in b
illio
ns)
Non-U.S. LBO Volume U.S. LBO Volume

May 2003
18 | U.S. Leveraged Buyout Market From 1980-2002 U.S. Bancorp Piper Jaffray M&A Insights
P A R T I I I – L E V E R A G E D B U Y O U T M A R K E T D R I V E R S
Overview Leveraged Buyout Trends from 1980-2002
As set out in Part II, there have been a number of changes in the leveraged buyout marketover the 1980-2002 period. The most significant trends were:
• Leveraged buyout volume and the number of leveraged buyouts were the highest inthe late 1980s.
• Leveraged buyout volume was greater in the late 1990s and early 2000s ascompared to the early 1990s.
• The number of buyout firms has increased significantly.• The average and median leveraged buyout deal size was significantly larger in the
1980s versus the 1990s and 2000s.• Leveraged buyouts represented a much higher percentage of M&A activity in the
late 1980s as compared to other periods.
In this part, we review the drivers behind some of these trends.

May 2003
U.S. Bancorp Piper Jaffray M&A Insights U.S. Leveraged Buyout Market From 1980-2002 | 19
B U Y O U T R E T U R N S
Exhibit XIII
Source: Venture Economics
Leveraged Buyout Returns
In the 1970s and early 1980s, there were few participants in the leveraged buyout marketand many of them earned exceptional returns. For example, in the 1982 leveraged buyoutof Gibson Greetings a $330,000 investment was turned into $66 million in 18 months.The successes of these initial participants attracted many more players to the industry.
Leveraged buyout returns are generally a function of one or more of the following factors:(i) leverage; (ii) growth; (iii) margin enhancement; and (iv) multiple expansion. Leveragehas historically been the most important driver of buyout returns. Growth and marginenhancements have been important contributors to returns in a number of industries.Private equity firms have also benefited from multiple expansion, that is, buying the targetfor a lower multiple than that which is received upon an exit. This multiple expansionmay be driven by growth, margin enhancement or conditions in the financial markets(e.g., higher valuation multiples).
Exhibit XIII sets out the net buyout returns (i.e., buyout returns to the limited partners) asreported by Venture Economics. We suspect that this data is incomplete as a result of thechallenges in obtaining this information. However, we believe it to be the most completereported data. From 1985-1989, buyout returns averaged 41%, with the top quartile ofleveraged buyout returns averaging 92%. In the 1990s, average buyout returns weresignificantly lower than in the late 1980s; returns averaged 16% and the top quartileaveraged 34%. So far in the 2000s, top quartile buyout returns have declined to anaverage of 8%.
(40.0%)
(20.0%)
0.0%
20.0%
40.0%
60.0%
80.0%
100.0%
120.0%
140.0%
160.0%
1980 1981 1982 1983 1984 1985 1986 1987 1988 1989 1990 1991 1992 1993 1994 1995 1996 1997 1998 1999 2000 2001
Ret
urn
s
Buyout Returns Top Quartile Buyout Returns
May 2003
20 | U.S. Leveraged Buyout Market From 1980-2002 U.S. Bancorp Piper Jaffray M&A Insights
As long as returns were relatively attractive, parties were drawn to the leveraged buyoutindustry. Over the 1980-2002 period, top financial sponsors have earned extremelyattractive returns. The lure of exceptional returns continued to attract participants to theindustry over this period of time. While there has been an increase in participants in theleveraged buyout market, the activity has not approached the levels seen in the late 1980s.Over the 1980-2002 period, the high activity of the late 1980s and lower levels in lateryears were driven primarily by the following: (i) leverage; (ii) valuations; and (iii) theavailability of attractive targets. In addition, the increased availability of capital hascontinued to attract participants to the industry and has contributed to the increasedcompetitive environment. We discuss these four drivers in the following sections.
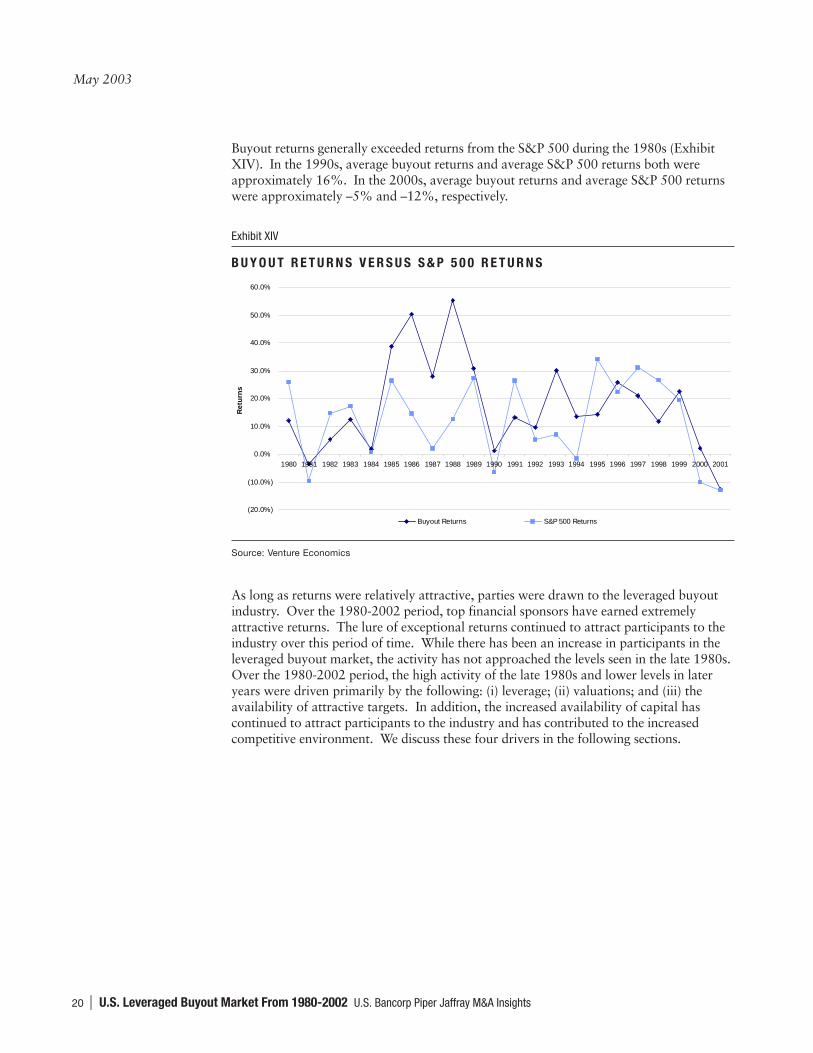
B U Y O U T R E T U R N S V E R S U S S & P 5 0 0 R E T U R N S
Exhibit XIV
Buyout returns generally exceeded returns from the S&P 500 during the 1980s (ExhibitXIV). In the 1990s, average buyout returns and average S&P 500 returns both wereapproximately 16%. In the 2000s, average buyout returns and average S&P 500 returnswere approximately –5% and –12%, respectively.
Source: Venture Economics
(20.0%)
(10.0%)
0.0%
10.0%
20.0%
30.0%
40.0%
50.0%
60.0%
1980 1981 1982 1983 1984 1985 1986 1987 1988 1989 1990 1991 1992 1993 1994 1995 1996 1997 1998 1999 2000 2001
Ret
urn
s
Buyout Returns S&P 500 Returns

May 2003
U.S. Bancorp Piper Jaffray M&A Insights U.S. Leveraged Buyout Market From 1980-2002 | 21
Leverage Overview
Leverage has historically been the most important driver of the leveraged buyout market.Generally, the higher the leverage and the lower the equity contribution, the higher thetotal returns. In the leveraged buyout community, leverage is generally measured by totaldebt/EBITDA. While the debt is composed of a number of instruments such as seniordebt, high yield debt and mezzanine debt, a discussion of these components is beyond thescope of this article.
Leverage Lending Multiples
Total debt/EBITDA multiples averaged 5.4x over the 1987-2002 period (Exhibit XV).Lending multiples declined from a peak of 8.8x in 1987 to 3.8x in 2002. (The availabledata only reported average lending multiples since 1987.) The high lending multiples ofthe late 1980s coincided with the period of the greatest leveraged buyout activity.
The average lending multiples in the 1990s and 2000s were 5.3x and 3.8x, respectively.The decline in lending multiples was driven by an increase in default rates and regulatorypressure. The lower lending multiples in the 2000s have been driven by the downturn inthe economy, the consolidation of lending institutions, a less receptive high yield market,and an increase in default rates. The lower leverage multiples after 1989 coincided withlower leveraged buyout activity as compared to the late 1980s. From 1990-1996,leveraged buyout volume (but not number of deals) generally increased as leveragemultiples trended upwards. Over the 1997-2002 period, lending multiples decreasedwhile the volume of leveraged buyouts generally increased and the number of leveragedbuyouts did not show a trend.
A V E R A G E L E N D I N G M U L T I P L E S
Exhibit XV
Note: There were too few deals in 1991 to provide a meaningful sample.Source: Standard & Poor’s Portfolio Management Data
8.8x
7.1x6.7x
5.3x5.0x 5.2x 5.3x 5.2x
5.8x 5.7x5.3x
4.5x4.0x
3.7x 3.8x
4.7x
3.7x3.4x 3.4x
2.6x 2.7x 2.8x3.3x
3.5x 3.6x 3.5x
2.2x 2.4x2.9x
3.3x
0.0x
2.0x
4.0x
6.0x
8.0x
10.0x
1987 1988 1989 1990 1992 1993 1994 1995 1996 1997 1998 1999 2000 2001 2002
Mu
ltip
les
Total Debt / EBITDA Senior Secured Debt / EBITDA

May 2003
22 | U.S. Leveraged Buyout Market From 1980-2002 U.S. Bancorp Piper Jaffray M&A Insights
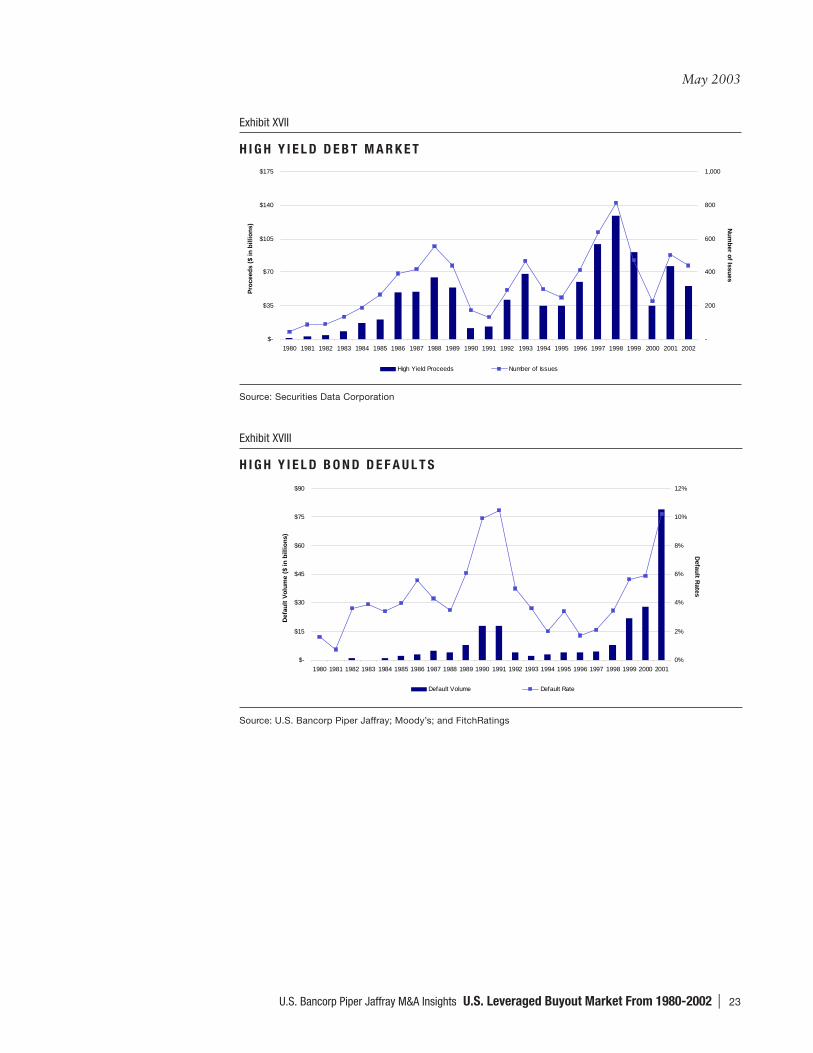
In conjunction with lending multiples, we looked at lending volumes over the 1980-2002period. M&A leverage lending volume peaked in the late 1980s, which was consistentwith the trend in leveraged buyout activity (Exhibit XVI). Volume in the leverage lendingmarket was also higher in the late 1990s and 2000s versus the early 1990s. Exhibit XVIIsets out the issuance in the high yield market over the 1980-2002 period; this is totalissuance and not just M&A-related issuance. The percentage of issuance related to M&Awas much higher in the 1980s versus the 1990s. Exhibit XVIII sets out the high yielddefault rates. The high yield default rates in the early 1990s are consistent with thedecline in lending multiples that occurred since the late 1980s. The high yield defaultrates in the 2000s are consistent with the decline in lending multiples in the 2000s.
M & A L E V E R A G E L O A N V O L U M E
Exhibit XVI
Source: Loan Pricing Corporation
$-
$20
$40
$60
$80
$100
$120
$140
$160
1987 1988 1989 1990 1991 1992 1993 1994 1995 1996 1997 1998 1999 2000 2001 2002
Lo
an V
olu
me
($ in
bill
ion
s)
May 2003
U.S. Bancorp Piper Jaffray M&A Insights U.S. Leveraged Buyout Market From 1980-2002 | 23
Source: Securities Data Corporation
H I G H Y I E L D B O N D D E F A U L T S
Exhibit XVIII
Source: U.S. Bancorp Piper Jaffray; Moody’s; and FitchRatings
H I G H Y I E L D D E B T M A R K E T
Exhibit XVII
$-
$35
$70
$105
$140
$175
1980 1981 1982 1983 1984 1985 1986 1987 1988 1989 1990 1991 1992 1993 1994 1995 1996 1997 1998 1999 2000 2001 2002
Pro
ceed
s ($
in
bil
lio
ns)
-
200
400
600
800
1,000
Nu
mb
er of Issu
es
High Yield Proceeds Number of Issues
$-
$15
$30
$45
$60
$75
$90
1980 1981 1982 1983 1984 1985 1986 1987 1988 1989 1990 1991 1992 1993 1994 1995 1996 1997 1998 1999 2000 2001
Def
ault
Vo
lum
e ($
in
bil
lio
ns)
0%
2%
4%
6%
8%
10%
12%
Defau
lt Rates
Default Volume Default Rate

May 2003
24 | U.S. Leveraged Buyout Market From 1980-2002 U.S. Bancorp Piper Jaffray M&A Insights
Capital Structure
In conjunction with leverage, we looked at the equity contributions in leveraged buyoutsover the 1987-2002 period (data was not available prior to 1987). The low equitycontributions of the late 1980s are consistent with the higher leveraged buyout volumeduring this period of time. However, equity contributions increased over the 1990-2002period during which time the leveraged buyout volume increased and the number ofleveraged buyouts remained relatively stable.
Average equity contribution increased from 7% in 1987 to 41% in 2002, which wasconsistent with the decrease in lending multiples over this time period. In the late 1980s,equity contribution averaged approximately 10%. In the 1990s and 2000s, the equitycontribution averaged approximately 25% and 40%, respectively.
Note: There were too few deals in 1991 to provide a meaningful sample.Source: Standard & Poor’s Portfolio Management Data
L B O E Q U I T Y C O N T R I B U T I O N
Exhibit XIX
7.0%9.7%
13.4%
20.7% 22.0%25.2% 26.2%
23.7% 22.9%
30.0% 31.6%35.7%
37.8%40.6% 41.0%
0%
10%
20%
30%
40%
50%
1987 1988 1989 1990 1992 1993 1994 1995 1996 1997 1998 1999 2000 2001 2002
Equ
ity
Con
trib
uted
Per
cent
age
May 2003
U.S. Bancorp Piper Jaffray M&A Insights U.S. Leveraged Buyout Market From 1980-2002 | 25
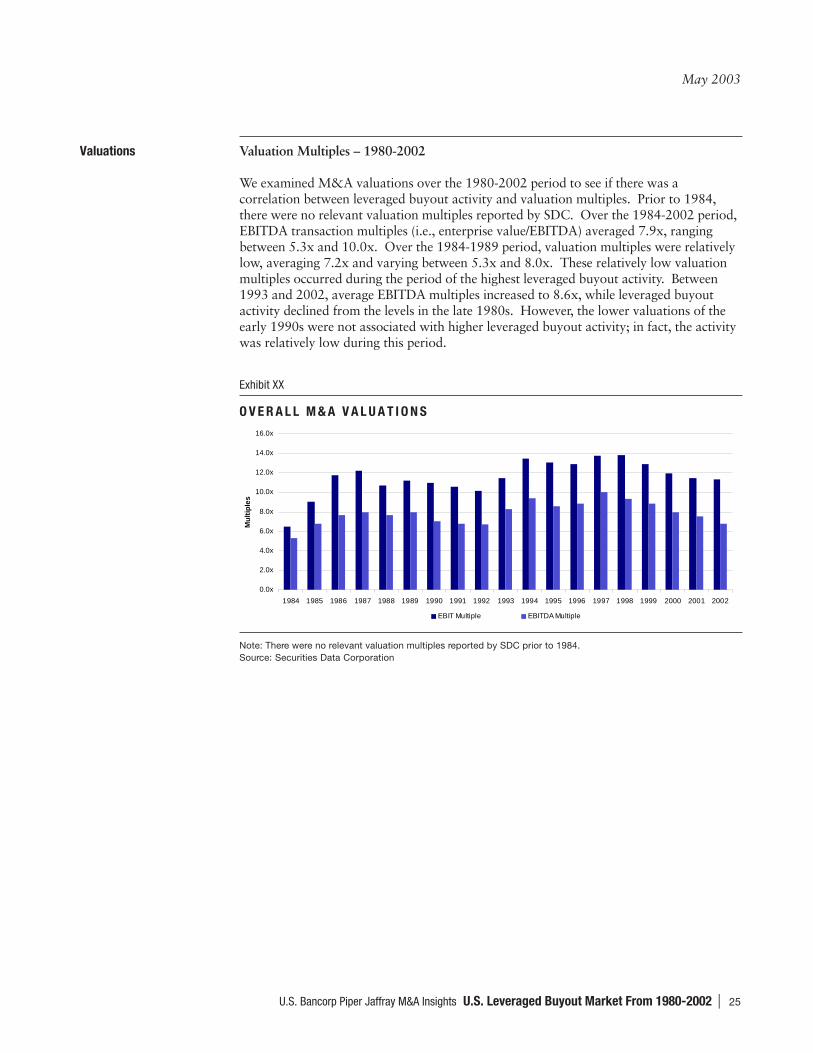
Valuations Valuation Multiples – 1980-2002
We examined M&A valuations over the 1980-2002 period to see if there was acorrelation between leveraged buyout activity and valuation multiples. Prior to 1984,there were no relevant valuation multiples reported by SDC. Over the 1984-2002 period,EBITDA transaction multiples (i.e., enterprise value/EBITDA) averaged 7.9x, rangingbetween 5.3x and 10.0x. Over the 1984-1989 period, valuation multiples were relativelylow, averaging 7.2x and varying between 5.3x and 8.0x. These relatively low valuationmultiples occurred during the period of the highest leveraged buyout activity. Between1993 and 2002, average EBITDA multiples increased to 8.6x, while leveraged buyoutactivity declined from the levels in the late 1980s. However, the lower valuations of theearly 1990s were not associated with higher leveraged buyout activity; in fact, the activitywas relatively low during this period.
Note: There were no relevant valuation multiples reported by SDC prior to 1984.Source: Securities Data Corporation
O V E R A L L M & A V A L U A T I O N S
Exhibit XX
0.0x
2.0x
4.0x
6.0x
8.0x
10.0x
12.0x
14.0x
16.0x
1984 1985 1986 1987 1988 1989 1990 1991 1992 1993 1994 1995 1996 1997 1998 1999 2000 2001 2002
Mu
ltip
les
EBIT Multiple EBITDA Multiple

May 2003
26 | U.S. Leveraged Buyout Market From 1980-2002 U.S. Bancorp Piper Jaffray M&A Insights
Availability of Targets Overview
The availability of attractive targets is an important driver of leveraged buyout activity.An attractive leveraged buyout candidate is typically associated with some or all of thefollowing characteristics:
• Stable cash flow• Non-cyclical business• Fixed assets that can be used as collateral• Low level of debt• Low capital expenditures• Assets and/or divisions that can be sold to pay down debt• Experienced management with a proven track record• Opportunity for cost reduction and margin improvement
Companies with these characteristics generally have a high borrowing capacity and havethe ability to service significant levels of debt. Manufacturing companies often have manyof the aforementioned characteristics. As discussed in Part II, the majority of leveragedbuyouts have been with manufacturing companies over 1980-2002 (Exhibit XXI). Inaddition to the characteristics mentioned above, financial sponsors are looking forcompanies that have the potential to generate high returns through growth, marginenhancement and multiple arbitrage. We note that the decrease in leveraged buyouts isconsistent with the shift to the service sector, representing a larger portion of the economy.However, in absolute terms this does not necessarily contribute to the falloff in leveragedbuyouts in the 1990s and 2000s.
B R E A K D O W N O F L B O S B Y S E C T O R
Exhibit XXI
Source: U.S. Bancorp Piper Jaffray and Securities Data Corporation
-
20
40
60
80
100
120
140
160
180
1980 1981 1982 1983 1984 1985 1986 1987 1988 1989 1990 1991 1992 1993 1994 1995 1996 1997 1998 1999 2000 2001 2002
Num
ber
of L
BO
s
Manufacturing Business Services Distribution Other

May 2003
U.S. Bancorp Piper Jaffray M&A Insights U.S. Leveraged Buyout Market From 1980-2002 | 27
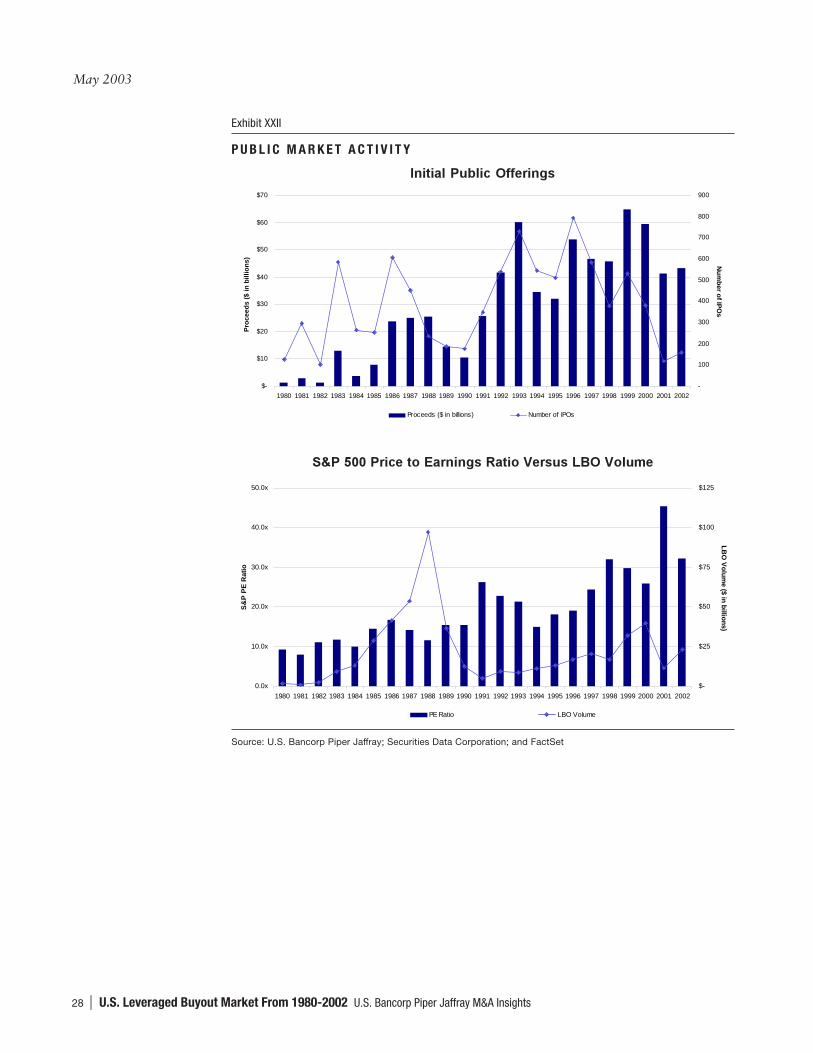
Public Market Activity
We examined the activity in the public markets over the 1980-2002 period in order todetermine if it may have affected leveraged buyout activity. An initial public offeringprovides an alternative to selling to a strategic or financial buyer for a seller of a privatecompany or division of a public company. When the public equity markets have highervaluations and higher investor demand, an initial public offering becomes relatively moreattractive than a leveraged buyout.
We examined the number and volume of initial public offerings over the 1980-2002period as well as public company valuations as represented by price/earnings ratios.Initial public offering activity was significantly higher in the 1990s and 2000s ascompared to the 1980s (Exhibit XXII). In addition, public company valuations werehigher in the 1990s and 2000s as compared to the 1980s. We suspect that the morefavorable conditions in the initial public offering market in the 1990s and 2000sinfluenced the lower level of leveraged buyouts as compared to the late 1980s. However,we note that this in isolation does not support the higher leveraged buyout activity in thelate 1990s and 2000s versus the early 1990s.
May 2003
28 | U.S. Leveraged Buyout Market From 1980-2002 U.S. Bancorp Piper Jaffray M&A Insights
P U B L I C M A R K E T A C T I V I T Y
Exhibit XXII
�������������� ������
�����������������������������������������������
Source: U.S. Bancorp Piper Jaffray; Securities Data Corporation; and FactSet
$-
$10
$20
$30
$40
$50
$60
$70
1980 1981 1982 1983 1984 1985 1986 1987 1988 1989 1990 1991 1992 1993 1994 1995 1996 1997 1998 1999 2000 2001 2002
Pro
ceed
s ($
in b
illio
ns)
-
100
200
300
400
500
600
700
800
900
Nu
mb
er of IP
Os
Proceeds ($ in billions) Number of IPOs
0.0x
10.0x
20.0x
30.0x
40.0x
50.0x
1980 1981 1982 1983 1984 1985 1986 1987 1988 1989 1990 1991 1992 1993 1994 1995 1996 1997 1998 1999 2000 2001 2002
S&
P P
E R
atio
$-
$25
$50
$75
$100
$125
LB
O V
olu
me ($ in
billio
ns)
PE Ratio LBO Volume

May 2003
U.S. Bancorp Piper Jaffray M&A Insights U.S. Leveraged Buyout Market From 1980-2002 | 29
Leveraged Buyout by Divestitures, Public and Private Targets
We also reviewed leveraged buyouts by type of target: divestitures, private targets andpublic targets over the 1980-2002 period in order to see if the availability of any of thesetargets was higher during the late 1980s. From 1980-2002, 4,231 (98%) leveragedbuyouts out of the total of 4,310 reported deal type. Out of the 4,231 leveraged buyouts,there were 2,416 (58%) divestitures, 1,118 (26%) private targets and 697 (16%) publictargets. Over the 1980-2002 period, the leveraged buyout volume by target was asfollows: $205 billion (40%) were divestitures, $267 billion (52%) were public companiesand $42 billion (8%) were private companies. We suspect that the results related to lowprivate company volume and number of deals are a function of the difficulty in obtainingthis information.
Corporate DivestituresThe leveraged buyout volume in which divestitures were the target was significantly higherin the late 1980s than in the 1990s or 2000s (Exhibit XXIII). Between 1986 and 1989,the average annual leveraged buyouts of corporate divestitures were $19 billion and 159transactions. These numbers dropped to $7 billion and 126 deals in the 1990s. So far inthe 2000s, the numbers are $14 billion and 112 transactions. We suspect that therelatively large divestiture activity in the late 1980s was driven by a period of time whencorporations were focusing on their core competencies and disposing of non-corebusinesses. In addition, private equity firms were in a stronger position to compete for thedivestitures as a result of the high leverage multiples and low valuations in that period.While the absolute level of divestitures in the overall M&A market was not higher in thelate 1980s versus the 1990s and 2000s, on a relative basis, they were higher than publicand private company M&A transactions.

May 2003
30 | U.S. Leveraged Buyout Market From 1980-2002 U.S. Bancorp Piper Jaffray M&A Insights
D I V E S T I T U R E S
Exhibit XXIII
��������������� ����������
!�"� �������#�$�
Source: Securities Data Corporation
$-
$5
$10
$15
$20
$25
1980 1981 1982 1983 1984 1985 1986 1987 1988 1989 1990 1991 1992 1993 1994 1995 1996 1997 1998 1999 2000 2001 2002
LB
O V
olu
me
($ in
bill
ion
s)
-
40
80
120
160
200
Nu
mb
er of L
BO
s
Divestiture LBO Volume Number of Divestitures
-
1,000
2,000
3,000
4,000
5,000
6,000
7,000
8,000
1980 1981 1982 1983 1984 1985 1986 1987 1988 1989 1990 1991 1992 1993 1994 1995 1996 1997 1998 1999 2000 2001 2002
Nu
mb
er o
f D
eals
Private Divestiture Public

May 2003
U.S. Bancorp Piper Jaffray M&A Insights U.S. Leveraged Buyout Market From 1980-2002 | 31
Public CompaniesSimilar to corporate divestitures, the leveraged buyout volume of public companies peakedin the late 1980s (Exhibit XXIV). Between 1985 and 1989, the average annual leveragedbuyouts of public companies amounted to $34 billion and 55 transactions. In the 1990s,these figures fell to $6 billion and 22 transactions. So far in the 2000s, the average annualleveraged buyouts of public companies has amounted to $10 billion and 45 transactions.The lower leveraged buyout activity of the 1990s and 2000s (versus the late 1980s) likelyreflects the increased challenge for leveraged buyouts of public companies as a result ofregulatory changes and developments in corporate law (e.g., the Revlon duties). Forexample, if a financial sponsor approaches a public company with the idea of a goingprivate transaction, it is likely that if the company is receptive, a competitive auction willbe triggered. The result is that the financial sponsor could spend significant time andmoney without being successful in consummating a going private transaction.
P U B L I C T A R G E T L B O S
Exhibit XXIV
Source: Securities Data Corporation
$-
$15
$30
$45
$60
$75
1980 1981 1982 1983 1984 1985 1986 1987 1988 1989 1990 1991 1992 1993 1994 1995 1996 1997 1998 1999 2000 2001 2002
LB
O V
olu
me
($ in
bill
ion
s)
-
25
50
75
100
125
Nu
mb
er of L
BO
s
Public LBO Volume Number of Public LBOs

May 2003
32 | U.S. Leveraged Buyout Market From 1980-2002 U.S. Bancorp Piper Jaffray M&A Insights
Private CompaniesThe trend with respect to leveraged buyouts of private companies in the late 1980s versusthe 1990s and 2000s was much less pronounced than the case with divestitures and publiccompanies (Exhibit XXV). We believe that the data with respect to private companyleveraged buyouts is the least reliable compared to divestiture and public data because ofthe difficulty in compiling this information. Between 1985 and 1989, average annualprivate company leveraged buyout volume and number of deals were $2 billion and 55deals, respectively. In the 1990s, these figures were $2 billion and 60 transactions. So farin the 2000s, the figures are $1 billion and 64 transactions.
P R I V A T E T A R G E T L B O S
Exhibit XXV
Source: Securities Data Corporation
$-
$1
$2
$4
$5
$6
1980 1981 1982 1983 1984 1985 1986 1987 1988 1989 1990 1991 1992 1993 1994 1995 1996 1997 1998 1999 2000 2001 2002
LB
O V
olu
me
($ in
bill
ion
s)
-
25
50
75
100
125
Nu
mb
er of L
BO
s
Private LBO Volume Number of Private LBOs
May 2003
U.S. Bancorp Piper Jaffray M&A Insights U.S. Leveraged Buyout Market From 1980-2002 | 33
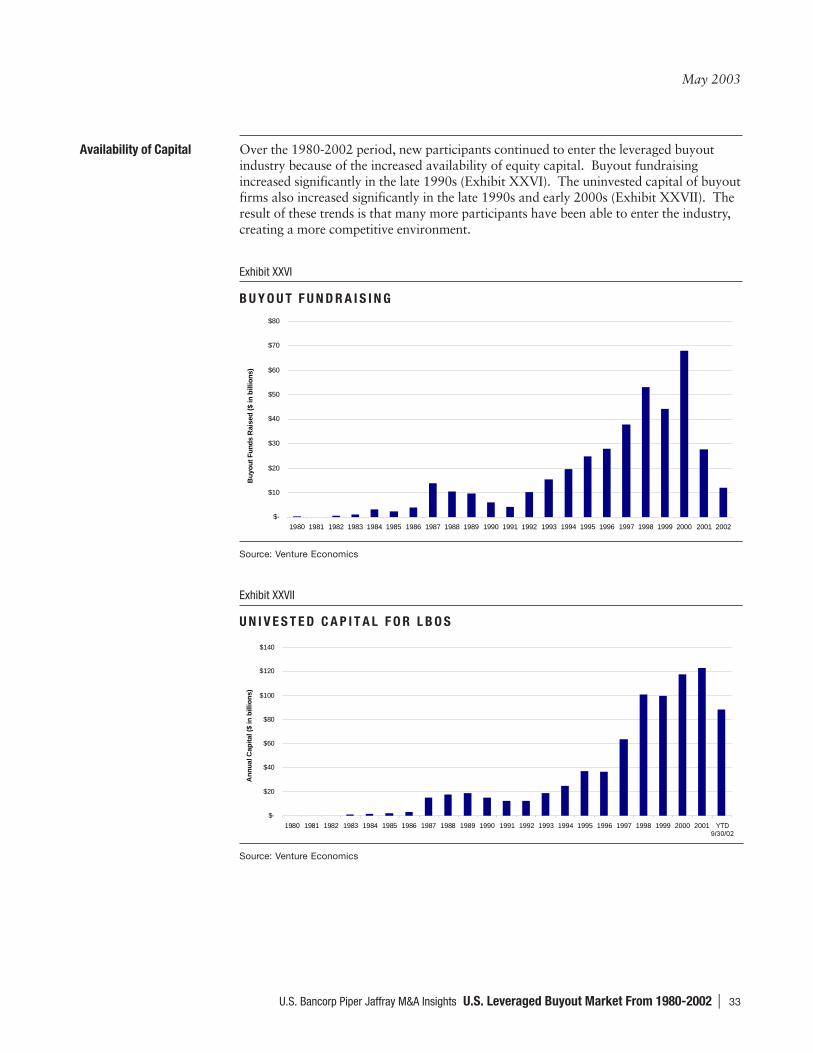
Availability of Capital Over the 1980-2002 period, new participants continued to enter the leveraged buyoutindustry because of the increased availability of equity capital. Buyout fundraisingincreased significantly in the late 1990s (Exhibit XXVI). The uninvested capital of buyoutfirms also increased significantly in the late 1990s and early 2000s (Exhibit XXVII). Theresult of these trends is that many more participants have been able to enter the industry,creating a more competitive environment.
B U Y O U T F U N D R A I S I N G
Exhibit XXVI
U N I V E S T E D C A P I T A L F O R L B O S
Exhibit XXVII
Source: Venture Economics
Source: Venture Economics
$-
$10
$20
$30
$40
$50
$60
$70
$80
1980 1981 1982 1983 1984 1985 1986 1987 1988 1989 1990 1991 1992 1993 1994 1995 1996 1997 1998 1999 2000 2001 2002
Buy
out F
unds
Rai
sed
($ in
bill
ions
)
$-
$20
$40
$60
$80
$100
$120
$140
1980 1981 1982 1983 1984 1985 1986 1987 1988 1989 1990 1991 1992 1993 1994 1995 1996 1997 1998 1999 2000 2001
An
nu
al C
apit
al (
$ in
bill
ion
s)
����������
May 2003
34 | U.S. Leveraged Buyout Market From 1980-2002 U.S. Bancorp Piper Jaffray M&A Insights
P A R T I V : C O N C L U S I O N
The leveraged buyout industry has undergone significant changes over the 1980-2002period. Leveraged buyout activity peaked in the late 1980s. Leveraged buyout activitywas higher in the late 1990s and 2000s as compared to the early 1990s. The number ofprivate equity firms has increased, driven by the attraction of high returns and theavailability of equity capital. The major drivers of the leveraged buyout activity over thisperiod were leverage, valuations, and the availability of attractive targets and capital.
Currently, the leveraged buyout industry faces a challenging environment due to theavailability of relatively low leverage, $120 billion in uninvested capital, hundreds offinancial sponsors, and a difficult M&A environment. The current leveraged buyoutindustry is very competitive. We suspect that many of the current players in the privateequity community will not survive this more competitive environment. However, webelieve that it will take a number of years for many of the less competitive firms to exitthe industry. The gradual exits will be driven by the less competitive firms continuing toemploy uninvested capital and only gradually selling off low return portfolio companies.The firms with a track record of producing exceptional returns will continue to attractinterest from investors (i.e., the limited partners such as pension funds and insurancecompanies).
As firms adjust to this more competitive environment, we see firms considering oradopting one or more of the following strategies in order to compete in this increasinglycompetitive environment:
• Industry Specialization – Industry specialization allows private equity firms to betterrecognize attractive opportunities. In addition, this specialization may aid the privateequity firm in sourcing deals and in successfully enhancing the value of the business.
• Operating Professionals – Operating expertise allows financial sponsors to morecompetitively source opportunities, recognize and enhance value.
• Focus on Smaller Transactions – Some firms have focused on smaller companies in thebelief that the market for these companies is not as competitive.
• International Markets – Private equity firms are exploring international markets inwhich the industry is less developed and there is a greater volume of attractiveopportunities.
• In-house Financing – Some private equity firms now have the ability to provide boththe debt and equity in a leveraged buyout. This often provides them with an advantageover the competition.
• Risk Sharing – Some financial sponsors are partnering with their competitors in orderto share resources and spread risk.
While we expect the private equity industry to continue to evolve, we believe that industryleaders will continue to enjoy attractive returns.

May 2003
U.S. Bancorp Piper Jaffray M&A Insights U.S. Leveraged Buyout Market From 1980-2002 | 35
N O T E S

May 2003
36 | U.S. Leveraged Buyout Market From 1980-2002 U.S. Bancorp Piper Jaffray M&A Insights
N O T E S
������������������ ������ ������� ������������ ����������� ��� ������������� ��� �������������� �������!���������� ������������������������������ �� ���������������������������� ��������������������

May 2003
U.S. Bancorp Piper Jaffray M&A Insights U.S. Leveraged Buyout Market From 1980-2002 | 37
U . S . B A N C O R P P I P E R J A F F R A Y M & A R E P O R T I N D E X
����������� ����Our industry reports identify industries with consolidation opportunities and valuationtrends.- Valuations in the Packaging Industry- European Food Industry- Packaging Industry Public Acquirers - Earnings Per Share Accretion/Dilution Considerations- Mergers & Acquisitions - Value Drivers For Companies in the Packaging Industry- Mergers & Acquisitions in the Packaging Industry—2002 Year in Review- Industrial Distribution- Housewares & Household Products- Construction Materials Update- Plastics- Mining Higher Aggregate Values- Die-Casting
���������These articles focus on technical issues in the M&A marketplace.- U.S. Leveraged Buyout Market From 1980-2002- The Effect of an Acquisition on Earnings Per Share - Accretion/Dilution Analysis- Tax-Free Acquisitions- Trends in Acquisition Consideration- UK Orphan Companies- Private Equity Survey- Taxable Sales of C Corporations- Taxable Sales of S Corporations- Middle Market M&A Outlook- The Furor Over Purchase & Pooling- Putting the Collar on Stock Deals- What About a Dutch Auction?- Endangered Species Update- Wall Street’s Endangered Species- Make Your Cash Flow Sing, Your Stock Will Dance- Leveraged Recapitalizations: Financing Tools For Financial Buyers- Mezzanine Financing Demystified
����������We publish a weekly e-newsletter that analyzes M&A activity and features topics of interestto the M&A marketplace.
��������We publish a monthly e-newsletter that covers topics related to current M&A activity in thepackaging industry.
To access the above listed products in Adobe Acrobat PDF format, please visit our web site atwww.gotoanalysts.com/ma or call 612-303-5685 to request a copy.
(c)2003 U.S. Bancorp Piper Jaffray Inc., 800 Nicollet Mall, Suite 800, Minneapolis, Minnesota 55402-7020 03-0109
C O N T A C T S
Middle Market Mergers & Acquisitions
Glenn A. Gurtcheff Jeff A. RosenkranzManaging Director Managing DirectorCo-Head Co-Head612-303-5548 312-920-2133
Investment Banking
Brad F. EnglandSenior Managing DirectorHead of Investment Banking612-303-2400
David P. CrosbyManaging Director612-303-6300
Daniel E. KubesManaging Director612-303-6303
Michael R. DillahuntPrincipal612-303-6337
John A. Hogan, Jr.Principal612-303-6380
Robert D. FrostVice President612-303-8248
Douglas J. LawsonVice President312-920-2139
Walter D. MurphyVice President312-920-2147
Michael E. PohlenVice President612-303-6356
Heather D. GoodwinVP, Marketing612-303-5679
T E C H N O L O G Y & C O M M U N I C AT I O N S
Chad R. AbrahamManaging DirectorHead of Technology &Communications650-838-1363
David M. JacquinManaging DirectorHead of Technology &Communications M&A415-277-1505
Hugh J. HoffmanManaging Director612-303-6319
Jason D. HutchinsonManaging Director415-277-1510
Steven R. RickmanManaging Director612-303-8569
Eric M. NicholsonPrincipal612-303-6378
F I N A N C I A L I N S T I T U T I O N S
Peter M. GillManaging Director612-303-6312
Jon W. SalvesonManaging DirectorHead of Health Care612-303-6363
Robert A. DeSutterManaging DirectorHead of Health CareM&A612-303-6392
H E A LT H C A R E
Murray C. HunekeManaging DirectorHead of Consumer650-838-1388
David M. JacquinManaging Director415-277-1505
Scott R. LaRueManaging Director650-838-1407
C O N S U M E R
Daniel J. GulbrandsonPrincipal612-303-5652
Edward A. LagerstromPrincipal612-303-0513
J. Thomas HalversonPrincipal612-303-6371
John A. BarrymoreVice President415-277-1501
John T. TwichellVice President415-277-1533
Robert P. RinekManaging DirectorHead of FinancialInstitutions612-303-6306Matthew J. Flower
Vice President+44-020-7743-8702
U . S . B A N C O R P P I P E R J A F F R AYC A P I TA L M A R K E T S LT D .
David I. WilsonManaging Director+44-020-7743-8701

M&A Web Site: http://www.gotoanalysts.com/mergersacquisitions
Web Site: http://www.gotoanalysts.com | http://www.piperjaffray.com
Institutional/Corporate Clients: http://clientaccess.pjc.com
Individual Investors: https://online.piperjaffray.com
Securities products and services are offered through U.S. Bancorp Piper Jaffray Inc., member of SIPC and NYSE, Inc., a subsidiary of U.S. Bancorp and in the United Kingdom through its affiliated company U.S. Bancorp Piper Jaffray Capital Markets Ltd., which is authorised and regulated by the Financial Services Authority.
*U.S. Bancorp Piper Jaffray Capital Markets Ltd.**Strategic alliance: Securities products and services are offered in Israel through Nessuah Zannex Ltd.under an agreement with USBPJI.
04/03-0095
Equity Capital MarketsMergers & Acquisitions
MINNEAPOLIS
SAN FRANCISCO
NEW YORK
CHICAGO
MENLO PARK
LONDON*
TEL AVIV**