u.s. life sciences industry trends and clusters
TRANSCRIPT

Life
Sciences
Firms
flock to
premier
markets
United States | 2015

Projected
revenue
of…
Despite pressures from
competitors, the branded
pharmaceutical industry has
projected revenue of
approximately $158.7B in
2015. The industry will see
continued growth, which will
lead to increased real estate
demand in already tightening
markets.
$158.7B

Wages are
growing as
life sciences
firms
compete for
highly
skilled labor.
1,020,000
1,040,000
1,060,000
1,080,000
1,100,000
1,120,000
1,140,000
1,160,000
$64,000.00
$65,000.00
$66,000.00
$67,000.00
$68,000.00
$69,000.00
$70,000.00
$71,000.00
2011 2012 2013 2014
Annual wages
Number of employees
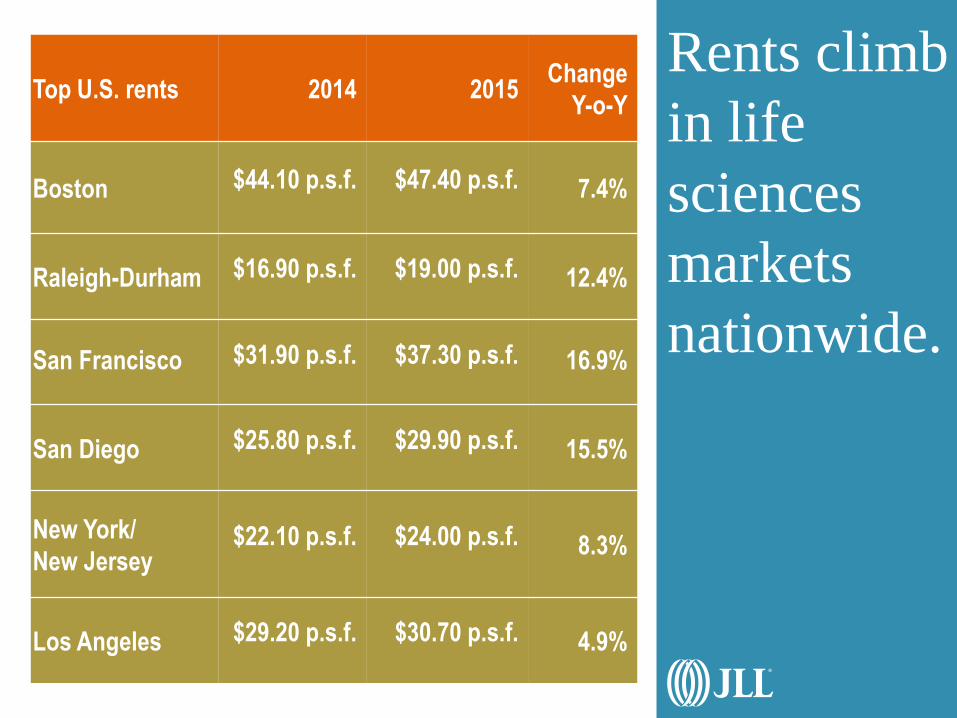
Rents climb
in life
sciences
markets
nationwide.
Top U.S. rents 2014 2015 Change
Y-o-Y
Boston $44.10 p.s.f. $47.40 p.s.f. 7.4%
Raleigh-Durham $16.90 p.s.f. $19.00 p.s.f. 12.4%
San Francisco $31.90 p.s.f. $37.30 p.s.f. 16.9%
San Diego $25.80 p.s.f. $29.90 p.s.f. 15.5%
New York/
New Jersey $22.10 p.s.f. $24.00 p.s.f. 8.3%
Los Angeles $29.20 p.s.f. $30.70 p.s.f. 4.9%

Premier vs. Emerging: the tradeoff between price and established infrastructure.
Cambridge, MA Bothell, WA #1 life sciences market in the world and
home to a large concentration of some of the
most well-known and innovative life sciences
firms. This submarket also contains some of
the top universities in the world, feeding the
labor pool.
A suburb of the growing Seattle market,
Bothell has seen a decline in the vacancy
rate of 460 basis points y-o-y, as life sciences
firms increasingly occupy lab space in this
submarket. Bothell still has relatively high
vacancy and will become even more active over the next year.
Average lab rent: $51.60 p.s.f. Average lab rent: $19.00 p.s.f.
Average lab vacancy: 11.4% Average lab vacancy: 14.1%
Current demand: 1.3 m.s.f. Current demand: 0.6 m.s.f.
Implications
for life
sciences
companies?
Industry competition is heightening the need for
highly specialized labor and driving up wages.
Rents are growing in established life sciences
markets. In other industries, this would lead to
noticeable exodus to secondary markets.
However, life sciences firms are doubling down on
entrenched markets, thanks to a unique
combination of developed infrastructure and
strong labor markets.
However, space constraints in traditional markets
are forcing firms to look elsewhere- with the
secondary markets absorbing that demand.

U.S.
cluster
rankings
Rank Cluster Weighted
score
1 Greater Boston Area 70.9
2 Raleigh-Durham 66.4
3 San Francisco Bay Area 64.3
4 San Diego 62.0
5 New York City 60.3
6 Los Angeles/Orange County 58.3
7 Long Island 48.2
8 Minneapolis 43.6
9 Philadelphia 42.4
Life sciences employment concentration: Weight: 25.0% Measured as the percent of industry employment against total metro private employment Life sciences employment growth: Weight: 10.0% Life sciences establishments concentration: Weight: 10.0% Measured as the percent of industry establishments against total metro private establishments Life sciences venture capital funding: Weight: 20.0% Life sciences National Institute of Health funding: Weight: 20.0 % Life sciences patents: Weight: 15.0%
Rank Cluster Weighted
score
10 Seattle 40.8
11 Denver 38.1
12 New Jersey 35.5
13 Suburban Maryland/Metro DC 34.8
14 Westchester County 31.9
15 Central & Southern Florida 30.3
16 Indianapolis 29.4
17 Chicago Metro 27.5
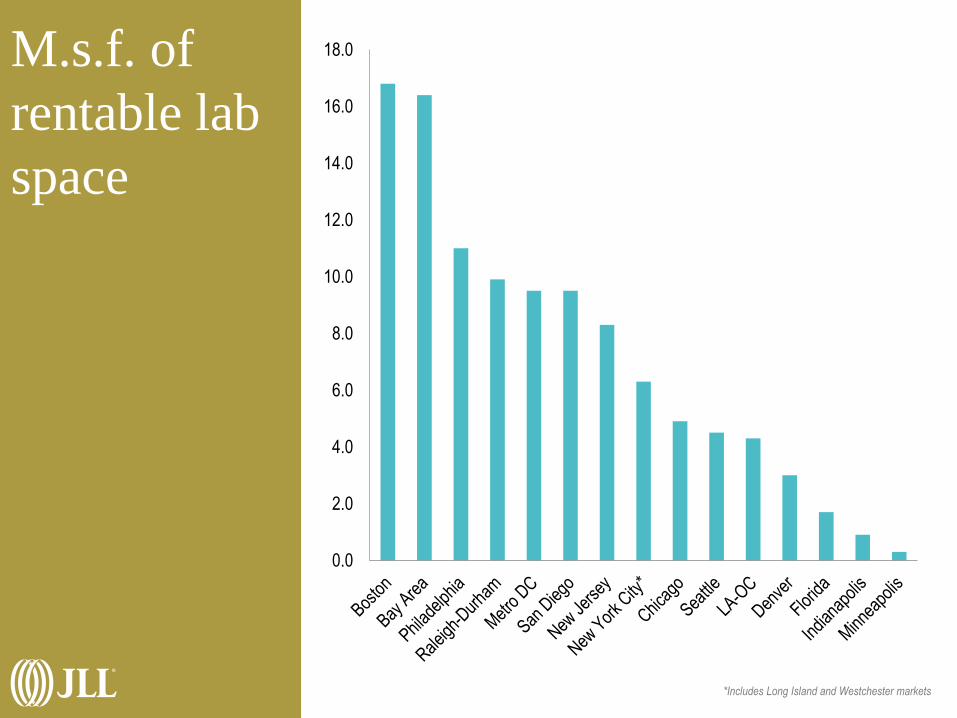
M.s.f. of
rentable lab
space
*Includes Long Island and Westchester markets
0.0
2.0
4.0
6.0
8.0
10.0
12.0
14.0
16.0
18.0

Newly
approved
drugs per
state
NJ 20%
CA 17%
MA 13% NY
6%
FL 5%
MD 3%
WA 5%
IL 3%
PA 3%
NC 3%
Other 22%

Industry trends:
#1: The rise of generics and biosimilars
Source: U.S. Food and Drug Administration
0%
20%
40%
60%
80%
100%
120%
United States Canada European Union Japan
Brand
Generic
Percent branded vs. generic prescriptions filled

Industry trends:
#2: Increased consolidation and globalization
Source: U.S. Food and Drug Administration
Total M&A deals in life sciences
0
10
20
30
40
50
60
Q1 2014 Q4 2014 Q1 2015
> $1B
$500M to $1B
$250M to $500M
$100M to $250M
$50M to $100M
$15M to $50M

Global
clusters to
watch
Mexico Mexico’s pharmaceutical
sales growth is projected
at 5.6 percent in 2014-
2018. An aging
population and growing
middle class are
increasing consumer
demand for pharma
products. The
government in Mexico is
pushing generics usage.
Brazil Number two in terms of
biotech crop production
and the top medical
device producer in South
America, Brazil’s life
sciences market will
continue to expand.
India Population growth and
an increase in chronic
illness makes India a
strong export market.
The Indian pharma
industry is expected to
grow 15.0% CAGR
to 2020.
Singapore A major re-exporter of
pharmaceuticals, this
market is projected to
grow 9.3 percent
annually over the next
4 years.
Indonesia A growing middle class is
supporting development
of the life sciences
industry. Indonesia’s
medical device market
is strong, with
projected future growth
of 15.0% y-o-y.
Turkey The creation of
technology development
zones that exempt
pharma entrepreneurs
from income tax until
2023 has driven R&D
activity and attracted
foreign investors.
Russia The domestic life
sciences market will
grow as the government
continues to restrict
imported drugs.
South Korea The government plans to
invest $5.3 billion in the
development of a life
sciences hub in Osong
Bio Valley.
Israel Tel Aviv has driven
innovation through a
new R&D park and
incubators to promote
life sciences start up
organizations, attracting
international investment.
China Due to the large
population and low rates
of insurance coverage,
China’s biosimilars
industry has become one
of the world’s strongest.

Industry
trends:
#3: Space
that enables
productivity
and
innovation
Source: U.S. Patent Office
1,652
1,412
1,325
1,231 1,180
956
837
639
505 456
411 335 303
170
0
200
400
600
800
1,000
1,200
1,400
1,600
1,800
Bay
Are
a
Bos
ton
NJ/
NY
C
LA/O
C
Min
neap
olis
San
Die
go
Phi
lade
lphi
a
Mar
ylan
d/D
C
Chi
cago
Flo
rida
Sea
ttle
Den
ver
Ral
eigh
-Dur
ham
Indi
anap
olis
Number of U.S. patents in 2013 (most recent available data)
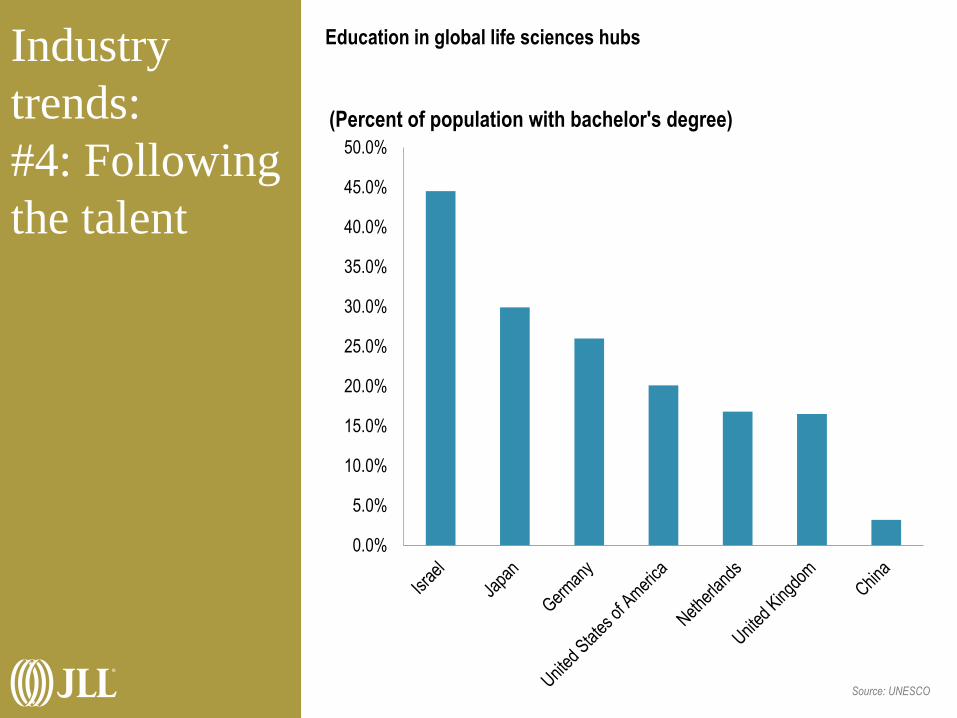
Industry
trends:
#4: Following
the talent
Source: UNESCO
Education in global life sciences hubs
0.0%
5.0%
10.0%
15.0%
20.0%
25.0%
30.0%
35.0%
40.0%
45.0%
50.0%
(Percent of population with bachelor's degree)

Real estate outlook
Source: JLL Research
In 2015, rents are increasing in all the major U.S. lab markets
$0.00
$5.00
$10.00
$15.00
$20.00
$25.00
$30.00
$35.00
$40.00
$45.00
$50.00
2014 2015
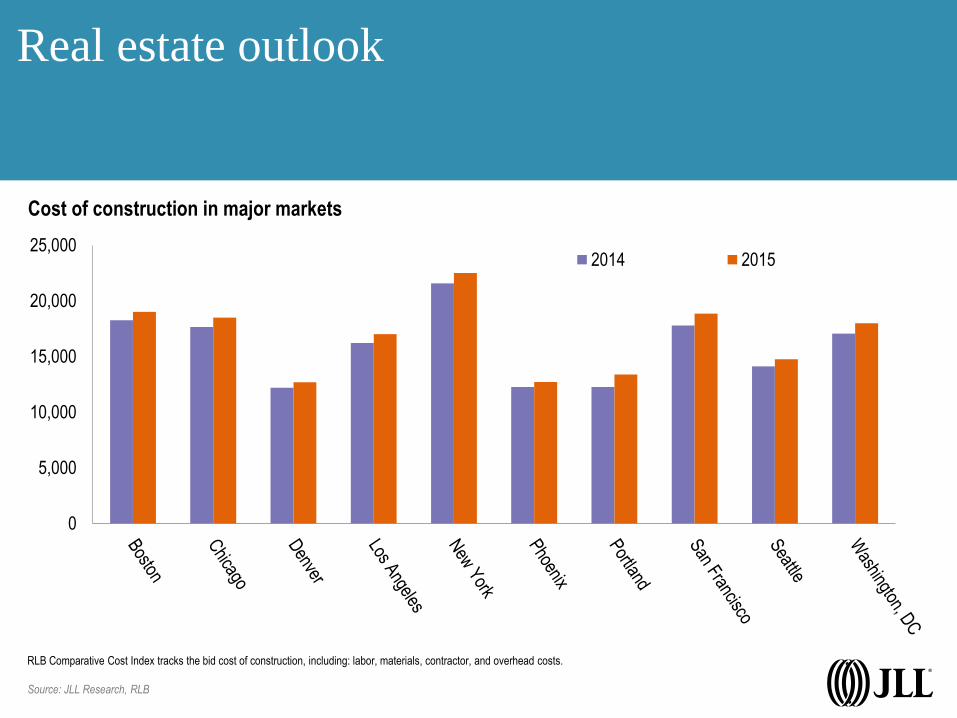
Real estate outlook
RLB Comparative Cost Index tracks the bid cost of construction, including: labor, materials, contractor, and overhead costs.
Source: JLL Research, RLB
Cost of construction in major markets
0
5,000
10,000
15,000
20,000
25,0002014 2015

© Copyright 2015 Jones Lang LaSalle
Roger Humphrey Executive Managing Director Life Sciences +1 (908) 698-2867 [email protected]
Dan Loughlin Managing Director Brokerage, New Jersey +1 (973) 939-3869 [email protected]
Richard McBlaine International Director Corporate Client Development +1 (312) 228-2793 [email protected]
Lauren Picariello Director, Industry Occupier Americas Research +1 (617) 531-4208 [email protected]
Dana Westgren Analyst, Industry Occupier Americas Research +1 (312) 228-2867 [email protected]
>>> Click here to check it out.
If you enjoyed, this preview, visit us.jll.com/life-sciences-trends
to learn more, see market-specific analyses and download our
complete report.
With questions on how this information impacts your business or investments, contact: