u.s. metric study interim report - international trade
TRANSCRIPT
U.S. METRIC STUDYINTERIM REPORT
INTERNATIONAL
TRADE
U.S. METRIC STUDY

U.S. METRIC SUBSTUDY REPORTS
The results of substudies of the U.S. Metric Study, while being evaluated
for the preparation of a comprehensive report to the Congress, are being
published in the interim as a series of NBS Special Publications. The titles
of the individual reports are listed below.
REPORTS ON SUBSTUDIES
NBS SP345-I:
NBS SP345-2:
NBS SP345-3:
NBS SP345-4:
NBS SP345-5:
NBS SP345-6:
NBS SP345-7:
International Standards (issued December 1970, SDCatalog No. C I 3. 10:345-1 , price $1.25)
Federal Government: Civilian Agencies ^issued
July 1971, SD Catalog No. C 1 3. 1 0:345-2, price
$2.25)
Commercial Weights and Measures (issued July 1971,
SD Catalog No. CI 3. 10:345-3, price $1.00)
The Manufacturing Industry (issued July 1971,
SD Catalog No. C I 3. 1 0:345-4, price $1.25)
Nonmanufacturing Businesses (in press)
Education (issued July 1971, SD Catalog No. CI3. 10:345-
6, price $1.75)
The Consumer (issued July 1971, SD Catalog No. CI3. 10:
345-7, price $1.25)
NBSSP345-8: International Trade ( this publication
)
NBSSP345-9: Department of Defense (issued July 1971, SDCatalog No. C 1 3. 1 0:345-9, price $1.25)
NBS SP345-IO: A History of the Metric System Controversy in the
United States (in press)
NBSSP345-1I: Engineering Standards (issued July 1971, SD Cata-
log No. CI 3. 10:345-1 1. price $2.00)
NBS SP345-I2: Testimony of Nationally Representative Groups (is-
suedJuly 1971, SD Catalog No. C13. 10:345-12, price$1.50)
COMPREHENSIVE REPORT ON THE U.S. METRIC STUDY
NBS SP345: To be published in August 1971
Those publications with catalog numbers have already been issued, and
may be purchased from the Superintendent of Documents, Government
Printing Office, Washington, D.C. 20402 for the prices indicated. Add one-
fourth of the purchase price if the publication ordered is to be sent to a
foreign address. Be sure to include the SD Catalog number with your order.

U.S. METRIC STUDYINTERIM REPORT
INTERNATIONAL
TRADE
i'J )
'
Eighth in a series of reports prepared
for the Congress
U.S. METRIC STUDYDaniel V. De Simone, Director
V< National Bureau of Standards
if, Special Publication 345-8
UNITED STATES DEPARTMENT OF COMMERCEMaurice H. Stans, Secretary
NATIONAL BUREAU OF STANDARDSLewis M. Branscomb, Director
Nat. Bur. Stand. (U.S.), Spec. Publ. 345-8, 188 pages (July 1971)
CODEN: XNBSA
Issued July 1971
For sale by the Superintendent of Documents, U.S. Government Printing Office, Washington, D.C. 20402(Order by SD Catalog No. C 13.10 :345-8), Price $1.50
Stock Number 0303-0895
SEP 7 1971
,0 SI
till


LETTER OF TRANSMITTAL
THE HONORABLE PRESIDENT OF THE SENATETHE HONORABLE SPEAKER OF THE HOUSE OFREPRESENTATIVES
SIRS:
I have the honor to present the eighth in the series of interim reports
stemming from the U.S. Metric Study, prepared by the National Bureau of
Standards.
This Study was authorized by Public Law 90-472 to reduce the many un-
certainties concerning the metric issue and to provide a better basis upon which
the Congress may evaluate and resolve it.
I shall make a final report to the Congress on this Study in August 1971.
In the meantime, the data and opinions contained in this interim report are
being evaluated by the Study team at the National Bureau of Standards. Myfinal report to you will reflect this evaluation.
Respectfully submitted,
Secretary of Commerce
Enclosure
iii
LETTER OF TRANSMITTAL
Honorable Maurice H. Stans
Secretary of Commerce
Dear Mr. Secretary:
I have the honor to transmit to you another interim report of the U.S.
Metric Study, which is being conducted at the National Bureau of Standards
at your request and in accordance with the Metric Study Act of 1968.
The Study is exploring the subjects assigned to it with great care. We have
tried to reach every relevant sector of the society to elicit their views on the
metric issue and their estimates of the costs and benefits called for in the
Metric Study Act. Moreover, all of these sectors were given an opportunity to
testify in the extensive series of Metric Study Conferences that were held last
year.
On the basis of all that we have been able to learn from these conferences,
as well as the numerous surveys and investigations, a final report will be madeto you before August 1971 for your evaluation and decision as to any recom-
mendations that you may wish to make to the Congress.
The attached interim report includes data and other opinions that are still
being evaluated by us to determine their relationship and significance to all
of the other information that has been elicited by the Study. All of these
evaluations will be reflected in the final report.
Sincerely,
Lewis M. Branscomb, Director
National Bureau of Standards
Enclosure
iv
FOREWORD
This report evaluates the potential effects that a U.S. conversion to the
metric system may have on the nation's foreign trade. To make this evalua-
tion, a survey was conducted of exporters and importers trading in products
that are "measurement sensitive." These are products in which dimensions are
critical—e.g., tractors, clinical thermometers, vacuum pumps, typewriters, and
computers.
Exporters and importers were asked to rank the factors that influence the
sale or purchase of these products in international trade. They were also asked
to estimate how much they would expect to export or import in 1975 if the
U.S. had gone metric by 1970. The results are given in this volume.
Reports covering other substudies of the U.S. Metric Study are listed on
the inside front cover. All of these, including this report, are under evaluation.
Hence, they are published without prejudice to the comprehensive report on
the U.S. Metric Study, which will be sent to the Congress by the Secretary of
Commerce in August of 1971
.
This report was prepared by the Bureau of Domestic Commerce of the
Department of Commerce, under the direction of Thomas E. Murphy. Gerald
F. Gordon was the principal staff member who designed and conducted the
statistical survey and drafted this report. Other members of the Bureau of
Domestic Commerce who made contributions to this study were Mrs. Dorothy
Miller, David Cohen, Gerald Moody, Mrs. Elsie Dorman and her staff, and
Mrs. Ann Wynn.
We are grateful to all who participated in this survey, particularly to the
hundreds of companies and trade associations that supplied the data which
made this report possible.
In this as in all aspects of the U.S. Metric Study, the program has benefited
from the independent judgment and thoughtful counsel of its advisory panel
and the many other organizations, groups and committees that have partici-
pated in the Study.
Daniel V. De Simone, Director
U.S. Metric Study
v


CONTENTSPage
Letters of Transmittal Hi, iv
Foreword v
Introduction 1
Chapter:
I. Summary of Findings 3
II. The Role of the United States in World Trade 7
Export Trends (1960-69) 10
Import Trends (1960-69) 11
III. Potential Effects of Metrication on U.S. Foreign Trade 14
Trade Trends of Measurement-Standard Sensitive Products . 14
Importance of the Measurement System 22
Estimated Effects of U.S. Metrication on Foreign Trade ... 33
Measurement Systems Characterizing U.S. Foreign Trade . . 38
IV. Potential Effects of U.S. Conversion to the Metric System
on Selected Industries 43
The Machine Tool Industry 43
The U.S. Steel Industry 49
The Air Conditioning and Refrigeration Industry 51
The Industrial Pump and Compressor Industry 57
The Industrial Fastener Industry 61
The Electronic Computing Industry 66
The Construction Machinery and Equipment Industry .... 69
Appendices:
A. Objectives and Methodology of Study 75
B. Statistical Tables 90
1. U.S. Merchandise Trade Balance and
Balance of Payments 91
2. U.S. Exports and Imports of Selected
Categories of Merchandise 92
3. U.S. Exports of Selected Categories of
Domestic Merchandise 93
vii
Page
4. U.S. Exports of Merchandise by Country 94
5. Total U.S. Exports and Exports Financed by
Military and Economic Aid 94
6. U.S. General Imports of Merchandise 95
7. U.S. General Imports of Selected Categories of
Manufactured Goods 95
8. U.S. General Imports of Merchandise by
Country or Area of Origin 96
9. U.S. Foreign Trade Balance for
Measurement-Standard Sensitive Products 97
10. U.S. Export Summary of Measurement-Standard
Sensitive Products 97
11. U.S. Import Summary of Measurement-Standard
Sensitive Products 99
12. U.S. Exports of Measurement-Standard
Sensitive Product Classes 101
13. U.S. Imports of Measurement-Standard
Sensitive Product Classes 149
viii
INTRODUCTION
The issue of U.S. conversion to the metric system is viewed by its advocates
as potentially another significant step towards bringing about a more fully
integrated international economy. Just as the Kennedy Round of trade nego-
tiations in 1967 resulted in freer and unhampered passage of goods and
services across national boundaries, so will the United States' conversion to
the metric system. Its advocates claim that the system would lessen trade
distortions resulting from differences in measurements and standards and help
allocate resources in a more efficient manner.
Whether conversion to the metric system would bring about a more fully
integrated international economy is not the central question to be answered by
the U.S. Metric Study. Rather, what must be answered by the Study is
whether conversion to the metric system is in the United States' best interest.
To answer this question, PL-90-472 authorized the Secretary of Commerceto determine the effects of increased world-wide use of the metric system on
the United States. Section 2 of the Law states: ".. . The Secretary, among
other things, shall ( 1 ) investigate and appraise the advantages and disadvan-
tages to the United States in international trade and commerce ... of an
internationally standardized system of weights and measures."
In accordance with Section 2 of the Law, this Study—one of fourteen
major investigative components of the U.S. Metric Study—has been prepared.
This Study's objective is "to evaluate the potential effects that U.S. conversion
to metric measurements and standards may have on U.S. foreign trade." To
1
2 INTERNATIONAL TRADE
achieve this objective a survey was conducted of exporters and importers
trading in products which would be affected by conversion to the metric
system. Appendix A presents details relative to the Study's objectives and
methodology.
It is not the purpose of this Study to recommend whether the United States
should or should not convert to the metric system. The U.S. Metric Study,
which will evaluate the findings from all study components, will make appro-
priate recommendations concerning the question of U.S. conversion. The
purpose of this Study is to provide data to be evaluated with the data from
other Study components to enable the Secretary of Commerce to make appro-
priate recommendations to the United States Congress.
This report is divided into four sections. Chapter I summarizes the Study's
findings. Chapter II briefly describes the role of the United States in world
trade and discusses current problems connected with our Balance of Payments
and the need to generate a larger trade surplus. Chapter III evaluates the
potential impact of metrication on U.S. foreign trade, analyzing the results of
the BDC survey of U.S. exporters and importers. Chapter IV consists of
analyses of the potential impact of metrication on selected industries.
I. SUMMARY OF FINDINGS
1 . U.S. export trade volume in product classes judged to be measurement-
standard sensitive (MSS), amounted to $13.9 billion in 1969, up from $9.2
billion in 1965—a gain of 47.1 percent. In 1969, MSS exports accounted for
36.3 percent of total U.S. exports of $38.0 billion.
2. Canada is the largest market for MSS products shipped by the U.S. In
1969, MSS exports to Canada were $3.0 billion. The European Economic
Community (EEC) countries were the second largest market, with U.S.
exports of MSS products totaling $2.6 billion, 62 percent greater than the
1 965 trade level. Combined, these two major markets account for over 40
percent of the total U.S. MSS exports.
3. The notion that the U.S. is losing exports to metric countries because its
products are not designed and manufactured in metric units and standards
appears to be ill-founded. U.S. exports of MSS products to metric countries
are more than double the exports to nonmetric countries. Furthermore, some
of the fastest growing markets for U.S. MSS products are the metric countries.
For example, shipments to both Japan and EEC markets grew faster than
total exports of MSS products. In the period 1965-69, exports of MSS prod-
ucts to metric countries grew 48.3 percent compared with a 44.6 percent
growth to nonmetric countries.
4. Most exports of MSS products involve machinery and equipment, classi-
fied as nonelectrical machinery, transportation equipment, electrical equip-
3
4 INTERNATIONAL TRADE
ment, and instruments. Exports of MSS nonelectrical machinery account for
nearly half of U.S. exports of MSS products.
5. Imports of MSS products were $6.0 billion in 1969, 129 percent higher
than 1965's $2.6 billion. The growth of MSS imports was slightly less than for
total imports during the period 1965-69. MSS imports accounted for close to
17 percent of total imports in 1969.
6. The largest supplier to the U.S. of MSS products is the EEC, the source
of about 38 percent of total MSS imports. Japan ranks as the second largest
supplier. MSS U.S. imports from Japan were the fastest growing of any
country, rising 175 percent from 1965-69. The EEC and Japan combined
accounted for 60 percent of total MSS imports.
7. Value-wise, the largest MSS import is transportation equipment, partic-
ularly motor vehicles from the EEC. Imports of motor vehicles from Canada
were excluded as not being MSS. Imports from Japan, the second largest
supplier of motor vehicles, increased over 900 percent from 1965-69.
8. The U.S runs a favorable trade balance in MSS products. Between 1965
and 1969, when the MSS trade surplus increased about $1.1 billion to reach a
peak of $7.9 billion in 1969, the total trade surplus was shrinking. The U.S.
has a trade surplus in MSS products with all countries, except Japan, which
had a trade deficit of $478 million in 1969.
9. U.S. exporters and importers rank the measurement factor very low,
indicating it affects U.S. trade only slightly. Exporters indicate that the top
three factors promoting sales abroad of MSS products were reliability and
reputation, superior technology, and high quality of product. These three
factors account for over 60 percent of total rankings. As to promoting exports,
the measurement system used to design and manufacture U.S. products
(either U.S. customary or metric) received only 1.6 percent of the total
rankings. The measurement system received only 3.3 percent of the total
ranking of export deterrent factors.
10. Importers of MSS products also consider measurement as having little
effect on trade. Price, reputation and reliability, and high quality of foreign
product were the most important factors promoting imports. Only 3.5 percent
of the rankings identified the measurement system as being an important
promoting factor.
11. The only instance where the measurement factor was cited as having an
important effect on trade was in the importation of wood and lumber products
and primary metal products. Importers in these product categories stated that
because these products are generally designed and manufactured in U.S.
customary units and engineering standards, their sales in the domestic market
were greatly enhanced.
12. Lack of technological and quality advantages of foreign products was
considered as the chief deterrent to importing. Once again, the measurement
system ranked very low as a deterrent to importing—only about 3 percent of
the total rankings.
13. A recurring theme throughout the Bureau of Domestic Commerce(BDC) survey was the importance of prices of products which were standard
SUMMARY OF FINDINGS 5
and had a low level technology. For many of these products, the U.S. cannot
compete with foreign producers. For example, steel, some types of machine
tools, standard fasteners, standard pumps and compressors, and veneer and
plywood are all products for which U.S. producers are not competitive price-
wise.
14. Another recurring theme was the importance of a technological edge
which U.S. producers have over foreign producers. It made little difference
whether it was a product such as a special fastener or something as complex
as a computer or aircraft. Technology was the key factor to U.S. exports.
15. Exporters indicate that conversion to the metric system would have a
positive effect on U.S. exports of MSS products. They were asked to make two
estimates of the percentage change in their 1975 export trade over 1970 trade,
assuming that among other things (a) the U.S. maintained its current meas-
urement system, and (b) the U.S. converted to the metric system in 1970.
Over 41 percent of the respondents thought their 1975 exports would be
higher than 1970 if the U.S. converted to the metric system as compared with
only 29 percent of the respondents who projected increases assuming the U.S.
maintained its current measurement system. Similarly, only 2.5 percent of the
respondents indicated a decline with conversion as compared with 15 percent
of the respondents who estimated a decline assuming the U.S. maintained its
current measurement system.
16. On a weighted basis, U.S. exporters in the BDC survey estimated their
1975 exports to be 2.7 percent higher if the U.S. had converted to the metric
system in 1970 instead of maintaining its customary system. Assuming U.S.
exports of measurement sensitive products were to increase to $20.6 billion in
1975, based on a straight line projection of these exports from 1965-69, it is
estimated that U.S. exports of MSS products would be about $600 million
larger in 1975, if the U.S. converted to the metric system.
17. Exports of most product classes in 1975 would change little by convert-
ing to the metric system according to exporters in the BDC survey. However,
for some product classes, exports would show substantial increases. For exam-
ple, exports of pumps and compressors would increase 18 percent; mechanical
measuring devices, 18 percent; hand tools, 13 percent; printing trades machi-
nery and equipment, 11 percent; special industrial machinery, 7 percent; and
textile machinery, 6 percent. Only two product classes of exports would
decline. Exports of mechanical power transmission equipment, except ball and
roller bearings, were estimated to decline 0.6 percent and electric measuring
instruments and test equipment, 0.7 percent.
18. Surveyed importers estimate that their 1975 imports would show no
change assuming the U.S. converted to the metric system. With few excep-
tions, they stated that their sales of foreign made products would not increase
if the U.S. converted to the metric system.
19. Of the respondent exporters, 17 percent stated that they designed and
manufactured products in both U.S. customary and metric units and stand-
ards. However, many respondents merely described products designed and
manufactured in U.S. customary units and standards in metric terms.
20. About 17 percent of the respondents stated that exports were hindered
6 INTERNATIONAL TRADE
because products were not manufactured in metric units and engineering
standards, West Germany, France, Italy, the Netherlands, and Sweden were
the most frequently mentioned countries hindering exports.
21. About 13 percent of the respondent exporters stated that they actively
solicited export orders requiring production in metric units and engineering
standards. A similar percentage indicated that in the last 3 years, export
orders had been lost because the specification requiring the products to be
manufactured in metric units and engineering standards could not be met.
22. With respect to the United Kingdom's conversion to the metric system,
over 17 percent of the survey respondents thought that their export sales to
the U.K. would be adversely affected if they did not ship in metric units and
engineering standards. Another 57.5 percent thought their export sales would
not be affected and 25 percent had no opinion.
23. About 35 percent of the total survey responses indicated that exports
went to foreign affiliates, the remainder to foreign customers. Of that part
shipped to foreign affiliates, about 38 percent went to foreign affiliates of the
respondents for further processing, 58 percent was shipped for resale, and 4
percent for other purposes.
24. Over 90 percent of the respondents' exports were products designed
and manufactured in U.S. customary measurement units and/or engineering
standards. About 10 percent were products designed and manufactured in
U.S. customary measurements and/or engineering standards, but described in
labels, packages, engineering drawings, and catalogues in terms of metric units
and/or engineering standards. Only one percent of exports were products
designed and manufactured in metric units and/or engineering standards or
were products modified or changed to include metric components, parts, or
subassemblies.
25. Over 50 percent of the respondents' imports are products designed and
manufactured in metric units and engineering standards. Only 19 percent of
the imports are products designed and manufactured in U.S. customary units
and engineering standards. About 19 percent are products designed and man-
ufactured in metric units and engineering standards but are described in U.S.
customary units and engineering standards, and 9 percent are metric products
substantially modified or changed to include parts and components in U.S.
customary units and engineering standards.
II. THE ROLE OF THE UNITED STATES
IN WORLD TRADE
Because of its position as the principal trading and investing nation in the
world, the United States has a strong influence on the stability and growth of
international commerce. Many countries are dependent on the United States
as an outlet for their goods and as a source of needed materials. Fluctuations
in the rate of economic growth in the United States have significant impacts
on the trade and economic growth of our trading partners. U.S. investment
abroad, which has been paid for in large part by means of the country's trade
surpluses, has contributed greatly to the growth of world-wide income and
trade. Moreover, because the dollar is the principal trading and reserve cur-
rency, the U.S. balance of payments plays a predominant role in the interna-
tional monetary system.
Conversely, the U.S. economy as a whole is much less dependent on foreign
trade than most smaller countries. In fact, the trade of the United States is so
small compared with the country's total economic activity that trade policy is
of less concern here than in many other countries. Whereas U.S. exports nowaccount for 1 7 percent of total world trade, these exports are equal in value to
only about 4 percent of the country's gross national product. Further, after a
period of exceptionally rapid growth, U.S. imports are now equal to 4 percent
of the gross national product.
Traditionally, the United States has depended heavily on its merchandise
trade surplus to counter the net outflows of private capital and the expendi-
tures abroad for various Governmental programs. The United States had fairly
sizeable trade surpluses in most of the years in the 1950's and unusually large
surpluses from 1960 to 1965. However, the surpluses were small in 1966-67
7
8 INTERNATIONAL TRADE
and virtually nil in 1968-69. The surplus was larger in 1970 than it was in
each of the 2 preceding years.
Despite trade surpluses over the years, the United States has had a deficit in
its balance of payments (on the liquidity basis) in 18 of the past 20 years.
The United States had substantial payments deficits in the early and mid-
1960's despite substantial trade surpluses. While it was possible in 1968 to
achieve a small payments surplus even though the trade surplus was negligible,
this was accomplished only after substantial mandatory restrictions were
placed on foreign investment by U.S. firms and after exceptional financial
conditions in this country resulted in a temporary inflow of funds from
abroad. In 1969, a second year in which the United States had a very small
trade surplus, the payments deficit was the largest on record for this country.
(See table 1, p. 91.)
The country's chronic balance-of-payments difficulties have resulted in a
substantial depletion of our international reserve assets. The value of U.S.
reserve assets ranged from $23 billion to $25 billion in the period 1950-57.
The reserve assets declined each year from 1957, when they were valued at
about $25 billion, to 1967 when they were valued at only $15 billion. At the
end of 1969, U.S. international reserve assets were valued at $17 billion.
Gold stocks constitute the largest part of the reserve assets of the United
States. However, in recent years, convertible foreign currencies and the U.S.
reserve position in the International Monetary Fund (IMF) have become
relatively more important in the total reserve position in the United States. In
particular, gold stocks were equal in value to only 70 percent of the country's
total reserve assets in 1969 compared with 92 percent in 1960. The advent of
the so-called Special Drawing Rights in the IMF probably insures that gold
will become even less important as a reserve asset in coming years.
In addition to the decline in U.S. holdings of reserve assets and the changes
in the composition of those assets, there has occurred a sharp rise in U.S.
liquid liabilities to foreigners. Such liabilities were valued at $21 billion at the
end of 1960; by the end of 1969, they amounted to $42 billion. The largest
increase in U.S. liquid liabilities to foreigners occurred in 1969 when the
United States suffered a very large payments deficit. The liabilities to foreign-
ers rose from $34 billion at the end of 1968 to $42 billion a year later. By far
the largest part of the recent increase in U.S. liquid liabilities has consisted of
a growth in the short-term liabilities to foreign countries reported by banks in
the United States from $19 billion in 1968 to almost $28 billion at the end of
1969.
The United States has taken a number of stop-gap measures over the years
to reduce the size of the balance-of-payments deficits, including: Changes in
the Buy-American practices of defense agencies to increase purchases from
domestic sources; restrictions on direct investment abroad by U.S. firms;
interest equalization taxes to reduce the outflow of private funds; and restric-
tions on foreign lending by U.S. banks. In addition, the monetary policy of the
United States has been influenced by international needs, reductions and
restrictions of various kinds have been imposed on U.S. economic assistance
to the developing countries, the staffs of the U.S. embassies have been
THE ROLE OF THE UNITED STATES IN WORLD TRADE 9
reduced, the Export-Import Bank has liberalized the criteria that must be
satisfied before loans will be granted to finance U.S. exports, a number of
efforts have been made by the Government to induce U.S. businessmen to
expand their exports, and the U.S. Travel Service has striven to encourage
tourism in this country to offset the large expenditures abroad by American
tourists. Many other programs and policies of the U.S. Government have been
influenced to some extent by the country's international payments difficulties.
In view of the long history of U.S. international payments difficulties, it
appears that fiscal and monetary policy alone cannot be expected to correct
the situation. However, in the late 1960's and early 1970's, the fiscal and
monetary policies appropriate for achieving a stabilization of the domestic
economy were also appropriate for dealing with the international disequilib-
rium. Consequently, efforts to reduce price inflation and to reduce the rate of
economic expansion were clearly in order. It appears, however, that restrictive
policies will be discontinued for domestic reasons long before the international
payments are brought into balance. In fact, there is likely to be a recurrence
of the conflict in the policies appropriate for domestic and international
balance that prevailed in the early 1960's. In that period, expansionary poli-
cies were needed for purposes of reducing unemployment and increasing the
rate of economic growth; however, such expansionary policies were clearly not
appropriate for dealing with the international payments deficits.
If the United States is to continue to play a significant role in international
affairs, it will probably be necessary for this country again to become a
substantial net exporter. The earnings from U.S. investment abroad, which
have become more and more important as a credit item in the country's
balance of payments, are not yet so large that they can offset perpetual deficits
and also enable the country to meet its responsibilities abroad. A trade surplus
of some magnitude will probably be required if the United States is to provide
greater assistance to developing nations. Such a surplus would also make it
easier for the country to reassert its leadership in bringing about greater
freedom of international trade and investment. Much of the present sentiment
in the United States for protectionist policies has no doubt arisen from the
failure to deal effectively with the overall balance-of-payments problems.
The recent interest throughout the world in greater flexibility of interna-
tional exchange rates may indicate that steps will be taken to deal more
effectively in the future with the chronic balance-of-payments difficulties of
various countries, particularly the United States. Several steps have been taken
in the past few years to alter the exchange rates of countries with chronic
payments deficits or surpluses. Because of the critical role of the U.S. dollar as
an international reserve currency, it may not be feasible for the United States
unilaterally to devalue the dollar. Nevertheless, results comparable to a deval-
uation of the dollar can perhaps be achieved by means of a revaluation of the
currencies of the countries with chronic payment surpluses. Further, it may be
possible to obtain general international agreement on the desirability of some-
what greater flexibility in the establishment of exchange rates than has existed
in the past.

10 INTERNATIONAL TRADE
Export Trends (1960-69)
U.S. exports of domestic merchandise increased from about $20 billion in
1960 to $37 billion in 1969. Despite the great expansion in demand and the
resulting price inflation in this country during the period of escalation of the
Vietnam conflict, exports increased more rapidly in that period than at the
beginning of the decade. The annual increases in exports averaged about 9
percent in the period 1963-69 compared with less than 5 percent in the pe-
riod 1960-63. Manufactured goods accounted for about 85 percent of the
increase in U.S. exports from 1960 to 1969. In 1969, about 75 percent of
the exports (in terms of value) consisted of manufactures compared with
about 65 percent in 1960. (See table 2, p. 92.)
Leading export items in recent years have included aircraft, electronic
computers, power generating machinery, telecommunications apparatus,
chemicals, and grains. From 1960 to 1969, the rise in exports of transport
equipment, including aircraft, by about $4 billion and of nonelectrical machi-
nery of all kinds by $3.8 billion accounted for about 45 percent of the growth
from 1960 to 1969 in U.S. exports. (See table 3, p. 93.)
Despite the growth in U.S. exports in the 1960's, the U.S. share of world
exports of manufactures declined in that decade. 1 The decline in the U.S.
share of world exports of manufacturers was smaller in the 1960's, however,
than it was in the 1950's when European and Japanese industries were
experiencing especially rapid postbellum growth. The United States supplied
22 percent of the world exports of all manufactures in 1969 compared with
25 percent in 1960. The decline in the U.S. share of the world market for
chemicals was greater than for any other major manufacturing sector, drop-
ping in 1969 to only 22 percent compared with 30 percent in 1960. As for
transport equipment as a whole, the U.S. share of world exports has been
higher in the past 3 years (32 to 34 percent) than it was in the mid-1960's
but about the same as it was in the early 1960's.
U.S. exports to the developed countries doubled in value in the period
1960-69 compared with a 60 percent increase to the developing countries.
Canada, the largest foreign outlet for U.S. goods, accounted for 30 percent of
the growth in U.S. exports from 1960 to 1969. As a result of the rapid
expansion in U.S. exports to Japan, that country became the second largest
foreign market for U.S. goods, displacing the United Kingdom. In 1969,
Canada took 24 percent and Japan 9 percent of the U.S. exports. (See table
4, p. 94.)
A part, but evidently only a small part, of the decline in the U.S. trade
balance in the late 1960,
s is attributable to the reduction in the financing of
U.S. exports by means of foreign assistance programs. Exports financed by
those programs rose in value from $2.7 billion in 1960 to $3.5 billion in
1964, then declined to $3.4 billion in 1966 to $2.7 billion in 1969. As a result
1 World exports are defined as exports from the 14 major industrial countries. These nations, whichaccount for approximately four-fifths of world exports of manufactures to foreign markets, are: United
States, Austria, Belgium-Luxembourg, Canada, Denmark, France, Federal Republic of Germany, Italy,
Japan, the Netherlands, Norway, Sweden, Switzerland, and the United Kingdom.

THE ROLE OF THE UNITED STATES IN WORLD TRADE 1 1
of the reductions in foreign assistance, the assistance programs accounted for
the financing of only 8 percent of the U.S. exports in 1968 and 7 percent in
1969 compared with from 12 to 13 percent in the early and mid 1960's. (See
table 5, p. 94.)
Foreign investment by U.S. companies has both positive and negative
effects so far as the exports of the United States are concerned. Such invest-
ment establishes links between businesses in this country and abroad which
tend to increase international trade. However, foreign investment may also act
as a substitute for exports of merchandise. While analysis of the net effects of
foreign investment on the exports of the country is beyond the scope of this
report, studies show that sizeable shares of the U.S. exports of certain products
have gone to foreign affiliates of U.S. firms. Exports of automobiles, machi-
nery, and chemicals to foreign affiliates have been particularly significant.
Moreover, in some parts of the world U.S. affiliates are among the most
important earners of foreign exchange. Such foreign exchange earnings enable
the countries in question to import goods from various countries, including
the United States, which they otherwise would not be able to import.
A sizeable number of Americans are employed in export-related activities.
In recent years, the production of goods for export and the provision of
various kinds of services to carry out the export transactions have accounted
for a littie less than 5 percent of the total private employment in the United
States. Export transactions have accounted for more than 10 percent of the
employment in the mining and agricultural, forestry, and fishery industries.
About 7 percent of the employment in the manufacturing industries has been
attributable to exports.
Import Trends (1960-69)
Of particular significance with respect to U.S. international trade in the
1960's is the increase in imports of manufactured goods. Annual imports of
manufactured goods increased in value by 235 percent from 1960 to 1969
whereas the imports of all other merchandise (including crude materials,
fuels, food, beverages, and tobacco) rose only about 60 percent. Manufac-
tured goods accounted for two-thirds of the value of the merchandise
imported in 1969 compared with less than half of the imports in 1960. (See
table 6, p. 95.)
The imports of manufactured goods, like U.S. imports generally, increased
at a fairly slow pace from 1960 to 1964. It was not until 1965 that manufac-
tured goods accounted for more than half of the total value of U.S. merchan-
dise imports. As the following tabulation indicates, manufactured goods
became more and more important in the total import picture as the decade
came to a close.
The substantial increase in U.S. imports of manufactures in the period
1964-69 coincided with a sharp rise in economic activity in this country.
Unemployment averaged only 3.8 percent of the civilian labor force in the
years 1965-69 compared with 5.7 percent in 1960-64. Unfilled orders on the

12 INTERNATIONAL TRADE
Imports of Manufactured Goods as a Percent
of Total U.S. Merchandise Imports
1960 47
1961 46
1962 48
1963 48
1964 50
1965 54
1966 58
1967 61
1968 64
1969 66
Source: Calculated from data in 1970 Economic Report of the President, p. 278.
average were equal to about 2.8 times the value of manufacturers' shipments
in the years 1965-69 compared with 2.5 times manufacturers' shipments in
1960-64. Wholesale prices rose on the average by about 12 percent from
1964 to 1969 whereas such prices were nearly stable in the period 1960-64.
Of the $16 billion increase from 1960 to 1969 in the value of U.S. annual
imports of manufactures, automobiles and parts, iron and steel, electrical
machinery, nonelectric machinery, and nonferrous metals accounted for 60
percent. Imports of automobiles and parts were almost 8 times as great (in
terms of value) in 1969 as they had been in 1960, which contributed signifi-
cantly to the rapid growth in U.S. imports of manufactures in the late 1960's.
In fact, if the imports of automobiles and parts had increased in the period
1960-69 at the same rate as U.S. imports generally, the United States would
have had a trade surplus in 1969 of about $4.5 billion instead of the surplus
that it actually had of only $0.7 billion.1 (See table 7, p. 95.)
Of special interest with respect to the possibility of the United States
adopting the metric system is the international trade in machinery of various
kinds. In the period 1960-69, U.S. annual imports of machinery increased in
value from $0.7 billion to $4.4 billion, at a rate almost 4 times that of U.S.
imports generally. Among the principal contributors to the recent rise in
imports of machinery are engines and parts; metalworking machinery; tele-
communications apparatus; office machines; and electron tubes, transistors,
semiconductor devices, and parts.
The developed countries have been the source of the bulk of the increase in
U.S. imports in the past few years. Imports from developed countries were
more than 3 times greater in 1969 than in 1960 (in terms of value) whereas
imports from developing countries were only about 50 percent greater in the
latter year than in the former. Annual imports from Canada rose from $2.9
billion in 1960 to $4.8 billion in 1965 and to $10.4 billion in 1969, the
largest increase for any one supplier country. (See table 8, p. 96.)
Canada supplied 29 percent of the imports of the United States in 1969
compared with only 23 percent as recently as 1965. Transport equipment,
1 U.S. international trade (both exports and imports) in automotive products rose at a very rapid
rate in the late 1960's largely because of the Canadian Automobile Agreement which resulted in con-
ditional free trade in such products between the United States and Canada. In 1965, the United States
had a trade surplus with Canada in automotive products of about $700 million; by the end of the
decade, the surplus with Canada was very small and it appears that there may be a deficit in 1970.
THE ROLE OF THE UNITED STATES IN WORLD TRADE 13
including automobiles which are the subject of a trade agreement between the
United States and Canada, accounted for a sizeable part of the recent growth
in U.S. imports from Canada. In 1969, the United States imported from
Canada transport equipment valued at $3.1 billion compared with $0.2 billion
i» 1965.

III. POTENTIAL EFFECTS OF METRICATION
ON U.S. FOREIGN TRADE
TRADE TRENDS OF MEASUREMENT-STANDARDSENSITIVE PRODUCTS
Exports: In the period 1965-69, U.S. export trade in those product classes
judged to be measurement-standard sensitive (MSS) grew faster than the
volume of total U.S. exports. In 1969 exports in MSS product classes totaled
$13.9 billion, up from $9.4 billion in 1965, 1 a gain of 47 percent compared
with a 38 percent increase in total exports for the same period. In 1969, MSSexports accounted for over 36 percent of total U.S. exports. (See app. B for
detailed trade statistics of MSS products.)
Exports to Canada, the largest market for U.S. MSS products, were $3.0
billion in 1969, which was $1.1 billion greater than 1965 exports. The second
largest market for U.S. shipments of MSS products is the European CommonMarket (EEC), to which exports totaled $2.6 billion in 1969, 62 percent
higher than in 1965. Canada and the EEC accounted for about 40 percent of
total U.S. MSS exports. MSS products exported to the United Kingdom(U.K.) grew over 57 percent from 1965-69, from $535 million to $840 mil-
lion. Although exports of MSS products to the U.K. were larger than to Japan
in 1965, the Japanese market grew faster and was slightly larger than the
1 This definition excludes motor vehicle and farm machinery exports to Canada because there are
essentially inter-plant transfers of American companies. More than likely, these exports would not
increase or decrease if the U.S. converted to the metric system. In 1969, these exports were $2.5 billion.
The definition also excludes exports of military aircraft because these are generally negotiated sales
between the U.S. and foreign governments.
14
EFFECTS OF METRICATION ON U.S. FOREIGN TRADE 15
U.K. market in 1969, increasing over 100 percent from $434 million to $883
million.
Nearly half of U.S. exports of MSS products go to countries other than
Canada, EEC, U.K., and Japan. Latin American and many Asian countries are
important markets for U.S. MSS products.
U.S. Exports of MSS Products, 1969, 1967, 1965
(In Millions of Dollars)
1969 1967 1965
Total, all products 13,922.7 11,308.8 9,465.1
3,027.5 2,589.0 2,103.9
EEC 2,581.3 1.931.1 1,563.0
840.1 681.4 534.9
883.2 559.3 434.1
All other 6,590.6 5,548.0 4,829.2
The notion that the U.S. is losing exports in metric countries because its
products are not designed and manufactured in metric units and engineering
standards appears to be ill-founded. U.S. exports of MSS products to metric
countries are over twice the exports of nonmetric countries and some of the
fastest growing markets for U.S. MSS products are metric countries, e.g.,
Japan and EEC. From 1965-69, U.S. exports of MSS products to metric
countries grew 48 percent as compared with a growth of about 45 percent to
nonmetric countries.
Value of MSS Exports
(In Billions of Dollars)
Year
Tometric
countries
Tononmetric
countries
1965 6.4 3.0
1966 7.0 3.4
1967 7.6 3.7
1968 8.6 4.0
1969 9.5 4.4
MSS nonelectrical machinery accounts for nearly half of total MSS U.S.
exports. In 1969, MSS exports in this product category were $6.3 billion,
having increased nearly 36 percent over 1965. The nonelectrical machinery
group includes many of the high technology and fastest growing export prod-
uct classes. For example, exports of electronic computing equipment grew 227
percent from 1965-69. Special industrial machinery increased 82 percent; air
conditioning and refrigeration machinery, 64 percent; printing machinery and
parts, almost 63 percent; and industrial trucks and tractors, 46 percent.
16 INTERNATIONAL TRADE
Canada and the EEC countries are the chief markets for nonelectrical
machinery identified as MSS, accounting for over 40 percent of these exports.
The fastest growing market was Japan, which increased over 100 percent from
1965-69.
U.S. Exports of Nonelectrical Machinery identified as
Measurement-Standard Sensitive, 1969, 1967, 1965
(In Millions of Dollars)
1969 1967 1965
6,282.6 5,262.5 4,625.8
1,582.7 1,440.5 1,255.9
EEC 1,098.0 803.5 668.4
388.3 350.5 289.8
Japan 376.2 258.5 184.5
All other 2,837.4 2,409.5 2,227.2
The second most important class of MSS products is transportation equip-
ment, which in 1969 had an export trade volume of $3.0 billion, an increase
of 56 percent from 1965. The EEC countries are the largest single market for
MSS transportation equipment, receiving U.S. exports of $657 million in
1969, nearly double the 1965 level.
Over 65 percent of MSS transportation equipment exports are commercial
aircraft, aircraft engines and parts. These exports increased over 100 percent
from 1965-69, advancing from $966 million to nearly $2.0 billion. The most
important single market for U.S. commercial aircraft was the EEC. In 1969
U.S. shipment of aircraft and aircraft equipment and parts to the EEC was
$557 million or about 28 percent of total exports of commercial aircraft.
Other important markets for U.S. produced aircraft are Canada which pur-
chased $252 million in 1969 and Japan, $164 million.
Excluding exports to Canada, exports of motor vehicles, buses, trucks, and
parts and accessories remained almost unchanged from 1965-69 at a $1
billion level. Latin American countries are major markets for these exports,
U.S. Exports of Transportation Equipment Identified as
Measurement-Standard Sensitive, 1969, 1967, 1965
(In Millions of Dollars)
1969 1967 1965
3,044.1 2,472.0 1,946.0
Canada 293.2 231.9 102.0
EEC 657.4 504.3 363.5
United Kingdom 101.0 84.9 54.6
189.8 116.2 137.7
All other 1,802.7 1,534.7 1,288.2

EFFECTS OF METRICATION ON U.S. FOREIGN TRADE 17
whereas the EEC countries, U.K., and Japan import only small quantities of
motor vehicles from the U.S.
The third major export category of MSS products is electrical equipment
and supplies, whose exports totaled $2.3 billion in 1969, up 73 percent from
1965. Major exports of MSS electrical equipment are radio and television
broadcasting equipment, electrical measuring instruments and test equipment,
motors and generators, and current-carrying wire devices.
Canada, an important market for U.S. electrical equipment, imported $527million of MSS electrical equipment in 1969. The EEC market was the second
largest followed by the U.K. The Japanese market has been growing rapidly; it
increased 131 percent from 1965-69, moving from $51 million to $117
million.
U.S. Exports of Electrical Equipment Identified asMeasurement-Standard Sensitive, 1969, 1967, 1965
(In Millions of Dollars)
1969 1967 1965
2,301.9 1,777.5 1,330.4
Canada 526.8 412.6 294.7
EEC 445.2 346.0 293.3
United Kingdom 238.1 139.7 108.1
117.4 87.1 50.9
All other 974.4 792.1 583.4
Other major export categories of MSS products include primary metals,
mostly steel products. In 1969 these exports were valued at $664 million.
Following closely were instruments and related products. These exports,
mostly instruments for measuring, controlling, and indicating physical charac-
teristics, amounted to $640 million in 1969. Finally, about $272 million of
lumber and wood products exports were identified as being MSS. These
included mostly veneer and plywood and sawmill and planing mill products.
Imports: U.S. imports of MSS products 2 were $6.0 billion in 1969, 129
percent higher than the 1965 level of $2.6 billion. Measurement-standard
sensitive imports have grown slightly less than total imports, which increased
138 percent from 1965-69. However, the growth of MSS imports was muchgreater than MSS exports for the same time period.
2 This definition excludes: (1) Motor vehicles and farm machinery imports from Canada which are
mostly interplant transfers of American companies. These exports totaled $3.3 billion in 1969 and are
not likely to increase or decrease if the U.S. converted to metric. (2) Imports of consumer radio and
television receiving sets from Japan which are specifically designed and manufactured by Japan for
the U.S. market. These imports, $0.7 billion in 1969, would not likely increase or decrease by metrica-
tion. (3) Imports of sawmill and planing mill products from Canada because they are either shipped
to the U.S. by affiliates of U.S. companies or they are specifically designed to U.S. standards by
Canadian firms for the U.S. market. They would not likely increase or decrease by metrication. These
imports amounted to $0.6 billion in 1969. (4) Imports of steel products because they are specifically
designed to U.S. standards and measurements for the U.S. market. They would not likely increase or
decrease by metrication. These imports were $1.4 billion in 1969.

18 INTERNATIONAL TRADE
The value of MSS imports as a percent of total imports is significantly
lower than the proportion of MSS exports to total exports. In 1969, the
import ratio was close to 17 percent as compared with a 36 percent ratio for
exports. From 1965-69, the import ratio increased from 12 percent to 17
percent.
The largest supplier of MSS products to the U.S. is the EEC, from which
about 38 percent of the total MSS imports come. In 1969, MSS imports from
the EEC were nearly $2.3 billion, double the 1965 volume of $1.1 billion.
Japan is the second largest supplier of MSS products to the U.S., shipping
products totaling $1.4 billion in 1969, up 175 percent from 1965. MSSimports from the EEC and Japan combined accounted for over 60 percent of
total MSS imports.
MSS imports from the U.K. are barely larger than those from Canada,
amounting to $676 million and $665 million in 1969, respectively. Imports
from Canada grew almost 163 percent from 1965-69, compared with a 65
percent increase from the U.K.
Value-wise, the largest amount of MSS imports is transportation equipment,
particularly motor vehicles from the EEC, at $2.1 billion in 1969, up from
$879.2 million in 1965. Over half of the imports came from the EEC.
In 1969 Japan was the second largest supplier of transportation equipment
to the U.S. after ranking third in 1965. Motor vehicle imports from Japan
increased over 900 percent from 1965-69, rising from $37 million to $372
million.
Very close to transportation equipment in value were MSS imports of
nonelectrical machinery, which amounted to $1.9 billion in 1969, 137 percent
above 1965. In 1969, the most important MSS nonelectrical machinery prod-
ucts imported were typewriters and other office equipment ($379 million),
machine tools ($183.2 million), textile machinery ($166.7 million), and
general industrial machinery and equipment ($333.9 million).
Imports from the EEC, the largest supplier of MSS nonelectrical machinery
to the U.S., were $727.1 million in 1969, almost 40 percent of the total value
of MSS nonelectrical machinery imports. Between 1965 and 1969, EECimports climbed 113 percent. Major items imported from the EEC were
U.S. Imports of Measurement-StandardSensitive Products, 1969, 1967, 1965
(In Millions of Dollars)
1969 1967 1965
Total, all products 6,044.5 3,932.2 2,643.1
Canada
EECUnited KingdomJapan
All other
665.3
2,278.9
675.7
1,361.5
1,063.1
417.1
1,647.1
546.6
688.6
632.8
253.4
1,072.7
408.5
495.6
412.9
EFFECTS OF METRICATION ON U.S. FOREIGN TRADE 19
U.S. Imports of Transportation Equipment Identified
as Measurement Sensitive, 1969, 1967, 1965
(In Millions of Dollars)
1969 1967 1965
2,071.4 1,191.6 879.2
Canada 3 34.2 13.5 12.4
EEC 1,149.3 729.3 502.1
United Kingdom 256.8 184.6 149.3
Japan 502.7 165.9 146.3
All other 128.4 98.3 69.0
3 Excludes motor vehicle imports from Canada which are not classified as MSS.
machine tools, textile machinery, printing trades machinery, typewriters, and
other office equipment.
Aside from the EEC, remaining U.S. imports of MSS nonelectrical machi-
nery were divided almost evenly among Canada, U.K., Japan, and all other
countries. Imports from these countries in 1969 ranged from $265 million to
$298 million. The fastest growing supplier of MSS nonelectrical machinery is
Japan, whose imports to this country increased over 500 percent, from $49.5
million in 1965 to $298.0 million in 1969.
U.S. Imports of Nonelectrical Machinery Identified as
Measurement-Standard Sensitive, 1969, 1967, 1965
(In Millions of Dollars)
1969 1967 1965
1,859.8 1,315.0 783.4
Canada 276.7 171.6 103.6
EEC 727.1 560.6 341.4
264.9 233.5 162.6
298.0 139.2 49.5
All other 293.1 210.1 126.3
Electrical equipment and supplies was the third largest U.S. import category
of MSS products. These imports rose 157 percent from 1965-69, advancing
from $467 million to $1.2 billion. In 1969, the largest MSS imports of
electrical equipment were radio and television receiving sets ($224.8 million,
excluding $727 million from Japan which are not classified as MSS); radio
and television broadcasting equipment ($190.9 million); sewing machines
($109.2 million); and household cooking equipment, fans, and other appli-
ances (93.9 million).

20 INTERNATIONAL TRADE
Japan is the largest single supplier of MSS electrical equipment to the U.S.
market, shipping $283 million in 1969, slightly more than from the EEC and
Canada.
U.S. Imports of Electrical Equipment Identified as
Measurement-Standard Sensitive, 1969, 1967, 1965
(In Millions of Dollars)
1969 1967 1965
1,200.0 766.4 466.6
220.2 131.1 62.0
EEC 233.2 193.6 104.7
United Kingdom 118.7 95.6 73.4
282.8 195.5 147.0
All other 345.1 150.6 79.5
Other MSS product categories with significant U.S. import volume in 1969
include veneer, plywood, and hardwood flooring ($334 million); fabricated
metal products ($271 million); instruments and related products ($177 mil-
lion); and primary metal products ($132 million).
Trade Balance: The U.S. runs a favorable trade balance in those products
identified as MSS. Throughout the last half of the sixties, this trade surplus
was relatively stable, as compared with a declining surplus for total foreign
trade for the same time period. In 1969, the surplus for MSS products was
$7.9 billion, about $1.1 billion above the 1965 surplus. The U.S. has an MSStrade surplus with all countries, except Japan. The trade MSS deficit with
Japan increased 678 percent from 1965-69, climbing from $61.5 million to
$478.3 million.
The largest U.S. trade surplus of MSS products is with Canada. In 1969,
this surplus was $2.4 billion, up from $1.9 billion in 1965. In 1969, the trade
surplus with the EEC was quite small, amounting to $300 million; however, it
fluctuates quite significantly, ranging from a $490 million surplus in 1965 to a
$70 million deficit in 1968.
Over 70 percent of the U.S. trade surplus in MSS products is with countries
other than Canada, EEC, United Kingdom, and Japan. Latin American coun-
tries and Asian countries, other than Japan, all import more MSS products
from the U.S. than the U.S. imports from them.
The U.S. manages to maintain a trade surplus in all major MSS product
categories, except for a small deficit in lumber and wood products. Over 56
percent of the MSS trade surplus occurs in nonelectrical machinery products,
which in 1969 was $4.4 billion. The trade surplus in electrical equipment and
transportation equipment was $1.1 billion and $973 million in 1969 respec-
tively. The electrical equipment surplus increased from 1965-69, but the
transportation equipment surplus swung from a high of $1.4 billion in 1968 to
a low of $973 million in 1969.
EFFECTS OF METRICATION ON U.S. FOREIGN TRADE 21
U.S. Trade Balance for Measurement-StandardSensitive Products 1969, 1967, 1965
(In Millions of Dollars)
1969 1967 1965
Total, all products 7,878.2 7,376.6 6,822.0
2,362.2
302.4
164.4
(478.3)
5,527.5
2,171.9
284.0
134.8
(129.3)
4,915.2
1,850.5
490.3
126.4
(61.5)
4,416.3
EEC
All other
IMPORTANCE OF THE MEASUREMENT SYSTEM
As part of the BDC survey, U.S. exporters and importers were asked to
rank the five most important factors currently promoting and deterring their
trade. 4 Insofar as the measurement factor—whether metric or U.S.
customary—is concerned, the survey shows that U.S. exporters and importers
consider it to have only slight effects on their trade. Invariably, the measure-
ment system used to design and manufacture products ranked near the bottom
of all factors affecting foreign trade.
The results of an earlier Department of Commerce (DOC) survey tend to
support the views of the exporters and importers in the BDC survey. The
DOC surveyed the Directors of U.S. Trade Centers in Stockholm, Milan,
London, Frankfurt, and Bangkok, and those Washington-based officers
responsible for foreign trade exhibits to seek their views on whether the U.S.
customary measurement system was a detriment to U.S. trade.
In general, the DOC survey revealed that U.S. nonuse of the metric system
in the manufacture of its products had presented no serious difficulties to U.S.
exhibitors in making sales abroad. However, there were instances where some
exhibitors lost business or were put to greater expense in concluding sales
because their products were not metric. The Directors surveyed indicated that
U.S. conversion to the metric system would improve sales of U.S. products in
various countries; however, the situation was not preclusive to most U.S.
firms.
Factors Affecting MSS Product Exports: U.S. exporters of MSS products
indicated that the top three factors promoting sales abroad are reputation and
reliability, superior technology, and high quality of products. These three fac-
tors accounted for nearly sixty percent of the total rankings by U.S. exporters.
Other factors cited by U.S. exporters as promoting foreign sales were: U.S.
prices are competitive with foreign producers, product maintenance and serv-
icing is available abroad, U.S. companies maintain vigorous export promo-
4 This was restricted to nine major markets (countries): Canada, United Kingdom. West Germany,
France, Belgium-Luxembourg, the Netherlands, Italy, Japan, and Mexico.
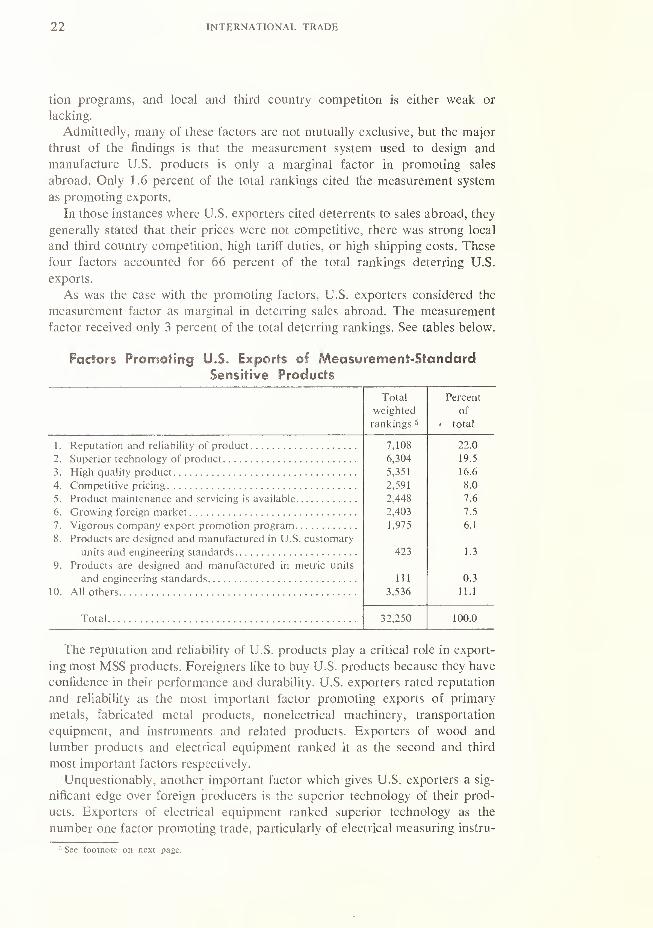
22 INTERNATIONAL TRADE
tion programs, and local and third country competiton is either weak or
lacking.
Admittedly, many of these factors are not mutually exclusive, but the major
thrust of the findings is that the measurement system used to design and
manufacture U.S. products is only a marginal factor in promoting sales
abroad. Only 1 .6 percent of the total rankings cited the measurement system
as promoting exports.
In those instances where U.S. exporters cited deterrents to sales abroad, they
generally stated that their prices were not competitive, there was strong local
and third country competition, high tariff duties, or high shipping costs. These
four factors accounted for 66 percent of the total rankings deterring U.S.
exports.
As was the case with the promoting factors, U.S. exporters considered the
measurement factor as marginal in deterring sales abroad. The measurement
factor received only 3 percent of the total deterring rankings. See tables below.
Factors Promoting U.S. Exports of Measurement-StandardSensitive Products
Total Percent
weighted of
rankings 5. total
1. Reputation and reliability of product 7,108 22.0
2 Superior technology of product 6,304 19.5
3. High quality product 5,351 16.6
4. Competitive pricing : 2,591 8.0
5. Product maintenance and servicing is available 2,448 7.6
6. 2,403 7.5
7. Vigorous company export promotion program 1,975 6.1
8. Products are designed and manufactured in U.S. customary
units and engineering standards 423 1.3
9. Products are designed and manufactured in metric units
and engineering standards 111 0.3
10. All others 3,536 11.1
Total 32,250 100.0
The reputation and reliability of U.S. products play a critical role in export-
ing most MSS products. Foreigners like to buy U.S. products because they have
confidence in their performance and durability. U.S. exporters rated reputation
and reliability as the most important factor promoting exports of primary
metals, fabricated metal products, nonelectrical machinery, transportation
equipment, and instruments and related products. Exporters of wood and
lumber products and electrical equipment ranked it as the second and third
most important factors respectively.
Unquestionably, another important factor which gives U.S. exporters a sig-
nificant edge over foreign producers is the superior technology of their prod-
ucts. Exporters of electrical equipment ranked superior technology as the
number one factor promoting trade, particularly of electrical measuring instru-
G See footnote on next page.
EFFECTS OF METRICATION ON U.S. FOREIGN TRADE 23
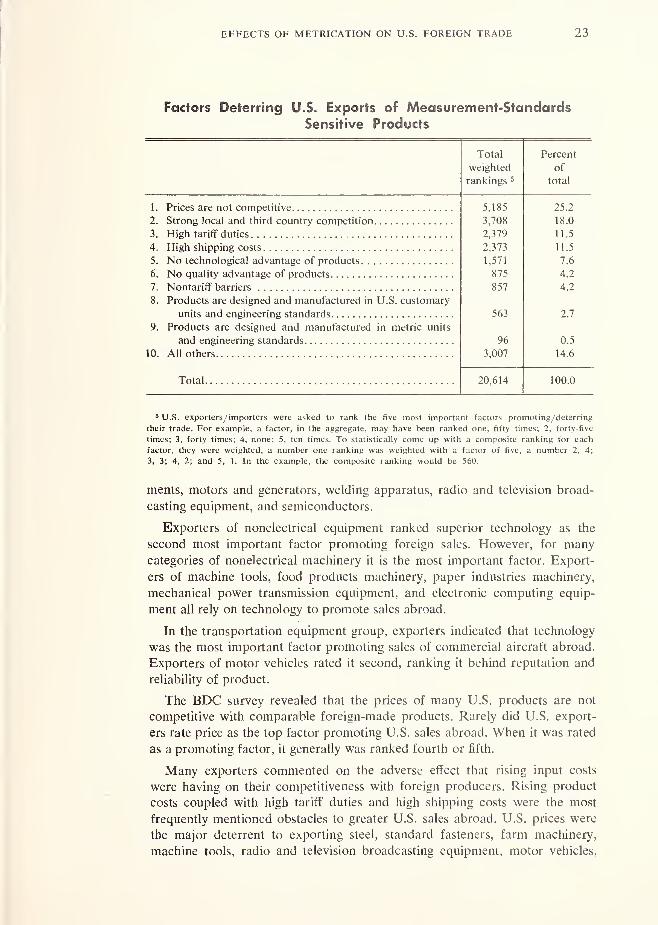
Factors Deterring U.S. Exports of Measurement-StandardsSensitive Products
rci ct^n i
U/Pl an tpH of
t*h nV in
5
total
1. Prices firp not onmnptitivp 5,185 25.2
2. Strong local and third country competition 3,708 18.0
3. High tariff duties 2,379 11.5
4. 2,373 11.5
5. 1,571 7.6
6. 875 4.2
7. 857 4.2
8. Products are designed and manufactured in U.S. customary
units and engineering standards 563 2.7
9. Products are designed and manufactured in metric units
and engineering standards 96 0.5
10. 3,007 14.6
Total 20,614 100.0
5 U.S. exporters/ importers were asked to rank the five most important factors promoting/deterring
their trade. For example, a factor, in the aggregate, may have been ranked one, fifty times; 2, forty-five
times; 3, forty times; 4, none; 5, ten times. To statistically come up with a composite ranking for each
factor, they were weighted, a number one ranking was weighted with a factor of five, a number 2, 4;
3, 3; 4, 2; and 5, 1. In the example, the composite ranking would be 560.
ments, motors and generators, welding apparatus, radio and television broad-
casting equipment, and semiconductors.
Exporters of nonelectrical equipment ranked superior technology as the
second most important factor promoting foreign sales. However, for manycategories of nonelectrical machinery it is the most important factor. Export-
ers of machine tools, food products machinery, paper industries machinery,
mechanical power transmission equipment, and electronic computing equip-
ment all rely on technology to promote sales abroad.
In the transportation equipment group, exporters indicated that technology
was the most important factor promoting sales of commercial aircraft abroad.
Exporters of motor vehicles rated it second, ranking it behind reputation and
reliability of product.
The BDC survey revealed that the prices of many U.S. products are not
competitive with comparable foreign-made products. Rarely did U.S. export-
ers rate price as the top factor promoting U.S. sales abroad. When it was rated
as a promoting factor, it generally was ranked fourth or fifth.
Many exporters commented on the adverse effect that rising input costs
were having on their competitiveness with foreign producers. Rising product
costs coupled with high tariff duties and high shipping costs were the most
frequently mentioned obstacles to greater U.S. sales abroad. U.S. prices were
the major deterrent to exporting steel, standard fasteners, farm machinery,
machine tools, radio and television broadcasting equipment, motor vehicles,
24 INTERNATIONAL TRADE
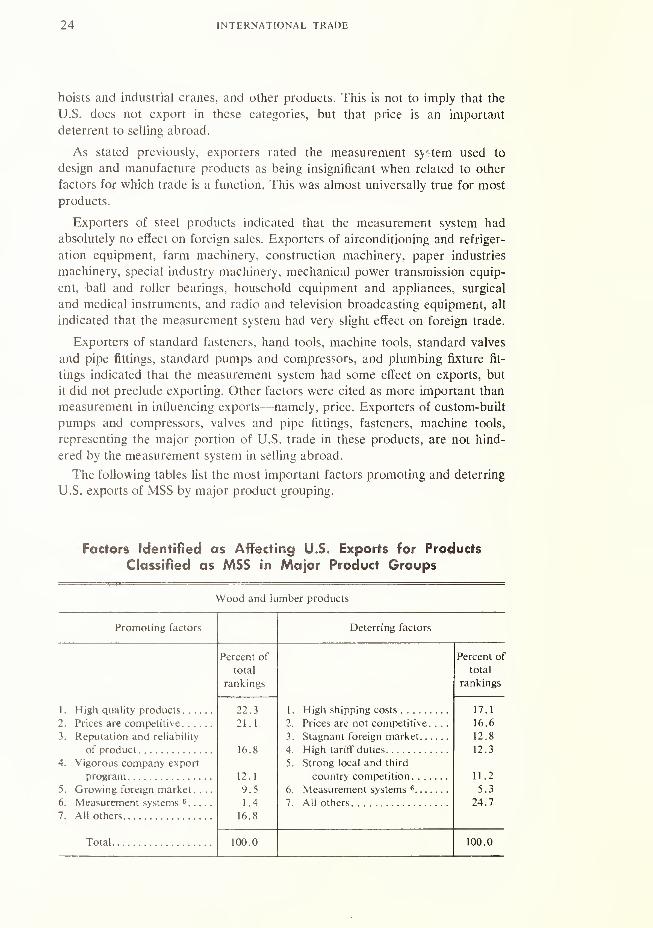
hoists and industrial cranes, and other products. This is not to imply that the
U.S. does not export in these categories, but that price is an important
deterrent to selling abroad.
As stated previously, exporters rated the measurement system used to
design and manufacture products as being insignificant when related to other
factors for which trade is a function. This was almost universally true for most
products.
Exporters of steel products indicated that the measurement system had
absolutely no effect on foreign sales. Exporters of airconditioning and refriger-
ation equipment, farm machinery, construction machinery, paper industries
machinery, special industry machinery, mechanical power transmission equip-
ent, ball and roller bearings, household equipment and appliances, surgical
and medical instruments, and radio and television broadcasting equipment, all
indicated that the measurement system had very slight effect on foreign trade.
Exporters of standard fasteners, hand tools, machine tools, standard valves
and pipe fittings, standard pumps and compressors, and plumbing fixture fit-
tings indicated that the measurement system had some effect on exports, but
it did not preclude exporting. Other factors were cited as more important than
measurement in influencing exports—namely, price. Exporters of custom-built
pumps and compressors, valves and pipe fittings, fasteners, machine tools,
representing the major portion of U.S. trade in these products, are not hind-
ered by the measurement system in selling abroad.
The following tables list the most important factors promoting and deterring
U.S. exports of MSS by major product grouping.
Factors identified as Affecting U.S. Exports for Products
Classified as MSS in Major Product Groups
Wood and lumber products
Promoting factors Deterring factors
1. High quality products
2. Prices are competitive
3. Reputation and reliability
of product
4. Vigorous company export
program
5. Growing foreign market. . .
.
6. Measurement systems 6
7. All others
Total
Percent of
total
rankings
1. High shipping costs
2. Prices are not competitive. . .
.
3. Stagnant foreign market
4. High tariff duties
5. Strong local and third
country competition
6. Measurement systems 6
7. All others
Percent of
total
rankings
22.3
21.1
16.8
12.1
9.5
1 .4
16.8
17.1
16.6
12.8
12.3
11.2
5.3
24.7
100.0 100.0

EFFECTS OF METRICATION ON U.S. FOREIGN TRADE 25
Factors Identified as Affecting U.S. Exports for Products
Classified as MSS in Major Product Groups—Continued
Primary metal products
Promoting factors Deterring factors
1. Reputation and reliability
of products
2. Higher quality products.
.
3. Prices are competitive ...
.
4. Superior technology
5. Lack of local and third
country competition. . .
.
6. Measurement systems 6. .
.
7. All others
Total
Percent
of
total
rankings
18.8 2.
14.7
14.1 3
12.5 4
5.
11.0 6.
0.3 7
28.6
100.0
Prices are not competitive . .
Strong local and third
country competition
High shipping costs
High tariff duties
No technological advantage
Measurement systems 6
All others
Fabricated metal products
Promoting factors Deterring factors
1. Reputation and reliability
2. Higher quality product
3 . Super technology of product
.
5. Growing foreign markets. . .
7. All others
Percent
of
total
rankings
1 . Prices are not competitive
2. High tariff duties
3. Strong local and third
country competition
4. High shipping costs
5. No technological advantage
7. All others
Percent
of
total
rankings
22.2
21.8
17.0
13.5
7.8
2.5
15.2
25.3
17.3
14.8
11.1
7.2
5.1
19.2
Total 100.0 100.0
26 INTERNATIONAL TRADE
Factors Identified as Affecting U.S. Exports for Products
Classified as MSS in Major Product Groups—Continued
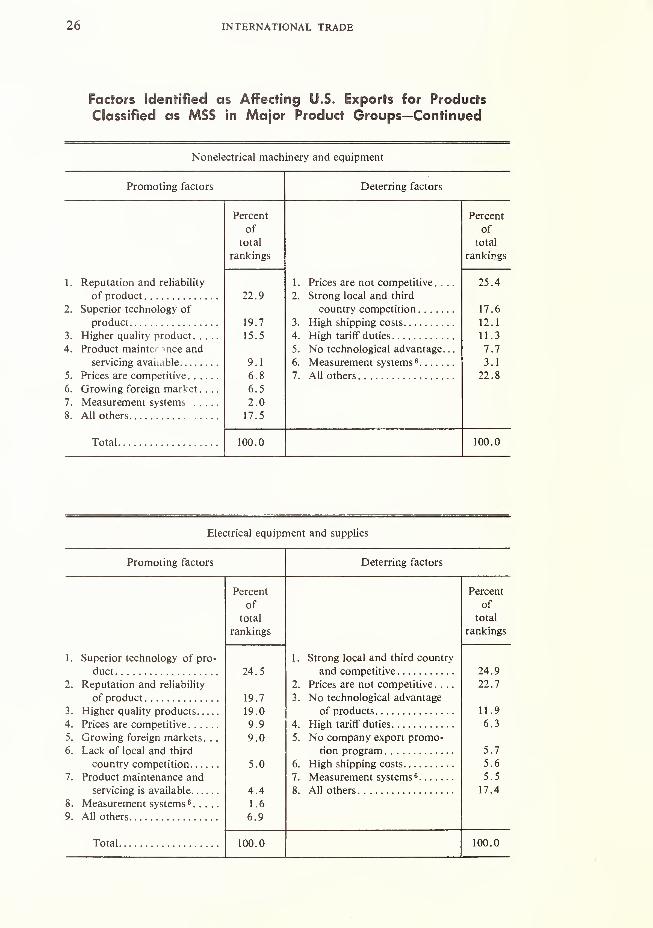
Nonelectrical machinery and equipment
Promoting factors Deterring factors
1. Reputation and reliability
of product
2. Superior technology of
product
3. Higher quality product. . .
4. Product mainter nee and
servicing available
5. Prices are competitive. ..
.
6. Growing foreign market. ,
7. Measurement systems . . .
8. All others
Total
Percent
of
total
rankings
1
22 9 2
19 7 3
15 5 4
5
9 1 6
6 8 7
6 5
2 0
17 5
Prices are not competitive . .
Strong local and third
country competition
High shipping costs
High tariff duties
No technological advantage.
Measurement systems 6
All others
100.0
Electrical equipment and supplies
Promoting factors Deterring factors
9.
Superior technology of pro-
duct
Reputation and reliability
of product
Higher quality products
Prices are competitive
Growing foreign markets. .
Lack of local and third
country competition
Product maintenance and
servicing is available
Measurement systems 6. . . .
All others
Total
Percent
of
total
rankings
24.5
19.7
19.0
9.9
9.0
5.0
4.4
1.6
6.9
1 . Strong local and third country
and competitive
2. Prices are not competitive. . .
.
3. No technological advantage
of products
4. High tariff duties
5. No company export promo-
tion program
6. High shipping costs
7. Measurement systems 6
8. All others
100.0
EFFECTS OF METRICATION ON U.S. FOREIGN TRADE 27
Factors Identified as Affecting U.S. Exports for Products
Classified as MSS in Major Product Groups—Continued
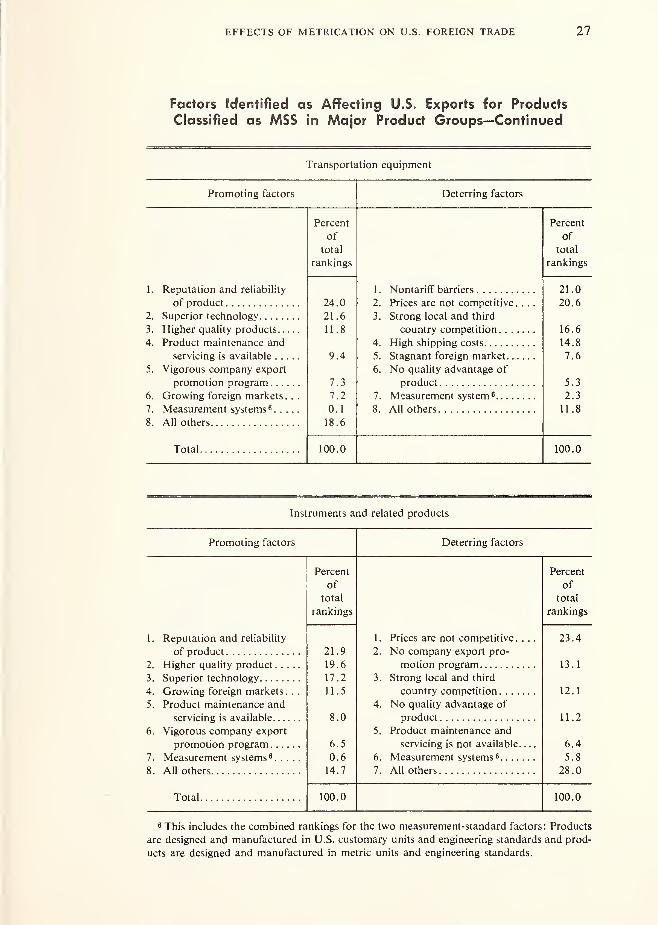
Transportation equipment
Promoting factors Deterring factors
1. Reputation and reliability
of product
2. Superior technology
3. Higher quality products
4. Product maintenance and
servicing is available
5. Vigorous company export
promotion program
6. Growing foreign markets .. .
7. Measurement systems 6
8. All others
Total
Percent
of
total
rankings
1 . Nontariff barriers
2. Prices are not competitive ....
3. Strong local and third
4. High shipping costs
5. Stagnant foreign market
6. No quality advantage of
product
7. Measurement system 6
8. All others
Percent
of
total
rankings
24.0
21.6
11.8
9.4
7.3
7.2
0.1
18.6
21.0
20.6
16.6
14.8
7.6
5.3
2.3
11.8
100.0 100.0
Instruments and related products
Promoting factors Deterring factors
1. Reputation and reliability
of product
2. Higher quality product
3. Superior technology
4. Growing foreign markets. . .
5. Product maintenance and
servicing is available
6. Vigorous company export
promotion program
7. Measurement systems 6
8. All others
Percent
of
total
rankings
1 . Prices are not competitive ....
2. No company export pro-
motion program
3. Strong local and third
country competition
4. No quality advantage of
5. Product maintenance and
servicing is not available
6. Measurement systems 6
7. All others
Percent
of
total
rankings
21.9
19.6
17.2
11.5
8.0
6.5
0.6
14.7
23.4
13.1
12.1
11.2
6.4
5.8
28.0
Total 100.0 100.0
6 This includes the combined rankings for the two measurement-standard factors: Products
are designed and manufactured in U.S. customary units and engineering standards and prod-
ucts are designed and manufactured in metric units and engineering standards.
28 INTERNATIONAL TRADE
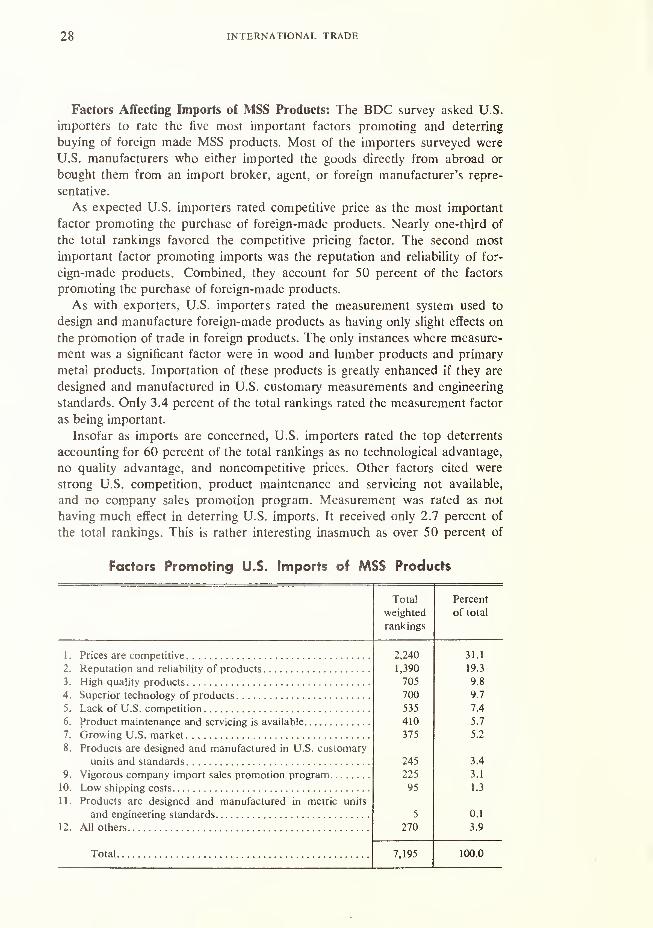
Factors Affecting Imports of MSS Products: The BDC survey asked U.S.
importers to rate the five most important factors promoting and deterring
buying of foreign made MSS products. Most of the importers surveyed were
U.S. manufacturers who either imported the goods directly from abroad or
bought them from an import broker, agent, or foreign manufacturer's repre-
sentative.
As expected U.S. importers rated competitive price as the most important
factor promoting the purchase of foreign-made products. Nearly one-third of
the total rankings favored the competitive pricing factor. The second most
important factor promoting imports was the reputation and reliability of for-
eign-made products. Combined, they account for 50 percent of the factors
promoting the purchase of foreign-made products.
As with exporters, U.S. importers rated the measurement system used to
design and manufacture foreign-made products as having only slight effects on
the promotion of trade in foreign products. The only instances where measure-
ment was a significant factor were in wood and lumber products and primary
metal products. Importation of these products is greatly enhanced if they are
designed and manufactured in U.S. customary measurements and engineering
standards. Only 3.4 percent of the total rankings rated the measurement factor
as being important.
Insofar as imports are concerned, U.S. importers rated the top deterrents
accounting for 60 percent of the total rankings as no technological advantage,
no quality advantage, and noncompetitive prices. Other factors cited were
strong U.S. competition, product maintenance and servicing not available,
and no company sales promotion program. Measurement was rated as not
having much effect in deterring U.S. imports. It received only 2.7 percent of
the total rankings. This is rather interesting inasmuch as over 50 percent of
Factors Promoting U.S. Imports of MSS Products
Total Percent
weighted of total
rankings
1. 2,240 31.1
2. Reputation and reliability of products 1,390 19.3
3. 705 9.8
4. 700 9.7
5. 535 7.4
6. Product maintenance and servicing is available 410 5.7
7. 375 5.2
8 Products are designed and manufactured in U.S. customary
245 3.4
9. Vigorous company import sales promotion program 225 3.1
10. Low shipping costs 95 1.3
11. Products are designed and manufactured in metric units
and engineering standards 5 0.1
12. 270 3.9
Total 7,195 100.0

EFFECTS OF METRICATION ON U.S. FOREIGN TRADE 29
the total imports of MSS products in the survey were products designed and
manufactured in metric units and engineering standards.
Factors Deterring U.S. Imports of MSS Products
Total Percent
weighted of
rankings total
1. 2,490 22.7
2. 2,217 20.2
5.1 n a ii,y47 no
I /.5
4. Strong U S competition 930 8.5
<j. OJ I 7 fi
6. 741 6.8
7. High shipping costs 387 3.5
8. Products are designed and manufactured in metric units and
engineering standards 294 2.7
9. High U.S. tariff duties 177 1.6
10. Stagnant U.S. market 21 0.2
11. Products are designed and manufactured in U.S. customary
15 0.1
12. All others 906 8.3
Total 10,962 100.0
Unquestionably, competitive pricing was ranked by U.S. importers as the
top factor promoting the importation of every major category of measure-
ment-standard sensitive products. For MSS products classified as primary
metals, nearly 40 percent of the total rankings by U.S. importers favored the
factor of competitive pricing. Similarly, competitive pricing received over
one-third of the ranking of U.S. importers for fabricated metal products,
electrical equipment, and transportation equipment. Data for instruments and
related products are sparse and are not reported to avoid possible disclosures.
Reputation and reliability was rated the second most important factor
promoting MSS imports classified as wood and lumber, primary metals, non-
electrical machinery, electrical equipment, and transportation equipment.
Rarely did U.S. importers rate the measurement factor as important in
promoting exports except for wood and lumber products and primary metal
products. For wood and lumber products, U.S. importers ranked measurement
as the fourth among promoting factors. In fact, this is the only instance where
the measurement factor accounted for anything like 15 percent of the total
rankings.
Similarly, the importation of primary metal products is also greatly en-
hanced if they are designed and manufactured in U.S. customary units and
engineering standards. Importers ranked this factor as the fifth most important,
receiving 7 percent of the total rankings.
The only other product category where the measurement system was identi-
fied as promoting U.S. imports was electrical equipment. However, it was
rated quite low in relation to all other promoting factors.

30 INTERNATIONAL TRADE
More interesting than rankings of promoting factors was the ranking of
deterring factors by U.S. importers. There was much less agreement amongU.S. importers on what factors deterred the importation of foreign-made
products. For example, U.S. importers of fabricated steel products and trans-
portation equipment rated "strong U.S. competition" as the leading deterring
factor. Importers of primary metals rated "no company import sales pro-
gram" as the chief deterring factor. Nonelectrical machinery importers indi-
cated that the lack of technological advantage over domestic machinery was
the number one hindrance to importing foreign-made machinery. Importers of
wood and lumber products and electrical equipment said that their prices were
not competitive. This factor deterred them from importing. This appears to be
inconsistent with the earlier statement that importers in these same product
categories had ranked "competitive pricing" as the leading promoting factor;
however, U.S. importers in most instances are referring to different products
in the same product groupings. Certain MSS products imported in these
product categories are competitively priced, but other MSS products included
in the survey which are not imported in large volume, are hindered by price.
Importers of fabricated metal products, nonelectrical machinery, and trans-
portation equipment indicated the measurement factor had slight effect on
trade. Because these groups of foreign-made products are generally designed
and manufactured in metric units and engineering standards, they are slightly
more difficult to sell in the domestic market. Of the total deterring rankings by
Factors Affecting the Importation of MSS Products
Wood and lumber products
Promoting Deterring
1.
2.
3.
4.
Prices are competitive
Reputation and reliability of
product
Lack of U.S. competition. .
.
Products are designed and
manufactured in U.S.
customary units and en-
gineering standards
Higher quality product
Growing U.S. market
Company import sales
promotion program
All others.
Total
Percent
of
total
rankings
25.0
16.7
16.7
14.9
8.3
6.7
5.0
6.7
Percent
of
total
rankings
1. Prices are not competitive. .
2. No quality advantage of
product
3. High shipping costs
4. No technological advantage
of product
5. Strong U.S. competition . .
.
6. Measurement systems
7. All others
33.3
24.2
20.8
11.7
2.5
7.5
100.0 100.0

EFFECTS OF METRICATION ON U.S. FOREIGN TRADE 31
Factors Affecting the Importation of MSS Products—Continued
Primary metal products
Promoting Deterring
1 . Prices are competitive
2. Reputation and reliability
of product
3. Company import sales
promotion program
4. Lack of U.S. competition. . .
.
5. Products are designed and
manufactured in U.S.
customary units and
engineering standards
7. Higher quality product
8. Superior technology
9. All others
Total
Percent
of
total
rankings
1 . No company import sales
promotion
2. No technological advantage
r\f nrnHurt
3. Prices are not competitive. . . .
4. No quality advantage of
product
5. Strong U.S. competition
6. Measurement systems
7. All others
Percent
of
total
rankings
39.6
24.1
11.4
8.8
7.0
2.6
2.6
2.6
1.3
24.6
23 .6
19.6
17.3
5.3
9.6
100.0 100.0
Fabricated metal products
Promoting Deterring
1 . Prices are competitive
2. Higher quality products
3. Reputation and reliability of
4. Lack of U.S. competition. . .
.
5. Superior technology
Total
Percent
of
total
rankings
1. Strong U.S. competition
2. No quality advantage of
product
3. No technological advantage
4. Prices are not competitive. . .
.
5. High shipping costs
6. Product maintenance and
servicing not available
7. No company sales import
promotion program
8. Products are designed and
manufactured in metric
units and engineering
standards
9. All others
Percent
of
total
rankings
33.3
26.7
20.0
13.3
6.7
16.4
16.1
14.1
14.1
7.3
6.7
4.8
3.4
7.6
100.0 100.0
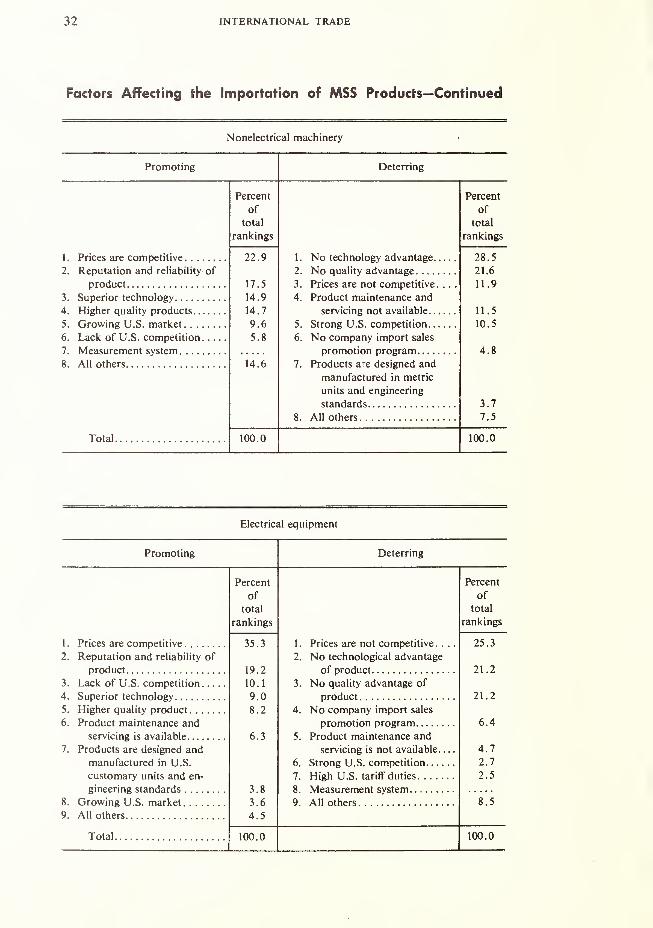
32 INTERNATIONAL TRADE
Factors Affecting the Importation of MSS Products—Continued
Nonelectrical machinery
Promoting Deterring
1. Prices are competitive
1 Rpniitation anrl reliahilitv* of
3. Superior technology
4. Higher quality products
5. Growing U.S. market
6. Lack of U.S. competition
8. All others
Total
Percent
of
total
rankings
1. No technology advantage
2 NIn duality aHvantat?p
3. Prices are not competitive ...
.
4. Product maintenance and
servicing not available
5. Strong U.S. competition
6. No company import sales
7. Products are designed and
manufactured in metric
units and engineering
standards
8. All others
Percent
of
total
rankings
22.9
17.5
14.9
14.7
9.6
5.8
14.6
28.5
21.6
11.9
11.5
10.5
4.8
3.7
7.5
100.0 100.0
Electrical equipment
Promoting Deterring
Percent Percent
of of
total total
rankings rankings
1. Prices are competitive 35.3 1. Prices are not competitive. . .
.
25.3
2. Reputation and reliability of 2. No technological advantage
19.2 21.2
3. Lack of U.S. competition 10.1 3. No quality advantage of
4. 9.0 21.2
5. Higher quality product 8.2 4. No company import sales
6. Product maintenance and promotion program 6.4
servicing is available 6.3 5. Product maintenance and
7. Products are designed and servicing is not available 4.7
manufactured in U.S. 6. Strong U.S. competition 2.7
customary units and en- 7. High U.S. tariff duties 2.5
gineering standards 3.8 8.
8. Growing U.S. market 3.6 9. 8.5
9. 4.5
Total 100.0 100.0

EFFECTS OF METRICATION ON U.S. FOREIGN TRADE 33
Factors Affecting the Importation of MSS Products—Continued
Transportation equipment
Promoting Deterring
1 . Prices are competitive
2. Reputation and reliability of
Percent
of
total
rankings
2. No technological advantage
of product
Percent
of
total
rankings
34.1
19.2
17.8
9.0
6.3
6.3
7.3
JJ.A
T 1 QL\ .y
10.5
9.9
8.9
3.7
9.9
3. Product maintenance and
servicing is available
4. Higher quality product
6. Growing U.S. market
8. All others
Total
3. No quality advantage of
product
4. High U.S. tariffs
5. High shipping costs
6. Products are designed and
manufactured in metric
units and engineering
standards
7. All others
100.0 100.0
importers of fabricated metal products, 3.4 percent were for the measurement
factor; for electrical machinery, 3.7 percent; and transportation equipment,
3.7 percent.
ESTIMATED EFFECTS OF U.S. METRICATION ONFOREIGN TRADE
Impact on Exports: Available data indicate that U.S. exports in all proba-
bility would improve moderately by conversion to the metric system. How-ever, contrary to speculation, the potential increase in U.S. exports resulting
from metrication would not approach $10-25 billion. Such speculation clearly
underestimates ability of U.S. exporters to sell in foreign markets. Clearly, if
there was a potential $10-25 billion market abroad for U.S. exporters, they
would have made the necessary conversion to metric long before now.
As part of the BDC survey, U.S. exporters were asked to estimate the
percentage change in their 1975 export trade over their 1970 trade, assuming,
among other things (a) the U.S. maintained its current measurement system,
and (b) the U.S. converted to the metric system in 1970. The rationale for
asking exporters to make these two estimates was to hold constant all varia-
bles on which foreign trade is dependent except the measurement system, and
to ascertain the effect, if any, metrication would have on exports. Put
differently, the effects of metrication would be the net difference between the
respondents' two estimates.
Out of the 395 respondents, 55 percent stated there would be "no change"
in their 1975 exports over the 1970 trade levels assuming the U.S. maintained
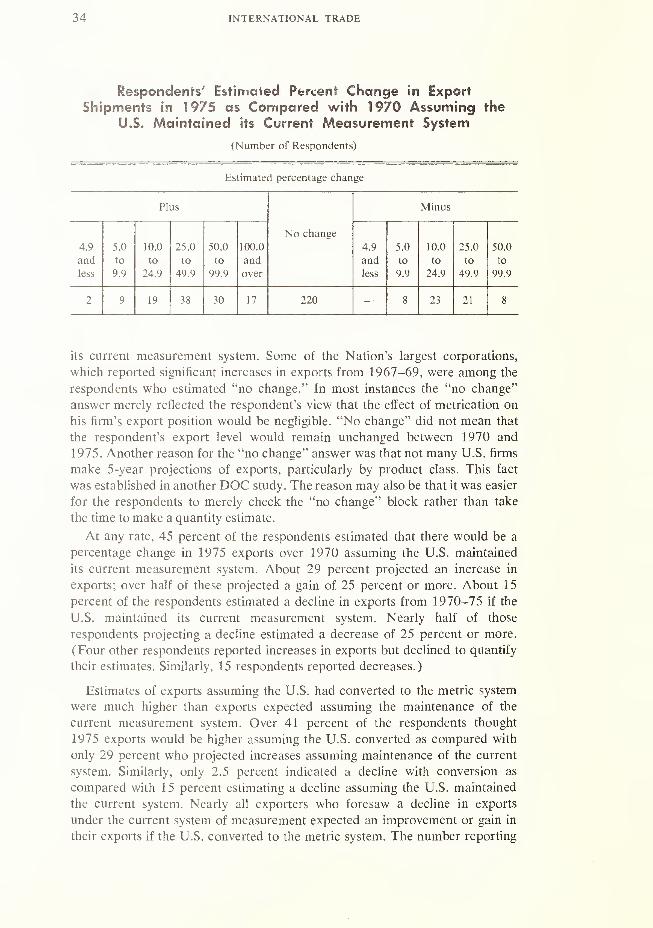
34 INTERNATIONAL TRADE
':- nts Estimated Percent Change in Export
Shipments in 1975 as Compared with 1970 Assuming the
U.S. Maintained its Current Measurement System
(Number of Respondents)
Estimated percentage change
Plus Minus
No change
4.9 5.0 10.0 25.0 50.0 100.0 4.9 5.0 10.0 25.0 50.0
and to to to to and and to to to "o
less 9.9 24.9 49.9 99.9 over less 9.9 24.9 49.9 99.9
2 9 19 38 30 17 220 8 23 21 8
its current measurement system. Some of the Nation's largest corporations,
which reported significant increases in exports from 1967-69, were among the
respondents who estimated "no change." In most instances the "no change"
answer merely reflected the respondent's view that the effect of metrication on
his firm's export position would be negligible. "No change" did not mean that
the respondent's export level would remain unchanged between 1970 and
1975. Another reason for the "no change" answer was that not many U.S. firms
make 5-year projections of exports, particularly by product class. This fact
was established in another DOC study. The reason may also be that it was easier
for the respondents to merely check the "no change" block rather than take
the time to make a quantity estimate.
At any rate, 45 percent of the respondents estimated that there would be a
percentage change in 1975 exports over 1970 assuming the U.S. maintained
its current measurement system. About 29 percent projected an increase in
exports; over half of these projected a gain of 25 percent or more. About 15
percent of the respondents estimated a decline in exports from 1970-75 if the
U.S. maintained its current measurement system. Nearly half of those
respondents projecting a decline estimated a decrease of 25 percent or more.
(Four other respondents reported increases in exports but declined to quantify
their estimates. Similarly, 15 respondents reported decreases.)
Estimates of exports assuming the U.S. had converted to the metric system
were much higher than exports expected assuming the maintenance of the
current measurement system. Over 41 percent of the respondents thought
1975 exports would be higher assuming the U.S. converted as compared with
only 29 percent who projected increases assuming maintenance of the current
system. Similarly, only 2.5 percent indicated a decline with conversion as
compared with 15 percent estimating a decline assuming the U.S. maintained
the current system. Nearly all exporters who foresaw a decline in exports
under the current system of measurement expected an improvement or gain in
their exports if the U.S. converted to the metric system. The number reporting

EFFECTS OF METRICATION ON U.S. FOREIGN TRADE 35
Respondents' Estimated Percent Change in Export
Shipments in 1975 as Compared with 1970 Assuming the
U.S. Converted to the Metric System in 1970
(Number of Respondents)
Estimated percentage change
Plus Minus
4.9 5.0 10.0 25.0 50.0 100.0 No change 4.9 5.0 10.0 25.0 50.0
and to to to to and and to to to to
less 9.9 24.9 49.9 99.9 over less 9.9 24.9 49.9 99.9
3 25 43 34 36 18 218 3 4 1 1
"no change" in 1975 exports remained almost the same under both assump-
tions.
Unweighted, the foregoing estimates suggest there would be an improve-
ment in U.S. exports if the U.S. converted to the metric system, but the ques-
tion is "how much?" The foregoing analysis gives the same weight to a small
exporter as it does to a large exporter. Consequently, it was necessary to relate
the respondents' estimates to their trade to determine whether there would be
a net increase or decrease in their exports if the U.S. maintained its current
measurement system or converted to metric.
On a weighted basis, U.S. exporters estimated their 1975 exports would be
larger if the U.S. converted to the metric system in 1970 than if it maintained
its current system. Taking respondents' estimates for both assumptions and
relating them to 1969 export trade volume indicates that 1975 exports of
respondents would be 2.7 percent larger if the U.S. converted to the metric
system. By MSS product grouping, the percentage varies significantly. Export-
ers in 29 MSS product groupings indicated 1975 trade would be larger if the
U.S. had converted to the metric system, and those in 8 MSS product group-
ings indicated no change in trade levels. Only two product groupings showed
higher exports if the U.S. maintained its current system. Data were also
compiled for 19 other product groupings, which indicates there would be an
improvement in U.S. trade if the U.S. converted; however, they are not
reported because they are sparse and would involve disclosures.
A rough calculation using a straight-line projection yields an estimate of
$20.6 billion of U.S. exports of MSS products in 1975, if the U.S. maintained
its current measurement system. Applying the exporters' 2.7 percent estimate
to the projected 1975 level if the U.S. maintained its current measurement
system, it is estimated that U.S. exports would be about $21.2 billion if the
U.S. converted. The difference between the two estimates is $600 million.
Whether the 2.7 percent estimate will increase over time cannot be demon-
strated with the available data. However, the probabilities are that it will
increase if the rest of the English-speaking world converts to the metric
system.
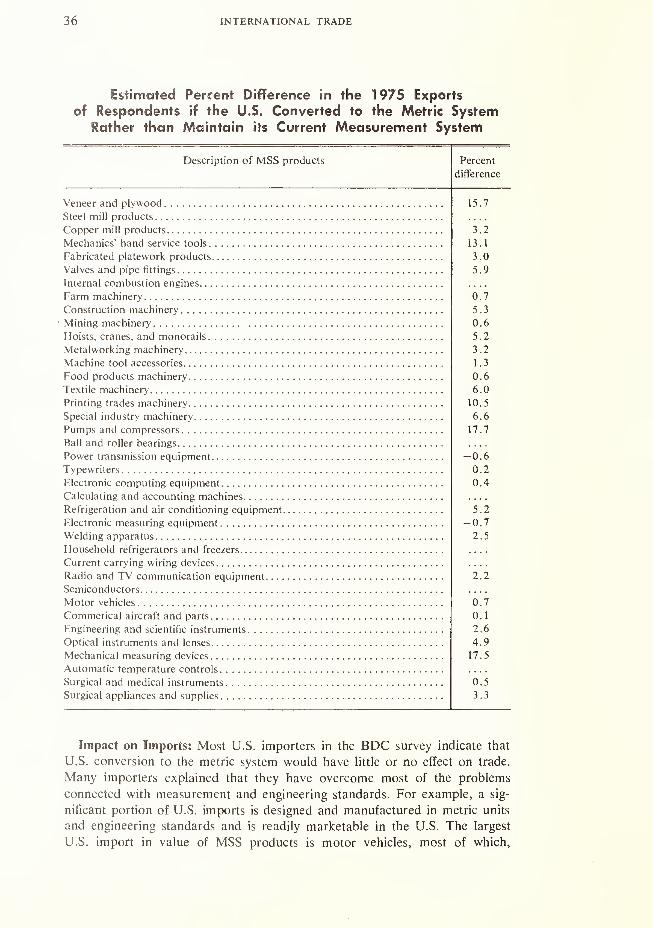
36 INTERNATIONAL TRADE
Estimated Percent Difference in the 1975 Exports
of Respondents if the U.S. Converted to the Metric SystemRather than Maintain iJs Current Measurement System
Description of MSS products Percent
difference
Veneer and plywood
Steel mill products
Copper mill products
Mechanics' hand service tools
Fabricated platework products
Valves and pipe fittings
Internal combustion engines
Farm machinery
Construction machinery
Mining machinery
Hoists, cranes, and monorails
Metalworking machinery
Machine tool accessories
Food products machinery
Textile machinery
Printing trades machinery
Special industry machinery
Pumps and compressors
Ball and roller bearings
Power transmission equipment
Typewriters
Electronic computing equipment
Calculating and accounting machines
Refrigeration and air conditioning equipment.
Electronic measuring equipment
Welding apparatus
Household refrigerators and freezers
Current carrying wiring devices
Radio and TV communication equipment. . . .
Semiconductors
Motor vehicles
Commerical aircraft and parts
Engineering and scientific instruments
Optical instruments and lenses
Mechanical measuring devices
Automatic temperature controls
Surgical and medical instruments
Surgical appliances and supplies
15.7
3.2
13.1
3.0
5.9
0.7
5.3
0.6
5.2
3.2
1.3
0.6
6.0
10.5
6.6
17.7
-0.6
0.2
0.4
5.2
-0.7
2.5
2.2
0.7
0.1
2.6
0.5
3.3
Impact on Imports: Most U.S. importers in the BDC survey indicate that
U.S. conversion to the metric system would have little or no effect on trade.
Many importers explained that they have overcome most of the problems
connected with measurement and engineering standards. For example, a sig-
nificant portion of U.S. imports is designed and manufactured in metric units
and engineering standards and is readily marketable in the U.S. The largest
U.S. import in value of MSS products is motor vehicles, most of which,
EFFECTS OF METRICATION ON U.S. FOREIGN TRADE 37
excluding those coming from U.S. affiliates in Canada, are designed and
manufactured in metric units and engineering standards. The chief reason
these imports are marketable are price, their reputation and reliability, and the
extensive maintenance and servicing system foreign manufacturers have estab-
lished in the U.S. It can be argued that U.S. imports of motor vehicles would
rise if the U.S. converted because there would be more maintenance outlets
available to owners of foreign-made vehicles of metric design. However,
knowledgeable sources indicate that this is doubtful because the number of
auto repair shops providing service to metric design motor vehicles is increas-
ing each year. Morever, U.S. manufacturers are increasing the use of metric
parts on their motor vehicles so eventually most auto repair shops will be
providing service to both metric and U.S. customary designed and engineered
motor vehicles.
Similarly, U.S. imports of textile, printing, and paper machinery are exam-
ples of products which are generally designed and manufactured in metric
units and engineering standards but are marketable in the U.S. To overcome
many of the measurement and standard problems connected with these types
of machinery, foreign manufacturers supply metric tools to their customers
and have established inventories of spare parts and components in the U.S. to
readily service their machinery. This may be an added cost to foreign manu-
facturers, but in most instances they are generally able to absorb the cost and
price their machinery below comparable U.S.-made machinery.
Another large segment of imports which would not likely be affected by
U.S. conversion to the metric system is veneer and plywood products. Foreign
manufacturers have a substantial portion of the U.S. market for these products
because their products are generally designed to U.S. customary measurement
units and standards. If the U.S. converted to the metric system, foreign
producers would in all probability ship their products in metric, and the result
would have little effect on imports.
Another large segment of imports which would not likely be affected by
by U.S. conversion is the importation of equipment and parts such as sewing
machines, typewriters and semiconductors from foreign affiliates of U.S.
parent companies.
Importer respondents to the BDC survey indicated that there would be little
or no percent change in imports in 1975 over 1970 if the U.S. converted to
the metric system or maintained its current system.
A total of 124 respondents made estimates of 1975 imports assuming the
U.S. maintained its current measurement system. As was the case with export-
ers, a very high percentage (67 percent) stated that there would be "no
change" in their 1975 imports over 1970 trade levels. Twenty percent esti-
mated an increase in imports, and 13 percent a decline.
When asked to estimate the percent change in their 1975 imports over 1970
assuming the U.S. had converted to the metric system, the same respondents
made estimates similar to those made assuming the U.S. maintained its current
measurement system. There was no discernible change in these estimates to
indicate that U.S. imports would be affected in any important way. The
percent of respondents reporting "no change" was 69 percent, up slightly from
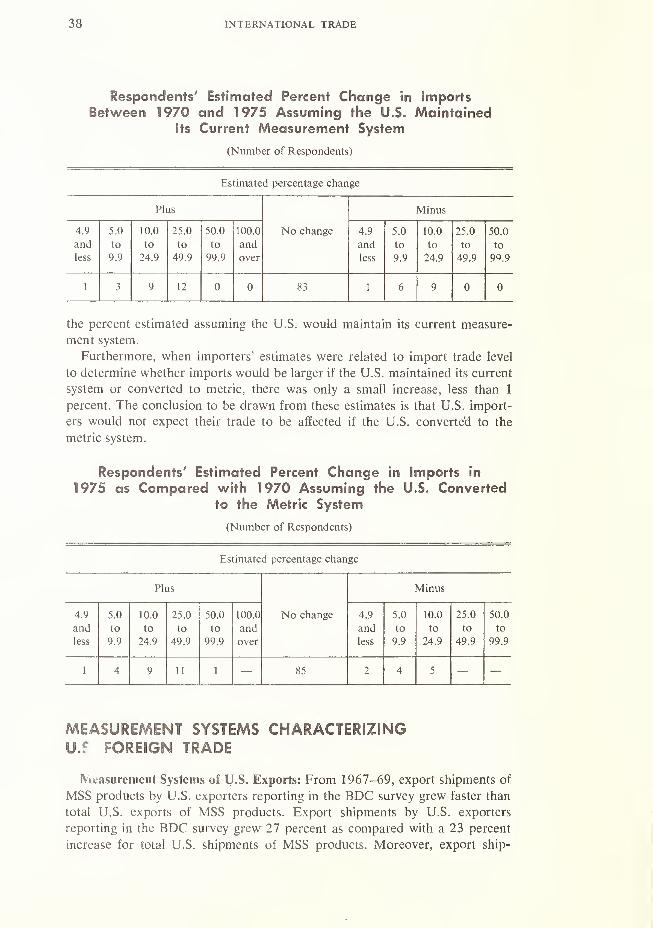
38 INTERNATIONAL TRADE
Respondents' Estimated Percent Change in imports
Between 1970 and 1975 Assuming the U.S. MaintainedIts Current Measurement System
(Number of Respondents)
Estimated percentage change
Plus Minus
4.9 5.0 10.0 25.0 50.0 100.0 No change 4.9 5.0 10.0 25.0 50.0
and to to to to and and to to to to
less 9.9 24.9 49.9 99.9 over less 9.9 24.9 49.9 99.9
1 3 9 12 0 0 83 1 6 9 0 0
the percent estimated assuming the U.S. would maintain its current measure-
ment system.
Furthermore, when importers' estimates were related to import trade level
to determine whether imports would be larger if the U.S. maintained its current
system or converted to metric, there was only a small increase, less than 1
percent. The conclusion to be drawn from these estimates is that U.S. import-
ers would not expect their trade to be affected if the U.S. converted to the
metric system.
Respondents' Estimated Percent Change in Imports in
1975 as Compared with 1970 Assuming the U.S. Convertedto the Metric System
(Number of Respondents)
Estimated percentage change
Plus Minus
4.9 5.0 10.0 25.0 50.0 100.0 No change 4.9 5.0 10.0 25.0 50.0
and to to to to and and to to to to
less 9.9 24.9 49.9 99.9 over less 9.9 24.9 49.9 99.9
1 4 9 11 1 85 2 4 5
m*fi<JMu*m41 SYSTEMS CHARACTERIZINGU.f FOREIGN TRADE
Measurement Systems of U.S. Exports: From 1967-69, export shipments of
MSS products by U.S. exporters reporting in the BDC survey grew faster than
total U.S. exports of MSS products. Export shipments by U.S. exporters
reporting in the BDC survey grew 27 percent as compared with a 23 percent
increase for total U.S. shipments of MSS products. Moreover, export ship-
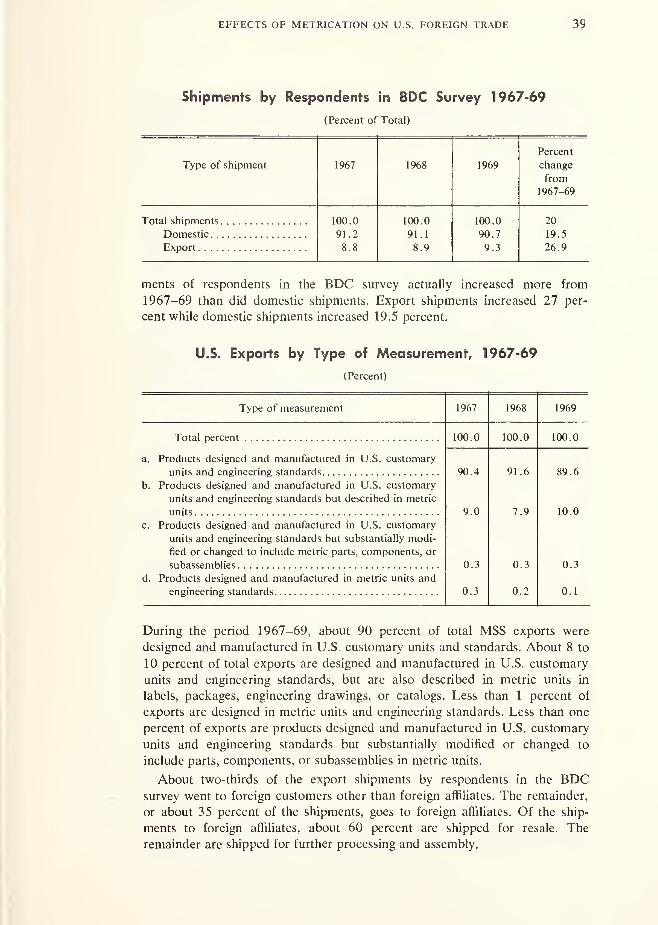
EFFECTS OF METRICATION ON U.S. FOREIGN TRADE 39
Shipments by Respondents in BDC Survey 1967-69
(Percent of Total)
Type of shipment 1967 1968 1969
Percent
change
from
1967-69
Total shipments 100.0 100.0 100.0 20
Domestic 91 .2 91.1 90.7 19.5
Export 8.8 8.9 9.3 26.9
ments of respondents in the BDC survey actually increased more from
1967-69 than did domestic shipments. Export shipments increased 27 per-
cent while domestic shipments increased 19.5 percent.
U.S. Exports by Type of Measurement, 1967-69
(Percent)
Type of measurement 1967 1968 1969
Total percent 100.0 100.0 100.0
a. Products designed and manufactured in U.S. customary
units and engineering standards 90.4 91 .6 89.6
b. Products designed and manufactured in U.S. customary
units and engineering standards but described in metric
units 9.0 7.9 10.0
c. Products designed and manufactured in U.S. customary
units and engineering standards but substantially modi-
fied or changed to include metric parts, components, or
subassemblies 0.3 0.3 0.3
d. Products designed and manufactured in metric units and
engineering standards 0.3 0.2 0.1
During the period 1967-69, about 90 percent of total MSS exports were
designed and manufactured in U.S. customary units and standards. About 8 to
10 percent of total exports are designed and manufactured in U.S. customary
units and engineering standards, but are also described in metric units in
labels, packages, engineering drawings, or catalogs. Less than 1 percent of
exports are designed in metric units and engineering standards. Less than one
percent of exports are products designed and manufactured in U.S. customary
units and engineering standards but substantially modified or changed to
include parts, components, or subassemblies in metric units.
About two-thirds of the export shipments by respondents in the BDCsurvey went to foreign customers other than foreign affiliates. The remainder,
or about 35 percent of the shipments, goes to foreign affiliates. Of the ship-
ments to foreign affiliates, about 60 percent are shipped for resale. The
remainder are shipped for further processing and assembly.
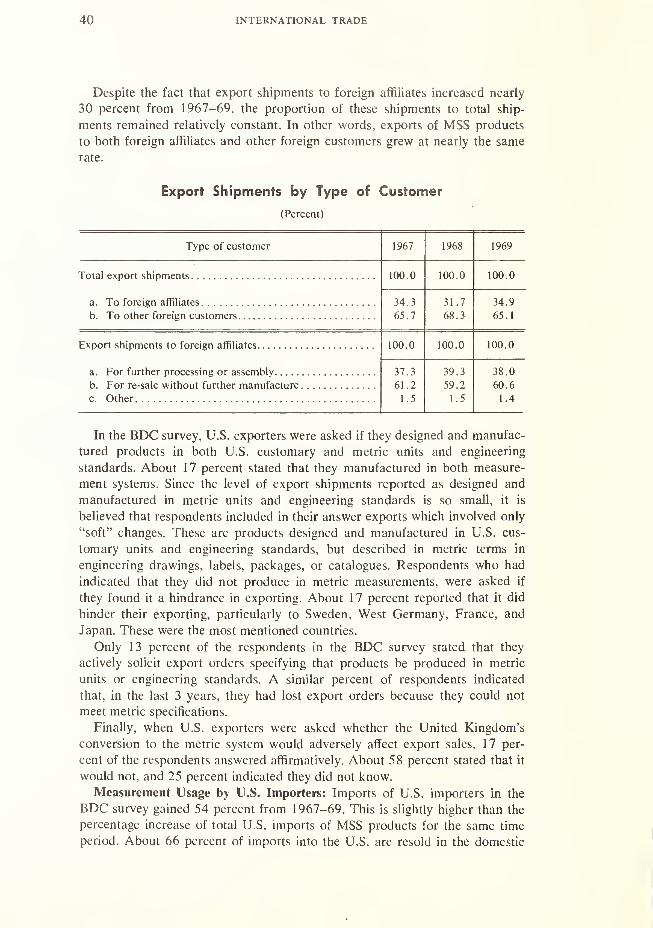
40 INTERNATIONAL TRADE
Despite the fact that export shipments to foreign affiliates increased nearly
30 percent from 1967-69, the proportion of these shipments to total ship-
ments remained relatively constant. In other words, exports of MSS products
to both foreign affiliates and other foreign customers grew at nearly the same
rate.
Export Shipments by Type of Customer
(Percent)
Type of customer 1967 1968 1969
100.0 100.0 100.0
a. To foreign affiliates 34.3 31.7 34.9
b. To other foreign customers 65.7 68.3 65.1
Export shipments to foreign affiliates 100.0 100.0 100.0
a. For further processing or assembly 37.3 39.3 38.0
b. For re-sale without further manufacture 61.2 59.2 60.6
c. Other 1.5 1.5 1.4
In the BDC survey, U.S. exporters were asked if they designed and manufac-
tured products in both U.S. customary and metric units and engineering
standards. About 17 percent stated that they manufactured in both measure-
ment systems. Since the level of export shipments reported as designed and
manufactured in metric units and engineering standards is so small, it is
believed that respondents included in their answer exports which involved only
"soft" changes. These are products designed and manufactured in U.S. cus-
tomary units and engineering standards, but described in metric terms in
engineering drawings, labels, packages, or catalogues. Respondents who had
indicated that they did not produce in metric measurements, were asked if
they found it a hindrance in exporting. About 17 percent reported that it did
hinder their exporting, particularly to Sweden, West Germany, France, and
Japan. These were the most mentioned countries.
Only 13 percent of the respondents in the BDC survey stated that they
actively solicit export orders specifying that products be produced in metric
units or engineering standards. A similar percent of respondents indicated
that, in the last 3 years, they had lost export orders because they could not
meet metric specifications.
Finally, when U.S. exporters were asked whether the United Kingdom's
conversion to the metric system would adversely affect export sales, 17 per-
cent of the respondents answered affirmatively. About 58 percent stated that it
would not, and 25 percent indicated they did not know.
Measurement Usage by U.S. Importers: Imports of U.S. importers in the
BDC survey gained 54 percent from 1967-69. This is slightly higher than the
percentage increase of total U.S. imports of MSS products for the same time
period. About 66 percent of imports into the U.S. are resold in the domestic
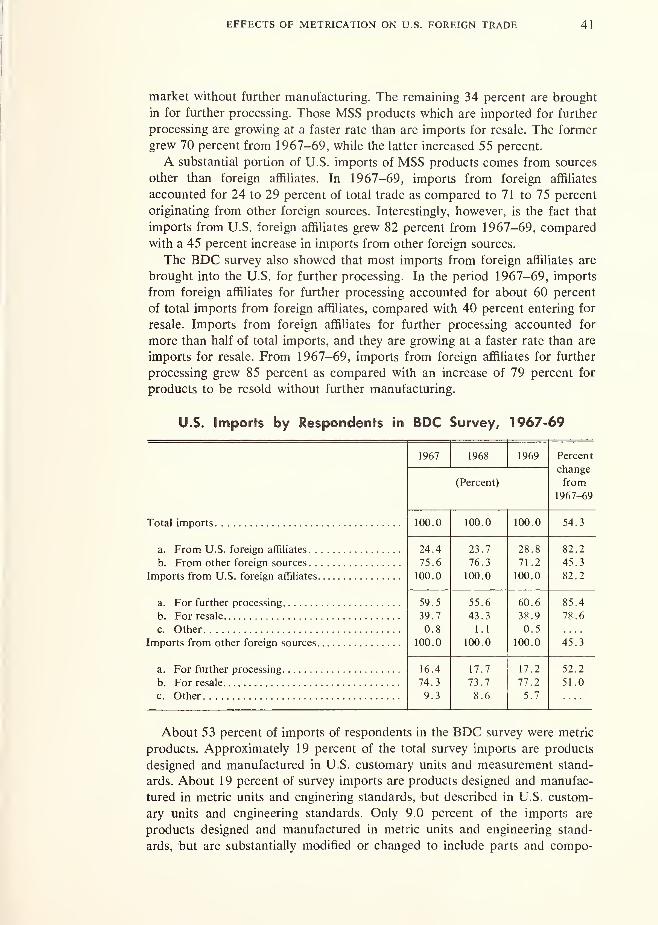
EFFECTS OF METRICATION ON U.S. FOREIGN TRADE 41
market without further manufacturing. The remaining 34 percent are brought
in for further processing. Those MSS products which are imported for further
processing are growing at a faster rate than are imports for resale. The former
grew 70 percent from 1967-69, while the latter increased 55 percent.
A substantial portion of U.S. imports of MSS products comes from sources
other than foreign affiliates. In 1967-69, imports from foreign affiliates
accounted for 24 to 29 percent of total trade as compared to 71 to 75 percent
originating from other foreign sources. Interestingly, however, is the fact that
imports from U.S. foreign affiliates grew 82 percent from 1967-69, compared
with a 45 percent increase in imports from other foreign sources.
The BDC survey also showed that most imports from foreign affiliates are
brought into the U.S. for further processing. In the period 1967-69, imports
from foreign affiliates for further processing accounted for about 60 percent
of total imports from foreign affiliates, compared with 40 percent entering for
resale. Imports from foreign affiliates for further processing accounted for
more than half of total imports, and they are growing at a faster rate than are
imports for resale. From 1967-69, imports from foreign affiliates for further
processing grew 85 percent as compared with an increase of 79 percent for
products to be resold without further manufacturing.
U.S. Imports by Respondents in BDC Survey, 1967-69
1967 1968 1969 Percent
change
(Percent) from
1967-69
Total imports 100.0 100.0 100.0 54.3
a. From U.S. foreign affiliates 24.4 23.7 28.8 82.2
b. From other foreign sources 75.6 76.3 71.2 45.3
Imports from U.S. foreign affiliates 100.0 100.0 100.0 82.2
a. For further processing 59.5 55.6 60.6 85.4
b. For resale 39.7 43.3 38.9 78.6
c. Other 0.8 1.1 0.5
100.0 100.0 100.0 45.3
16.4 17.7 17.2 52.2
74.3 73.7 77.2 51.0
c. Other 9.3 8.6 5.7
About 53 percent of imports of respondents in the BDC survey were metric
products. Approximately 19 percent of the total survey imports are products
designed and manufactured in U.S. customary units and measurement stand-
ards. About 19 percent of survey imports are products designed and manufac-
tured in metric units and enginering standards, but described in U.S. custom-
ary units and engineering standards. Only 9.0 percent of the imports are
products designed and manufactured in metric units and engineering stand-
ards, but are substantially modified or changed to include parts and compo-
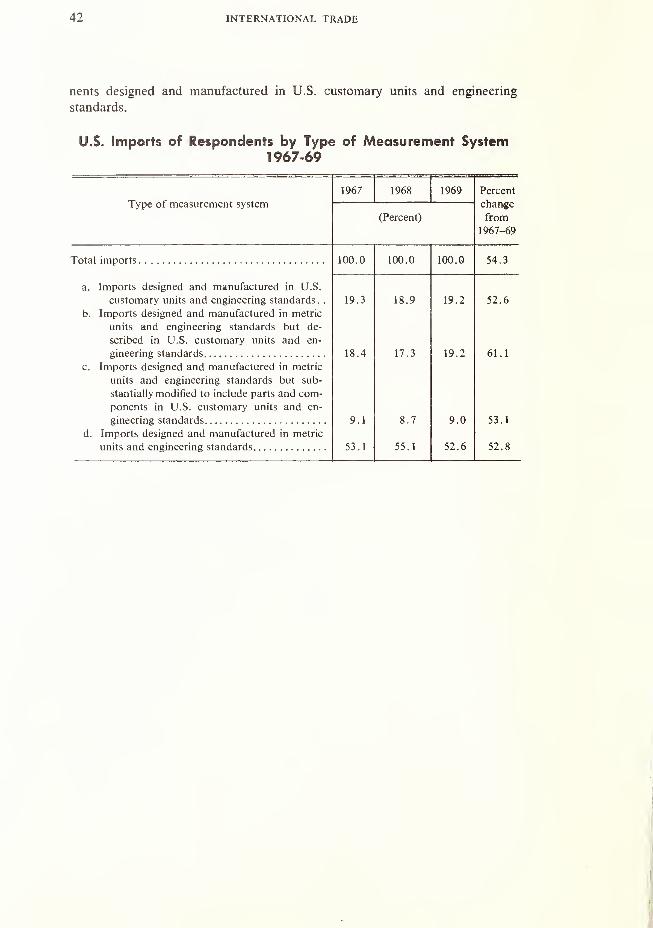
42 INTERNATIONAL TRADE
nents designed and manufactured in U.S. customary units and engineering
standards.
U.S. Imports of Respondents by Type of Measurement System1967-69
Type of measurement system
1967 1968 1969 Percent
change
(Percent) from
1967-69
100.0 100.0 100.0 54 3
n Imnnrts rlpQicrnpH anH mamif*af*tiirf»rl in T T ^a . xi 1 ][.
1w i i > u>-M^ni.u diiu iijtaiiLHii^iuiLii ill i... •o
customary units and engineering standards.
.
19.3 18.9 19.2 52.6
b. Imports designed and manufactured in metric
units and engineering standards but de-
scribed in U.S. customary units and en-
gineering standards 18.4 17.3 19.2 61.1
c. Imports designed and manufactured in metric
units and engineering standards but sub-
stantially modified to include parts and com-
ponents in U.S. customary units and en-
gineering standards 9.1 8.7 9.0 53.1
d. Imports designed and manufactured in metric
units and engineering standards 53.1 55.1 52.6 52.8
IV. POTENTIAL EFFECTS OF U.S.
CONVERSION TO THE METRIC SYSTEMON SELECTED INDUSTRIES
This chapter consists of a series of industry impact statements evaluating
the potential effect of U.S. conversion to the metric system on selected U.S.
industries. The criteria for selecting the industries were: (1) the U.S. has an
extraordinary foreign trade surplus in the industry's products; or (2) the
potential impact of U.S. conversion may have adverse effects on the industry.
The reason for selecting industries with an extraordinary foreign trade surplus
was to determine whether or not metrication would reduce or enhance the
surplus.
The industries selected were: (1) machine tool industry, (2) steel industry,
(3) air conditioning and refrigeration industry, (4) pumps and compressors,
(5) industrial fasteners, (6) electronic computing equipment, and (7) con-
struction machinery and equipment. Each impact statement includes a sum-
mary of the potential metrication impact, a description of the foreign trade
patterns, and a discussion of the importance of the measurement factor.
THE MACHINE TOOL INDUSTRY1
A shift from the U.S. customary measurement system to the metric system
would have little or no effect upon U.S. foreign trade in machine tools. Asurvey conducted by BDC of exporters and importers indicates clearly that
1 Standard Industrial Classifications 3541 and 3542.
43
44 INTERNATIONAL TRADE
price, technology, reliability and reputation of product, local and third country
competition, shipping costs, tariff duties-—all are factors that transcend in
importance a change from our U.S. customary measurement system to the
metric system.
Indications are that the U.S. foreign trade surplus for machine tools will
deteriorate in the seventies. U.S. exports will probably not grow appreciably
because: (a) U.S. prices will continue higher than prices of foreign producers;
and (b) U.S. producers are increasingly supplying foreign markets by manu-
facturing abroad. U.S. imports of foreign-made machine tools will probably
grow, depending on the growth of the domestic economy. Foreign producers
have important price advantages and are rapidly acquiring U.S. technology.
U.S. conversion to the metric system will have only a marginal effect on U.S.
foreign trade.
Foreign Trade Patterns: Domestic demand for machine tools more than
doubled from 1960-69, rising from about $603 million to $1.5 billion. In
1967, demand peaked at $1.8 billion and then steadily declined to $1.5
billion. The growth in shipments reflected a massive investment in industrial
modernization and expansion, encouraged by the investment tax credit pro-
gram and revised depreciation allowances. Other factors stimulating shipments
were military procurement for Southeast Asia, cuts in corporate income taxes,
rising labor costs and a labor shortage. Since 1969, the investment tax credit
program has been repealed, military procurement has decreased, interest rates
have risen. All of these factors have acted to depress the machine tool
industry. New orders are currently running at pre-1960 levels.
The unprecedented domestic demand for machine tools during the sixties
had a significant effect on U.S. foreign trade in machine tools. It probably
restricted growth in machine tool exports and certainly encouraged imports of
machine tools, particularly during periods when foreign machine tool produc-
ers could offer faster deliveries than domestic producers. U.S. exports of
machine tools increased from $271 million in 1965 to $322 million in 1969,
as compared to an increase in imports of from $69 million to $183 million for
the same period. The 18 percent increase in machine tool exports from
1965-69, which represents mostly price change rather than any real signifi-
cant increase in actual shipments, was small compared with the 69 percent
increase in exports for all manufacturing. In 1969, the U.S. had a trade
surplus in machine tools of about $138 million. Exports amounted to about
20 percent of total machine tool product shipments and imports about 12
percent of domestic consumption of machine tools. Currently, exports of
machine tools are up quite sharply owing to the fast growing markets of West
Germany, Japan, and other countries. Imports have declined.
Parts for metalcutting machines was the largest machine tool export cate-
gory in 1969, amounting to $48.6 million or about 15 percent of total
machine tool shipments. This was followed by exports of grinding and polish-
ing machines and metal forming machine tools. Export shipments in these two
categories of equipment were in excess of $40.0 million each in 1969. Exports
of machine tools for home workshops, laboratories, and garages have steadily
declined, dropping from $44.6 million in 1965 to $20.5 million in 1969.

EFFECTS OF METRIC CONVERSION ON SELECTED INDUSTRIES 45
From 1965-69, imports of machine tools climbed 165 percent, moving from
$69.0 million to $183.2 million. The largest increase occurred in 1966 whenimports doubled from the previous year, reflecting the high level of economic
activity in the U.S. The largest single machine tool import was lathes, which
amounted to $38 million in 1969. Milling machines showed the largest
growth, rising over 300 percent and totalling $26.3 million in 1969, downslightly from $31 million in each of the 2 previous years.
In 1969, the U.S. had a favorable trade balance in machine tools with most
countries, except for the Common Market countries, which had a deficit of
$37.1 million. The largest surplus was with Canada, totalling $62.1 million,
which was about 45 percent of the total surplus. Trade in machine tools with
Japan increased quite significantly from 1965-69. Exports doubled, from
$25.7 million to $54.0 million. However, imports also rose and our machine
tool trade balance fluctuated between a $5.5 million deficit in 1966 and a
$34.5 million surplus in 1969. (See table, p. 47.)
Measurement Factor: Technical superiority, reputation, reliability, and high
quality of U.S. machine tools are the chief selling points used in marketing
abroad. Insofar as price is concerned, the U.S. is not competitive in most
foreign markets. The price of foreign built machine tools is from 25 percent to
40 percent less than the price of comparable U.S. built machines.
Since they are unable to compete on price, most U.S. producers are moving
from the production for export of low-price, general purpose machine tools to
special, custom built and technically advanced machines. Performance and
quality are emphasized. However, there is a question as to how long the U.S.
will continue to maintain a technological edge since foreign producers are
rapidly equaling U.S. technology.
Because of competitive uncertainty, many U.S. machine tool firms have
acquired foreign subsidiaries to supply local markets. Many firms have
invested in new manufacturing operations, acquired existing firms, or entered
into licensing arrangements. These steps provide the benefit of lower cost,
both in labor and transportation, and eliminate tariff duties. The consequences
of these developments with respect to future U.S. exports of machine tools are
not encouraging.
The measurement system, either metric or U.S. customary, used in building
machine tools is a marginal factor in foreign trade. Its effect on foreign trade
ranks low in relation to price, technology, reliability, local competition, ship-
ping costs, tariff duties, and many other factors. Respondents to the BDCsurvey indicated that the five most important factors promoting U.S. exports
of machine tools were: (1 ) superior technology; (2) reputation and reliability
of product; (3) higher quality products; (4) growing foreign markets; and
(5) a vigorous company export promotion program. The five most important
deterring factors were: (1) prices were not competitive; (2) strong local and
third country competition; (3) high shipping costs; (4) high tariff duties; and
(5) no technological advantage of product. (See table, p. 50.)
Assuming the U.S. maintained its current measurement system, half of the
survey respondents when asked to estimate exports for 1975 stated that there
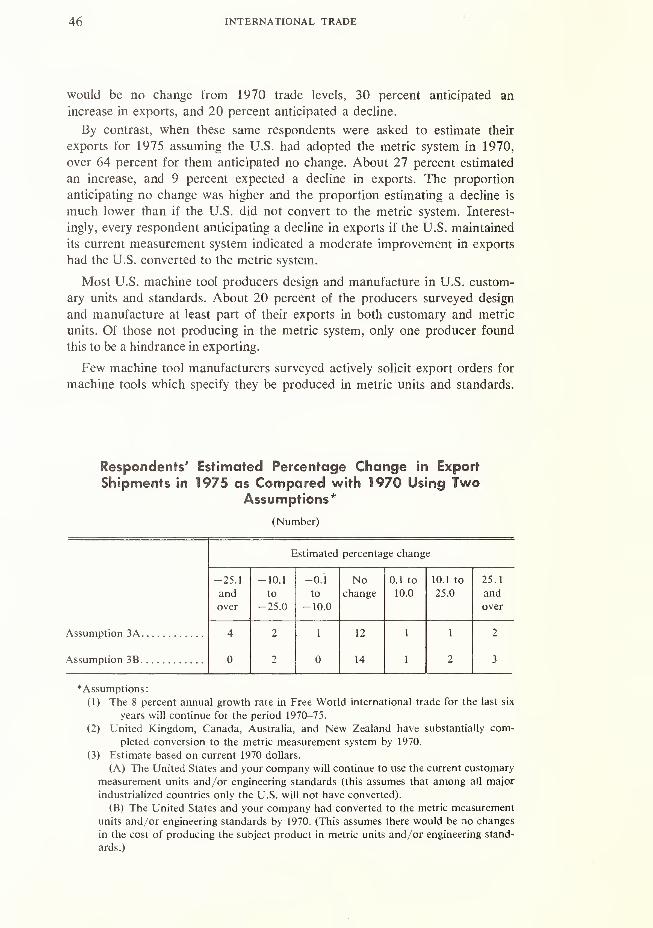
46 INTERNATIONAL TRADE
would be no change from 1970 trade levels, 30 percent anticipated an
increase in exports, and 20 percent anticipated a decline.
By contrast, when these same respondents were asked to estimate their
exports for 1975 assuming the U.S. had adopted the metric system in 1970,
over 64 percent for them anticipated no change. About 27 percent estimated
an increase, and 9 percent expected a decline in exports. The proportion
anticipating no change was higher and the proportion estimating a decline is
much lower than if the U.S. did not convert to the metric system. Interest-
ingly, every respondent anticipating a decline in exports if the U.S. maintained
its current measurement system indicated a moderate improvement in exports
had the U.S. converted to the metric system.
Most U.S. machine tool producers design and manufacture in U.S. custom-
ary units and standards. About 20 percent of the producers surveyed design
and manufacture at least part of their exports in both customary and metric
units. Of those not producing in the metric system, only one producer found
this to be a hindrance in exporting.
Few machine tool manufacturers surveyed actively solicit export orders for
machine tools which specify they be produced in metric units and standards.
Respondents' Estimated Percentage Change in Export
Shipments in 1975 as Compared with 1970 Using TwoAssumptions*
(Number)
Estimated percentage change
-25.1 -10.1 -0.1 No 0.1 to 10.1 to 25.1
and to to change 10.0 25.0 and
over -25.0 -10.0 over
Assumption 3A 4 2 1 12 1 1 2
Assumption 3B 0 2 0 14 1 2 3
*Assumptions:
(1) The 8 percent annual growth rate in Free World international trade for the last six
years will continue for the period 1970-75.
(2) United Kingdom, Canada, Australia, and New Zealand have substantially com-
pleted conversion to the metric measurement system by 1970.
(3) Estimate based on current 1970 dollars.
(A) The United States and your company will continue to use the current customary
measurement units and/or engineering standards (this assumes that among all major
industrialized countries only the U.S. will not have converted).
(B) The United States and your company had converted to the metric measurement
units and/or engineering standards by 1970. (This assumes there would be no changes
in the cost of producing the subject product in metric units and/or engineering stand-
ards.)
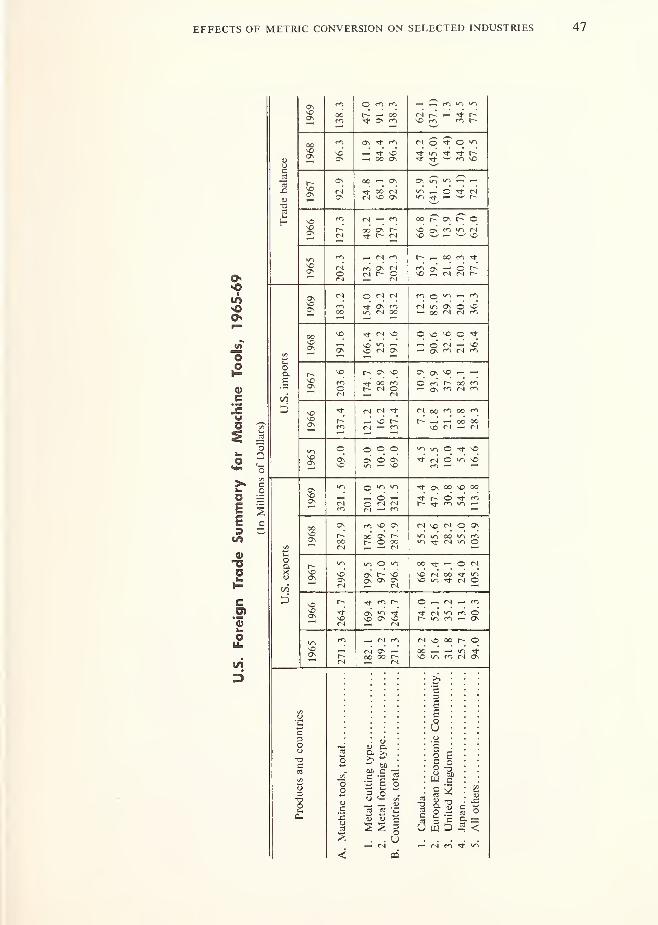
EFFECTS OF METRIC CONVERSION ON SELECTED INDUSTRIES
u
Ui
oQ.
E
D
9>
3s
3>
sC
3n
OS
ON
O rvl
N *
o o o
~- ^- m w*i ui
M 1^ ^ 't 1^so m m r-~
M O ^ O "1
Tj" t
—
tJ- Tt w so
0\ m - -«> —! o <Nv-i tf — ^ r-
oo os t— OSO OS f*l <NSO w — w vo
t-» h 00 ro ^
O 1/1 ^ wcn Os © so- 00 ^ (N "
O so so o ^
OS OS SO ^ ^O m r~ oo mi—
i os rsl
N oo ^ co f^i
_ — oo oo^ fN IH tS
"1 u-l O so
N O "O
0>so3s
SOSOOS
— O —O <N JS
OS 00 SO 00
t r~ O r*">
r~ m —
fN SO <N O OS
oo os r-t- O oo_ — <N
oo Tt — o r>l
os r~ soOS OS OS
O — <~n1 — m"si-
ts so oo t— O
•ac
o0.
2
-Jpe
Q, >,>,
6060c
c(3
E o"3
<soJ3*3'C
OJ (L) cno
UPD
8 ^
is u —
)
p - (d oh i- o. —c _
« 3 iU W D— fN co Tt wi

48 INTERNATIONAL TRADE
Factors Affecting U.S. Export of Machine Tools
Promoting
Percent
of total
rankings
1. Superior technology of product
2. Reputation and reliability of product
3. Higher quality product
4. Growing foreign markets
5. Lack of local and third country competition
6. Products are designed and manufactured in U.S. customary units and en-
gineering standards
7. Products are designed and manufactured in metric units and engineering
standards
8. All others
Total
Deterring
1. Prices are not competitive
2. Strong local and third country competition
3. High tariff duties
4. High shipping costs
5. No technological advantage of product ,.
6. Products are designed and manufactured in U.S. customary units and en-
gineering standards
7. Products are designed and manufactured in metric units and engineering
standards
8. All others
Total
27.7
25.2
14.3
6.7
5.2
1.7
0.6
18.6
100.0
33.1
15.7
13.0
12.0
7.5
1.5
17.2
100.0
Only one manufacturer reported that, in the last 3 years, it turned down an
export order because it could not meet metric specifications.
About 50 percent of machine tool export shipments reported were
described in dual dimensions. These are machine tools designed and manufac-
tured in U.S. customary units and standards but described in labels, packages,
engineering drawings, and catalogues in metric units. About 40 percent of the
reported exports of machine tools were manufactured and described only in
the U.S. customary system. The remaining 10 percent of exports included
machine tools either modified to include metric parts or components or manu-
factured entirely in metric units or standards.
Imports of machine tools are a function of price, delivery, and most impor-
tant, the level of economic activity in the U.S. Most imports into the U.S. have
been designed and manufactured in the metric system, but are modified to
function in the U.S. customary system. All scales, verniers, and measuring
systems are graduated in the inch system. This modification is an additional
cost to foreign producers which influence price to U.S. importers. However,
the additional cost is not so great as to make prices of foreign-built machinery

EFFECTS OF METRIC CONVERSION ON SELECTED INDUSTRIES 49
noncompetitive with U.S.-built equipment. Foreign producers still have a
favorable price differential over comparable U.S. equipment.
THE U.S. STEEL INDUSTRY
The consensus within the steel industry is that U.S. conversion to the metric
system would not affect U.S. foreign trade in steel mill products. The industry
is easily able to convert machinery and equipment to make steel products in
metric sizes.
The basic "gauge system" used in the steel industry has its origins in
Europe and is standard throughout the world. Sheet steel, which is 20 or 22
gauge, is rolled to the same thickness in both metric and nonmetric countries.
The only dimensional problem, which is minor, involves the width in which
steel is produced. However, since the width of most steel products is trimmed
to size, it is an easy operation to trim to metric or inch units.
Further, the industry uses the "order book" production scheduling practice,
a system where the steel producer groups a number of individual orders for
the same product and makes one large production run. This enables the pro-
ducer to make steel to nearly any standard or measurement unit. Similarly, it
is the practice of domestic consumers when steel is purchased abroad to order
by specification. Foreign producers will deliver the product in any dimension
that the consumer orders.
Price is the most important factor affecting the foreign trade of steel prod-
ucts. Inasmuch as U.S. prices are not competitive with foreign producers,
imports of steel products into the U.S. have risen sharply. Consequently,
were the U.S. to convert to the metric system, the U.S. trade deficit for steel
products would not change.
Foreign Trade Patterns: In the last decade, foreign steel products signifi-
cantly penetrated the U.S. market, and the U.S. trade balance for steel prod-
ucts moved from a surplus to a large deficit. For products covered by this
report, 2 the U.S. had a trade deficit in 1969 of $837 million, second largest to
the record of $1.3 billion in 1968. From 1965-69, imports of steel products
grew 61 percent, climbing from $868 million to $1.4 billion. Imports in 1969
were down about $200 million from the previous year. Export gains of steel
products were moderate, reaching $540 million in 1969, up from $388 million
in 1965. In 1969, imports of steel products as a percent of apparent consump-
tion amounted to about 14 percent. Exports were about 5 percent of total
shipments.
The growth in imports was stimulated by the high rate of economic activity
in the U.S., higher domestic prices for steel, and labor strikes. The installation
of large scale and ultramodern machinery and equipment by European and
Japanese producers, coupled with lower labor costs, enabled them to under-
price domestic producers and increase their share of the U.S. market.
Imports grew for nearly all product classes covered in this report. When
2 SIC-33123, 33124, 33126, 33127, 33128, 33176, 33167, 33168.
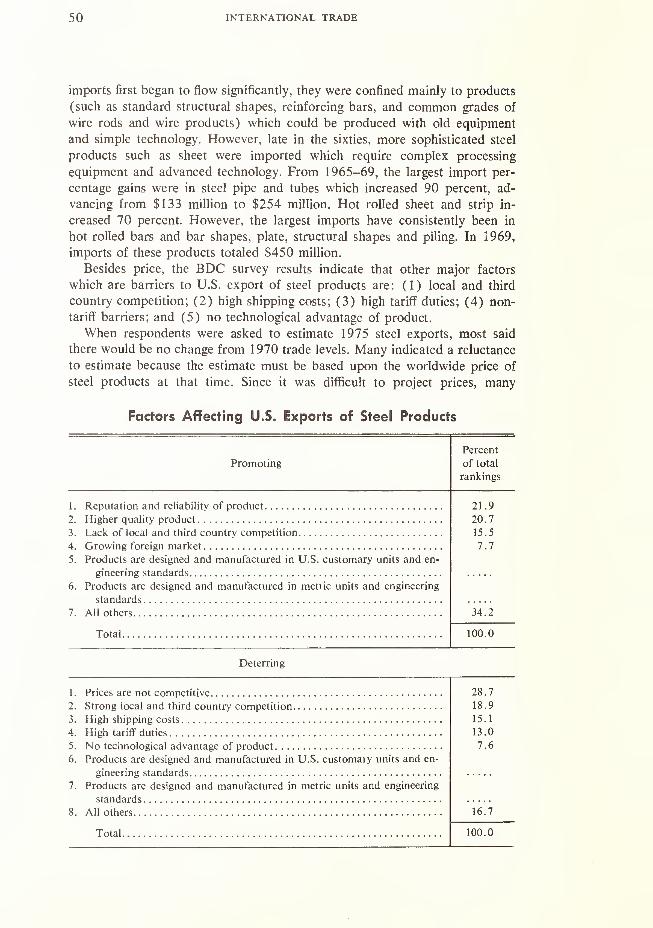
50 INTERNATIONAL TRADE
imports first began to flow significantly, they were confined mainly to products
(such as standard structural shapes, reinforcing bars, and common grades of
wire rods and wire products) which could be produced with old equipment
and simple technology. However, late in the sixties, more sophisticated steel
products such as sheet were imported which require complex processing
equipment and advanced technology. From 1965-69, the largest import per-
centage gains were in steel pipe and tubes which increased 90 percent, ad-
vancing from $133 million to $254 million. Hot rolled sheet and strip in-
creased 70 percent. However, the largest imports have consistently been in
hot rolled bars and bar shapes, plate, structural shapes and piling. In 1969,
imports of these products totaled $450 million.
Besides price, the BDC survey results indicate that other major factors
which are barriers to U.S. export of steel products are: (1) local and third
country competition; (2) high shipping costs; (3) high tariff duties; (4) non-
tariff barriers; and (5) no technological advantage of product.
When respondents were asked to estimate 1975 steel exports, most said
there would be no change from 1970 trade levels. Many indicated a reluctance
to estimate because the estimate must be based upon the worldwide price of
steel products at that time. Since it was difficult to project prices, many
Factors Affecting U.S. Exports of Steel Products
Promoting
Percent
of total
rankings
1. Reputation and reliability of product
2. Higher quality product
3. Lack of local and third country competition
4. Growing foreign market
5. Products are designed and manufactured in U.S. customary units and en-
gineering standards
6. Products are designed and manufactured in mehic units and engineering
standards
7. All others
Total
Deterring
1. Prices are not competitive
2. Strong local and third country competition
3. High shipping costs
4. High tariff duties
5. No technological advantage of product
6. Products are designed and manufactured in U.S. customaiy units and en-
gineering standards
7. Products are designed and manufactured in metric units and engineering
standards
8. All others
Total
21.9
20.7
15.5
7.7
34.2
100.0
28.7
18.9
15.1
13.0
7.6
16.7
100.0

EFFECTS OF METRICATION ON U.S. FOREIGN TRADE 51
respondents did not estimate 1975 export levels. It should be noted, however,
that many respondents who did not estimate 1975 exports stated that metrica-
tion was not an important factor affecting trade.
When respondents were asked if the United Kingdom's conversion to the
metric system would affect steel export trade, only one said yes. Thirteen
respondents answered no, and five said they did not know.
Respondents who import steel products stated that foreign countries are
willing to supply steel in the U.S. customary system at prices very favorable to
U.S. prices. Several indicated that if the U.S. converted to the metric system, im-
proved relations with foreign suppliers would result, but not to the extent that
it would influence their buying more than they are now.
The U.S. runs a large trade deficit for all steel products with the EECcountries and with Japan. In 1965, the trade deficit with these countries was
$673 million, and in 1969, it was in excess of $1.0 billion. The deficit had
declined in 1969 to about $200 million. Realizing this situation and the
probability that the U.S. might legislate import controls, these countries agreed
to voluntarily restrain their exports to the U.S. during the years 1969-71.
(See table, p. 52.)
Measurement Factor: Price and availability are the two most important
factors affecting U.S. foreign trade in steel. In fact, price is so important that it
far outweighs all other factors. Steel, a relatively standardized product moving
freely in international trade, competes almost entirely on price rather than on
product differentiation, service, or some other factor. During 1968, the peak
year for steel imports, finished steel came into the U.S. at a 15 to 20 percent
price differential. This is too much for U.S. producers to compete against.
Generally, industry considers a price difference of 10 percent or more to be
sufficient to encourage domestic consumers to buy off shore.
It is a practice in international trade for foreign prices of steel for most
countries including the U.S. to be less than the domestic price. In Japan,
published prices of domestic steel is about 10 perecnt more than that sold by
the Japanese in foreign markets. The differential may be smaller for large
consumers who negotiate their prices with Japanese steel producers. A similar
situation exists for European produced steel. (See table, p. 52.)
THE AIR CONDITIONING ANDREFRIGERATION INDUSTRY
Evidence adduced from BDC's survey indicates that U.S. conversion to the
metric system would have little or no effect on the trade surplus in air
conditioning and refrigeration equipment. Both exports and imports might
increase as a result of such a step, but would probably offset one another.
The U.S. trade surplus for air conditioning and refrigeration equipment will
perhaps grow moderately in future years. World-wide demand for this type of
equipment has been very strong and will continue strong as standards of living
rise, particularly in the developing countries. U.S. share of the worldwide
market will shrink as new producers enter the market, but the market's growth
will be such that U.S. producers should continue to experience good sales.

52 INTERNATIONAL TRADE
Dm
3
in
C
©IL
(/)
D
oQ
1- C0 .2
1 i
to -
o
o<
3>
ON
0>
NOm On00 —
r-' r~in in
NO (N NO
* so m"st m —>T m
m — <N •—-—
Tfr so©' r-
-
oo —"* —
OS OS SO— m ©fS w —
6
OS OS
NO SO
«-s Cn| OS
OS Cn)
3
* "!(S Tf <NO 4 >£>
in Csl
Tj" in— o Os <N so'
tJ- so 0°
nC
3
—
;
00 <N— r~Os <N
(N — r-_
so' rn t—N in "1m —
r-
SO —so00 (N
m so— r»s so
rr O Of- rsi rn- N O
r
-
r~
in rsi r-
I—' od nom © f
Os r-
so r4
rsi so O)
so' so'
in o o*
r-'©'
(N ©m —
N * «Os NO
NO O "*
0s
SO
(N in
r~ OsOO (Nm —
t-- m Os
in OsOs Os •n
°°. oo m oo
3; (N r~' so°° r~ m os5*j, w so —
^ — (S pj 8 » °jn_ SO —
o ti
1"S
2 £
, u _o ie
• 9- 3 —n) <u
t/i sj w
« «i 2 a =o -a T33 u ""gooi- V *ra « ^_ o o8 11
c/3 a>
55o ">
U o
NO r*> r-so m -N^ Tj" —
^ N m -—' so r~'SO so (N —
rsj so — ©£2 I--' ©' osos m oo r-N s^m ^
°°- ~°o 't m'n oo Os
Os oo oo rJOs r-' sdsn © os osin ^- \o
d m OsIS oo' so' sono r~ r«i r~
© f~; 00 <Nin rsi od r--'X 1^ (N SO
OS — Ttm' Os rsi— so oo
© so oo rsi
*' —i i-'
—'
r~ — Osrsi
so rsi
rsi*'
in ro
Os rsi rsi— — os
CO m r*i
(-- m m oo
E^ o- SOC C
u^ o.
cCn) _U UJ
E "a
o O «i
u
a —5 <
73C
CD
EFFECTS OF METRIC CONVERSION ON SELECTED INDUSTRIES 53
The BDC survey shows that the measurement system used in the manufac-
ture of air conditioning and refrigeration equipment is a minor factor affecting
foreign trade in this product line. The quality, reputation, and reliability of the
product, price, technology, and maintenance and service all rank as more
important than the measurement system.
Foreign Trade Patterns: The U.S. has always maintained a large trade
surplus in air conditioning and refrigeration equipment. Demand for this
equipment remains strong worldwide. In 1969, with U.S. exports of $365
million and imports only $24 million, the trade surplus was $341 million, up
from about $200 million in 1965.
From 1965-69, exports of air conditioning and refrigeration equipment
grew 64 percent, slightly greater than the growth in domestic product ship-
ments. Of the $365 million of equipment exported in 1969, over 45 percent
was air conditioners, both room and unitary, and heat transfer equipment.
Soda fountain and beer dispensing equipment was the only other sizeable
export category, amounting to $119.4 million in 1969, up from $50.6 in
1965, a 100 percent increase. Exports of commercial refrigeration equipment
such as display cases and cabinets amounted to about $17 million in 1965.
Imports of air conditioning and refrigeration equipment, always small in
relation to exports, were equal to 6.5 percent of total exports of this product
category in 1969. Imports of air conditioning and refrigeration equipment,
though small, grew spectacularly from 1965-69, increasing 269 percent. In
1969, the bulk of imports consisted of room air conditioners assembled in
Canada mostly from parts manufactured in the U.S., and small hermetic
refrigeration compressors from Italy and Denmark. (See table, p. 55.)
Measurement Factor: Four factors account for the substantial U.S. air
conditioning and refrigeration equipment trade surplus: high quality products,
superior technology, rapidly growing foreign markets, and aggressive U.S.
marketing.
Historically, the air conditioning and refrigeration industry has had a tech-
nological advantage over the rest of the world. As a result, the industry has
been superior to foreign competition, not only in design of equipment, but also
in manufacturing processes. The technological gap between U.S. and foreign
producers is, however, rapidly closing. Foreign producers have adopted muchof U.S. technology, and have abandoned many inefficient production methods.
In the past, foreign producers tended to be craftsmen, producing custom
equipment instead of using large scale production techniques.
Also contributing to the growth in the U.S. trade surplus in this commodity
area has been the increasing worldwide demand for air conditioning and
refrigeration equipment. While there are no statistical data on worldwide
consumption of this equipment, it appears to be growing at an extraordinary
rate. Although the U.S. share of this worldwide market is shrinking because of
increased local production, worldwide demand is growing at such a rate that
the U.S. should continue to experience a substantial growth in shipments. Toinsure their share in these markets, many U.S. firms have either acquired or
begun manufacturing operations abroad or have entered license or joint ven-
ture arrangements. In Canada, for example, except for one producer, all are

54 INTERNATIONAL TRADE
U.S. owned or affiliated. The major benefit derived from these steps is the
designing of products to meet local demand, but it also has the potential effect
of reducing or slowing U.S. exports.
Results of the BDC survey show that the U.S. customary measurement
system used to design and manufacture air condition and refrigeration equip-
ment has little effect in either promoting or deterring U.S. exports. This factor
ranks low among factors promoting exports as: (1) quality, reputation, and
reliability of the products, (2) technology, (3) prices, and (4) maintenance
and servicing.
Factors deterring U.S. exports of air conditioning and refrigeration equip-
ment all relate to exporting costs, such as shipping costs and tariff duties.
Other deterrents cited are: U.S. prices are not competitive and in somecountries there is strong local and third country competition. (See table, p.
56.)
In the opinion of survey respondents, had the U.S. converted to the metric
system in 1970, 1975 exports of air conditioning and refrigeration equipment
would probably be higher than if we maintained the current system. Whenasked to estimate 1975 exports on the assumption that the U.S. maintained its
current measurement system, most respondents indicated no change from
1970 trade levels. Of 13 respondents, 6 estimated no change, 3 an increase
and 4, a decrease.
Respondents' Estimated Percentage Change in Export Shipmentsin 1975 as Compared With 1970 Using Two Assumptions*
(Number of respondents)
Estimated percentage change
-50.0 -25.1 -0.1 No 0.1 to 25.1 to 50.1
and to to change 25.0 50.0 and
over -50.0 -25.0 over
Assumption 3A 0 0 4 6 1 0 2
Assumption 3B 0 0 0 5 5 0 3
*Assumptions:
(1) The 8 percent annual growth rate in Free World international trade for the last six
years will continue for the period 1970-75.
(2) United Kingdom, Canada, Australia, and New Zealand have substantially completed
conversion to the metric measurement system by 1970.
(3) Estimate based on current 1970 dollars.
(A) The United States and your company will continue to use the current customary
measurement units and/or engineering standards (this assumes that among all major
industrialized countries- only the U.S. will not have converted).
(B) The United States and your company had converted to the metric measurement
units and. or engineering standards by 1970. (This assumes theie would be no changes
in the cost of producing the subject product in metric units and/or engineering stand-
ards.)
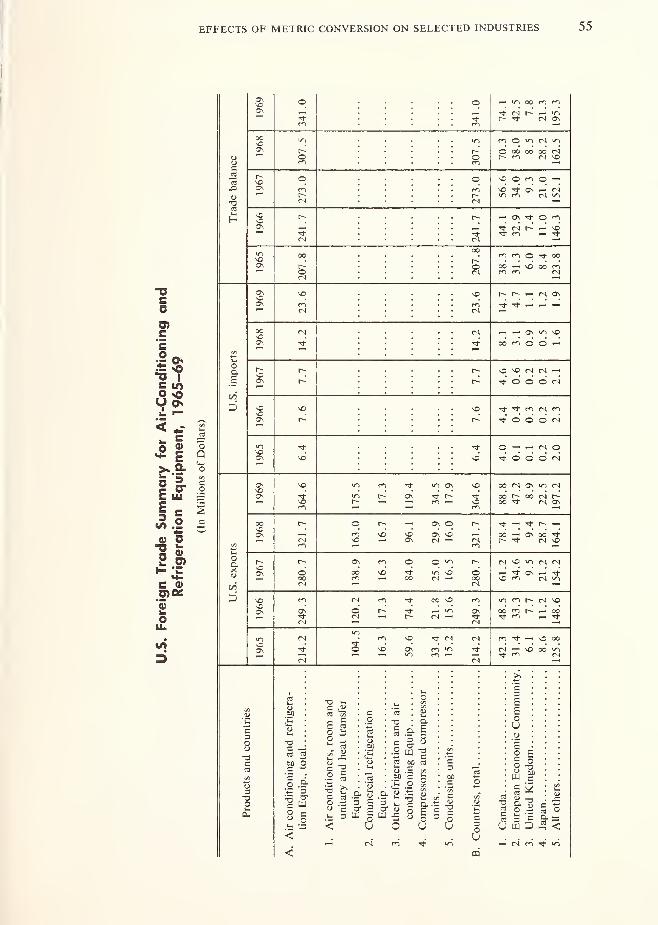
EFFECTS OF METRIC CONVERSION ON SELECTED INDUSTRIES
o o1-
— in oo r*i m
m O rA w>
NO O m © —
i
— ON ^ O PI
3
fi m © ^ oo
r- r~ h n o\
^ ^ „' J, J,
- - a\ m «oo r*» O O —
\o * M (S «^ © d © ts
On
tCI N CI*©'©'© ts
O —I— <N O
<*' © d © <n
On
SN
u-> f>
jo t~- On
OO N 0\ »1 N
— ON © — r- —
© fN no m rJ ts
oo no
— i/->
iri m r~ cs no
— ~- 1/1
ts m - \0 oo
til
T3
Ofi o
o .&
3 §
2 §.2 §
1 S •& §
5 <
.2 w -g
£ .2
c 9-
oU
c•= T3
D OU o
U
caEEoUu
| a
Jl« « 2
1 g-l§ 3 3 Q--U W D n <
ri n »i
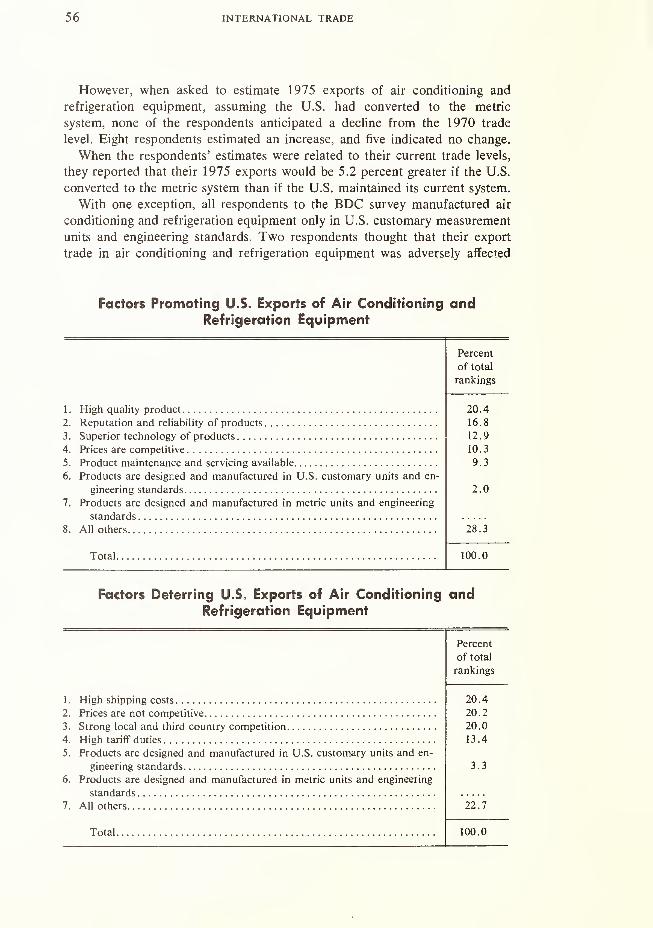
56 INTERNATIONAL TRADE
However, when asked to estimate 1975 exports of air conditioning and
refrigeration equipment, assuming the U.S. had converted to the metric
system, none of the respondents anticipated a decline from the 1970 trade
level. Eight respondents estimated an increase, and five indicated no change.
When the respondents' estimates were related to their current trade levels,
they reported that their 1975 exports would be 5.2 percent greater if the U.S.
converted to the metric system than if the U.S. maintained its current system.
With one exception, all respondents to the BDC survey manufactured air
conditioning and refrigeration equipment only in U.S. customary measurement
units and engineering standards. Two respondents thought that their export
trade in air conditioning and refrigeration equipment was adversely affected
Factors Promoting U.S. Exports of Air Conditioning andRefrigeration Equipment
1. High quality product
2. Reputation and reliability of products
3. Superior technology of products
4. Prices are competitive
5. Product maintenance and servicing available
6. Products are designed and manufactured in U.S. customary units and en-
gineering standards
7. Products are designed and manufactured in metric units and engineering
standards
8. All others
Total
Percent
of total
rankings
20.4
16.8
12.9
10.3
9.3
2.0
28.3
100.0
Factors Deterring U.S. Exports of Air Conditioning andRefrigeration Equipment
1. High shipping costs
2. Prices are not competitive
3. Strong local and third country competition
4. High tariff duties
5. Products are designed and manufactured in U.S. customary units and en-
gineering standards
6. Products are designed and manufactured in metric units and engineering
standards
7. All others
Total
Percent
of total
rankings
20.4
20.2
20.0
13.4
3.3
22.7
100.0
EFFECTS OF METRIC CONVERSION ON SELECTED INDUSTRIES 57
since they did not manufacture equipment in metric units and engineering
standards.
None of the survey respondents solicited export orders specifying they be
manufactured in metric units and engineering standards. No respondent indi-
cated that an export order had been refused, in the last 3 years, because the
specifications were in metric units and engineering standards.
Finally, when the survey respondents were asked if a United Kingdom
conversion to the metric system would adversely affect their air conditioning
and refrigeration export sales, four answered affirmatively and nine that such a
move would have no effect. One respondent predicted that a change to the
metric system by the United Kingdom would gradually influence acceptance of
the metric system in other countries presently using British units.
THE INDUSTRIAL PUMP AND COMPRESSOR INDUSTRY 1
In 1969 the U.S. ran a trade surplus of $315 million in industrial pumpsand compressors, $100 million and 46 percent larger than the 1965 surplus.
Exports in 1969 amounted to $367 million, about 15 percent of total domes-
tic shipments of pumps and compressors. While U.S. imports of this commodity
are relatively small, totaling $53 million in 1969, they have been growing at
an annual rate of about 17.5 percent.
U.S.-exported pumps and compressors are generally highly engineered, non-
standard, and with large capacities compared with our imports of standardized
equipment. In recent years demand has been strong for pumps and compres-
sors in developing countries in connection with the construction of petroleum
and gas field transmission lines, highways, and industrial and commercial
facilities and operation.
Conversion to the metric system would have a beneficial effect on U.S.
exports of pumps and compressors. BDC survey respondents estimate that
exports would decline slightly by 1975 if the U.S. maintained its current
measurement system, and would probably increase nearly 20 percent by 1975
if the U.S. converted to the metric system by 1970.
Conversion to the metric system may accelerate imports of pumps and
compressors, particularly standard-type pumps and compressors where price is
the chief determinant. However, because the U.S. supplies foreign markets
with large capacity, high value equipment, the overall effect would be an
increase in exports which would more than offset any increase that may occur
in imports.
Foreign Trade Patterns: The U.S. industrial pump and compressor industry
is a major international supplier of equipment whose exports in 1969 were
$367 million, up 51.2 percent from $243 million in 1965.
The largest single category of export shipments, parts and attachments for
pumps and compressors, in 1969 amounted to $156 million or 42 percent of
1 Standard Industrial Classification 3561. Does not include measuring and dispensing pumps for
gasoline service stations.
58 INTERNATIONAL TRADE
total exports in this category. Exports of parts and attachments were also the
fastest growing trade category of pumps and compressors, advancing from $85
million to $113 million, or 85 percent from 1965-69. Parts and attachments
are used not only to replace parts of existing equipment, but are also used by
U.S. subsidiaries and affiliates abroad for further assembly.
The U.S. pump and compressor industry is also an important supplier of
industrial pumps and air and gas compressors. Exports in each of these trade
categories exceeded $65 million in 1969.
This country's imports of pumps and compressors are relatively small,
totaling $53 million in 1969. Nearly half of these imports were classified in a
basket category which included oil burners and appliance pumps, fire engine,
laboratory, and sump pumps. About a third of the total imports of pumps and
compressors come from Canada. While these imports are relatively small in
absolute terms, their growth has been quite spectacular, increasing 90 percent
from 1965-69.
The U.S. trade surplus for pumps and compressors amounted to $314.3
million in 1969 which was nearly $100 million larger than in 1965. The U.S.
surplus with Canada amounted to $72 million. Aside from Canada, the devel-
oping countries are important markets for U.S. pumps and compressors. The
Latin American countries bought $86.4 million of pumps and compressors
from this nation in 1969 of which about $33 million were parts and attach-
ments. U.S. trade remains relatively small with the EEC countries, United
Kingdom, and Japan. (See table, p. 60.)
Measurement Factor: U.S. exports of pumps and compressors are generally
highly engineered, nonstandardized equipment. The domestic market requires
U.S. producers to make a wide range of pumps and compressors, including a
substantial quantity of custom designed. In most foreign markets the demand
is generally for smaller types of pumps and compressors so foreign producers
concentrate on standard-type equipment. Consequently, the U.S. is able to
capture a significant portion of the sophisticated, highly-engineered pump and
compressor markets. In recent years demand for this type of equipment has
been strong in developing countries in connection with the construction of
petroleum and gas field transmission lines, highways, and industrial and com-
mercial facilities and operations.
The U.S. customary measurement system, used to design and manufacture
U.S.-made pumps and compressors, is not currently affecting foreign demandfor this equipment. The high quality, reputation, and reliability of U.S. equip-
ment, the availability of maintenance and servicing, the superior technology of
equipment, and competitive prices, all rank more important in promoting U.S.
exports than does the measurement system. (See table, p. 59.)
Where there is a deterrent to U.S. exports, it is usually in standard pumpsand compressors because the U.S. is not competitive pricewise with foreign
producers. High tariff and shipping costs contribute to this noncompeti-
tiveness, but other factors sometimes cited are strong local and third-country
competition and no technological advantage of products. The U.S. customary
measurement system used to design and manufacture pumps and compressors
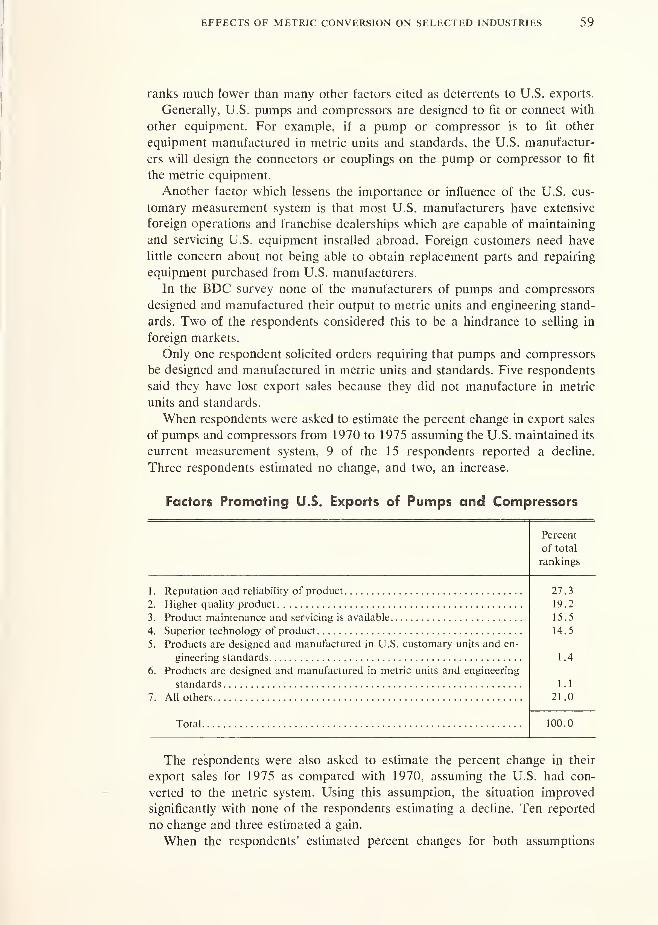
EFFECTS OF METRIC CONVERSION ON SELECTED INDUSTRIES 59
ranks much lower than many other factors cited as deterrents to U.S. exports.
Generally, U.S. pumps and compressors are designed to fit or connect with
other equipment. For example, if a pump or compressor is to fit other
equipment manufactured in metric units and standards, the U.S. manufactur-
ers will design the connectors or couplings on the pump or compressor to fit
the metric equipment.
Another factor which lessens the importance or influence of the U.S. cus-
tomary measurement system is that most U.S. manufacturers have extensive
foreign operations and franchise dealerships which are capable of maintaining
and servicing U.S. equipment installed abroad. Foreign customers need have
little concern about not being able to obtain replacement parts and repairing
equipment purchased from U.S. manufacturers.
In the BDC survey none of the manufacturers of pumps and compressors
designed and manufactured their output to metric units and engineering stand-
ards. Two of the respondents considered this to be a hindrance to selling in
foreign markets.
Only one respondent solicited orders requiring that pumps and compressors
be designed and manufactured in metric units and standards. Five respondents
said they have lost export sales because they did not manufacture in metric
units and standards.
When respondents were asked to estimate the percent change in export sales
of pumps and compressors from 1970 to 1975 assuming the U.S. maintained its
current measurement system, 9 of the 15 respondents reported a decline.
Three respondents estimated no change, and two, an increase.
Factors Promoting U.S. Exports of Pumps and Compressors
Percent
of total
rankings
1. Reputation and reliability of product
2. Higher quality product
3. Product maintenance and servicing is available
4. Superior technology of product
5. Products are designed and manufactured in U.S. customary units and en-
gineering standards
6. Products are designed and manufactured in metric units and engineering
standards
7. All others
Total
27.3
19.2
15.5
14.5
1.4
1.1
21.0
100.0
The respondents were also asked to estimate the percent change in their
export sales for 1975 as compared with 1970, assuming the U.S. had con-
verted to the metric system. Using this assumption, the situation improved
significantly with none of the respondents estimating a decline. Ten reported
no change and three estimated a gain.
When the respondents' estimated percent changes for both assumptions

INTERNATIONAL TRADE
r<"> r<-> O m m \o
O O oo m m <N
r*1 mON OnCM (N
m >* On oo <—
nOnoon o o
O N \0 (N NO
cm <N
>n t On »o 0\
no no O on oo r- <N
no m on v~> r~
r- oo r» ts
<N «N oo m NO
no m oo o ^r~ <M On <N
nO3n
N O * ^1 OOO M ON "
VN NO oo oo m on r-
r~ oo t-h m
3>c0< NO NO
NO NO
O N - oo oo
« oo - o "t
ON
CO
o o
IO vn00 oofN <N
r-4 c-i
on r- r~ oo u"n
N (N (N r- NO
m <N r-j n- no
T3c
D.
E
fS cO 3~ ou
EoUo
Is£ oo -a
ttJ cc 5
iS -n
™ o « § u
-« n m <t i^i
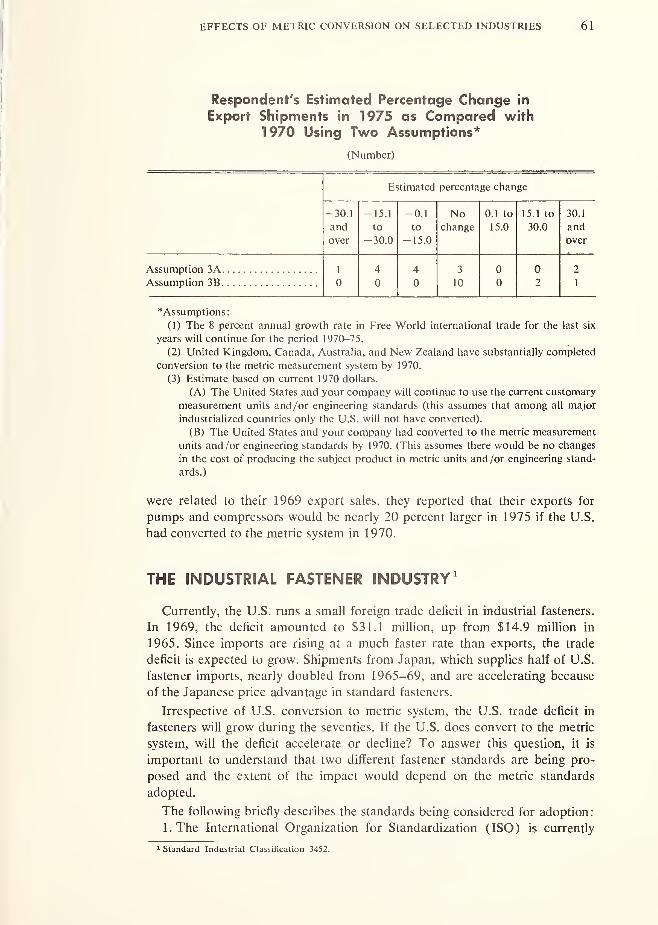
EFFECTS OF METRIC CONVERSION ON SELECTED INDUSTRIES 61
Respondent's Estimated Percentage Change in
Export Shipments in 1975 as Compared with
1970 Using Two Assumptions*
(Number)
Estimated percentage change
-30.1 -15.1 -0.1 No 0.1 to 15.1 to 30.1
and to to change 15.0 30.0 and
over -30.0 -15.0 over
Assumption 3A 1 4 4 3 0 0 2
Assumption 3B 0 0 0 10 0 2 1
*Assumptions:
(1) The 8 percent annual growth rate in Free World international trade for the last six
years will continue for the period 1970-75.
(2) United Kingdom, Canada, Australia, and New Zealand have substantially completed
conversion to the metric measurement system by 1970.
(3) Estimate based on current 1970 dollars.
(A) The United States and your company will continue to use the current customary
measurement units and/or engineering standards (this assumes that among all major
industrialized countries only the U.S. will not have converted).
(B) The United States and your company had converted to the metric measurement
units and /or engineering standards by 1970. (This assumes there would be no changes
in the cost of producing the subject product in metric units and /or engineering stand-
ards.)
were related to their 1969 export sales, they reported that their exports for
pumps and compressors would be nearly 20 percent larger in 1975 if the U.S.
had converted to the metric system in 1970.
THE INDUSTRIAL FASTENER INDUSTRY 1
Currently, the U.S. runs a small foreign trade deficit in industrial fasteners.
In 1969, the deficit amounted to $31.1 million, up from $14.9 million in
1965. Since imports are rising at a much faster rate than exports, the trade
deficit is expected to grow. Shipments from Japan, which supplies half of U.S.
fastener imports, nearly doubled from 1965-69, and are accelerating because
of the Japanese price advantage in standard fasteners.
Irrespective of U.S. conversion to metric system, the U.S. trade deficit in
fasteners will grow during the seventies. If the U.S. does convert to the metric
system, will the deficit accelerate or decline? To answer this question, it is
important to understand that two different fastener standards are being pro-
posed and the extent of the impact would depend on the metric standards
adopted.
The following briefly describes the standards being considered for adoption:
l.The International Organization for Standardization (ISO) is currently
1 Standard Industrial Classification 3452.
62 INTERNATIONAL TRADE
working on metric standards for fasteners. Complete standards will be
available in about 3 years. These standards will be based mostly on
metric standards currently in use in European countries which at
present are not totally interchangeable. The U.S. conversion to the
metric system may mean the adoption of these ISO standards currently
being developed.
2. Some industry sources claim that the ISO fastener standards currently
being developed will be inferior to the current U.S. standards. Conse-
quently, it is undertaking development of a new "optimum fastener"
system which will be in metric units but will incorporate a superior
performance capability to the ISO standards. This superior perform-
ance will be developed to meet the demands of U.S. manufacturers and
will be proposed for adoption to ISO.
If the U.S. adopts the ISO standards for fasteners currently being developed,
its trade deficit will grow sharply, because the competitive advantage will
swing further to foreign producers who will have had production experience
with most of these standards, whereas U.S. producers would have to acquire it.
Foreign producers would have a potential cost advantage.
If the new optimum fastener system is adopted, the trade deficit would not
be affected as much as if the standards currently being developed by ISO were
adopted. All producers, both domestic and foreign, would be on, a more
equitable footing and would have to acquire the learning experience to pro-
duce this type of fastener.
To summarize, the foreign trade deficit for fasteners will continue to grow
even if the U.S. does not convert to the metric system. If conversion does take
place, the engineering standards adopted will have their effects on the rate of
increase in the trade deficit. The trade deficit would, in all probability, be less
if the U.S. adopted the new optimum system rather than the ISO standards.
Foreign Trade Patterns: U.S. shipments of industrial fasteners reached an
estimated $1.85 billion in 1970 slightly less than half of world production of
$4 billion. Actual fastener production is greater in value than shipments since
many manufacturers incorporate their fasteners in end items thus eluding Gov-
ernment statistics. Unreported production is estimated to be about 15 percent
of annual shipments.
Industrial fasteners include not only standard bolts, nuts, washers, and
screws but also sophisticated fastening devices designed for special applica-
tions. Shipments of this latter category, growing 1 2 percent annually in recent
years, currently represent 35 percent of the total. Shipments of standard
fasteners are growing about 7 percent annually. These trends are expected to
continue as the demand for fasteners by consuming industries will require ease
of application, improved performance, and reliability.
Exports and imports of fasteners are small in value in relation to total
domestic shipments. Only 3.7 percent of total U.S. shipments are sold abroad;
imports are equal to about 5.4 percent of U.S. shipments.
From 1965-69, fastener exports grew from $36.6 million to $68.4 million,
an increase of 87 percent. In 1969, the average value per ton was $1,117 for
exports in contrast to only $400 per ton for imports.
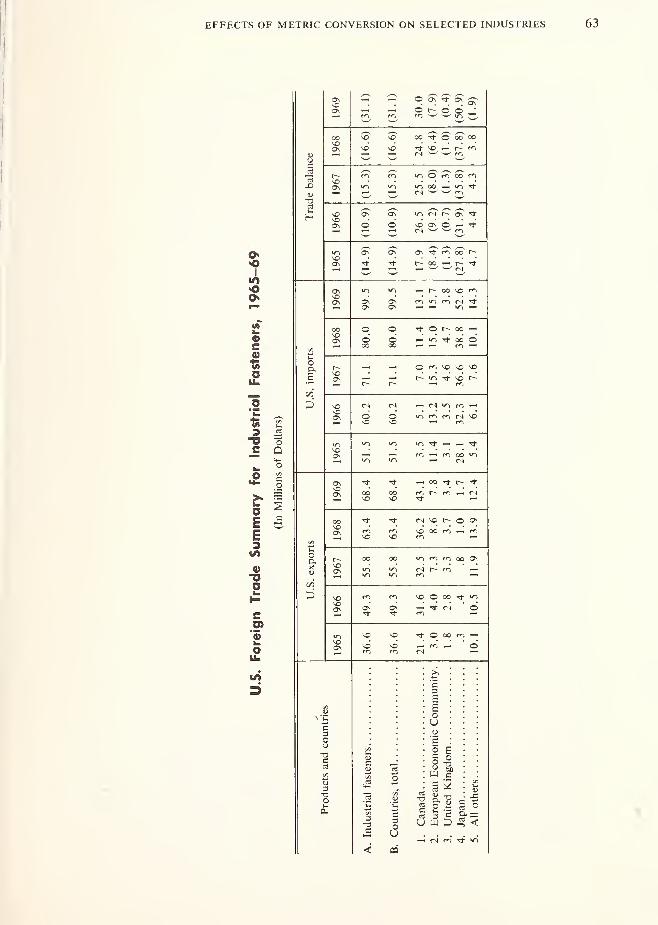
EFFECTS OF METRIC CONVERSION ON SELECTED INDUSTRIES
o©
^ os
— (N
OO O OO OO
Tj- so — r- ci
d
O c*> oo f>
*~ — <N
»o CN r-- ON
\o a d « t
OS
1-
ON OO
r- oo — r-
moo ON
ON
i—" ( oo so
on —< —
c
(A
o
o©
qo
O r- oo —— >ri oo O
OO I-H l-H
© NO SO SO
— m
3 iS0 oC Q
^ <N v> m i—
•
m (N
IT) Tj- r- ^- Tf
m i—> r*i oo
E SE3
1
C0)"55
o
t/5
ooSO
m m
so
(N SO t— O ON
so oo (*i i m
>/") m oo Os
iO O oo ^ «i—
' r-4 ©
NO
rj- O oo r*l <-«
— m r-l ©
3
OU
EEoUo
'h§lw J
1
* U -r
^ & o
B) 3 SU W D
1>
a E--> <
— (N tn »3-
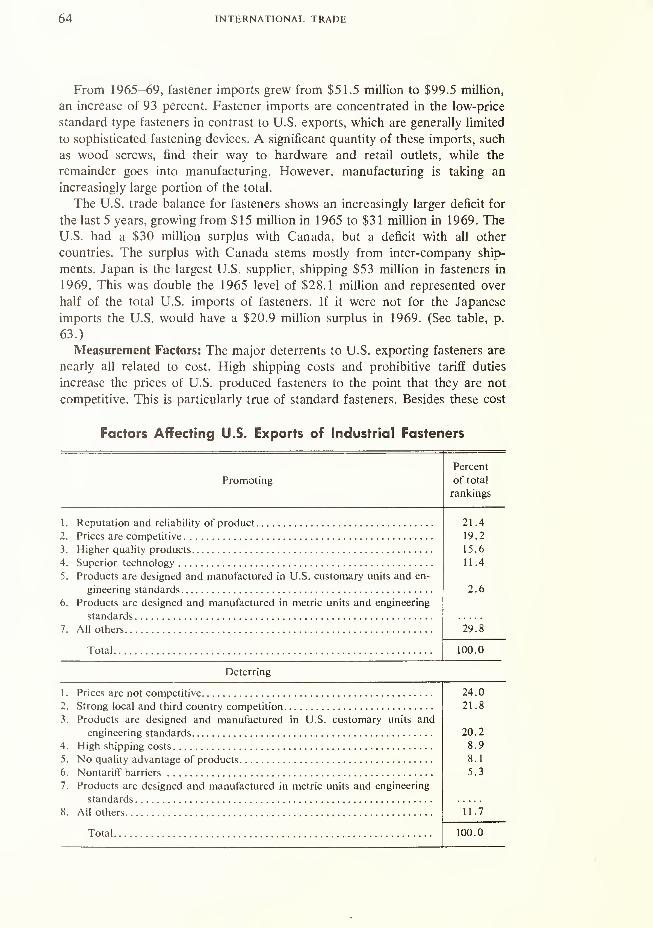
64 INTERNATIONAL TRADE
From 1965-69, fastener imports grew from $51.5 million to $99.5 million,
an increase of 93 percent. Fastener imports are concentrated in the low-price
standard type fasteners in contrast to U.S. exports, which are generally limited
to sophisticated fastening devices. A significant quantity of these imports, such
as wood screws, find their way to hardware and retail outlets, while the
remainder goes into manufacturing. However, manufacturing is taking an
increasingly large portion of the total.
The U.S. trade balance for fasteners shows an increasingly larger deficit for
the last 5 years, growing from $15 million in 1965 to $31 million in 1969. The
U.S. had a $30 million surplus with Canada, but a deficit with all other
countries. The surplus with Canada stems mostly from inter-company ship-
ments. Japan is the largest U.S. supplier, shipping $53 million in fasteners in
1969. This was double the 1965 level of $28.1 million and represented over
half of the total U.S. imports of fasteners. If it were not for the Japanese
imports the U.S. would have a $20.9 million surplus in 1969. (See table, p.
63.)
Measurement Factors: The major deterrents to U.S. exporting fasteners are
nearly all related to cost. High shipping costs and prohibitive tariff duties
increase the prices of U.S. produced fasteners to the point that they are not
competitive. This is particularly true of standard fasteners. Besides these cost
Factors Affecting U.S. Exports of Industrial Fasteners
Promoting
Percent
of total
rankings
1. Reputation and reliability of product
5. Products are designed and manufactured in U.S. customary units and en-
6. Products are designed and manufactured in metric units and engineering
21.4
19.2
15.6
11.4
2.6
Total
29.8
100.0
Deterring
3. Products are designed and manufactured in U.S. customary units and
7. Products are designed and manufactured in metric units and engineering
24.0
21.8
20.2
8.9
8.1
5.3
8. All others
Total
11.7
100.0

EFFECTS OF METRIC CONVERSION ON SELECTED INDUSTRIES 65
factors, most countries have their own fastener industries which are strong
competitors to U.S. producers.
The chief factors promoting U.S. exports are the reputation, reliability, and
quality of U.S. fasteners and superior technology. Additionally, a significant
portion of U.S. exports are to subsidiaries or affiliates abroad which are
producing U.S. designed and manufactured products.
The U.S. customary measurement system used to design and manufacture
fasteners ranks below other deterring factors relating to costs. However, the
measurement system is a more important export deterrent for fasteners than for
most other product classes. This does not mean that if the U.S. converted to
the metric system the fastener industry could export more; in fact, it may de-
cline because U.S. manufacturers who are producing abroad and buying U.S.
produced fasteners may buy metric fasteners locally. One respondent summa-
rized the problem as follows: "The subject of conversion to metric standards as
an influence on exports is so secondary to the tariff and non-tariff restraints in
Europe and Japan as to be irrelevant. Get us free trade with export markets
on an equal basis and the matter of what standards such exports are in, will
take care of itself."
The principal factors promoting the importation of industrial fasteners are
competitive pricing and reputation and reliability of products. These two
factors account for 57 percent of the total rankings. Importers ranked meas-
urement as an important promoting as well as deterring factor. (See tables
pp. 64 and 65.)
Factors Affecting U.S. Imports of Industrial Fasteners
Promoting
Percent
of total
rankings
Prices are competitive
Reputation and reliability of product
Products are designed and manufactured in U.S. customary units and
engineering standards
Growing U.S. market
All others
Total
Deterring
Strong U.S. competition
No quality advantage of product
No technological advantage of product
Prices are not competitive
High shipping costs
Products are designed and manufactured in metric units and engineering
standards
All others
Total
38.6
18.7
8.1
3.2
31.4
100.0
20.0
16.7
12.8
9.8
8.9
8.3
23.5
100.0
66 INTERNATIONAL TRADE
THE ELECTRONIC COMPUTING INDUSTRY 1
Inasmuch as the computer industry supplies nearly all worldwide demand,
the U.S. customary measurement system which is used to design and manufac-
ture this equipment is not an important variable affecting our foreign trade.
Exports of computer equipment are currently growing twice as fast as domestic
shipments. Imports are virtually nil. The outlook for continued export growth
in this equipment category remains exceptionally bright.
In most cases, computer firms furnish foreign customers not only the equip-
ment, but also engineering and technical assistance, software, as well as mainte-
nance and servicing. Because nearly all equipment installed abroad is main-
tained and serviced by U.S. computer firms, the measurement system which is
used to design and manufacture this equipment is of little concern to foreign
customers. This total package purchase greatly reduces the importance of the
measurement system to the foreign customer.
Foreign Trade Patterns: In 1969, the U.S. exported nearly three-quarters
of a billion dollars of electronic computing equipment, including parts and
attachments. Exports were up over 225 percent since 1965, advancing from
$223 million to $728 million. This represented an annual increase of nearly
35 percent. Though the U.S. is importing some parts and attachments for
electronic computing equipment, the quantity is believed to be very small.
Most imports are coming from foreign affiliates of U.S. parent companies.
In 1970, U.S. exports of computer equipment reached about $1 billion and
are projected to climb to $2 billion by 1974. The European Common Market
is the largest, taking over a third of the total U.S. exports of computer
equipment. In 1969, exports to the EEC countries were $255.5 million; since
1965, they have been growing about 32 percent annually. The United Kingdom
bought over $104.5 million of U.S. computer equipment in 1969. Canada
imported nearly $100.0 million in 1969 and Japan, $91.3 million.
In the past, foreign demand has lagged behind the rapidly growing U.S.
demand. However, this is now changing and foreign markets are growing twice
as fast as the U.S. market. Managements in many foreign companies are nowtaking advantage of computer technologies to upgrade their production per-
formance and reduce costs, to provide better services to consumers, and to
solve problems more efficiently.
In 1969, over 80 percent of the 34,000 computers installed or on-order
abroad were produced by U.S. firms. Much of the remaining 20 percent was
produced under U.S. license. U.S. industry has pioneered and developed the
widest range of computer equipment for application to the simplest task and
also to the most advanced problem. As a consequence, this technological edge
has given the industry a virtual monopoly of the world's electronic computer
market. However, this will be changing in the future since many foreign
producers are now moving into the computer market and several plan to make
a super computer in the 1975-80 period. (See table, p. 68.)
Measurement Factor: The U.S. customary measurement system which is
1 Standard Industrial Classification 3573.

EFFECTS OF METRIC CONVERSION ON SELECTED INDUSTRIES 67
used to design and manufacture electronic computing equipment poses no
hindrance or obstacle to U.S. exports of this equipment. The large U.S. trade
surplus for this equipment is attributed to: (1) superior technology, (2)
reputation and reliability of products, (3) aggressive marketing, (4) growing
foreign markets, and (5) product maintenance and servicing. See table below.)
A distinctive characteristic of the U.S. computer industry is its marketing
practices. Nearly all equipment whether leased or sold outright involves a total
package purchase. For one price a U.S. computer firm furnishes its customers
engineering and technical services, the equipment, the software programs, and
most importantly, the maintenance and servicing of the equipment. Therefore,
insofar as the customer is concerned, maintenance and servicing are no prob-
lem and it makes little or no difference to him what measurement system was
used in the design and manufacture of the computer equipment. Customers
rarely, if ever, service their own equipment.
Of the 9 BDC rspondents to the survey in SIC 3573, none manufactured
equipment in both metric and U.S. customary measurement systems. How-ever, three respondents did indicate that they described their export shipments
in both metric and in U.S. customary units. In fact, nearly 50 percent of the
export shipments of computer equipment are described in both measurement
systems in engineering drawings, catalogues, brochures, etc. Several respond-
ents indicated that their equipment has to be compatible with the electrical
supply in foreign countries and must meet certain electrical specifications.
However, they hastened to add that this was no limitation to exporting. Oneperipheral manufacturer, whose products are designed and manufactured in
the U.S. customary system, stated that compatibility with metric designed hard-
ware was not currently a problem, but thought it could become so after 1975
when advances in technology bring foreign equipment approximately to the
level of U.S. products. If this development takes place, the respondent indi-
Factors Promoting U.S. Exports of Electronic Computing Equipment
Percent
of total
rankings
1 . Superior technology of product
2. Reputation and reliability of product
3. Vigorous company export promotion program
4. Growing foreign markets
5. Product maintenance and servicing is available
6. Products are designed and manufactured in U.S. customary units and
engineering standards
20.8
16.9
16.7
13.6
14.0
7. Products are designed and manufactured in metric units and engineering
8. All others
Total
18.0
100.0
68 INTERNATIONAL TRADE
ONNOON ON
o-r i
os vi v> cn so
os v> st « noon
jq o on r-
a
st
NO
-a-
3
ON
5
st
SO
— st oo m oo
no oo st r~ <n~>
ON
V) 00 00 st 00
oo v> no m ©st O * r»i no
1/1
m st oo no
O O fifl st
ONoON.
OS vi m no
OS vi st — noon vi © Os r—
Cn| « —st
sooot 5
ON
5
St 00 m 00
NO O OS OS ono oo vi o
no oo st r~ m
I©
3
ouC
£.9-'3
cr
CCO
—I st
"* ^(N vios os
S S
O as
5 .Sb -c
3 E
oUen
« 00 OO St 00
r~ rr, st OO NO
st ci O O <"0
rNi oo st st
5u
g Eo -o
8P .ts OSC w =
03 3 =U W D
u
S oO. —-> <
— CN m st v>
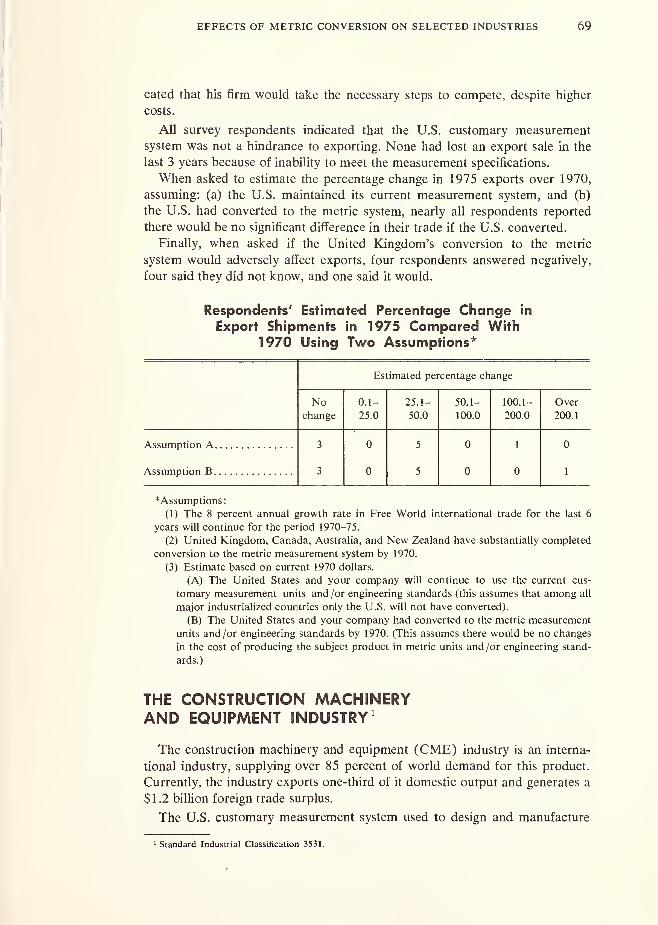
EFFECTS OF METRIC CONVERSION ON SELECTED INDUSTRIES 69
cated that his firm would take the necessary steps to compete, despite higher
costs.
All survey respondents indicated that the U.S. customary measurement
system was not a hindrance to exporting. None had lost an export sale in the
last 3 years because of inability to meet the measurement specifications.
When asked to estimate the percentage change in 1975 exports over 1970,
assuming: (a) the U.S. maintained its current measurement system, and (b)
the U.S. had converted to the metric system, nearly all respondents reported
there would be no significant difference in their trade if the U.S. converted.
Finally, when asked if the United Kingdom's conversion to the metric
system would adversely affect exports, four respondents answered negatively,
four said they did not know, and one said it would.
Respondents' Estimated Percentage Change in
Export Shipments in 1975 Compared With1970 Using Two Assumptions*
Estimated percentage change
No 0.1- 25.1- 50.1- 100.1- Over
change 25.0 50.0 100.0 200.0 200.1
3 0 5 0 1 0
Assumption B 3 0 5 0 0 1
*Assumptions:
(1) The 8 percent annual growth rate in Free World international trade for the last 6
years will continue for the period 1970-75.
(2) United Kingdom, Canada, Australia, and New Zealand have substantially completed
conversion to the metric measurement system by 1970.
(3) Estimate based on current 1970 dollars.
(A) The United States and your company will continue to use the current cus-
tomary measurement units and /or engineering standards (this assumes that among all
major industrialized countries only the U.S. will not have converted).
(B) The United States and your company had converted to the metric measurement
units and /or engineering standards by 1970. (This assumes there would be no changes
in the cost of producing the subject product in metric units and /or engineering stand-
ards.)
THE CONSTRUCTION MACHINERYAND EQUIPMENT INDUSTRY 1
The construction machinery and equipment (CME) industry is an interna-
tional industry, supplying over 85 percent of world demand for this product.
Currently, the industry exports one-third of it domestic output and generates a
$1.2 billion foreign trade surplus.
The U.S. customary measurement system used to design and manufacture
1 Standard Industrial Classification 3531.
70 INTERNATIONAL TRADE
CME is not important either in promoting or deterring U.S. exports of this
equipment. Reputation, reliability, and quality of equipment, superior technol-
ogy, availability of maintenance and service, a vigorous export promotion pro-
gram, and competitive pricing are all factors currently responsible for the large
U.S. trade surplus of CME.Practically all worldwide production of CME is designed to the U.S. cus-
tomary measurement system. U.S. conversion to the metric system would have
little impact on U.S. foreign trade in CME.
During the seventies, the U.S. foreign trade surplus in CME will probably
deteriorate because many U.S. manufacturers will be producing abroad. Five
years ago, U.S. manufacturers of CME had little off-shore production. Cur-
rently, off-shore production by U.S. manufacturers is estimated to be about
$700 million annually, and reliable sources estimate that by 1980 this trend
may increase to as much as $2.5 billion. Domestic production of CME will
probably decline from $4.0 billion to $3.0 billion during the same time period.
Lower costs of labor, material, and shipping, and no tariff duties encourage
U.S. firms to manufacture abroad.
Foreign Trade Patterns: The industry exports one-third of its total domestic
production of $4 billion, and it manufactures another estimated $700 million
of equipment abroad through its foreign-based subsidiaries and affiliates.
As the major supplier to the free world, the U.S. manufactures nearly 100
percent of the large capacity, high-value CME, such as large cranes, shovels,
tracklaying and wheel-type tractors. Foreign producers compete mostly on low
value and small capacity CME.
One important factor which helps U.S. manufacturers supply the major
portion of world CME is their extensive worldwide franchise dealership orga-
nizations. These function not only as sales organizations but also provide
financing, maintenance and servicing, replacement parts and equipment, and
many other services. These services, coupled with a large product line, makeU.S. producers effective competitors.
Practically all worldwide production of CME is designed and manufactured
to U.S. customary measurement system. The reason is that most foreign pro-
duced CME are copies of U.S. equipment and much of the equipment is madeunder license arrangements with U.S. producers.
In 1969, U.S. export shipments of CME amounted to $1.3 billion, up from
$1.1 billion in 1965, an increase of 21 percent. Of this, parts and attachments
totaled $278 million, up 30 percent over 1965. Parts and attachments were
primarily intercompany shipments which will probably continue to grow as
off-shore production increases. Exports of tracklaying type tractors were
$240.5 million in 1969 followed by cranes, draglines, and shovels totaling
$195.2 million. This last category demonstrated the largest growth, increasing
37 percent from the 1965-69 period.
Inasmuch as the U.S. dominates the worldwide market for CME, imports
from other countries are very small, amounting to $97.6 million in 1969. This
is overstated because it includes not only CME but also mining machinery and

EFFECTS OF METRIC CONVERSION ON SELECTED INDUSTRIES 7!
equipment. BDC estimated CME imports in 1969 to be about $69 million, up
from $37 million in 1965.
In 1969, the U.S. trade surplus in CME amounted to $1.2 billion, up
slightly from $995.5 million in 1965. (As noted above, this is understated
because it includes imports of mining equipment as well as CME.) The U.S.
CME trade surplus was $232 million with Canada and $171 million with the
Common Market countries. In 1965-69, the CME trade surplus with the
Latin American countries increased from $163 million to $230 million. The
surplus with Asian countries, except Japan, was about $167 million in 1969,
down slightly from $173 million in 1965. (See table, p. 73.)
Measurement Factors: Measurement when related to other factors affecting
U.S. foreign trade of CME is of minor significance. Reputation, reliability,
and quality of equipment; superior technology; availability of maintenance
and servicing; vigorous export promotion programs; competitive pricing; and
good financing and insurance terms are responsible for the large U.S. trade
surplus of CME.
Deterrents to U.S. exports cited were: prices, strong local and third country
competition, high shipping costs, no quality advantage of product, high tariffs,
and no technological advantage. Rarely was the measurement system identi-
fied as either promoting or deterring U.S. foreign trade. (See table, p. 74.)
None of the 25 survey respondents designed and manufactured their equip-
ment in both metric and U.S. customary units and engineering standards.
However, seven respondents indicated they described their export shipments
in both measurement systems in their engineering drawings, catalogues, bro-
chures, etc.
Over 90 percent of the CME exports are described, designed, and manufac-
tured to U.S. customary units and engineering standards. Nearly all of the
remaining exports were designed and manufactured in U.S. customary units
and engineering standards, but were described in both measurement systems.
Only 15 percent of the exports of those respondents in the survey went to
foreign affiliates and subsidiaries and the remainder to other customers.
Only three respondents found it a hindrance to export because their equip-
ment was not designed and manufactured in metric units and engineering
standards. They reported a growing pressure from foreign customers to manu-facture their equipment in metric units and standards. None of the respond-
ents solicit export orders for equipment to be built in metric units and
standards, and only three respondents lost orders in the last 3 years because
they could not meet the metric specifications. Asked if their exports would be
adversely affected when the United Kingdom converts to the metric system, 20
respondents replied negatively, 3 affirmatively, and 2 did not know.
Although reporting that the measurement system was relatively unimportant
in foreign trade of CME, many respondents expected an increase in trade if
the U.S. were to convert to the metric system. When asked to estimate the
percentage change in their 1975 exports over 1970 assuming the U.S. main-
tained its current measurement system, over half the respondents stated there

72 INTERNATIONAL TRADE
would be no change. Sixteen percent estimated an increase and 32 percent
anticipated a decline.
Half the respondents estimated no change and half an increase in their
1975 exports over 1970, assuming the U.S. had converted to the metric
system. None estimated a decline in exports, in contrast to the 32 percent
estimating a decline assuming the U.S. had not converted to the metric system.
However, nearly all of those respondents anticipating an increase from con-
version to the metric system had relatively small exports except for one large
exporter.
Respondents' Estimated Percentage Change in Export Shipmentsin 1975 Compared with 1970 Using Two Assumptions*
Estimated percentage change
-25.1 -10.0 -0.1 No 0.1 to 10.0 to 25.0
and to to change 9.9 24.9 and
over -24.9 -9.9 over
Assumption 3A 5 2 1 13 0 1 3
Assumption 3B 0 0 0 13 3 3 6
* Assumptions:
(1) The 8 percent annual growth rate in Free World International trade for the last 6
years will continue for the period 1970-75.
(2) United Kingdom, Canada, Australia, and New Zealand have substantially completed
conversion to the metric measurement system by 1970.
(3) Estimate based on current 1970 dollars.
(A) The United States and your company will continue to use the current customary
measurement units and /or engineering standards (this assumes that among all major
industrialized countries only the U.S. will not have converted).
(B) The United States and your company had converted to the metric measurement
units and /oi engineering standards by 1970. (This assumes there would be no changes
in the cost of producing the subject product in metric units and /or engineering stand-
ards.)

EFFECTS OF METRIC CONVERSION ON SELECTED INDUSTRIES
onnoON oo oo
IT) t~- t~~ ~O vo Os c*ir- «s fS fs*- r-
fS (N «->
r-noOn
nC^OCN
ON ONON ONON ON
NO NOON ON
00 (N 00 Ttno' v! on— m <N <N
NO
On r—' p-' 3ON <N — NO
V-l t/*N
ON ONON ON
N S\ N—< C*l NO
ONsDON
00 fN ON 00
O oo oo no'
co
uu o>v.^
-=• ~o cE.9-E a
«n >«
« "9TJ C
oQ
NOnDON
ONNOON
o ©
ON ON
On On
NO r-; O ON
no «"> rn vi
O ON t-; 00
U1 OO N 00
~- "/I © ON
On Wi Ono r~ O On
r»l ON nO_ On—i -<t oo OnO cn m <N
M N M
coax p p
00 00O p.
oo oo
o o
00 i-H «1
no' >n oo' oor*N rs m— NO
h oo in q--' w-i on ©(N m »—i cn— NO
O ONO
— on r- oo
c-i On on no
— NO
sao
•acas
E o
ilII
ori
3m 60C C
12w 4> S m1c u 3 S o
S a ==
D 5 <m Tt IT)

74 INTERNATIONAL TRADE
Factors Affecting U.S. Exports of Construction Machineryand Equipment
PromotingPercent of
total
ranking
1. Reputation and reliability of product
2. Superior technology
3. Higher quality products
4. Product maintenance and servicing is available
5. Vigorous company export promotion program
6. Products are designed and manufactured in U.S. customary units and
engineering standards
7. Products are designed and manufactured in metric units and engineering
standards
8. All others
Total
Deterring
1. Prices are not competitive
2. Non-tariff barriers,
3. High shipping costs
4. No quality advantage of product
5. High tariff duties ,
6. Products are designed and manufactured in U.S. customary measurement
units and standards
7. Products are designed and manufactured in metric units and engineering
standards
8. All others
Total
22.7
19.3
16.3
11.6
9.9
20.2
100.0
23.6
22.2
16.5
9.3
9.0
5.1
14.3
100.0

Appendix A
OBJECTIVES AND METHODOLOGY OF STUDY
Public Law 90-742, dated August 8, 1968, authorizes the Secretary of
Commerce to undertake a study to determine the effect on the United States
of increased worldwide use of the metric system. Pertinent to the report is
section 2 of the Law which states ".. . the Secretary, among other things,
shall— (1) investigate and appraise the advantages and disadvantages to the
United States in international trade and commerce, . . . of an internationally
standardized system of weights and measures."
The Secretary of Commerce delegated to the National Bureau of Standards
(NBS) authority to prepare the Study. The Metric Study will consist of 14
major investigative components, each dealing with a specific area. Findings of
these individual studies will be incorporated into the Metric Study to be
submitted by the Secretary of Commerce to the United States Congress.
One major investigative component of the Metric Study has as its objective:
"to evaluate the potential effects that U.S. conversion to metric measurements
and standards may have on U.S. foreign trade." In May 1970, the NBSengaged the Business and Defense Services Administration (BDSA), now the
Bureau of Domestic Commerce (BDC), to undertake this part of the Metric
Study.
Accordingly, BDC conducted a survey of exporters and importers of com-
modities which would be affected by a conversion to the metric system. Thesurvey consisted of four phases: (1) selection of the five-digit Standard
Industrial Classification (SIC) product classes to be studied; (2) selection of
firms to be surveyed; (3) preparation, mailing, followup, editing, and tabula-
tion of questionnaires; and (4) analysis of data and writing of report.
Selection of Product Classes: The Survey was restricted to those product
classes (five-digit SIC) which were identified as being measurement sensitive.
These are product classes where physical changes to commodities would most
likely occur because of changes to metric measurements and engineering
standards. If physical changes to products were not likely to occur because of
conversion, or if the product would remain the same except for labeling or
packaging in metric units, it was assumed that there would be no impact on
foreign trade. These product classes were excluded from the survey.
In selecting the product classes it was further assumed that the existing U.S.
customary measurement system and engineering standards would ultimately
change to new metric measurements and engineering standards. Thus, physical
changes would occur in those products currently designed and manufactured
in accordance with U.S. engineering standards. Included would be: (1)
finished products currently manufactured in U.S. engineering standards; (2)
intermediate products which are standard parts and components; and (3)
finished products, not produced to any standards, but which must be rede-
signed to accommodate standard parts and components designed and manu-
factured in metric units and standards.
75

76 INTERNATIONAL TRADE
Certain exceptions were made to the criteria used to identify measurement
sensitive product classes. For example, products were not included in the
survey ( 1 ) when U.S. engineering standards are currently used worldwide and
it would be unrealistic to change them; e.g., locomotive and railroad equip-
ment and oil field machinery; and (2) when products are exported and
imported to certain specifications or job orders, such as steam, gas, and
hydraulic turbine generators.
Because of budget restrictions, product classes identified as measurement
sensitive which had trade volume of less than $10 million were not surveyed.
This reduced the number of product classes surveyed for exports by 54 and
for imports, 52. The 1969 trade volume in the export product classes not
surveyed amounted to $244.2 million, which was only 1.8 percent of the total
trade for all export product classes identified as being measurement sensitive.
The 1969 trade volume for import product classes not surveyed was $134.3
million, or 2.2 percent of all import product classes classified as measurement
sensitive.
An important assumption underlying the survey was that no price changes
would result from additional costs of metric conversion. Implicit in this
assumption is that competitive relationships, insofar as price is concerned,
between domestic and foreign producers will remain unchanged. It was impos-
sible to identify those product classes, if any, which might experience
increased costs owing to metric conversion.
Using these criteria and assumptions, the 1,166 five-digit SIC product
classes were reviewed to identify those which were measurement sensitive and
188 were selected for exports and 155 for imports. Most of the selected
product classes fall within four major SIC groupings: nonelectrical machinery,
electrical equipment and supplies, transportation equipment, and instruments
and related products. See page 86 for a list of product classes identified as
meeting the criteria for inclusion in the survey.
Selection of Survey Panel: The American Industrial Trader's Index (AITI)
was used to select firms. The AITI is a computerized compilation of U.S.
exporting and importing firms registered with the Department of Commerce.The list provides names and addresses as well as a substantial amount of
information on each firm, including product classes each firm exports and
imports.
An effort to stratify the survey panel by firm size was unsuccessful because
the number of small firms engaged in foreign trade is insufficient. The bulk of
foreign trade is carried on by a small number of large firms. One source
estimates that 50 percent of U.S. exports are shipped by 93 large firms.
The Panel selected for the survey was not a scientific or probability sample
of the total trade in each product class identified as being measurement
sensitive. Though the AITI identifies product classes in which many firms
export and import, it does not provide information on a firm's trade volume in
each product class which is necessary to draw a representative sample for the
survey. Instead, the number of respondents selected for each product class was
based on the total trade volume of the product class. The larger the product
class trade volume, the larger the number of firms selected for the panel. For
APPENDIX A 77
each product class having a trade volume of $10 million to $49.9 million, five
firms were drawn; for product classes with trade volume of $50.0 million to
$99.9 million, seven firms were drawn; and for product classes with a trade
volume of $100.0 million and over, 10 firms were chosen.
The survey panel comprised 510 firms. Most firms were asked to report for
more than one product class. The response to this voluntary survey was
exceptionally high. Nearly 74 percent of the firms canvassed reported. About
45 percent of the total 1969 export volume of the product classes identified as
measurement sensitive was covered in the survey. For imports the percentage
was nearly 37.
The Survey Questionnaire: Separate questionnaires were designed for
exporters and importers. The questionnaires collected three broad classes of
information: (1) general information about the firm's foreign trade opera-
tions; (2) information about those factors which affect the respondents' trade;
and (3) projections of the respondents' trade to 1975. See pp. 78 to 85 for
copies of questionnaires.
Information sought included not only the magnitude of respondents' trade
for the years 1967-69, but also data on shipments from/imports to foreign
affiliates and other customers. Trade data were also collected on respondents'
shipments/imports by measurement system. Besides determining the quantity
of trade which was shipped/imported in U.S. customary measurements, data
were also gathered on that trade which was shipped/imported in metric units
and engineering standards. The respondent was also asked to rank the five
most important factors either promoting or deterring foreign trade with the
nine countries which are the most important U.S. trading partners.
About 12 or 14 factors were listed from which the respondent ranked the
five most important including measurement, both metric and U.S. custom-
ary. This information was required to obtain some notion of how important
the measurement factor is in relation to other factors affecting the respond-
ent's trade.
The third category of information collected was the respondent's estimate of
the percentage change in his 1975 exports/imports over 1970 based on two
assumptions: (1) the U.S. and his firm maintained the current measurement
system; and (2) the U.S. and his firm converted to the metric system. (See
the questionnaires for other assumptions.) The rationale underlying these
estimates was to hold all factors constant except the measurement system
factor. The net difference between the two estimates would provide data as to
which measurement system would yield the larger trade surplus, if any, for the
U.S.
The Final Report: The fourth and final phase of the study involves the
analysis of the data collected and the preparation of a final report for incorpo-
ration into the Secretary of Commerce's report to the U.S. Congress.
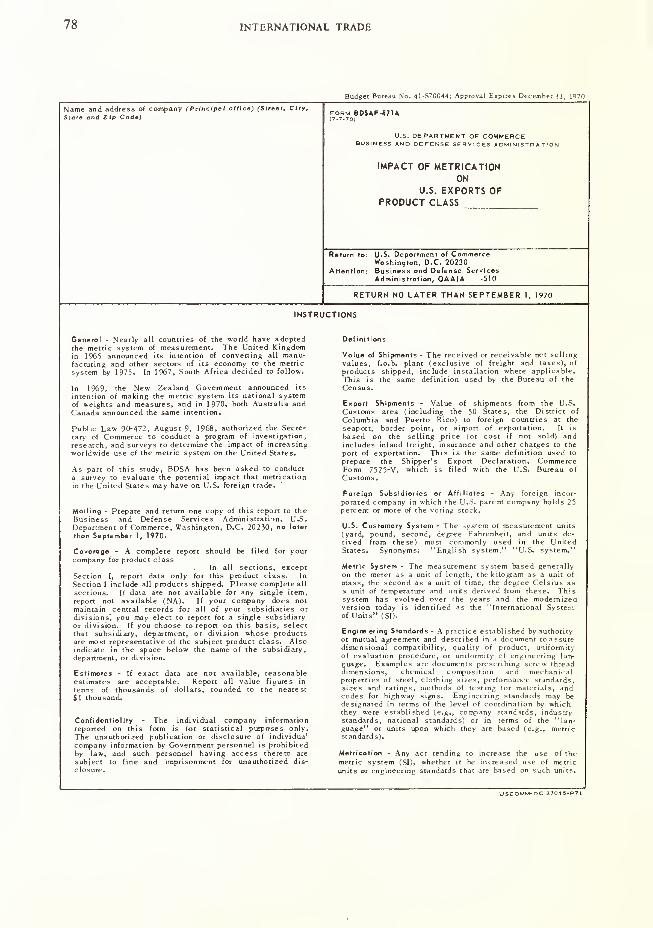
78 INTERNATIONAL TRADE
Budget Bureau No. 41-S70044; Approval Expires December 31, 1970
Name and address of company (Principal office) (Street, City,form BDSAF-671
A
State end Zip Code) (7-7-701
U.S. DEPARTMENT OF COMMERCEBUSINESS AND DEFENSE SERVICES ADMINISTRATION
IMPACT OF METRICATIONON
U.S. EXPORTS OFPRODUCT CI A«
Return to: U.S. Deportment of CommerceWoshington, O.C. 20230
Attention: Business and Defense Services
Administration, OAAIA -510
RETURN NO LATER THAN SEPTEMBER 1, 1970
INSTRUCTIONS
General - Nearly all countries of the world have adoptedthe metric system of measurement. The United Kingdomin 1965 announced its intention of converting all manu-facturing and other sectors of its economy to the metric
system by 1975. In 1967, South Africa decided to follow.
In 1969, the New Zealand Government announced its
intention of making the metric system its national systemof weights and measures, and in 1970, both Australia andCanada announced the same intention.
Public Law 90-472, August 9, 1968, authorized the Secre-
tary of Commerce to conduct a program of investigation,
research, and surveys to determine the impact of increasingworldwide use cf the metric system on the United States.
As part of this study, BDSA has been asked to conducta survey to evaluate the potential impact that metrication
in the United States may have on U.S. foreign trade.
Moiling - Prepare and return one copy of this report to the
Business and Defense Services Administration, U.S.Department of Commerce, Washington, D.C. 20230, no later
than September 1, 1970.
Coverage - A complete report should be filed for yourcompany for product class
In all sections, exceptSection I, report data only for this product class. In
Section I include all products shipped. Please complete all
sections. If data are not available for any single item,
report not available (NA). If your company does not
maintain central records for all of your subsidiaries or
divisions', you may elect to report for a single subsidiaryor division. If you choose to report on this basis, selectthat subsidiary, department, or division whose productsare most representative of the subject product class. Alsoindicate in the space below the name of the subsidiary,department, or division.
Estimates - If exact data are not available, reasonableest i mates are acceptable. Report all value figure s in
terms of thousands of dollars, rounded to the neare st
$1 thousand.
Confidentiality - The individual company information
reported on this form is for statistical purposes only.
The unauthori zed publ i cat ion or disclosure of individua"
company information by Government personnel is prohibited
by law, and such personnel having access thereto are
subject to fine and imprisonment for unauthorized dis-
c losure.
Definitions
Value of Shipments - The received or receivable net selling
values, f.o.b. plant (exclusive of freight and taxes), of
products shipped, include installation where applicable.
This is the same definition used by the Bureau of the
Census.
Export Shipments - Value of shipments from the U.S.Customs area (including the 50 States, the District of
Columbia and Puerto Rico) to foreign countries at the
seaport, border point, or airport of exportation. It is
based on the selling price (or cost if not sold) andincludes inland freight, insurance and other charges to the
port of exportation. This is the same definition used to
prepare the Shipper's Export Declaration, CommerceForm 7525-V, which is filed with the U.S. Bureau of
Customs.
Foreign Subsidiaries or Affiliates - Any foreign incor-
porated company in which the U.S. parent company holds 25percent or more of the voting stock.
U.S. Customary System - The sysrem of measurement units
(yard, pound, second, degree Fahrenheit, and units de-rived from the se) most commonl y used in the UnitedStates. Synonyms: "English sy stem "U.S. system."
Metric System - The measurement system based generallyon the meter as a unit of length, the kilogram as a unit of
mass, the second as a unit of time, the degree Celsius asa unit of temperature and units derived from these. Thissystem has evolved over the years and the modernizedversion today is identified as the "International Systemof Units" (SI).
Engine ering Standards - A practice e stabl i shed by authority
or mutual agreement and described in a document to assuredimen sional compatibil ity, qua 1 it y of product, uniform it yof evaluation procedure, or uniformity of engineering lan-
guage. Examples are documents prescribing screw threaddimensions, chemical composition and mechanicalproperties of steel, clothing sizes, performance standards,sizes and ratings, methods of testing for materials, andcodes for highway signs. Engineering standards may bedesignated in terms of the level of coordination by whichthey were established (e.g., company standards, industrystandards, national standards) or in terms of the "lan-guage" or units upon which they are based (e.g., metricstandards).
Metri cation - Any act tend in g to increase the use of the
metric system (SI), whether it he increased use of metric
units or engineering standards that are based on such units.
USCOMM-DC 37015-P71

APPENDIX A 79
Section I - 1969 TOTAL SHIPMENTS - DOMESTIC AND FOR EXPORT
Item Value (S000)
Total Shipments, oil products
1. Do nestic shipments
2. Export shipments
Section II - PRODUCT CLASS SHIPMENTS - DOMESTIC AND FOR EXPORT
Item
Totol shipments, product class
1. Domestic shipments ,
2. Export shipments by customer, total
a. To foreign affiliates
1. For further processing or assembly
2. For resale without further manufacturing
3. Other
b. To other foreign customers,
3. Export shipments by system of measurement, total (estimates are acceptable):
a. Value of exports designed, assembled, manufactured, and described in U.S. customary
units and engineering standards
b. Value of exports designed and manufactured in U.S. customary units and engineering
standards but described in labels, packages, engineering drawings or catalogues in
metric units. Descriptions in dual dimensions would be included
c. Value of exports designed and manufactured in U.S. customary units and engineering
standards but which have been substantially modified or changed to include standard
parts, compone nts , or subassemblies designed and manufactured in metric units and
engineering standards
d. Value of exports designed, assembled, manufactured, and described in metric units
and engineering standards
Value ($000)
1967 1968 1969
Section III - MAJOR FACTORS CURRENTLY INFLUENCING EXPORT SHIPMENTS OF SUBJECT PRODUCT CLASS, BYFOREIGN MARKET - The purpose of this section is to determine the most important factors affecting your cur-rent trade in the subject product class by major country, particularly the relative importance of the measure mesystem (U.S. customary or metric) to all other factors.
A. For those countries to which you ore currently exporting, rank by number (1, 2, 3, etc.) the five most favorable factorsfluencing your sales.
Factors promoting your exports3c
UUnited
Kingdom
West
GermanyFrance
H
Netherlands|
J CO
c
Cu
6. Vigorous company export promotion program .
8. Products designed or manufactured in U.S.
customary units and/or engineering standards
11* Lack of local and third country competition..
12. Products designed and manufactured in metric
14* Product maintenance and servicing is
15. Others (Specify)
16.
17.
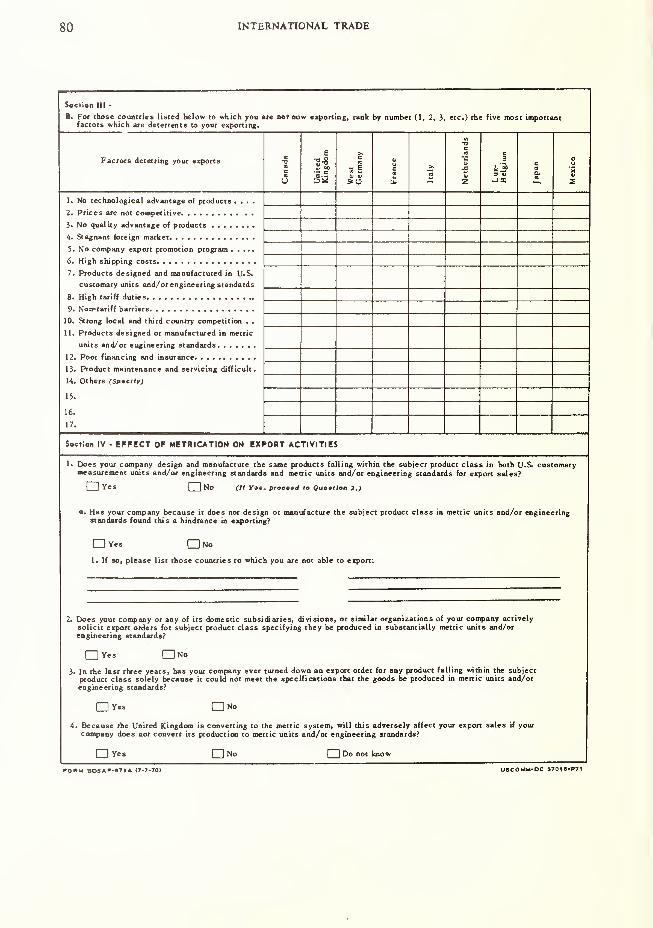
80 INTERNATIONAL TRADE
Section III •
B. For those countries listed below to which you are not now exporting, rank by number (1, 2, 3, etc.) the five most importantfactors which are deterrents to your exporting.
Factors deterring your exportsCanada
United
Kingdom
We
st GermanyFrance
Italy
Netherlands
Lux-
Belgium
Japan
M
exico
1. No technological advantage of products «...
7. Products designed and manufactured in U.S.
customary units and/or engineering standards
10. Strong local and third country competition . •
11. Products designed or manufactured in metric
13. Product maintenance and servicing difficult.
14. Others (Spicily)
15.
16.
17.
Section IV - EFFECT OF METRICATION ON EXPORT ACTIVITIES
1. Does your company design and manufacture the same products falling within the subject product class in both U.S. customarymeasurement units and/or engineering standards and metric units and/or engineering standards for export sales?
I I Yes £3] No (II Yae. prociad to Qutmlion 2.)
«. Has your company because it does not design or manufacture the subject product class in metric units and/or engineeringstandards found this a hindrance in exporting?
Yes No
1. If so, please list those countries to which you are not able to export:
2. Does your company or any of its domestic subsidiaries, divisions, or similar organizations of your company actively
solicit export orders for subject product class specifying they be produced in substantially metric units and/orengineering standards?
Yes CUNo
3. In the last three years, has your company ever turned down an expect order for any product falling within the subject
product class solely because it could not meet the specifications that the goods be produced in metric units and/orengineering standards?
Yes No
4. Because the United Kingdom is converting to the metric system, will this adversely affect your export sales if your
company does not convert its production to metric units and/or engineering standards?
I I Yes No CH Do not know
FORM BOSAF-S7IA (7-7-70) USCOMM-OC 37010-P7I
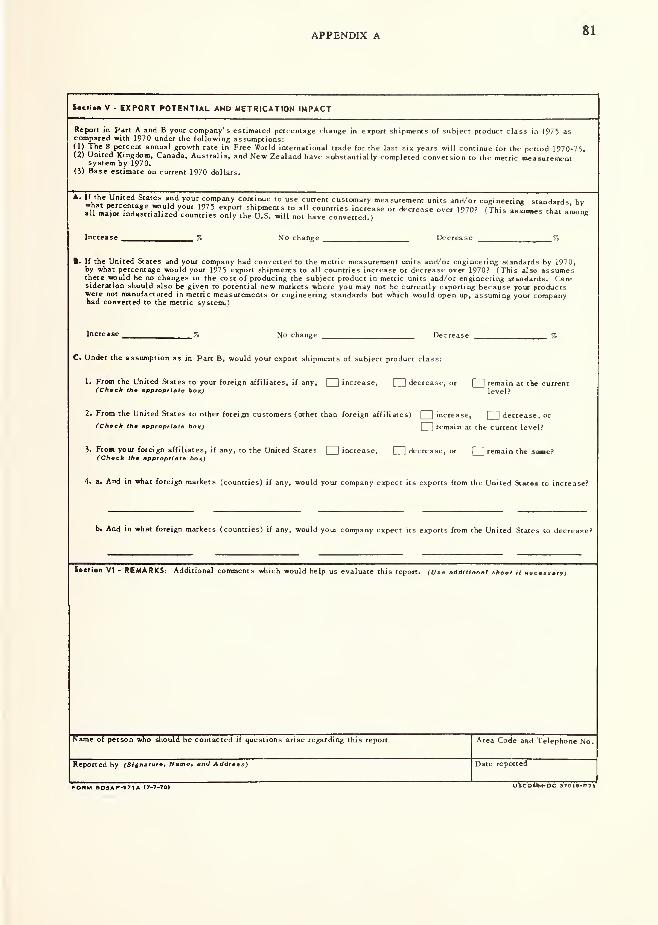
APPENDIX A 81
S«cti«n V - EXPORT POTENTIAL AND METRICATION IMPACT
Report in Part A and B your company's estimated percentage change in export shipments of subject product class in 1975 ascompared with 1970 under the following assumptions:f 1) The 8 percent annual growth rate in Free World international trade for the last six years will continue for the period 1970-75.(2) United Kingdom, Canada, Australia, and New Zealand have substantially completed conversion to the metric measurement
system by 1970.(3) Base estimate on current 1970 dollars.
A. If the United States and your company continue to use current customary measurement units and/or engineering standards bvwhat percentage would your 1975 export shipments to all countries increase or decrease over 1970? (This assumes that anon*all major industrialized countries only the U.S. will not have converted.)assumes tfcat among
Increase % No change Decrease %
ft* If the United States and your company had concerted to the metric measurement units and/or engineering standards by 1970,by what percentage would your 1975 export shipments to all countries increase or decrease over 1970? (This also assumesthere would be no changes in the cost of producing the subject product in metric units and/or engineering standards. Con-sideration should also be given to potential new markets where you may not be currently exporting because your productswere not manufactured in metric measurements or engineering standards but which would open up, assuming your companyhad converted to the metric system.)
Increase _% No change Decrease %
C. Under the assumption as in Part B, would your export shipments of subject product class:
1. From the United States to your foreign affiliates, if any,| ]
increase, decrease, or remain at the current(Check the appropriate box) level?
2. From the United States to other foreign customers (other than foreign affiliates) Q^] increase, [^] decrease, or
fCkeck the appropriate box)| |
remain at the current level?
3. From your foreign affiliates, if any, to the United States increase, Q decrease, or remain the same?(Check the appropriate box)
4. a. And in what foreign markets (countries) if any, would your company expect its exports from the United States to increase?
b. And in what foreign markets (countries) if any, would your company expect its exports from the United States to decrease?
Sect i«n VI - REMARKS: Additional comments which would help us evaluate this report. (Use additional sheet it necessary)
Name of person who should be contacted if questions arise regarding this report Area Code and Telephone No.
Reported by (Signature, Name, and Address) Date reported
U^BCQMM-bC 370 15- P?1FORM BDSAF-671A l7-7-70>

INTERNATIONAL TRADE
Budgei Bureau No. 41-S70044, Approval Expires December 31 1970
Name and address of company (Principal otllce) (stroetg City,Stflo and Zip Code)
form BDSAF-67 1 B(7-7-70)
U.S. DEPARTMENT OF COMMERCEBUSINESS AND DEFENSE SERVICES ADMINISTRATION
IMPACT OF METRICATION
ON
U.S. IMPORTS OF
PRODUCT CLASS
Return to: U.S. Department of CommerceWashington, D.C. 20230
Attention: Business and Defense ServicesAdministration, OAAIA -510
RETURN NO LATER THAN SEPTEMBER 1, 1970
INSTRUCTIONS
General - Nearly all countries of the world have adoptedthe metric system of measurement. The United Kingdomin 1965 announced its intention of converting all manu-facturing and other sectors of its economy to the metricsystem by 1975. In 1967, South Africa decided to follow.
In 1969, the New Zealand Government announced its
intention of making the metric system its national systemof weights and measures, and in 1970, both Australia andCanada announced the same intention.
Public Law 90-472, August 9, 1968, authorized the Secre-tary of Commerce to conduct a program of investigation,
research, and survey to determine the impact of increasing
worldwide use of the metric system on the United States.
As part of this study, BDSA has been asked to conduct a
survey to evaluate the potential impact that metrication
in the United States may have on U.S. foreign trade.
Mailing - Prepare and return one copy of this report to the
Business and Defense Services Administration, U.S.Department of Commerce, Washington, D.C 20230, no later
than September 1, 1970.
Coverage - A complete report should be filed for yourcompany for product classIn all sections, except Section I, report data only for this
product class. In Section I include all products shipped.
Please complete all sections. If data are not available for
any single item, report not available (NA). If your companydoes not maintain central records for all of your subsidiaries
or divisions, you may elect to report for a single sub-
sidiary or division. If you choose to report on this basis,
select that subsidiary, department, or division whoseproducts are most representative of the subject product
class. Also indicate in the space below the name of the
subsidiary, department or division
Estimates - If exact data are not available, reasonableestimates are acceptable. Report all value figures in
terms of thousands of dollars, rounded to the nearest$1 thousand.
Confidential I ty - The individual company informationreported on this form is for statistical purposes only.
The unauthorized publication or disclosure of individual
company information by Government personnel is pro-
hibited by law, and such personnel having access thereto
are subject to fine and imprisonment for unauthorizeddisclosure.
Definitions
Value of Imports - The market value in the foreign country,excluding U.S. import duties, freight charges, and insur-ance, for goods com ing into the U.S. customs area (the
50 States, the District of Columbia, and Puerto Rico)without regard to whether the importation involved a
commercial transaction. This is the same value informationrequired on import entries in accordance with Sections402 and 402(A) of the Tariff Act of 1930, as amended.
Foreign Subsidiaries or Affiliates - Any foreign incorpo-rated company in which the U.S. parent company holds 25percent or more of the voting stock.
U .S. Customory System - The system of mea sure rncnt
units (yard, pound, second, degree Fahrenheit, and unitsderived from these) most commonly used in the UnitedStates. Synonyms: "English system," "U.S. system."
Metric System - The measurement system based generallyon the meter as a unit of length, the kilogram as a unit of
mass, the second as a unit of time, the degree Celsius asa unit of temperature and units derived from these. Thissystem has evolved over the years and the modern izedversion today is identified as the "International Systemof Units" (SI).
Engineering Standards - A practice established by authority
or mutual agreement and described in a document to assuredimensional coi ipat ibi lity , quality of product, uniformity
of evaluation procedure, or uniformity of engineeringlanguage. Examples are documents prescribing screwthread dimensions, chemical composition and mechanicalproperties of steel, clothing sizes, performance standards,
sizes and ratings, methods of testing for materials, andcodes for highway signs. Engineering standards may be
designated in terms of the level of coordination by whichthey were established (e.g., company standards, industry
standards, national standards) in terms of the "language"or units upon which they are based (e.g., metric standards).
Metrication - Any act tending to increase the use of the
metric system (SI), whether it be increased use of metric
units or engineering standards that are based on such units.
USCOMM-DC 370I4-P71
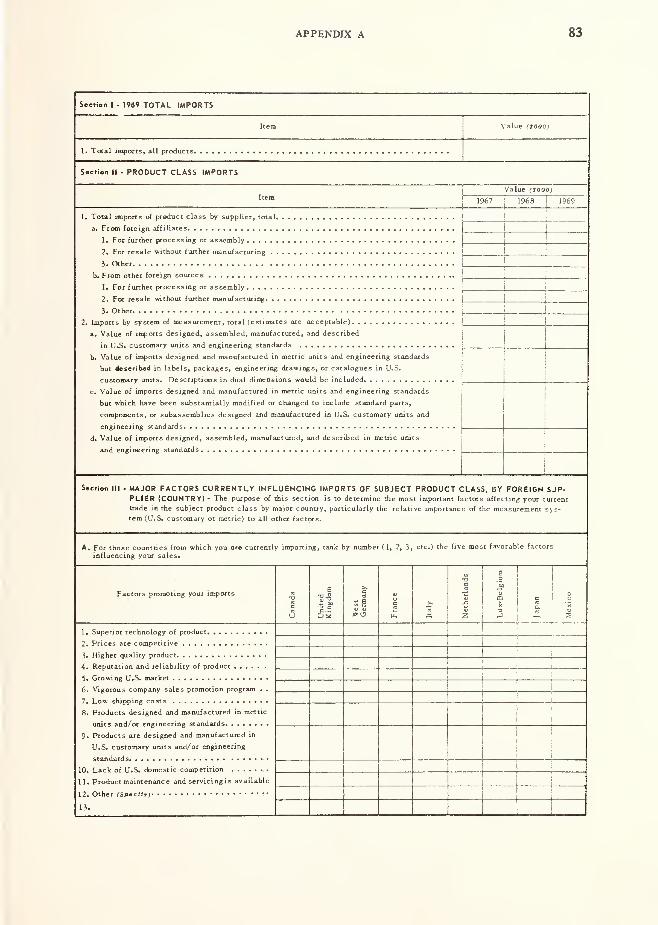
APPENDIX A 83
Section I - 1969 TOTAL IMPORTS
1. Total imports, all products.
Section II - PRODUCT CLASS IMPORTS
ItemValue ($000)
1967|
1968|
1969
1. Total imports of product class by supplier, total.
a. From foreign affiliates [_
1. Foe further processing or assembly|_
2. For resale without further manufacturing '
3. Other I
b. From other foreign sources >
1. For further processing or assembly
2. For resale without further manufacturing I
3. Other I
2. Imports by system of measurement, total (estimates are acceptable) [_
a. Value of imports designed, assembled, manufactured, and described
in U.S. customary units and engineering standards !
b. Value of imports designed and manufactured in metric units and engineering standards
but described in labels, packages, engineering drawings, or catalogues in U.S.
customary units. Descriptions in dual dimensions would be includedj_
c. Value of imports designed and manufactured in metric units and engineering standards
but which have been substantially modified or changed to include standard parts,
components, or subassemblies designed and manufactured in U.S. customary units and
engineering standards Ld. Value of imports designed, assembled, manufactured, and described in metric unics
and engineering standards !
Section Ml . MAJOR FACTORS CURRENTLY INFLUENCING IMPORTS OF SUBJECT PRODUCT CLASS, BY FOREIGN SUP-PLIER (COUNTRY) - The purpose of this section is to determine the most important factors affecting your current
trade in the subject product class by major country, particularly the relative importance of the measurement sys-
tem (U.S. customary or metric) to all other factors.
A. For those countries from which you ore currently importing, rank by number (1, 2, 3, etc.) the five most favorable factors
influencing your sales.
Factors promoting your imports uc
UUnited
Kingdom
West
Germany
4J
UcCO
Italy
Netherlands
Lux-Belgium
JapanMexico
1 I
j;
1 !
6. Vigorous company sales promotion program . .
!
j
1
8. Products designed and manufactured in metric !
i !
9. Products are designed and manufactured in
U.S. customary units and/or engineeringj
i
|
i:
11. Product maintenance and servicing is available
13.
'
1 1
',
1
ff
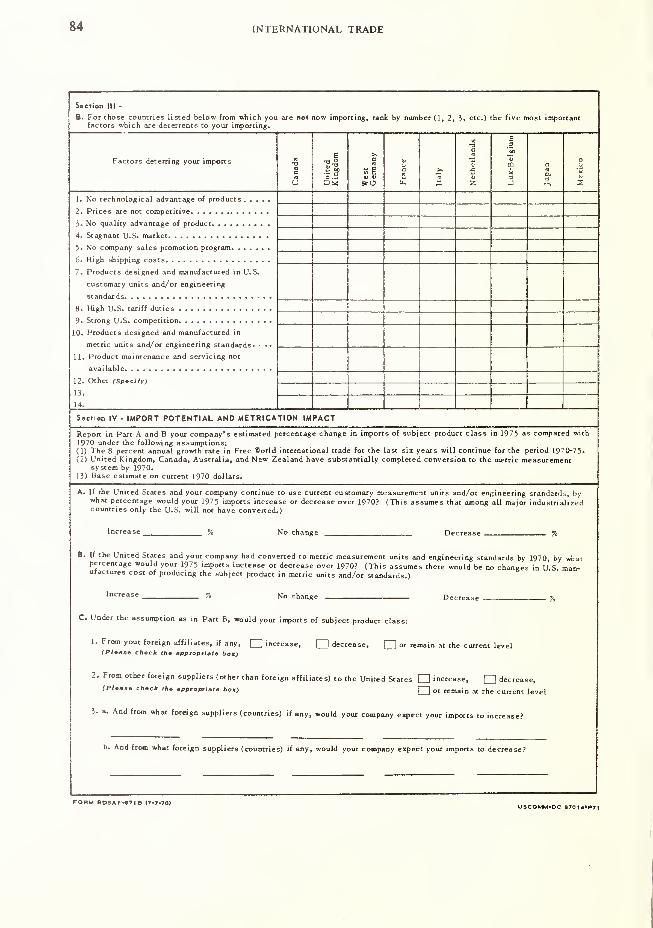
84 INTERNATIONAL TRADE
Factors deterring your importsCanada
United
Kingdom
West
Germany France
Italy
Netherlands
E.2'<£
Cj
3
a
ex
o
t>
1. No technological advantage of products. ....
7. Products designed and manufactured in U.S.
customary units and/or engineering
10. Products designed and manufactured in
metric units and/ or engineering standards- • ••
11. Product maintenance and servicing not
12. Other (Specify)
13.
1 I.
Section III -
8- For those countries listed below from which you are not now importing, rank by number (1, 2, 3i etc.) the five most importantfactors which are deterrents to your importing.
Section IV - IMPORT POTENTIAL AND METRICATION IMPACT
Report in Part A and B your company's estimated percentage change in imports of subject product class in 1975 as compared with
1970 under the following assumptions:(1) The 8 percent annual growth rate in Free World international trade for the last six years will continue for the period 1970-75-
(2) United Kingdom, Canada, Australia, and New Zealand have substantially completed conversion to the metric measurementsystem by 1970.
(3) Base estimate on current 1970 dollars.
A. If the United States and your company continue to use current customary measurement units and/or engineering standard.;, bywhat percentage would your 1975 imports increase or decrease over 1970? (This assumes that among all major industrializedcountries only the U.S. will not have converted.)
%
If the United States and your company had converted to metric measurement units and engineering standards by 1970, by whaipercentage would your 1975 imports increase or decrease over 1970? (This assumes there would be no change- in US man-ufactures cost of producing the subject product in metric units and/or standards.)
Increase No change Decrease
C Under the assumption as in Part B, would your imports of subject product class:
1. From your foreign affiliates, if any, increase, decrease, or remain at the current level(Pteaee check the appropriate box)
2. From other foreign suppliers (other than foreign affiliates) to the United States increase, decrease,(Please check the appropriate box) Q or remain at the current level
3- a. And from what foreign suppliers (countries) if any, would your company expect your imports to increase?
>. And from what foreign suppliers (countries) if any, would your company expect your imports to decrease?
FORM BOSAF-671B (7-7-70) USCOMM-DC 370 140P71

APPENDIX A 85
S*ctiM V • REMARKS . Additional comments which would help us evaluate this report
Area Code and "telephone No.Name of person who should be contacted if questions arise regarding this report
Reported by (Slgnmturo. N*me. mnd Addrmam) Date reported
FORM »OSAF-e7|B 17-7-70) USCOMM-OC 370I4-P7I
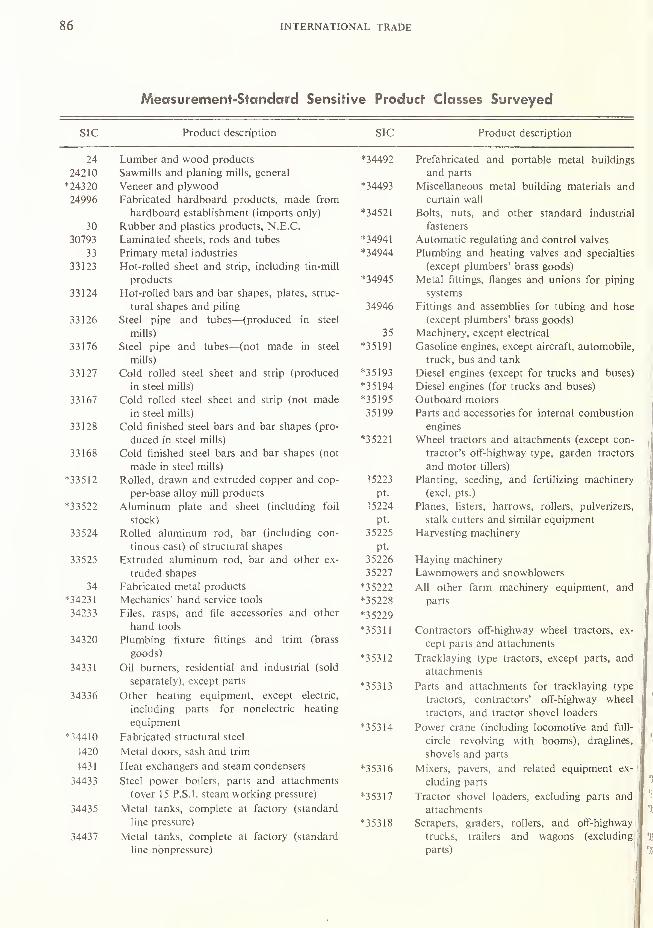
86 INTERNATIONAL TRADE
Measurement-Standard Sensitive Product Classes Surveyed
sic Product description SIC Product description
24 Lumber and wood products
24210 Sawmills and planing mills, general
*24320 Veneer and plywood
24996 Fabricated hardboard products, made from
hardboard establishment (imports only)
30 Rubber and plastics products, N.E.C.
30793 Laminated sheets, rods and tubes
33 Primary metal industries
33123 Hot-rolled sheet and strip, including tin-mill
products
33124 Hot-rolled bars and bar shapes, plates, struc-
tural shapes and piling
33126 Steel pipe and tubes—(produced in steel
mills)
33176 Steel pipe and tubes—(not made in steel
mills)
33127 Cold rolled steel sheet and strip (produced
in steel mills)
33167 Cold rolled steel sheet and strip (not madein steel mills)
33128 Cold finished steel bars and bar shapes (pro-
duced in steel mills)
33168 Cold finished steel bars and bar shapes (not
made in steel mills)
*33512 Rolled, drawn and extruded copper and cop-
per-base alloy mill products
*33522 Aluminum plate and sheet (including foil
stock)
33524 Rolled aluminum rod, bar (including con-
tinous cast) of structural shapes
33525 Extruded aluminum rod, bar and other ex-
truded shapes
34 Fabricated metal products
*34231 Mechanics' hand service tools
34233 Files, rasps, and file accessories and other
hand tools
34320 Plumbing fixture fittings and trim (brass
goods)
34331 Oil burners, residential and industrial (sold
separately), except parts
34336 Other heating equipment, except electric,
including parts for nonelectric heating
equipment
*?4410 Fabricated structural steel
1420 Metal doors, sash and trim
1431 Heat exchangers and steam condensers
34433 Steel power boilers, parts and attachments
(over 15 P.S.I, steam working pressure)
34435 Metal tanks, complete at factory (standard
line pressure)
34437 Metal tanks, complete at factory (standard
line nbnpressure)
*34492 Prefabricated and portable metal buildings
and parts
*34493 Miscellaneous metal building materials and
curtain wall
*34521 Bolts, nuts, and other standard industrial
fasteners
*34941 Automatic regulating and control valves
*34944 Plumbing and heating valves and specialties
(except plumbers' brass goods)
*34945 Metal fittings, flanges and unions for piping
systems
34946 Fittings and assemblies for tubing and hose
(except plumbers' brass goods)
35 Machinery, except electrical
*35 191 Gasoline engines, except aircraft, automobile,
truck, bus and tank
*35 193 Diesel engines (except for trucks and buses)
*35 194 Diesel engines (for trucks and buses)
*35195 Outboard motors
35199 Parts and accessories for internal combustion
engines
*35221 Wheel tractors and attachments (except con-
tractor's off-highway type, garden tractors
and motor tillers)
^5223 Planting, seeding, and fertilizing machinery
pt. (excl. pts.)
?5224 Planes, listers, harrows, rollers, pulverizers,
pt. stalk cutters and similar equipment
35225 Harvesting machinery
pt.
35226 Haying machinery
35227 Lawnmowers and snowblowers
*35222 All other farm machinery equipment, and
*35228 parts
*35229
*35311 Contractors off-highway wheel tractors, ex-
cept parts and attachments
*353 12 Tracklaying type tractors, except parts, and
attachments
*35313 Parts and attachments for tracklaying type
tractors, contractors' off-highway wheel
tractors, and tractor shovel loaders
*35314 Power crane (including locomotive and full-
circle revolving with booms), draglines,
shovels and parts
*35316 Mixers, pavers, and related equipment ex-
cluding parts
*35317 Tractor shovel loaders, excluding parts and
attachments
*35318 Scrapers, graders, rollers, and off-highway
trucks, trailers and wagons (excluding
parts)
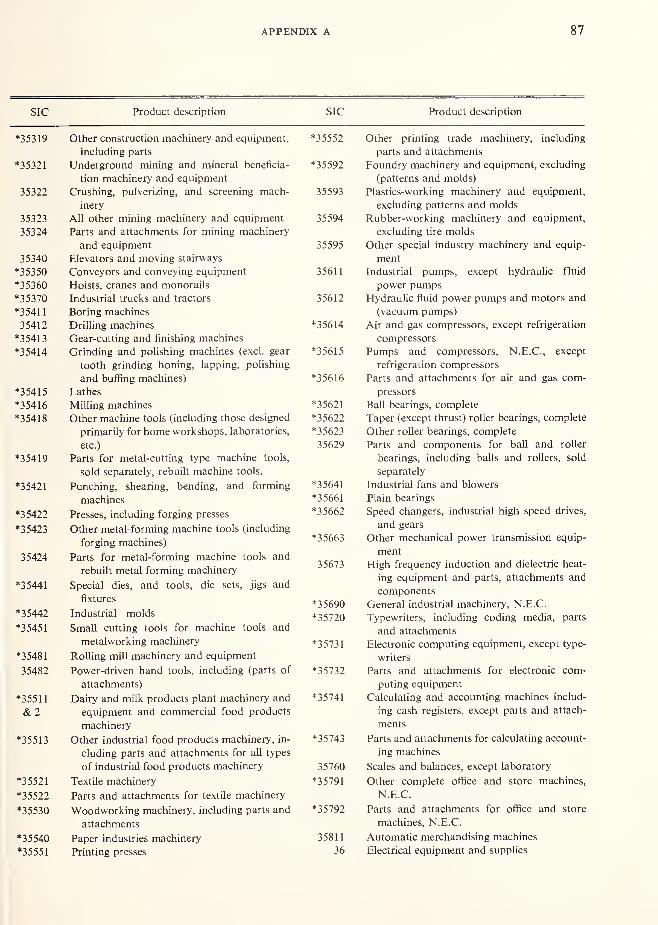
APPENDIX A 87
SIC Product description SIC Product description
*35319 Other construction machinery and equipment,
including parts
*35321 Underground mining and mineral beneficia-
tion machinery and equipment
35322 Crushing, pulverizing, and screening mach-
inery
35323 All other mining machinery and equipment
35324 Parts and attachments for mining machinery
and equipment
35340 Elevators and moving stairways
*35350 Conveyors and conveying equipment
*35360 Hoists, cranes and monorails
*35370 Industrial trucks and tractors
*35411 Boring machines
35412 Drilling machines
*35413 Gear-cutting and finishing machines
*35414 Grinding and polishing machines (excl. gear
tooth grinding honing, lapping, polishing
and buffing machines)
35415 Lathes
*35416 Milling machines
*35418 Other machine tools (including those designed
primarily for home workshops, laboratories,
etc.)
*35419 Parts for metal-cutting type machine tools,
sold separately, rebuilt machine tools.
*35421 Punching, shearing, bending, and forming
machines
*35422 Presses, including forging presses
*35423 Other metal-forming machine tools (including
forging machines)
35424 Parts for metal-forming machine tools and
rebuilt metal forming machinery
*35441 Special dies, and tools, die sets, jigs and
fixtures
* 3 5442 Industrial molds
*35451 Small cutting tools for machine tools and
metalworking machinery
*35481 Rolling mill machinery and equipment
35482 Power-driven hand tools, including (parts of
attachments)
*3551 1 Dairy and milk products plant machinery and
& 2 equipment and commercial food products
machinery
*35513 Other industrial food products machinery, in-
cluding parts and attachments for all types
of industrial food products machinery
*35521 Textile machinery
*35522 Parts and attachments for textile machinery
*35530 Woodworking machinery, including parts and
attachments
*35540 Paper industries machinery
*35551 Printing presses
*35552 Other printing trade machinery, including
parts and attachments
*35592 Foundry machinery and equipment, excluding
(patterns and molds)
35593 Plastics-working machinery and equipment,
excluding patterns and molds
35594 Rubber-working machinery and equipment,
excluding tire molds
35595 Other special industry machinery and equip-
ment
35611 Industrial pumps, except hydraulic fluid
power pumps35612 Hydraulic fluid power pumps and motors and
(vacuum pumps)
*35614 Air and gas compressors, except refrigeration
compressors
*35615 Pumps and compressors, N.E.C., except
refrigeration compressors
*35616 Parts and attachments for air and gas com-
pressors
*35621 Ball bearings, complete
*35622 Taper (except thrust) roller bearings, complete
*35623 Other roller bearings, complete
35629 Parts and components for ball and roller
bearings, including balls and rollers, sold
separately
*35641 Industrial fans and blowers
*35661 Plain bearings
*35662 Speed changers, industrial high speed drives,
and gears
* 3 5663 Other mechanical power transmission equip-
ment
35673 High frequency induction and dielectric heat-
ing equipment and parts, attachments and
components* 3 5690 General industrial machinery, N.E.C.
*35720 Typewriters, including coding media, parts
and attachments
*35731 Electronic computing equipment, except type-
writers
*35732 Parts and attachments for electronic com-
puting equipment
*35741 Calculating and accounting machines includ-
ing cash registers, except paits and attach-
ments
*35743 Parts and attachments for calculating account-
ing machines
35760 Scales and balances, except laboratory
*35791 Other complete office and store machines,
N.E.C.
*35792 Parts and attachments for office and store
machines, N.E.C.
35811 Automatic merchandising machines
36 Electrical equipment and supplies
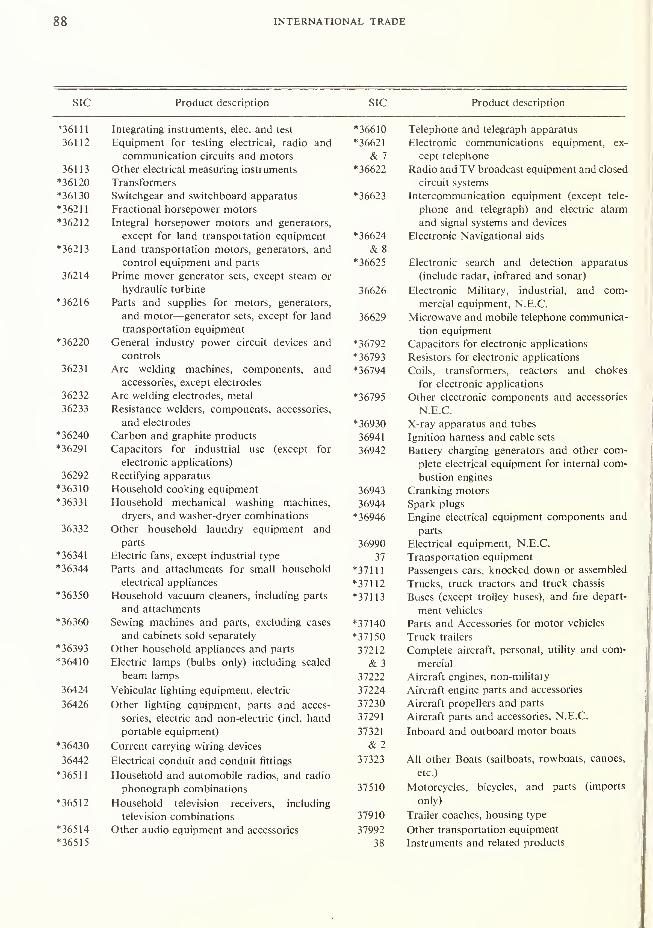
68 INTERNATIONAL TRADE
SIC Product description SIC Product description
'36111 Integrating instruments, elec. and test
36112 Equipment for testing electrical, radio and
communication circuits and motors
36113 Other electrical measuring instruments
*36120 Transformers
*361 30 Switchgear and switchboard apparatus
* 362 11 Fractional horsepower motors
*36212 Integral horsepower motors and generators,
except for land transpoitation equipment
*36213 Land transportation motors, generators, and
control equipment and parts
36214 Prime mover generator sets, except steam or
hydraulic turbine
*36216 Parts and supplies for motors, generators,
and motor—generator sets, except for land
transportation equipment* 36220 General industry power circuit devices and
controls
36231 Arc welding machines, components, and
accessories, except electrodes
36232 Arc welding electrodes, metal
36233 Resistance welders, components, accessories,
and electrodes
* 36240 Carbon and graphite products
*36291 Capacitors for industrial use (except for
electronic applications)
36292 Rectifying apparatus
*363 10 Household cooking equipment
*36331 Household mechanical washing machines,
dryers, and washer-dryer combinations
36332 Other household laundry equipment and
parts
*36341 Electric fans, except industrial type
*36344 Parts and attachments for small household
electrical appliances
*36350 Household vacuum cleaners, including parts
and attachments
*36360 Sewing machines and parts, excluding cases
and cabinets sold separately
*36393 Other household appliances and parts
*36410 Electric lamps (bulbs only) including sealed
beam lamps
36424 Vehicular lighting equipment, electric
36426 Other lighting equipment, parts and acces-
sories, electric and non-electric (incl. hand
portable equipment)
* 36430 Current carrying wiring devices
36442 Electrical conduit and conduit fittings
*36511 Household and automobile radios, and radio
phonograph combinations
* 365 1 2 Household television receivers, including
television combinations
*365 14 Other audio equipment and accessories
*36515
*36610 Telephone and telegraph apparatus
*36621 Electronic communications equipment, ex-
& 7 cept telephone
*36622 Radio and TV broadcast equipment and closed
circuit systems
*36623 Intercommunication equipment (except tele-
phone and telegraph) and electric alarm
and signal systems and devices
*36624 Electronic Navigational aids
& 8
*36625 Electronic search and detection apparatus
(include radar, infrared and sonar)
36626 Electronic Military, industrial, and com-
mercial equipment, N.E.C.
36629 Microwave and mobile telephone communica-
tion equipment
*36792 Capacitors for electronic applications
*36793 Resistors for electronic applications
* 36794 Coils, transformers, reactors and chokes
for electronic applications
*36795 Other electronic components and accessories
N.E.C.
*36930 X-ray apparatus and tubes
36941 Ignition harness and cable sets
36942 Battery charging generators and other com-
plete electrical equipment for internal com-
bustion engines
36943 Cranking motors
36944 Spark plugs
* 36946 Engine electrical equipment components and
parts
36990 Electrical equipment, N.E.C.
37 Transportation equipment
*37 111 Passengers cars, knocked down or assembled
*37112 Trucks, truck tractors and truck chassis
*37113 Buses (except trolley buses), and fire depart-
ment vehicles
*37140 Parts and Accessories for motor vehicles
* 37 150 Truck trailers
37212 Complete aircraft, personal, utility and com-
& 3 mercial
37222 Aircraft engines, non-military
37224 Aircraft engine parts and accessories
37230 Aircraft propellers and parts
37291 Aircraft parts and accessories, N.E.C.
37321 Inboard and outboard motor boats
& 2
37323 All other Boats (sailboats, rowboats, canoes,
etc.)
37510 Motorcycles, bicycles, and parts (imports
only)
37910 Trailer coaches, housing type
37992 Other transportation equipment
38 Instruments and related products

APPENDIX A 89
SIC Product description SIC Product description
*38111 Aeronautical nautical and navigational in-
struments and automatic pilots
*381 12 Laboratory and scientific instruments
*381 13 Surveying and drafting instruments and
laboratory furniture
*38211 Aircraft engine instruments, except flight
*38214 Motor vehicle instruments, except electric
*38216 Other mechanical measuring and controlling
instruments
*38220 Automatic temperature controls and industrial
& process instruments
38213
*38311 Optical instruments and lenses
*38410 Surgical and medical instruments and ap-
paratus
*Denotes import category surveyed

Appendix B
STATISTICAL TABLES
Page
Table 1. U.S. Merchandise Trade Balance and Balance
of Payments 91
Table 2. U.S. Exports and Imports of Selected Categories
of Merchandise 92
Table 3. U.S. Exports of Selected Categories
of Merchandise 93
Table 4. U.S. Exports of Merchandise by Country 94
Table 5. Total U.S. Exports and Exports Financed by
Military and Economic Aid 94
Table 6. U.S. General Imports of Merchandise 95
Table 7. U.S. General Imports of Selected Categories of
Manufactured Goods 95
Table 8. U.S. General Imports of Merchandise by
Country or Area of Origin 96
Table 9. U.S. Foreign Trade Balance for Measurement-Standard
Sensitive Products 97
Table 10. U.S. Export Summary of Measurement-Standard
Sensitive Products 97
Table 11. U.S. Import Summary of Measurement-Standard
Sensitive Products 99
Table 12. U.S. Exports of Measurement-Standard
Sensitive Product Classes 101
Table 13. U.S. Imports of Measurement-Standard
Sensitive Product Classes 149
90

APPENDIX B 91
Table 1. U.S. Merchandise Trade Balance and Balance of
Payments (Liquidity Basis), 1950-69, in Billions of Dollars
(— Indicates Deficit)
Balance of
payments
1950.
1951.
1952.
1953.
1954.
1955.
1956.
1957.
1958.
1959.
1960.
1961.
1962.
1963.
1964.
1965.
1966.
1967.
1968.
1969.
-3.5
-0.0'
-1.2
-2.2
-1.5
-1.2
-1.0
0.6
-3.4
-3.9
-3.9
-2.4
-2.2
-2.7
-2.8
-1.3
-1.4
-3.5
0.2
-7.0
1 Deficit of $8 million.
Source: 1970 Economic Report of the President, pp. 276-7; Survey of Current Business
March 1970, p. 27.

INTERNATIONAL TRADE
o
,03 O
i_
B -aS3 C£ *
2? «
S o>u -o
o
. o
(L)~0
X) c
— 0O w> fS
!/-> NO I—
^ ^ 0\ N O
Ov in —no so r— oo on
ra Tt oo no ©
%t (<1 M«J Of t v~,
* t» * o >tf
tn ti in ^ ^3
r- o\ Om m
O no r- ^ m^- ^ ^ in
O n ^ O NO NO 00
NO 00 r*l v>
fS (N fl Tt" NO
Tt (N 00 0O 0O
ON ON Tj- 00
m ci r*i m tJ-
On OTf •<t' U-l
u") t~- <N NO
r**l f*l Tj"
>/-) fs r— no tt
in •* * t
O - (N ^ in NO 00 OnnOnOnOnOnO \OnOnOnOnOOn On On On On On On On On On
u
a a.5 o.
B ."2
cd CT3
d £
o3 uc c
E S
a' ^
.5 3 *>c
— — <J03 03 cj
0 O 3H H O
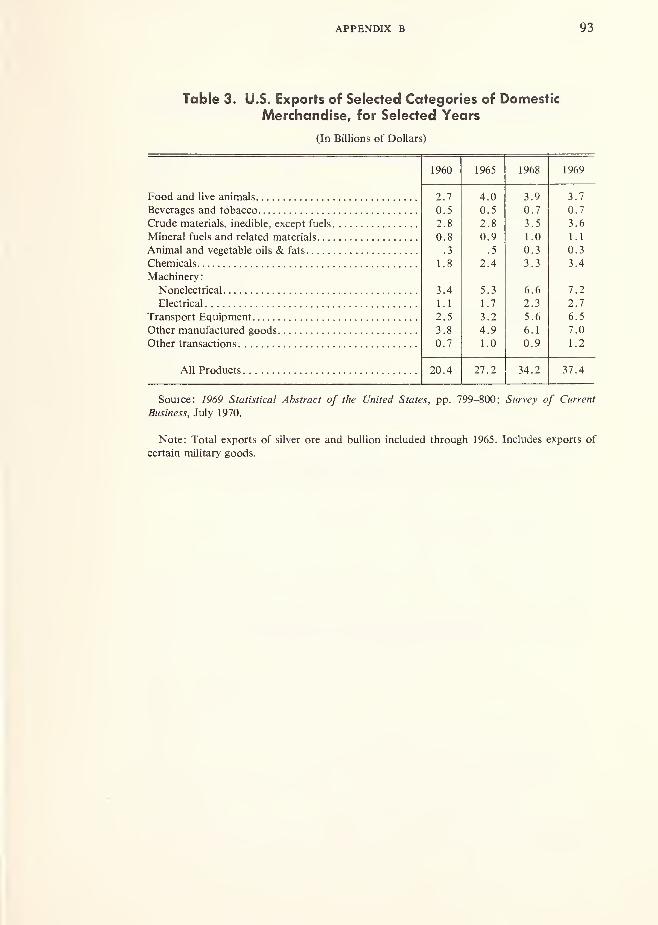
APPENDIX B 93
Table 3. U.S. Exports of Selected Categories of Domestic
Merchandise, for Selected Years
(In Billions of Dollars)
1 qahlyou 1 OAS 1 Q£S1 yOo 1 QfiQ
Food and live animals 2.7 4.0 3.9 3.7
Beverages and tobacco 0.5 0.5 0.7 0.7
Crude materials, inedible, except fuels 2.8 2.8 3.5 3.6
Mineral fuels and related materials 0.8 0.9 1.0 1.1
.3 .5 0.3 0.3
1.8 2.4 3.3 3.4
Machinery:
3.4 5.3 6.6 7.2
Electrical 1.1 1.7 2.3 2.7
Transport Equipment 2.5 3.2 5.6 6.5
Other manufactured goods 3.8 4.9 6.1 7.0
Other transactions 0.7 1.0 0.9 1.2
AH Products 20.4 27.2 34.2 37.4
Source: 1969 Statistical Abstract of the United States, pp. 799-800; Survey of Current
Business, July 1970.
Note: Total exports of silver ore and bullion included through 1965. Includes exports of
certain military goods.
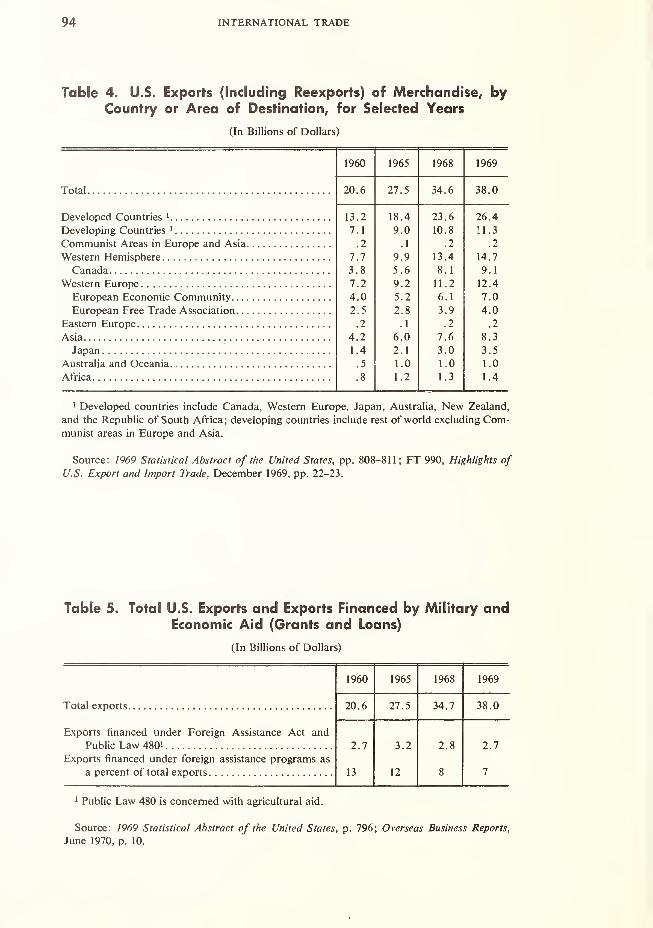
94 INTERNATIONAL TRADE
Table 4. U.S. Exports (Including Reexports) of Merchandise, byCountry or Area of Destination, for Selected Years
(In Billions of Dollars)
Total
1960 1965 1968 1969
20.6 27.5 34.6 38.0
Developed Countries 1 13.2 18.4 23.6 26.4
Developing Countries 1 7.1 9.0 10.8 11.3
f^nmmunist Areas in Purone anH Asia .2 . 1 .2 .2
7.7 9.9 13.4 14.7
3.8 5.6 8.1 9.1
7.2 9.2 11.2 12.4
European Economic Community 4.0 5.2 6.1 7.0
European Free Trade Association 2.5 2.8 3.9 4.0
Eastern Europe .2 .1 .2 .2
Asia 4.2 6.0 7.6 8.3
1.4 2.1 3.0 3.5
Australia and Oceania .5 1.0 1.0 1.0
Africa .8 1.2 1.3 1.4
1 Developed countries include Canada, Western Europe, Japan, Australia, New Zealand,
and the Republic of South Africa; developing countries include rest of world excluding Com-munist areas in Europe and Asia.
Source: 1969 Statistical Abstract of the United States, pp. 808-811; FT 990, Highlights ofU.S. Export and Import Trade, December 1969, pp. 22-23.
Table 5. Total U.S. Exports and Exports Financed by Military andEconomic Aid (Grants and Loans)
(In Billions of Dollars)
1960 1965 1968 1969
20.6 27.5 34.7 38.0
Exports financed under Foreign Assistance Act and
Public Law 480 1 2.7 3.2 2.8 2.7
Exports financed under foreign assistance programs as
a percent of total exports 13 12 8 7
Public Law 480 is concerned with agricultural aid.
Source: 7969 Statistical Abstract of the United States, p. 796; Overseas Business Reports,
June 1970, p. 10.
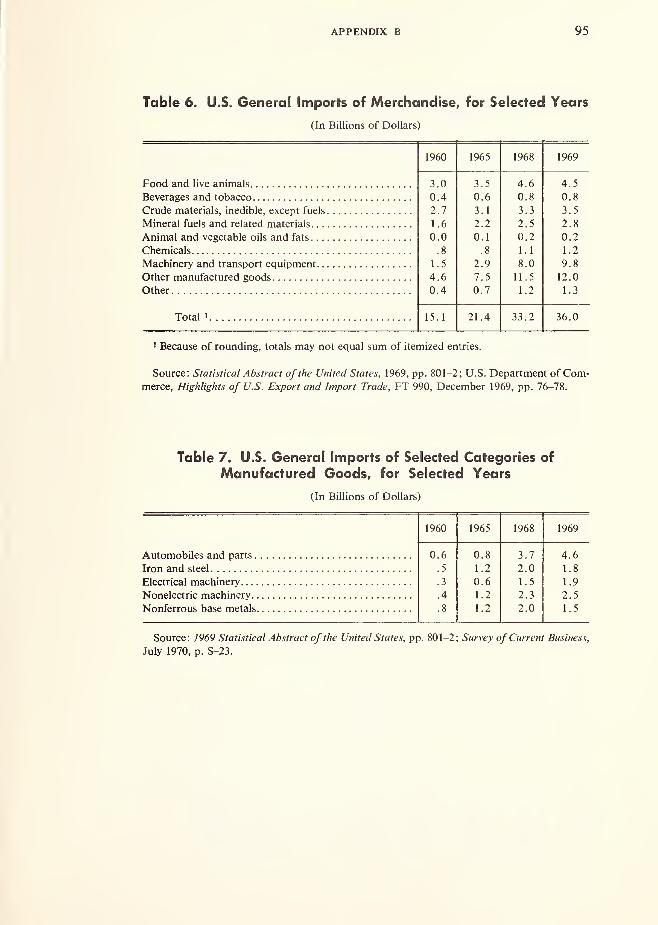
APPENDIX B 95
Table 6. U.S. General Imports of Merchandise, for Selected Years
(In Billions of Dollars)
1960 1965 1968 1969
Food and live animals 3.0 3.5 4.6 4.5
Beverages and tobacco 0.4 0.6 0.8 0.8
Crude materials, inedible, except fuels 2.7 3.1 3.3 3.5
1.6 2.2 2.5 2.8
Animal and vegetable oils and fats 0.0 0.1 0.2 0.2
Chemicals .8 .8 1.1 1.2
Machinery and transport equipment 1.5 2.9 8.0 9.8
Other manufactured goods 4.6 7.5 11.5 12.0
Other 0.4 0.7 1.2 1.3
Total i 15.1 21.4 33.2 36.0
1 Because of rounding, totals may not equal sum of itemized entries.
Source: Statistical Abstract of the United States, 1969, pp. 801-2; U.S. Department of Com-merce, Highlights of U.S. Export and Import Trade, FT 990, December 1969, pp. 76-78.
Table 7. U.S. General Imports of Selected Categories of
Manufactured Goods, for Selected Years
(In Billions of Dollars)
1960 1965 1968 1969
Automobiles and parts 0.6 0.8 3.7 4.6
Iron and steel .5 1.2 2.0 1.8
Electrical machinery .3 0.6 1.5 1.9
Nonelectric machinery .4 1.2 2.3 2.5
Nonferrous base metals .8 1.2 2.0 1.5
Source: 1969 Statistical Abstract of the United States, pp. 801-2; Survey of Current Business,
July 1970, p. S-23.

96 INTERNATIONAL TRADE
Table 8. U.S. Genera! imports of Merchandise, by Country or
Area of Origin, for Selected Years
(In Billions of Dollars)
Total
1960 1965 1968 1969
14.6 21 .4 33.2 36.0
Developed Countries 1 8.6 14.
1
24.
1
26.5
Developing Countries 1 6.0 7.1 8.9 9.4
Communist Areas in Europe and Asia 0.0 0.1 0.2 0.2
Western Hemisphere 6.9 9.2 14.1 15.6
2.9 4.8 9.0 10.4
Western Europe 4.2 6.2 10.1 10.1
European Economic Community 2.3 3.3 5.9 5.8
European Free Trade Association 1.6 2.3 3.5 3.6
Eastern Europe 0.0 0.1 0.2 0.2
Asia 2.7 4.5 6.9 8.3
Japan 1.1 2.4 4.0 4.9
Australia and Oceania 0.3 0.4 0.7 0.8
Africa .5 .9 1.1 1.0
1 Developed countries include Canada, Western Europe, Japan, Australia, New Zealand, and
the Republic of South Africa. Developing countries include the rest of the world except Com-munist areas in Eastern Europe and Asia.
Source: 7969 Statistical Abstract of the United States, pp. 808-811; FT 990, Highlights of
U.S. Export and Import Trade, December 1969, pp. 26-7.

APPENDIX B 97
Table 9. U.S. Foreign Trade Balance for MeasurementStandard Sensitive Products, 1965-69
(In Millions of Dollars)
SIC Product description 1969 1968 1967 1966 1965
7,878.2 7,356.5 7,376.6 6,680.7 6,822.0
Canada 2,362.2 2,140.7 2,171.9 2,124.3 1,850.5
EEC 302.4 (69.5) 284.0 118.3 490.3
1 fsA Ai 0*+.*+ 1 70 R1 ly.o 1 ~\A 9. 1 1f, A
Japan (478.3) (319.3) (129.3) (227.8) (61.5)
All other 5,527.5 5,424.8 4,915.2 4,641.9 4,416.3
24 Lumber and wood products. . . . (62.5) (83.4) (29.6) (65.7) (52.5)
30 Rubber and plastic products. . .
.
23.4 23.3 19.5 18.6 13.6
33 Primary metal products 531.9 260.1 284.6 209.8 355.1
34 Fabricated metal products 425.2 416.5 432.8 509.1 404.8
35 Machinery, except electrical 4,422.8 3,897.8 3,947.5 3,795.8 3,842.4
36 Electrical machinery 1,101.9 1,011.9 1,011.1 846.6 863.8
37 Transportation equipment 972.7 1,419.5 1,280.4 980.1 1,066.8
38 Instruments and related
products 462.8 410.8 430.3 386.4 328.0
( ) deficit.
Table 10. U.S. Export Summary of Measurement-StandardSensitive Products, 1965-69
(In Millions of Dollars)
SIC Product description 1969 1968 1967 1966 1965
All products 13,922.7 12,629.1 11,308.8 10,401.7 9.465.1
Canada 3,027.5 2,700.5 2,589.0 2,479.0 2,103.9
EEC 2,581.3 2,149.7 1,931.1 1,677.5 1,563.0
United Kingdom 840.1 781.9 681.4 573.5 534.9
Japan 883.2 712.9 559.3 464.7 434.1
All other 6,590.6 6,284.1 5,548.0 5,207.0 4,829.2
24 Lumber and wood products .... 271.5 215.7 179.6 158.7 143.9
Canada 69.7 56.8 55.9 54.2 49.6
EEC 61.6 47.5 36.4 37.9 35.7
6.5 5.3 6.8 6.9 5.0
66.9 49.8 31.3 13.4 8.5
All other 66.8 56.3 49.2 46.3 45.1
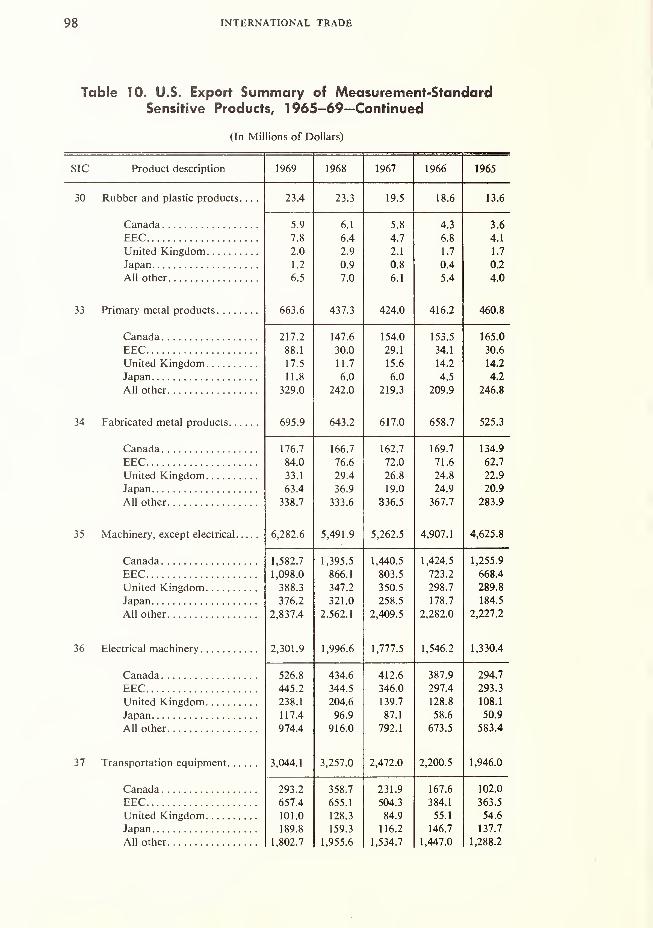
98 INTERNATIONAL TRADE
Table 10. U.S. Export Summary of Measurement-StandardSensitive Products, 1965—69—Continued
(In Millions of Dollars)
SIC Product description 1969 1968 1967 1966 1965
30 Rubber and plastic products. . .
.
23.4 23.3 19.5 18.6 13.6
5.9 6.1 5.8 4.3 3.6
EEC 7.8 6.4 4.7 6.8 4.1
United Kingdom. 2.0 2.9 2.1 1.7 1.7
Japan 1.2 0.9 0.8 0.4 0.2
All other 6.5 7.0 6.1 5.4 4.0
33 Primary metal products 663.6 437.3 424.0 416.2 460.8
217.2 147.6 154.0 153.5 165.0
EEC 88.1 30.0 29.1 34.1 30.6
United Kingdom 17.5 11.7 15.6 14.2 14.2
Japan 11.8 6.0 6.0 4.5 4.2
All other 329.0 242.0 219.3 209.9 246.8
34 Fabricated metal products 695.9 643.2 617.0 658.7 525.3
Canada 176.7 166.7 162.7 169.7 134.9
EEC 84.0 76.6 72.0 71.6 62.7
United Kingdom 33.1 29.4 26.8 24.8 22.9
63.4 36.9 19.0 24.9 20.9
All other 338.7 333.6 336.5 367.7 283.9
35 Machinery, except electrical 6,282.6 5,491.9 5,262.5 4,907.1 4,625.8
Canada 1,582.7 1,395.5 1,440.5 1,424.5 1,255.9
EEC 1,098.0 866.1 803.5 723.2 668.4
United Kingdom 388.3 347.2 350.5 298.7 289.8
Japan 376.2 321.0 258.5 178.7 184.5
All other 2,837.4 2.562.1 2,409.5 2,282.0 2,227.2
36 Electrical machinery 2,301.9 1,996.6 1,777.5 1,546.2 1,330.4
Canada 526.8 434.6 412.6 387.9 294.7
EEC 445.2 344.5 346.0 297.4 293.3
United Kingdom 238.1 204.6 139.7 128.8 108.1
Japan 117.4 96.9 87.1 58.6 50.9
All other 974.4 916.0 792.1 673.5 583.4
37 Transportation equipment 3,044.1 3,257.0 2,472.0 2,200.5 1,946.0
Canada 293.2 358.7 231.9 167.6 102.0
EEC 657.4 655.1 504.3 384.1 363.5
United Kingdom 101.0 128.3 84.9 55.1 54.6
Japan 189.8 159.3 116.2 146.7 137.7
All other 1,802.7 1,955.6 1,534.7 1,447.0 1,288.2

APPENDIX B 99
Table 10. U.S. Export Summary of Measurement-StandardSensitive Products, 1965-69—Continued
(In Millions of Dollars)
SIC Product description 1969 1968 1967 1966 1965
38 Instruments and related
products 639.7 564.1 556.7 495.7 419.3
Canada 155.3 134.5 125.6 117.3 98.2
EEC 139.2 123.5 135.1 122.4 104.7
United Kingdom 53.6 52.5 55.0 43.3 38.6
Japan 56.5 42.1 40.4 37.5 27.2
All other 235.1 211.5 200.6 175.2 150.6
Table 11. U.S. Import Summary of Measurement-StandardSensitive Products, 1965-69
(In Millions of Dollars)
SIC Product description 1969 1968 1967 1966 1965
All products 6,044.5 5,272.6 3,932.2 3,721.0 2,643.1
Canada 665.3 559.8 417.1 354.7 253.4
EEC 2,278.9 2,219.2 1,647.1 1,559.2 1,072.7
United Kingdom 675.7 602.1 546.6 549.5 408.5
Japan 1,361.5 1,032.2 688.6 692.5 495.6
All other 1,063.1 859.3 632.8 565.1 412.9
24 Wood and lumber products 334.0 299.1 209.2 224.4 196.4
Canada 39.4 41.4 38.2 42.4 41.8
EEC 4.9 4.3 3.6 3.0 2.9
United Kingdom 0.4 0.5 0.2 0.3 0.2
72.4 73.5 49.1 57.1 51.4
All other 216.9 179.4 118.1 121.6 100.1
33 Primary metal products 131.7 177.2 139.4 206.4 105.7
Canada 26.4 44.1 30.9 35.0 11.5
EEC 50.2 70.7 67.6 104.9 57.9
United Kingdom 4.0 8.8 8.1 13.3 5.4
Japan 30.9 25.6 14.6 29.8 16.4
All other 20.2 28.0 18.2 23.4 14.5
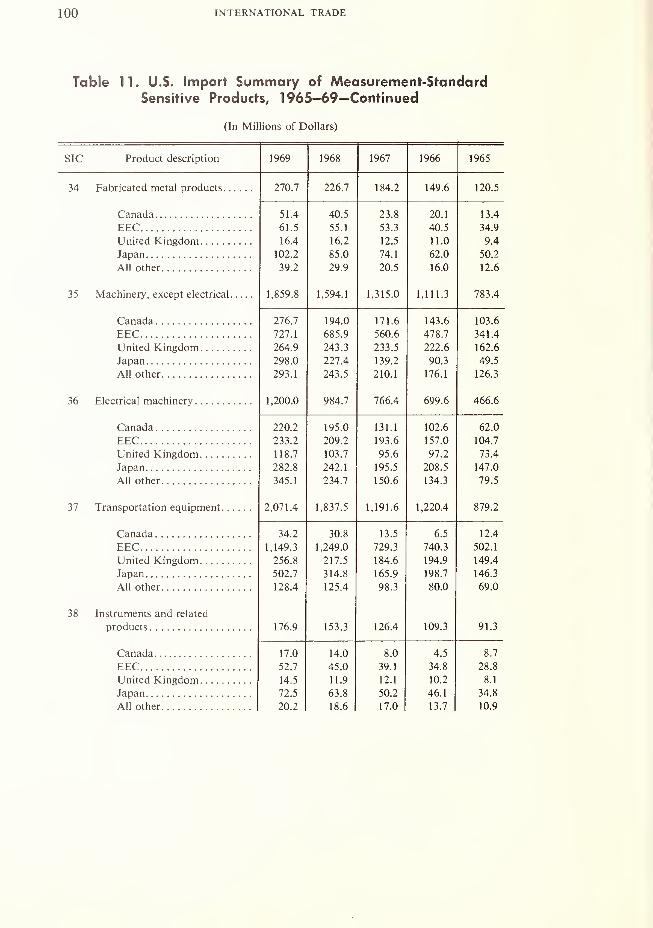
100 INTERNATIONAL TRADE
Table 11. U.S. Import Summary of Measurement-StandardSensitive Products, 1965-69—Continued
(In Millions of Dollars)
SIC Product description 1969 1968 1967 1966 1965
34 Fabricated metal products 270.7 226.7 184.2 149.6 120.5
Canada 51.4 40.5 23.8 20.1 13.4
EEC 61.5 55.1 53.3 40.5 34.9
United Kingdom 16.4 16.2 12.5 11.0 9.4
Japan 102.2 85.0 74.1 62.0 50.2
All other 39.2 29.9 20.5 16.0 12.6
35 Machinery, except electrical 1,859.8 1,594.1 1,315.0 1,1 1 1.3 783.4
Canada 276.7 194.0 171.6 143.6 103.6
EEC 727.1 685.9 560.6 478.7 341.4
United Kingdom 264.9 243.3 233.5 222.6 162.6
Japan 298.0 227.4 139.2 90.3 49.5
All other 293.1 243.5 210.1 176.1 126.3
36 Electrical machinery 1,200.0 984.7 766.4 699.6 466.6
Canada 220.2 195.0 131.1 102.6 62.0
EEC 233.2 209.2 193.6 157.0 104.7
United Kingdom 118.7 103.7 95.6 97.2 73.4
Japan 282.8 242.1 195.5 208.5 147.0
All other 345.1 234.7 150.6 134.3 79.5
37 Transportation equipment 2,071.4 1,837.5 1,191.6 1,220.4 879.2
Canada 34.2 30.8 13.5 6.5 12.4
EEC 1,149.3 1,249.0 729.3 740.3 502.1
United Kingdom 256.8 217.5 184.6 194.9 149.4
Japan 502.7 314.8 165.9 198.7 146.3
All other 128.4 125.4 98.3 80.0 69.0
38 Instruments and relateo
products 176.9 153.3 126.4 109.3 91.3
Canada 17.0 14.0 8.0 4.5 8.7
EEC 52.7 45.0 39.1 34.8 28.8
United Kingdom 14.5 11.9 12.1 10.2 8.1
Japan 72.5 63.8 50.2 46.1 34.8
All other 20.2 18.6 17.0 13.7 10.9
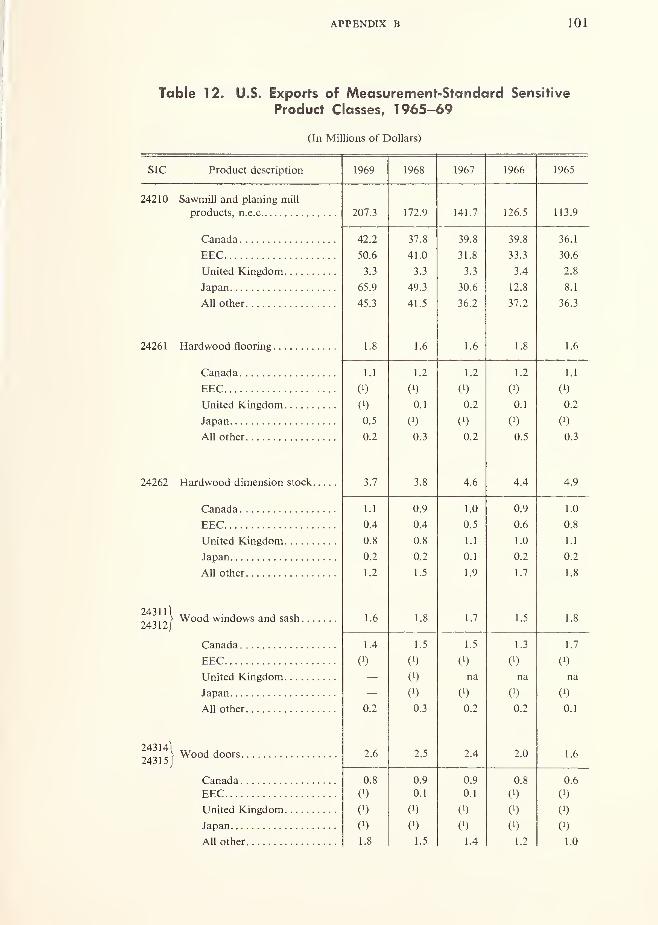
APPENDIX B 101
Table 12. U.S. Exports of Measurement-Standard Sensitive
Product Classes, 1965-69
(In Millions of Dollars)
SIC Product description 1969 1968 1967 1966
24210 Sawmill and planing mill
products, n.e.c
Canada
EECUnited Kingdom.
Japan
All other
24261 Hardwood flooring.
Canada
EECUnited Kingdom.
Japan
All other
24262 Hardwood dimension stock.
Canada
EECUnited Kingdom.
Japan
All other
243111
24312)Wood windows and sash
.
Canada
EECUnited Kingdom.
Japan
All other
243 14\
24315/Wood doors
Canada
EECUnited Kingdom.
Japan
All other
207.3
42.2
50.6
3.3
65.9
45.3
1.8
1.1
(')
(>)
0.5
0.2
3.7
1.1
0.4
0.8
0.2
1.2
1.6
1.4
C1)
0.2
2.6
0.8
C1)
V)
1.8
172.9
37.8
41.0
3.3
49.3
41.5
1.6
1.2
0)
0.1
C1)
0.3
3.8
0.9
0.4
0.8
0.2
1.5
1.8
1.5
(')
P)
(')
0.3
2.5
0.9
0.1
(')
(')
1.5
141.7
39.8
31.8
3.3
30.6
36.2
1.6
1.2
0)
0.2
C1)
0.2
4.6
1.0
0.5
1.1
0.1
1.9
1.7
1.5
(!)
na
0)
0.2
2.4
0.9
0.1
(')
(')
1.4
126.5
39.8
33.3
3.4
12.8
37.2
1.
1.2
(')
0.1
0.5
4.4
0.9
0.6
1.0
0.2
1.7
1.5
1.3
na
(')
0.2
2.0
0.8
(')
(')
0)
1.2
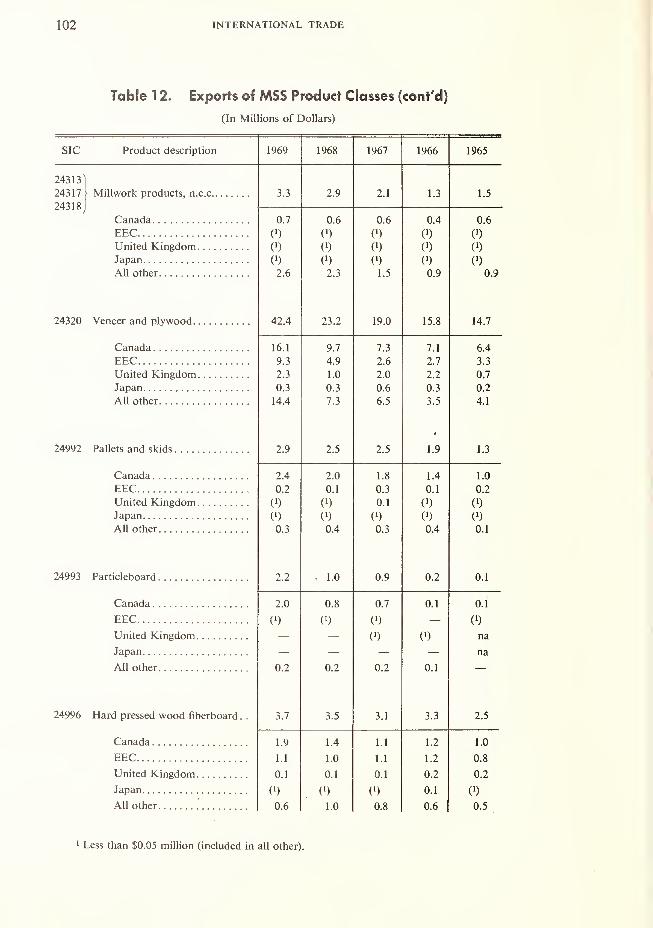
102 INTERNATIONAL TRADE
Table 1 2. Exports of MSS Product Classes (cont'd)
(In Millions of Dollars)
SIC Product description 1969 1968 1967 1966 1965
243131
24317 > Millwork products, n.e.c 3.3 2.9 2.1 1.3 1.5
24318
u. / u.o u.o U.4 u.o
\ ) \
)
y )<Tl
\
)
I Tnif^/H It inrrnArvi\ )
(ViK ) \ ) v)
\ > K
)
\ ) \ ) ( )
All other 2.6 2.3 1.5 0.9 0.9
24320 Veneer and plywood 42.4 23.2 19.0 15.8 14.7
1 A 110.
1
Q 7 7 1/.I
per A Q Zr.O 7 7 J.J
T TnifpH Tc inoHnm 1 n 1 o£.\J n 7
0 ^V.J VJ.U
All other 14.4 7.3 6.5 3.5 4.1
24992 Pallets and skids 2.9 2.5 2.5 1.9 1.3
Canada 2.4 2.0 1.8 1.4 1.0
EEC 0.2 0.1 0.3 0.1 0.2
United Kingdom (J) (!) 0.1 (') 0)
0) C1) 0)
All other 0.3 0.4 0.3 0.4 0.1
24993 Particleboard 2.2 1.0 0.9 0.2 0.1
Canada 2.0 0.8 0.7 0.1 0.1
EEC (!) (') (!) — (!)
United Kingdom — — (') na
— — — — na
All other 0.2 0.2 0.2 0.1 —
24996 Hard pressed wood fiberboard . . 3.7 3.5 3.1 3.3 2.5
Canada 1.9 1.4 1.1 1.2 1.0
EEC 1.1 1.0 1.1 1.2 0.8
United Kingdom 0.1 0.1 0.1 0.2 0.2
(!) (!) 0.1 (')
All other 0.6 1.0 0.8 0.6 0.5
Less than $0.05 million (included in all other).
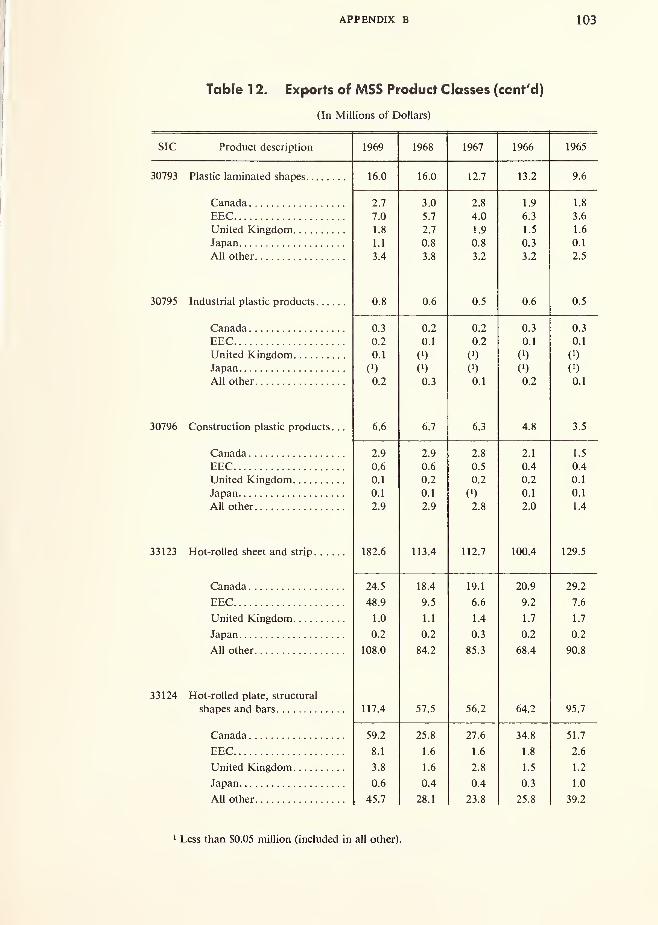
APPENDIX B 103
Table 1 2. Exports of MSS Product Classes (cont'd)
(In Millions of Dollars)
Pfnni iff1 /'i£*C(-1 t*ir^f"i/""*r'inuuuti ucsci ipiioii 1 Q6Q1 7D7 1 700 1 QA7 1 Q«f>1 7UD
30793 16.0 16.0 12.7 13.2 9.6
7 7 ~K flj .yj 1 Q 1.8
7 fl A fl 3.6
I Tnitprl K^inoHnm 1.8 2.7 1.9 1 .5 1.6
la nan 1.1 0.8 0.8 0.3 0.1
All other 3.4 3.8 3.2 3.2 2.5
30795 Industrial plastic products 0.8 0.6 0.5 0.6 0.5
fl 1 fl 7 fl 7 flV/. J fl ^
per fl 7 fl 1yj. 1 fl 7 0.1 0.1
1 TnifpH K inoHnm fl 1V ) y ) V > \ )
la Y\'AT\V )
fl"!V ) \ ) V I V )
All other 0.2 0.3 0.1 0.2 0.1
30796 Construction plastic products. .
.
6.6 6.7 6.3 4.8 3.5
Canada 2.9 2.9 2.8 2.1 1.5
EEC 0.6 0.6 0.5 0.4 0.4
U.l u.z u.z U.Z U.l
Japan. . .
.
0.1 0.1 (') 0.1 0.1
All other 2.9 2.9 2.8 2.0 1.4
33123 Hot-rolled sheet and strip 182.6 113.4 112.7 100.4 129.5
Canada 24.5 18.4 19.1 20.9 29.2
EEC 48.9 9.5 6.6 9.2 7.6
United Kingdom 1.0 1.1 1.4 1.7 1.7
Japan 0.2 0.2 0.3 0.2 0.2
All other 108.0 84.2 85.3 68.4 90.8
33124 Hot-rolled plate, structural
shapes and bars 117.4 57.5 56.2 64.2 95.7
Canada 59.2 25.8 27.6 34.8 51.7
EEC 8.1 1.6 1.6 1.8 2.6
United Kingdom 3.8 1.6 2.8 1.5 1.2
Japan 0.6 0.4 0.4 0.3 1.0
All other 45.7 28.1 23.8 25.8 39.2
1 Less than $0.05 million (included in all other),
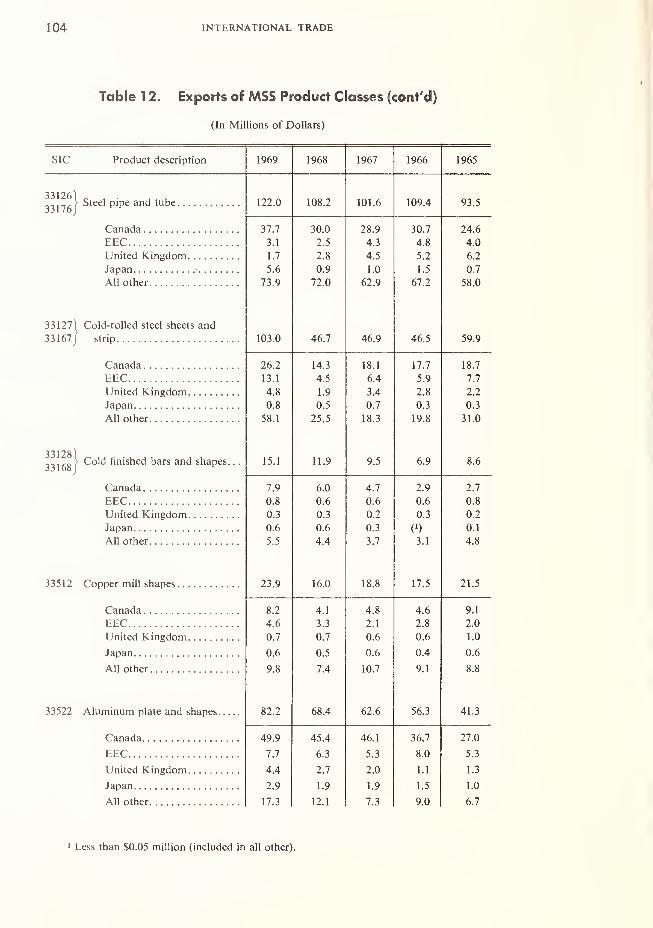
104 INTERNATIONAL TRADE
Table 1 2. Exports of MSS Product Classes (cont'd)
(In Millions of Dollars)
1969 1968 1967 1966 1965
122.0 108.2 101.6 109.4 93.5
37.7 30.0 28.9 30.7 24.6
3.1 2.5 4.3 4.8 4.0
1.7 2.8 4.5 5.2 6.2
5.6 0.9 1.0 1.5 0.7
73.9 72.0 62.9 67.2 58.0
103.0 46.7 46.9 46.5 59.9
26.2 14.3 18.1 17.7 18.7
13.1 4.5 6.4 5.9 7.7
4.8 1.9 3.4 2.8 2.2
0.8 0.5 0.7 0.3 0.3
<e 1Jo, 11 ft 11 O.J 1Q Q
ji.y)
15.1 11.9 9.5 6.9 8.6
7.9 6.0 4.7 2.9 2.7
n ftU.o u.o U.o u.o u.o
0.3 0.3 0.2 0.3 0.2
0.6 0.6 0.3 (') 0.1
5.5 4.4 3.7 3.1 4.8
23.9 16.0 18.8 17.5 21.5
8.2 4.1 4.8 4.6 9.1
4.6 3.3 2.1 2.8 2.0
0.7 0.7 0.6 0.6 1.0
0.6 0.5 0.6 0.4 0.6
9.8 7.4 10.7 9.1 8.8
82.2 68.4 62.6 56.3 41.3
49.9 45.4 46.1 36.7 27.0
7.7 6.3 5.3 8.0 5.3
4.4 2.7 2.0 1.1 1.3
2.9 1.9 1.9 1.5 1.0
17.3 12.1 7.3 9.0 6.7
SIC Product description
33126) 0 , , .
33176 I
pipC a 6
Canada
EECUnited KingdomJapan
All other
33127] Cold-rolled steel sheets and
33167/ strip
Canada
EECUnited KingdomJapan
All other
ttI^oI Cold finished bars and shapes.JjlOoJ
Canada
EECUnited KingdomJapan
All other
33512 Copper mill shapes
Canada
EECUnited Kingdom
Japan
All other
33522 Aluminum plate and shapes. .
.
Canada
EECUnited Kingdom
Japan
All other
1 Less than S0.05 million (included in all other)
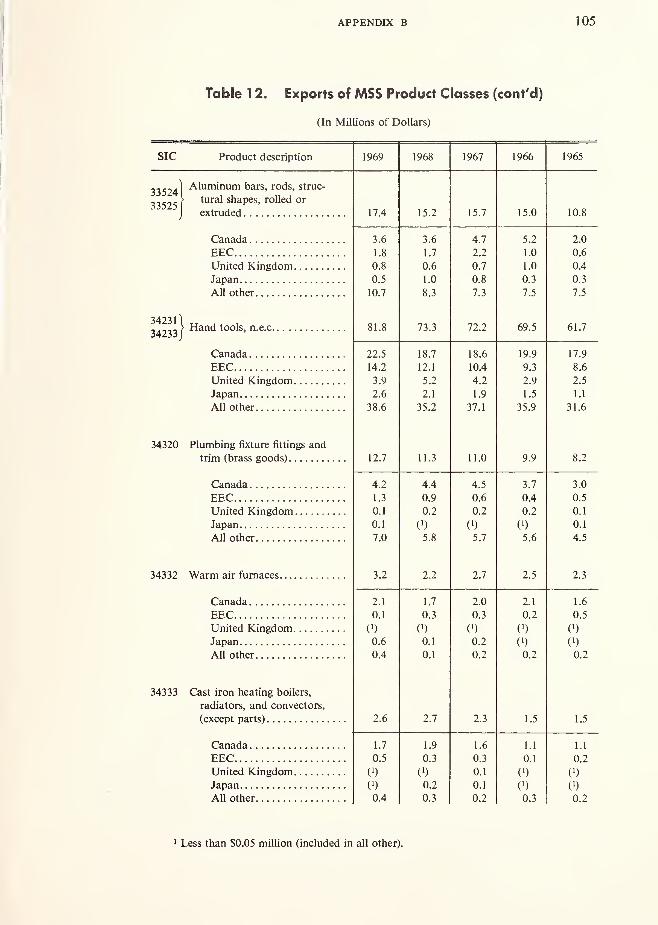
APPENDIX B 105
Table 1 2. Exports of MSS Product Classes (cont'd)
(In Millions of Dollars)
1969 1968 1967 1966 1965
17.4 15.2 15.7 15.0 10.8
3.6 3.6 4.7 5.2 2.0
1.8 1.7 2.2 1.0 0.6
0.8 0.6 0.7 1.0 0.4
0.5 1.0 0.8 0.3 0.3
10.7 O 17.3
1 cI.J
n c/.->
81.8 73.3 72.2 69.5 61.7
22.5 18.7 18.6 19.9 17.9
14.2 12.1 10.4 9.3 8.6
3.9 5.2 4.2 2.9 2.5
2.6 2.1 1.9 1.5 1.1
38.6 35.2 37.1 35.9 31.6
12.7 11.3 11.0 9.9 8.2
4.2 4.4 4.5 3.7 3.0
1.3 0.9 0.6 0.4 0.5
0.1 0.2 0.2 0.2 0.1
0.1 (') 0) V) 0.1
7.0 5.8 5.7 5.6 4.5
3.2 2.2 2.7 2.5 2.3
2.1 1.7 2.0 2.1 1.6
0.1 0.3 0.3 0.2 0.5
(') 0) 0) 0)
0.6 0.1 0.2 0) (')
0.4 0.1 0.2 0.2 0.2
2.6 2.7 2.3 1.5 1.5
1.7 1.9 1.6 1.1 1.1
0.5 0.3 0.3 0.1 0.2
0) (') 0.1 (') 0)
(') 0.2 0.1 o (')
0.4 0.3 0.2 0.3 0.2
SIC Product description
33524]Aluminum bars >
r°ds, struc-
33525 1
tura' s^aPes >r°Ued or
Jextruded
Canada
EECUnited KingdomJapan
All other
342311 „ ,,.„,,> Hand tools, n.e.c34233
J
Canada
EECUnited KingdomJapan
All other
34320 Plumbing fixture fittings and
trim (brass goods)
Canada
EECUnited KingdomJapan
All other
34332 Warm air furnaces
Canada
EECUnited KingdomJapan
All other
34333 Cast iron heating boilers,
radiators, and convectors,
(except parts)
Canada
EECUnited KingdomJapan
All other
1 Less than $0.05 million (included in all other)
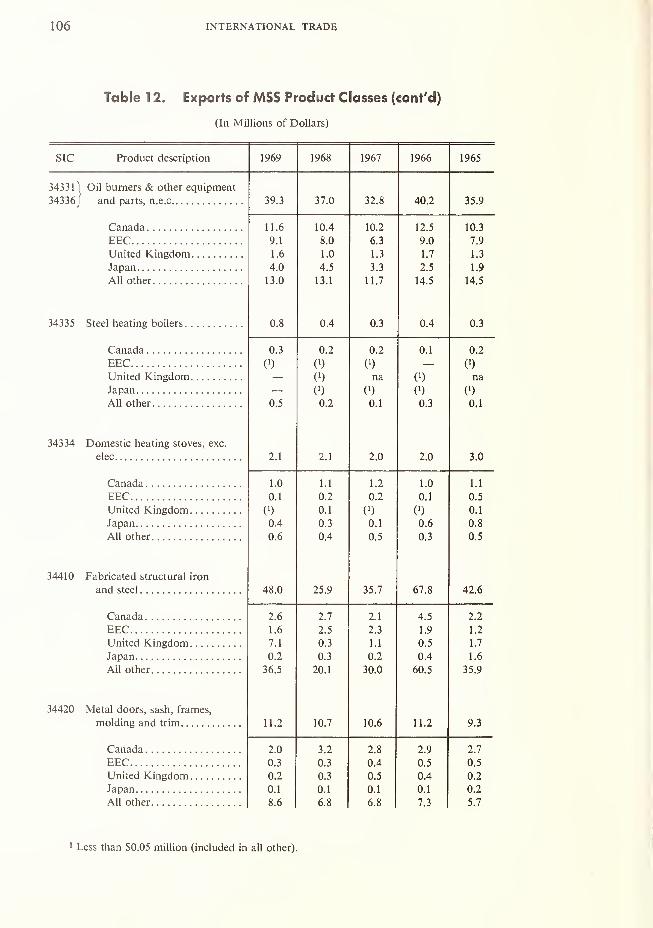
106 INTERNATIONAL TRADE
Table 1 2. Exports of MSS Product Classes (cont'd)
(In Millions of Dollars)
SIC Product description 1969 1968 1967 1966 1965
34331 1 Oil burners & other equipment
34336 j and paits, n.e.c 39.3 37.0 32.8 40.2 35.9
11.6 10.4 10.2 12.5 10.3
EEC 9.1 8.0 6.3 9.0 7.9
T InitfH KinoHom 1.6 1.0 1.3 1.7 1.3
Japan 4.0 4.5 3.3 2.5 1.9
All nthpr 1 3 n 1 1 1 1 711./ It. J
34335 Steel heating boilers 0.8 0.4 0.3 0.4 0.3
Canada 0.3 0.2 0.2 0.1 0.2
EEC C1) 0) — 0)
United Kingdom —(
l) na 0) na
Japan (') (') 0) 0)
All other 0.5 0.2 0.1 0.3 0.1
34334 Domestic heating stoves, exc.
elec 2.1 2.1 2.0 2.0 3.0
Canada 1.0 1.1 1.2 1.0 1.1
EEC 0.1 0.2 0.2 0.1 0.5
United Kingdom (') 0.1 V) 0) 0.1
Japan 0.4 0.3 0.1 0.6 0.8
All other 0.6 0.4 0.5 0.3 0.5
34410 Fabricated structural iron
and steel 48.0 25.9 35.7 67.8 42.6
Canada 2.6 2.7 2.1 4.5 2.2
EEC 1.6 2.5 2.3 1.9 1.2
United Kingdom 7.1 0.3 1.1 0.5 1.7
Japan 0.2 0.3 0.2 0.4 1.6All
36.5 20.1 30.0 60.5 35.9
34420 Metal doors, sash, frames,
molding and trim 11.2 10.7 10.6 11.2 9.3
Canada 2.0 3.2 2.8 2.9 2.7
EEC 0.3 0.3 0.4 0.5 0.5
United Kingdom 0.2 0.3 0.5 0.4 0.2
Japan 0.1 0.1 0.1 0.1 0.2
8.6 6.8 6.8 7.3 5.7
Less than $0.05 million (included in all other).
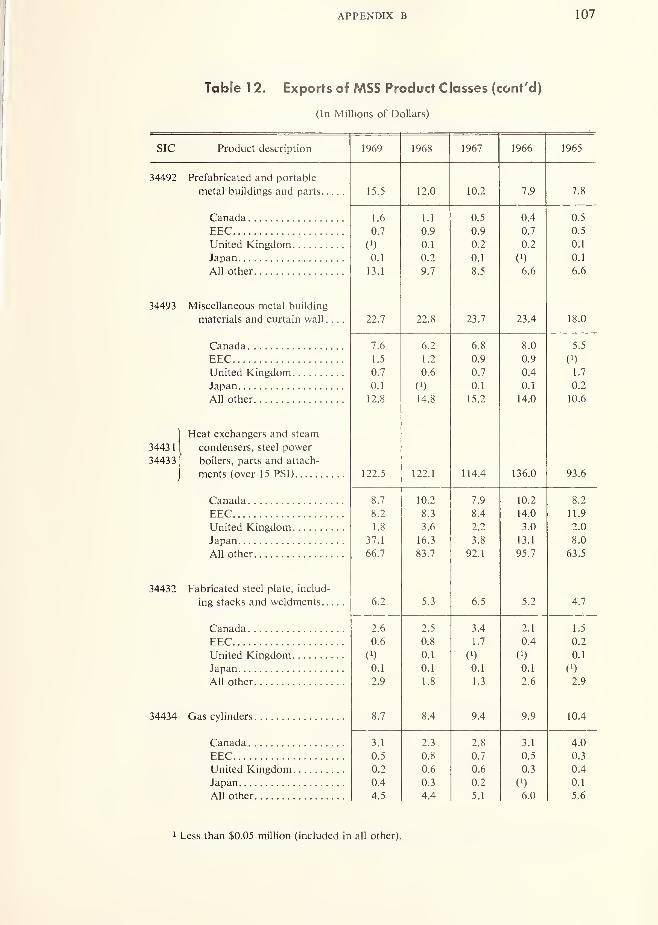
APPENDIX B 107
Table 1 2. Exports of MSS Product Classes (cont'd)
(In Millions of Dollars)
SIC Product description 1969 1968 1967 1966 1965
34492 Prefabricated and portable
metal buildings and parts 15.5 12.0 10.2 7.9 7.8
Canada 1.6 1.1 0.5 0.4 0.5
EEC 0.7 0.9 0.9 0.7 0.5
United Kingdom (') 0.1 0.2 0.2 0.1
Japan 0.1 0.2 0.1 (i) 0.1
AH other 13.1 9.7 8.5 6.6 6.6
34493 Miscellaneous metal building
materials and curtain wall .... 22.7 22.8 23.7 23.4 18.0
Canada 7.6 6.2 6.8 8.0 5.5
EEC 1.5 1.2 0.9 0.9 C1)
United Kingdom 0.7 0.6 0.7 0.4 1.7
Japan 0.1 V / 0.1 0.1 0.2
All other 12.8 14.8 15.2 14.0 10.6
Heat exchangers and steam
34431 condensers, steel power
34433 boilers, parts and attach-
;ments (over 15 PSI) 122.5 122.1 114.4 136.0 93.6
Canada 8.7 10.2 7.9 10.2 8.2
EEC 8.2 8.3 8.4 14.0 1 1.9
United Kingdom 1.8 3.6 2.2 3.0 2.0
Japan 37.1 16.3 3.8 13.1 8.0
All other 66.7 83.7 92.1 95.7 63.5
34432 Fabricated steel plate, includ-
ing stacks and weldments 6.2 5.3 6.5 5.2 4.7
Canada 2.6 2.5 3.4 2.1 1.5
EEC 0.6 0.8 1.7 0.4 0.2
United Kingdom 0.1 (') V / 0.1
Japan 0.1 0.1 0.1 0.1 (r
)
All other 2.9 1.8 1.3 2.6 2.9
34434 Gas cylinders 8.7 8.4 9.4 9.9 10.4
Canada 3.1 2.3 2.8 3.1 4.0
EEC 0.5 0.8 0.7 0.5 0.3
United Kingdom 0.2 0.6 0.6 0.3 0.4
Japan 0.4 0.3 0.2 (') 0.1
All other 4.5 4.4 5.1 6.0 5.6
1 Less than $0.05 million (included in all other)

108 INTERNATIONAL TRADE
Table 1 2. Exports of MSS Product Classes (cont'd)
(In Millions of Dollars)
SIC Product description 1969 1968 1967 1966
34435]
34437 > Metal tanks
34439
j
Canada
EECUnited KingdomJapan
All othei
34440 Sheet metal products
Canada
EECUnited KingdomJapan
All other
34521 Industrial fasteners (bolts and
nuts)
Canada
EECUnited KingdomJapan
All other
Metal shipping barrels,
drums, kegs, pails and
collapsible tubes
Canada
EECUnited KingdomJapan
All other
34941 Automatic regulating and
control valves
Canada
EECUnited KingdomJapan
All other
3491
3496
21.8
2.7
3.9
0.9
0.3
14.0
9.7
3.0
0.3
0.2
0.4
5.8
68.4
43.1
7.8
3.4
1.7
12.4
3.9
1.2
0.6
0.1
(')
2.0
122.9
26.2
19.6
7.8
10.0
59.3
25.2
3.8
2.3
0.7
0.9
17.5
10.2
2.3
0.2
0)
0.1
7.6
63.4
36.2
8.6
3.7
1.0
13.9
2.6
0.9
0.5
0.1
0)
1.1
124.7
21.2
2.6
1.8
0.5
2.0
14.3
7.9
2.4
0.2
0.1
0.2
5.0
55.8
32.5
7.3
3.3
0.8
11.9
3.9
1.3
0.6
0.1
0)
1.9
115.5
28.0
6.6
0.8
1.6
0.7
18.3
8.7
1.7
0.2
0.1
0)
6.7
49.3
31.6
4.0
2.8
0.4
10.5
5.8
1.6
0.7
0.1
()
3.4
105.1
29.8
17.4
7.7
6.7
63.1
31.7
18.6
6.3
3.4
55.5
30.5
15.8
6.0
4.1
48.7
1 Less than $0.05 million (included in all other).
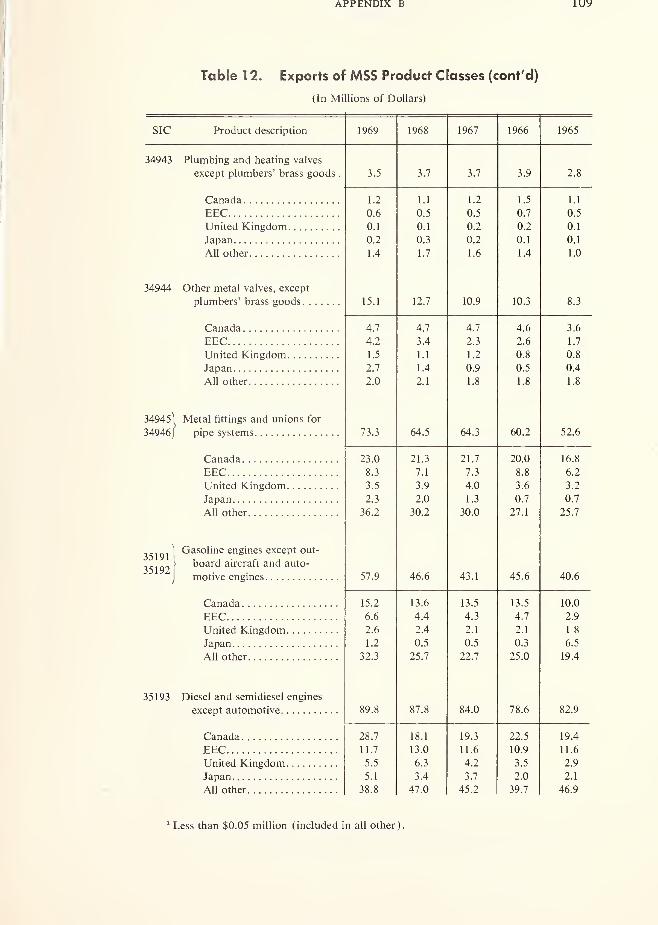
APPENDIX B
Table 1 2. Exports of MSS Product Classes (cont'd)
(In Millions of Dollars)
SIC Product description 1969 1968 1967 1966 1965
34943 Plumbing and heating valves
except plumbers' brass goods . 3.5 3.7 3.7 3.9 2.8
Canada 1.2 1.1 1.2 1.5 1.1
EEC 0.6 0.5 0.5 0.7 0.5
United Kingdom 0.1 0.1 0.2 0.2 0.1
Japan 0.2 0.3 0.2 0.1 0.1
All other 1.4 1.7 1.6 1.4 1.0
Other metal valves, except
plumbers' brass goods 15.1 12.7 10.9 10.3 8.3
Canada 4.7 4.7 4.7 4.6 3.6
EEC 4.2 3.4 2.3 2.6 1.7
United Kingdom 1.5 1.1 1.2 0.8 0.8
Japan 2.7 1 .4 0.9 0.5 0.4
All other 2.0 2.1 1.8 1.8 1 .8
1AQA ^j4y4j Metal fittings and unions for
34946J pipe systems 73.3 64.5 64.3 60.2 52.6
Canada 23.0 21.3 21.7 20.0 16.8
EEC 8.3 7.1 7.3 8.8 6.2
United Kingdom 3.5 3.9 4.0 3.6 3.2
Japan 2.3 2.0 1.3 0.7 0.7
All other 36.2 30.2 30.0 27.1 25.7
35191Gasoline engines except out-
' DUdlU auClall allU aULU35192
motive engines 57.9 46.6 43.1 45.6 40.6
15.2 13.6 13.5 13.5 10.0
EEC 6.6 4.4 4.3 4.7 2.9
~> 1 7 i 1 81 o
U.J U.J yj.j 55All r\tVi^r ?S 7 ?? 7 75 0- - .
*' 1 Q 4
35193 Diesel and semidiesel engines
except automotive 89.8 87.8 84.0 78.6 82.9
Canada 28.7 18.1 19.3 22.5 19.4
EEC 11.7 13.0 11.6 10.9 11.6
United Kingdom 5.5 6.3 4.2 3.5 2.9
5.1 3.4 3.7 2.0 2.1
All other 38.8 47.0 45.2 39.7 46.9
1 Less than $0.05 million (included in all other).

110 INTERNATIONAL TRADE
Table 1 2. Exports of MSS Product Classes (cont'd)
(In Millions of Dollars)
SIC Product description 1969 1968 1967 1966 1965
35194 Diesel and semidiesel engines
a i itnmnt ivf 24.7 22.5 16.8 16.2 20.7
Canada 11.7 7.7 5.4 6.5 4.2
EEC 3.0 3.2 3.0 2.1 2.0
United Kingdom 0.1 0.1 0.4 0.3 1.4
Japan 0) 0.1 (>) (')
All other 9.9 11.4 8.0 7.3 13.1
35195 Outboard motors 23.1 23.2 19.6 23.7 17.8
Canada 0.1 0.2 2.6 3.4 2.4
EEC 4.2 4.5 4.1 5.1 4.0
United Kingdom 0.9 1.4 0.8 0.6 0.4
Japan 1.1 0.7 0.5 0.3 0.6
All other 16.8 16.4 11.6 14.3 10.4
35196 Gas engines, except gas turbines. 1.4 1.5 3.9 1.3 1.0
Canada 0.8 0.6 0.3 0.3 0.5
EEC 0) (!) (') 0)
United Kingdom (') — 0.2 — V)— 0) — —C
1)
All other 0.6 0.9 2.4 1.0 0.5
35197 Internal combustion engines,
1.8 2.1 2.3 3.0 3.6
Canada 0.6 0.4 0.4 0.4 0.5
EEC 0.2 0.2 0.2 0.4 0.7
United Kingdom (') 0.1 0.1 (') (')
(') (') 0) (') (')
All other 1.0 1.4 1.6 2.2 2.4
35199 Parts and accessories, n.e.c. for
internal combustion engines.
.
213.1 193.3 182.8 162.3 233.6
Canada 55.1 52.0 55.1 49.0 81.5
EEC 34.3 24.0 18.9 18.6 23.1
United Kingdom 3.6 3.4 4.1 3.0 7.2
Japan 2.7 2.1 2.7 2.0 2.1
All other 117.4 111.8 102.0 89.7 119.7
1 Less than $0.05 million (included in all other).

APPENDIX B 111
Table 1 2. Exports of MSS Product Classes (cont'd)
(In Millions of Dollars)
SIC Product description 1969 1968 1967 1966 1965
35221 Wheel tractors, excluding
garden tractors and parts, 103.3 115.5 137.0 134.5 137.6
Canada 50.8 70.8 96.0 102.6 83.9
EEC 5.2 2.0 2.6 3.6 4.5
United Kingdom C1) 0.7 0.3 0.7 0.9
Japan 0) 0.1 0.2 0.2 0.6
All other 47.3 41.9 37.9 27.4 47.7
35223 Planting, seeding, and fertilizing
part machinery, except parts 13.7 16.0 15.7 13.5 12.8
Canada 10.2 12.2 9.4 10.2 9.4
EEC 0.4 0.3 0.1 0.2 0.2
United Kingdom 0.1 (') 0.1 0.1 0.1
Japan 0.1 0) 0.1 (') 0.1
All other 2.9 3.5 6.0 3.0 3.0
35224 Plows, listers, harrows, pulver-
part izers and stalkcutters 14.7 18.2 21.7 19.6 19.5
Canada 7.2 10.5 14.5 13.0 11.2
EEC 0.4 0.4 0.3 0.4 0.2
United Kingdom 0.1 0.1 0.1 0.1 0.1
Japan (') C1) 0.1 0) (')
All other 7.0 7.2 6.7 6.1 8.0
35225 Harvesting machinery, excl.
part parts 49.5 52.8 70.3 73.2 71.8
Canada 30.0 28.2 45.7 53.0 42.6
EEC 2.1 1.4 1.6 1.4 2.2
0.2 0.2 0.9 0.6 0.3
0.2 0.1 0.1 0.3 0.1
All other 17.0 22.9 22.0 17.9 26.6
35226 Haying machinery and mowers,
except lawn mowers and parts
.
14.9 17.0 21.2 20.3 18.5
Canada 10.1 11.9 16.2 14.4 12.9
EEC 0.3 0.5 0.5 0.7 0.5
United Kingdom 0) (') 0.1 0.3 0.1
Japan 0.3 0.2 0.1 0.1 0.1
All other 4.2 4.4 4.3 4.8 4.9
1 Less than $0.05 million (included in all other)
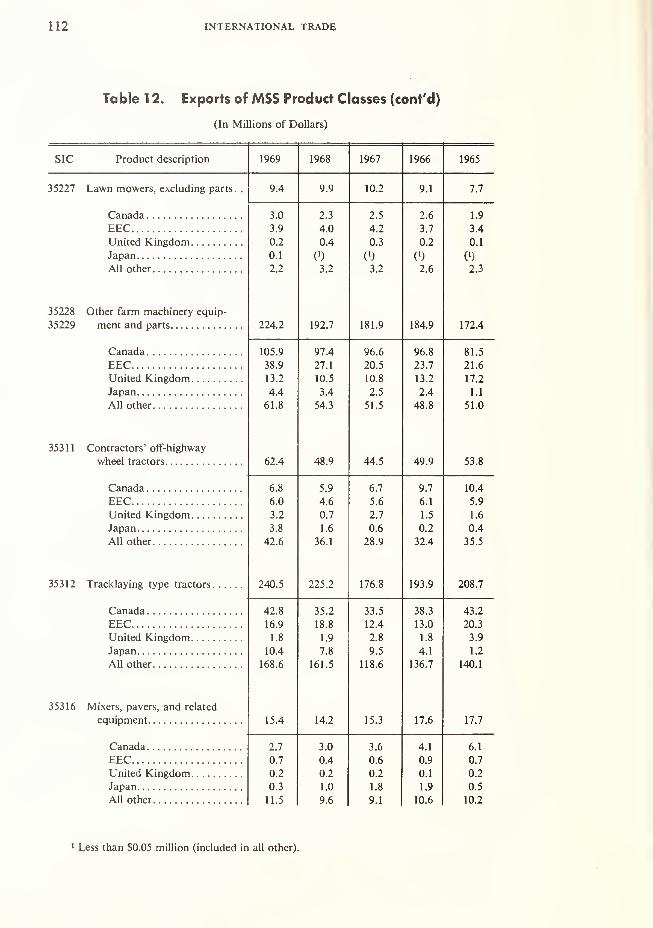
112 INTERNATIONAL TRADE
Table 1 2. Exports of MSS Product Classes (cont'd)
(In Millions of Dollars)
SIC Product description 1969 1968 1967 1966 1965
35227 Lawn mowers, excluding parts. . 9.4 9.9 10.2 9.1 7.7
i n ~> ^ z.o 1 Q
cpr 7. Q A ")j. i
1 A
n 7U.Z. U.'f ft tu.z ft 1V.L
C\ 1\ ) i. )
til\ )
All other 2.2 3.2 3.2 2.6 2.3
J JZZo Other farm machinery ecjuip-
35229 ment and parts 224.2 192.7 181.9 184.9 172.4
Q7 A yo.o OA ftyO.o ft 1 ^81 .0
pep jQ.y 77 12 /. 17fi <2U. J 71 723. /
7 1 A21 .0
1 1 7 in ^1U. J in ft1U.0 117 17 7
A A 7. A3.4 7 ^Z.J 7 A i i1 .
1
All other 61.8 54.3 51.5 48.8 51.0
35311 Contractors' off-highway
wheel tractors 62.4 48.9 44.5 49.9 53.8
O.o < Qj.y A 70. /Q 7 in a1U.4
O.U A £4.0 J.O 0.
1
"X 73.2 n 7u. /7 7 1 c
1 .3 1 fs1 .0
Japan 3.8 1.6 0.6 0.2 0.4
All nthpr A") f% %fi 1JD. 1
35312 Tracklaying type tractors 240.5 225.2 176.8 193.9 208.7
42.0 35.
2
J J.
5
3o.3 43.2
lo.y 1 o olo.o 12.4 13.U 7A 72U.31 Q1 .0
1 oi .y
7 Q2.0 i ft1.0 7 Q3.y
1 Ci A1U.4 7 0/.o Q <y.j A 14.
1
1 71 .2
All nthpr 1 6ft fx 161 S 1 1 ft 61 lo.U 1 ~K« 7
35316 Mixers, pavers, and related
equipment 15.4 14.2 15.3 17.6 17.7
Canada 2.7 3.0 3.6 4.1 6.1
EEC 0.7 0.4 0.6 0.9 0.7
United Kingdom 0.2 0.2 0.2 0.1 0.2
Japan 0.3 1.0 1.8 1.9 0.5
Ail other 11.5 9.6 9.1 10.6 10.2
1 Less than $0.05 million (included in all other)
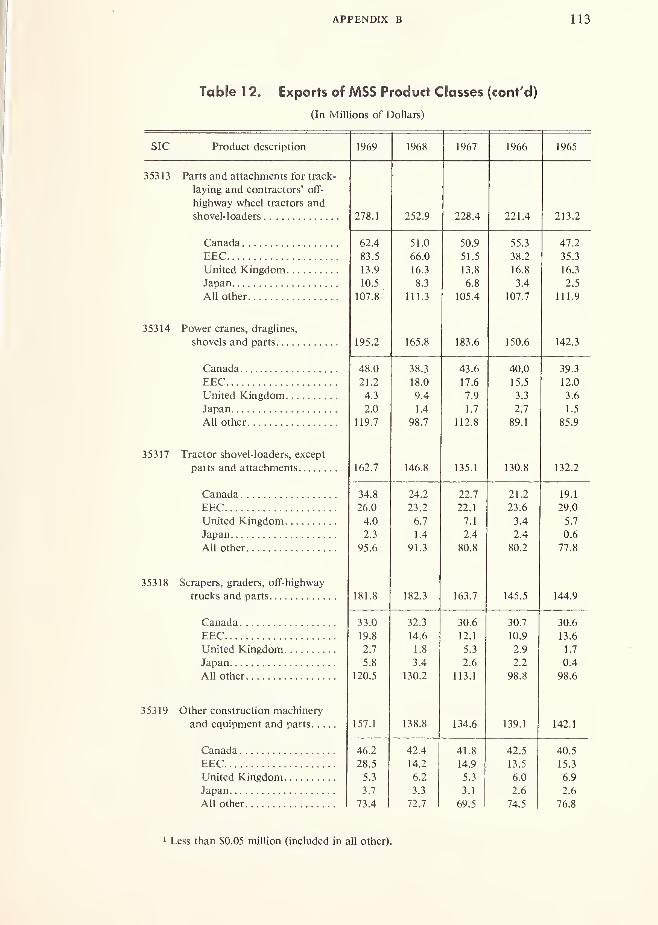
APPENDIX B 113
Table 1 2. Exports of MSS Product Classes (cont'd)
(In Millions of Dollars)
t- 1 f •
Product description 1969 1968 1967 1966 1965
35313 Parts and attachments for track-
laying and contractors' off-
highway wheel tractors and
shovel- loaders 278.1 252.9 228.4 221.4 213.2
Canada 62.4 51.0 50.9 55.3 47.2
EEC 83.5 66.0 51.5 38.2 35.3
United Kingdom 13.9 16.3 13.8 16.8 16.3
Japan 10.5 8.3 6.8 3.4 2.5
All other 107.8 111.3 105.4 107.7 111.9
35314 Power cranes, draglines,
shovels and parts 195.2 165.8 183.6 150.6 142.3
C'anada 48.0 38.3 43.6 40.0 39.3
EEC 21 .2 18.0 17.6 15.5 12.0
I Initftd Kingdom 4.3 9.4 7.9 3.3 3.6
Japan 2.0 1.4 1.7 2.7 1.5
All other 119.7 98.7 112.8 89.1 85.9
35317 Tractor shovel-loaders, except
parts and attachments 162.7 146.8 135.1 130.8 132.2
34.8 24.2 22.7 21.2 19.1
EEC 26.0 23.2 22.1 23.6 29.0
United Kingdom 4.0 6.7 7.1 3.4 5.7
2.3 1.4 2.4 2.4 0.6
All other 95.6 91.3 80.8 80.2 77.8
35318 Scrapers, graders, off-highway
trucks and parts 181.8 182.3 163.7 145.5 144.9
Canada 33.0 32.3 30.6 30.7 30.6
EEC 19.8 14.6 12.1 10.9 13.6
United Kingdom 2.7 1.8 5.3 2.9 1.7
5.8 3.4 2.6 2.2 0.4
All other 120.5 130.2 113.1 98.8 98.6
35319 Other construction machinery
and equipment and parts 157.1 138.8 134.6 139.1 142.1
Canada 46.2 42.4 41.8 42.5 40.5
EEC 28.5 14.2 14.9 13.5 15.3
United Kingdom 5.3 6.2 5.3 6.0 6.9
Japan 3.7 3.3 3.1 2.6 2.6
All other 73.4 72.7 69.5 74.5I
76.8
1 Less than SO.05 million (included in all other).
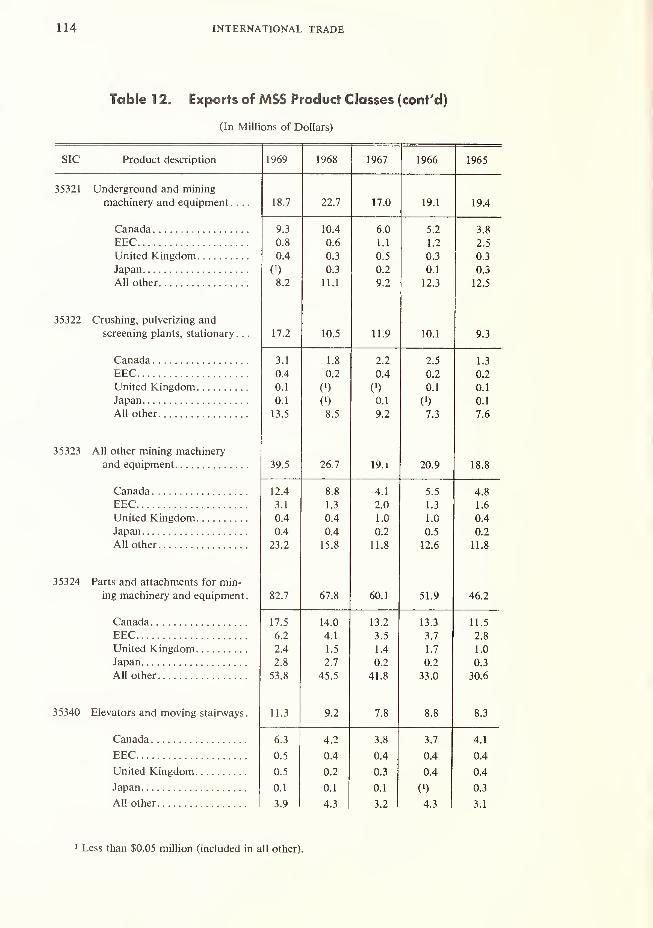
114 INTERNATIONAL TRADE
Table 1 2. Exports of MSS Product Classes (cont'd)
(In Millions of Dollars)
SIC Product description 1969 1968 1967 1966 1965
35321 Underground and mining
machinery and equipment .... 18.7 22.7 17.0 19.1 19.4
Canada 9.3 10.4 6.0 5.2 3.8
EEC 0.8 0.6 1.1 1.2 2.5
United Kingdom 0.4 0.3 0.5 0.3 0.3
Japan 0) 0.3 0.2 0.1 0.3
All other 8.2 11.1 9.2 12.3 12.5
35322 Crushing, pulverizing and
screening plants, stationary
.
17.2 10.5 11.9 10.1 9.3
Canada 3.1 1.8 2.2 2.5 1.3
EEC 0.4 0.2 0.4 0.2 0.2
United Kingdom 0.1 0) 0.1 0.1
Japan 0.1 0) 0.1 0) 0.1
All other 13.5 8.5 9.2 7.3 7.6
35323 All other mining machinery
and equipment 39.5 26.7 19.1 20.9 18.8
Canada 12.4 8.8 4.1 5.5 4.8
EEC 3.1 1.3 2.0 1.3 1.6
United Kingdom 0.4 0.4 1.0 1.0 0.4
0.4 0.4 0.2 0.5 0.2
All other 23.2 15.8 11.8 12.6 11.8
35324 Parts and attachments for min-
ing machinery and equipment. 82.7 67.8 60.1 51.9 46.2
17.5 14.0 13.2 13.3 11.5
EEC o.z A 1 j, j 1 7j. / Z.o
United Kingdom 2.4 1.5 1.4 1.7 1.0
Japan 2.8 2.7 0.2 0.2 0.3
All other 53.8 45.5 41.8 33.0 30.6
35340 Elevators and moving stairways. 11.3 9.2 7.8 8.8 8.3
6.3 4.2 3.8 3.7 4.1
EEC 0.5 0.4 0.4 0.4 0.4
United Kingdom 0.5 0.2 0.3 0.4 0.4
0.1 0.1 0.1 (') 0.3
All other 3.9 4.3 3.2 4.3 3.1
1 Less than $0.05 million (included in all other)
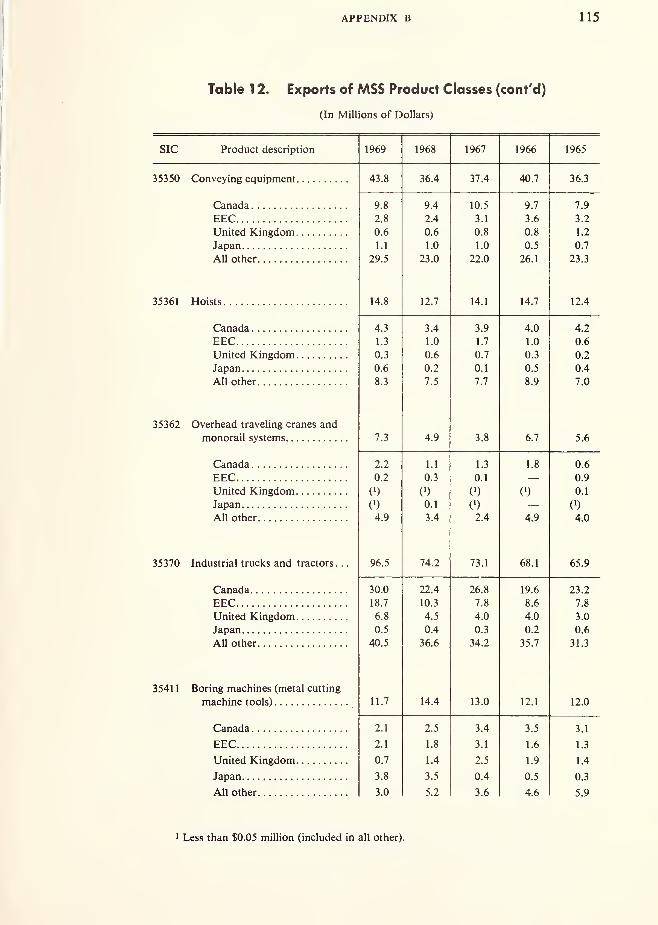
APPENDIX B 115
Table 1 2. Exports of MSS Product Classes (cont'd)
(In Millions of Dollars)
SIC Product description 1969 1968 1967 1966 1965
35350 Conveying equipment 43.8 36.4 37.4 40.7 36.3
Canada 9.8 9.4 10.5 9.7 7.9
EEC 2.8 2.4 3.1 3.6 3.2
United Kingdom 0.6 0.6 0.8 0.8 1.2
1.1 1.0 1.0 0.5 0.7
All other 29.5 23.0 22.0 26.1 23.3
35361 Hoists 14.8 12.7 14.1 14.7 12.4
Canada 4.3 3.4 3.9 4.0 4.2
EEC 1.3 1.0 1.7 1.0 0.6
United Kingdom 0.3 0.6 0.7 0.3 0.2
0.6 0.2 0.1 0.5 0.4
All other 8.3 7.5 7.7 8.9 7.0
35362 Overhead traveling cranes and
7.3 4.9 3.8 6.7 5.6
Canada 2.2 1.1 1.3 1.8 0.6
EEC 0.2 0.3 0.1 0.9
United Kingdom / 1\(*) (
)
v) C1) 0.1
Japan n 1U.l
i l \(') 0)
All other 4.9 3.4 2.4 4.9 4.0
35370 Industrial trucks and tractors. .
.
yt>. j IH.Z ii i 05.
1
65.9
Canada 30.0 22.4 26.8 19.6 23.2ifi 718. /
1 n i 1.0 O.O"7 Q1.0
United Kingdom 6.8 4.5 4.0 4.0 3.0
Japan 0.5 0.4 0.3 0.2 0.6
All other 40.5 36.6 34.2 35.7 31.3
35411 Boring machines (metal cutting
machine tools) 11.7 14.4 13.0 12.1 12.0
Canada 2.1 2.5 3.4 3.5 3.1
EEC 2.1 1.8 3.1 1.6 1.3
United Kingdom 0.7 1.4 2.5 1.9 1.4
Japan 3.8 3.5 0.4 0.5 0.3
All other 3.0 5.2 3.6 4.6 5.9
1 Less than $0.05 million (included in all other).
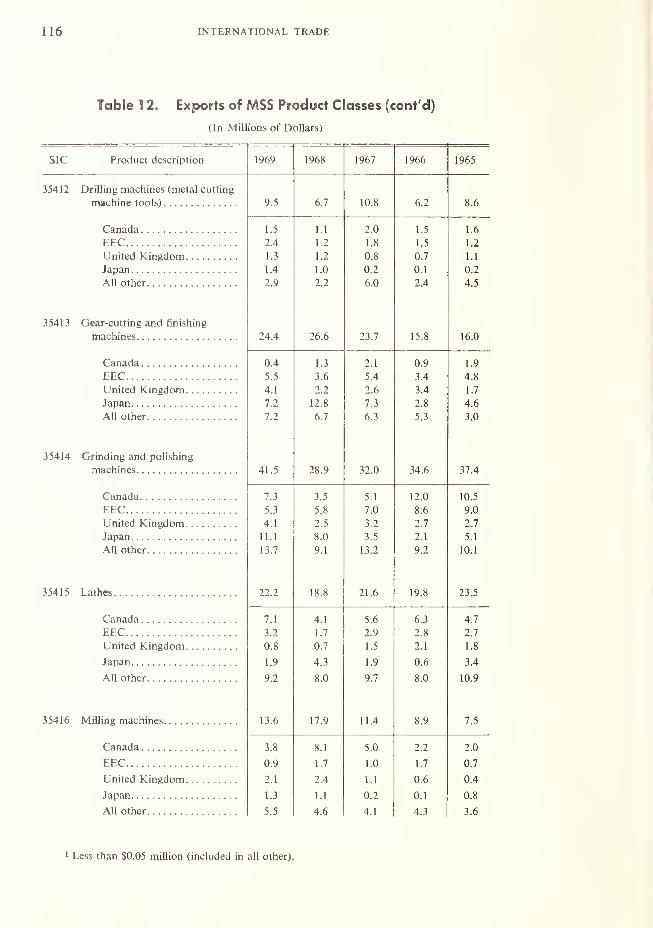
116 INTERNATIONAL TRADE
Table 1 2. Exports of MSS Product Classes (cont'd)
(In Millions of Dollars)
Product description 1 OAQ 1 QA7 1 QAA1 VOO 1 QA<
1 VDJ
35412 Drilling machines (metal cutting
machine tools) 9.5 6.7 10.8 6.2 8.6
Canada 1.5 1.1 2.0 1.5 1.6
EEC 2.4 1.2 1.8 1.5 1.2
United Kingdom 1.3 1.2 0.8 0.7 1.1
Japan 1.4 1.0 0.2 0.1 0.2
All other 2.9 2.2 6.0 2.4 4.5
35413 Gear-cutting and finishing
machines 24.4 26.6 23.7 15.8 16.0
Canada 0.4 1.3 2.1 0.9 1.9
EEC 5.5 3.6 5.4 3.4 4.8
United Kingdom 4.1 2.2 2.6 3.4 1.7
Japan 7.2 12.8 7.3 2.8 4.6
All other 7.2 6.7 6.3 5.3 3.0
35414 Grinding and polishing
machines 41.5 28.9 32.0 34.6 37.4
1.5\ cJ.J C 1
5.1ionIz.U 1L). 5
EEC 5.3 5.8 7.0 8.6 9.0
United Kingdom 4.1 2.5 3.2 2.7 2.7
Japan 11.1 8.0 3.5 2.1 5.1
All other 13.7 9.1 13.2 9.2 10.1
5JH J LL.L ICQ18.
8
1 1 .D1 O Q Z5. J
Canada 7.1 4.1 5.6 6.3 4.7
EEC 3.2 1.7 2.9 2.8 2.7
United Kingdom 0.8 0.7 1.5 2.1 1.8
1 .9 4.3 1 .9 0.6 3.4
All other 9.2 8.0 9.7 8.0 10.9
35416 Milling machines 13.6 17.9 11.4 8.9 7.5
Canada 3.8 8.1 5.0 2.2 2.0
EEC 0.9 1.7 1.0 1.7 0.7
United Kingdom 2.1 2.4 1.1 0.6 0.4
1.3 1.1 0.2 0.1 0.8
All other 5.5 4.6 4.1 4.3 3.6
1 Less than $0.05 million (included in all other).
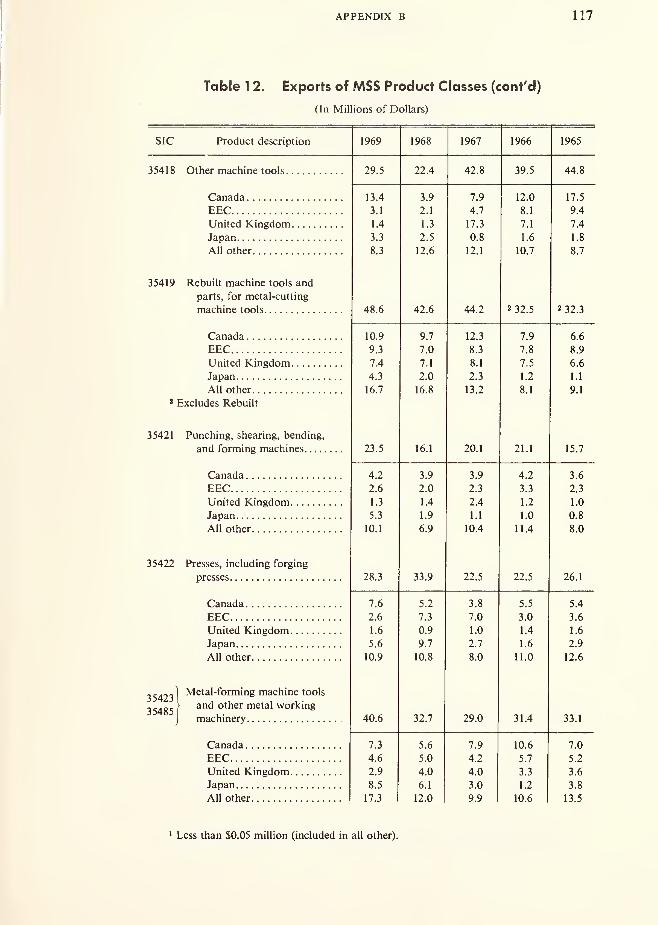
APPENDIX B 117
Table 1 2. Exports of MSS Product Classes (cont'd)
(In Millions of Dollars)
Product description 1 yoy 1 OAS 1 QfilI 7D /
1 Qf*f\ I yoj
35418 29.5 22.4 42.8 39.5 44.8
Panada 13.4 3.9 7.9 12.0 17.5
EEC 3.1 2.1 4.7 8.1 9.4
United Kingdom 1.4 1.3 17.3 7.1 7.4
Japan 3.3 2.5 0.8 1.6 1.8
All other 8.3 12.6 12.1 10.7 8.7
35419 Rebuilt machine tools and
parts, for metal-cutting
machine tools 48.6 42.6 44.2 2 32.5 2 32.3
Canada 10.9 9.7 12.3 7.9 6.6
EEC 9.3 7.0 8.3 7.8 8.9
United Kingdom 7.4 7.1 8.1 7.5 6.6
Japan 4.3 2.0 2.3 1.2 1.1
All other 16.7 16.8 13.2 8.1 9.1
2 Excludes Rebuilt
35421 Punching, shearing, bending,
and forming machines 23.5 16.1 20.1 21.1 15.7
Canada 4.2 3.9 3.9 4.2 3.6
EEC 2.6 2.0 2.3 3.3 2.3
United Kingdom 1.3 1.4 2.4 1.2 1.0
Japan 5.3 1.9 1.1 1.0 0.8
All other 10.1 6.9 10.4 11.4 8.0
35422 Presses, including forging
presses 28.3 33.9 22.5 22.5 26.1
Canada 7.6 5.2 3.8 5.5 5.4
EEC 2.6 7.3 7.0 3.0 3.6
United Kingdom 1.6 0.9 1.0 1.4 1.6
Japan 5.6 9.7 2.7 1.6 2.9
All other 10.9 10.8 8.0 11.0 12.6
35423Metal-forming machine tools
354851 and other metal working
machinery 40.6 32.7 29.0 31.4 33.1
Canada 7.3 5.6 7.9 10.6 7.0
EEC 4.6 5.0 4.2 5.7 5.2
United Kingdom 2.9 4.0 4.0 3.3 3.6
Japan 8.5 6.1 3.0 1.2 3.8
All other 17.3 12.0 9.9 10.6 13.5
1 Less than $0.05 million (included in all other).
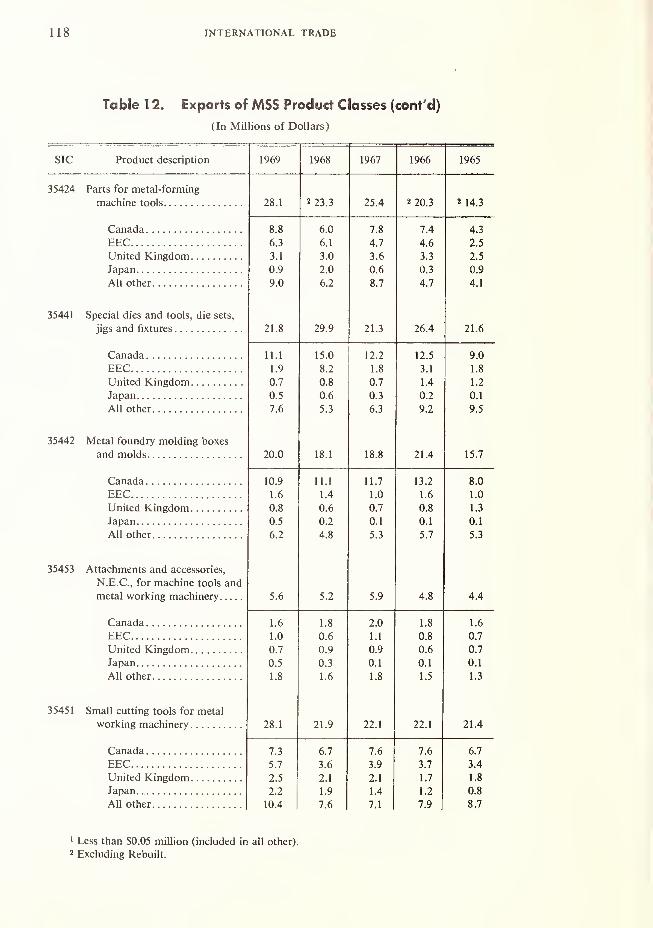
118 INTERNATIONAL TRADE
Table 1 2. Exports of MSS Product Classes (cont'd)
(In Millions of Dollars)
SIC Product description 1969 1968 1967 1966 1965
35424 Parts for metal-forming
machine tools 28.1 2 23.3 25.4 2 20.3 2 14.3
Canada 8.8 6.0 7.8 7.4 4.3
EEC. 6.3 6.1 4.7 4.6 2.5
United Kingdom 3.1 3.0 3.6 3.3 2.5
Japan 0.9 2.0 0.6 0.3 0.9
All other 9.0 6.2 8.7 4.7 4.1
35441 Special dies and tools, die sets,
jigs and fixtures 21.8 29.9 21.3 26.4 21.6
Canada 11.1 15.0 12.2 12.5 9.0
EEC 1.9 8.2 1.8 3.1 1.8
United Kingdom 0.7 0.8 0.7 1.4 1.2
Japan 0.5 0.6 0.3 0.2 0.1
All1.0 C 1J.J C 1O.J y.Z y.D
35442 Metal foundry molding boxes
and molds 20.0 18.1 18.8 21.4 15.7
Canada 10.9 11.1 11.7 13.2 8.0
EEC 1.6 1.4 1.0 1.6 1.0
United Kingdom 0.8 0.6 0.7 0.8 1.3
Japan 0.5 0.2 0.1 0.1 0.1
All other 6.2 4.8 5.3 5.7 5.3
35453 Attachments and accessories,
N.E.C., for machine tools and
5.6 5.2 5.9A O4.8
A A4.4
Canada 1.6 1.8 2.0 1.8 1.6
EEC 1.0 0.6 1.1 0.8 0.7
United Kingdom 0.7 0.9 0.9 0.6 0.7
0.5 0.3 0.1 0.1 0.1
All other 1.8 1.6 1.8 1.5 1.3
35451 Small cutting tools for metal
working machinery 28.1 21.9 22.1 22.1 21.4
Canada 7.3 6.7 7.6 7.6 6.7
EEC 5.7 3.6 3.9 3.7 3.4
United Kingdom 2.5 2.1 2.1 1.7 1.8
Japan 2.2 1.9 1.4 1.2 0.8
All other 10.4 7.6 7.1 7.9 8.7
1 Less than $0.05 million (included in all other).
2 Excluding Rebuilt.
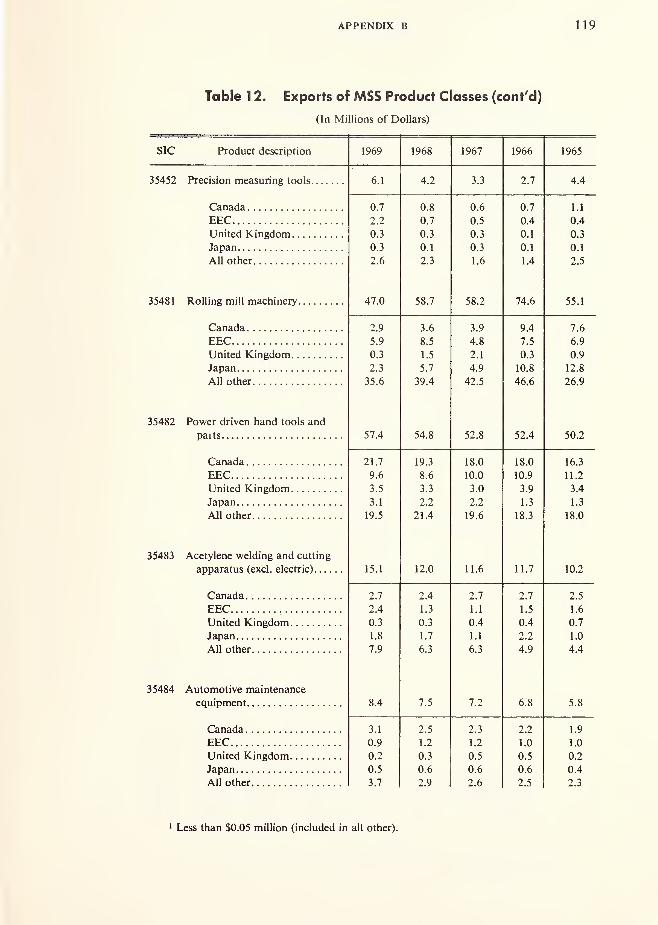
APPENDIX B 119
Table 1 2. Exports of MSS Product Classes (cont'd)
(In Millions of Dollars)
SIC Product description 1969 1968 1967 1966 1965
35452 fS 1 A 1 1
1
A A
Canada 0.7 0.8 0.6 0.7 1.1
EEC 2.2 0.7 0.5 0.4 0.4
United Kingdom 0.3 0.3 0.3 0.1 0.3
0.3 0.1 0.3 0.1 0.1
All other 2.6 2.3 1.6 1.4 2.5
35481 Rolling mill machinery 47.0 58.7 58.2 74.6 55.1
Canada 2.9 3.6 3.9 9.4 7.6
EEC 5.9 8.5 4.8 7.5 6.9
United Kingdom 0.3 1.5 2.1 0.3 0.9
Japan 2.3 5.7 4.9 10.8 12.8
All other 35.6 39.4 42.5 46.6 26.9
35482 Power driven hand tools and
paits 57.4 54.8 52.8 52.4 50.2
Canada 21.7 19.3 18.0 18.0 16.3
EEC 9.6 8.6 10.0 10.9 11.2
United Kingdom 3.5 3.3 3.0 3.9 3.4
Japan 3.1 2.2 2.2 1.3 1.3
All other 19.5 21.4 19.6 18.3 18.0
35483 Acetylene welding and cutting
15.1 12.0 11.6 11.7 10.2
Canada 2.7 2.4 2.7 2.7 2.5
EEC 2.4 1.3 1.1 1.5 1.6
United Kingdom 0.3 0.3 0.4 0.4 0.7
Japan 1.8 1.7 1.1 2.2 1.0
All other 7.9 6.3 6.3 4.9 4.4
35484 Automotive maintenance
equipment 8.4 7.5 7.2 6.8 5.8
Canada 3.1 2.5 2.3 2.2 1.9
EEC 0.9 1.2 1.2 1.0 1.0
United Kingdom 0.2 0.3 0.5 0.5 0.2
Japan 0.5 0.6 0.6 0.6 0.4
All other 3.7 2.9 2.6 2.5 2.3
1 Less than $0.05 million (included in all other).
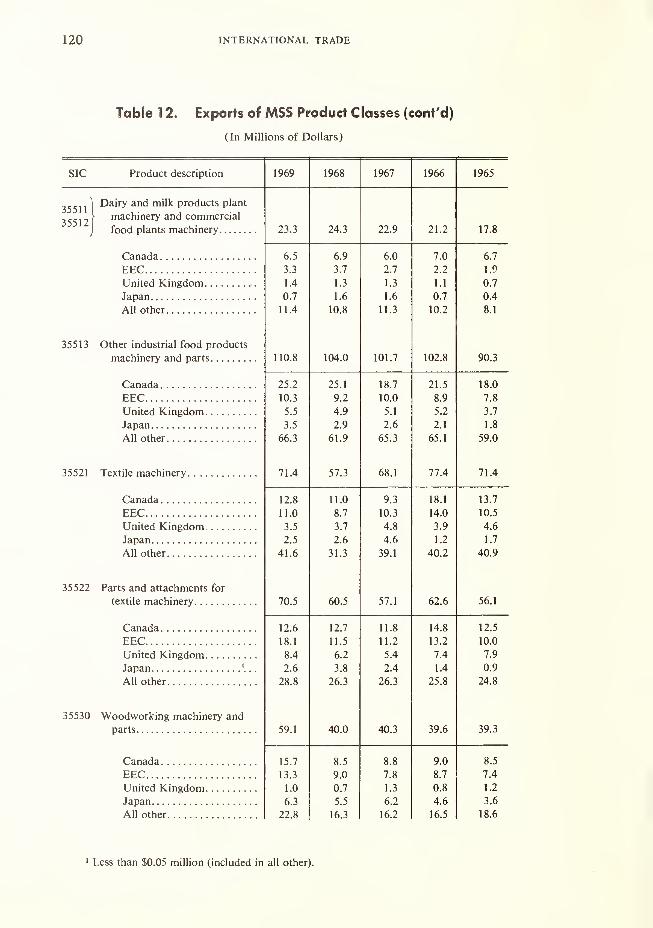
120 INTERNATIONAL TRADE
Table 1 2. Exports of MSS Product Classes (cont'd)
(In Millions of Dollars)
SIC Product description 1969 1968 1967 1966 1965
35511Dairy and milk products plant
machinery and commercial35512
food plants machinery 23.3 24.3 22.9 21.2 17.8
Canada 6.5 6.9 6.0 7.0 6.7
EEC 3.3 3.7 2.7 2.2 1.9
1.4 1.3 1.3 1.1 0.7
Japan 0.7 1.6 1.6 0.7 0.4
All other 11.4 10.8 11.3 10.2 8.1
35513 Other industrial food products
110.8 104.0 101.7 102.8 90.3
Canada 25.2 25.1 18.7 21.5 18.0
EEC 10.3 9.2 10.0 8.9 7.8
United Kingdom 5.5 4.9 5.1 5.2 3.7
Japan 3.5 2.9 2.6 2.1 1.8
All ~- -5
DO. J £1 Q OX j 1Dj. 1
35521 Textile machinery 71.4 57.3 68.1 77.4 71.4
Canada 12.8 11.0 9.3 18.1 13.7
EEC 11.0 8.7 10.3 14.0 10.5
United Kingdom 3.5 3.7 4.8 3.9 4.6
Japan 2.5 2.6 4.6 1.2 1.7
All other 41.6 31.3 39.1 40.2 40.9
35522 Parte anrl flttapVimpntc rtwIT dl IN CtllU CtlladlUICIllo 1 Ul
textile machinery 70.5 60.5 57.1 62.6 56.1
Canada 12.6 12.7 11.8 14.8 12.5
EEC 18.1 11.5 11.2 13.2 10.0
United Kingdom 8.4 6.2 5.4 7.4 7.9
2.6 3.8 2.4 1.4 0.9
All other 28.8 26.3 26.3 25.8 24.8
35530 Woodworking machinery and
59.1 40.0 40.3 39.6 39.3
15.7 8.5 8.8 9.0 8.5
EEC 13.3 9.0 7.8 8.7 7.4
United Kingdom 1.0 0.7 1.3 0.8 1.2
Japan 6.3 5.5 6.2 4.6 3.6
All other 22.8 16.3 16.2 16.5 18.6
1 Less than $0.05 million (included in all other).
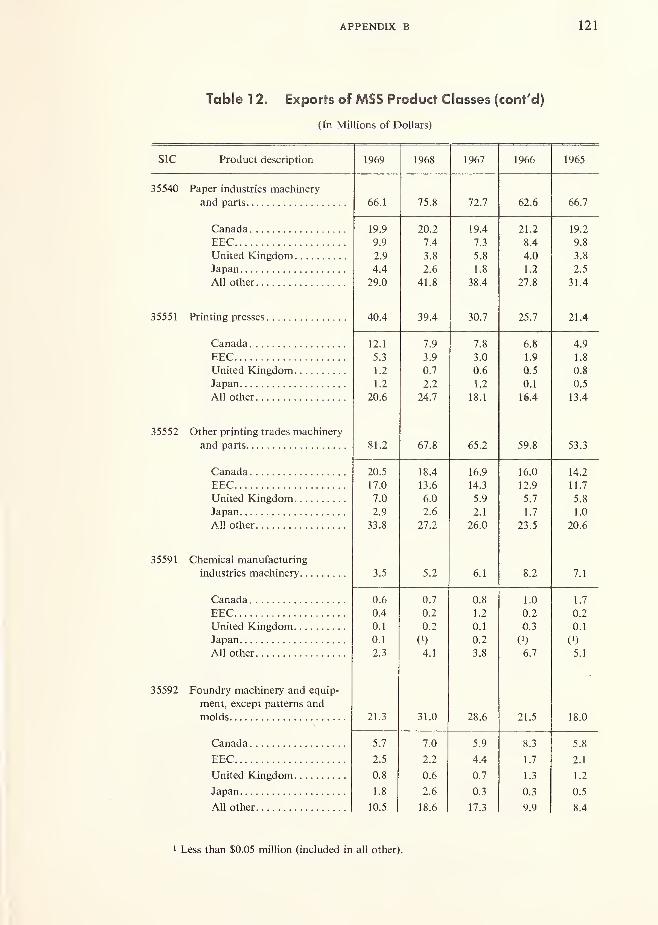
APPENDIX B 121
Table 1 2. Exports of MSS Product Classes (cont'd)
(In Millions of Dollars)
SIC Product description 1969 1968 1967 1966 1965
Paper industries machinery
66.1 75.8 72.7 62.6 66.7
Canada 19.9 20.2 19.4 21.2 19.2
EEC 9.9 7.4 7.3 8.4 9.8
United Kingdom 2.9 3.8 5.8 4.0 3.8
Japan 4.4 2.6 1.8 1.2 2.5
All other 29.0 41.8 38.4 27.8 31.4
A(\ A4U.4 J9.4 1 A "7
5\). 1 25. / 21 .4
Canada 12.1 7.9 7.8 6.8 4.9
EEC 5.3 3.9 3.0 1.9 1.8
United Kingdom 1.2 0.7 0.6 0.5 0.8
Japan 1.2 2.2 1.2 0.1 0.5
All other 20.6 24.7 18.1 16.4 13.4
35552 Other printing trades machineryO 1 ^si.
2
6 1.6 65.2 59.8 53.3
Canada 20.5 18.4 16.9 16.0 14.2
EEC 17.0 13.6 14.3 12.9 11.7
United Kingdom 7.0 6.0 5.9 5.7 5.8
Japan 2.9 2.6 2.1 1.7 1.0
All other 33.8 27.2 26.0 23.5 20.6
35591 Chemical manufacturing
3.5 5.2 6.1 8.2 7.1
Canada 0.6 0.7 0.8 1.0 1.7
EEC 0.4 0.2 1.2 0.2 0.2
United Kingdom 0.1 0.2 0.1 0.3 0.1
yj. i v ) u.z ( ) v)All other 2.3 4.1 3.8 6.7 5.1
35592 Foundry machinery and equip-
ment, except patterns and
molds 21.3 31.0 28.6 21.5 18.0
Canada 5.7 7.0 5.9 8.3 5.8
EEC 2.5 2.2 4.4 1.7 2.1
United Kingdom 0.8 0.6 0.7 1.3 1.2
1.8 2.6 0.3 0.3 0.5
All other 10.5 18.6 17.3 9.9 8.4
1 Less than $0.05 million (included in all other).

122 INTERNATIONAL TRADE
Table 1 2. Exports of MSS Product Classes (cont'd)
(In Millions of Dollars)
SIC Product description 1969 1968 1967 1966 1965
JJJ7J iriasuc-worKing macninery aiiu
equipment, except patterns
and molds 39.5 30.0 28.1 28.9 27.8
1 A Q 1 1 A1 1 .H in 9 1ft \ 7 O1.7
7 91 .1. A 9 j, j fx fto.u O. .1
9 S 9 ? 9 9 9 S 1 A.J .*T
1.6 2.4 1.7 0.8 1,1
All other 13.3 9.8o n0.7 9.3 9.3
35594 Rubber working machinery and
equipment 50.6 43.1 35.9 34.6 42.8
1 1 S1 1 .J Q 8 7 ft 7 Q O.l
s nJ.U f% no.u 8 ft O.j J.*f
1 8J.O 1 fx1 .0 9 9 J.O
Japan 2.3 2.1 1.4 0.2 0.8ATI ( LAll other 28.0 21.5 17.9 18.0 26.9
35595 Other special industrial
machinery 347.0 280.3 255.0 239.0 190.5
Oo.O fxl ft0 / .u OKJ.J A& A
ppr AQ 1 *KA 1 JJ,U 98 ft
T Tinfoi^i 1^"" i f» Ctrl i"\m 1 8 fs ISA 1 6 9 1 1 111.1
Japan 34.8 22.4 15.8 10.0 8.2
All other 175.5 139.4 122.6 116.9 94.8
35613 Domestic water systems and
pumps 2.1 2.0 1.5 1.7 1.4
ft "2
U.J ft "3
U.J ft "2
U.J ft iU.j ft iU.J
ft 1U.l ft 1U.l ft 1U.l V ) v)i\\V) V) W ( ) V)(Vlv ; \ ) V )
All other 1.7 1.6 1.1 1.4 1.1
35614 Air and gas compressors,
except refrigerants 67.8 73.5 81.6 60.5 56.5
Canada 12.3 11.9 17.4 11.4 8.8
EEC 4.7 7.4 4.5 7.1 4.5
United Kingdom 0.8 4.1 2.8 0.5 3.6
Japan 0.9 3.0 2.8 1.5 3.2
All other 49.1 47.1 54.1 40.0 36.4
Less than $0.05 million (included in all other).
APPENDIX B 123
Table 1 2. Exports of MSS Product Classes (cont'd)
(In Millions of Dollars)
SIC Product description 1969 1968 1967 1966 1965
35616 Parts and attachments for air
and gas compressors 156.3 128.3 114.1 99.3 84.4
Canada 42.6 36.0 29.1 25.2 21.7
EEC 21.8 14.7 12.3 8.8 7.4
United Kingdom 9.6 6.7 5.1 4.8 4.4
Japan 6.2 4.7 3.6 4.9 2.2
All other 76.1 66.2 64.0 55.6 48.7
35611 Industrial pumps, except
DO.
J
t>y.(D 05.4 JO. 1
Canada 12.3 12.6 13.4 13.3 11.0
EEC 6.1 6.0 6.2 5.8 4.7
United Kingdom 1.5 1.5 1.0 1.1 1.7
Japan 4.2 4.3 4.3 2.7 3.3
All other 42.4 45.2 45.0 45.5 35.4
35612 Hydraulic fluid power pumpsand motors 29.2 26.8 29.4 27.7 18.2
Canada 9.8 10.1 10.3 8.2 7.1
EEC 5.7 3.6 4.5 4.1 2.5
United Kingdom 2.2 1.6 2.5 2.0 0.9
3.5 4.1 4.1 1.6 1.1
All other 8.0 7.4 8.0 11.8 6.6
35615 Pumps and compressors, n.e.c,
except refrigerants 45.0 34.6 34.1 28.3 26.1
Canada 10.7 8.6 8.4 6.8 7.4
EEC 8.8 6.0 5.1 5.4 4.1
United Kingdom 2.0 2.2 2.3 1.8 1.6
Japan 3.0 1.9 2.0 1.0 0.6
All other 20.5 15.9 16.3 13.3 12.4
35621 Ball bearings, complete 30.8 30.0 29.2 28.5 25.1
Canada 9.5 9.5 10.5 8.5 5.6
EEC 4.9 4.9 4.7 4.8 3.3
United Kingdom 2.7 2.9 2.6 2.3 1.0
Japan 0.9 0.7 0.8 1.1 0.4
All other 12.8 12.0 10.6 11.8 14.8
1 Less than S0.05 million (included in all other)
124 INTERNATIONAL TRADE
Table 1 2. Exports of MSS Product Classes (cont'd)
(In Millions of Dollars)
SIC Product description 1969 1968 1967 1966 1965
35622 Taper roller bearings (except
thrust) 35.8 27.9 32.5 30.8 30.0
Canada 11.4 10.6 13.9 9.8 7.7
EEC 7.4 3.8 3.8 5.2 6.2
United Kingdom 1.6 0.9 1.1 1.4 1.6
Japan 0.5 0.3 0.5 0.3 0.5
All other 14.9 12.3 13.2 14.1 14.0
35623 Other roller bearings, com-
plete 19.7 18.2 19.2 18.8 17.7
Canada 6.6 6.3 7.2 5.7 6.1
EEC. 3.5 2.5 2.6 2.3 2.4
United Kingdom 1.5 1.4 0.9 0.9 1.0
Japan 0.6 0.6 0.6 0.3 0.2
All other 7.5 7.4 7.9 9.6 8.0
35629 Parts for ball and roller bearings. 12.3 7.9 7.3 8.5 8.7
5.2 3.3 3.0 4.9 4.3
EEC 2.3 1.2 1.1 1.3 1.7
United Kingdom 1.7 0.9 1.0 0.4 0.6
Japan 0.3 0.2 0.1 0.1 (')
All other 2.8 2.3 2.1 1.8 2.1
35641 Industrial blowers and fans 15.8 14.2 14.3 14.1 13.6
A 3O.J A 1 ^ AJ.O ^ 7J. /^ i.j.j
per 1 Q 1 A 1 1 Z. 1
T InitAn It i
n
(tHAm U. / U.J n aU.H U.D
fi AU.D Cl AU.D U.J U.j
All nthpr KJ.J u.o j .*+ 6.1
35642 Dust collection, air purification
7.2 7.2 6.0 8.2 5.7
Canada 2.9 2.6 2.7 3.1 1.5
EEC 0.5 0.3 0.5 0.4 0.5
United Kingdom 0.2 0.1 0.1 0.2 0.1
Japan 0.2 0.4 0.1 0.1
All other 3.4 3.8 2.6 4.5 3.5
1 Less than S0.05 million (included in all other).
APPENDIX B 125
Table 1 2. Exports of MSS Product Classes (cont'd)
(In Millions of Dollars)
SIC Product description 1969 1968 1967 1966 1965
JJDOl lo.J 1 K Q 1 yj.y 14 0 1 7 4
Canada 7.5 8.1 8.1 6.5 4.2
EEC 1.2 1.0 0.9 1.0 0.8
United Kingdom 0.7 0.3 0.2 0.1 0.1
Japan 0.5 0.5 0.3 0.2 0.5
All other 8.6 9.0 7.4 7.1 6.8
35662 Speed changers, industrial high-
speed drives and gears 71 7 1Q 1 1 Q Qiy.y 1 f> 71U. ' 16 71U. 1
Canada 6.5 9.4 8.6 8.3 6.5
EEC 4.2 1.7 1.8 1.4 1.2
1.7 1.1 1.7 0.9 1.1
Japan 2.6 2.4 1.7 0.7 1.9
All other 8.7 4.7 6.1 5.4 6.0
356631 Other mechanical power
35623/ transmission equipment 96.7 78.3 77.5 76.4 69.3
Canada 38.1 33.9 34.9 35.4 31.6
EEC 15.5 10.6 10.1 10.1 9.0
United Kingdom 14./ Q Qo.y 7 Q1 .y 7 n/.u S 8J.O
Japan 3.7 2.6 3.0 2.3 2.4
All other 25.2 22.3 21.6 21.6 20.5
35671 Electrical industrial furnaces
and ovens, metal processing.
.
4.8 4.9 6.1 6.2 5.8
Canada 0.9 0.7 0.9 1.4 0.6
EEC 1.0 0.8 0.8 1.5 1.0
United Kingdom 0.2 0.2 0.3 0.1 0.1
Japan 0.9 0.3 0.4 0.1 1.0
All other 1.8 2.9 3.7 3.1 3.1
35673 Other industrial furnaces, and
14.6 14.5 15.1 14.7 15.0
Canada 3.6 4.8 3.5 4.4 4.2
EEC 2.5 1.9 3.0 2.6 2.1
United Kingdom 0.7 0.5 0.6 0.6 0.8
1.5 1.0 1.1 0.4 0.7
All other 6.3 6.3 6.9 6.7 7.2
1 Less than $0.05 million (included in all other).
126 INTERNATIONAL TRADE
Table 1 2. Exports of MSS Product Classes (cont'd)
(In Millions of Dollars)
SIC Product description 1969 1968 1967 1966 1965
35672 Industrial furnaces and ovens,
fuel fired 4.0 2.7 8.4 8.8 3.5
Canada 0.9 0.6 0.6 0.5 0.9
EEC 0.1 0.4 0.6 0.6 0.2
United Kingdom 0.1 0.1 0.3 0.1 0.1
Japan 0) 0.2 0) 0)All ,
i . AMz.y 1 A
1.4 o.y"7 £.1.0 Z.5
35690 General industrial machinery,
n e c 1 14.0 81.7 94.6 84.5 61.3
Canada 30.7 19.7 26.7 25.6 17.2
EEC.
.
16.6 9.7 13.0 11.9 8.2
United Kingdom 6.6 7.0 5.6 4.8 4.5
6.6 4.6 5.0 1 o3.0 2.8
All other 53.5 40.7 43.7 38.4 28.6
35720 Typewriters and parts 37.2 43.1 40.9 33.8 30.4
Canada 8.8 12.8 1 1.3 9.2 6.7
EEC 1 1.5 1 1.9 1 1.2 7.6 7.2
United Kingdom 2.6 2.5 2.1 2.7 2.3
1.7 1.8 2.3 1.6 1.5
All other 12.6 14.1 14.0 12.7 12.7
35760 Scales and balances, except
15.9 12.8 14.1 13.7 13.0
Canada 4.8 2.0 4.5 4.5 3.5
EEC 2.1 0.9 1.4 1.4 1.5
United Kingdom 0.3 0.3 0.3 0.3 0.4
0.1 0.2 0.1 0) 0.1
All other 8.6 9.4 7.8 7.5 7.5
35731 Electronic data processing
machines, except type-
writers and parts 428.5 344.5 313.4 202.9 145.4
Canada 72.6 50.2 45.8 35.4 19.9
EEC 141.3 126.2 118.2 68.0 45.2
United Kingdom 60.2 61.3 49.5 33.3 25.3
52.6 42.1 38.9 22.1 19.7
All other 101.8 64.7 61.0 44.1 35.3
1 Less than $0.05 million (included in all other).
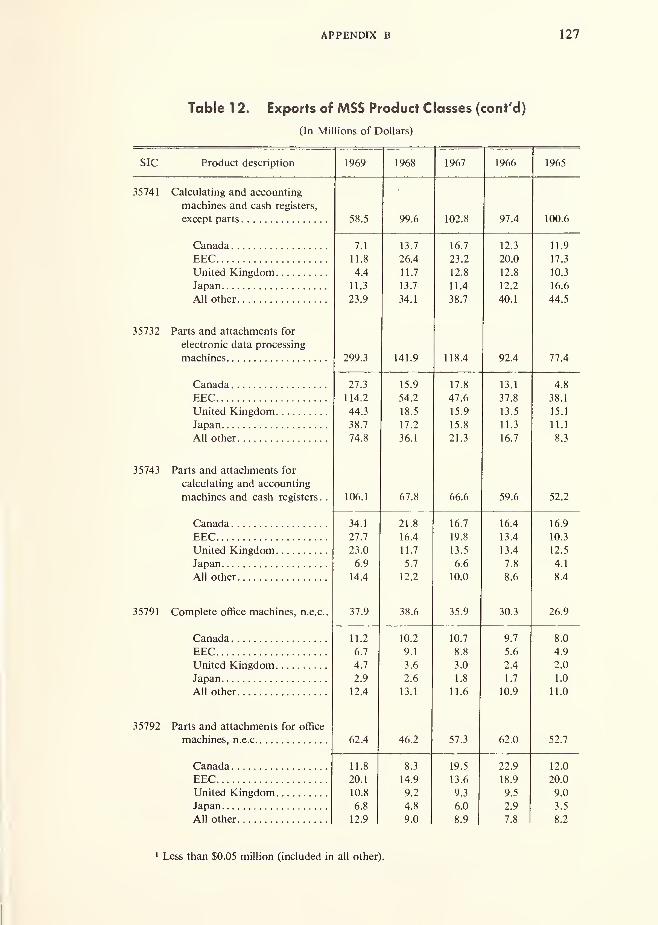
APPENDIX B 127
Table 1 2. Exports of MSS Product Classes (cont'd)
(In Millions of Dollars)
SIC Product description 1969 1968 1967 1966 1965
35741 Calculating and accounting
machines and cash registers,
except parts 58.5 99.6 102.8 97.4 100.6
Canada 7.1 13.7 16.7 12.3 1 1 .9
11.87^ A26.4 23.2 20.0 17.3
United Kingdom A A4.4 11./ 1 ") olz.o 12.0
1 A 710.
3
i i 71 1 .3 13./ 1 1 A
1 1 .4 12.2
All other 23.9 34.1 38.7 40.1 44.5
35/32 Parts and attachments for
electronic data processing
machines 299.3 141.9 118.4 92.4 77.4
Canada 27.3 15.9 17.8 13.1 4.8
EEC 1 14.2 54.2 47.6 37.8 38.1
United Kingdom 44.3 18.5 15.9 13.5 15.1
38. /1 1 71 1 .2.
1 c o15.5 1 1 .3111li.i
All other 74.8 36.1 21.3 16.7 8.3
35743 Parts and attachments for
calculating and accounting
marli ! npc anH r*ach rpoictprQ1 1 1 tlL- 1 11
1
1\. 5 ill 111 V-clMI K^lMtn . . 106.1 67.8 66.6 59.6 52.2
34.1 21 .8 16.7 16.4 16.9
EEC 27.7 16.4 19.8 13.4 10.3
United Kingdom 23.0 11.7 13.5 13.4 12.5
Japan 6.9 5.7 6.6 7.8 4.1
All other 14.4 12.2 10.0 8.6 8.4
35791 Complete office machines, n.e.c. 37.9 38.6 35.9 30.3 26.9
anaHa 1 1 ? 1 ft 1 1f) 7 0 7 8 ft
ppr f, 7 Q 1 c eo .o 4 Q
4.7 3.6 3.0 2.4 2.0
Tar>a n 2.9 2.6 1.8 1.7 1.0
All other 12.4 13.1 11.6 10.9 11.0
35792 Parts and attachments for office
machines, n.e.c 62.4 46.2 57.3 62.0 52.7
Canada 11.8 8.3 19.5 22.9 12.0
EEC 20.1 14.9 13.6 18.9 20.0
United Kingdom 10.8 9.2 9.3 9.5 9.0
Japan 6.8 4.8 6.0 2.9 3.5
All other 12.9 9.0 8.9 7.8 8.2
1 Less than $0.05 million (included in all other).
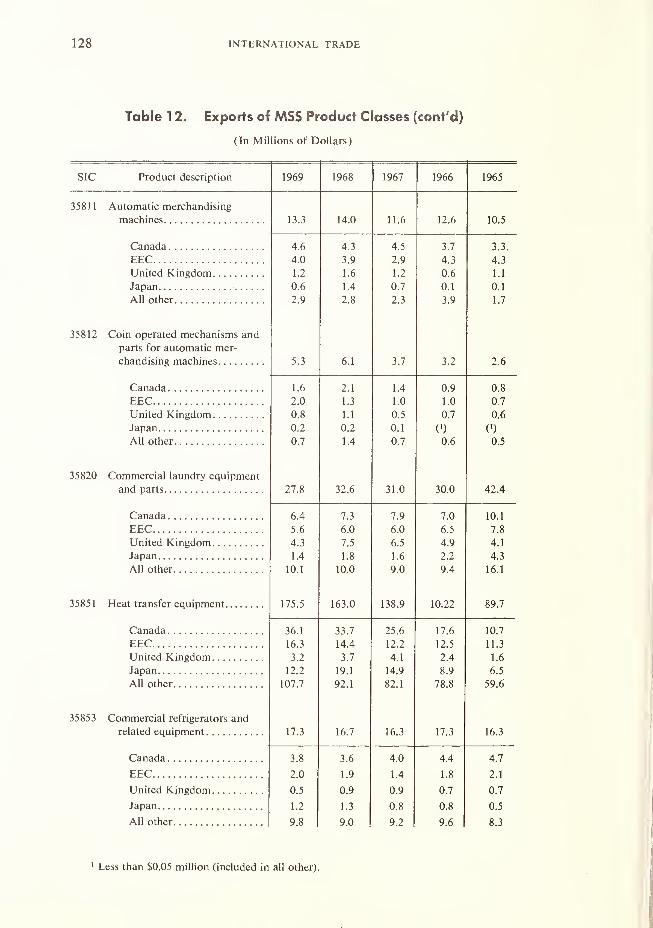
128 INTERNATIONAL TRADE
Table 1 2. Exports of MSS Product Classes (cont'd)
(In Millions of Dollars)
SIC Product description 1969 1968 1967 1966 1965
3581 1 Automatic merchandising
machines 13.3 14.0 11.6 12.6 10.5
A f> t. J A SH.J J.J
.
EEC 4.0 3.9 7 Q A 7 A 7*T. J
I InitfH JCinffHnm 1.2 1 .6 1.2 0.6 1.1
Japan 0.6 1.4 0.7 0.1 0.1
All other 2.9 2.8 2.3 3.9 1.7
35812 Coin operated mechanisms and
parts for automatic mer-PnEinriiCinCT m a r* n inpc j .j f\ 1 j . / 7 7 7 fi
1 .6 7 1 1 A ft 0 0 8
EEC 2.0 1.3 1 .0 1.0 0.7
United Kingdom 0.8 1.1 0.5 0.7 0.6
0.2 0.2 0.1 (') 0)All other 0.7 1.4 0.7 0.6 0.5
J JOL.KJ I*nm m<*T*r*i c\\ l^iinH pmn r\m pntk^Ull 11 1 1L i C Ull I a U \ I Ul y CU U1DIJ 1CI1 1
a nH rMirtc 77 8 77 f\ J 1 .u A~> A
f, A 7 7 7 0 7 0 If) 1
EEC 5.6 6.0 6.0 6.5 7.8
United Kingdom 4.3 7.5 6.5 4.9 4.1
1.4 1.8 1.6 2.2 4.3
All other 10.1 10.0 9.0 9.4 16.1
35851 Heat transfer equipment 175.5 163.0 138.9 10.22 89.7
36.1 33.7 25.6 17.6 10.7
EEC 16.3 14.4 12.2 12.5 11.3
United Kingdom 3.2 3.7 4.1 2.4 1.6
12.2 19.1 14.9 8.9 6.5
All other 107.7 92.1 82.1 78.8 59.6
35853 Commercial refrigerators and
related equipment 17.3 16.7 16.3 17.3 16.3
Canada 3.8 3.6 4.0 4.4 4.7
EEC 2.0 1.9 1.4 1.8 2.1
United Kingdom 0.5 0.9 0.9 0.7 0.7
1.2 1.3 0.8 0.8 0.5
All other 9.8 9.0 9.2 9.6 8.3
Less than $0.05 million (included in all other).

APPENDIX B 129
Table 1 2. Exports of MSS Product Classes (cont'd)
(In Millions of Dollars)
SIC Product description 1969 1968 1967 1966 1965
35857 Other refrigeration and air-
conditioning equipment 119.4 96.1 84.0 74.4 59.6
Canada 33.3 28.1 20.3 18.5 15.9
EEC 23.8 18.7 15.8 14.3 10.0
4.5 3.8 3.6 3.8 2.5
Japan 8.4 6.7 4.5 1.2 1.1
4Q 7 38 8 ?Q 8jy.o JO.U JU. 1
35854 Compressors and compressor
34.5 29.9 25.0 26.8 33.4
Canada 10.0 8.8 5.9 4.2 6.9
EEC 4.1 5.1 4.1 3.4 6.6
United Kingdom 0.3 0.4 0.4 0.4 1.0
Japan 0.5 1.1 0.6 0.2 0.2
A 11 r*tht*r 14 S 1 8 710./
35855 Condensing units, all
17.9 16.0 16.5 15.6 15.2
Canada 5.6 4.2 5.4 3.8 4.1
EEC 1.0 1.0 1.1 1.3 1.4
United Kingdom 0.4 0.6 0.5 0.4 0.3
Japan 0.2 0.5 0.4 0.1 0.3
All ntV\t*r in 7 Q 7y. / Q 1y. i 0 1
35860 Measuring and dispensing
17.7 15.9 17.5 16.4 16.8
Canada 3.7 3.4 3.2 3.6 3.6
EEC 2.9 2.8 3.2 2.9 2.6
United Kingdom 0.4 0.4 0.4 0.5 0.4
A O A A A £. A 1U.J
All rtlUar Q Qy.o Q 7 1 n 1 Q A Q Qy.y
35891 Commercial cooking and food
13.4 10.8 8.8 i.i 6.5
Canada 4.9 4.3 3.6 3.0 2.1
EEC 1.3 0.8 0.6 0.6 0.6
1.0 0.6 0.5 0.6 0.5
Japan 0.6 0.6 0.3 0.2 0.2
All other 5.6 4.5 3.8 3.3 3.1
1 Less than $0.05 million (included in all other)
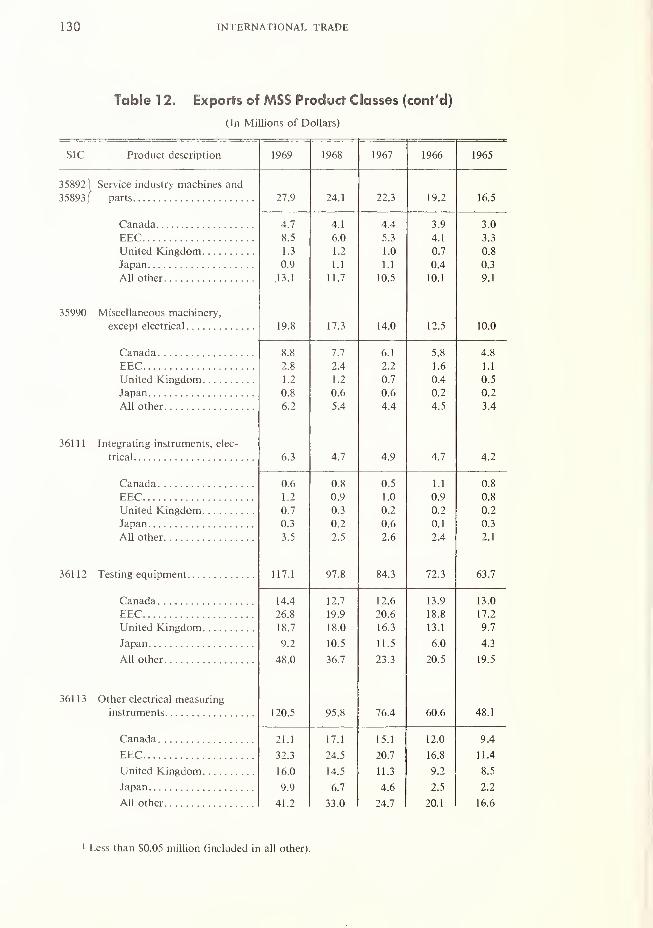
130 INTERNATIONAL TRADE
Table 1 2. Exports of MSS Product Classes (cont'd)
(In Millions of Dollars)
SIC PmH lift HpQprir^tiori 1969 1968 1967 1966 1965
35892) Service industry machines and
35893/ parts 27.9 24.1 22.3 19.2 16.5
Canada 4.7 4.1 4.4 3.9 3.0
EEC 8.5 6.0 5.3 4.1 3.3
United Kingdom 1.3 1.2 1.0 0.7 0.8
Japan 0.9 1.1 1.1 0.4 0.3
All other .13.1 11.7 10.5 10.1 9.1
35990 Miscellaneous machinery,
except electrical 19.8 17.3 14.0 12.5 10.0
Canada 8.8 7.7 6.1 5.8 4.8
2.8 2.4 2.2 1.6 1.1
United Kingdom 1.2 1 .2 0.7 0.4 0.5
0.8 0.6 0.6 0.2 0.2
All other 6.2 5.4 4.4 4.5 3.4
361 1
1
Integrating instruments, elec-
trical 6.3 4.7 4.9 4.7 4.2
Canada 0.6 0.8 0.5 1.1 0.8
p i t i ol .u a qu.y f\ QU.5
United Kingdom 0.7 0.3 0.2 0.2 0.2
Japan 0.3 0.2 0.6 0.1 0.3
All other 3.5 2.5 2.6 2.4 2.1
36112 117.1 97.8 84.3 72.3 63.7
Canada 14.4 12.7 12.6 13.9 13.0
EEC 26.8 19.9 20.6 18.8 17.2
United Kingdom 18.7 18.0 16.3 13.1 9.7
Japan 9.2 10.5 11.5 6.0 4.3
All other 48.0 36.7 23.3 20.5 19.5
36113 Other electrical measuring
120.5 95.8 76.4 60.6 48.1
Canada 21.1 17.1 15.1 12.0 9.4
EEC 32.3 24.5 20.7 16.8 11.4
United Kingdom 16.0 14.5 11.3 9.2 8.5
Japan 9.9 6.7 4.6 2.5 2.2
All other 41.2 33.0 24.7 20.1 16.6
Less than $0.05 million (included in all other).

APPENDIX B 131
Table 1 2. Exports of MSS Product Classes (cont'd)
(In Millions of Dollars)
SIC Product description 1969 1968 1967 1966 1965
36121 Specialty transformers and
fluorescent ballasts, except
6.9 6.1 6.5 6.9 0. /
Canada 1.3 1.7 1.9 1.1 1.8
EEC 1.1 0.9 0.7 0.7 0.5
United Kingdom 0.2 0.1 0.1 0.1 0.1
Japan 0.2 0.1 0) 0)
All other 4.1 3.3 3.8 5.0 4.3
36122 Power and distribution trans-
formers 1 1 c\1 1 .9
1 1 i13.3 1 A C14.0 lo.l in i19. J
Canada 0.4 0.3 0.4 0.9 0.7
EEC 0.3 0.2 0.3 0.3 0.2
United Kingdom (') 0.1 (') 0.3 0)
Japan 0.1 0.1 (') (') 0.1
All other 11.1 12.6 13.9 14.6 18.3
36123 Power regulators, boosters, and
transformer parts 15.41 A T14.7 1 1 i
li.l 1 1 .j1 A O10.0
Canada 6.4 5.3 5.0 4.9 4.0
EEC 1.2 1.1 0.6 1.1 1.2
United Kingdom 0.2 0.2 0.3 0.2 0.3
0.3 0.1 0.2 0.2 0.3
All nther 7.3 8.0 7.6 4.9 5.0
3613 Switchgear and switchboard
apparatus 75.5 73.5 72.8 71.0 63.4
Canada 15.3 13.7 14.3 16.3 18.3
EEC 5.2 4.0 4.2 3.5 3.0
1 1 1 i <i .j i . j
1 Q j 5 1 .2 j 7 1.0
All other 51.1 52.2 51.5 48.0 39.6
36211 Fractional horsepower motors. .
.
19.7 15.7 15.5 14.0 11.6
Canada 6.8 5.7 6.2 6.0 4.8
EEC 4.4 3.0 3.2 2.4 1.6
United Kingdom 1.5 1.5 0.9 0.7 0.7
Japan 1.9 1.4 1.4 1.4 1.3
All other 5.1 4.1 3.8 3.5 3.2
1 Less than SO.05 million (included in all other)
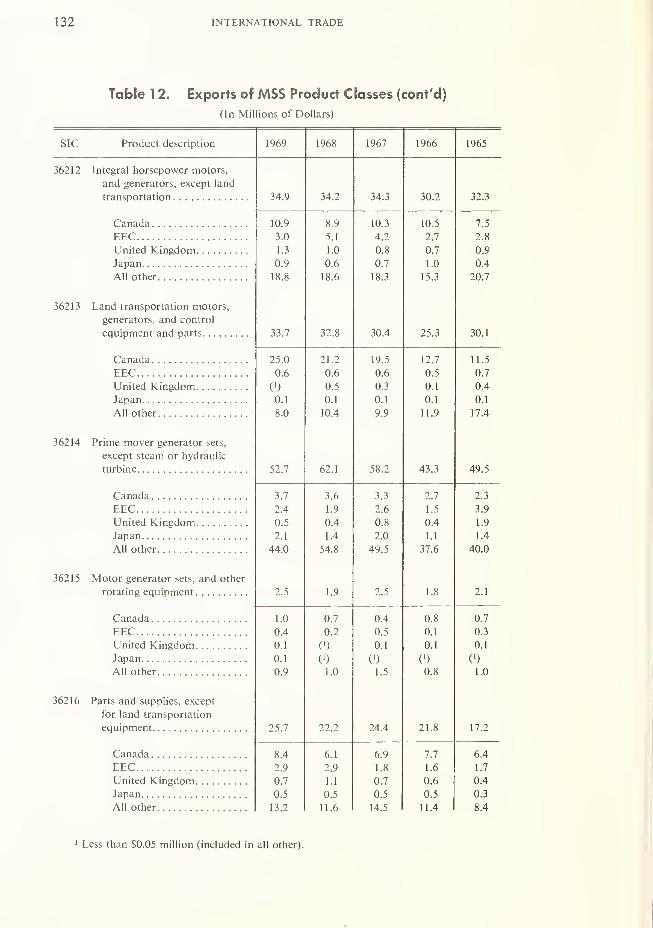
132 INTERNATIONAL TRADE
Table 1 2. Exports of MSS Product Classes (cont'd)
(In Millions of Dollars)
ML Product description lyoy lyoo iyo/ iyoo iyto
36212 Integral horsepower motors,
and generators, except land
transportation 34.9 34.2 34.3 30.2 32.3
Canada 10.9 8.9 10.3 10.5 7.5
EEC 3.0 5.1 4.2 2.7 2.8
United Kingdom 1.3 1.0 0.8 0.7 0.9
Japan 0.9 0.6 0.7 1.0 0.4
All other 18.8 18.6 18.3 15.3 20.7
36213 Land transportation motors,
generators, and control
equipment and parts 33.7 32.8 30.4 25.3 30.1
Canada 25.0 21.2 19.5 12.7 11.5
EEC 0.6 0.6 0.6 0.5 0.7
United Kingdom V / 0.5 0.3 0.1 0.4
Japan 0.1 0.1 0.1 0.1 0.1
All other 8.0 10.4 9.9 11.9 17.4
36214 Prime mover generator sets,
except steam or hydraulic
turbine 52.7 62.1 58.2 43.3 49.5
Canada 3.7 3.6 3.3 2.7 2.3
EEC 2.4 1.9 2.6 1.5 3.9
United Kingdom 0.5 0.4 0.8 0.4 1.9
Japan 2.1 1.4 2.0 1.1 1.4
All other 44.0 54.8 49.5 37.6 40.0
36215 Motor generator sets, and other
rotating equipment 2.5 1.9 2.5 1.8 2.1
Canada 1.0 0.7 0.4 0.8 0.7
EEC 0.4 0.2 0.5 0.1 0.3
IJnifpri 1^ inoHnm 0.1 0.1 0.1 0.1
lapan 0.1 V / f 1)V /(!)
All other 0.9 1.0 1.5 0.8 1.0
36216 Parts and supplies, except
for land transportation
equipment 25.7 22.2 24.4 21.8 17.2
Canada 8.4 6.1 6.9 7.7 6.4
EEC 2.9 2.9 1.8 1.6 1.7
United Kingdom 0.7 1.1 0.7 0.6 0.4
Japan 0.5 0.5 0.5 0.5 0.3
All other 13.2 11.6 14.5 11.4 8.4
Less than $0.05 million (included in all other).
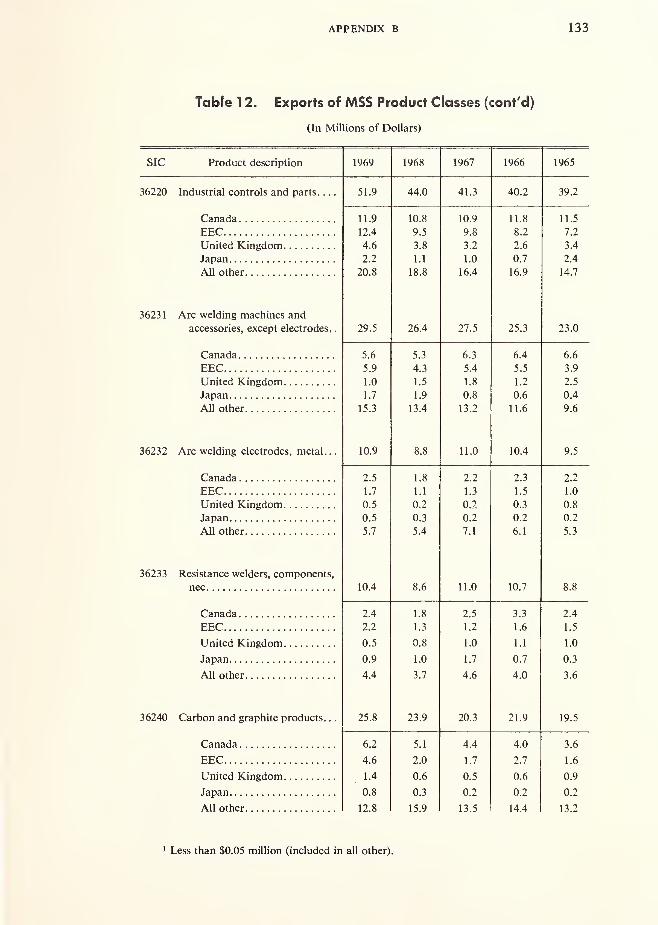
APPENDIX B 133
Table 1 2. Exports of MSS Product Classes (cont'd)
(In Millions of Dollars)
SIC Product description 1969 1968 1967 1966 1965
36220 Industrial controls and parts. . .
.
51.9 44.0 41.3 40.2 39.2
Canada 11.9 10.8 10.9 11.8 11.5
EEC 12.4 9.5 9.8 8.2 7.2
United Kingdom 4.6 3.8 3.2 2.6 3.4
Japan 2.2 1.1 1.0 0.7 2.4
All other 20.8 18.8 16.4 16.9 14.7
36231 Arc welding machines and
accessories, except electrodes.
.
29.5 26.4 27.5 25.3 23.0
Canada 5.6 5.3 6.3 6.4 6.6
EEC 5.9 4.3 5.4 5.5 3.9
United Kingdom 1.0 1.5 1.8 1.2 2.5
Japan 1.7 1.9 0.8 0.6 0.4
All other 15.3 13.4 13.2 11.6 9.6
36232 Arc welding electrodes, metal..
.
10.9 8.8 11.0 10.4 9.5
2.5 1.8 2.2 2.3 2.2
EEC 1.7 1.1 1.3 1.5 1.0
ft 9 n ~> ft X ft 8
Japan 0.5 0.3 0.2 0.2 0.2
All other 5.7 5.4 7.1 6.1 5.3
36233 Resistance welders, components,
10.4 8.6 11.0 10.7 8.8
Canada 2.4 1.8 2.5 3.3 2.4
EEC 2.2 1.3 1.2 1.6 1.5
United Kingdom 0.5 0.8 1.0 1.1 1.0
0.9 1.0 1.7 0.7 0.3
All other 4.4 3.7 4.6 4.0 3.6
36240 Carbon and graphite products. .
.
25.8 23.9 20.3 21.9 19.5
Canada 6.2 5.1 4.4 4.0 3.6
EEC 4.6 2.0 1.7 2.7 1.6
United Kingdom 1.4 0.6 0.5 0.6 0.9
0.8 0.3 0.2 0.2 0.2
All other 12.8 15.9 13.5 14.4 13.2
1 Less than $0.05 million (included in all other)

134 INTERNATIONAL TRADE
Table 1 2. Exports of MSS Product Classes (cont'd)
(In Millions of Dollars)
SIC Product description 1969 1968 1967 1966 1965
36291 Capacitors for industrial use
(except for electronic appli-
cations) 3.3 3.2 3.0 2.6 2.6
Canada 0.9 0.6 0.7 0.7 0.8
EEC 0.3 0.3 0.4 0.3 0.3
United Kingdom 0.1 0.1 0.1 0.1 0.1
Japan 0.4 C1) 0.2 (0 0)
All other 1.6 2.2 1.6 1.5 1.4
1 1 111.-' 1 7 1 C AO.H I 1 fiI I .u /.J
Canada 2.1 1.9 1.8 2.1 1.6
EEC 2.2 3.3 1.9 2.1 0.9
United Kingdom 1.7 0.7 0.6 1.0 1.0
0.3 0.1 0.2 0.1 0.1
All other 5.0 6.3 3.9 5.7 3.7
36311 Electric household cookingO A V A 7 7
/. /7 7 (- A
Canada 2.9 2.5 2.2 2.4 0.4
EEC 0.6 1.1 0.9 0.4 0.5
United Kingdom 0.8 0.9 1.1 0.8 0.2
0.5 0.3 0.3 0.3 0.4
All other 3.6 3.6 3.2 3.3 5.1
Household cooking equipment
and parts, except electric 10.5 11.5 12.2 6.4 6.8
Canada 3.3 2.6 2.9 0.4 0.4
EEC 0.4 0.6 0.6 0.1 0.1
United Kingdom 0.3 0.7 0.3 (') (')
0.2 0.3 0.3 (') 0)All other 6.3 7.3 8.1 5.9 6.3
36341 Electric fans except industrial. .
.
1.9 1.6 1.6 1.6 1.9
Canada 0.7 0.7 0.4 0.5 0.7
EEC (') (') (') 0.2
United Kingdom 0) (') (') (')
(') 0.1 0) (') (')
All other: 1.2 0.8 1.2 1.1 1.0
1 Less than $0.05 million (included in all other).

APPENDIX B 135
Table 1 2. Exports of MSS Product Classes (cont'd)
(In Millions of Dollars)
SIC Product description 1969 1968 1967 1966 1965
36342 Electric razors and dry shavers.
.
0.3 0.6 1.1 1.1 1.3
Canada 0.1 0.1 0.3 0.6 0.3
EEC V) 0) 0.1 0.1 0.1
United Kingdom 0) 0.1 0.5 0.2 0.2
Japan (') 0)All other 0.2 0.4 0.2 0.2 0.7
36344 Parts and attachments for small
household electric appliances.
.
12.6 12.4 11.7 10.9 8.8
Canada 7.6 6.7 5.9 5.5 4.0
EEC 1.1 1.4 1.5 1.4 1.8
United Kingdom 0.7 1.1 1.4 1.3 0.6
Japan 0.1 0.1 0.1 0) (')
All nther 3.1 3.1 2.8 2.7 2.4
36391 Household water heaters and
parts, electric 1.6 1.0 1.0 1.0 1.0
Canada 0.1 0.2 0.1 0.1 0.1
EEC 0.1 C1) 0) 0.1 (')
United Kingdom (i) (i) (') (')
Japan 0.5 0 C1) (')
All nther 0.9 0.8 0.9 0.8 0.9
36392 Household water heaters, except
electric 6.4 5.1 4.3 3.1 2.6
Canada 2.1 1.8 1.3 1.2 1.0
EEC 1.0 0.6 0.3 0.2 0.2
United Kingdom 0.2 0.1 0.7 0) 0)
Japan 0.7 0.7 0.6 0.2 0.1
All other 2.4 1.9 1 4 1.5 1.3
36393 Other household appliances
11.2 10.4 10.5 12.3 10.5
Canada 5.9 4.7 4.1 3.9 3.6
EEC 1.2 1.4 1.7 3.6 2.8
United Kingdom (!) 0.1 0.2 0.2 (!)
Japan 0.2 0.2 0.1 0.1 0.1
All other 3.9 4.0 4.4 4.5 4.0
1 Less than $0.05 million (included in all other).
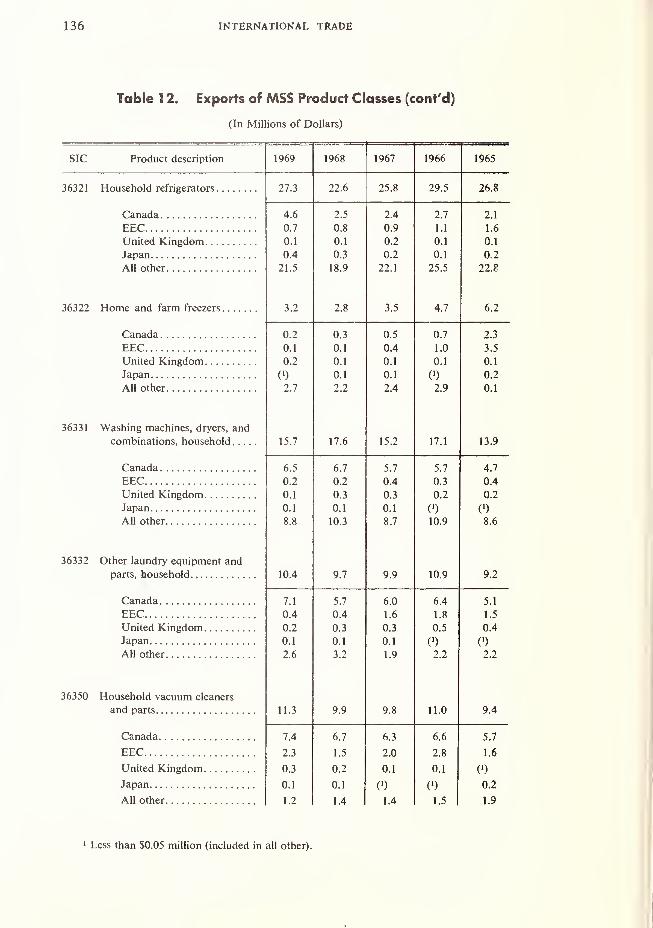
136 INTERNATIONAL TRADE
Table 1 2. Exports of MSS Product Classes (cont'd)
(In Millions of Dollars)
SIC Product description 1969 1968 1967 1966 1965
36321 27.3 22.6 25.8 29.5 26.8
4.6 2.5 2.4 2.7 2.1
a n0.7
A O0.8 A A0.9 1.1 1.6
United Kingdom 0.1A 10.1
A T0.2
A 10.1
A t0.1
Japan 0.4 0.3 0.2 0.1 0.2
21.5 18.9 22.1 25.5 22.8
36322 3.2 2.8 3.5 4.7 6.2
0.2 0.3 0.5 0.7 2.3
0.1 0.1 0.4 1.0 3.5
United Kingdom 0.2 0.1 0.1 0.1 0.1
0) 0.1A 10.1 C
1)
A 10.2
All other 2.7 2.2 2.4 2.9 0.1
ioiil Washing machines, dryers, and
combinations, household 15.7 17.6 15.2 17.1 13.9
6.5 6.7 5.7 5.7 4.7
0.2 0.2 0.4 0.3 0.4
United Kingdom 0.1 0.3 0.3 0.2 0.2
0.1 0.1 0.1 (') (')
All other 8.8 10.3 8.7 10.9 8.6
36332 \_/UId laUIIUI V GUU1L/II1G1J l dllU
parts, household 10.4 9.7 9.9 10.9 9.2
Canada 7.1 5.7 6.0 6.4 5.1
EEC 0.4 0.4 1.6 1.8 1.5
United Kingdom 0.2 0.3 0.3 0.5 0.4
0.1 0.1 0.1 0) (')
2.6 3.2 1.9 2.2 2.2
36350 Household vacuum cleaners
and parts 11.3 9.9 9.8 11.0 9.4
Canada 7.4 6.7 6.3 6.6 5.7
EEC 2.3 1.5 2.0 2.8 1.6
United Kingdom 0.3 0.2 0.1 0.1 0)
0.1 0.1 0) Q) 0.2
All other 1.2 1.4 1.4 1.5 1.9
Less than S0.05 million (included in all other).

APPENDIX B 137
Table 1 2. Exports of MSS Product Classes (cont'd)
(In Millions of Dollars)
SIC Product description 1969 1968 1967 1966 1965
36360 Sewing machines and parts 39.1 32.3 28.9 30.6 30.6
Canada 5.1 4.6 3.7 4.1 3.5
EEC 10.8 7.5 6.2 7.7 8.9
United Kingdom 5.2 5.0 4.2 4.2 5.6
Japan 2.5 1.8 1.6 1.2 1.1
All other 15.5 13.4 13.2 13.4 11.5
36410 Electric lamps (bulbs only) 31.5 30.7 30.9 30.0 25.7
Canada 12.0 10.1 10.6 9.4 7.4
EEC 6.9 6.2 6.2 7.4 3.6
United Kingdom 1.0 0.9 0.8 0.9 0.6
1.3 0.8 0.4 0.3 0.2
All other 10.3 12.7 12.9 12.0 13.9
36421) Residential-type fixtures 3.3 3.2 8.6 8.2 3.4
36427/
Canada 1.2 1.0 4.7 4.3 1.3
A 10.3 0.3 0.1
United Kingdom rri 0.1 \ ) \ ) V )
Japan 0) (!) 0.1 0.2 0)
All other 2.0 2.1 3.5 3.4 2.0
36422) Commercial and industrial
36423
J
lighting fixtures 6.6 7.1 6.0 6.3 5.5
Canada 2.5 2.6 2.6 2.1 1.6
EEC 0.3 0.5 0.2 0.7 0.3
United Kingdom 0) 0.1 0.1 C1) 0.1
Japan 0.2 0.1 0.1 0.3 0.1
All other 3.6 3.8 3.0 3.2 3.4
36425 Outdoor lighting equipment 5.9 4.9 4.3 3.0 2.4
Canada 0.9 1.0 1.1 0.9 0.6
EEC 0.7 0.1 0.1 0.4 0.1
United Kingdom 1.1 0.1 0.1 0) (')
Japan (') 0) 0.1 (') 0.1
All other 3.2 3.7 2.9 1.7 1.6
1 Less than S0.05 million (included in all other)

138 INTERNATIONAL TRADE
Table 1 2. Exports of MSS Product Classes (cont'd)
(In Millions of Dollars)
Product description 1 QfiQ1 yOy 1 QAR1 7O0 I yO 1 1 Q^fi1 7DO I7DJ
36426 Other lighting equipment, parts
and accessories 12.6 11.5 11.5 10.7 8.6
Canada 3.2 3.5 3.4 3.9 3.0
EEC 1.0 0.8 0.7 0.7 0.6
United Kingdom 0.8 0.8 0.7 0.4 0.3
Japan 0.3 0.3 0.2 0.2 0.3
All other 7.3 6.1 6.5 5.5 4.4
36424 Vehicular lighting equipment,
20.5 14.8 12.1 9.6 7.3
Canada 18.5 12.9 10.5 8.1 5.9
EEC 0.1 0.2 0.3 0.2 0.2
United Kingdom 0.1 0.1 (') 0.1 0.1
0.1 0.1 0.1 0.1 (')
All other 1.7 1.5 1.2 1.1 1.1
36430 Current-carrying wiring devices.
.
116.0 94.5 87.2 77.4 59.3
Canada 31.0 28.3 26.5 26.1 20.1
EEC 29.7 21.3 21.3 18.0 14.0
United Kingdom 12.9 11.8 11.2 12.2 7.3
13.1 8.8 7.1 4.8 3.0
All other 29.3 24.3 21.1 16.3 14.9
36441 Pole-line and transmission
7.7 6.0 5.7 7.0 6.5
Canada 0.9 0.8 1.0 1.6 1.6
perV.J U.Z U.l u. 1 U.l
United Kingdom 0.1 0.1 0.1 0.1 0.1
Japan 0.1 0) (') 0.1 0)All other 6.3 4.9 4.5 5.1 4.7
36442 Electric conduit and conduit
fittings 16.6 14.2 17.2 15.9 13.6
Canada 4.2 3.8 4.4 4.7 4.0
EEC 1.7 1.0 1.0 1.2 1.0
United Kingdom 0.8 0.8 1.0 1.3 0.9
Japan 0.6 0.2 0.2 0.1 0.2
All other 9.3 8.4 10.6 8.6 7.5
1 Less than $0.05 million (included in all other).

APPENDIX B 139
Table 1 2. Exports of MSS Product Classes (cont'd)
(In Millions of Dollars)
SIC Product description 1969 1968 1967 1966 1965
36443 Other non-current carrying
wiring devices 1.3 1.2 1.1 1.0 1.1
Canada 0.3 0.4 0.5 0.6 0.5
EEC 0.1 (') (') (')
United Kingdom (l) 0) (!) (!)
Japan (>) (') c> 0) (')
All other 0.9 0.8 0.6 0.4 0.6
36511 Household and automobile
radios and radio-phono-
graph combinations 19.1 14.6 12.0 10.3 10.3
Canada 12.7 9.4 6.7 4.2 3.9
EEC 1.7 1.0 1.4 1.2 1.4
United Kingdom 0.3 Q.4 0.2 0.3 0.2
Japan 0.1 0.2 0.1 0.1 0)
All other 4.3 3.6 3.6 4.5 4.8
36512 Household television receivers. .
.
I /.O Zi.b ZD. J 21 .i
Canada 23.6 17.3 13.4 14.2 6.0
EEC 0.1 0.1 0.4 0.2 0.7
United Kingdom 0.1 (') 0.1 0.1 C1)
Japan V) 0.1 0.1 0.1
All other 9.5 10.4 9.6 11.7 14.5
365 14\ Other audio equipment and
36515/ accessories 102.1 82.9 59.8 57.2 51 .4
Canada 16.7 17.6 9.9 9.7 6.8
EEC 29.5 20.9 17.2 16.2 16.7
United Kingdom 1 1.5 9.7 4.2 5.6 5.5
Japan 7.1 5.9 4.5 3.3 2.8
All other 37.3 28.8 24.0 22.4 19.6
36611 Telephone switching and
switchboard equipment 2.0 1.0 1.0 0.6 1.1
Canada 0.5 0.1 0.1 0.2 0.2
EEC (') (') (') ()
United Kingdom (') 0) 0.1 (') ()
Japan 0.1 (>) C1) (>)
All other 1.4 0.9 0.8 0.4 0.9
1 Less than S0.05 million (included in all other)
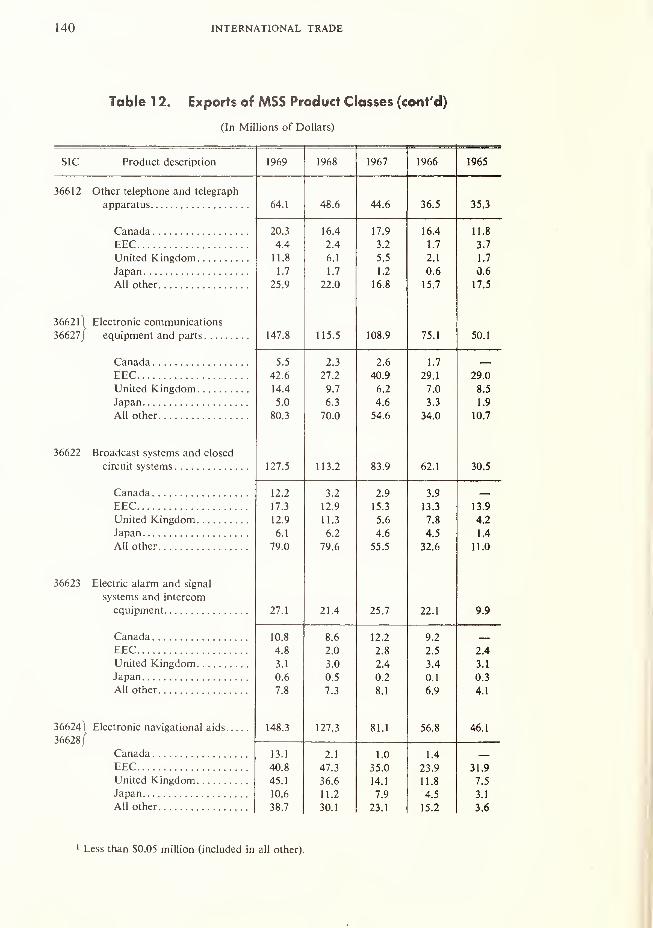
140 INTERNATIONAL TRADE
Table 1 2. Exports of MSS Product Classes (cont'd)
(In Millions of Dollars)
SIC Product description 1969 1968 1967 1966 1965
36612 Other telephone and telegraph
annarati i c 64.1 48.6 44.6 36.5 35.3
Canada 20.3 16.4 17.9 16.4 11.8
EEC 4.4 2.4 3.2 1.7 3.7
United Kingdom 11.8 6.1 5.5 2.1 1.7
Japan 1.7 1.7 1.2 0.6 0.6
All other 25.9 22.0 16.8 15.7 17.5
36621] Electronic communications
36627 pniiinmpnt anH nart<5 147.8 1 15.5 108.9 75.1 50.1
Canada 5.5 2.3 2.6 1.7 —EEC 42.6 27.2 40.9 29.1 29.0
United Kingdom 14.4 9.7 6.2 7.0 8.5
Japan 5.0 6.3 4.6 3.3 1.9
All other 80.3 70.0 54.6 34.0 10.7
36622 Broadcast systems and closed
circuit systems 127.5 113.2 83.9 62.1 30.5
Canada 12.2 3.2 2.9 3.9
EEC 17.3 12.9 15.3 13.3 13.9
United Kingdom 12.9 11.3 5.6 7.8 4.2
6.1 6.2 4.6 4.5 1.4
79.0 79.6 55.5 32.6 11.0
36623 Electric alarm and signal
oj o Itl 1 dllli llllClCUIll
27.1 21.4 25.7 22.1 9.9
Canada 10.8 8.6 12.2 9.2 —EEC 4.8 2.0 2.8 2.5 2.4
United Kingdom 3.1 3.0 2.4 3.4 3.1
Japan 0.6 0.5 0.2 0.1 0.3
All other 7.8 7.3 8.1 6.9 4.1
36624^Electronic navigational aids 148.3 127.3 81.1 56.8 46.1
36628j
Canada 13.1 2.1 1.0 1.4
EEC 40.8 47.3 35.0 23.9 31.9
United Kingdom 45.1 36.6 14.1 11.8 7.5
10.6 11.2 7.9 4.5 3.1
All other 38.7 30.1 23.1 15.2 3.6
Less than S0.05 million (included in all other).

APPENDIX B 141
Table 1 2. Exports of MSS Product Classes (cont'd)
(In Millions of Dollars)
SIC Product description 1969 1968 1967 1966 1965
36625 Electronic search and detection
annaratus 74.6 63.6 61.1 30.7 44.6
Canada 5.9 2.3 2.8 3.5 1.5
EEC 25.5 15.4 21.2 10.1 24.0
United Kingdom 22.0 16.6 5.4 5.1 2.4
4.8 6.2 8.6 3.2 5.8
All other 16.4 23.1 23.1 8.8 10.9
36626 Electronic equipment nec 53.1 40.9 31.4 30.9 24.4
Canada 7.4 6.7 4.5 5.6 3.2
EEC 14.1 11.1 1 1.3 13.0 9.8
T IniteH TCinpdom 3.1 4.5 1.7 0.5 1.1
Japan 3.7 1.4 2.2 1.2 0.9
All other 24.8 17.2 11.7 10.6 9.4
36629 N/Iirrnwavp anH mnhilf tplp-
phone communication
32.7 38.1 45.2 35.6 23.9
4.0 5.2 3.8 6.2 3.6
EEC 3.6 4.2 5.5 4.5 4.2
I IniteH Kintrdom 1.7 2.7 2.6 1.5 1.6
Japan 0.6 0.7 0.6 0.7 0.4
All other 22.8 25.3 32.7 22.7 14.1
36792 Capacitors for electronic
applications 29.5 22.3 20.3 21.1 16.8
Canada 5.4 5.5 5.3 5.8 4.6
EEC 11.7 7.8 7.2 8.0 6.0
United Kingdom 2.7 2.2 2.5 2.5 1.7
Japan 1.0 0.7 0.4 0.5 0.2
O. /C 1D. 1
A 14.
J
A "i4.3
36793 Resistors for electronic appli-
41.0 32.2 31.2 29.5 20.6
Canada 8.2 8.6 11.8 10.4 5.5
EEC 12.4 9.4 8.3 8.8 6.8
United Kingdom 5.5 3.7 3.2 2.7 2.1
2.4 1.6 1.1 1.1 0.8
All other 12.5 8.9 1 6.8 6.5 5.4
1 Less than $0.05 million (included in all other).

142 INTERNATIONAL TRADE
Table I 2 Exports of MSS Product Classes (cont'd)
(In Millions of Dollars)
SIC Product rit^crint ion 1969 1968 1967 1966 1965
36794 Coils, transformers, reactors
and chokes 16.2 13.2 11.7 12.2 9.0
Canada 2.8 2.9 3.8 4.1 2.7
EEC 3.4 2.1 2.1 2.9 2.1
United Kingdom 1.4 0.8 1.1 1.3 1.0
Japan 0.6 0.4 0.6 0.6 0.4
All other 8.0 7.0 4.1 3.3 2.8
36795 Other electronic components. . .
.
144.0 123.5 91.8 81.1 75.3
Canada 24.5 20.3 19.9 17.7 15.4
EEC 33.2 22.2 20.6 17.5 14.8
United Kingdom 18.3 1°.3 14.9 14.9 12.3
Japan 11.4 5.6 6.1 4.4 4.7
AH other 56.6 56.1 30.3 26.6 28.1
36930 X-ray and therapeutic apparatus. 48.5 43.5 39.4'
33.4 25.5
Canada 14.7 13.3 12.5 10.0 8.5
11.0 9.8 8.2 7.0 4.6
United Kingdom 2.0 1.6 2L1 1.8 1.0
2.1 2.6 1.7 1.5 1.0
All other 18.7 16.2 14.9 13.1 10.4
36941 Ignition, harness and cable sets. . 16.8 13.0 10.4 7.0 5.3
Canada 15.7 12.2 9.1 6.1 4.5
EEC 0.1 0.2 0.5 0.2 0.2
United Kingdom 0.3 0.1 0.1 0.1 0)
\ > ^ )(V\K I i >
fni >
All other 0.7 0.5 0.7 0.6 0.6
36942\
Battery charging generators,
other complete electrical
36945/ equipment for internal
combustion engines 35.4 34.8 30.1 27.7 22.4
Canada 17.7 18.0 15.1 12.2 7.9
EEC 3.3 2.6 2.8 2.7 2.7
United Kingdom 1.3 1.3 0.6 0.4 0.4
Japan 0.9 0.9 1.1 1.3 1.5
All other. .- 12.2 12.0 10.5 11.1 9.9
Less than $0.05 million (included in all other).
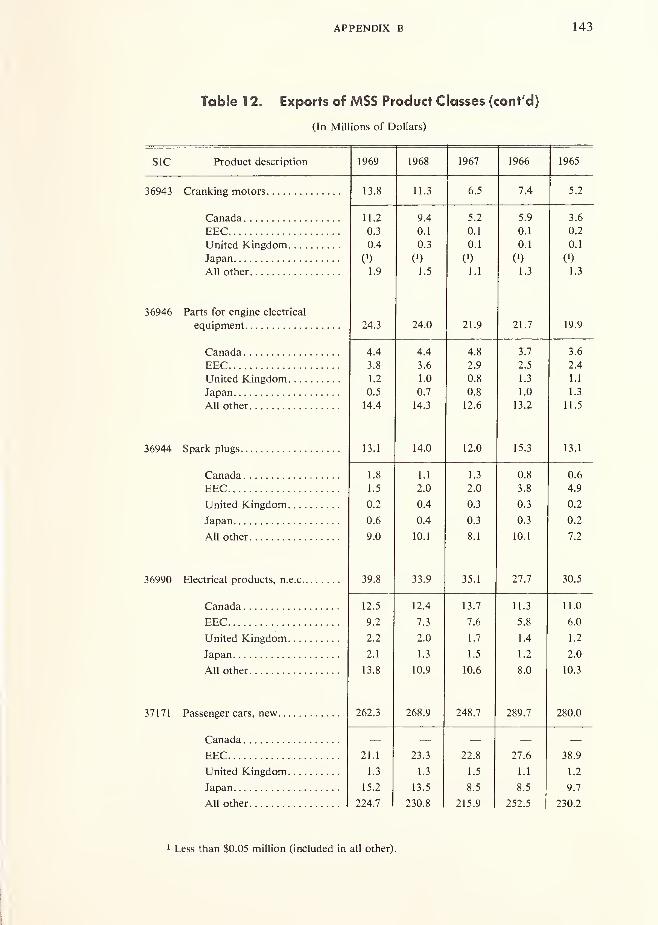
APPENDIX B 143
Table 1 2. Exports of MSS Product Classes (cont'd)
(In Millions of Dollars)
SIC Product description 1969 1968 1967 1966 1965
36943 Cranking motors 13.8 11.3 6.5 7.4 5.2
Canada 11.2 9.4 5.2 5.9 3.6
EEC 0.3 0.1 0.1 0.1 0.2
United Kingdom 0.4 0.3 0.1 0.1 0.1
Japan (') C1) (') (')
All other 1.9 1.5 1.1 1.3 1.3
36946 Parts for engine electrical
24.3 24.0 21.9 21.7 19.9
A A4.4 A A4.4 A Q4.0 j. i j.O
EEC 3.8 3.6 2.9 2.5 2.4
United Kingdom 1.2 1.0 0.8 1.3 1.1
0.5 0.7 0.8 1.0 1.3
All other 14.4 14.3 12.6 13.2 11.5
i j . i 1 T, 1
Canada 1.8 1.1 1.3 0.8 0.6
EEC 1.5 2.0 2.0 3.8 4.9
United Kingdom 0.2 0.4 0.3 0.3 0.2
0.6 0.4 0.3 0.3 0.2
All other 9.0 10.1 8.1 10.1 7.2
36990 Electrical products n.e.c 39.8 33.9 35.1 27.7 30.5
12.5 12.4 13.7 11.3 1 1.0
EEC 9.2 7.3 7.6 5.8 6.0
United Kingdom 2.2 2.0 1.7 1.4 1.2
2.1 1.3 1.5 1.2 2.0
All other 13.8 10.9 10.6 8.0 10.3
37171 Passenger cars, new 262.3 268.9 248.7 289.7 280.0
Canada
EEC 21.1 23.3 22.8 27.6 38.9
United Kingdom 1.3 1.3 1.5 1.1 1.2
15.2 13.5 8.5 8.5 9.7
All other 224.7 230.8 215.9 252.5 230.2
1 Less than S0.05 million (included in all other)

144 INTERNATIONAL TRADE
Table 1 2. Exports of MSS Product Classes (cont'd)
(In Millions of Dollars)
SIC Product description 1969 1968 1967 1966 1965
37113 Motor coaches and fire
department vehicles 14.1 26.0 17.9 17.9 19.0
Canada — — — — —EEC 0) V) 0.1 V) 0.6
United Kingdom 0) — 0)Japan (') (') 0) 0)All other 14.1 26.0 17.8 17.9 18.4
37112 Trucks, new and wheeled
armored vehicles 220.6 307.1 311.1 356.0 309.2
Canada — — — — —EEC 10.9 7.8 8.8 4.0 5.3
United Kingdom 1.0 2.7 1.8 2.1 1.0
1.3 1.3 0.7 0.9 0.1
All other 207.4 295.3 299.8 349.0 302.8
37140 Parts and accessories for
passenger cars, trucks &buses 460.9 404.0 375.3 381.8 327.1
perOU.O A 1 f\
4.5.
U
1G C\ 1Q A lO £.JZ.O
Z J. J 1 8 ft1 o.o 1 a n
1 o.uin 1i y.z 1 A ft14.
o
1 A1 .4 1 73.Z A A4.4 1 7z.z C 1
J.I
All other 369.4 339.0 316.9 321.0 274.6
Truck and bus bodies (for sale
4.8 4.0 3.9 4.6 3.3
repV) U.Z U.J A 1 U.Z
U.l v) V) c) (')
f\ 1U. 1
A A4.0 1 QJ.O J.O A 1 3.1
372121 Aircraft, non-military, exclud-
37213J ing rebuilt and modified 1,103.3 1,336.6 729.8 522.4 438.8
Canada 128.2 204.8 95.1 56.5 18.1
EEC 300.0 323.2 194.7 118.5 118.2
United Kingdom 15.2 35.1 18.8 3.3 18.4
Japan 73.4 56.0 27.6 76.2 62.1
All other 586.5 717.5 393.6 267.9 222.0
1 Less than $0.05 million (included in all other).

APPENDIX B 145
Table 1 2. Exports of MSS Product Classes (cont'd)
(In Millions of Dollars)
SIC Product description 1969 1968 1967 1966 1965
37222 Aircraft pnoinp^i nonmilitarv
94.3 106.4 89.7 65.1 45.8
12.2 14.4 Q 1 7.5
EEC 19.1 40.2 35.3 23.8 16.2
I Initpfi KinfHnm 6.5 4.5 2.8 2.3 2.4
Ta nan 12.7 8.3 7.3 7.5 7.5
All other 43.8 39.0 35.2 24.0 17.8
37224 Parts n.e.c, for combustion
aircraft engines and turbines.
.
235.2 232.6 206.8 183.3 169.1
Canada 48.7 46.2 44.6 41.4 30.9
EEC 64.3 64.6 54.4 52.4 52.0
United Kingdom 12.1 10.1 16.9 11.1 5.5
26.1 28.5 24.4 17.7 17.5
All other 84.0 83.2 66.5 60.7 63.2
37230 Propellers and parts, n.e.c, for
17.8 18.7 17.5 13.5 14.0
5.8 6.5 5.7 3.5 4.9
EEC 2.0 2.4 2.3 1.9 2.0
United Kingdom 1.3 0.6 1.2 0.4 0.3
Japan 1.6 1.7 1.6 1.7 1.4
All other 7.1 7.5 6.7 6.0 5.4
37290 Parts and accessories, n.e.c,
including landing gear for
aircraft, excluding missile
543.8 482.3 413.7 314.8 298.2
Canada 57.0 56.5 52.9 38.8 31.9
EEC 171.7 143.1 141.8 109.9 93.0
United Kingdom 38.5 53.7 25.2 14.8 10.6
Japan 50.1 44.9 41.3 31.8 34.1
All other 226.5 184.1 152.5 119.5 128.6
37510 Motorcycles, bicycles, and parts. 4.4 4.8 4.0 2.7 2.3
1.6 1.7 1.8 1.0 0.8
EEC 0.4 0.3 0.4 0.3 0.2
United Kingdom 0.7 0.9 0) (') 0)
Japan 0.1 0.1 (!) () 0)
All other 1.6 1.8 1.8 1.4 1.3
1 Less than $0.05 million (included in all other).
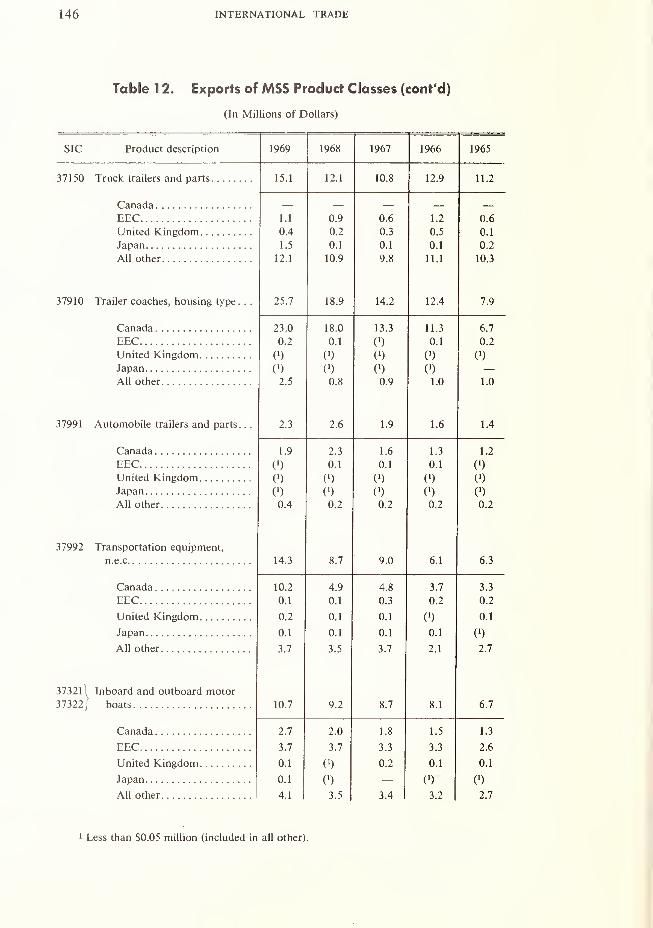
146 INTERNATIONAL TRADE
Table 1 2. Exports of MSS Product Classes (cont'd)
(In Millions of Dollars)
SIC Product description 1969 1968 1967 1966 1965
37150 Truck trailers and parts 15.1 12.1 10.8 12.9 11.2
Canada — — — — —EEC 1.1 0.9 0.6 1.2 0.6
United Kingdom 0.4 0.2 0.3 0.5 0.1
1.5 0.1 0.1 0.1 0.2
All other 12.1 10.9 9.8 11.1 10.3
37910 Trailer coaches, housing type . . . 25.7 18.9 14.2 12.4 7.9
Canada 23.0 18.0 13.3 11.3 6.7
EEC 0.2 0.1 (*) 0.1 0.2
United Kingdom 0) (') C1) V) 0)
Japan (') 0) C1) C
1)
All other 2.5 0.8 0.9 1.0 1.0
37991 Automobile trailers and parts. .
.
2.3 2.6 1.9 1.6 1.4
Canada 1.9 2.3 1.6 1.3 1.2
EEC (!) 0.1 0.1 0.1 0)United Kingdom C
1) 0) (') (') V)
Til n:i ni. > V >
All other 0.4 0.2 0.2 0.2 0.2
37992 Transportation equipment,
14.3 8.7 9.0 6.1 6.3
Canada 10.2 4.9 4.8 3.7 3.3
EEC 0.1 0.1 0.3 0.2 0.2
United Kingdom 0.2 0.1 0.1 C1) 0.1
Japan 0.1 0.1 0.1 0.1 (')
All other 3.7 3.5 3.7 2.1 2.7
37321 \ Inboard and outboard motor
37322/ boats 10.7 9.2 8.7 8.1 6.7
Canada 2.7 2.0 1.8 1.5 1.3
EEC 3.7 3.7 3.3 3.3 2.6
United Kingdom 0.1 0) 0.2 0.1 0.1
Japan 0.1 (') 0) 0)
All other 4.1 3.5 3.4 3.2 2.7
1 Less than SO.05 million (included in all other)
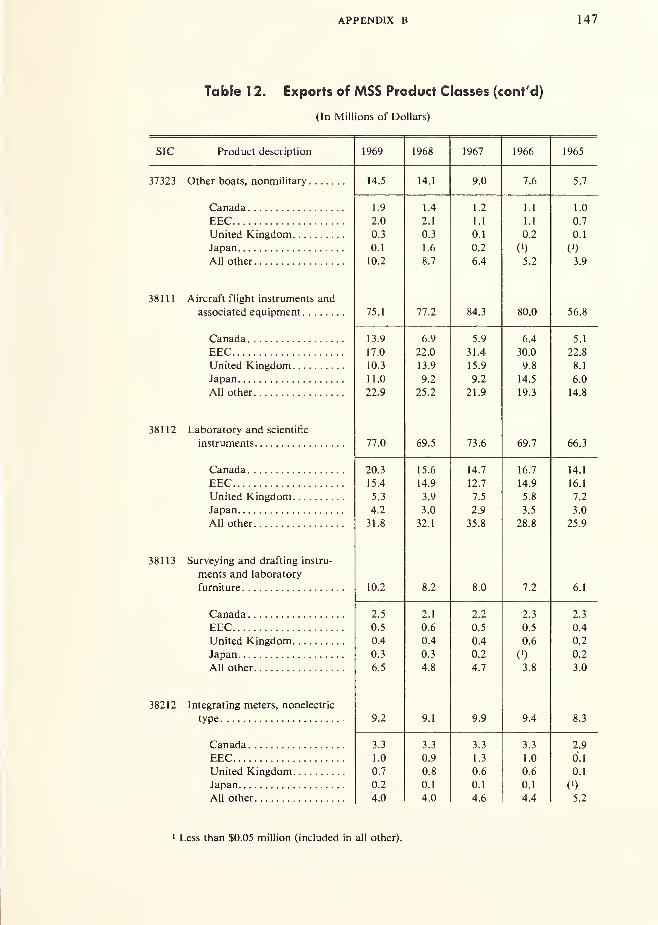
APPENDIX B 147
Table 1 2. Exports of MSS Product Classes (cont'd)
(In Millions of Dollars)
SIC Product description 1969 1968 1967 1966 1965
37323 Other boats, nonmilitary 14.5 14.1 9.0 7.6 5.7
Canada 1.9 1.4 1.2 1.1 1.0
EEC 2.0 2.1 1.1 1.1 0.7
United Kingdom . 0.3 0.3 0.1 0.2 0.1
Japan. . .
.
0.1 1.6 0.2 (i) (i)
All other 10.2 8.7 6.4 5.2 3.9
38111 Aircraft flight instruments and
associated equipment 75.1 77.2 84.3 80.0 56.8
Canada 13.9 6.9 5.9 6.4 5.1
EEC 17.0 22.0 31.4 30.0 22.8
United Kingdom . 10.3 13.9 15.9 9.8 8.1
Japan 11.0 9.2 9.2 14.5 6.0
All other 22.9 25.2 21.9 19.3 14.8
38112 Laboratory and scientific
instruments 77.0 69.5 73.6 69.7 66.3
Canada 20.3 15.6 14.7 16.7 14.1
EEC 15.4 14.9 12.7 14.9 16.1
United Kingdom 5.3 3.9 7.5 5.8 7.2
Japan 4.2 3.0 2.9 3.5 3.0
All other 31.8 32.1 35.8 28.8 25.9
38113 Surveying and drafting instru-
ments and laboratory
furniture 10.2 8.2 8.0 7.2 6.1
Canada 2.5 2.1 2.2 2.3 2.3
EEC 0.5 0.6 0.5 0.5 0.4
United Kingdom 0.4 0.4 0.4 0.6 0.2
Japan 0.3 0.3 0.2 V / 0.2
All other 6.5 4.8 4.7 3.8 3.0
38212 Integrating meters, nonelectric
type 9.2 9.1 9.9 9.4 8.3
Canada 3.3 3.3 3.3 3.3 2.9
EEC 1.0 0.9 1.3 1.0 0.1
United Kingdom 0.7 0.8 0.6 0.6 0.1
Japan 0.2 0.1 0.1 0.1 (')
All other 4.0 4.0 4.6 4.4 5.2
1 Less than $0.05 million (included in all other).
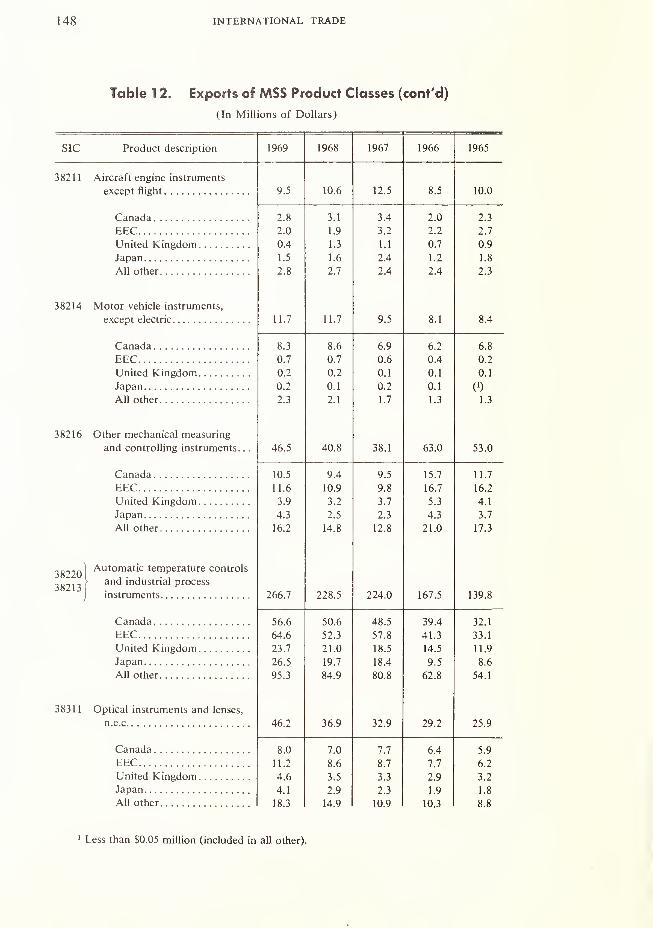
148 INTERNATIONAL TRADE
Table 1 2. Exports of MSS Product Classes (cont'd)
(In Millions of Dollars)
SIC Product description 1969 1968 1967 1966 1965
38211 Aircraft engine instruments
except flight 9.5 10.6 12.5 8.5 10.0
2.8 3.1 3.4 2.0 2.3
EEC 2.0 1.9 3.2 2.2 2.7
United Kingdom 0.4 1.3 1.1 0.7 0.9
Japan 1.5 1.6 2.4 1.2 1.8
All other 2.8 2.7 2.4 2.4 2.3
38214 Motor vehicle instruments,
except electric 11.7 11.7 9.5 8.1 8.4
Canada 8.3 8.6 6.9 6.2 6.8
EEC 0.7 0.7 0.6 0.4 0.2
United Kingdom 0.2 0.2 0.1 0.1 0.1
Japan 0.2 0.1 0.2 0.1 (!)
All other 2.3 2.1 1.7 1.3 1.3
38216 Other mechanical measuring
and controlling instruments. .
.
46.5 40.8 38.1 63.0 53.0
Canada 10.5 9.4 9.5 15.7 11.7
EEC 11.6 10.9 9.8 16.7 16.2
United Kingdom 3.9 3.2 3.7 5.3 4.1
Japan 4.3 2.5 2.3 4.3 3.7
All other 16.2 14.8 12.8 21.0 17.3
38220Automatic temperature controls
38213> and industrial process
instruments 266.7 228.5 224.0 167.5 139.8
Canada 56.6 50.6 48.5 39.4 32.1
EEC 64.6 52.3 57.8 41.3 33.1
United Kingdom 23.7 21.0 18.5 14.5 11.9
26.5 19.7 18.4 9.5 8.6
All other 95.3 84.9 80.8 62.8 54.1
38311 Optical instruments and lenses,
n.e.c 46.2 36.9 32.9 29.2 25.9
Canada 8.0 7.0 7.7 6.4 5.9
EEC 11.2 8.6 8.7 7.7 6.2
United Kingdom 4.6 3.5 3.3 2.9 3.2
4.1 2.9 2.3 1.9 1.8
All other 18.3 14.9 10.9 10.3 8.8
1 Less than $0.05 million (included in all other).
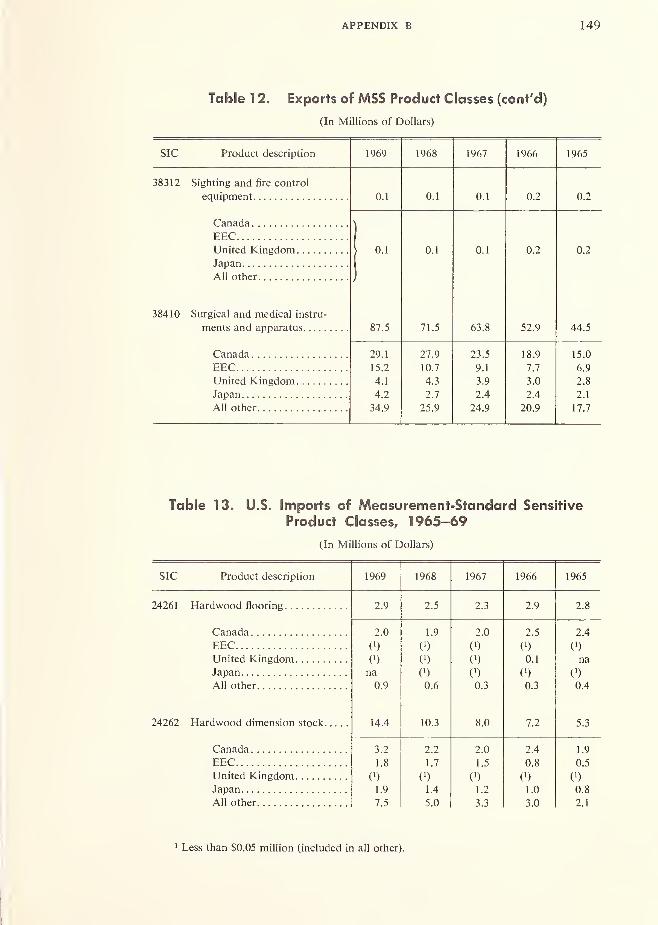
APPENDIX B 149
Table 1 2. Exports of MSS Product Classes (cont'd)
(In Millions of Dollars)
SIC Product description 1969 1968 1967 1966 1965
JO J 1 —
equipment 0.1 0.1 0.1 0.2 0.2
> U. 1 U. 1 u.z
1All other
38410 Surgical and medical instru-
ments and apparatus 87.5 71.5 63.8 52.9 44.5
Canada 29.1 27.9 23.5 18.9 15.0
EEC 15.2 10.7 9.1 7.7 6.9
United Kingdom 4.1 4.3 3.9 3.0 2.8
4.2 2.7 2.4 2.4 2.1
All other 34.9 25.9 24.9 20.9 17.7
Table 13. U.S. Imports of Measurement-Standard Sensitive
Product Classes, 1965-69
(In Millions of Dollars)
SIC Product description 1969 1968 1967 1966 1965
24261 Hardwood flooring 2.9 2.5 2.3 2.9 2.8
Canada 2.0 1.9 2.0 2.5 2.4
EEC (') (!) 0) (') C1)
United Kingdom (') C1) 0) 0.1 na
Japan na (!) (!) (')
All other 0.9 0.6 0.3 0.3 0.4
24262 Hardwood dimension stock 14.4 10.3 8.0 7.2 5.3
Canada 3.2 2.2 2.0 2.4 1.9
EEC 1.8 1.7 1.5 0.8 0.5
United Kingdom (') (') (')
Japan 1.9 1.4 1.2 1.0 0.8
All other 7.5 5.0 3.3 3.0 2.1
Less than $0.05 million (included in all other).
150 INTERNATIONAL TRADE
Table 1 3. Imports of MSS Product Classes (cont'd)
(In Millions of Dollars)
SIC Product description 1969 1968 1967 1966 1965
24320 Veneer and plywood 297.3 268.8 185.8 200.3 170.6
29.6 33.6 31.6 35.1 33.9
EEC 2.2 2.6 2.1 2.1 2.2
United Kingdom 0.4 0.5 0.2 0.2 0.2
69.7 72.1 47.9 56.0 50.6
All other 195.4 160.0 104.0 106.9 83.7
24996 Hard pressed wood fibre board.
.
19.4 17.5 13.1 14.0 17.7
Canada 4.6 3.7 2.6 2.4 3.6
EEC 0.9 (') C1) 0.1 0.2
United Kingdom 0) 0) C1) (') 0)
0.8 0) 0) 0.1 (')
All other 13.1 13.8 10.5 11.4 13.9
33512 Copper mill shapes 94.0 136.1 99.8'
131.4 67.9
Canada 22.2 39.2 25.5 29.4 8.8
EEC 37.5 51.3 46.8 59.3 31.7
United Kingdom 4.0 8.7 6.9 10.3 4.9
Japan 20.6 17.9 11.3 18.5 11.7
AH other 9.7 19.0 9.3 13.9 10.8
33522 Aluminum plate and sheet 28.7 32.4 27.8 63.8 33.8
3.6 4.5 3.5 4.6 2.5
EEC 11.4 17.4 15.6 38.7 24.0
0.1 1 .2 3.0 0.3
Q A0.1
"» *7
1. 1 10.4 4.
J
All nthpr ^ ij.j A 14.3 4.8 7 1 "5 ^Z.j
335241 Aluminum bars, rods and
33525/ structural shapes 9.0 8.7 11.8 11.2 4.0
Canada 0.6 0.4 1.9 1.0 0.2
EEC 1.3 2.0 5.2 6.9 2.2
United Kingdom (') (') 0 (') (')
Japan 1.9 1.6 0.6 0.9 0.4
All other 5.2 4.7 4.1 2.4 1.2
1 Less than $0.05 million (included in all other)

APPENDIX B 151
Table 1 3. Imports of MSS Product Classes (cont'd)
(In Millions of Dollars)
SIC Product description 1969 1968 1967 1966 1965
34231\Handtools, n.e.c 49.2 44.0 33.4 26.6 21.4
342331
Canada 1.0 1.2 0.7 0.7 0.5
EEC 6.8 6.6 5.1 4.4 3.9
United Kingdom 3.3 3.0 2.6 2.2 2.1
Japan 26.8 22.7 18.2 15.4 11.8
All other 11.3 10.5 6.8 3.9 3.1
34320 Plumbing fixture fittings and
trim (brass goods) 1.2 1.4 0.9 1.2 1.3
Canada V / \ ) V } \ ) V )
EEC 0.1 0.1 0.1 0.1 0.2
United Kingdom (') 0.2 V f V ) V J
Japan 0.6 0.5 0.4 0.6 0.8
AH other 0.5 0.6 0.4 0.5 0.3
34330] Heating equipment, except
36312J electric 8.4 5.8 4.4 3.5 3.5
0.8 0.4 0.5 0.5 0.5
EEC 1.8 0.3 0.7 0.4 0.5
United Kingdom 0.8 0.4 0.3 0.4 0.7
2.5 3.2 2.4 1.7 1.4
All other 2.5 1.5 0.5 0.5 0.4
34410' Metal windows, doors, frames
34420 and fabricated structural metal
34490, products, n.e.c 44.0 34.4 27.6 21.1 15.4
Canada 16.0 8.2 3.7 4.5 2.9
EEC 16.7 14.7 16.3 12.1 10.3
United Kingdom 3.7 2.8 1.6 1.4 1.2
Japan 6.0 7.8 5.8 2.8 0.8
All other 1.6 0.9 0.2 0.3 0.2
3443 1 \ Heat exchangers and steam
34433] condensers and steel power
boilers, parts and attachments. 3.2 2.4 2.3 1.4 0.7
Canada 0.8 1.2 1.1 0.9 0.3
EEC 1.5 0.6 0.2 0.1 0.1
United Kingdom 0) 0.2 (') (l) 0.1
Japan 0.2 0.3 0.7 0) (')
All other 0.7 0.1 0.3 0.4|
0.2
1 Less than $0.05 million (included in all other).

152 INTERNATIONAL TRADE
Table 1 3. Imports of MSS Product Classes (cont'd)
(In Millions of Dollars)
SIC Product description 1969 1968 1967 1966 1965
34434]
344351 Gas cylinders and metal tanks. .
.
1.2 0.8 1.2 1.0 0.4
34437
[
34439J
Canada 0.8 0.2 0.2 0.2 0.3
EEC 0.2 0.5 1.0 0.1 0)
United Kingdom 0.1 (') (') 0.5 0)
(') 0) 0) 0.1 (!)
All other 0.1 0.1 0.0 0.1 0.1
34521 Standard industrial fasteners
(bolts, nuts, screws, etc.) 99.5 80.0 71.1 60.2 51.5
Canada 13.1 11.4 7.0 5.1 3.5
EEC 15.7 15.0 15.3 13.2 11.4
United Kingdom 3.8 4.7 4.6 3.5 3.1
Japan 52.6 38.8 36.6 32.3 28.1
All other 14.3 10.1 7.6 6.1 5.4
349 10\ Metal shipping barrels, drums,
34110i
kegs, and pails 11.1 9.8 5.6 5.2 5.3
Canada 6.8 6.0 2.2 2.3 1.3
EEC 1.7 1.5 1.5 1.1 2.5
United Kingdom 0.7 0.6 0.6 0.4 0.4
0.4 0.3 0.2 0.3 0.2
All other 1.5 1.4 1.1 1.1 0.9
34941 Metal valves, except plumbers'
34943 34.3 28.5 20.9 17.1 12.1
34944
Canada 9.9 8.8 6.7 5.4 3.9
EEC 11.6 9.9 7.3 5.1 3.7
United Kingdom 3.1 3.2 2.0 1.8 1.3
Japan 5.5 3.8 2.5 2.8 2.3
All other 4.2 2.8 2.4 2.0 0.9
34942 Metal fittings and unions for
34945 piping systems 18.6 19.6 16.8 12.3 8.9
Canada 2.2 3.1 1.7 0.5 0.2
EEC 5.4 5.9 5.8 3.9 2.3
United Kingdom 0.9 1.1 0.8 0.8 0.5
7.6 7.6 7.3 6.0 4.8
All other 2.5 1.9 1.2 1.1 1.1
1 Less than $0.05 million (included in all other).
APPENDIX B 153
Table 1 3. Imports of MSS Product Classes (cont'd)
(In Millions of Dollars)
SJC Product description 1969 1968 1967 1966 1965
351931 Diesel and semi-diesel engines. .
.
33.4 21.4 17.3 21.0 15.5
35194]
Canada 3.0 0.4 0.2 0.5 0.2
EEC 3.5 8.4 5.0 4.5 4.6
United Kingdom 18.8 11.3 1 1.0 15.2 10.1
1.2 0.1 0.2 0.1 0.4
6.9 1.2 0.9 0.7 0.2
351951 Internal combustion engines,
35196] n.e.c 62.4 62.1 49.9 35.4 25.8
Canada 2.3 7.7 11.2 2.5 1.4
EEC 22.6 16.2 11.4 4.2 2.9
United Kingdom 27.7 31.8 26.8 27.7 20.0
5.9 4.2 0.2 0.2 0.2
All other 3.9 2.2 0.3 0.8 1.3
35221 Wheel tractors (except con-
tractors' off-highway and
garden tractors, parts and
18.7 15.4 18.8 20.0 1 1 .4
Canada — — — — —EEC 6.2 2.7 4.9 5.5 1.1
11.7 12.6 13.6 14.2 10.2
0.3 V) 0) 0.2 (')
0.5 0.1 0.3 0.1 0.1
352231 Planting, seeding, and fertilizing
part/ machinery 0.9 1.1 0.4 0,5 0.6
Canada — — — —EEC 0.7 0.8 0.3 0.3 0.5
0.1 0.1 (') 0.2
(') 0) (') (')
All other 0.1 0.2 0.1 0.1
352241 Plows, listers, harrows, rollers,
part/ etc 0.5 0.9 1.4 1.4 1.2
Canada
EEC (') 0.1 0.1 (') (')
United Kingdom 0.1 0.8 1.1 1.3 1.1
Japan (')
All other 0.4 0.2 0.1 0.1
1 Less than $0.05 million (included in all other).
154 INTERNATIONAL TRADE
Table 1 3. Imports of MSS Product Classes (cont'd)
(In Millions of Dollars)
SIC Product description 1969 1968 1967 1966 1965
35226\ Haying machinery and mower0. 1 U.J U.J 0.3 0.2
Canada
EEC 0.5 0.1 0.2 0.2 0.2
United Kingdom 0.1 0.1 (')
Japan (') 0.1 —All other 0.2 0.1
U.j A £U.O A 1 U.J U.j
Canada
EEC 0) (')
United Kingdom 0.4 0.5 0.3 0.3 0.3
Japan V) 0) 0) — —All other 0.1 0.1
352251 Harvesting machinery 8.1 12.5 5.0 4.0 1.8
part/
Canada
EEC 7.8 12.2 4.8 4.0 1.7
United Kingdom 0.1 0.1 0) _ 0)
0.2 0.1 _All other 0) 0.1 0.2 — 0.1
35228 \ Other farm machinery equip-
35229/ ment and parts 86.3 84.3 64.1 65.2 50.1
Canada
EEC 50.1 50.9 33.0 27.8 22.7
United Kingdom 31.4 30.0 28.9 35.3 26.0
Japan 1.0 1.1 0.7 0.5 0.1
All other 3.8 2.3 1.5 1.6 1.3
35311) Construction-type tractors,
35312 \ parts and attachments 35.8 22.8 27.9 36.6 25.7
35313]
Canada 25.9 17.1 18.5 25.5 14.3
EEC 4.4 4.2 5.8 8.2 7.2
United Kingdom 2.6 1.3 3.2 2.8 4.0
Japan 2.8 0.1 0.4 0 (')
All other 0.1 1 0.1 0.1 0.2
1 Less than $0.05 million (included in all other)
APPENDIX B 155
Table 1 3. Imports of MSS Product Classes (cont'd)
(In Millions of Dollars)
SIC Product description 1969 1968 1967 1966 1965
35314s
35317
35318 Mining and construction
35319 • machinery, n.e.c, and parts. .
.
61.8 51.9 54.3 48.4 33.7
35331
35332 17.0 16.4 18.3 16.6 1 1.3
35334 EEC 26.4 22.4 19.2 14.3 9.7
United Kingdom 5.6 4.4 5.7 5.7 3.5
Japan 6.1 2.9 2.3 2.0 0.4
6 7D. /S R R Ro.o Q R o.o
35340 Elevators and moving stairways. 1.7 3.8 1.9 0.9 1.1
f"1?* n p H a 0.2 1.3 0.7 0.2 0.3
EEC 0.5 1.2 0.8 0.4 0.3
United Kingdom 0.7 1.1 0.3 0.1 0.1
0.2 C1) C
1) 0) 0)
All ^-,t V» ar n 1 n 1 n ?u.z
35350 Conveying equipment 10.5 7.9 4.8 3.0 2.5
5.6 3.6 2.3 1.3 0.9
EEC 2.2 1.8 0.9 0.9 0.3
TTmtpH 1^ inoHnm 0.6 1.1 0.3 0.2 0.4
Japan 0.1 t1) (>) (
l)
(i)
All other 2.0 1.4 1.3 0.6 0.9
35360 Hoists, cranes, and monorail
systems 62.8 41.9 11.6 11.4 7.6
Canada 21.4 13.5 5.2 4.8 3.1
EEC 16.3 12.2 2.9 3.3 1.6
United Kingdom 5.6 3.1 0.3 0.3 0.3
Japan 5.2 2.9 0.7 1.0 0.8
All other 14.3 10.2 2.5 2.0 1.8
35370 Industrial trucks and tractors. . . 13.9 7.4 3.3 2.1 0.7
2.9 2.1 1.3 0.7 0.2
EEC 1.6 1.3 0.4 0.5 0.1
United Kingdom 2.7 1.3 0.6 0.3 0.1
Japan 6.0 2.5 1.0 0.6 0.1
All other 0.7 0.2 0.0 0.0 0.2
1 Less than $0.05 million (included in all other)
156 INTERNATIONAL TRADE
Table 1 3. Imports of MSS Product Classes (cont'd)
(In Millions of Dollars)
SIC Product description 1969 1968 1967 1966 1965
35411 Boring machines 21.0 21.4 21.0 12.8 6.1
Canada 0.8 0.5 0.1 0.1 0.1
1,1 / '
i 3 i1 J.Z 1 1 Q11.0 1 Z.J A "7
0. / Z.O
United Kingdom 3.1 3.4 2.9 1.4 0.5
Japan 0.5 1.5 1,9 1.2 0.5
All other 3.4 4.2 3.6 3.4 2.4
35412 Drilling machines 6.0 8.1 7.6 5.1 2.3
Canada 0.1 0.2 0.2 0.1 (')
EEC 2.7 4.5 3.8 2.5 0.9
United Kingdom 0.6 0.7 0.8 0.5 0.3
Japan 1.1 1.4 1.1 0.9 0.3
All other 1.5 1.3 1.7 1.1 0.8
35413 Gear cutting and finishing
machines 2.5 3.8 3.6 2.4 3.3
Canada 0.1 (!) (') na
EEC 1.6 2.9 2.5 1.7 2.3
United Kingdom 0.4 0) 0.1 0.1 (!)
Japan 0.1 (>) 0.1 0.2 0.1
All other 0.3 0.9 0.9 0.4 0.9
35415 Lathes 38.0 38.1 47.7 37.2 14.2
Canada 2.0 0.6 1.1 0.4 V)
EEC 13.7 16.2 18.5 15.6 5.6
United Kingdom 7.7 7.8 11.3 7.1 3.1
8.3 7.4 10.2 7.6 2.3
All other 6.3 6.1 6.6 6.5 3.2
35416 Milling machines 26.3 30.6 31.4 17.4 6.1
Canada 2.3 2.4 3.0 1.8 0.5
EEC 11.7 12.8 13.0 7.1 2.9
United Kingdom 3.2 4.8 4.6 2.0 0.8
4.5 5.2 7.6 4.1 0.8
All other 4.6 5.4 3.2 2.4 1.1
1 Less than $0.05 million (included in all other)
APPENDIX B 157
Table 1 3. Imports of MSS Product Classes (cont'd)
(In Millions of Dollars)
SIC Product description 1969 1968 1967 1966 1965
35414 Grinding and polishing
machines 16.6 16.9 16.0 12.7 6.5
Canada 0.5 0.3 0.2 0.6 0.4
EEC 7.5 7.6 7.4 6.2 3.0
3.1 3.5 2.2 1.6 0.8
Japan 1.6 1.9 2.0 1.0 0.2
All other 3.9 3.6 4.2 3.3 2.1
35418 Other machine tools, (metal-
cutting) 22.4 23.1 26.1 17.1 9.7
Canada 0.7 0.9 0.6 0.3 0.8
EEC 11.1 9.7 11.4 7.9 5.0
United Kingdom 4.2 5.2 6.8 2.8 1.2
Japan 1.0 1.3 1.3 1.1 0.2
All other 5.4 6.0 6.0 5.0 2.5
35419 Parts for metal-cutting machine
tools, and rebuilt machine
tools 21.2 24.4 21.3 16.5 10.8
Canada 2.7 3.1 1.8 1.6 1.1
EEC 9.0 12.4 9.8 6.7 4.6
United Kingdom 3.2 3.5 4.2 3.8 2.1
Japan 1.9 1.4 1.5 1.2 0.6
All other 4.4 4.0 4.0 3.2 2.4
35421
35422 Metalworking machinery, n.e.c.
.
23.3 21.6 24.7 13.1 8.2
35423
35425i
Canada 1.6 1.4 1.7 1.1 0.8
EEC 12.7 11.3 14.0 6.1 5.0
United Kingdom 2.1 3.4 4.1 1.7 1.0
Japan 0.9 0.9 2.2 1.3 0.4
All other 6.0 4.6 2.7 2.9 1.0
35424 Parts for metalworking
machinery, n.e.c 5.9 3.6 4.2 3.1 1.8
Canada 1.5 1.6 2.2 1.2 0.8
EEC 1.8 1.4 1.0 1.3 0.6
United Kingdom 1.9 0.3 0.6 0.3 0.2
Japan 0.2 (») 0.2 0.2 (')
All other 0.5 0.3 0.2 0.1 0.2
1 Less than $0.05 million (included in all other).

158 INTERNATIONAL TRADE
Table 1 3. Imports of MSS Product Classes (cont'd)
(In Millions of Dollars)
SIC Product description 1969 1968 1967 1966 1965
354411 Special dies, jigs, fixtures and
35453/ metalworking attachments. . .
.
16.1 10.0 9.4 7.1 7.0
Canada 4.0 3.5 2.4 2.0 3.2
EEC 7.0 2.7 3.2 2.2 1.4
United Kingdom 0.8 0.7 0.6 0.5 0.4
Japan 0.5 0.6 0.6 0.5 0.2
All other 3.8 2.5 2.6 1.9 1.8
35442 Metal foundry molding boxes
and molds 26.2 23.9 18.2 14.5 11.6
Canada 17.4 17.7 12.8 10.5 8.5
EEC 4.6 2.9 2.7 2.1 1.6
United Kingdom 0.7 0.6 0.4 0.2 0.3
Japan 0.5 0.3 0.3 0.2 0.1
All other 3.0 2.4 2.0 1.5 1.1
35451 Small cutting tools for metal-
working machinery 14.9 13.4 12.9 10.5 7.0
Canada 1.2 0.7 0.7 0.5 0.2
EEC 3.6 3.2 2.4 2.0 1.8
United Kingdom 2.7 2.4 2.4 1.9 1.3
Japan 2.0 2.2 2.1 1.4 0.7
All other 5.4 4.9 5.3 4.7 3.0
35452 Precision measuring tools 3.8 3.7 4.6 3.6 2.2
0.2 0.2 0.3 (')
per i 1 i -ii .j
United Kingdom 0.2 0.1 0.3 0.1 0.1
Japan 1.6 1.7 1.7 1.5 0.8
All other 0.6 0.5 0.8 0.7 0.4
35481 Rollingmill machinery 10.5 21.7 10.5 2.6 3.1
Canada 0.6 0.3 0.5 0.1 0.1
EEC 6.5 16.5 7.1 1.5 2.3
United Kingdom 0.6 0.4 0.2 0.4 0.2
Japan 0.4 0.4 0.2 0.5 0.3
All other.' 2.4 4.1 2.5 0.1 0.2
1 Less than $0.05 million (included in all other)
APPENDIX B 159
Table 1 3. Imports of MSS Product Classes (cont'd)
(In Millions of Dollars)
SIC Product description 1969 1968 1967 1966 1965
35482 Power-driven hand tools 9.9 7.9 6.0 5.3 2.9
Canada 3.1 2.5 0.2 0.1 0.1
EEC 1.9 1.2 1.4 1.1 0.7
United Kingdom 0.7 0.3 0.8 0.7 0.3
Japan 3.3 2.7 2.4 2.2 1.0
All other 0.9 1.2 1.2 1.2 0.8
35483 Acetylene welding and cutting
apparatus 3.6 1.8 2.6 2.1 1.3
Canada 0.1 0.3 0.1 0.1 0.1
EEC 2.5 1.2 1.7 1.0 0.6
United Kingdom 0.4 0.2 0.6 0.9 0.5
Japan (') 0.1 0) (')
All other 0.6 0.1 0.1 0.1 0.1
35512 Commercial food products
machinery 3.8 3.4 3.1 2.9 2.7
Canada 0.1 0.1 (i) 0.1 (i)
EEC 2.6 2.2 2.0 1.9 1.9
United Kingdom 0.2 0.2 0.1 0.1 0.1
Japan 0.3 0.2 0.1 0.1 0.1
All other 0.6 0.7 0.9 0.7 0.6
35511
\
Dairy product plant machinery
35513/ and other industrial food
products machinery and
parts 55.7 48.7 49.3 45.3 40.8
Canada , 0.5 o.O 8.1 7.2 5.0
EEC 31.8 27.8 23.8 25.5 23.4
United Kingdom 7.1 5.3 5.9 4.8 5.3
Japan 2.4 2.2 4.0 1.1 0.5
All other 7.6 7.4 7.5 6.7 6.6
35521 128.2 121.5 88.7 84.2 54.9
Canada 1.3 0.6 0.5 0.4 0.2
EEC 74.8 67.7 48.9 44.5 28.4
United Kingdom 13.8 12.9 9.4 14.5 10.4
5.7 4.1 3.2 2.7 1.4
All other 32.6 36.2 26.7 22.1 14.5
1 Less than $0.05 million (included in all other)
160 INTERNATIONAL TRADE
Table 1 3. Imports of MSS Product Classes (cont'd)
(In Millions of Dollars)
SIC Product description 1969 1968 1967 1966 1965
35522 Parts and attachments for textile
machinery 38.5 38.4 35.0 37.3 19.9
Canada 0.5 0.3 0.1 0.6 0.1
EEC 21.0 23.7 18.9 20.1 10.4
United Kingdom 5.5 4.5 5.1 1.8 4.9
Japan 2.8 1.5 1.1 0.5 0.6
All other 8.7 8.4 9.8 14.3 3.9
35530 Woodworking machinery and
parts 21.0 12.6 8.0 10.0 6.8
Canada 7.8 2.6 1.8 0.9 0.7
EEC 9.6 6.8 4.0 6.7 4.3
United Kingdom 0.7 0.8 0.6 0.7 0.5
Japan 1.3 0.8 0.2 0.2 0.1
All other 1.6 1.6 1.4 1.5 1.2
35540 Paper industries machinery andA "7 A 34.
o
ill g41.5 7Q AZy.u 23.3
Canada 9.8 6.3 9.9 6.2 4.6
EEC 14.6 12.5 11.7 9.3 10.6
United Kingdom 2.9 2.9 1.6 1.7 1.1
1.2 3.2 1.6 0.7 0.2
All other 18.9 9.7 17.0 11.1 7.0
35551 Printing presses 37.0 35.1 28.1 22.8 21.8
Canada 1.8 1.7 1.8 1.5 1.1
EEC 28.6 25.2 20.8 15.5 16.3
United Kingdom 2.4 3.7 1.6 2.7 1.7
0.5 0.3 0.4 0.1 0.1
All /"itri^T "K 7 4 7 \ sj.j j.yj 7 A
35552 Other printing trades machin-
ery and parts 28.8 30.9 22.6 13.4 9.8
Canada 1.1 1.1 1.3 0.6 0.8
EEC 15.0 13.5 11.4 7.8 5.3
United Kingdom 6.9 5.9 3.9 2.7 1.7
1.1 0.9 0.6 0.3 0.2
All other 4.7 9.5 5.4 2.0 1.8
1 Less than $0.05 million (included in all other).

APPENDIX B 161
Table 1 3. Imports of MSS Product Classes (cont'd)
(In Millions of Dollars)
SIC Product description 1969 1968 1967 1966 1965
355921 Foundry machinery and
3321
1
pfininmpnt 12.9 15.7 6.6 8.1 3.5
3.7 1.1 1.6 1.2 0.8
EEC 5.5 12.6 2.4 4.6 1.1
United Kingdom 1.0 0.6 0.5 0.6 0.2
Japan 1.3 0.4 0.4 0.3 0.1
All other 1.4 1.0 1.7 1.4 1.3
35614 Air anH pomnrpssnr^ pxcf^nti\ 11 dllU geld t % A i_ t. j..' L
refrigeration 11.7 10.0 10.9 8.3 6.9
Canada 3.0 2.2 1.4 1.4 1.9
EEC 4.7 4.4 5.3 3.8 2.0
United Kingdom 2.0 1.4 1.6 1.5 1.5
Japan 0.3 0.1 (') 0) (')
All other 1.7 1.9 2.6 1.6 1.5
35615 PiimrK anH rnmnrpQ^nrs n p c 24.4 20.1 15.3 18.7 10.8
Canada 5.5 4.8 3.6 4.3 2.2
EEC 6.4 5.2 4.3 6.8 2.7
United Kingdom 4.7 4.4 4.3 5.2 3.7
Japan 4.8 3.2 1.7 1.1 1.0
All other 3.0 2.5 1.4 1.3 1.2
35616 Parts and attachments for air
16.5 13.7 10.9 8.3 9.8
Canada 7.5 5.7 2.6 2.5 3.7
EEC 2.8 2.8 2.7 1.4 1.1
United Kingdom 3.1 3.0 3.9 2.9 3.1
Japan 0.6 0.4 0.3 0.4 0.9
All other 2.5 1.8 1.4 1.1 1.0
35621' Ball and roller bearings, not
35622 mounted 68.9 61.2 57.8 51.6 33.4
35624
Canada 10.0 7.2 6.7 5.7 3.6
EEC 7.4 8.2 9.7 9.0 7.0
United Kingdom 5.0 4.5 8.3 7.9 3.4
43.3 36.4 28.6 25.7 17.0
All other 3.2 4.9 4.5 3.3 2.4
1 Less than $0.05 million (included in all other).
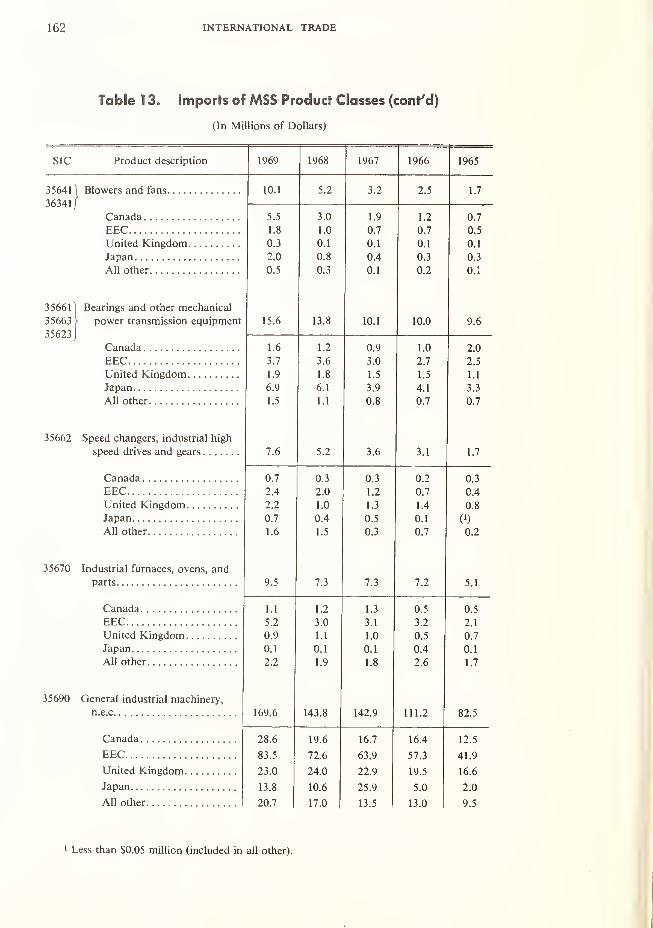
162 INTERNATIONAL TRADE
Table 1 3. Imports of MSS Product Classes (cont'd)
(In Millions of Dollars)
SIC Product description 1969 1968 1967 1966 1965
35641 Tllnwf*rQ anH fans 10.1 5.2 3.2 2.5 1 7
36341
j
Canada 5.5 3.0 1.9 1.2 0.7
EEC 1.8 1.0 0.7 0.7 0.5
United Kingdom 0.3 0.1 0.1 0.1 0.1
2.0 0.8 0.4 0.3 0.3
All other 0.5 0.3 0.1 0.2 0.1
35661' Bearings and other mechanical
35663 15.6 13.8 10 1 10 0
35623
Canada 1.6 1.2 0.9 1.0 2.0
EEC 3.7 3.6 3.0 2.7 2.5
United Kingdom 1.9 1.8 1.5 1.5 1.1
Japan 6.9 6.1 3.9 4.1 3.3
All other 1.5 1.1 0.8 0.7 0.7
35662 Speed changers, industrial high
7.6 5.2 3 6 1 7
Canada 0.7 0.3 0.3 0.2 0.3
EEC 2.4 2.0 1.2 0.7 0.4
United Kingdom 2.2 1.0 1.3 1.4 0.8
Japan 0.7 0.4 0.5 0.1 0)All other 1.6 1.5 0.3 0.7 0.2
35670 Industrial furnaces, ovens, and
I .J 7 3 7 7 C 1J. 1
1.1 1.2 1.3 0.5 0.5
EEC 5.2 3.0 3.1 3.2 2.1
r\ q\).y
i ii . i l.U U.J A 1
Japan 0.1 0.1 0.1 0.4 0.1
All other 2.2 1.9 1.8 2.6 1.7
35690 General industrial machinery,
169.6 143.8 142.9 111.2 82.5
Canada 28.6 19.6 16.7 16.4 12.5
EEC 83.5 72.6 63.9 57.3 41.9
United Kingdom 23.0 24.0 22.9 19.5 16.6
13.8 10.6 25.9 5.0 2.0
All other 20.7 17.01
13.5 1 13.0 9.5
1 Less than $0.05 million (included in all other).
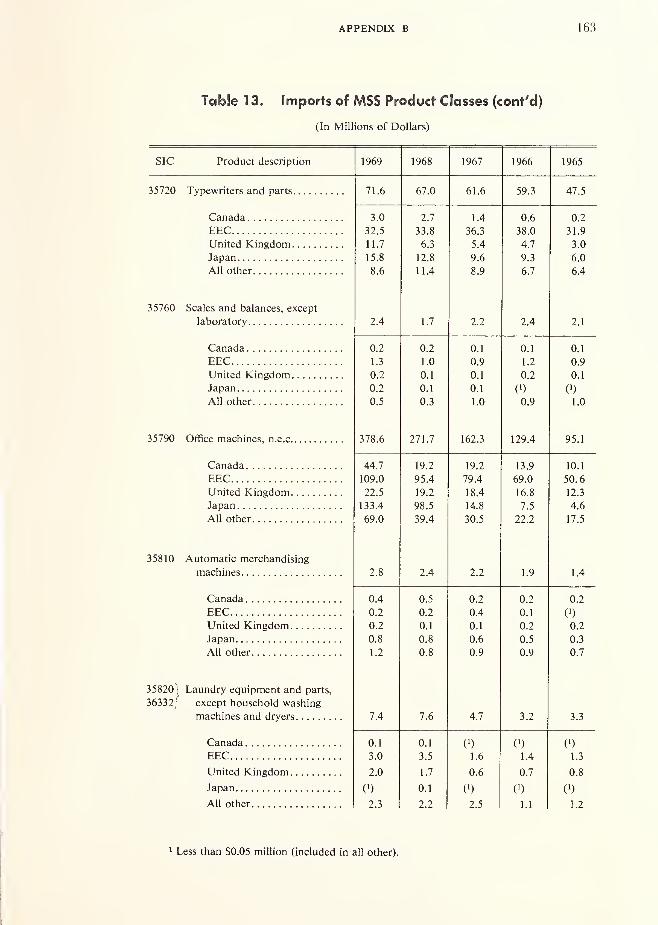
APPENDIX B 163
Table 1 3. Imports of MSS Product Classes (cont'd)
(In Millions of Dollars)
SIC Product description 1969 1968 1967 1966 1965
J J 1 IX) / 1 .0 O / .U O 1 .0 jy.S AH K
Canada 3.0 2.7 1.4 0.6 0.2
EEC 32.5 33.8 36.3 38.0 31.9
United Kingdom 11.7 6.3 5.4 4.7 3.0
Japan 15.8 12.8 9.6 9.3 6.0
All other 8.6 11.4 8.9 6.7 6.4
J J /DU Scales and balances, except
laboratory 2.4 1.7 2.2 2.4 2.1
Canada 0.2 0.2 0.1 0.1 0.1
EEC 1.3 1.0 0.9 1.2 0.9
United Kingdom 0.2 0.1 0.1 0.2 0.1
Japan 0.2 0.1 0.1 (') 0)All other 0.5 0.3 1.0 0.9 1.0
35790 Office machines, n.e.c... 378.6 271.7 162.3 129.4 95.1
Canada 44.7 19.2 19.2 13.9 10.1
EEC 109.0 95.4 79.4 69.0 50.6
22.5 19.2 18.4 16.8 12.3
Japan 133.4 98.5 14.8 7.5 4.6
All other 69.0 39.4 30.5 22.2 17.5
35810 Automatic merchandising
2.8 2.4 2.2 1.9 1.4
0.4 0.5 0.2 0.2 0.2
EEC 0.2 0.2 0.4 0.1 (')
United Kingdom 0.2 0.1 0.1 0.2 0.2
Japan 0.8 0.8 0.6 0.5 0.3Alt 4. L. _—All other 1.2 0.8 0.9 0.9 0.7
358201 Laundry equipment and parts,
36332/ except household washing
machines and dryers 7.4 7.6 4.7 3.2 3.3
Canada 0.1 0.1 C1) 0) (')
EEC 3.0 3.5 1.6 1.4 1.3
United Kingdom 2.0 1.7 0.6 0.7 0.8
Japan i1) 0.1 0) C
1) (
!)
All other 2.3 2.2 2.5 1.1 1.2
1 Less than $0.05 million (included in all other).

164 INTERNATIONAL TRADE
Table 1 3. Imports of MSS Product Classes (cont'd)
(In Millions of Dollars)
SIC Product description 1969 1968 1967 1966 1965
35851'
35853 Heat transfer equipment and
35855[
refrigeration equipment 17.5 10.6 5.4 5.1 5.0
35857
14.7 8.0 4.6 4.0 3.9
EEC 0.7 1.0 0.2 0.3 0 1
United Kingdom 0.6 0.6 0.1 0.1 0 1
Japan 0.7 0.4 0.1 0.1 0.2
All other 0.8 0.6 0.4 0.6 0.7
35854 Compressors and compressor
units, all refrigerants 6.1 3.6 2.3 2.5 1.4
Canada (') (») (') 0.3 (')
EEC 3.9 2.2 0.4 0.1 (')
United Kingdom 0.4 0.3 0.1 0.2 (')
Japan 0.6 0.1 (') 0.1 (')
All other 1.2 1.0 1.8 1.8 1.4
36110 Electrical measuring instruments. 62.6 53.7 43.2 41.8 23.0
Canada 6.7 6.1 6.7 6.0 2.4
EEC 16.2 12.3 10.0 9.1 6.0
United Kingdom 11.6 11.8 10.1 10.2 4.2
15.5 13.3 8.6 8.1 4.2
All other 12.6 10.2 7.8 8.4 6.2
36120] Power, distribution, and
30 ly")j
specialty transformers, in-
cluding electronic 42.0 39.8 27.0 24.4 10.5
12.2 1 1.3 10.4 4.3 3.2
6.9 8.1 5.6 4.8 1.6
United Kingdom 5.1 3.1 1.8 0.6 0.2
8.4 7.2 5.6 7.0 4.4
All r*thf*r i n ii \j. i 3.0 7 7 i i
i . i
36211 Fractional horsepower motors
and generators 23.5 20.0 17.4 17.5 15.5
0.9 0.5 0.5 0.2 0.2
EEC 2.6 2.3 2.0 1.4 1.0
United Kingdom 3.8 5.2 5.6 3.6 2.3
Japan 14.8 10.7 8.0 11.1 10.4
Al! other 1.4 1.3 1.3 1.2 1.6
1 Less than S0.05 million (included in all other).
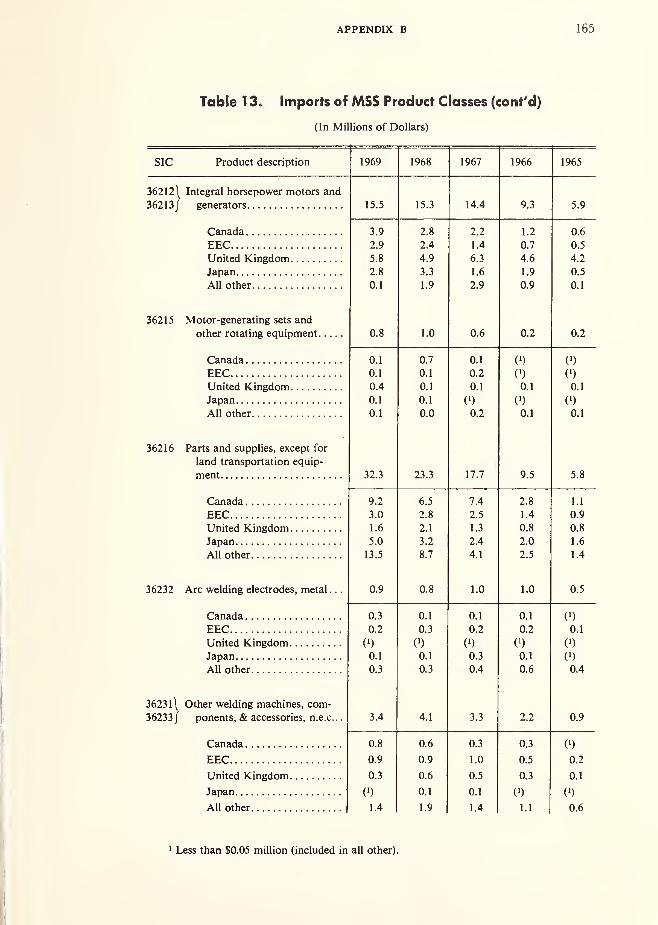
APPENDIX B 165
Table 1 3. Imports of MSS Product Classes (cont'd)
(In Millions of Dollars)
SIC Product description 1969 1968 1967 1966 1965
36212) Integral horsepower motors and
36213/ generators 15.5 15.3 14.4 9.3 5.9
Canada 3.9 2.8 2.2 1.2 0.6
EEC 2.9 2.4 1.4 0.7 0.5
United Kingdom 5.8 4.9 6.3 4.6 4.2
Japan 2.8 3.3 1.6 1.9 0.5
All f\t\~it*r ft 1 1 Q ft 1
36215 Motor-generating sets and
other rotating equipment 0.8 1.0 0.6 0.2 0.2
Canada 0.1 0.7 0.1 (i) (i)
EEC 0.1 0.1 0.2 (i) (')
United Kingdom 0.4 0.1 0.1 0.1 0.1
Japan 0.1 0.1 V) (') (')
All other 0.1 0.0 0.2 0.1 0.1
36216 Parts and supplies, except for
land transportation equip-
ment 32.3 23.3 17.7 9.5 5.8
Canada 9.2 6.5 7.4 2.8 1.1
EEC 3.0 2.8 2.5 1.4 0.9
United Kingdom 1.6 2.1 1.3 0.8 0.8
7 A 7 ft 1 f\1 . o
All other 13.5 8.7 4.1 2.5 1.4
36232 Arc welding electrodes, metal . .
.
0.9 0.8 1.0 1.0 0.5
Canada 0.3 0.1 0.1 0.1 (')
EEC 0.2 0.3 0.2 0.2 0.1
United Kingdom (') (') P) (') (')
a i A 1U. 1 U.J A 1 tw
All nfher 0.3 0.3 0.4 0.6 0.4
3623 1 \ Other welding machines, com-
36233/ ponents, & accessories, n.e.c.
.
3.4 4.1 3.3 2.2 0.9
Canada 0.8 0.6 0.3 0.3 0)
EEC 0.9 0.9 1.0 0.5 0.2
United Kingdom 0.3 0.6 0.5 0.3 0.1
Japan (') 0.1 0.1 (') (')
All other 1.4 1.9 1.4 1.1 0.6
1 Less than $0.05 million (included in all other)
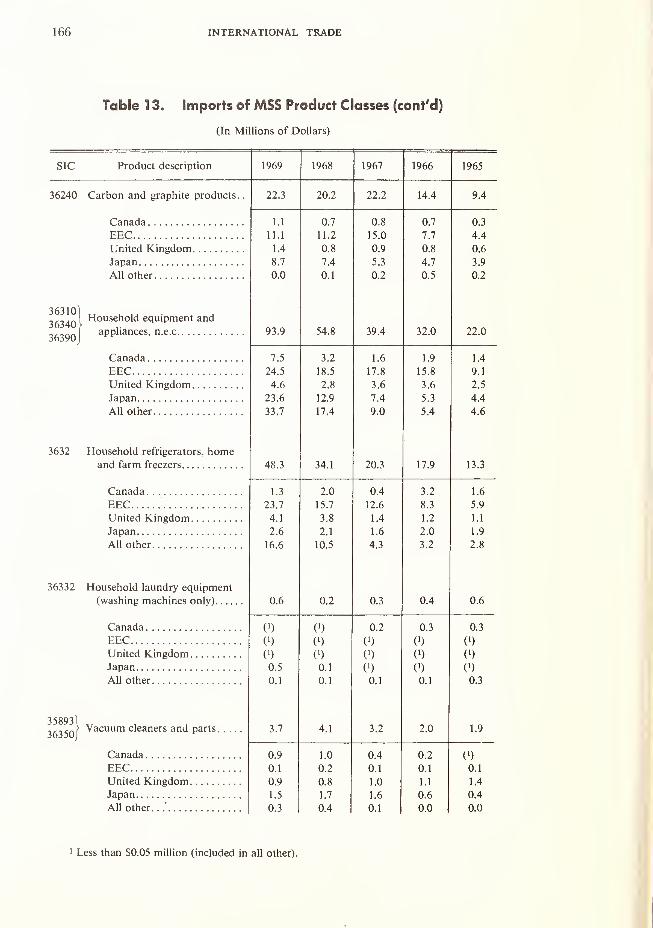
166 INTERNATIONAL TRADE
Table 1 3. Imports of MSS Product Classes (cont'd)
(In Millions of Dollars)
SIC Product description 1969 1968 1967 1966 1965
36240 Carbon and graphite products. 22.3 20.2 22.2 14.4 9.4
Canada 1.1 0.7 0.8 0.7 0.3
EEC 11.1 11.2 15.0 7.7 4.4
United Kingdom 1.4 0.8 0.9 0.8 0.6
8.7 7.4 5.3 4.7 3.9
All other 0.0 0.1 0.2 0.5 0.2
36310
363401Household equipment and
36390 |
appliances, n.e.c 9J.9 C A O54.8 39.4 52.0 22.0
Canada 7.5 3.2 1.6 1.9 1.4
EEC 24.5 18.5 17.8 15.8 9.1
United Kingdom 4.6 2.8 3.6 3.6 2.5
23.6 12.9 7.4 5.3 4.4
All other 33.7 17.4 9.0 5.4 4.6
3632 Household refrigerators, homeanH farm frppyprs 48.3 34.1 20.3 17.9 13.3
Canada 1.3 2.0 0.4 3.2 1.6
EEC 23.7 15.7 12.6 8.3 5.9
United Kingdom 4.1 3.8 1.4 1.2 1.1
Japan 2.6 2.1 1.6 2.0 1.9
All other 16.6 10.5 4.3 3.2 2.8
36332 Household laundry equipment
(washing machines only) 0.6 0.2 0.3 0.4 0.6
/~< _ _ j _0) (') 0.2 0.3 0.3
C1) (') 0) (') (')
0) 0) (') 0)/ 1 \
U.J U. 1 V) V) V)
All other 0.1 0.1 0.1 0.1 0.3
35893/
36350/Vacuum cleaners and parts 3.7 4.1 3.2 2.0 1.9
Canada 0.9 1.0 0.4 0.2 (')
EEC 0.1 0.2 0.1 0.1 0.1
United Kingdom 0.9 0.8 1.0 1.1 1.4
1.5 1.7 1.6 0.6 0.4
All other. .
.' 0.3 0.4 0.1 0.0 1 0.0
1 Less than $0.05 million (included in all other).

APPENDIX B 167
Table 1 3. Imports of MSS Product Classes (cont'd)
(In Millions of Dollars)
SIC Product description 1969 1968 1967 1966 1965
36360 Sewing machines and parts 109.2 95.2 76.3 75.5 67.2
Canada 4.2 2.9 0.2 0.2 0.8
EEC 24.7 18.7 20.1 15.6 11.4
United Kingdom 15.6 11.6 11.0 15.5 14.5
Japan 58.2 56.2 41.7 41.1 37.8
All other 6.5 5.8 3.3 3.1 2.7
36410 Electric lamps (bulbs only) 25.6 23.8 22.6 23.4 14.6
Canada 2.1 2.1 0.7 1.0 0.7
EEC 6.4 6.2 3.7 3.4 2.7
United Kingdom 0.4 0.7 0.2 0.2 0.2
Japan 14.2 12.9 14.8 16.7 10.0
All other 2.5 1.9 3.2 2.1 1.0
36421
'
36422Electric lighting fixtures, except
36423(
portable 12.6 9.4 6.7 8.3 6.4
0.8 0.5 0.3 0.4 0.3
EEC 4.4 3.2 2.2 2.9 2.1
United Kingdom (i) (i) (i) (i) (i)
Japan 0.7 0.4 0.2 0.2 0.1
All other 6.7 5.3 4.0 4.8 3.9
36424
'
Electric lighting except fixtures
36425and outdoor equipment in-
36426cluding hand portable equip-
ment 6.5 28.0 18.7 16.6 13.3
Canada 0) 6.6 2.9 1.4 0.7
EEC 1.6 7.6 4.9 4.1 3.1
United Kingdom.
.
0.3 1.6 1.2 2.4 0.8
Japan 1.7 4.5 3.7 3.4 3.3
All other 2.9 7.7 6.0 5.3 5.4
36427 Portable residential electric
fixtures 5.2 4.7 5.3 8.0 5.6
Canada (') (0 0) (') P)EEC 0.6 0.5 0.6 0.3 0.3
United Kingdom 0) (') (') (!) 0)
Japan 3.6 3.4 3.7 7.1 4.8
All other 1.0 0.8 1.0 0.6 0.5
1 Less than $0.05 million (included in all other).
168 INTERNATIONAL TRADE
Table 1 3. Imports of MSS Product Classes (cont'd)
(In Millions of Dollars)
SIC Product description 1969 1968 1967 1966 1965
36430
36130 Electric current circuit making
36220 and hrpakinf? Hpvicps n f* c 70.2 60.2 51.0 34.9 27.1
36793
16.0 11.1 8.0 7.6 5.7
EEC 20.6 18.9 16.5 9.4 7.1
United Kingdom 5.9 4.9 3.9 3.6 3.1
Japan 15.2 14.1 12.2 8.0 7.6
All other 12.5 11.2 10.4 6.3 3.6
36442 Electric conduit and conduit
fittings 2.3 2.3 1.3 0.7 0.4
Canada 0.2 0.1 (') (') CO
EEC 0.5 0.2 0.1 0.1 (')
United Kingdom 0) (') (') (')
1.6 1.9 1.2 0.5 0.3
All other — 0.1 — 0.1 0.1
36511 Household and automobile
radios and radio-nhonnpranh
combinations 115.0 88.8 60.7 45.8 32.2
Canada 26.7 29.6 18.4 8.1 5.0
EEC 6.8 7.7 8.4 6.4 8.1
United Kingdom 0.3 0.2 0.2 0.2 0.1
Japan
All other 81.2 51.3 33.7 31.1 19.0
3oM2 Household television receivers.. 45.3 18.0 7.6 9.7 0.2
4.7 1.8 5.6 9.5 0.2
EEC 0.1 0.2 0.1 0.1 0)United Kingdom (') 0.1 (') 0) (')
All other 40.5 15.9 1.9 0.1
36514] Other audio equipment and
36515] accessories 62.1 50.1 50.3 53.5 37.7
Canada 2.4 1.4 0.7 0.7 0.3
EEC 10.6 10.9 19.5 17.3 7.9
United Kingdom 36.8 31.5 24.3 30.8 26.5
Japan
All other 12.3 6.3 5.8 4.7 3.0
1 Less than $0.05 million (included in all other).
APPENDIX B 169
Table 1 3. Imports of MSS Product Classes (cont'd)
(In Millions of Dollars)
SIC Product description 1969 1968 1967 1966 1965
36621'
36622
36623icon
Electronic communications
systems and electronic alarm
and signal systems 126.8 118.9 110.1 91.1 45.6
EECUnited KingdomJapan
All other
12.6
6.4
4.5
55.4
47.9
14.9
7.4
3.8
52.0
40.8
16.0
6.5
8.4
47.6
31.6
8.1
5.1
4.7
50.7
22.5
3.7
2.6
2.1
26.0
11.2
36624
'
36628(
Electronic navigational aids
f and detection equipment 64.1 40.9 25.9 26.0 24.8
Canada
EECUnited KingdomJapan
All other
54.7
1.2
5.3
2.5
0.4
33.2
0.9
4.8
1.9
0.1
19.4
0.6
4.8
1.0
0.1
21.1
0.4
4.0
0.4
0.1
21.8
0.3
2.1
0.6
36792]
36291,Capacitors, including industrial.
.
32.2 26.9 23.6 24.5 15.5
EECUnited Kingdom
All other
0.7
6.8
0.4
14.9
9.4
0.4
5.6
0.3
14.7
5.9
0.5
4.5
0.4
15.6
2.6
0.2
5.0
0.5
16.9
1.9
0.1
3.9
0.2
10.3
1.0
36795 Other electronic components. . .
.
63.6 38.4 22 2 38.5 25.6
EECUnited KingdomJapan
All other
5.2
13.0
4.3
17.4
23.7
3.8
9.0
3.2
10.0
12.4
3.5
5.9
3.3
6.2
3.3
5.2
7.1
3.3
16.0
6.9
3.2
5.0
2.5
10.6
4.3
36610 Telephone and telegraph
apparatus 33.9 43.1 30.6 32.5 17.0
Canada
EECUnited KingdomJapan
All other
16.9
7.8
1.1
3.9
42
25.3
10.6
1.1
3.0
3.1
10.6
12.1
1.2
1.7
5.0
7.1
12.2
1.2
1.5
10.5
6.0
6.1
1.0
1.6
2.3
1 Less than $0.05 million (included in all other).

170 INTERNATIONAL TRADE
Table 1 3. Imports of MSS Product Classes (cont'd)
(In Millions of Dollars)
SIC Product description 1969 1968 1967 1966 1965
X-ray and therapeutic
29.0 23.8 19.5 18.4 14.6
Canada 3.5 2.9 2.3 1.4 1.1
EEC 18.8 16.9 12.7 12.6 10.0
United Kingdom 1.0 0.5 0.5 0.8 0.3
Japan 2.5 1.0 0.9 1.4 1.3
All other 3.2 2.5 3.1 2.2 1.9
36942 Battery charging generators 2.1 2.1 1.5 1.3 0.8
Canada 0) (') 0) P) P)EEC 1.3 1.2 0.8 0.5 0.3
United Kingdom 0.7 0.8 0.7 0.7 0.5
0.1 0.1 (') 0.1 0)All other 0.0 0.0 0.0 0.0 0.0
36943 Cranking motors 4.1 3.5 1.7 1.4 0.9
P) P) 0) P) 0)EEC 1.7 1.8 0.7 0.5 0.3
United Kingdom 0.8 0.8 0.7 0.8 0.5
Japan 1.4 0.8 0.2 0.1 0.1
All nthpr ft i n iv. 1 ft n n n
36944 6.3 5.4 4.8 3.6 2.9
\ ) K) V) \
)
\
)
EEC 3.3 3.1 2.6 2.0 1.6
United Kingdom 0.9 0.9 1.1 0.7 0.7
Japan 1.9 1.2 1.1 0.8 0.5
All other 0.2 0.2 0.0 0.1 0.1
36945) Other engine electrical equip-
36946] 34.1 29.8 16.0 13.3 4.7
Canada 24.6 22.9 10.9 9.4 1.3
EEC 4.4 3.8 2.7 2.0 2.1
United Kingdom 0.8 1.1 1.1 0.9 0.8
4.0 1.8 1.2 0.8 0.4
All other 0.3 0.2 0.1 0.2 0.1
1 Less than $0.05 million (included in all other).
APPENDIX B 171
Table 1 3. Imports of MSS Product Classes (cont'd)
(In Millions of Dollars)
SIC Product description 1969 1968 1967 1966 1965
37111 Passenger cars, new 1,451.7 1,374.8 828.1 721.1 526.3
t1 a r» o rl o
pep Q87 Qyo I ,y 1 ftftft 1 SOS Q ftftA 7 A\A 84J4.CI Initorl \? inrrn r\nr\ IftA 7 1 C\A 1 RQ ft07.U Q fty .\J
AS A4J.4
787 7 1 70 ft ft7 ft SI 0Jj.y 7S 1
All other 77.4 91.6 73.2 54.0 40.8
All r»t npr m r\\ r\T v^nir'lp'C u nH/All 1JL11C1 111UIU1 VClUdCS allU37110
37140parts, including aircraft and
missile engines and parts 351.8 270.9 200.1 271.7 167.9
77 A 7^ f. Q ft 7. 7J . J Q 8
per 1 70 11 Ly . 1 1 1 ft 7 Oft 1 1 ftl ft1W1 .o SO C\
T 1 n i tf^H \£ in ctH r\m 1 1ft 7 7ft 7 <ift 7 \AA 41 44.4 / *+. o
Japan 71.2 49.9 30.3 16.6 11.4
1 8 Q10.7 8 Cio.yj < 8 1 7 Q1 L.y
17} 1 ft Ships and boats-nonmilitary,
37320] new 37.1 24.8 18.6 16.4 12.7
Canada 11.6 6.9 4.4 3.2 2.6
EEC 1 A3.4 3.51 A3.4 3.5 3.0
T Jnitpd Kingdom 5.7 2.8 2.3 1.3 1.2
Japan 2.5 1.6 1.6 1.2 1.2
1 1 QIj.y i n n £ Q 7 7 A 1
37510 Motorcycles, bicycles and parts.
.
230.8 167.0 144.8 211.2 172.3
Canada 0.2 0.3 0.1 (') 0)
EEC 28.9 28.7 30.9 31.0 25.3
United Kingdom 36.7 40.4 36.6 40.2 28.0
Japan 1 A £ O OA "1
s4.3 67.0 127.0 1 f\0 A108.4
All other 18.2 13.3 10.2 13.0 10.6
38111 Aircraft flight instruments and
related equipment 13.5 10.8 6.5 5.0 8.2
Canada 8.5 6.5 1.7 2.0 6.2
EEC 1.3 1.1 1.1 0.6 0.2
United Kingdom 1.6 1.4 2.0 1.3 1.1
Japan 1.5 1.2 1.2 0.5 0.3
All other 0.6 0.6 0.5 0.6 0.4
1 Less than $0.05 million (included in all other)
172 INTERNATIONAL TRADE
Table 1 3. Imports of MSS Product Classes (cont'd)
(In Millions of Dollars)
cir Product description 1 Q£Q 1 Q^Q 1 QA7 iyoo
38112 Laboratory and scientific
13.2 13.0 11.3 3.5 3.7
Canada 2.6 3.2 4.0 0.1 0.2
EEC 4.8 3.7 2.5 1.0 1.5
United Kingdom 2.0 1.2 1.7 0.9 1.2
Japan 1.7 2.5 1.7 1.0 0.5
All other 2.1 2.4 1.4 0.5 0.3
38113 Surveying and drafting instru-
ments and laboratory
furniture 18.9 18.5 17.6 16.8 14.5
1.1 0.7 0.4 0.2 0.2
EEC 8.2 7.8 7.4 7.6 7.1
United Kingdom 1.9 2.0 1.7 1.9 1.2
3.9 3.5 2.9 2.5 1.7
All other 3.8 4.5 5.2 4.6 4.3
38212 Integrating meters, nonelectric
type 1.6 0.9 0.8 0.7 0.2
Canada 0.2 0.1 (') (') (')
EEC 0.2 0.1 0.2 0.2 0.1
United Kingdom 0.6 0.5 0.3 0.2 0)
Japan 0.6 0.2 0.2 0.2 V)All other 0.0 0.0 0.1 0.1 0.1
38211
38213Mechanical measuring and
38214> industrial process instru-
38220ments, n.e.c 27.5 22.2 16.1 13.8 10.7
Canada 2.8 2.6 1.3 1.2 1.5
EEC 11.2 8.9 6.2 5.3 4.1
United Kingdom 3.2 2.8 2.7 2.5 1.6
5.3 3.6 2.6 2.0 1.3
All other 5.0 4.3 3.3 2.8 2.2
383111
19410/Optical instruments and lenses. . 88.3 77.8 65.7 62.0 48.5
Canada 1.3 0.6 0.5 0.9 0.5
EEC 18.5 16.9 16.2 15.3 12.4
United Kingdom 3.3 2.8 2.7 2.4 2.1
Japan 58.2 51.8 40.6 39.1 30.4
All other 7.0 5.7 5.7 4.3 3.1
1 Less than $0.05 million (included in all other).

APPENDIX B 173
Table 1 3. Imports of MSS Product Classes (cont'd)
(In Millions of Dollars)
SIC PrArl npt H psprint inn 1969 1968 1967 1966 1965
38410 Surgical and medical instru-
ments and apparatus 13.9 10.1 8.4 7.5 5.5
Canada 0.5 0.3 0.1 0.1 0.1
EEC 8.5 6.5 5.5 4.8 3.4
United Kingdom 1.9 1.2 1.0 1.0 0.9
Japan 1.3 1.0 1.0 0.8 0.6
All other 1.7 1.1 0.8 0.8 0.5
FORM NBS-114A (1-71)
U.S. DEPT. OF COMM. 1. PUBLICATION OR REPORT NO.BIBLIOGRAPHIC DATA NBS-SP-345-8
2. Gov't AccessionNo.
3. Recipient's Accession No.
4. TITLE AND SUBTITLE
U.S. Metric Study Interim Report: International Trade
5. Publication Date
July 19 71
6. Performing Organization Code
7. AUTHOR(S)Gerald F. Gordon
8. Performing Organization
9. PERFORMING ORGANIZATION NAME AND ADDRESS
NATIONAL BUREAU OF STANDARDSDEPARTMENT OF COMMERCEWASHINGTON, D.C. 20234
10. Project/Task/Work Unit No.
406312911. Contract/Grant No.
12. Sponsoring Organization Name and Address 13. Tvpe of Report & PeriodCovered
Interim
14. Sponsoring Agency Code
15. SUPPLEMENTARY NOTES
16. ABSTRACT (A 200-word or less factual summary of most significant information. If document includes a significantbibliography or literature survey, mention it here.)
This publication, one of a series prepared pursuant to the U.S. Metric StudyAct, evaluates the potential effects that a U.S. conversion to the metricsystem may have on the Nation's foreign trade. i; ie report is based on asurvey of exporters and importers trading in measurement- sensitive products,which was conducted by the Bureau of Domestic Commerce of the Departmentof Commerce.
me1me1trade
:
usag
18. AVAILABILITY STATEMENT 19. SECURITY CLASS(THIS REPORT)
21. NO. OF PAGES
1X1 UNLIMITED.UNCLASSIFIED
188
1 1FOR OFFICIAL DISTRIBUTION. DO NOT RELEASETO NTIS.
20. SECURITY CLASS(THIS PAGE)
UNCLASSIFIED
22. Price
$1.50
USCOMM-DC 66244-P71


!

, REYNOLDSBINDLRY, INC.
KUiillfcldl