u.s. mining industry energy bandwidth study · ventilation materials handling diesel electric...
TRANSCRIPT


Contents
Executive Summary.................................................................................................................1
1. Introduction..................................................................................................................5
2. Background ..................................................................................................................7
2.1 Mining Industry Energy Sources ...................................................................................7 2.2 Materials Mined and Recovery Ratio ............................................................................7 2.3 Mining Methods.............................................................................................................8
3. Mining Equipment .......................................................................................................9 3.1 Extraction.....................................................................................................................10 3.2 Materials Handling Equipment ....................................................................................11 3.3 Beneficiation & Processing Equipment .......................................................................12
4. Bandwidth Calculation Methodology ......................................................................13
4.1 Method for Determining Current Mining Energy Consumption .................................14 4.2 Best Practice, Practical Minimum, and Theoretical Minimum Energy Consumption 16 4.3 Factoring in Electricity Generation Losses in the Analysis.........................................17 4.4 Estimating Annual Energy Consumption and Energy-Savings Opportunity ..............18
5. Uncertainties and Data Quality ................................................................................19
6. Conclusion ..................................................................................................................21
References...............................................................................................................................25
Appendix A: Current Energy Consumption and Savings Potential by Equipment
Category in Coal, Metal, and Mineral Mining.............................................27
Appendix B: Energy Requirements and Efficiencies of Equipment Types in
Coal, Metals and Minerals Mining................................................................31
Appendix C: Total Energy Consumption by Mining Stage across
Coal, Metals and Minerals Mining (TBtu/yr) ..............................................35
Appendix D: Assumptions for U.S. Mining Industry Bandwidth Analysis......................37
Appendix E: Glossary of Mining Terms..............................................................................41

Mining Energy Bandwidth Analysis Process and Technology Scope
Exploration
Extraction
Blasting
Dewatering Drilling Digging
Ventilation
Materials HandlingElectric Diesel
Beneficiation & Processing Separations Grinding Crushing
Finished Product

Executive Summary
The Industrial Technologies Program (ITP) in the U.S. Department of Energy’s (DOE) Office of Energy Efficiency and Renewable Energy (EERE) works with the U.S. industry to reduce its energy consumption and environmental impact nationwide. ITP relies on analytical studies to identify large energy reduction opportunities in energy-intensive industries and uses these results to guide its R&D portfolio. One facet of energy analysis includes energy bandwidth studies which focus on a particular industry and analyze the energy-saving potential of key processes in that industry. The energy bandwidth, determined from these studies, illustrates the total energy-saving opportunity that exists in the industry if the current processes are improved by implementing more energy-efficient practices and by using advanced technologies. This bandwidth analysis report was conducted to assist the ITP Mining R&D program in identifying energy-saving opportunities in coal, metals, and mineral mining. These opportunities were analyzed in key mining processes of blasting, dewatering, drilling, digging, ventilation, materials handling, crushing, grinding, and separations.1 The U.S. mining industry (excluding oil & gas) consumes approximately 1,246 Trillion Btu/year (TBtu/yr). This bandwidth analysis estimates that investments in state-of-the-art equipment and further research could reduce energy consumption to 579 TBtu/yr (Exhibit 1). There exists a potential to save a total of 667 TBtu/yr – 258 TBtu/yr by implementing best practices and an additional 409 TBtu/yr from R&D that improves mining technologies. Additionally, the CO2 emission reduction achievable from total practical energy savings is estimated to be 40.6 million tonnes (Exhibit 2).
Exhibit 1. U.S. Mining Industry Energy Bandwidth
409
258
0
200
400
600
800
1000
1200
1400
Ener
gy C
onsu
mpt
ion
(Tril
lion
Btu
/Yea
r)
Best Practice Energy Saving Opportunity=258 Trillion Btu/YearR & D Energy Savings Opportunity=409 Trillion Btu/YearLess Practical Energy Savings Recovery OpportunityMinimum Energy Requirement
Current Energy Consumption= 1246 Trillion Btu/Year
Theoretical Minimum= 184 Trillion Btu/Year
Best Practice= 988 Trillion Btu/Year
Practical Minimum= 579 Trillion Btu/Year
Ene
rgy
Savi
ngs
Opp
ortu
nity
As seen in Exhibit 2, the greatest energy reductions for the mining processes assessed in this study can be actualized in the coal and metal mining industries.
1 Refer to Glossary of Mining Terms in Appendix E or Section 3 for further clarification of processes.
1

Exhibit 2. Energy Savings Opportunity by Commodity Type (TBtu/yr)
Current Energy
Consumption
Energy Savings from R&D Improving
Energy Efficiency
Energy Savings from
Implementing Best Practices
Total Practical Energy Savings
CO2 Reduction from Total
Practical Energy Savings
(million tonnes)* Coal 485.3 84.2 153.3 237.5 14.4Metals 552.1 117.5 220.7 338.2 20.6Minerals 208.9 56.6 35.2 91.8 5.6Total 1246.3 258.3 409.2 667.5 40.6* The CO2 emissions factor for the mining industry (60,800 tonnes / TBtu) was calculated from the fuel mix in the Miing E&E Profile.
The fuel consumption was equated to carbon dioxide emissions using conversion factors obtained from EIA.
The two equipment types offering the greatest energy savings potential in the mining industry are grinding and diesel (materials handling) equipment (Exhibit 3). Implementing best practices and new advances through R&D can save 356 TBtu/yr in grinding and 111 TBtu/yr in materials handling. By reducing the energy consumption of these two processes to their practical minimum, the mining industry would save about 467 TBtu/yr, or 37% of current energy consumption. Energy savings illustrated in Exhibit 3 include the full implementation of state-of-the-art technology and installation of new technology through R&D investments.
Exhibit 3. Energy-Saving Opportunity in U.S. Mining Industry for Top 10 Energy-Intensive Processes
0 50 100 150 200 250 300 350 400
Energy Savings Opportunity (Trillion Btu/Year)
separations
grinding
crushing
electric
diesel
ventilation
dewatering
drilling
digging
blasting
CoalMineralsMetals
Extraction
Materials Transport/Handling
Beneficiation & Processing
It is important to note that the energy-saving opportunities reported in this study are independent of one another (e.g. improving blasting energy savings will increase downstream savings in materials handling, and beneficiation and processing; however these potential downstream savings are not accounted for in this study).
2

Methodology The bandwidth analysis relies on estimating the following quantities:
• Current Energy Consumption – The average energy consumption for performing a given process
• Best Practice Energy Consumption – The energy consumed by mine sites with above-average energy efficiency
• Practical Minimum Energy Consumption – The energy that would be required after R&D achieves substantial improvements in the energy efficiency of mining processes
• Theoretical Minimum Energy Consumption – The energy required to complete a given process, assuming it could be accomplished without any energy losses
The difference between current energy consumption and best practice consumption corresponds to energy-saving opportunities from investments made in state-of-the-art technologies or opportunity existing today which has not been fully implemented in mine operations. The difference between best practice and practical minimum energy consumption quantifies opportunities for research and development or near-term opportunity with few barriers to achieving it. Finally, the difference between the practical and theoretical minimum energy consumption refers to the energy recovery opportunity which is considered impractical to achieve because it is a long-term opportunity with major barriers or is infeasible. This analysis uses data on the current energy requirements for mining equipment used in key processes based on calculations from the SHERPA modeling software2 and published equipment efficiency values. However, no single value for the theoretical minimum energy requirement for mining could be sourced, even for a specific mining commodity, because of the wide variability in mining process requirements. The mining process is unique in that unlike most industrial processes, the starting raw materials and conditions for production vary widely, sometimes by more than an order of magnitude, in energy intensity (Btu/ton produced). Therefore, an average theoretical value was approximated by evaluating the average performance efficiency of mining equipment. Practical minimum energy requirements represent a value between the theoretical and best practice performance of mining equipment. The best practice value can be benchmarked at a specific point in time; however, the practical minimum energy levels are a moving target since today’s estimates of practical machine efficiencies are not absolute and may be surpassed via improvement in science and technology over time. For several mining processes, estimates of practical limits were based on literature approximating the maximum efficiency of equipment types. When practical efficiency estimates were unavailable, the analysis assumed the practical minimum to be two-thirds of the way from the best practice energy consumption to the theoretical minimum energy consumption.3 To reflect more inclusive energy savings, the bandwidth analysis used tacit energy values of electrical energy consumption (i.e., generation and distribution losses are factored in addition to
2 Western Engineering, Inc. – SHERPA Software - software used by the mining industry to model mining operations
and estimate capital, energy, labor and other costs of production. 3 Practical Min = Best Practice - (Best Practice - Theoretical Min)* 2/3 (see page 17)
3

onsite electrical consumption). Including generation and distribution losses in bandwidth estimates is essential as saving 1 Btu of onsite electricity translates to a total savings of over 3.17 Btu using current data (EIA 2006). The practical minimum values were adjusted to reflect 2020 electrical distribution systems, where the ratio of offsite to onsite electricity consumption is assumed to be 3.05 (EIA 2006). Theoretical values, however, assume zero electrical losses.
4

1. Introduction
The U.S. mining industry provides essential raw materials like coal, metals, minerals, sand, and gravel to the nation’s manufacturing and construction industries, utilities and other businesses. Nearly 24 tons of material are consumed annually per capita in the United States;4 further, common consumer products can use a vast variety of mined materials, for example, a telephone is manufactured from as many as 42 different mined materials, including aluminum, beryllium, coal, copper, gold, iron, limestone, and silica. Mining these materials consumes significant energy – in 2002, the mining industry spent $3.2 billion on energy, or 21% of the total cost of its supplies (not including labor).5 Given the large role mining industry plays in the U.S. economy and the energy intensity of the mining processes, tapping into the potential for energy savings across different mined commodities could yield significant impact. The magnitude of these potential savings can be quantified using the energy bandwidth analysis – a method for estimating the opportunity in various processes based on their theoretical energy consumption and the practical minimum energy use achievable by implementing R&D results and best practices. This mining industry energy bandwidth analysis was conducted to assist the Industrial Technologies Program’s (ITP) Mining subprogram, an initiative of the U.S. Department of Energy’s (DOE) Office of Energy Efficiency and Renewable Energy (EERE), to maximize the impact of its R&D in reducing industrial energy consumption. Although the study focuses on equipment used in coal, metals, and industrial minerals mining, some results can also be applied to the oil & gas exploration and production industries, since similar equipment is used in both industries. This bandwidth study expands on the previous work conducted in Energy and Environmental Profile of the U.S. Mining Industry (E&E Profile), a study published by DOE in 2002 to benchmark energy use for various mining technologies.6 It uses similar methods to estimate the average energy consumption of key equipment used in coal, metals, and mineral mining. In absence of energy data on many mined commodities in the U.S., the E&E Profile benchmarks energy consumption for eight mined commodities, collectively responsible for approximately 78% of the energy used in the U.S. mining industry. These commodities were used to define the average Btu/ton for coal, metals, and industrial minerals which was then proportioned against the total mined material for each sector in the mining industry to account for the remainder of the mining industry. Additionally, there is very little data available on U.S. mining industry for energy use by specific mining process, equipment type or fuel type utilized. Thus the E&E Profile assumes a “typical” mine and uses data from a combination of sources including production data from federal and
4 National Mining Association. “Per capita consumption of minerals – 2006”. February 2007.
http://www.nma.org/pdf/m_consumption.pdf 5 U.S. Department of Commerce, Bureau of Census, Mining Industry Series, 2002 (Supplies include minerals
received, purchased machinery installed, resales, purchased fuels consumed, purchased electric energy and contract work.) This does not include withheld data.
6 U.S. Department of Energy. Energy and Environmental Profile of the U.S. Mining Industry. 2002.
5

industry sources (Census of Mineral Industries). Estimates are based on the SHERPA Mine Cost Estimating Model and Mine and Mill Equipment Costs, an Estimator’s Guide from Western Mine Engineering, Inc. to model the typical equipment required for various types of mine operations (e.g. longwall mine, western surface mine, etc.) and the energy consumption of each major equipment unit. The SHERPA software was used to identify the type and number of equipment units optimally used in a hypothetical mine based on certain assumptions and inputs. The Estimator’s Guide identified the energy cost for particular equipment types, which is determined by annual surveys of U.S. equipment manufacturers and distributors, fuel and energy suppliers, and mining companies. This model and equipment cost guide served the need to establish and manipulate baseline assumptions and inputs in order to develop hypothetical mines deemed reasonable by industry experts. While the E&E Profile provides detailed data for the estimated energy consumption of each piece of equipment required in a typical mine, this report focuses on the average energy consumption of similar equipment types to estimate the potential for energy savings for a given process. Similar equipment was grouped into the following categories based on their process use: blasting, dewatering, drilling, digging, ventilation, materials handling, crushing, grinding, and separations. Thus the analysis in this report identifies the equipment categories which provide the greatest opportunities for energy savings in the U.S. mining industry.
6

2. Background
2.1 Mining Industry Energy Sources Major energy sources for the U.S. mining industry are petroleum products, electricity (purchased and produced onsite), coal, and natural gas. Diesel fuel accounts for 34% of the U.S. mining industry’s fuel needs, followed by onsite electricity at 32%, natural gas at 22%, and coal and gasoline supplying the balance (Exhibit 4).7 The type of fuel used at a mine site will depend on the mine type (surface or underground) and on the processes employed.
2.2 Materials Mined and Recovery Ratio Materials mined in the U.S. can be broadly classified into three categories: coal, metals (e.g., iron, lead, gold, zinc and copper), and industrial minerals (these include phosphate, stone, sand and gravel). Each mined product has a different recovery ratio, which has a significant impact on the energy required per ton of product.
Exhibit 4. Fuels Consumed in the U.S. Mining Industry
Coal10%
Diesel34%
Natural Gas22%
Gasoline2%
Electricity32%
Exhibit 5. Mined Material Recovery in 2000
Commodity Recovery Ratio Million Tons Recovered
Million Tons Mined
Coal Average 82% 1073 1308.5 Metals Iron 19% 69.6 366.3 Copper 0.16% 1.6 1000.0 Lead & Zinc 8% 1.4 17.5 Gold & Silver 0.001% 0.003 300.0 Other* n/a < 0.05 Average 4.50% 72.6 1613.3 * Other category consists of magnesium, mercury, titanium, vanadium, and zirconium
Industrial Minerals
Potash, Soda Ash,
Borates 88.30% 13.856 15.7 Phosphate 33% 42.549 128.9 Sand & Gravel n/a 1,148 Stone (crushed) 92.60% 1,675.50 1809.4 Other n/a 320.1 Average 90% 3,200 3556
Mining Total Average 67% 4,346 6,477
7 Energy and Environmental Profile for the U.S. Mining Industry. 2002. p. 1-19.
7

The recovery ratio in mining refers to the percentage of valuable ore within the total mined material. While coal mining has a recovery ratio of 82%, the recovery ratio for metals averages only about 4.5% (Exhibit 5). This means 1.2 tons of material must be mined for every 1 ton of useful coal product, while 22 tons of material must be mined for every 1 ton of metal product.8 These recovery ratios exclude waste rock from development operations. The U.S. mining industry produced 1,073 million tons of coal, 72.6 million tons of metal ores, and 3,200 million tons of industrial minerals in 20009 (Exhibit 5), amounting to a total of 4,346 million tons of mined products. Factoring in the waste materials that must also be processed by the mining industry, the total amount of material extracted, handled, and processed in the mining industry totaled 6,477 million tons.10 Coal, metals, and industrial minerals mining accounted for a total of 13,904 mines in the United States in 2000 with 235,348 employees working in the mines and/or processing plants. 2.3 Mining Methods The extraction of coal, metals and industrial minerals employs both surface and underground mining techniques. The method selected depends on a variety of factors, including the nature and location of the deposit, and the size, depth and grade of the deposit. Surface mining accounts for the majority of mining (65% of coal, 92% of metals, and 96% of minerals mined) with underground mining accounting for the remaining (Exhibit 6).11 Underground mining requires more energy than surface mining due to greater requirements for hauling, ventilation, water pumping, and other operations.
Exhibit 6. Underground and Surface Mining in the United States Million Tons Of
Material Mined % Produced in Surface Mines
% Produced in Underground Mines
Coal 1,309 65% 35% Metals 1,613 92% 8%
Industrial Minerals 3,556 96% 4%
8 Energy and Environmental Profile for the U.S. Mining Industry. 2002. p. 1-17, p. 1-7. 9 While 2005 data is available, this analysis used 2000 data to stay consistent with the 2000 data presented in the
Energy and Environmental Profile of the U.S. Mining Industry. After new data is presented in the E&E Profile, this bandwidth analysis will be updated to reflect the latest industry data. According to NMA and USGS Commodity Summaries (metals and industrial minerals selected based on DOE Mining Annual Report of 2004), production in 2005 was: coal – 1,131 M tons; metals – 62.3 M tons; and industrial minerals – 3,491M tons.
10 Overburden is included in the total material mined. 11 Energy and Environmental Profile for the U.S. Mining Industry. 2002. p. 1-13.
8

3. Mining Equipment
The mining process can be divided into three broad stages, each involving several operations. The first stage is extraction, which includes activities such as blasting and drilling in order to loosen and remove material from the mine. The second stage is materials handling, which involves the transportation of ore and waste away from the mine to the mill or disposal area. At the processing plant, the third stage, i.e., beneficiation & processing is completed. This stage recovers the valuable portion of the mined material and produces the final marketable product. Beneficiation operations primarily consist of crushing, grinding, and separations, while processing operations comprise of smelting and/or refining. In this study, similar equipment types that perform a given function were grouped into a single category to benchmark their energy consumption. For example, all types of drills and blasting agents, such as ammonium nitrate fuel oil (ANFO) and loaders are grouped into the drilling category to assign energy data. The different equipment types analyzed are listed below. Operations that consume relatively low amounts of energy were omitted, as they offer poor energy-saving opportunities.
o Extraction Drilling Blasting Digging Ventilation Dewatering
o Materials Transport and Handling Diesel powered Equipment Electrical equipment
• Load Haul Dump • Conveyers • Pumps
o Beneficiation and Processing Crushing Grinding Separations
• Centrifuge • Flotation
9
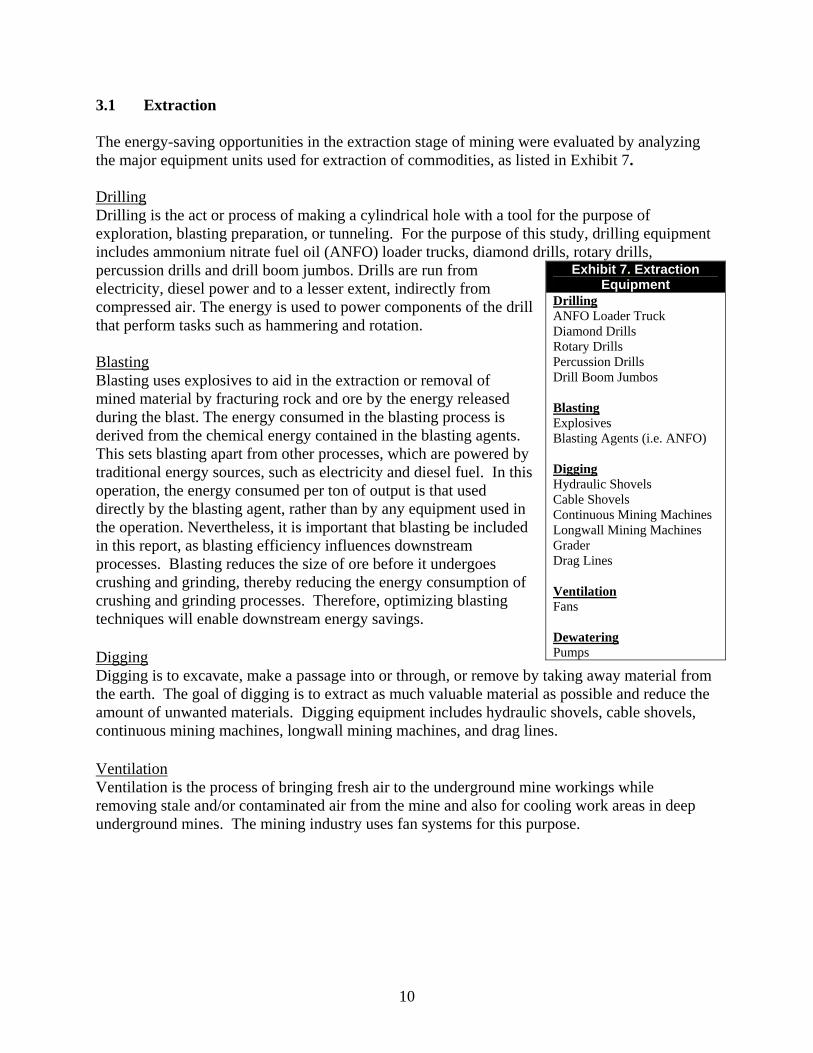
3.1 Extraction The energy-saving opportunities in the extraction stage of mining were evaluated by analyzing the major equipment units used for extraction of commodities, as listed in Exhibit 7. Drilling Drilling is the act or process of making a cylindrical hole with a tool for the purpose of exploration, blasting preparation, or tunneling. For the purpose of this study, drilling equipment includes ammonium nitrate fuel oil (ANFO) loader trucks, diamond drills, rotary drills, percussion drills and drill boom jumbos. Drills are run from electricity, diesel power and to a lesser extent, indirectly from compressed air. The energy is used to power components of the drill that perform tasks such as hammering and rotation.
Exhibit 7. Extraction Equipment
Drilling ANFO Loader Truck Diamond Drills Rotary Drills Percussion Drills Drill Boom Jumbos Blasting Explosives Blasting Agents (i.e. ANFO) Digging Hydraulic Shovels Cable Shovels Continuous Mining Machines Longwall Mining Machines Grader Drag Lines Ventilation Fans Dewatering Pumps
Blasting Blasting uses explosives to aid in the extraction or removal of mined material by fracturing rock and ore by the energy released during the blast. The energy consumed in the blasting process is derived from the chemical energy contained in the blasting agents. This sets blasting apart from other processes, which are powered by traditional energy sources, such as electricity and diesel fuel. In this operation, the energy consumed per ton of output is that used directly by the blasting agent, rather than by any equipment used in the operation. Nevertheless, it is important that blasting be included in this report, as blasting efficiency influences downstream processes. Blasting reduces the size of ore before it undergoes crushing and grinding, thereby reducing the energy consumption of crushing and grinding processes. Therefore, optimizing blasting techniques will enable downstream energy savings. Digging Digging is to excavate, make a passage into or through, or remove by taking away material from the earth. The goal of digging is to extract as much valuable material as possible and reduce the amount of unwanted materials. Digging equipment includes hydraulic shovels, cable shovels, continuous mining machines, longwall mining machines, and drag lines. Ventilation Ventilation is the process of bringing fresh air to the underground mine workings while removing stale and/or contaminated air from the mine and also for cooling work areas in deep underground mines. The mining industry uses fan systems for this purpose.
10

Dewatering Dewatering is the process of pumping water from the mine workings. Pumping systems are large energy consumers. This study assumes end-suction pumps (i.e. centrifugal) as the only equipment used for dewatering the mine during extraction.12 3.2 Materials Handling Equipment The materials handling equipment were categorized into diesel and electric for the purpose of this energy bandwidth analysis (Exhibit 8). In general, diesel fuel powers rubber tire or track vehicles that deliver material in batches, while electricity powers continuous delivery systems such as conveyors and slurry lines. Diesel Equipment Much of the equipment used in the transfer or haulage of materials in mining is powered by diesel engines. Equipment includes service trucks, front-end loaders, bulldozers, bulk trucks, rear-dump trucks and ancillary equipment such as pick-up trucks and mobile maintenance equipment. Diesel technologies are highly energy intensive, accounting for 87% of the total energy consumed in materials handling.13 Materials handling equipment is powered by diesel 80%, 100%, and 99.5% for coal, metals and industrial minerals respectively as per the mine equipment modeled in this study using SHERPA software.
Exhibit 8. Materials Handling Equipment
Diesel Equipment Service Trucks Front-end Loaders Bulldozers Pick-up Trucks Bulk Trucks Rear-dump Trucks Electric Equipment Load-Haul-Dump Machines- Conveyors (motors) Pipelines (pumps) Hoists
Electric Equipment Electric equipment includes load-haul-dump (LHD) machines, hoists, conveyor belt systems and pipelines for pumping slurries. The percentage of materials handling equipment run by electricity is 20% for coal, 0% for metals,14 and 0.5% for industrial minerals, according to the mines modeled with SHERPA. It must be noted, however, that the actual use of conveyor systems in metal and industrial mineral mines is more extensive than was modeled by the E&E Profile. The SHERPA software model identifies the optimal type and number of equipment units used in hypothetical mines by considering many variables including different inputs and assumptions. In this instance, the SHERPA model did not output conveyor belt energy data because it determined that haul trucks were the best option for materials handling. Thus, the hypothetical mine scenario does not show greater conveyor usage based on the inputs entered.
12 Industry expert. Oral communication - “Deep-well/Vertical turbine pumps are predominantly used by deep coal
mines because they are more efficient.” April 2007. 13 Mining Industry of the Future Fiscal Year 2004 Annual Report. p. 6 14 While electric conveyors are used in certain metal mines, this analysis was based on the SHERPA mining
software from Western Mine Engineering which did not output electric equipment for metals mines based on inputs.
11

3.3 Beneficiation & Processing Equipment Exhibit 9. Beneficiation and Processing
Equipment Crushing Primary Crusher Secondary Crusher Tertiary Crusher Grinding SAG Mill Ball Mill Rod Mill Processing Roasting Smelting Refining
Separations Physical: Centrifuge Flotation Screen Filter Cyclone Magnetic Separator Pelletizer Solvent Extraction Thickener Trommel Washing Chemical: Electrowinning
Beneficiation comprises crushing, grinding and separations, while processing operations include roasting, smelting, and refining to produce the final mined product (Exhibit 9). Crushing Crushing is the process of reducing the size of run-of- mine material into coarse particles. The efficiency of crushing in mining depends on the efficiency of upstream processes (rock fragmentation due to blasting or digging in the extraction process) and in turn, has a significant effect on downstream processes (grinding or separations). Grinding Grinding is the process of reducing the size of material into fine particles. As with crushing, the efficiency of grinding is influenced by upstream processes that fragment the rock prior to the grinding stage. In the case of both crushing and grinding, estimates of their energy efficiency in the literature vary widely based on the metrics involved (creation of new surface area per unit energy applied, or motor efficiency of crushing equipment). Separations The separation of mined material is achieved primarily by physical separations rather than chemical separations, where valuable substances are separated from undesired substances based on the physical properties of the materials. As shown in Exhibit 9, a wide variety of equipment is used for separations processes, the largest energy-consuming separation method amongst these being centrifugal separation for coal mining, and floatation for metals and minerals mining. Centrifuges consist primarily of a spinning basket designed to receive solid-liquid slurries and remove the liquid. The “centrifugal force” created by the spinning action sends the liquid out of the bowl through a perforated medium and leaves the desired solid material behind. Flotation machines are designed to isolate valuable ore from other non-valuable substances. The surfaces of mineral particles are treated with chemicals that bond to the valuable product and make them air-avid and water-repellent. The ore is suspended in water that is mechanically agitated and aerated. The treated minerals attach to air bubbles and rise to the surface where they can be collected. Final Processing Final processing includes steps that further prepare the ore to yield the desired product in its purest and most valuable form. Roasting, smelting, and refining are different processes falling under this category. While a component of the mining industry, these processes require relatively much less energy. These processes were, therefore, not investigated in this study.
12

4. Bandwidth Calculation Methodology
This bandwidth study estimates the achievable energy savings for different commodity groups – coal, metals and industrial minerals. The analysis examines energy-saving opportunities in common processes rather than opportunities for operational improvement (e.g., using more efficient fans rather than more efficient fan utilization, or improving diesel engines rather than improving routing for diesel equipment). Mining process equipment was analyzed according to three main stages: extraction, materials transport and handling, and beneficiation and processing (section 3). Similar equipment units that perform a given function were grouped into a single category to benchmark their energy consumption. See section 3, Mining Equipment (page 9) for equipments analyzed. For each equipment type, the current energy consumption, best practice energy consumption, practical minimum, and theoretical minimum energy consumption were estimated.
• Current Energy Consumption – The actual average energy consumption for performing a given process
• Best Practice Energy Consumption – The energy consumed by mining sites with above average energy efficiency
• Practical Minimum Energy Consumption – The energy that would be required after R&D achieves substantial improvements in the energy efficiency of the mining technology
• Theoretical Minimum Energy Consumption – The energy required to complete a given process, assuming it could be accomplished without any energy losses
The energy-savings opportunity is calculated as the difference between the current energy consumption and the practical minimum energy consumption, assuming that mining production rates remain constant. Energy Savings Potential = Current Energy Consumption – Practical Minimum Energy Required The bandwidth analysis is based on energy data on eight mined commodities that in sum account for 78% of the total energy use by the U.S. mining industry. The eight commodities are coal; potash, soda ash and borate; iron; copper; lead and zinc; gold and silver; phosphate rock; and limestone. These commodities were used to define the average Btu/ton for coal, metals, and industrial minerals which was then proportioned against the total mined material for each sector in the mining industry to account for the remainder of the mining industry. Values are reported in Btu/ton of material handled, as well as Btu/yr consumption. Quantifying the above measures of energy consumption for each equipment type enabled an estimate of the entire mining industry’s current energy consumption and potential for energy reduction. It also identified the equipment types that would provide the greatest opportunity for energy reduction in mining operations.
13

4.1 Method for Determining Current Mining Energy Consumption This study estimates current energy consumption relying on the same data sources and assumptions as used in the E&E Profile.15 The E&E Profile used the SHERPA Mine Cost Estimating Model along with Mine and Mill Equipment Costs, an Estimator’s Guide from Western Mine Engineering, Inc. The SHERPA software was used to model several mines differing by ore type, mining technique, and production rate. For each mine, the energy consumption (Btu/ton) of key processes (drilling, digging etc.) was calculated. These values were then used to determine the average energy consumption of key processes in coal, metal, and mineral mining.
Step 1: Determine equipment energy requirements for individual model mines The SHERPA model allows the user to input parameters describing seam and ore body characteristics, and it outputs the equipment required by the mine. Model mines were selected to represent the majority of commodity production from U.S. mining. Four coal mines were modeled – an eastern longwall, eastern underground, western surface, and interior surface mine – each with differing production rates. Mineral mines included potash, limestone, and phosphate mines, while metal mines included iron, copper, lead, and gold mines. SHERPA provided a list of equipment required for each mine as well as the number of operating hours expected for each equipment unit. In cases where additional information was required (for example, SHERPA does not include beneficiation and processing equipment), typical equipment requirements were determined through correspondence with industry experts. Each equipment unit’s energy consumption was then obtained from the Estimator’s Guide. Exhibit 10 below displays an example of equipment lists and data derived from SHERPA and the Estimator’s Guide.
Exhibit 10. Extraction and Materials Handling Equipment for Assumed
Interior (Coal) Surface Mine (9,967 tons per day produced)
Equipment Number of Units
Daily hours/unit Btu/hr (single unit)
Hydraulic Shovel 1 9.38 4,102,318 Rear Dump Trucks 11 14 1,656,897 Front-end Loaders 5 14 3,640,682 Bulldozer 2 14 5,115,421 Pick-up Trucks 8 14 207,112 Rotary Drills 2 14 805,991 Pumps 2 14 331,549 Service Trucks 2 14 339,364 Bulk Trucks 2 13.58 339,364 Water Tankers 1 2.94 1,502,187 Graders 1 0.56 618,841
15 U.S. Department of Energy. Energy and Environmental Profile of the U.S. Mining Industry. 2002.
14

Step 2: Calculate total energy consumption for major processes/equipment types The energy consumption of key processes (such as drilling, digging, etc.) in each mine was determined by summing the energy consumption of each associated equipment unit generated by the SHERPA model. For example, in the case of the interior surface coal mine modeled in the E&E Profile, the energy consumption required for materials transport/handling is the sum of energy consumed by the rear dump trucks, front-end loaders, bulldozer, service trucks, and bulk trucks (see Exhibit 11 below). The energy consumed per ton of material (Btu/ton) was determined by dividing all the equipments’ daily energy consumption by the tons of material mined each day. This calculation was repeated for each of the four coal mines analyzed.
Exhibit 11. Diesel-Powered Materials Handling Equipment for Assumed
Interior (Coal) Surface Mine (9,967 tons per day produced)
Number of Units
Hours/ Unit
Btu/hr (single unit)
Btu/ton of material handled
Rear Dump Trucks 11 14 1,656,897 25,601 Front-end Loaders 5 14 3,640,682 25,569 Bulldozer 2 14 5,115,421 14,371 Pick-up Trucks 8 14 207,112 2,327 Service Trucks 2 14 339,364 953 Bulk Trucks 2 13.58 339,364 925
Total 69,746
Step 3: Estimate average energy consumption across multiple mines The energy consumption estimates for each individual mine were used to calculate the weighted average energy consumption, based on the productivity of the different mine types in the United States. The resulting value for energy consumption was assumed to be representative of the coal mining industry. The energy consumed by diesel-powered materials handling equipment in coal mining is shown below in Exhibit 12.
Exhibit 12. Diesel-Powered Materials Handling Equipment:
Average Energy Consumption for Coal Mines Modeled
Energy Consumption (Btu/ton)
Materials Mined in the United States (Thousand Short Tons)b
Proportion of Total Mines Analyzed
Eastern Underground 68,320 178,934 17.80%Longwall NAa 152,584 15.18%Interior Surface 69,746 109,232 56.15%Western Surface 41,960 564,401 10.87%Weighted Average Energy Consumption (Btu/ton) 43,303 a Longwall mining machines are electric powered, according to Western Mine Engineering Mine & Mill Equipment Costs – An Estimator’s Guide. 1999. b Calculated based on EIA Annual Coal Report 2000 (Production/Average Recovery Ratio).
15
4.2 Best Practice, Practical Minimum, and Theoretical Minimum Energy Consumption General methods for determining the best practice, practical minimum, and theoretical minimum energy consumption are discussed below. Detailed assumptions are listed in Appendix D (page 37). Best Practice Energy Consumption Estimates of best practice energy consumption were based on a variety of published sources reporting the energy efficiencies of top-performing mining equipment. In cases where equipment characteristics varied significantly, or when equipment efficiency data was unavailable, this study used other indicators of efficiency such as the motors used to power electric equipment. Theoretical Minimum Energy The theoretical minimum energy is defined as the minimum energy needed to complete a given process, in absence of any energy losses to heat, noise etc. For example, theoretical minimum energy describes the energy required to haul rock from a mining area to a process area, but excludes the energy lost in the diesel engine powering the truck. Since mining is predominantly a mechanical process, no single value for the current or theoretical minimum energy requirement for mining can be derived, even within a single mineral group, since the depth at which the material is mined and the type of refining required varies widely. Every commodity that is mined has different mechanical and physical properties. Therefore, different mines will have drastically varying energy requirements for a given process, and it is difficult to pinpoint the theoretical minimum energy necessary for such operations. At best, average values for energy consumption may be approximated by evaluating the average performance of mining equipment. Theoretical minimum energy was calculated using current energy consumption and published estimates of equipment efficiency. Equipment efficiency can be expressed as:
Efficiency = Theoretical Minimum Energy Energy Consumption
The theoretical minimum energy for completing a process could thus be calculated as follows: Theoretical Minimum Energy = Energy Consumption * Efficiency The calculations used direct equipment efficiency foremost, but in cases where these data were unavailable, indirect equipment efficiency was used as the next best alternative. For example, in the case of conveyer belts for materials transport, the efficiency of the motor powering the conveyer was used. In another case, centrifuge minimum energy consumption was not based on efficiency values but rather on a theoretical calculation for the kinetic energy of a solid-liquid slurry. Practical Minimum Energy The practical minimum energy is considered to be the closest approach to the theoretical limit allowed by implementing current best practices and technologies developed by ongoing R&D.
16

Practical minimum energy values are however a moving target. Science and technology continuously improve energy efficiency and waste recovery. New technologies will be developed that will change what is now perceived as the practical minimum. In some cases, the practical minimum energy for a process was determined from published estimates of future attainable efficiencies for equipment. In other cases where no published practical minimum target could be found, this study assumes that practical minimum energy is two-thirds of the way between best practical energy requirement and theoretical minimum energy requirements.
“2/3 approximation” for Estimating Practical Minimum Energy Consumption
Practical Min = Best Practice - (Best Practice - Theoretical Min)* 2/3 Practical minimum energy calculations for equipment using motors, pumps, and diesel engines were all based on published estimates of practical efficiency limits. Had the practical minimum energy consumption for diesel engines, motors and pumps been calculated using the 2/3 rule, the error would range from 0.02 to 14%, as shown in Exhibit 13. For pumps, motors, and diesel engines, the 2/3 approximation provides a good approximation of practical minimum energy consumption, though slightly overestimating in each case (this would lead to underestimating potential energy savings). While these results do not prove that the practical minimum energy consumption can be calculated using the 2/3 rule for all equipment types, it does demonstrate that the 2/3 rule can provide a useful approximation in some cases, when published values are unavailable. This rule was used in calculating onsite practical minimum energy, which is later adjusted for generation and distribution losses (see section 4.3).
Exhibit 13. Error Associated with "2/3 approximation" for Materials Handling Equipment used in Mineral Mining
Equipment
Practical Minimum Energy Requirement (Btu/ton), based on current energy consumption and published estimates of practical
efficiency limits
Practical Minimum Energy Requirement (Btu/ton), calculated using the "2/3 rule"
% Error
Diesel Equipment 4515 5162 14%Conveyor (Motor) 11 11 ~2%Pumps 221 221 ~0.02%
4.3 Factoring in Electricity Generation Losses in the Analysis Much of the equipment included in this analysis relies on electricity. Since electricity generation and distribution is associated with substantial energy losses, it is important to utilize the tacit energy consumption values, i.e., the energy used onsite plus the energy lost in generating and distributing that energy, instead of only onsite consumption. According to data reported by the Energy Information Administration (EIA, 2006), 2.17 Btu are lost in transmission and distribution for every 1 Btu delivered to the industrial sector.16 In other words, consuming 1 Btu 16 EIA AEO 2006, Table 2
17

of electricity onsite requires a total electricity consumption of 3.17 Btu. Conversely, saving 1 Btu onsite translates to saving 3.17 Btu. Therefore, tacit energy was included in this study in order to quantify energy saving potential more accurately. The current and best practice energy consumption of electrical equipment was, therefore, multiplied by a factor of 3.17 to estimate the total energy consumption. However, total energy consumption was calculated differently for practical minimum and theoretical minimum energy consumption estimates. Since the practical minimum energy consumption would hypothetically be obtained in the future, EIA predictions for 2020 are used to determine electricity losses. EIA predicts that in 2020, the ratio of offsite to onsite electricity consumption will be 3.05—the value used in this analysis to calculate the tacit practical minimum energy. Further, the definition of theoretical minimum energy consumption requires that all processes involve zero energy losses. Therefore, theoretical minimum energy estimates assume zero electricity losses.
4.4 Estimating Annual Energy Consumption and Energy-Savings Opportunity In order to benchmark energy savings opportunities in the mining industry, energy consumption estimates (Btu/ton) were converted to yearly energy consumption estimates (TBtu/yr). Estimates of current, best practice, practical minimum, and theoretical minimum energy (Btu/ton) were multiplied by the tons of material mined in the U.S. for each commodity to calculate potential annual energy savings (see Exhibit 14).
Exhibit 14. Current Energy Consumption by Commodity Group Million
Tons Recovered
Average Recovery
Ratio*
Million Tons Of Material Mined
Btu/Ton of Material Mined
TBtu/yr Consumed by
the Mining Industry
Coal 1,073 82% 1,309 370,628 485.3
Metals 72.6 4.5% 1,613 342,200
552.1
Industrial Minerals
3,200 90% 3,556 58,757
208.9
Total/Average 4,345.6 6,477 192,373 1,246 Similar methods were used for determining best practice, practical minimum, and theoretical minimum energy consumption (TBtu/yr) * Refer to Exhibit 5.
18

5. Uncertainties and Data Quality
A major challenge in analyzing the mining industry’s energy consumption is the variability in mining operations. Even within a single mineral group, processes will differ according to the depth at which the material is mined and the degree of refining required. Moreover, every commodity that is mined has different mechanical and physical properties. These properties can vary over an order of magnitude between deposits and can vary significantly even within individual mines. For example, the work indices (a measure of energy required to grind rock) of mined commodities vary from 1.43 kWh/ton for calcined clay to 134.5 kWh/ton for mica.17 This results in large variations in grinding equipment energy requirements. Therefore, different mines will have drastically different energy requirements for a given process. A mine could be designed for maximum efficiency, yet consume more energy than an inefficient mine with the same output. The large variation in mine’s energy consumption is evidenced by two recent Canadian studies benchmarking the energy consumption of 10 underground mines and 7 open pit mines. The average energy requirement of the underground mines was 25,000 Btu/ton, with a standard deviation of 11,000 Btu/ton, while the average energy requirement of the open pit mines was 1,000 Btu/ton with a standard deviation of 700 Btu/ton (CIPEC, 2005). The variation in these mines’ energy consumption can arise from a number of factors, including mining method, equipment selection, geology, economies of scale, ore composition, and customer requirements. It is also important to keep in mind the small sample size used in this bandwidth study. This report is based on the E&E Profile, which studies eight commodities selected by the Department of Energy and the National Mining Association for analysis. Further, the energy estimates for each commodity are limited by the number of mining methods analyzed for that commodity. Given the small sample size, there are obviously uncertainties associated with extrapolating energy requirements across the mining industry. Nevertheless, the eight commodities analyzed account for over 78% of energy consumption in U.S. mining, representing the majority of the energy-saving opportunity. Moreover, many of the commodities analyzed can be representative of other commodities (e.g., copper of molybdenum and gold of platinum). Despite the uncertainties involved in estimating the entire mining industry’s energy consumption, this study’s estimates correspond well with other estimates of mining energy consumption. According to the EIA Annual Energy Outlook 2006, the mining industry (including oil and natural gas) consumes approximately 2,500 TBtu/yr,18 or approximately 3,000 TBtu/yr including electricity losses. The EIA data include oil and natural gas mining along with other mining activities in its published values for mining industry energy consumption. This report estimates that the coal, metal, and mineral mining industries alone consume 1,246 TBtu/y, or about 1/3 of total mining energy consumption (including oil and natural gas).
17 SME Mineral Processing Handbook. Table 10. Average Work Indexes. 1985. 18 Annual Energy Outlook 2006 Supplemental Tables: Table 32
19

20
6. Conclusion
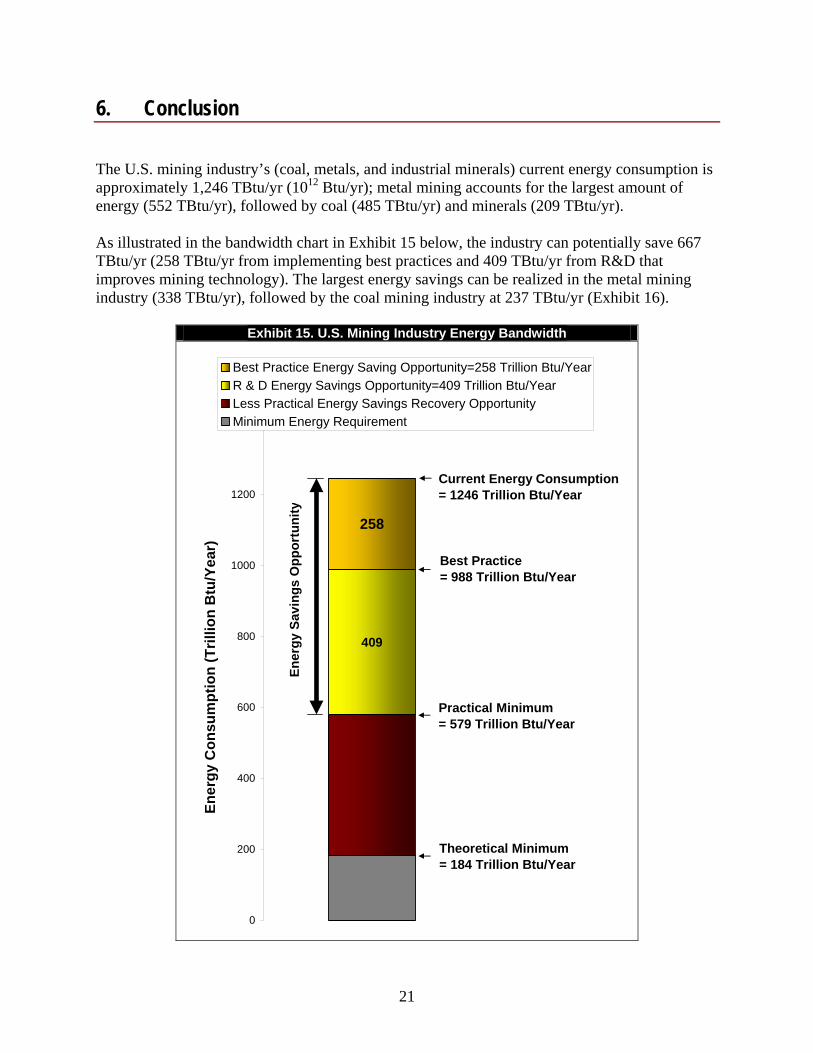
The U.S. mining industry’s (coal, metals, and industrial minerals) current energy consumption is approximately 1,246 TBtu/yr (1012 Btu/yr); metal mining accounts for the largest amount of energy (552 TBtu/yr), followed by coal (485 TBtu/yr) and minerals (209 TBtu/yr). As illustrated in the bandwidth chart in Exhibit 15 below, the industry can potentially save 667 TBtu/yr (258 TBtu/yr from implementing best practices and 409 TBtu/yr from R&D that improves mining technology). The largest energy savings can be realized in the metal mining industry (338 TBtu/yr), followed by the coal mining industry at 237 TBtu/yr (Exhibit 16).
Exhibit 15. U.S. Mining Industry Energy Bandwidth
409
258
0
200
400
600
800
1000
1200
1400
Ener
gy C
onsu
mpt
ion
(Tril
lion
Btu
/Yea
r)
Best Practice Energy Saving Opportunity=258 Trillion Btu/YearR & D Energy Savings Opportunity=409 Trillion Btu/YearLess Practical Energy Savings Recovery OpportunityMinimum Energy Requirement
Current Energy Consumption= 1246 Trillion Btu/Year
Theoretical Minimum= 184 Trillion Btu/Year
Best Practice= 988 Trillion Btu/Year
Practical Minimum= 579 Trillion Btu/Year
Ene
rgy
Savi
ngs
Opp
ortu
nity
21

Exhibit 17 describes the current energy use by equipment category in the U.S. mining industry. The largest energy consuming equipment types are grinding (40%) and materials handling (17%). Exhibit 18 below displays the estimated current, best practice, practical minimum, and theoretical minimum energy consumption for each equipment type. It is noteworthy that the energy consumption associated with grinding far outweighs the energy consumption of other operations. Grinding currently consumes about 494 TBtu/yr, while materials handling diesel equipment is the next largest energy consumer, using only 211 TBtu/yr, or less than half of the energy required for grinding. The
Exhibit 16. U.S. Mining Industry Energy Bandwidth for Coal, Metal, and Mineral Mining
153 221
35
84
117
57
0
100
200
300
400
500
600
Coal Metals MineralsIndustry
Ener
gy C
onsu
mpt
ion
(Tril
lion
Btu
/Yea
r)
Best Practice Energy SavingsOpportunity (TBtu/Year)R & D Energy Savings Opportunity(TBtu/Year)Less Practical Energy SavingsOpportunity (TBtu/Year)Minimum Energy Requirement(TBtu/Year)
Ene
rgy
Savi
ngs
Opp
ortu
nity
Ene
rgy
Savi
ngs
Opp
ortu
nity
Ene
rgy
Savi
ngs
Opp
ortu
nity
Exhibit 17. Contribution of Current Energy Use by Equipment across the Mining Industry (Values account for electricity losses)
5%2%
6%
10%
2%
17%
4%4%
40%
4%
6%
Drilling Blasting DiggingVentilation Dewatering Materials Handling-DieselMaterials Handling-Electric Eq Crushing GrindingSeparations Ancillary Operations
Grinding
Materials Handling-Diesel Eq
Ventilation
22

third largest energy consumingenergy consumption for individuAppendix B, while perceconsumption can be found in
equipment ent al industries – c n
nt contribution of each nergy Appendix C.
Note: Values assume that production rates remain constant and are based on coal, metals, and minerals mining data. The top two energy-consuming processes, grinding and materials handling (diesel equipment), offer tremendous opportunities for energy savings, as shown in Exhibit 19. If the energy consumption of grinding and materials handling diesel equipment alone could be reduced to their practical minimum, then the mining industry would save approximately 467 TBtu/yr, or about 70% of the 667 TBtu/yr energy savings achievable if all processes were reduced to their practical
is ventilation, requiring only 122 TBtu/yr. Equipmoal, metals and minerals – is provided iequipment type to the industry’s total e
Exhibit 18. Energy Consumption and Saving Potential by Equipment Type (TBtu/Yr)
0
200
400
rgy
Con
sum
ptio
n (T
rillio
n B
tu/Y
ear)
600
800
1000
1200
1400
Ene
Blasting 24 18 10 5
Dewatering 28 25 23 7
Separations 46 8 7 2
Electric Equipment 48 43 40 13
Crushing 52 32 27 8
Drilling 67 54 32 9
Ancillary Operations 75 75 72 24
Digging 79 60 35 22
Ventilation 122 111 94 29
Materials Handling-Diesel 211 141 101 63
Grinding 494 420 138 2
Current Best Practice
Practical Minimum
Theoretical Minimum
23

minim and coal m
um energy consumption. The majority of savings potential is offered by the metalsining industries.
Exhibit 19. Energy Saving Opportunity in U.S. Mining Industry for Top 10 Energy-Intensive Processes (includes energy savings from implementing best practices and R&D)
0 50 100 150 200 250 300 350 400
Energy Savings Opportunity (Trillion Btu/Year)
separations
grinding
crushing
electric
diesel
ventilation
dewatering
drilling
digging
blasting
CoalMineralsMetals
Extraction
Materials Transport/Handling
Beneficiation & Processing
Key Findings of Bandwidth Analysis
• Implementation of best practices in coal, metal and mineral mines could save 258 TBtu/yr.
• Continued R&D developing more energy-efficient technologies could save an additional
A combined energy savings from best practice investments and further R&D could allow 409 TBtu/yr.
• for total savings of 667 TBtu/yr or 54% of the total energy consumption of the mining industry.
• CO2 emission reduction achievable from total practical energy savings is estimated to be 40.6 million tonnes.
• The largest energy savings opportunity (70%) lies in improving the energy efficiency of the two most energy-consuming processes – grinding and materials handling, particularly in the metal and coal mining industries.
24

References
AOG (2005): "AOG to focus on throughput in 2005". AOG (Advanced Optimization Group) Newsletter, Volume 4, Issue 1. 2005. Basu (2004): “Design Innovations for Energy Efficiency in Underground Mine Ventilation.” Presented at the 13th Intl. Mine Planning and Equipment Selection Symposium 1-3 Sep, 2004. Wroclaw, Poland. CIPEC (2005): “Benchmarking the Energy Consumption of Canadian Underground Bulk Mines.” Canadian Industry Program for Energy Conservation. Natural Resources Canada, 2005. CIPEC (2005): “Benchmarking the Energy Consumption of Canadian Open-Pit Mines.” Canadian Industry Program for Energy Conservation. Natural Resources Canada, 2005. EIA (2006): “Annual Energy Outlook 2006 with Projections to 2030,” Table 2. U.S. DOE Energy Information Administration. February 2006 Eloranta (1997): “Efficiency of Blasting vs. Crushing & Grinding,” Proceedings of the twenty-third conference of Explosives and Blasting Technique, Las Vegas, Nevada, February 2-6, 1997.
ternational Society of Explosives Engineers, Cleveland, Ohio
ean Guide to Pump Efficiency for Single Stage
Gre wSimulation Software.” DOE Propos Nord unInternational Journal of Rock Mechanics, U.S. DOE (2002): Energy and EnvironmDep tm U.S. DOof FreedomCar & Vehicle Technologies. August 2003.
Motor.” U.S. Department of Energy, EERE, Industrial Technologies Program. September 1996.
In European Commission (2003): “Europ
entrifugal Pumps.” May, 2003. Chttp://energyefficiency.jrc.cec.eu.int/motorchallenge/pdf/EU_pumpguide_final.pdf
en ade and Rajamani (1999): “Development of a 3-Dimensional Version of the Millsoft al.
l d (1989): “The Effect of Thrust on the Performance of Percussive Rock Drills,” Mining Sciences, & Geomechanics Abstracts.
ental Profile for the U.S. Mining Industry, 2002. U.S. ar ent of Energy. Prepared by BCS, Incorporated.
E (2003): “Just the Basics, Diesel Engine.” U.S. Department of Energy, EERE, Office
U.S. DOE (1996): “Buying an Energy Efficient
25

26

Appendix A: Current Energy Consumption and Savings Potential by Equipment Category in Coal, Metal, and Mineral Mining
Note: Values are reported in TBtu/yr, assuming that mining production rates remain constant. Electricity losses are included.
Exhibit 20. Energy Consumption by Equipment Category
in Coal Mining Industry (TBtu/yr)
0.0
50.0
100.0
150.0
200.0
250.0
300.0
350.0
400.0
450.0
500.0
Ener
gy R
equi
rem
ent
(Tril
lion
Btu
/Yea
r)
Blasting 6.7 5.0 2.7 1.5
Ancillary Operations 6.9 6.9 6.7 2.2
Separations 8.8 4.2 3.3 0.9
Crushing 14.6 9.1 7.6 2.3
Drilling 27.7 22.1 15.6 5.4
Digging 26.4 21.3 17.6 7.3
Materials Handling ElectricEquipment
45.3 40.4 37.7 12.1
Materials Handling DieselEquipment
56.7 37.8 27.0 17.0
Ventilation 97.3 88.5 75.3 23.0
Grinding 194.8 165.6 54.4 0.6
Current Best Practice Practical Minimum
Theoretical Minimum
27

Exhibit 21. Energy Consumption by Equipment Category in Metal Mining Industry
(TBtu/yr)
0.0
100.0
200.0
300.0
400.0
500.0
600.0En
ergy
Req
uire
men
t (T
rillio
n B
tu/Y
ear)
Dewatering 3.1 2.8 2.6 0.7
Drilling 3.7 3.0 2.1 1.3
Crushing 9.6 6.0 5.0 1.5
Blasting 16.0 12.3 6.6 3.7
Digging 22.1 18.6 2.9 6.0
Separations 22.2 3.6 3.2 0.9
Ventilation 24.3 22.1 18.8 5.7
Ancillary Operations 33.8 33.8 32.5 10.6
Diesel Equipment 120.9 80.6 57.6 36.3
Grinding 296.3 251.9 82.7 0.9
Current Best Practice Practical Minimum
Theoretical Minimum
28

E (TBtu/yr) xhibit 22. Energy Consumption by Equipment Category in Mineral Mining Industry
0.0
20.0
40.0
60.0
80.0
100.0
120.0
140.0
160.0
180.0
200.0
Ener
gy R
equi
rem
ent
(Tril
lion
Btu
/Yea
r)
Blasting 1.3 1.0 0.5 0.3
Electric Equipment 3.1 2.8 2.5 0.7
Grinding 3.2 2.7 0.9 0.0
Separations 14.9 0.6 0.5 0.1
Dewatering 24.6 22.2 20.2 5.8
Digging 30.1 20.1 14.3 9.0
Diesel Equipment 33.7 22.5 16.1 10.1
Ancillary Operations 34.5 34.5 33.3 10.9
Drilling 35.8 28.6 14.3 2.2
Current Best Practice Practical Minimum
Theoretical Minimum
29

30

31
Appendix B: Energy Requirements and Efficiencies of Equipment Types in Coal, Metals and Minerals Mining
Exhibits 23, 24, and 25 below display the calculated energy requirements of coal, metals, and minerals mining. Values include only onsite energy consumption and neglect electricity losses. See Appendix D for assumptions used. Exhibit 26 provides energy data by equipment based on tacit electricity consumption, or inclusive of electricity losses.
Exhibit 23. Energy Requirements and Efficiencies of Equipment Types in Coal Mining in Btu/yr (neglecting electricity losses)
Mining Area Equipment
Current Energy Requirements
(Btu/ton)
Current Practice
Efficiency
Best Practice
Efficiency
Best Practice Energy
Requirement (Btu/ton)
Maximum Attainable Efficiency
Practical Minimum
Energy Requirement
(Btu/ton)
Theoretical Minimum
Energy Requirement
(Btu/ton) Extraction Drilling 8,800 47% 59% 7,000 81% 5,100 4,200 Blasting 5,100 23% 30% 3,800 56% 2,000 1,100 Digging 10,500 53% 66% 8,500 78% 7,200 5,600 Ventilation 23,400 75% 82% 21,300 93% 18,800 17,600 Dewatering NA
Diesel Equipment 43,300 30% 45% 28,900 63% 20,600 13,000 Materials Handling Electric Equipment 10,900 9,700 0% 9400 9,300 Conveyor (motor) 500 85% 95% 400 98% 400 400 Load Haul Dump 10,400 85% 95% 9,300 98% 9000 8,900 pumps
Crushing and Grinding 50,400 42,100 15,500 2,200 Beneficiation
and Processing Crushing 3,500 50% 80% 2,200 92% 1,900 1,800 Grinding 46,900 1% 39,900 13,600 500 Separations 2,100 1,000 800 700 Centrifuge 1800 27% 41% 700 86% 600 500 Flotation 400 64% 79% 300 86% 300 200
Subtotal 154,600 122,300 79,500 55,900 Ancillary Operations 1,700 1,700 1,700 1,700
Total 156,200 124,000 81,200 57,600

32
Exhibit 24. Energy Requirements and Efficiencies of Equipment Types in Metal Mining in Btu/yr (neglecting electricity losses)
Mining Area Equipment
Current Energy Requirements
(Btu/ton)
Current Practice % Efficiency
Best Practice
Best Practice Energy
Requirement Max
Practical Practical Minimum
Minimum Energy
RequiremeEfficiency (Btu/ton) Efficiency (Btu/ton)
Theoretical
nt (Btu/ton)
Extractio 800 n Drilling 1,800 45% 57% 1,500 80% 1,000 2,300 Blasting 9,900 23% 30% 7,600 56% 4,100 Digging 6,000 63% 75% 5,000 84% 4,500 3,700 Ventilation 4,700 75% 82% 93% 0 4,300 3,800 3,60 Dewatering (pumps) 0 60 75% 83% 600 88% 500 500
Diesel Equipment 3 45 50,0 63 35,7 2 74,900 0% % 00 % 00 2,500Materials Handling Equipment Electric NA motor 8 95 98 NA 5% % % load haul dump NA pumps 75 83 88 NA % % %
Ban
eneficiation d Processing
CG 50,4 17,8
rushing and rinding 59,800 00 00 1,500
Crushing 0 50 % 1,200 92 1,00 0 1,90 % 80 % 0 90 rinding 57,900 1% 1% 49,200 3% 16,800 600 G Separations 4,300 700 600 600 Centrifuge NA
Flotation 64 % 86% 900 % 79 700 600 600
Subtotal 16 120,0 68,04 35 2,148 17 3 ,445Ancilla ns 6,59 6,59 6 ry Operatio 6,599 9 9 ,599
Total 168,746 126,616 74,642 42,044

33
Exhibit 25. Energy Requirements and Efficiencies of Equipment Types in Mineral Mining in Btu/yr (neglecting electricity losses)
Mining Process Equipment
Current Energy
Requirement (Btu/ton)
C
Efficiency Efficiency
Be
(Btu/ton)
M
Efficiency
P
Re(Btu/t
nt (Btu/ton
urrent Practice
Best Practice
st Practice Energy
Requirement aximum
Attainable
ractical Minimum
Energy quirement
on)
Theoretical Minimum
Energy Requireme
)
Extraction Drilling 5, 0 22% 27% 4, 0 53% 0 0 20 10 2,10 1,10 Blasting 400 23% 30% 0 56% 0 0 30 10 10 Digging 8, 0 30% 45 5, 63 50 % 600 % 4,000 2,500 Ventilation 3 75% 82% 3 93% 3 2 Dewatering 2,200 75% 83% 2,000 88% 1,900 1,600
Diesel Equipment 9, 0 30% 45% 0 63% 0 0 50 6,30 4,50 2,80Materials Handling Electric Equipment 27 % 24 88% 231 205 1 75% 84 5 Conveyor (Mo 1 85% 95% 11 98% 11 11 tor) 2 Loa NA d Haul Dump pumps 259 75% 83% 234 88% 221 194
Beneficiation and Processing
Crushing and Grinding 2, 700 1,780 1,414 1,233
Crushing 50 80% 1,53 92% 1, 1, % 7 332 230
Grinding 30 1% 240 82 3 0 Separations 1,30 10 0 0 Cent rifuge
64 % 87% Flotation 100 % 79 100
Subt 3 2 9, 0 otal 0,000 0,400 14,400 70Ancillary Operations 3,100 3,100 3,100 3,100
Total 33,000 23,500 17,400 12,800

34
Exhibit 26. Current, Best Practice, Practical Minimum, and Theoretical Minimum Energy Consumption (TBtu/yr, including electricity losses)
Coal Metals Minerals
Mining Process Equipment Current
Best Practice
PrMi
Theoretical Minim urrent
Best tice
P eoretical inim rent
PractMinim
tical mum
actical nimum um C Prac
ractical Minimum
ThM um Cur
Best Practice
ical um
TheoreMini
Extractio illing 27.7 22.1 3.7 0 5.8 2.2 n Dr 15.6 5.4 3. 2.1 1.3 3 28.6 14.3 sting 5.0 16. 1.3 0.3 Bla 6.7 2.7 1.5 0 12.3 6.6 3.7 1.0 0.5 ng .4 21.3 . 14 9.0 Diggi 26 17.6 7.3 22 1 18.6 2.9 6.0 30.1 20.1 .3 ation .3 88.5 75. 23 .3 18.8 5.7 0.0 0. 0.0 0.0 Ventil 97 3 .0 24 22.1 0
Dewatering .0 0.0 0. 0. 1 2. 0.7 4.6 22 20.2 5.8 0 0 0 3. 2.8 6 2 .2
Diesel Equipment 37.8 27. 17.0 0.9 57.6 36 .7 22 16.1 0.1 56.7 0 12 80.6 .3 33 .5 1
Materials Handling
Electric pment .4 37 12 0 0. 0. 1 2. 2.5 0.7 Equi 45.3 40 .7 .1 0. 0.0 0 0 3. 8
moto 7 1. 0. 0 0.0 0. 0. 1 0. 0.1 0.0 r 1.9 1. 6 5 0. 0 0 0. 1 LHD 36 11 0 0. 0. 0 0. 0.0 0.0 43.3 38.7 .1 .6 0. 0.0 0 0 0. 0 pumps 0. 0.0 0.0 0.0 0.0 2.9 2.6 2.4 0.7 0.0 0.0 0 0.0
Crushing and Grinding 209.4 174.7 63.9 2.9 305.9 257.9 90.6 2.4 30.9 20.0 15.4 4.4
Beneficiati n and Processin hin 9.1 7.6 2.3 9.6 6.0 5.0 1.5 27.7 17.3 14.5 4.4
o
g Crus g 14.6
8 165.6 56 0.6 29 3 251.9 85 0.9 3.2 2. 0.9 0.0 Grinding 194. .3 6. .6 7 Separations 8.8 4.2 3.3 0.9 22.2 3.6 3.2 0.9 14.9 0.6 0.5 0.1 Centrifuge 7.3 3.0 2.2 0.6 0.0 0.0 0.0 0.0 0.0 0.0 0.0 0.0 Flotation 1.5 1.1 0. 5 3. 0. 7 0. 0.5 0.1 1.2 3 4. 3.6 2 9 0. 6
Subtotal 478. 1 243. 70 3 400.9 184. 57.2 174.4 117. 83.8 .8 3 394. 0 .3 518. 3 8 32
Ancillary Operations 6.9 6. 2.2 33 33.8 32 10.6 34.5 34.5 33.3 10.9 6.9 7 .8 .5
Total 485.3 401.0 249.7 72.5 552.1 434.6 216.8 67.8 208. 9 152.3 117.1 43.6

35
Appendix C: Total Energy Consumption by Mining Stage across Met a alsCoal, als nd Miner Mining (TBtu/yr)
Exhibit 27. Curren e mu it, Th oretical Mini m, Best Practice, and Pract cal Minimum Energy Consumption across Coal, Me n ntal, and Mi eral Mi ing
(TBtu/yr, including electricity losses)
Mining Process Equipment Current Practice
alMinimum
re l Minimum
Best Practic Theo tica
Extraction Drilling 67 54 32 9 Blasting 24 18 10 5 Digging 79 60 35 22 Ventilation 122 111 94 29 Dewaterin 28 g 25 23 7
Diesel Equ ent 211 14 101 ipm 1 63MaterHand
ials ling Electric Equipment 48 43 40 13
mot 2 2 2 1 or LHD 43 39 36 12 pu 3 4mps 2.6 2. 0.7
B&P Crushing and Grindi 546 453 165 10 ng
Crushing 52 32 27 8 Grinding 494 42 1380 2 Sepa 46 8 7 2 rations Centrifuge 7 3 2 1 Flotation 7 5 5 1
Subtotal 1171 913 506 160
An ry Operations 75 75 72 24 cilla
Total 1246 988 579 184

36

Appendix D: Assumptions for U.S. Mining Industry Bandwidth Analysis
Exhibit 28. Assumptions Used in Estimating Theoretical Minimum, Practical Minimum, and Best Practice Energy Consumption Theoretical Minimum Energy
Consumption Practical Minimum Energy Consumption
Best Practice Energy Consumption
Notes The theoretical minimum energy requirement is based on the current efficiency of equipment and current equipment energy consumption. Theor. Energy=Curr. Energy x efficiency Efficiency estimates and sources are listed below.
Practical minimum energy is the energy that would be required after R&D achieves substantial improvements in the energy efficiency of mining technology. Values are derived from researchers' estimates of practical efficiency improvements. In cases where such estimates were unavailable, this study uses a "2/3 rule of thumb" to estimate practical minimum energy. As explained in the text, the practical minimum energy consumption is assumed to be 2/3 of the way between best practice energy requirement and theoretical minimum energy requirements. PM = BP -2/3(BP-TM) where PM = Practical Minimum, BP = Best Practice, and TM = Theoretical Minimum.
Best practice energy consumption was determined from a variety of sources describing mining operations that use significantly less energy compared to typical operations.
Equipment Category
Extraction Drilling Calculations for the theoretical minimum
energy requirement are based on the current energy efficiency of drilling. Nordlund (1989) simulates drill efficiency of the drill bit for various levels of thrust. 0.72 was a midway value for drill efficiency. In this study, 0.72 is used as the current average efficiency of the drill bit but not the drill rig. The drilling efficiency is combined with the efficiency of diesel engines (30%) and electric motors (85%). The distribution of electric and diesel drilling equipment was approximated using the SHERPA model equipment lists. The efficiencies of motors and diesel engines are
2/3 rule (see above) Assumed the best practice mine consumes 80% of the energy of the typical mine. This was based on a study benchmarking the energy consumption of Canadian mines (CIPEC 2005). Mines ranking in the lower quartile for energy consumption consumed 80% of the energy of typical mines.
37

discussed in the "materials handling section below."
Blasting Eloranta (1997) reports a blasting efficiency of 2/3 rule 15% to 30%. An average value of 23% was used for current blasting efficiency.
to be 30%, the upper estimate provided in Eloranta (1997).
Best practice blasting efficiency was assumed
Digging ing onds to the efficiencies of
um efficiency ent corresponds to the
f digging equipment corresponds to the best
d
Assumed that the efficiency of diggequipment correspdiesel engines and electric motors. The distribution of diesel and electric powered equipment was approximated using the SHERPA model equipment lists.
Assumed that the practical minimof digging equipmpractical minimum efficiencies of diesel engines and electric motors.
Assumed that the best practice efficiency o
practice efficiencies of diesel engines anelectric motors.
Ventilation ge
y of 75%
r efficiency and 85% fan efficiency, yielding 82% combined efficiency
Basu (2004) provides an example of a larcomplex underground mining ventilation system using a combined fan and motor efficienc
2/3 rule Basu 2004 provides a best practice example with 97% moto
Dewatering Assumed dewatering efficiency is described by the efficiency of pumps used to remove water from the mine workings.
Assumed best practice dewatering efficiency is described by the efficiency of pumps used to remove water from the mine workings.
Assumed practical minimum dewatering efficiency is described by the efficiency of pumps used to remove water from the mine workings.
Materials Handling Diesel Materials
Handling Equipment U.S. DOE (2003) reports 45% efficiency for diesel equipment. However, conversations with industry experts indicate that 30% is a
re appropriate estimate, due to older ipment in use.
for U.S. DOE (2003) reports 45% efficiency for diesel equipment.
moequ
U.S. DOE (2003) reports further advancesdiesel engines are possible up to 63%
ElectriHandling Eq
c Materials u
ipment
Conveyer (motor) The average efficiency of conveyers was assumed to correspond to the efficiency of typical electric motors. U.S. DOE (1996) reports a variety of efficiencies for electric motors. 85% is a typical value for motor efficiency.
2/3 rule U.S. DOE (1996) reports a variety of efficiencies for electric motors. The most efficient motors are around 95% efficient.
Load Haul Dump y
2/3 rule y for motors (see above).
The average efficiency of Load-Haul-Dumps was assumed to correspond to the efficiencof typical electric motors (85%, see above)
Based on 95% best practice efficienc
Pumps e Hydraulic Institute (2003): Maximum attainable efficiency is approximately 88%.
Hydraulic Institute (2003): highest efficiency pumps currently available operate at about 83% efficiency.
According to the Hydraulic Institute (2003), thcurrent catalogue mean for pump efficiency is 75%.
38

Beneficiation and Processing Crushing cy 2/3 rule Eloranta 1997: Highest estimate of crushing AOG (2005) reports current crushing efficien
of 50%. efficiency at about 80% efficiency Grinding Grinding efficiency estimates vary significantly,
depending on methods used. 1% efficiency was found to be the most common estiSources citing 1% efficiency include AOG (2005), Eloranta (1997), Perry's (1963), Hukk(1975), Willis ((1998), Greenwade and Rajamani (1999).
mate.
i
gy 2/3 rule Greenwade and Rajamani (1999): Recent R &
D improving grinding mills can reduce enerconsumption 15%.
Centrifuge y of a
s erate
0 rpm. Current efficiency values were based on this
2/3 rule Mine and Mill Equipment Costs (2005). Best
Assumes the theoretical minimum energcentrifuge is the amount of energy required tobring a unit mass of coal in a centrifuge to a target rotational speed. If sufficient time iavailable, the centrifuge speed could opat a fairly slow speed. Theoretical minimum energy calculated for a unit mass of coal with 0.7 mass concentration, in a 70 in. diameter centrifuge rotating at 30
calculation of theoretical minimum energy.
practice centrifuge energy consumption basedon lowest energy consuming centrifuges in equipment list.
Flotation Mechanical equipment in flotation machines includes air compressors and rotating impellers. Efficiency is assumed to be the product of electric motor and pump efficiency.
and pump efficiency.
ectric motor and
pump efficiency.
Practical efficiency is assumed to be the product of practical maximum electric motor
Best practice efficiency is assumed to be theproduct of best practice el
39

40

Appendix E: Glossary of Mining Terms
ANFO Ammonium Nitrate Fuel Oil, used as a blasting agent. Beneficiation The dressing or processing of coal or ores for the purpose of (1)
regulating the size of a desired product, (2) removing unwanted constituents, and (3) improving the quality, purity, or assay grade of a desired product.
Blasting Blasting uses explosives to aid in the extraction or removal of
mined material by fracturing rock and ore by the energy released during the blast.
Byproduct A secondary or additional product. Coal A readily combustible rock contain more that 50% by weight and
more than 70% by volume of carbonaceous material, including inherent moisture; formed form compacting and in duration of variously altered plant remains similar to those in peat. Difference in the kinds of plant materials (type), in degree of metamorphism (rank), and in the range of impurity (grade) are characteristic of coal and are used in classification.
Crushing Crushing is the process of reducing the size of run-of- mine material
into coarse particles. Dewatering Dewatering is the process of pumping water from the mine
workings. Digging Digging is to excavate, make a passage into or through, or remove
by taking away material from the earth. The goal of digging is to extract as much valuable material as possible and reduce the amount of unwanted materials.
Drilling Drilling is the act or process of making a cylindrical hole with a tool
for the purpose of exploration, blasting preparation, or tunneling. Electrowinning An electrochemical process in which a metal dissolved within an
electrolyte is plated onto an electrode. Emissions A gaseous waste discharged for a process. Grinding Grinding is the process of reducing the size of material into fine
41
particles. In situ In the natural or original position. Applied to a rock, soil, or fossil
occurring in the situation in which it was originally formed or deposited.
Materials Handling
The art and science involving movement, packaging , and storagesubstances in any form. In this study, the materials handling equipment were categorized as diesel and electric equipment. In general, diesel fuel powers rubber tire or track vehicles that deliver
aterial in batches, while elec
of
tricity powers continuous delivery msystems such as conveyors and slurry lines.
Mill
ting. (b) Revolving drum used in the grinding of (a) A plant in which ore is treated and minerals are recovered or
repared for smelpores in preparation for treatment.
Ore The naturally occurring material from which a mineral or minerals
of economic value can be extracted profitably or to satisfy social opolitical objectives.
r
Overburden Designates material of any nature, consolidated or unconsolidated,
that overlies a deposit of useful materials, ores, oar coal that are mined from the surface.
Reclamation Restoration of mined land to original contour, use, or condition. Refining ude metallic products. The purification of cr Separations The separation of mined material is achieved primarily by physical
eparations rs ather than chemical separations, where valuable substances are separated from undesired substances based on the physical properties of the materials.
Slurry A fine carbonaceous discharge from a mine washery. Surface Mining Mining at or near the surface. This type of mining is generally done
where the overburden can be removed without too much expense. lso called strip mining; placer mining, opencast; opencut mining; A
open-pit mining. Tailings
The gangue and other refuse material resulting from the washing, concentration, or treatment of ground ore.
Underground Mining that takes place underground. This type of mining is
42

Mining one where the valuable material is located deep enough here it is not economically viable to be removed by surface
generally dwmining.
Ventilation s the process of bringing fresh air to the underground
ine workings while removing stale and/or contaminated air from Ventilation imthe mine and also for cooling work areas in deep underground mines.
43