u.s. nursing assistants employed in nursing homes … · 4 u.s. nursing assistants employed in...
TRANSCRIPT

U.S. Nursing Assistants Employed in Nursing Homes: Key Facts 1
U.S. NURSING ASSISTANTS EMPLOYED IN NURSING HOMES: KEY FACTS

U.S. Nursing Assistants Employed in Nursing Homes: Key Facts2
More than 600,000 nursing assistants provide personal care, assistance with daily activities, and clinical support to 1.4 million nursing home residents nationwide.1 Despite a general trend toward providing care in home and community-based settings, nursing homes continue to play an integral role in the long-term services and supports system, providing 24-hour support to people who cannot live comfortably or safely at home.
For nursing assistants, the work is often challenging while offering few material rewards. Due in part to the repeated lifting and carrying required to assist residents, these workers are injured 3.4 times more frequently than the typical American worker.2 Additionally, wages are low and part-time work is common. Nursing assistants earn a median hourly wage of $12.34 and a median annual income of $20,000.3
The poor quality of nursing assistant jobs makes it difficult for nursing homes to attract and retain enough workers to meet demand. Changing demographics could exacerbate these staffing challenges. Nursing homes are expected to create an estimated 59,000 new nursing assistant jobs from 2014 to 2024.4 In coming years, the rapidly growing population of older adults will drive demand even higher: by 2050, the population of adults aged 65 and over, who constitute 85 percent of the nursing home resident population, is projected to double from 47.8 million (in 2015) to 88 million.5
Chart Source: U.S. Census Bureau. 2016. American Community Survey (ACS), 2015 1-year Public Use Microdata Sample (PUMS). https://www.census.gov/programs-surveys/acs/data/pums.html; analysis by Carlos Figueiredo and PHI (May 1, 2017).
NURSING ASSISTANTS
EMPLOYED IN NURSING HOMES
BY AGE, 2015
16-24 25-34 35-44 45-54 55-64 65+
22%
3%
25%
19%18%
13%
▪ Female 91%
▪ Male 9%
NURSING ASSISTANTS
EMPLOYED IN NURSING HOMES
BY GENDER, 2015
NURSING ASSISTANTS BY
▪ Female 91%
▪ Male 9%
NURSING ASSISTANTS
EMPLOYED IN NURSING HOMES
BY GENDER, 2015
NURSING ASSISTANTS
EMPLOYED IN NURSING HOMES
BY AGE, 2015
16-24 25-34 35-44 45-54 55-64 65+
22%
3%
25%
19%18%
13%
U.S. Nursing Assistants Employed in Nursing Homes: Key Facts 3
Chart Sources: U.S. Census Bureau. 2016. American Community Survey (ACS), 2015 1-year Public Use Microdata Sample (PUMS). https://www.census.gov/programs-surveys/acs/data/pums.html; analysis by Carlos Figueiredo and PHI (May 1, 2017). White and Black or African American do not include people who identify as Hispanic or Latino.
WHO ARE NURSING ASSISTANTS?
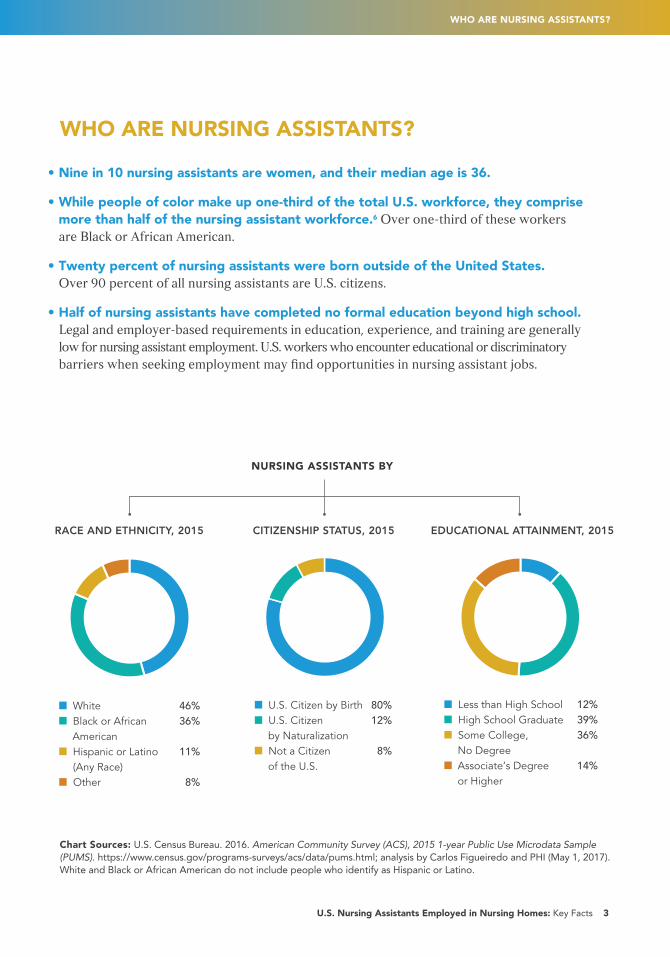
• Nine in 10 nursing assistants are women, and their median age is 36.
• While people of color make up one-third of the total U.S. workforce, they comprise more than half of the nursing assistant workforce.6 Over one-third of these workers are Black or African American.
• Twenty percent of nursing assistants were born outside of the United States. Over 90 percent of all nursing assistants are U.S. citizens.
• Half of nursing assistants have completed no formal education beyond high school. Legal and employer-based requirements in education, experience, and training are generally
low for nursing assistant employment. U.S. workers who encounter educational or discriminatory barriers when seeking employment may find opportunities in nursing assistant jobs.
RACE AND ETHNICITY, 2015 CITIZENSHIP STATUS, 2015 EDUCATIONAL ATTAINMENT, 2015
WHO ARE NURSING ASSISTANTS?
▪ White 46%
▪ Black or African 36% American
▪ Hispanic or Latino 11% (Any Race)
▪ Other 8%
NURSING ASSISTANTS
EMPLOYED IN NURSING HOMES
BY RACE AND ETHNICITY, 2015
▪ U.S. Citizen by Birth 80%
▪ U.S. Citizen 12% by Naturalization
▪ Not a Citizen 8% of the U.S.
NURSING ASSISTANTS
EMPLOYED IN NURSING HOMES
BY CITIZENSHIP STATUS, 2015
▪ Less than High School 12%
▪ High School Graduate 39%
▪ Some College, 36% No Degree
▪ Associate’s Degree 14% or Higher
NURSING ASSISTANTS
EMPLOYED IN NURSING HOMES
BY EDUCATIONAL ATTAINMENT, 2015
NURSING ASSISTANTS BY

U.S. Nursing Assistants Employed in Nursing Homes: Key Facts4
WHAT IS A NURSING ASSISTANT?
Nursing homes are facilities where residents receive nursing care and 24-hour personal assistance. There are 1.4 million residents living in approximately 18,000 nursing homes in the United States.7 The number of nursing home residents has been relatively constant over the last decade.
Compared to long-term care consumers in other settings, nursing home residents require more intensive assistance with daily tasks such as dressing, bathing, eating, and mobility.8 Nursing assistants provide most of this assistance. They also help residents participate in a range of social activities such as classes, guest performances, or religious services. Additionally, nursing assistants perform certain clinical tasks under the supervision of licensed professionals. (See Notes on Occupational Titles and Industry Classifications, page 9, for more details.)
• Nursing assistants comprise over one-third of the nursing home workforce, outnumbering every other occupational group. The number of nursing assistants—603,000—has remained constant over the past 10 years.
Table Source: U.S. Bureau of Labor Statistics (BLS), Division of Occupational Employment Statistics. 2016. May 2016 National Industry-Specific Occupational Employment and Wage Estimates. https://www.bls.gov/oes/current/oessrci.htm; analysis by PHI (April 28, 2017). “All Other Workers” comprises a range of occupations including Building and Grounds Cleaning and Maintenance occupations and Arts, Design, Entertainment, Sports, and Media occupations.
WHAT IS A NURSING ASSISTANT?
Occupation
Employment
% of Industry EE mployment
Nursing Assistants 602,630 37%
Licensed Practical/Vocational Nurses 211,940 13%
Registered Nurses 157,530 10%
Other Health Care and Personal Support Occupations 203,400 12%
Food Preparation and Serving Related Occupations 160,200 10%
Business, Administrative, and Social Services Staff 160,790 10%
All Other Workers 144,550 9%
NURSING HOME EMPLOYMENT BY OCCUPATION, 2016

U.S. Nursing Assistants Employed in Nursing Homes: Key Facts 5
• Nursing assistants constitute 13 percent of the total direct care workforce, which also includes workers who are employed in home care and a range of other settings.9 The total number of direct care workers across all industries tracked by the Bureau of Labor Statistics, in addition to PHI’s estimates of independent providers, is 4.5 million workers.
• Among all nursing staff, nursing assistants spend the most time assisting residents, providing a median of 2.4 hours of hands-on care per resident per day. Their frequent interactions with residents enable them to observe changes in resident condition and report these changes to licensed nursing staff.
• Nursing assistant jobs are primarily government-funded. Payments from public programs (primarily Medicare and Medicaid) constituted 72 percent of the industry’s $118 billion in annual revenue in 2015.
Chart Sources: U.S. Centers for Medicare and Medicaid Services (CMS). 2017. Nursing Home Compare Datasets: Staffing. https://data.medicare.gov/data/nursing-home-compare; analysis by PHI (July 21, 2017). Staffing data reflects Medicare- and Medicaid-certified nursing homes.
U.S. Census Bureau. 2016. Service Annual Survey, Table 4: Estimated Sources of Revenue for Employer Firms: 2010 through 2015. https://www.census.gov/services/index.html; analysis by PHI (May 9, 2017).
WHAT IS A NURSING ASSISTANT?
▪ Public Programs 72%
▪ Private Insurance 10%
▪ Out-of-pocket 12%
▪ Other 5%
NURSING HOMES REVENUE
BY SOURCE, 2015
0.70.8
2.4
MEDIAN STAFF HOURS
PER RESIDENT PER DAY
BY OCCUPATION, 2017
▪ Nursing Assistants
▪ Licensed Practical / Vocational Nurses
▪ Registered Nurses

U.S. Nursing Assistants Employed in Nursing Homes: Key Facts6
• Nursing assistants are more than three times more likely to be injured on the job than the typical U.S. worker.
• Wages for nursing assistants have barely kept up with inflation over the past 10 years: inflation-adjusted wages were $12.34 in 2016, compared to $12.35 in 2006. This means that while goods and services increased in price, the purchasing power of nursing assistant wages was static.
• More than half of nursing assistants work part time or for part of the year.
• Because of low wages and part-time work hours, nursing assistants in this industry earn a median income of $20,000 per year.10
Chart Sources: U.S. Bureau of Labor Statistics (BLS), Injuries, Illnesses, and Fatalities (IIF) Program. 2016. Nonfatal Cases Involving Days Away from Work: Selected Characteristics. https://data.bls.gov/cgi-bin/dsrv?cs; analysis by PHI (April 28, 2017).
U.S. Bureau of Labor Statistics (BLS), Division of Occupational Employment Statistics. 2016. May 2006 to May 2016 National Industry-Specific Occupational Employment and Wage Estimates. https://www.bls.gov/oes/current/oessrci.htm; analysis by PHI (April 28, 2017).
U.S. Census Bureau. 2016. American Community Survey (ACS), 2015 1-year Public Use Microdata Sample (PUMS). https://www.census.gov/programs-surveys/acs/data/pums.html; analysis by Carlos Figueiredo and PHI (May 1, 2017).
WHAT ARE THE CHALLENGES
FOR THIS WORKFORCE?
WHAT ARE THE CHALLENGES FOR THIS WORKFORCE?
▪ Nursing Assistants – Total 348.5
▪ All Occupations – Total 104.0
ANNUAL INJURY RATES
PER 10,000 WORKERS, 2015
38.017.3
187.1
109.8
Sprains strains,
tears
Back Injuries
32.2
180.5
Musculo-skeletal
disorders
NURSING ASSISTANT
MEDIAN HOURLY WAGES
ADJUSTED FOR INFLATION,
2006 TO 2016
2006 ’08 ’10 ’12 ’14 ’16
$12.34
$12.35
NURSING ASSISTANT
MEDIAN HOURLY WAGES
ADJUSTED FOR INFLATION,
2006 TO 2016
2006 ’08 ’10 ’12 ’14 ’16
$12.34
$12.35
NURSING ASSISTANTS
BY EMPLOYMENT STATUS, 2015
▪ Part time or part year 53%
▪ Full time, full year 47%
NURSING ASSISTANTS
BY EMPLOYMENT STATUS, 2015
▪ Part time or part year 53%
▪ Full time, full year 47%
NURSING ASSISTANTS
BY EMPLOYMENT STATUS, 2015
▪ Part time or part year 53%
▪ Full time, full year 47%
U.S. Nursing Assistants Employed in Nursing Homes: Key Facts 7
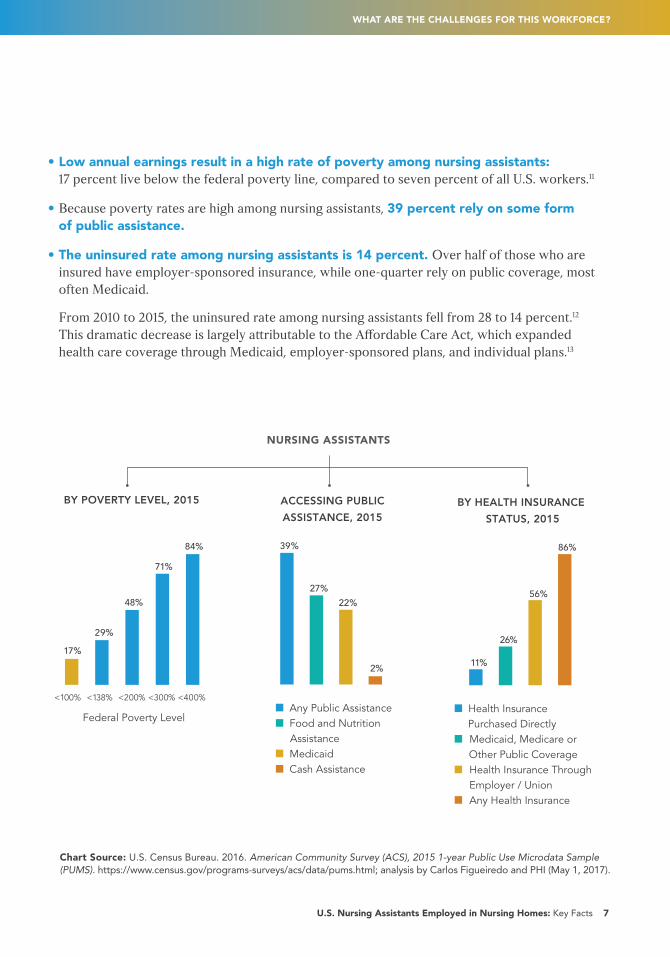
• Low annual earnings result in a high rate of poverty among nursing assistants: 17 percent live below the federal poverty line, compared to seven percent of all U.S. workers.11
• Because poverty rates are high among nursing assistants, 39 percent rely on some form of public assistance.
• The uninsured rate among nursing assistants is 14 percent. Over half of those who are insured have employer-sponsored insurance, while one-quarter rely on public coverage, most often Medicaid. From 2010 to 2015, the uninsured rate among nursing assistants fell from 28 to 14 percent.12 This dramatic decrease is largely attributable to the Affordable Care Act, which expanded health care coverage through Medicaid, employer-sponsored plans, and individual plans.13
Chart Source: U.S. Census Bureau. 2016. American Community Survey (ACS), 2015 1-year Public Use Microdata Sample (PUMS). https://www.census.gov/programs-surveys/acs/data/pums.html; analysis by Carlos Figueiredo and PHI (May 1, 2017).
WHAT ARE THE CHALLENGES FOR THIS WORKFORCE?
2%
22%
27%
39%
NURSING ASSISTANTS
ACCESSING PUBLIC
ASSISTANCE, 2015
▪ Any Public Assistance
▪ Food and Nutrition Assistance
▪ Medicaid
▪ Cash Assistance
17%
29%
48%
71%
84%
NURSING ASSISTANTS
BY POVERTY LEVEL, 2015
<100% <138% <200% <300% <400%
Federal Poverty Level
17%
29%
48%
71%
84%
NURSING ASSISTANTS
BY POVERTY LEVEL, 2015
<100% <138% <200% <300% <400%
Federal Poverty Level
11%
26%
56%
86%
NURSING ASSISTANTS
BY HEALTH INSURANCE
STATUS, 2015
▪ Health Insurance Purchased Directly
▪ Medicaid, Medicare or Other Public Coverage
▪ Health Insurance Through Employer / Union
▪ Any Health Insurance
NURSING ASSISTANTS
U.S. Nursing Assistants Employed in Nursing Homes: Key Facts8
Chart Sources: U.S. Bureau of Labor Statistics (BLS), Employment Projections Program. 2015. Employment Projections: 2014–24, National Employment Matrix - Occupation. https://www.bls.gov/emp/; analysis by PHI (April 28, 2017).
U.S. Census Bureau. 2014. National Population Projections Tables, Table 3. Projections of the Population by Sex and Selected Age Groups for the United States: 2015 to 2060. https://www.census.gov/data/tables/2014/demo/popproj/2014-summary-tables.html. Projections are shown as cumulative percentages, which indicate growth for each age group relative to 2015 population estimates.
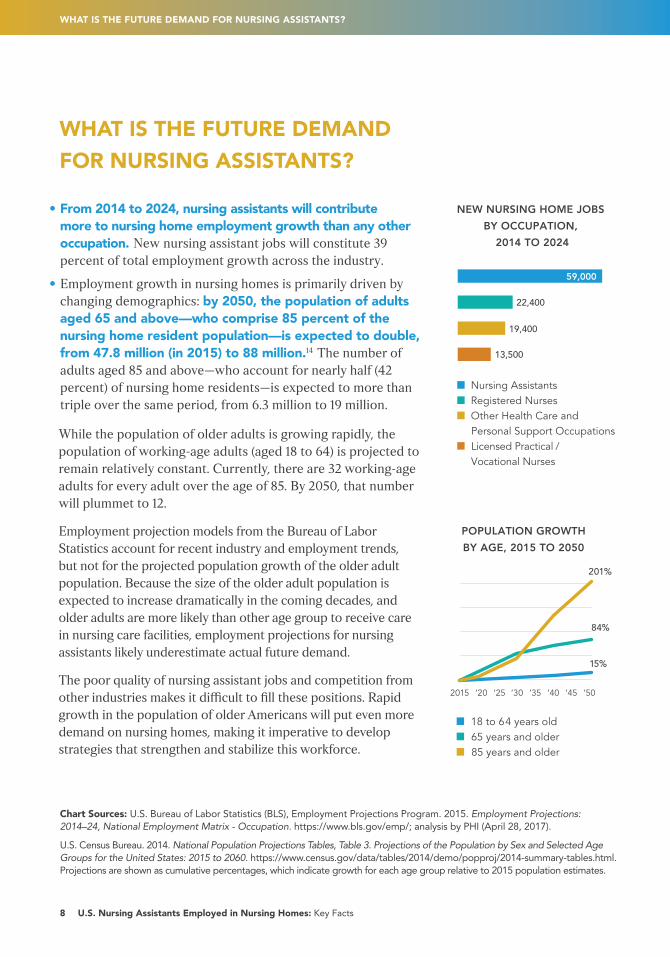
• From 2014 to 2024, nursing assistants will contribute more to nursing home employment growth than any other occupation. New nursing assistant jobs will constitute 39 percent of total employment growth across the industry.
• Employment growth in nursing homes is primarily driven by changing demographics: by 2050, the population of adults aged 65 and above—who comprise 85 percent of the nursing home resident population—is expected to double, from 47.8 million (in 2015) to 88 million.14 The number of adults aged 85 and above—who account for nearly half (42 percent) of nursing home residents—is expected to more than triple over the same period, from 6.3 million to 19 million.
While the population of older adults is growing rapidly, the population of working-age adults (aged 18 to 64) is projected to remain relatively constant. Currently, there are 32 working-age adults for every adult over the age of 85. By 2050, that number will plummet to 12. Employment projection models from the Bureau of Labor Statistics account for recent industry and employment trends, but not for the projected population growth of the older adult population. Because the size of the older adult population is expected to increase dramatically in the coming decades, and older adults are more likely than other age group to receive care in nursing care facilities, employment projections for nursing assistants likely underestimate actual future demand. The poor quality of nursing assistant jobs and competition from other industries makes it difficult to fill these positions. Rapid growth in the population of older Americans will put even more demand on nursing homes, making it imperative to develop strategies that strengthen and stabilize this workforce.
WHAT IS THE FUTURE DEMAND FOR NURSING ASSISTANTS?
WHAT IS THE FUTURE DEMAND
FOR NURSING ASSISTANTS?
▪ 18 to 64 years old
▪ 65 years and older
▪ 85 years and older
2015 ’20 ’25 ’30 ’35 ’40 ’45 ’50
15%
84%
201%
PROJECTED
POPULATION GROWTH
BY AGE, 2015 TO 2050
▪ Nursing Assistants
▪ Registered Nurses
▪ Other Health Care and Personal Support Occupations
▪ Licensed Practical / Vocational Nurses
22,400
19,400
13,500
NEW NURSING HOME JOBS
BY OCCUPATION,
2014 TO 2024
59,000

U.S. Nursing Assistants Employed in Nursing Homes: Key Facts 9
NOTES ON OCCUPATIONAL TITLES AND INDUSTRY CLASSIFICATIONS
TITLE OTHER TITLES JOB DESCRIPTION
Nursing Assistants (SOC 31-1014)
Certified Nursing Assistant, Certified Nursing Aide, Nursing Attendant, Nursing Aide, Nursing Care Attendant
Nursing assistants assist individuals with daily tasks such as eating, dressing, and bathing. They may also perform certain clinical tasks under the supervision of a licensed professional.
NOTES ON OCCUPATIONAL TITLES AND
INDUSTRY CLASSIFICATIONS
OCCUPATIONAL TITLES
The analyses in this fact sheet include nursing assistants who are employed in the Nursing Care Facilities (Skilled Nursing Homes) industry. Nursing assistants are defined by the Standard Occupational Classification (SOC) system developed by the Bureau of Labor Statistics (BLS) at the U.S. Department of Labor (DOL). Workers are classified based on their on-the-job responsibilities, skills, education, and training. Occupation definitions can be found at: http://www.bls.gov/SOC.
NURSING CARE INDUSTRIES
The Nursing Care Facilities (Skilled Nursing Homes) industry is defined by to the North American Industry Classification System (NAICS) developed by the Office of Management and Budget (OMB). Industry definitions can be found at http://www.census.gov/eos/www/naics/. Business establishments are coded based on their primary activity.
TITLE EXAMPLES INDUSTRY DESCRIPTION
Nursing Care Facilities (Skilled Nursing Homes) (NAICS 623110)
Skilled nursing facilities, nursing homes, rest homes with nursing care, retirement homes with nursing care, group homes for the disabled with nursing care, homes for the aged with nursing care, and inpatient hospice.
This industry comprises establishments that are primarily engaged in providing inpatient, 24-hour nursing, rehabilitative, and personal care services. The care is generally provided for an extended period. These establishments have a permanent core staff of registered and licensed practical/vocational nurses who provide care along with nursing assistants and other staff.

U.S. Nursing Assistants Employed in Nursing Homes: Key Facts10
Employment projections were sourced from the Bureau of Labor Statistics (BLS) Employment Projections program, and hourly wage and employment trends were sourced from the BLS Occupational Employment Statistics (OES) program. Wages were adjusted for inflation using the Consumer Price Index (CPI) for Urban Wage Earners and Clerical Workers (Current Series).
BLS data indicate that a small number of personal care aides and home health aides—which are other direct care occupations—are employed in the Nursing Care Facilities industry, but federal regulations require Medicare- and Medicaid-certified nursing homes to employ nursing assistants only.15 As 97 percent of nursing homes are Medicare-certified and 95 percent are Medicaid-certified,16 personal care aides and home health aides were excluded from the hourly wage analyses and employment estimates in this report.
Conversely, all direct care workers were included in analyses of the U.S. Census Bureau’s American Community Survey (ACS) because its occupational classification system is less precise than BLS Standard Occupational Classification system. ACS data were used to calculate nursing assistant demographics, median annual earnings, poverty status, use of public assistance, health insurance status, and full-time/part-time status.
1. U.S. Bureau of Labor Statistics (BLS), Division of Occupational Employment Statistics (OES), 2016. May 2016 National Industry-Specific Occupational Employment and Wage Estimates. https://www.bls.gov/oes/current/oessrci.htm; Kaiser Family Foundation. 2015. State Health Facts: Total Number of Residents in Certified Nursing Facilities. http://www.kff.org/other/state-indicator/number-of-nursing-facility-residents/?currentTimeframe=0&sortModel=%7B%22colId%22:%22Location%22,%22sort%22:%22asc%22%7D#notes; analysis by PHI (April 28, 2017).
2. U.S. Bureau of Labor Statistics (BLS), Injuries, Illnesses, and Fatalities (IIF) Program. 2016. Nonfatal Cases Involving Days Away from Work: Selected Characteristics. https://data.bls.gov/cgi-bin/dsrv?cs; analysis by PHI (April 28, 2017).
3. BLS, 2016; U.S. Census Bureau. 2015. American Community Survey (ACS), 2015 ACS 1-year Public Use Microdata Sample (PUMS). https://www.census.gov/programs-surveys/acs/data/pums.html; analysis by Carlos Figueiredo and PHI (May 1, 2017).
4. U.S. Bureau of Labor Statistics (BLS), Employment Projections Program. 2015. Employment Projections: 2014–24, National Employment Matrix - Occupation. https://www.bls.gov/emp/; analysis by PHI (April 28, 2017).
5. U.S. Census Bureau. 2014. National Population Projections Tables, Table 3. Projections of the Population by Sex and Selected Age Groups for the United States: 2015 to 2060. https://www.census.gov/data/tables/2014/demo/popproj/2014-summary-tables.html.
ENDNOTES
DATA SOURCES AND METHODS
DATA SOURCES AND ENDNOTES
U.S. Nursing Assistants Employed in Nursing Homes: Key Facts 11
ENDNOTES
6. U.S. Census Bureau. 2016. American Community Survey (ACS), Sex by Age by Employment Status for the Population 16 Years and Over (White Alone, Not Hispanic or Latino). https://factfinder.census.gov/bkmk/table/1.0/en/ACS/15_1YR/B23002H.
7. U.S. Bureau of Labor Statistics (BLS). 2016. Quarterly Census of Employment and Wages: Number of Establishments. https://www.bls.gov/cew/; Kaiser Family Foundation. 2015. State Health Facts: Total Number of Residents in Certified Nursing Facilities. http://www.kff.org/other/state-indicator/number-of-nursing-facility-residents/?currentTimeframe=0&sortModel=%7B%22colId%22:%22Location%22,%22sort%22:%22asc%22%7D#notes; analysis by PHI (April 28, 2017).
8. U.S. Department of Health and Human Services (HHS), Centers for Disease Control and Prevention (CDC). 2016. Long-Term Care Providers and Services Users in the United States: Data from the National Study of Long-Term Care Providers, 2013–2014. Hyattsville, MD: CDC. https://www.cdc.gov/nchs/data/series/sr_03/sr03_038.pdf.
9. BLS, 2016; analysis by PHI (March 30, 2016). After home care industries and nursing homes, the next five industries with the highest level of employment for direct care workers are Continuing Care Retirement Communities and Assisted Living Facilities for the Elderly; General Medical and Surgical Hospitals; Residential Intellectual and Developmental Disability, Mental Health, and Substance Abuse Facilities; Employment Services; and Vocational Rehabilitation Services. These five industries plus home care industries and nursing homes account for 92 percent of the direct care workforce.
10. U.S. Census Bureau. 2016. American Community Survey (ACS), 2015 1-year Public Use Microdata Sample (PUMS). https://www.census.gov/programs-surveys/acs/data/pums.html; analysis by Carlos Figueiredo and PHI (May 1, 2017).
11. U.S. Census Bureau. 2016. American Community Survey (ACS), 2015 1-year Estimates, Poverty Status in the Past 12 Months of Individuals by Sex by Employment Status. https://factfinder.census.gov/bkmk/table/1.0/en/ACS/15_1YR/B17005 ; analysis by PHI (July 19, 2017). Federal poverty thresholds, which are updated each year by the U.S. Census Bureau, can be accessed here: https://www.census.gov/data/tables/time-series/demo/income-poverty/historical-poverty-thresholds.html.
12. U.S. Census Bureau. 2016. American Community Survey (ACS), 2015 1-year Public Use Microdata Sample (PUMS). https://www.census.gov/programs-surveys/acs/data/pums.html; analysis by Carlos Figueiredo and PHI (May 1, 2017).
13. Campbell, Stephen. 2016. The Impact of the Affordable Care Act on Health Coverage for Direct Care Workers. Bronx, NY: PHI. https:// 60caregiverissues.org/quality-jobs-issue-3.html.
14. U.S. Census Bureau. 2014. National Population Projections Tables, Table 3. Projections of the Population by Sex and Selected Age Groups for the United States: 2015 to 2060. https://www.census.gov/data/tables/2014/demo/popproj/2014-summary-tables.html; CDC, 2016.
15. Centers for Medicare and Medicaid Services (CMS). 2016. Reform of Requirements for Long-Term Care Facilities. 81 FR 68688.
16. CDC, 2016.
400 East Fordham Road, 11th Floor Bronx, NY 10458 Phone: 718.402.7766 Fax: 718.585.6852 Email: [email protected] www.PHInational.org
© 2017 PHI
PHI works to transform eldercare and disability services. We foster dignity, respect, and independence for all who receive care, and all who provide it. As the nation’s leading authority on the direct care workforce, PHI promotes quality direct care jobs as the foundation for quality care.
Drawing on 25 years of experience working side-by-side with direct care workers and their clients in cities, suburbs, and small towns across America, PHI offers all the tools necessary to create quality jobs and provide quality care. PHI’s trainers, researchers, and policy experts work together to:
• Learn what works and what doesn’t in meeting the needs of direct care workers and their clients, in a variety of long-term care settings;
• Implement best practices through hands-on coaching, training, and consulting, to help long-term care providers deliver high-quality care;
• Support policymakers and advocates in crafting evidence-based policies to advance quality care.
For more information, visit PHI at www.PHInational.org and 60CaregiverIssues.org.